Embed Size (px)
Citation preview

U S D A F o r e s t Serv ice Resource B u l l e t i n S E - 15
forest Stat is t ics
for
Northemt F l o r i d a
1 9 7 0
forest Seruice - U.S. Department of Agriculture
Southeastern Forest Experiment Station
Asheoille, North Carolina
IXXEWORD
This report highlights the principal findings of the fourth Forest Sur-vey of the timber resource in Northeast Florida. The survey was startedin February I.969 and completed in November 1969. Findings of the threeprevious surveys, completed in 1934, 1949, and 1959, provide the basisfor measuring changes that have occurred and trends that have developedover the past 36 years. However, in this report, the primary emphasis ison the changes and trends that have taken place since the last survey.
Forest Survey, authorized by the McSweeney-McNary Forest Research Act ofMay 22, 1928, is a continuing nationwide undertaking by the regional ex-periment stations of the Forest Service, USDA. In Florida, Georgia,North Carolina, South Carolina, and Virginia, Forest Survey is an activityof the Southeastern Forest Experiment Station, with headquarters at /Asheville, North Carolina. The general objective is to inventory period-ically the forest lands, their extent, condition, and volume of timber,and to ascertain rates of 'forest growth and depletion. It is necessaryto keep this basic information up to date to provide a sound basis forthe formulation of forest policies and programs.
The 21-county area covered by this report is one of four Survey units inFlorida. A comparable report, "Forest Statistics for Northwest Florida1969, )1 USDA Forest Service Resource Bulletin SE-l&, was issued, and sim-ilar reports for the other two units will be issued as the Statewide sur-vey progresses. When completed, this survey will provide updated statis-tics on the timber resource for all of Florida.
The Southeastern Station gratefully acknowledges the cooperation and as-sistance'provided by the Division of Forestry, Florida Department ofAgriculture and Consumer Services, in the collection of the field data.
Joe P. McClure, Project Leader of the Forest Survey in the Southeast, or-ganized and coordinated the various phases of the Survey. Noel D. Costwas in charge of the data collection. William H. B. Raines was in chargeof the computations. Richard L. Welch was responsible for compiling thetimber removal and mortality information. Herbert A. Knight was in chargeof the analysis and reporting.
Office personnel assisting in this report were:
Robert A. Cathey Agnes C. NicholsBertie W. Greene Louise ShufordCecil C. Hutchins, Jr. Sammy S. WenninghamJoanne Hutchison Dorothy S. WhiteDoniev W. Jackson Camilla E. Young
The field party included:
Thomas R. Bellamy and John D. Nesbit, Field SupervisorsNolan L. Snyder, Field Assistant
Mervyn S. AllenRobert E. AllenJacky D. BalkcomDavid S. CarrGerald C. CraverEdgar L. DavenportJeffrey E. DukesLeonard G. Edwards
Robert S. HensleyRoy C. HensonHarold D. MathewsJamesF.PalmerJohn F. Parlier, Jr.Don F. RogersRichard J. White, Jr.
LewdDEAN N. QUINNEY. Ass< t Dire&oDivision -of Ma&eting, Utilization,and Resources Research

Forest Statistics
fOr
Northeust Florida1970
Joe P. McClure, Principal Resource Analyst

, ,
~~GBpS---------------------------- 1
f@J,~-J.J,~~OF~~ - - - - - - - - - - - - - - - - - - - - - 4
D~xINsOF~----------------------- 6
COUNTY TABLES:
1. &-ea, by la& class - - - - - - - - - - - - - - - - - - _ _ 132. Area of commercial forest land, by ownership class - - - - - 143. Area of commercial forest land, by forest-type group - - - - 154. Area of commercial forest land, by stand-size class - - - - 1.65. Area of comercial,forest laud, by site class - - - - - - - 176. Area of commercial. forest land, by stocking classes of grow-
ing-stock trees - - - - - - - - - - - - - - - - - - - - - - 187. Volume of sawtimber and growing stock on commercial forest
land, by species group i - - - - - - - - - - - - - - - - - - 198. Net annual growth of sawtimber and growing stock on commer-
cial. forest land, by species group - - - - - - - - - - - - - 209. Annual remvals of sawtimber and growing stock on commercial.
forest land, by species group - - - - - - - - - - - - - - - 21
uNI!r TABLES:
10.
11.
12.
13.
14.
15.
16.
17.
18.
19.
20.
21.
22.
23.
24.
25.
26.
Area of commercial forest land, by forest type ana ownershipclass --------_--________________Area of commercial forest land, by ownership and stockingclasses of growing-stock trees - - - - - - - - - - - - - - -Volume of timber on commercial forest land, by class andspecies (1Tol.q - - - - - - - - - - - - - - - - - - _ _ _ _ _Number of growing-stock trees on commercial forest land, byspecies and diameter class - - - - - - - - - - - - - - - - -Volume of all live trees on commercial forest land, by spe-cies and dismeter class - - - - - - - - - - - - - - - - - -Volume of growing stock on commercial forest land, by spe-cies snd diameter class - - - - - - - - - - - - - - - - - -Volume of sawtimber on commercial forest land, by speciesandai~terclass---------------------Net fmnual growth and removals of growing stock on comner-cial forest land, by species - - - --- - - - - - - - - - - -Net annual growth and removals of saw-timber on commercialforest land, by species - - - - - - - - - - - - - - - - - -Mortality of growing stock and sawtimber on commercial for-est la&, by species - - - - - - - - - - - - - - - - - - - -
Volume of all live trees am3 growing stock on commercialforest land, by ownership class and species group - - - - -Volume of sawtimber on commercial forest land, by ownershipclass ma species &roup - - - - - - - - - - - - - - - _ _ _
Net annual. growth and removals of growing stock on commer-cial forest land, by ownership class and species group - - -Net annual growth and removals of sawtimber on commercialforest land, by ownership class and species group - - - - -Average net volume per acre of sawtimber, growing stock, an&other live timber 0x1 commercial. forest land, by ownershipclass, major forest tme, and species group - - - - - - - -Land area, by class, major forest type, and survey comple-tion&&e _---------------_---_____Volume of sawtimber, growing stock, and all live timber oncommercial forest land, by species group, diameter class,and surveycompletiondate - - - - - - - - - - - - - - - - -
22
22
23
24
25
26
27
28
29
30
3
P
32
3
33
34
35

HIGHLIClTl?S
Since 1959 in Northeast Florida--
, ‘,
--area of commercial forest land declined by 190,000 acres, represent-ins a net loss of less than 3 percent. This small net change, how-ever, masks some major shifts which have taken place among the vari-ous land uses over the U-year period. For example, about 510,000acres of commercial forest land were diverted to pasture, urbandevelopments, and cropland, while some 320,000 acres of land shiftedback into commercial forest. Area of commercial forest land now 'totals almost 7.1 million acres, or 72 percent of total land area.
--about 1.3 million acres have been artificially regenerated. Now,about one out of every four acres of commercial forest shows evi-dence of artificial reforestation, which makes this 21-county areaa leader in the proportion of forest land in plantations. Most ofthe planting has been slash pine, and trends in forest type showthe area in slash pine has been increasing rapidly--up to 40 per-cent since 1959--to 2.8 million acres. Area in the longleaf pinetype, which declined from 2.3 to 1.2 million acres between 1949and 1959, decreased further to a new low of less than 0.5 millionacres.
--nonstocked forest land has been sharply reduced from 1.7 to 0.9million acres, or over 45 percent. Average stand density of alllive trees 5.0 inches d.b.h. and larger is now 44 square feet peracre, compared to 36 square feet in 1959 and 33 square feet in1949. A 53-percent increase in the average number of b-inch soft-wood trees per acre is a further indicator of the improvement instand density. Two out of every five acres, however, are stilleither poorly stocked or nonstocked.
--area of commercial forest land owned by forest industry has in-creased from 2.5 to almost 3.3 million acres, or 29 percent. Anadditional 0.4 million acres of commercial forest land under long-term lease places about one-half of the total commercial forestarea under forest industry management. Farm woodland and otherprivately owned forest land together declined from 4.0 to 3.2million acres, or 20 percent. Most of the publicly owned forestland is still concentrated in the Ocala National Forest, theOsceola National Forest, and the State-owned Csmp Blanding propertylocated in Clay County.
--volume of softwood growing stock has increased by almost 750 mil-lion cubic feet, or 29 percent. This increase followed a periodof relatively minor change between 1949 and 1959. Slash pine, theleading species in 1959, has accounted for atist 80 percent ofthe increase in softwood volume and is now the predominant speciesin the area. Cypress is the second major softwood species and its
-l-

, ‘,
volume is up by 4 percent. Longleaf pine, on the other hand, isdown by 18 percent. Volume of softwood saw-timber has increasedfrom 7.3 to over 9.1 billion board feet, or 25 percent.
--volume of hardwood growing stock has increased by over 110 millioncubic feet, or 7 percent. Hardwood volume had increased by lessthan 4 percent between the 1949 and 1959 surveys. Tupelo, black-gum, sweetgum, and other soft-textured species have accounted for80 percent of the recent increase in hardwood volume. Volume ofoak is down by 4 percent and volume of ash is up by 12 percent.Volume of hardwood sawtimber has increased from 4.2 to 4.5 billionboard feet, or 7 percent.
1969--In
--net growth of growing stock exceeded removals by an estimated 90million cubic feet, or 48 percent. About 65 percent of this growthover removals was pine, 14 percent other softwoods, and 21 percenthardwood. By ownership, 46 percent of the growth over removalswas on the private, nonindustrial lands, 37 percent on forest in-dustry lands, and the remaining 17 percent on public lands.
--net growth of sawtimber exceeded removals by an estimated 175 mil-lion board feet, or 28 percent. About 56 percent of this growthover removals was pine, 25 percent other softwoods, and 19 percenthardwood. By ownership, 41 percent of the growth over removalswas on the private, nonindustrial lands, 28 percent on forest in-dustry lands, and the remaining 31 percent on public lands.
--remvals of prowing stock totaled 188 million cubic feet, up bytwo-thirds from the estimate of removals in 1958. Pine species ac-counted for almost 82 percent of total removals from growing stock.Of the remaining 18 percent, 8 percent was hard-textured hardwoods,7 percent was'soft-textured hardwoods, and 3 percent was cypress.Pulpwood is the leading product removed in terms of volume, andyearly reports show that the annual pulpwood harvest in NortheastFlorida has increased about 40 percent over this remeasurementperiod. Sawtimber removals were distributed by species in roughlythe same proportion as growing stock.
--mortality of growing stock totaled over 28 million cubic feet,which was well below the estimate of mortality in 1958. It wasstill enough mortality to reduce gross growth by almost 10 percent.Over 60 percent of the mortality & hardwood, and climatic factorswere the leading identifiable causes of death.
-2-

HOWTREFORESTSU'FVBYISMADE
\ ‘I
The method of survey is essentially a sampling procedure designed to pro-vide reliable statistics primarily at the State and Survey Unit levels.Individual county statistics are presented to permit ,adding any combina-tion of counties together until the total is large enough to meet the de-sired degree of reliability. The basic steps of the survey procedure wereas follows:
1. In 19 of the 21 counties, initial estimates of forest andnonforest areas were based on the classification of 31,777sample clusters systematically spaced on the latest aerial 'photographs available. A subsample of 2,395 of these 16-point clusters were ground checked, and a linear regressionwas fitted to the data to develop the relationship betweenthe photo and ground classification of the subsample. Thisprocedure provided a means for adjusting the initial esti-mates of area for change in land use since date of photog-raphy and for photo misclassification.
2. In 2 of the 21 counties, aerial photography available wasconsidered to be outdated. Estimates of forest and non-forest areas were determined by direct aerial observationof 8,797 sample points from fixed-wing aircraft alongflight lines 2 miles apart. An interval timer was used todetermine the sample points.
3. Estimates of timber volume and forest classifications werebased on measurements recorded at 1,809 ground sample loca-tions systematically distributed within the commercial for-est land. A lo-point cluster of plots systematicallyspaced on an acre were measured at each of these sample lo-cations using a basal area factor of 37.5 square feet peracre. Trees less than 5.0 inches d.b.h. were tallied onfixed-radius plots around the point centers.
4. Equations prepared from detailed measurements collected onthe trees tallied at 1 out of every 20 sample locationswere used to compute the volumes of individual tally trees.A mirror caliper and sectional aluminum poles were used toobtain the additional measurements on standing trees re-quired to construct the volume equations. The same 5-
' percent subsample of plots used for the tree-volume studyalso served as a quality control of field measurements.Felled trees were measured at active cutting operations toprovide utilization factors for product and species groupsand to supplement the standing tree-volume study.
5. Estimates of growth, removals, and mortality were deter-mined from the remeasurement of 1,563 permanent sample plotswhich were established in the third survey.
-3-

6. Ownership information was collected from local contacts,correspondence, and public records. In those countieswhere the sample missed a particular ownership class,temporary sample plots were added and measured to describethe forest conditions within the ownership class.
7. All field data were sent to Asheville for editing andwere punched in cards and stored on magnetic tape formachine computing, sorting, and tabulation. Final esti-mates were based on statistical summaries of the data.
Statistical analysis of these data indicates the following samplingerrors:
Percent
Per million acres of commercial forest land - - - - - 1.45Per billion cubic feet of growing stock - - - - - - - 5.95Per billion cubic feet of net annual growth - - - - - 1.41Per billion cubic feet of annual removals - - - - - - 2.66
’ ;‘,,
-4-

Ssmpling errors for county and unit totals, Y in terms ofone standard error
.. iCubic-foot volume of growing stockcounty : Commercial .
: forest area :. . Inventory i Growth f Removals
AlaehuaBakerBradfordClayColumbiaDixieDuvalFlaglerGilchristHamiltonLafayetteLevyMadisonMarionNassauPutnamSt. JohnsSuwanneeTaylorUnionVolusia
Unit total
- - - - - - - Sampling err0 rf2 - - - - - - -
3.79 11.900.77 9.992.29 14.893.14 14.851.73 9.681.33 9.372.85 13.162.78 13.484.47 16.972.39 13.00l-75 14.252.13 9.051.63 11.592.37 90191.75 10.072.42 16.182.23 11.714.68 16.381.42 10.292.35 17.722.43 11.010.54 2.65
12.45 26.019.58 22.22 /
16.65 32.2116.81 29.5010.10 27.3610.45 26.0612.05 28.8512.05 25.3820.66 55.1714.75 24.9015.23 29.319.36 22.38
11.94 26.578.75 23.24
11.03 28.0414.05 28.0911.08 27.8918.52 27.6511.38 17.7215.04 40.. 1910.13 36.222.67 6.13
g Sampling error of breakdowns of county and unit totalsmay be computed with the following formula:
e = (SE) J(Specified volume or area) LVolume or area total in question)
Where: e = Sampling error of the volume or area total in question.SE = Specified sampling error in table.g By random-sampling formula (in percent).
-5-

DEFINITIONS OF TIZRMS
Acceptable trees .--Growing-stock trees of commercial species that meetspecified standards of size and quality, but not qualifying as desirabletrees.
Basal area.--The area in square feet of the cross section at breast heightof a single tree or of all the trees in a stand, usually expressed assquare feet of basal area per acre.
Commercial forest land .--Forest land producing or capable of producing ,,crops of industrial wood and not withdrawn from timber utilization.
Cormnercial species .--Tree species presently or prospectively suitable forindustrial wood products.
Cropland. --Land under cultivation within the past 24 months, includingorchards and land in soil-improving crops, but excluding land cultivatedin developing improved pasture. Also includes idle farmland.
‘. Desirable trees .--Growing-stock trees of commercial species having noserious defects in quality limiting present or prospective use for timberproducts, of relatively high vigor, and containing no pathogens that may
,,"' result in death or serious deterioration before rotation age.,
Diameter class .--A classification of trees based on diameter outside bark,measured at breast height (4s feet above the ground). D.b.h. is the com-mon abbreviation for rPdiameter at breast height." Two-inch diameterclasses are commonly used in Forest Survey, with the even inch the approx-imate midpoint for a class. For example, the 6-inch class includes trees5.0 through 6.9 inches d.b.h., inclusive.
Farm. --Either a place operated as a unit of 10 or more acres from whichthesale of agricultural products totaled $50 or more annually, or aplace operated as a unit of less than 10 acres from which the sale ofagricultural products for the year amounted to at least $250.
Farm operator .--A person who operates a farm, either doing the work him-self or directly supervising the work.
Farmer-owned lands .--Lands owned by farm operators.
Forest industry lands .--Lands owned by companies or individuals operatingwood-using plants.
Forest land. --Land at least 16.7 percent stocked by forest trees of anysize, or formerly having had such tree cover, and not currently developedfor nonforest use.
-6-

Forest type.--A classification of forest land based upon the speciesforming a plurality of live-tree stocking.
Longleaf-slash pine .--Forests in which longleaf or slash pine, singlyor in combination, comprises a plurality of the stocking. (Commonassociates include oak, hickory, and gum.)
Loblolly-shortleaf pine .--Forests in which loblolly pine, shortleafpine, or other southern yellow pines, except longleaf or slash pine,singly or in combination, comprises a plurality of the stocking.(Common associates include oak, hickory, and gum.)
Oak-pine .--Forests in which hardwoods (usually upland oaks) comprisea plurality of the stocking but in which pines comprise 25 to 50percent of the stocking. (Common associates include gum, hickory, andyellow-poplar.)
Oak-hickory.--Forests in which upland oaks or hickory, singly or incombination, comprise a plurality of the stocking, except where pinescomprise 25 to 50 percent, in which case the stand would be classifiedoak-pine. (Common associates include yellow-poplar, elm, maple, andblack walnut.)
Oak-gum-cypress .--Bottomland forests in which tupelo, blackgum, sweet-gum, oaks, or southern cypress, singly or in combination, comprises aplurality of the stocking, except where pines coqrise 25 to 50 per-cent, in which case the stand would be classified oak-pine. (Commonassociates include cottonwood, willow, ash, elm, hackberry, and maple.)
Elm-ash-cottonwood. --Forests in which elm, ash, or cottonwood, singlyor in combination, comprises a plurality of the stocking. (Commonassociates include willow, sycamore, beech, and maple.)
Gross growth .--Annual increase in net volume of trees in the absence ofcutting and mortality.
Growing-stock trees .--Live trees of commercial species qualifying as de-sirable or acceptable trees.
Growing-stock volume. --Net volume in cubic feet of growing-stock trees5.0 inches d.b.h. and over from a l-foot stump to a minimum 4.0~inchtop diameter outside bark of the central stem, or to the point where thecentral stem breaks into limbs. (Net volume jn primsry forks is in-cluded.)
Hardwoods .--Dicotyledonous trees, usually broad-leaved and deciduous.
Soft hardwoods .--Soft-textured hardwoods such as boxelder, red andsilver maple, buckeye, hackberry, loblolly-bay, silverbell (in mts.),butternut, sweetgum, yellow-poplar, cucumbertree, magnolia, sweetbay,water tupelo, blackgum, sycamore, cottonwood, black cherry, willow,basswood, and elm.
-7-

Hard hardwoods. --Hard-textured hardwoods such as Florida and sugarmaple, birch, hickory, dogwood, persimmon (forest grown), beech, ash,honeylocust, holly, black walnut, mulberry, all commercial oaks, andblack locust.
Idle farmland. --Includes former croplands, orchards, improved pasturesand farm sites not tended within the past two years, and presently lessthan 16.7 percent stocked with trees.
l&proved pasture .--Land currently improved for grazing by cultivation,seeding, irrigation, or clearing of trees or brush.
'IIndustrial wood. --All roundwood products except fuelwood.
Land area. --The area of dry land and land temporarily or partly coveredby water such as marshes, swamps, and river flood plains (omitting tidalflats below mean high tide); streams, sloughs, estuaries, and canals lessthan l/8 of a statute mile in width; and lakes, reservoirs, and pondsless than 40 acres in area. ',
, Logging residues. --The unused portions of trees cut or killed by logging.
Miscellaneous Federal lands. --Federal lands other than National Forests,lands administered by the Bureau of Land Management, and Indian lands.
Miscellaneous private lands - corporate. --Lands owned by private corpora-tions other than forest industry.
Miscellaneous private lands - individual. --Privately owned lands otherthan forest-industry, farmer-owned, or corporate lands.
Mortality.--l!?umber or sound-wood volume of live trees dying from naturalcauses during a specified period.
National Forest land. --Federal lands which have been legally designatedas National Forests or purchase units, and other lands under the adminis-tration of the Forest Service, including experimental areas and Bankhesd-Jones Title III lands.
Net annual growth. --The increase in volume for a specific year.
Net volume.-- Gross volume less deductions for rot, sweep, or other defectaffecting use for timber products.
Noncommercial forest land.-- (a) Unproductive forest land incapable ofyielding crops of industrial wood because of adverse site conditions, and(b) productive-reserved forest land.
Noncommercial species. --Tree species of typically small size, poor form,or inferior quality which normally do not develop into trees suitable forindustrial wood products.
-8-

Nonforest land. --Land that has never supported forests and lands formerlyforested where timber management is precluded by development for otheruses.
Nonstocked land. --Commercial forest land less than 16.7 percent stockedwith growing-stock trees.
Other Federal lands .--Federal lands other than National Forests, includ-ing lands administered by the Bureau of Land Management, Bureau of IndianAffairs, and other Federal agencies.
Other public lands .--Publicly-owned lands other than National Forests. '
Overstocked areas .--Areas where growth of trees is significantly reducedby excessive numbers of trees.
Poletimber trees.--Growing-stock trees of commercial species at least 5.0inches in d.b.h. but smaller than saw-timber size.
Productive-reserved forest land. --Forest land sufficiently productive toqualify as commercial forest land, but withdrawn from timber utilizationthrough statute or administrative designation.
Rangeland. --Land on which the natural plsnt cover is composed principallyof native grasses, forbs, or shrubs valuable for forage.
Rotten trees .--Live trees of commercial species that do not contain atleast one 12-foot saw log now or prospectively, primarily because of rotor missing sections, and with less than one-third of the gross tree vol-ume in sound material.
Rough trees.-- (a) Live trees of commercial species that do not contain atleast one 12-foot saw log now or prospectively, primarily because ofroughness, poor form, splits, and cracks, and with less than one-third ofthe gross tree volume in sound material, and (b) all live trees of non-commercial species.
Salvable dead trees .--Standing or down dead trees that are considered mer-chantable by Forest Survey standards.
Saplinps.--Live trees 1.0 inch to 5.0 inches in diameter at breast height.
Saw log. --A log meeting minimum standards of diameter, length, and defect,including logs at least 8 feet long, sound and straight, and with a mini-mum diameter inside bark for softwoods of 6 inches (8 inches for hardwoods).
Saw-log portion .--That part of the bole of sawtimber trees between thestump and the saw-log top.
Saw-log top.--The point on the bole of saw-timber trees above which a sawlog cannot be produced. The minimum saw-log top is 7.0 inches d.o.b. forsoftwoods and 9.0 inches d.o.b. for hardwoods.
-9-

Saw-timber trees .--Live trees of commercial species containing at least a12-foot saw log and with at least one-third of the gross board-foot vol-ume between the l-foot stump and minimum saw-log top sound. Softwoodsmust be at least 9.0 inches and hardwoods at least 11.0 inches in diameterat breast height.
Sawtimber volume .--Net volume of the saw-log portion of live sawtimber inboard-foot International l/&-inch rule.
Seedling+--Live trees less than 1.0 inch in diameter at breast heightthat are expected to survive and develop.
Site class .--A classification of forest land in terms of inherent capacityto grow crops of industrial wood based on fully stocked natural stands.
Class 1. --Sites capable of producing 165 or more cubic feet per acreannually.
Class 2.--Sites capable of producing 120 to 165 cubic feet per acre an-nually.
iizg-.--Sites capable of producing 85 to I20 cubic feet per acre an-
.\ 'I
Class 4 .--Sites capable of producing 50 to 85 cubic feet per acre an-nually.
Class5. --Sites incapable of producing 50 cubic feet per acre annually,but excluding unproductive sites.
Softwoods .--Coniferous trees, usually evergreen, having needles or scale-like leaves.
Pines. --Yellow pine species which include loblolly, longleaf, slash,shortleaf, pitch, Virginia, Table-Mt., sand, and spruce pine.
Other softwoods.--White pine, hemlock, cypress, eastern redcedar, white-cedar, spruce, and fir.
Stand-size class.-- A classification of forest land based on the size classof growing-stock trees on the area.
Saw-timber stands.-- Stands at least,16.7 percent stocked with growing-stock trees, with half or more of total stocking in sawtimber orpoletimber trees, and with sawtimber stocking at least equal to pole-timber stocking.
Poletimber stands.-- Stands at least 16.7 percent stocked with growing-stock trees of which half or more of this stocking is in poletimber andsawtimber trees, and with pole-timber stocking exceeding that of saw--timber.
-lO-
Sapling-seedling stands.--Stands at least 16.7growing-stock trees of which more than half oflings and seedlings.
percent stocked withthe stocking is sap-
by States, counties, andState, county, and municipal lands.--bands ownedlocal public agencies or municipalities, or lands leased to these govem-mental units for 50 years or more.
Stockin..--The degree of occupancy of land by trees, measured by basalarea or the number of trees in a stand and spacing in the stand, comparedto a minimum standard, depending on tree size, to fully utilize the growthpotential of the land. (See page l-2.) I
Timber removals .--The net volume of growing-stock trees removed from theinventory by harvesting; cultural operations, such as stand improvement;land clearing, or changes in land use.
Unproductive forest land. --Forest land incapable of producing 20 cubicfeet per acre of industrial wood under natural. conditions, because of ad-verse site conditions.
, ',
Upper-stem portion .--That part of the main stem or fork of sawtimber treesabove the saw-log top to a minimum top diameter of 4.0 inches outside barkor to the point where the main stem or fork breaks into limbs.
Urban and other areas .--Areas within the legal boundaries of cities andtowns; suburban areas developed for residential, industrial, or recre-ational purposes; school yards; cemeteries; roads; railroads; airports;beaches; powerlines and other rights-of-way; or other nonforest land notincluded in any other specified land use class.
-ll-

Stocking standard
D.b.h. ' Minimum number of i Minimum basal area i Percent stockingclass j trees per acre for . per acre for full
- full stocking : stockingi assigned ea h. tally tree1-7
Seedlings
E
li101214161820
600560460340240155115
g
5l
r/ Trees less than 5.0 inches d.b.h. were tallied on a lo-pointcluster of circular, l/300-acre plots at each sample location. Trees5.0 inches d.b.h. and larger were tallied on a lo-point cluster of vari-able plots using a basal area factor of 37.5 at each sample location.
Overstocked--Over 130 percentFully stocked--100-130 percentMedium stocked--60-99 percentPoorly stocked--16.7-59 percentNonstocked--Less than 16.7 percent
Cubic feet of wood per average cord(excluding bark)
D.b.h. i All i Pine i Other f soft f Hardclass I species . softwood I hardwood : hard-d. : .
ii1012141618202224+
61.6 61.1 68.3
77:8 ;z*:68.1 76.2;2: 85.2 81.4
80.2 79:3 88.081.5 81.4 90.3
82.7 83.283.1 84.6 g::83.5 85.8 95.085.0 87.4 99.5
60.1 60.168.5 a.373.4 73.3
2.:79:7
%*:68
80.8 80.881.4 81.582.1 82.183.0 83.6
-Average 79.1 75.7 87.4 78.0 80.2
-12-

COUNTY TABUS
The county tables are intended for use in compilingforest resource estimates for groups of counties. Be-cause the sampling procedure used by the Forest Surveyin Northeast Florida was intended primarily to furnishinventory data for the Unit as a whole, individualcounty estimates have limited and variable accuracy.As county totals are broken down by various subdivi-sions, the possibility of error increases and is great-est for the smallest items. The order of this increasecan be computed with the formula on page 5.
Table 1 .--Area, by land class and county, 1970
\ 'I
: : Forest land :: :
county : +/ :: land-j Nonforest
: Total ' Commercial i Unproductive i Productive : lands:: : : forest : forest : reserved :
AlachuaBakerBradfordClayColumbiaDixieDuvalFlaglerGilchristHamiltonLafayetteLevyMadisonMarionNassauPutnamSt. JohnsSuwaaneeTaylorUnionVolusia
Total
------------ Thousand acres - - - - - - - - - - - -
588.2 311.4 311.0 -- 0.4 276.8375.0 350.6 349.5 -- 1.1 24.4188.5 148.1 148.1 -- -- 40.4392.7
g5326.2 -- 1.3 65.2
515.3 385.2 3.0 125.9456.7 366 x93.6 -- 63.1
532:290.8 290.2 -- &i
217.2
22710265.6 263.6 1.8 0:2 50.5150.8 150.8 -- -- 76.2
329-o 253.3 252.2 -- 1.1 75.7352.0 294.9 294.7 0.2 mm 57-l729.5 521.7 507.9 12.0 207.8456.8 323.9 323.9 -- 132.9
bO38.3 637.6 636.1 -- g
1:o400.7
417.1 342.6 2.0 7r.5473.9 ;:;*46 368.7 -- 0.7 104.5400.9 2g8:1 293.4 3-l 1.6 102.8"63g 204.8 204.2 234.3
15810611.5 607.0 4:; (2; 56.7133.8 133.8 -m -- 24.2
723.2 491.3 478.2 12.4 0.7 231.9
9,753*5 7a3.7 7,&o-9 39.0 13.8 2,639.8
1/ From U. S. Bureau of the Census, Land and Water Area of the United States,1960.
d Includes 118,900 acres of water according to Survey standards of areaclassification but defined by the Bureau of the Census as land.
d Less than 50 acres.
-13-

Table 2.--Area of commercial forest land, by ownership and county, 1970
c4=I
: :. . Ownership class.
county : All I : : : : : :: ownerships : National : Miscellaneous :: : Forest : Federal : State :county and : Miscellaneous private
: municipal. . . . *
AlachuaBakerBradfordClayColumbiaDixieDuvalFlaglerGilchristHamiltonLafayetteLevyMadisonMarionNassauPutnamSt. JohnsSuwannee
--------------------_ Thousand acres _ _ _ _ _ _ _ _ _ _ _ _ _ _ _ _ _ _ _ _ _
311.0349.5148.1326.2
;;:*:29012263.6150.8252.2294.7507.9323.9636.1342.6368.7293.4204.2
74.6me
--
73.0--
--
--
--
--
me
--
--
248.6mm
22.8----
------
o-7----
14.1--
--
--
--
-a
--
1.9--
0.3mm
--
6.7 0.4
80:: --1.153.6 0.8
0.1 0.4
4.8 0.20.2 0.4-- 0.1
111.1165.773.489.7
121.6385.039.9
184.556.8
143.9222.4305.5158.659.1
193.5103.5140.529.6
96.410.921.792.797.61.3
16.816.750.422.827.859*5
122.0113.1
9243.19!*7
35.540.010.9
443:;1.3
12.6--
14.4--
14.050.2
--130.510.929.228.77.0
25.9--
60.958.232.684.748.85.3
201.561.928.885.530.190*943.369.6
127.4113.180.576.869.14.0
Taylor 607.0 -- 0.1 0.3Union 133.8Volusia 478.2 1:
q d 5.1 -- 5;'; * 4::;2.8 0.8 100.0 68.0 123.0 174.8
%tal 7.060.9 419.0 25.8 103.1 9.0 3,263-7 1,110.5 582.0 b547.8
r/ Less than 50 acres.2J Not including 385,ouo acres of farmer-owned ana miscellaneous private lands leased to forest industry.

-ii
Table 3. --Area of commercial forest land, by forest-type group and county, 1970
Forest-type groups
: groups . Longleaf- i Loblolly- i Oak- f Oak- i Oak-gum- f Elm-ash-. ' slash pine* : : shortleaf pine : pine : hickory : cypress. . . * i cottonwood
AlachuaBakerBradfordClayColumbiaDixieDuvalFlaglerGilchristHamiltonLafayetteLevyMadisonMarionNassauPutnamSt. JohnsSuwanneeTaylorUnionVolusia
Total
$i;*;l48:1.326.2385.2393.6290.2263.6150.8252.2294.7507.9323.9636.1342.6368.7293.4204.2607.0133.8
141.7250.0114.3149.3194.7166.2144.9176.388.7
151.4144.1185.7108.3127.1170.8174.9173.676.8
280.588.8
- -- - - - Thousand acres - - - - - - - - - -
20.38.2
29.59.84.2
23.1
me
2.87.2
16.424.3
240.623.138.214.416.847.4
--
32.424.410.818.726.534.425.225.53.6
33.630.954.2539372.745.823.628.424.454.514.5
74.4--
10.964.456.1
:x8:1
51938.6
26.3103.947.6
144.0--
pE.51.932.212.0
42.266.912.164.398.1
133.146.653.7
5::;86.2
143.390.447.4
102.935.068.434.3
192.418.5_ -
- -- - -
----------
0.7--meBe--
414
41;------------- -478.2 187.8 67.4 41.2 16.2 165.6
7,060.~ 3,295-P 593.7 678.6 918.9 1,564.4 9.4

Table 4 .--Area of commercial forest land, by stand-size class and county,1970
.. .. Stand-size class :
county ; All fl
' Nonstocked: stands : .. . Saw-timber : Polettiber ' Sapling and i areas:. . . . seedling :. . . . .
AlachuaBakerBradfordClayColumbiaDixieDuvalFlaglerGilchristHamiltonLafayetteLevyMadisonMarionNassauPutnamSt. JohnsSuwanneeTaylorUnionVolusia
Total
- - - - - - - - - - Thousand acres - - - - - - - - - -
103.0148:l ~G 132.3 20.8
326.2 70.2385.2 102.2393.6 127.5290.2 73.9263.6 85.3150.8 36.4252.2 69.5294.7 81.8507.9 201.9323.9 93.7636.1 184.1342.6 2*8"368.7
293.4 6217204.2 51.7607.0 221.5133.8 34.5478.2 170.7
7,dO.P 2,079.5
92-P66.8 58.1
72.1131.6126.181.261.836.668.354.5
141.8103.0171.1118.182.3
$*Z110:544.482.4
b853.8
81.0137.0 55.1
83.7122.5100.093.1
101.2
$21051889.594.7
161.3118.7123.2
129.456.0214.550.9
151.62,221.l
34.122.15.4
loo.228.940.042.015.325.514.852.674.732.5
119.6la.894.4
4::;60.54.0
.906.5
-16-
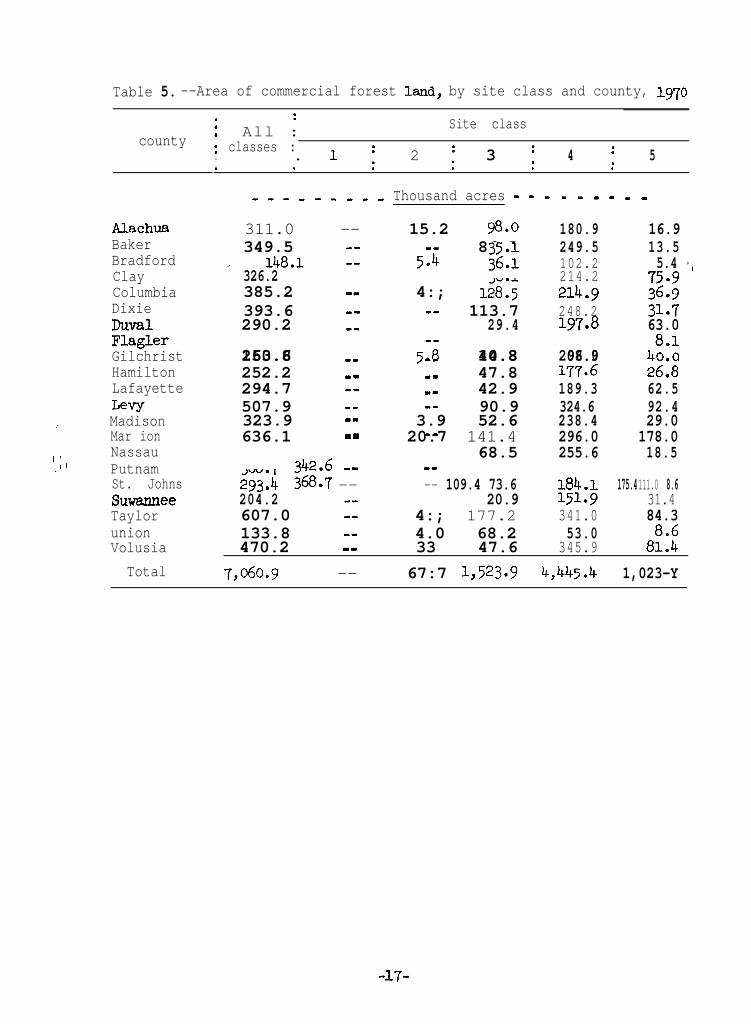
Table 5. --Area of commercial forest land, by site class and county, 1970
county
AlachuaBakerBradfordClayColumbiaDixieDuvalFlaglerGilchristHamiltonLafayetteLevy
,, MadisonMar ion
t 'I,. ' "NassauPutnamSt. JohnsSuwanneeTaylorunionVolusia
Total
.
.
:
. All : Site class.: classes :. ;1. 2 3; f 4 f 5. . . . . .
---------Thousand acres - - - - - - - - -
311.0 -- 15.2 98.0 180.9 16.9349.5 -- -- 86.5 249.5 13.5
- 148.1 1:
326.25*4 g*:: 102.2 5.4 ‘,
385.2 -- 4:; 12815214.2214.9 ;2;
393.6 -- -- 113.7 248.2 31:7290.2 mm 29.4
263.6 -- 5:; 40.8
197.8 63.0
208.9150.8 -- mm 14.8 96.0 4%
252.2 -- -- 47.8 vi=6 2618’294.7 -- -w 42.9 189.3 62.5
507.9 -- -- 90.9 324.6 92.4323.9 -- 3.9 52.6 238.4 29.0636.1 -- 20.7 141.4 296.0 178.0
--
29$ 3’:*; --
-- 68.5 255.6 18.5-- we
-- 109.4 73.6 184.1 175.4111.0 8.6204.2607.0 I:
20.94:; 177.2
w-*9 31.4341.0 84.3
133.8 -- 4.0 68.2 53.0470.2 -- 33 47.6
67:7 1,523.Y345.9 8%
7,060.g -- 4,445.4 1,023-Y
-17-

Table 6 .--Area of commercial forest land, by stocking classes of growing-stocktrees, by county, 1970
..
Stocking percentageY
: Over 1.30 f 100-130 i 60-99 i 16.7-59 i Less than 16.7. . . . .
AlachuaBakerBradfordClayColumbiaDixieDuvalFlaglerGilchristHamiltonLafayetteLevyMadisonMarionNassauPutnamSt. JohnsSuwanneeTaylorUnionVolusia
Total
-----M--w--- Thousand acres - - - - - - - - - - - -
go;10.1 33.8 131.7 101.3 34.1
148:l6.6
;E203.1 60.9 22.1
3.4' 78.8 26.3 5*4
z?~ --3210 103.5 90.5 100.2
m:615.3 68.9 143.3 128.8 28.916.6 62.7 191.7 82.6 40.0
290.2 5.3 53.9 lo4.3 84.7 42.0263.6 11.5 65.2 115.1 56.5 x5*3150.8 3.8 22.0 47.9 51.6 25.5252.2 -- 42.1 117.9 77.4 14.8294.7 7.2
g's"79.1 102.8 52.6
507-g 18.357:2
216.3 160.8 74.7323.9 -- 122.7 111.5 32.5636.1
::;113.1 179.2 220.9 119.6
342.6 46.2 175.5 94.2 18.8368.7 4.7 25.5 149.2 94.9 94.4293.4 5.7
;?49146.2 59.7
204.2 68.6 56.0 4::;607.0 2; 9o:7 243.2 203.7 60.5133.8 -- 32.8 74.4 lg.6 4.0478.2 20.8 . 132.8 172.4 .
7,060.~ 152.9 1,119-P 2,824.5 2,057.l 906.5
;1;/ See stocking standards on page 12.
-18-

IY
Table 7. --Volume of saw-timber and growing stock on commercial forest land, by species group and county, 1970: Sawtimber :: : Growing stock
county : All :Pine ' Other ' soft : Hard i A11 i pine ' Other ' soft : Hard:
: species :: ; sof%wood i hardwood i hardwood : species : ; softwood i hardwood i hardwood
AlachuaBakerBradfordClayColumbiaDixieDuvalFlaglerGilchristHamiltonLafayetteLevyMadisonMarionNassauPutnamSt. JohnsSuwanneeTaylorUnionVolusia
Total
586.3893.8227.8340.9857.5998.8552.1770.9120.3381.9426.3
x,099.9578.2
1,221.l724.7520.1639.6282.2
~287.3225.9
- - Million board feet - - - -
229.1 90.1 114.4630.5 112.4 150.1201.8 8.9154.0 59.2 6:::527.3 178.3 85.1313.5 191.4 204.2248.9 20.5 171.2316.2 235.3 119.641.2 23.2 11.5
202.6 85.6 59.9211.8 103.9 65.0481.8
';I??192.7
247.1801.2 6119
156.5175-o
%*T47.8 141.9
293:836.2 11-9.395.6 109.6
112.4 12.2 68.4588.9 276.0 218.7141.0 27.3 44.7
---m-v - Million cubic feet3/ - - - - - - -
152.7 206.40.8 3152
15.1 109.961.6 146.966.8 318.5
289.7 346.5111.5 217.2
E 253.4
33:858.5
157.045.6 157.9
265.5 385.660.5 229.0
183.0 421.589.1 296.676.5 186.2
140.6 251.989.2 94.4
203.7 432.512.9 113.1
95.4222.891.179.7
178.2107.6111.3120.133.977.576.3
151.096.2
290.0183.3112.1111.546.7
174.763.1
27.437.69*9
18.957.364.29.8
7z3211.38.060.339.216.820.08.7
34.2
8Z13.9
40.754.33.1
27.957.283.7
;;2*3::;29.087.368.7
;‘7-:40:357.621.292.830.1
42.90.55.8
20.425.891.036.822.013.111.914.687.024.961.835.525.148.623.683.26.0
2.2 417.8 34. 147.0 145.5 120.9 55.4 20.7
13,7o7.8 6,894.9 2,274.5 2,422.y 2,115.5 5,040.7 2,568.0 774.2 997.3 701.2
u Factors for converting to cords are shown on page 12.

Table a .--Net annual growth of sawtimber and growing stock on commercial forest land,by species group and county, 1969
.; Saw-timber l
: : Growing stockcounty : All i Pine i Other i soft : Hard i All j Pine i Other i soft : Hard: species softwood : hardwood i hardwood : species softwood: : : : : : hardwood i hardwood
AlachuaBakerBradfordClayColumbiaDixieDuvalFlaglerGilchristHamiltonLafayetteLevyMadisonMarionNassauPutnamSt. JohnsSuwanneeTaylorUnionVolusia
Total
30.059.618.921.648.657.428.842.56.9
24.125.0
;;*220.4 13.5 1.5 2.510.8 7.7 0.7 1.6
7518
$*L37:1
69,::16.949.1 36.2 a.5 2.9 1.5 15.6 11.4 2.6 1.2 0.4
797.5 605.6 62.3 69.2 60.4 277.7 211.9 18.0 26.5 21.3
21.2 2.352.4 3*1la.2 0.316.4 238.736.321.8 22
6:o
1818 3E-29 2.1 0.818.1 2.938.8 5.721.9 3.065.1 1.443.2 1.529.8 1.228.1 2.86.1 0.4
42.9 7.114.5 1.0
2.64.10.12.73.37.03.22.5
1.9 0.22.46.35*7
;:;3-23.01.48.61.1
3.9--
0.31.42.0a.23-21.1
1.7 1.31.67*52.85.42.91.83.2
ii:;0.3
12.8 1;:z 0.6 1.2 1.115.4 0.9 0.9 --a.0 7.2 0.5 0.1 0.2a.8 7.3 0.4 0.6 0.5
17.1 12.2 1.2 2.4 1.316.2 a.9 1.6 2.8 2.912.8 10.0 0.2 1.4 1.214.1 11.1 l-9 0.8 0.36.1 ::z 0.2 0.1 0.32: 5.8 0.6 1.0 0.9 0.9 0.4 0.4
2.90.8
25.4 21.5 0.3 1.3 2.317.4 14.6 0.4 1.4 1.012.2 10.4 0.3 0.9 0.615.1 11.5 0.7 l-7 1.25*6 4.7 - - 0.4 0.5
21.1 13.6 2.0 2.6 2.97-g 5.9 O-4 0.8 0.1
- - Million board feet - - - - - - - - - - - - Million cubic feet - - - - - -

Table 9. --AMual removals of sawtimber and growing stock on commercial forest land,by species group and county, 1969
: Sawtimber :: : Growing stock
county : All :i species
' Other ' Soft ': Pine : softwood : Hard i All i: hardwood i hardwood
' OtherPine : i Soft i Hard: : : species sofbood: : : hardwood : hardwood
- - - m - - Million board feet - - - - - - - - - - - - Million cubic feet - - - - - -
AlachuaBakerBradfordClayColumbiaDixieDuvalFlaglerGilchristHamiltonLafayetteLevyMadisonMarionNassauPutnamSt. JohnsSuwanneeTaylorUnionVolusia
Total
25.3 22.8 -- 0.5 2.0 7.5 6.6 -- 0.4 0.533.2 33.2 -- -- me 10.6 10.6 -- -- --19.3 18.7
1:me 0.6 6.2
13.5 13.5 me -- 6.52:;
1:3- 0.2-- --
30.0 27.9 -- 0.7 1.4 10.040.1 26.4 2.0 2.6 S:i 12.0 892 1:;
0.2 0.51.9
12.8 $:; -- 1.4 4.5 2.8 -- 37 1.44.6 7.7 0.8 3.4 12.1 9.3 1.7 0.3 0. iI
4::: 41x 2.9 -- 0.5 3-2 4.1 0.4 12.2 1.7 10.7 -- 0.7 -- I 0.1 0.9 0.9 0.639*5 31.5 3.0 2.9 2.1 13.0 10.7 0.7 0.9 0.7
61:7 33;*;
29.5 0.7 2.1 2.5 8.5 7.0 0.2 0.4 0.9
28.5 52.9 0.8 0.9 2:; 1.4 3.8 1;:; 14.8 7.4 0.2 0.2 1.1 1.1 0.8 1.419.5 14.3 --22.0 14.0 -- :::
1.9 8.4 1; 3 0.8;:; 7.3 46:: 1: 1*3 1.4
47.8 41.1 0.2 2.6 11.9 9.9 0.2 0.8 1.05::; 4::;
;j .
2.6 7.5 3.7 -- 1;:: 14.0 2.3 0.2 -- 2.1 0.7 1.1 0.1
11.5 6.7 2.7 1.5 3*4 t': O*l 0.8 0.411.9 11.5 -- em 0.4 4.7 . 0.1 -- 0.1
622.9 507.2 19.4 45.8 50.5 188.0 154.0 5.3 13.3 15.4

Table 10. --Area of commercial forest land, by forest type and ownership class, 1970: :: Ownership class
All :Forest type :: ownerships i National i Other i Forest i Farmer i Misc.
: : Forest : public : industry : : private
----------Thousand acres - - - - - - - - - -
Softwood types:Longleaf pineSlash pineIoblolly pine
Sand pineEastern redcedarPond pine
Total
455.5 58.7 25.1 143.4 71.8 156.52,840.4 89.9 35.9 1,607.2 351.4145.1 -- -- 54.4 30.1 nY&275.2 192.2 19.4 11.0 10.8 4x:88.8 -- 4.4
9 . 8 5 1 6 4 . 6 1 2 . 0 8 . 14.4
26:; 57.83,889*6 350.6 92.4 I,87895 491.0 1,077.l
Hardwood types:Oak-pineOak-hickorySouthern scrub oakOak-gum-cypressElm-ash-cottonwood
Total
All types 7,060.9 419.0 137.9 3,263.7 1,110.5 2,129.8
678.6 32.6 7.1 300.7 170.5 167.7478.9 7.5 141.6 1619.2 160.6440.0 6:; 18.2 34.1 105.6 275.4
1,564.4 29.1 12.7 174.2 444.09.4 -- --
9y(. -- 5*0
3,171.3 68.4 45.5 1,385.2 619.5 1,052.7
Table II. --Area of commercial forest land, by ownership and stocking classes ofgrowing-stock trees, 1970
: :Ownership : All : Stocking percentagel/
classes : classes :: : Over 130 i 100-130 j 60-99 i 16.7-59 i Less than 16.7
- - - - - - - - - - - Thousand acres - - - - - - - - - - -
National Forest 419.0 16.7 68.5 184.6 126.0 23.2
Other public 137.9 5.3 5.1 29.6 61.1 36.8
Forest industry 3,263.7 81.5 606.3 1,459.x 881.7 235.1Farmer 1,110.5 24.2 152.6 433.2 330.9 169.6
Misc. private 2,129.8 25.2 287.4 718.0 657.4 441.8All ownerships 71060.9 152.9 1,119-g 2,824.5 2,057-l 906.5
IL/ See stocking standards on page 12.
-22-

Table 12 .--Volume of timber on commercial forest land,by class and species group, 1970
:Class of timber : ful ;
. species . Pine f Other f Soft f Hard: softwood : hardwood : hardwood. . . . .
Sawtimber trees:Saw-log portionUpper-stem portion
Total
2,786.6 b394.5 462.9 487.4 441.8329.6 133.7 57.5 . 45 :1
3,116.2 1,528.2 520.4 580.7 486.9
Poletimber treesAll growing-stock trees
1,924/j l,o3g.8 253.8 416.6 214.35;,040.7 2,568.0 774.2 . 701.2
Rough trees:Saw-timber-size treesPoletimber-size trees
Total, ,
Rotten trees:Sawtimber-size treesPoletimber-size trees
Total
221.9 589 7.9 55.4 152.7336.7 14.4 13.9 103.8 204.6558.6 20.3 21.8 159.2 .
93.8 1.0 14.6 33.3 44.916.1 -- 2.2 7.7 6.2
109.9 1.0 16.8 41.0 51.1
Salvable dead trees:Sawtimber-size treesPoletimber-size trees
Total
6.7 4.6 1.0 -- 1.10.7 -- 0.7 -- - -7.4 4.6 1.7 -w 1.1
Total, all timber 5,716.6 2,593-g 814.5 1,197*5 1,110.7
- - - - - - Million cubic feet - - - - - -
-23-

Table 13. -4iunber of growing-stock trees on commercial forest land. bs species and diameter class, 1970
Species:: Diameter class (inches at breast height)
All.:: classes y.o- ; ll.o- ; 13.0-
10.9 12.9 14.9; 15.0- ; 17.0- ; 1y.o- 21.0- i29.0 and
: : : 16.9 ; 18.9 i 28.920.9 larger: :
- - - - - - - - - - - ---------Th,usmdtrees ------------------ - -
Sof-twood :Longleaf pineSlash pineLoblollypinePond pineSpruce pineSand pineBaldcypressPondcypressAtlantic white cedarEastern redcedar
Total softwoods
Hardwood :Select white oak 1/Select red oaks2-7Other white oaksOther red oaksHickoryFlorida mapleSoft mapleBeechSweetgum!l!upelo and blackgwnAshLoblolly-bayBasswoodYellow-poplarMagnoliaElmBlack cherrySweetbayRiver birchHackberry
46,621282,831
12,568 11,321172,o48 62,251
11,703 701 14826,569 12,860 7,427 2,6885,753 2,369 667 2z; ;; 1:
19,272 6,224 4,137 3,275 2,349 --12,650
176 592;z3,348 1,765
1,4401,012
474
1,29761.0 161 203 40 158 12 --
-- --24x7 16,518 510%11,081 ‘+,2-r’+
1,7m 4::31 1y8 22
19-- 11 --
23.82,769 1,405 $2
33 -- 6 --81,241 34,847 20,236 1,121 655 10012,854
7y5z3,749
1,352269 391 143 124
14910 3
gg -- -_ 292
-- -- -- em --1,630 1.023 303 121 132 11 -- -- -- --
4791778 252,797 109,463 59,509 33,243 15.211 6,058 2,162 814 511 13
731471
5,58134,4814,964
28912,645
3422,28250,69612,3407,4201,448
2521,6253,3847,~~
I.24193
1,20213,7041,655
4,1z;--
10,46220,669;.g
'50584
2141,417--2,466
42
178 120179786 6:;
8,320 4,8091,153 743-- 793,953 2,0635,2;6 3,266
12,109 6,9423,207 1,5931,865 999
449 11738
467 32648 57054 31
1,808 1,074-_ 2957 105
40
4;;2,783
551
9E--1,6285,073
897
:g22
253425
7;;;;
g
142
6;;1,905
4716::
8:;
5%
67474
1,185170
4;;10
4311,448
3191722112
13587
4;:----
18 23
43ii 3;;653 44176 64-- 14
160 1219 me
171 131687 416127 112
fl; 3z9 --
28 2660 149 --
210 1298 69 ---Other eastern hardwoods 1,282 697 260 200 56 59 -- 7 me
19 --
4 --535 153
':i! 94 34 --127 9-- --
3$1 383
2024 26 mm
-- --25 --10 3
k-i -;-- -*-- A3 --
Total hardwoods 168.353 67.554 40,747 23,791 14,477 9,306 5,512 2,813 1,866 1,y-p P5
All species 6@,W 320,351 150,210 83,300 47,717 24,517 11,570 4,975 2,680 2,483 328
r/ Includes white and swamp chestnut oaks.g Includes cherrybark and Shumra oaks.

i
Table 14 .--volume of all live trees on commercial forest lend, by species ard diameter class, 1970
: :- All ;
Diameter class (inches at breast height)Species :
: classes : i ll.o- ; 13.0- ; 15.0- i 17.0- ; 1g.o- : 21.0- j29.0 arId: : : 12.9 : 14.9 : 16.9 : 18.9 : 20.9 i 28.9 : larger
- - - - - - - - - - - - - - - - - - Million cubic feet - - - - - - - - - - - - - - - - - -
Sof%?OOd:
LongleafpineSlash pineLoblolly pinePond pineSpruce pineSand pineBaldcypressPondcypressAtlantic white cedarEastern redcedar
5n.9 36.7 80.5 150.1 142.7 --1,588.2
69.3 22.5 6.5 2.9 0.7390.1 378.7 313.6
245.3235.2
14.8147.1
38.5 44.975.3 29.8 13.1
27.2 37.0 22.3 12.220.4
1;:;_---
99.1 ILL.2 17.0 19.04.3
15.1 '220:g
6.60.7
--
140.5 5;::-- 0.9 1.0 2.5 -- --
j 3818 24.5 i:", 5.6 1.5 1.8 --147.0
i:?15.5 21.6 18.5 24.2 18.8 12.2 8.8
655.2 327.44::
101.3 139.7 124.6 88.20.6
38.5 13.4 16.1 6.3 11.0 9.4 2.11.9
20::-- 0.3 0.9 -- -- -- -- --
8.7 1.6 1.3 1.8 1.0 0.4 -- 0.2 -- --Total softwoods 3,402.1 631.3 692.8 705.5 603.7 383.9 193.2 97.5 46.0 41.5 6.7
Hardwood:1/
E::F :::::3Other white oaksOther red oaksHickoryFlorida mapleSoft mapleBeechSweetgumTupelo and blackgumAshLablolly-bayBaSEWOOdYellow-poplarMagnoliaElmBlack cherrySweetbayRiver birchHackberry
13.13.8
266.6459.461.36.0
171.01.4
191.2573.0145.154.018.93.4
26.33E.i
108:52.1
0.60.7
g::4.70.2
19.0--26.469.623.411.41.60.4
::1:0.2
10.80.4
11.13.60.4
2::0.3
14.1--
1.10.4
20.861.47.4
310s
380:;86.423.210.31.90.5
i:Fj
15:50.1
0.80.5
23.151.89.31.6
24.4--
30.1102.6lg.8
:*8".0.45.07.2--
13.50.8
3.8 2.1 0.80.3 -- 0.2
26.2 25.4 26.454.2 43.0 33.912.7 6.4 4.01.6 -- --
21.2 18.5 9.00.4 0.5
27.6 15.286.0 52.1 31.218.4 14.2
0.4 0.5i:i 3.8 1.5
. 2.6 2.9
1;::0.6 0.4
15.3 9.90.2 -- 0.3.
1.2_-
21.428.33.12:--
7.824.66.61.50.4--
1.61.2
6:;0.3--
1.80.4
59.864.16.30.4
11.0
6:;3i.g
1:80.50.12.21.1
6:;mm
----
37.220.20.5--1.2--
2:0.40.9_-----
0.5--0.7-w--1.6 1.1 -- -- --
Other eastern hardwoods ,,::I1.7
4::: 31.8 16.1 14.7 . 1":: 0.8 0.3 --Total hardwoods 2.307.1 984 x9.6 344.2 116.9 700.4 211.1 144.5 112.1 200.0 68.9
All species 5,709.2 910*7 1,022.b w49.7 920.6 684.3 404.3 242.0 158.1 241.5 75.6
r/ Includes white and swamp chestnut oaks.g Includes cherrybark and Shumard oaks.

Table 15. --Volume of growing stock on commercial forest land, by species and diameter class, 1970: Diameter class (inches at breast height)
Species: ml :: classes :: : * 7.0-
. ck;- ;; g.o-
8.9 : 10.9; ll.o- ; 13.0- ; 15.0- ; 17.0- ; 1g.o- : 21.0- i2g.o and
: : 12.9 : 14.9 : 16.9 . 18.9 : 20.9 ; 28.9 : larger
Sof%wooi :
Longleaf pineSlash pineLoblolly pinePond pineSpruce pineSand pineBaldcypressPondcypressAtlantic white cedarEastern redcedar
510.4 36.0 80.3 149.8 142.7 69.3 22.5 6.5 2.6 0.7 --
m& 386.2 312.9 ,233.Y 146.8 75.3 5.1y6:2 10.3 13.8
376.4 26.216.3 18.3 37.9 44.7 20.3 14.6 37.0 '22 .
29.8 22.0 13.1 12.2 -- --6.6
4.32.5 13.1 0.7 --
5;:;
-- -- 0.9 1.0 -- --
135.4 38.2
0.9
23.1 ii:;138.8 ;:z 1.5 1.8 --14.8 20.7 17.9 23.7 18.3 12.2 13.0 a.1 ii:4 114625.7 93.4 121.2 135.1 122.6 .84.8 37.4 14.8
1.85.4 9.8 1.2
-- -- 0.3 0.6 0.9 -- -- -- -- --. 2.1 1.6 1.1 1.8 0.9 0.4 -- -- -- --
Total sof'twoods 3,$+2.2 612.7 680.9 696.4 599.6 379.1 192.1 * 5 43.9 39.4 2.6Hardwood:
Select white oakSelect red oaks2yOther white oaksOther red oaksHickoryFlorida mapleSoft mapleBeechSweetgumTupelo and blackgumAshLoblolly-bayBasswoodYellow-poplarMagnoliaElmBlack cherrySweetbayRiver birchIiackberry
12.53.8
136.3
'2.;510
127.21.2
172.5487.5106.142.715.42.9
22.23.3
82:
2
0.4 0.9
20::1.33.6
33.4 45.04.0 5.50.2 --
12.0 23.6-- --
21.9 28.152.7 65.513.4 18.78.1 8.01.3 3.00.20.5 z3.2 4.1
6::0.2
10.80.2 --1.1 0.2
1.10.4
4;:;7.40.8
22.7_-
34.573.116.38.21.3
;::
E.11.40.11.3
0.6
;:ii44.78.81.2
3.5.4--
27.786.817.44.1
3
;::--
11.20.51.1
3.60.3
13.246.812.01.6
16.10.4
25.1
n*;2:42.9
;:;
0:313.4
--
2.1-_
12.237.25.5-_
15.0
1z46.710.94.30.70.43.82.60.6
14.5--
0.80.2
15.227.83.76:;
;:;28.96.33.42.00.51.12.9
i:::0.30.4
1.2--
14.422.4
3.10.85.5--7.2
22.26.41.50.4--
1.50.9--5.80.3--
1.80..4
37.349.6
2:8.8--
25
1:80.5-*2.20.8
6:;--
-- -- m-
----
26.716.50.5--1.2_-
4":;0.20.9mm----
0.5--0.4----
--_____--_______ - - Mi l l ion cubic feet - - - - - - - - - - - - - - - - - -
Other eastern hardwoods 7.4 1. 0.9 1.9 0.8 1.5 es 0.3 -- 0.3 --
Total hardwoods 1.698.5 163.6 222.0 245.3 241.0 240.3 171.6 117.1 93.6 151.8 52.2
All species 5,040.7 776.3 902.9 941.7 840.6 619.4 363.7 212.6 137.5 191.2 54.8
r/ Includes white and swamp chestnut oaks.2f Includes cherrybark and Shumard oaks.

Lmgleaf pine 1,832.2 608.5 673.0 363.1 135.1 38.4 11.4 2.7 --Slash pineLoblollypine 3,6@&Pond pine 30310
">m&5816
1,034.4 194.6g:7o:o
427.4 201.3 176.1 126.4 59.7 57.7 22-i * - - - -82.4 40.4 36.4 11.9
Spruce pine 21.28518 3:::
5.0 4.6 __ ;:; ::166.6 24.9Sand pine ::: 10.7 --
Baldcypress 496.2 59.9 107.0 90.2 70.9 37.8 42:i 6:;Pondcypress 1,755.0 472.7 517.5 409.2 200.3 E:- 24.5 43.5 5.1Atlantic white cedar 6.7 0.9 1.9 -- -- -- --Eastern redcedar 16.6 3.7 . 3:g 3 1.8 __ __ _- __
Total sof.txoods 9.16g.4 2.561.2 2.655.3 1.896.8 i,o%g.8 553.9 203.0 195.6 11.8
44.66.4
542.71,066.o-175.3
17.6332.1
4.9386.9
1,220.3
5.6 9.564:; 176.5 1.8
-- 101.4 250.913*p-- 3.4 ";t
-- 26.0 5o:5-- -- ---- 34.9 34.1
log.6 158.3
------_---
1.31.8
15.8162.434.2
,Z--
95.5270.058.512.512.11.8
3.me
30.4
E:',
14.3
4;::178.747.6
+:i*
log.0307.660.38.0
32.03.4
14.913.2
4;::me
10.4
44:;154.925.1
69:;1.4
70.1194.650.520.63.7
1;:s"10.9
5,'::--
242.2 --
E3J-:215
1X-- 215-- --
$:%
4:8
t; 4:2 g-4-- --
216.0 22.8 26.91.4 ---- ----. ^ --
--
3.5
6::z135.519.4
mm36.2
4%152.729.818.19.8
:::11.62.837.51.3l*P
Table 16 .--volume of sawtimber on commercial forest land, by species and diameter class, 1970: ::
All iDiameter class (inches at breast height)
Species : classes: g.o- ; 11-o- j 13.0- ; 15.0- ; 17.0- i 1p.o- : 21.0- i29.0 and: ; 10.9 : 12.9 : 14.9 : 16.9 : 1.8.9 : 20.9 i 28.9 : larger
_ _ - - - _ - - - - - - - - Million board feet _ _ - - - - _ - - - - - - -
Sof.twood :
Hardwood :Select white oak
Other white oaksOther red oaksHickoryFlorida mapleSoft mapleBeechSweetgumTupelo and blackgmAshLoblolly-bayBas5wooaYellow-poplarMagnoliaElmBlack cherrySweetbayRlfrer birchHackberry
---_
128.482.23.8--7.8--
2.727.51.05.8--
Other eastern hardwoods l.l.7 we 2. b.6 1.1 -- 1.1
----
2.4--
1.2------
Total llfiratis 4.538.4 -- 8a?!.o 945.5 728.7 582.2 439.3 'i'yi'.g 262.8
All species 13,7o7.8 2,563.2 3,457.3 2,842.3 1,818.5 1,136.i 642.3 973.5 274.6
y Includes white and swamp chestnut oaks.d Includes cherrybark and Shmard oaks.

Table 17. --Net annual growth and removals of growing stock on commercialforest land, by species, 1969
Species i Net annual growth f Annual timber removals. .
- - - - Million cubic feet - - - -
Softwood:Yellow pinesCypressOther eastern softwoods
Total softwoods
Hardwood:Select white and red oaksOther white and red oaksHickoryHard mapleSweetgumAsh, walnut, and black cherryYellow-poplarOther hardwoods
Total hardwoods
All species
211.9 154.017.5 5.30.5 Mm
229.9 159.3
0.5 0.616.3 10.81.6 2.5
50:: 4"::2.7 0.90.1 0.3
20.8 9.247.8 28.7
277.7 188.0
-28-

Table 18 .--Net annual growth and removals of sawtimber on commercialforest land, by species, 1969
Species : Netannualgrowth Annual timber removals
Softwood:Yellow pinesCypressOther eastern softwoods
Total softwoods
Hardwood:Select white and red oaksOther white and red oaksHickoryHard mapleSweetgumAsh, walnut, and black cherry
, Yellow-poplarOther hardwoods
Total hardwoods
All species
- - - - Million board feet - - - -
605.6 507.2 ’60.9 19.4 ’1.4 - -
667.9 526.6
4;:: 3;::5.7 9.30.4 1.5
15.0 14.26.0 1 .4
,4”:4’1 . 6
30.0129.6 96.3
797.5 622.9
-2g-

Table 19. --Mortality of growing stock and sawtimber on commercialforest land, by species, 1969
Species... Growing stock ; Sawtimber. .
Million cubic feet Million board feet
Softwood:Yellow pinesQ-pressOther eastern softwoodsTotal sof%woods
Hardwood:Select white and red oaksOther white and red oaksHickoryHard mapleSweetgumAsh, walnut, and black cherryYellow-poplarOther hardwoods
Total hardwoods
All species
8.7 22.51.9 6.00.2 0.9
10.8 29.4
;:ii 26.9 1.1
- - - -- - - -
1.8 5.50.3 0.5- - mm
. lg.617.4 53.6
28.2 83.0
-3o-

-_-i- .. . i
Table 20.~-Volwne of all live trees end growing stock on commercial forest land, by ownership class end species @OUPj lY’f0
: All live trees : Growing stock: :Ownership class : 811 : ' Other ' Soft '
: : Pine : ;SOftWOOd harawooa iHard ; All
hardwood species;
Pine' Other ' Soft ' Hard
: species : : softwood: : : ; h8&moa jhaniwood
rational Forest 466.7 350.5 36.6 61.9 17.7 445.2 346.7 35.6 54.5 8.4
Other public 50.5 31.7 3.0 11.6 4.2 44.7 30.7 2.8 10.6 0.6
Wrest industry 2,463.5 1,033.O 461.1 553.8 415.6 2,230.h 1,028.3 444.5 461.5 296.1
Fanner 898.5 393.1 PO.7 174.0 240.7 758.2 388.9 87.4 138.6 143.3Miscellaneous private ~830.0 781.0 221.4 396.2 431.4 1.562.2 773.4 203.9 332.1 252.8
All ownerships 5,709.2 2,589.3 812.8 lJP7.5 1,109.h 5,&0.7 2,568.0 7~4.2. 997.3 701.2
Table 21.~-Volume of sawtimber on ocnmercial forest land, by ownership class and species group, 1970: :: : Large sawtimbe3
Ownership class : All : ' Other ' Soft 'Pine : Hard ' All ' Hard:. species i . sof-twmd f hardwood i hardwood i species i' Other ' SoPt 'Pine :, sof%wooa f hardwood f har&Iood
Bational Forest 965.1 830.2 71.2 58.3 5.4 245.6 87.0 55.8 88.7 14.1
Other public 9995 76.9 6.0 16.6 -- 38*7 19.4 2.1 14.3 2.9
Forest industry 4,054.p 2,210.2 1,028.2 533.3 283.2 1,924.o 513.3 293.2 522.7 594.8Farmer 1,216.5 743*3 192.8 156.7 3.23.7 831.8 289.3 59.4 174.6 308.5Miscelhuwnas private 2,526.8 1.576.7 379.8 375.5 234.8 1.8o4.g 548.6 186.0 522.2 548.1
AIll ownershIps 8,862.8 5,437*3 1,678.0 1,100.4 647.1 4,845.0 1,457.6 596.5 1,322.5 1,468.4
d1 Volme of sawtiarber trees less than 15.0 inches at d.b.h.J Volume of sawtimber trees 15.0 inches and larger at d.b.h.
--

Table 22 .--Net annual growth and removals of growing stock on commercial forest land, by ownership class and species group, 1969
::
lktamualgrowth : Annual tixtiber removals:Ownership class : All : ' Other ': species : Pine : soft : ' Other
i hardwoodHard i All i Pine : Hard
softwood: : : i hardwood : species : softwoodi Soft i
: : hardwood : hardwood
Hational Forest
Other public
--_____-___________ - Million cubic feet - - - - - - - - - - - - - - - - - - - -
24.5 22.5 0.6 1.1 0.3 6.9 6.9 -- -- --
2 .2 1.8 0.1 0.3 -- 4 .2 2.3 -- 0.5 1.4
Forest industry 123.1 90*5 10.5 12.8 9.3 90.0 76.5 2.4 5.9 5.2
Farmer 44.7 33.8 2 .0 4.1 4.8 3X.7 22.9 1.8 2.2 4.8
Miscellaneous private 83.2 63.3 4.8 8.2 6.9 55.2 45.4 1.1 4.7 4.0
All ownerships 277.7 211.9 18.0 26.5 21.3 188.0 154.0. 5.3 1-3.3 15.4
Table 23. --Iiet annual growth and remmale of sawtimber on commercial forest land, by ownership class and species group, 1969: Net annual growth : Annual timber removals:
Ownership class : All : ' Other ' soft :species : : Pine : : i hardwood
Hard i All i ' Otheri 60f-moa i hardwood : species Pine : Bard
60fh00ai Soft ihardwood hardwood: : : :
Iiational Forest 74.9 68.0 2.5 3.7 0.7 14.7 14.7 -- -- --
Other public 7.7 7.1 0.2 0.4 -- 14.5 9.4 -- 1.3 3.8
Forest industry 345.5 247.5 37.8 34.7 25.5 296.9 249.3 7.0 22.5 18.1
Farmer 118.8 90.0 6.9 9.6 J-2.3 107.8 78.1 8.3 8.6 12.8
!&3cellaneous private 250.6 193.0 14.9 20.8 21.9 189.0 155.7 4.1 11.4 15.8
All ownerships 797.5 605.6 62.3 69.2 60.4 622.9 507.2 19.4 45.8 50.5

Table 24 .--Average net volume per acre of sawtimber, growing stock, and other live timber 1/by ownership class, major forest Q-pa, and species group, 1970
on coMmercia1 forest land,
Forest type, Ownership classspecies group, andclass of material i All ownerships i National Forest i Other public i Forest industry i Farmer i Misc. private
Pine types:Growing stock:
SoftWOOdHardwood
TotalOther timber:
SoftwoodHardwood
Total
Oak-pine type:Growing stock:
Sc?twoodHardwood
TotalOther timber:
,'Softwood
Hardwood\ '1 Total
t 'I,Upland hardwood types:
', Growing stock:Softvood
HardwoodT&al
Other timber:SoftwoodHardwood
Total
Bottomland hardwood types:Growing stock:
SoftwoodHardwood
TotalOther timber:
SoftwoodHardwood
Total
All types:Growing stock:
SoftwoodHardwood
TotalOther timber:
SoftwoodHardwood
Total
All timber
Board Cubic Board Cubic Board Cubic Board Cubic Board Cubic Board Cubicfeet feet feet feet feet feet feet feet feet feet feet feet- - - - - - - - - - - -
1,406 569 2,123 805 1,169 392 1,300 535 1,306 57533 17 12 1 0 -- -- 18
54113 33 19
1,3;;26
1,439 586 2,135 815 1,169 392 1,318 548 1,339 594 1,426 ‘, 567
-- 6 -_ 9 -- 1.6 -- 3 -- 6 -- 7-- 12 -_ 9 es 7 -- 9 -- 15 -- 17-- 18 -- 1.8 -- 23 -_ I2 -- 21 -- 24
1,826 558 2,126 642 340 80 2,084 663 1,6o4 451 1,650 509405 184 197 214 -- -- 203 106 828 318 337 162
2,231 742 2,323 856 340 80 2,287 769 2,432 -69 1,987 671
-- 8; :: 1% :: 1: 1: 11 -- 6 -- 6-- 54 -- 118 -- 95-- 94 -- 118 -- -- -- 65 -- 124 __ 101
232 57 -- -- 268 58 292 68 223 61 2191,106 365 -_ -- 113 25 2.1dr 671 974 335 930 321,338 422 -- -- 381 83 2,396 739 1,197 396 1,149 359
-- 1 -- -- -- -- -- -- -- 1 -- 1-- 20-l -- -- -- 58 -- 230 -- 222 -- 203-- 208 -- -- -- 58 -- 230 -- 223 -- 204
1,425 442 2,050 566 652 170 1,554 475 1,355 429 1,2211,993 749 4,325 1,423 2,791 9% 1,892 749 1,649 616 2,107 ::;3,418 1,191 6,375 1,989 3,443 1,126 3,446 1,224 3,004 1,045 3,328 1,142
-- 21 -- 18 -- _- -_ 16 -- 16 -- 30-- 199 -- 247 _- 227 -- 183 _- 212 -- 218_- 220 -_ 265 -- 227 -- lyy -- 228 -- 248
1,297 472 2,085 2 888 285 1,388 505 1,101 408 412641 240 332 289 g6 663 260 654 241
1,;3;246
1,938 712 2,417 889 1,177 381 2,051 765 1,755 649 1,825 68
-_ 8; :: 1 0 -- 1 0 -- 7 -- 6 -_ 11-_ 33 -_ 39 -- 73 _- 114 -- lo.2-_ 95 -- 43 -- 49 -- 80 -- 120 -- 113
1,938 807 2,417 932 1,177 430 2,051 845 1,755 i'69 1,825 771
u Rough and rotten trees.
-33-

/ , ’ ”
Table 25 .--Land area, by class, major forest type,and survey completion date, 1949, 1959, and 1970
Land use class
..
. Survey completion date i. . Change
.: 194&l ; 1970 f 1959-1970. . * .
Forest land:Commercial forest land:
Pine and oak-pine typesHardwood types
TotalNoncommercial forest land:
Productive-reservedUnproductive
Total
Nonforest land:CroplandPasture and rangeOther
Total
All landr/
- - - - - Thousand acres - - - - -
4,894.o 4,336~ 4,568.2 +232.12,707.7 2,914.g 2,492.T -422.27,601.7 7,251.O 7,060.g -190.1
6.1 12.3 13.8 + 1.5 ’
85.9 62.4 39.0 - 23.492.0 74.7 52.8 - 21.9
lJX3.2 bO79.3 813.7 -265.62% .6 468.2 'T$*fi +326.6546.7 790.8 . +i21.6
l,gTo.‘j 2,338.3 2,520.g +182.6
9,644.z 9,664.o g,W.6 - 29.4
1 Excludes all water areas.j2 These figures differ slightly from reported figures because of
revisions in the estimates of land area.
-34-

_-- .
Table 26 .--Volumetiof sawtimber, growing stock, and all Sive timber on commercial forest land, by species group,diameter class, and survey completion date
: : : Diameter class: : : (inches at breast height)Speciesgroup : Year :
cl&ies: g:;- : :
: : : : i:", - i 9.0- ; ll.G- 19.0- 21.0 and: : : : 10.9 : 12.9
; 13.0- ; 15.0- ; 17.0-16.9 ; 18.9
;: 14.9 : : 20.9j: larger
SAWl!IMBE8 (in million board feet)Softwood 1949 7,840.2
1959 7,336.8 :: 1: 2,609.5 2,474.62,276.9 2,398.8
1,584.6 634.3 287.5 87.1 162.61,407.2 696.0 31391 130.0 114.8
1970 y,16y.4 -- -- 2,563.2 2,655.3 1,896.8 1,089.8 553.9 203.0 207.4Hardwood 1949 4,24l.6 -- -- -- 760.5 911.1 625.9 552.4 360.2 l,O31.5
1959 4,232.4 -- -- -- 779.7 914.6 666.0 562.8 421.1 888.21970 4,538.4 -- -- -- 802.0 945*5 728.7 582.2 439.3 1,040.7
I GROWING STOCK (in million cubic feet)?II SOftWOOd 1949 2,629.6 302.4 529.7 316.7 111.8 49.6 18.8 33.0
1959 2,593.8 387.1 537.28i28 :Ei
281.3 122.6 54.0 28.1 23.31970 3,342.2 612.7 680.9 6y6:4 599:6 379.1 192.1 95*5 43.9 42.0
Hardwood 1949 1,527.l 139.4 174.5 215.6 228.6 231.5 147*5 111.1 76.7 202.21959 1,585.4 153.1 191.0 240.6 234.4 232.4 156.9 113.2 174.11970 1,698.5 163.6 222.0 245.3 241.0 240.3 171.6 117.1 204.0
ALL LIE TIMBER (in million cubic feet)
SOftWOOd 1949 2,673.2 311.8 538*7 718.7 562.6 320.8 112.5 50.6 19.7 37.81 9 5 9 q637.6 399.2 627.1 54594 284.9 123.4 55J 29.4 26.81970 3,4G2.1 631.3
g*;. 705*5 603.7 383*9 193.2 97.5 46.0 48.2
Hardwood 1949 2,C66.7 238.5 259.2 302.3 300.6 289.4 181.3 137.1 91.9 266.41959 2G5l.3 261.9 308.2 290.6 193.0 139.7 107.4 229.41970 2,307.l 279.4 316.9 300.4 211.1 144.5 112.1 268.9
1;/ To provide a basis for valid comparisons, adjustments have been made to allow for differences in volume tablesand sawtimber specifications used in previous surveys.
-