Embed Size (px)
Citation preview

United StatesDepartmentof Agriculture
Forest Service
Rocky MountainResearch Station
September 2003
Forest Resourcesof the CibolaNational ForestPaul Rogers

Rocky Mountain Research Station324 25th Street
Ogden, UT 84401
About the author __________________________
Paul Rogers is an ecologist with the Interior West Forest Inventory andAnalysis Program, Rocky Mountain Research Station in Ogden, Utah. He holdsa B.S. degree in geography from Utah State University, and an M.S. degree ingeography from the University of Wisconsin-Madison.
Contents __________________________________Page
Description of the Forest ........................................................................................ 1Total forest land: highlights of our inventory ..................................................... 2Nonreserved timberland: highlights of our inventory ...................................... 8The inventory methods ......................................................................................... 10Documentation ....................................................................................................... 13For further information ......................................................................................... 13

1
Forest Resources of the Cibola National Forest
Paul Rogers
The Interior West Forest Inventory and Analysis (IWFIA)program of the USDA Forest Service, Rocky Mountain Re-search Station, as part of its national Forest Inventory andAnalysis (FIA) duties, conducted forest resource invento-ries of the Southwestern Region (Region 3) National For-ests. This report presents highlights of the Cibola NationalForest, with Kiowa and Rita Blanca National Grasslands,1997 inventory, including tree population estimates andsummaries of commonly requested variables.
The information presented in this report is based solelyon the IWFIA inventory sample (USDA 1997). The datacould be summarized in other ways for different pur-poses (see “For further information” on the inside backcover for national FIA database and related contacts).Supplemental documentation and inventory terminologycan be found in O’Brien (2002), USDA (2002a), or on theWorld Wide Web at http://www.fs.fed.us/rm/ogden.Changes in terminology or procedures may limit com-parisons with previous estimates and summaries for thisarea. Additional data collected for the Cibola NationalForest, used separately or in combination with IWFIAdata, may produce varying results.
Since the results tabulated in this report reflect datacollected by field crews chiefly during the year 1997,changes in forest characteristics that have taken placesince that time are not addressed. Any trends or distur-bances (such as, fire) that have occurred after 1997 will bediscussed in reports from future inventories of the CibolaNational Forest.
Description of the ForestThe Cibola National Forest administers 1,767,376 acres
(USDA 1996) of which 79 percent is classified as forest landand 21 percent nonforest or water. This report describesthe characteristics of the forest land sampled on theCibola National Forest. Forest land is land that is at least 10percent stocked (or formerly stocked) with live tally treespecies and is greater than 1 acre in size and 120 feet wide.Based on the predominate tree species present, forestland can be further subdivided into two land categories:timberland and woodland (fig. 1). Timberland is forest landwhere the predominance of tree species tallied have beentraditionally used in the wood products industry, such asponderosa pine and Douglas-fir. Woodland primarily in-cludes tree species that typically do not conform to breastheight diameter measurement or have not been tradition-ally used for industrial wood products, such as pinyonpine, junipers, and oaks. Focusing on forested land only,32 percent is timberland and 68 percent is woodland.
Figure 1—Percent accessible forest land by land type,Cibola National Forest.
26%
53%
21%
Timberland
Woodland
Nonforest

2
Figure 2—Percent of forest land area by forest type, Cibola National Forest.
Eight percent of the total forested area administered bythe Cibola National Forest is reserved land, meaning that ithas been withdrawn from management for production ofwood products, such as wilderness areas. The first sectionof this report presents summaries of timber and woodlandspecies for all forest land, including reserved designations.A subsequent section addresses nonreserved timberlandonly and includes estimates for timber species sampled onthe Cibola National Forest.
Total forest land: highlights ofour inventory
Forest type–Forest resources are often described using aforest type classification. Forest type refers to the predomi-nant tree species in a stand, based on plurality of treestocking. Stocking is an expression of the extent to whichgrowing space is effectively utilized by live trees.
Figure 2 presents the distribution of forest land area onthe Cibola National Forest by forest type. Pinyon-juniperand pure juniper types dominate the Forest with a com-bined 59 percent of the total forest land area. The ponde-rosa pine forest type comprises about 27 percent of theforest land. The remaining 14 percent comprises a varietyof timber and woodland types including evergreen anddeciduous woodland oaks, Douglas-fir, aspen, white fir,spruce-fir, and miscellaneous species.
A field plot may sample more than one condition. A for-est condition is generally defined as an area of relativelyhomogeneous vegetative cover that meets the criteria forforest land. Forest type is one of several attributes that de-fine and separate conditions identified on the plot (for fur-ther explanation of conditions, see “About the mapped-plot design” page 11). Table 1 presents the number ofconditions and the condition proportions sampled on theCibola National Forest by forest type and land category.
Table 1—Number of conditions and condition proportionson forest land by forest type and land category,Cibola National Forest, 1997.
Number of ConditionForest type conditionsa proportionsb
TimberlandPonderosa pine 60 56.5Douglas-fir 9 8.3White fir 2 1.3Aspen 2 1.0Spruce-fir 1 1.0Misc. western softwoods 1 .8
Total timberland 75 68.7
WoodlandPinyon–Juniper 123 112.4Juniper 14 13.7Deciduous woodland oak 13 11.2Evergreen woodland oak 7 6.5
Total woodland 157 143.8
Grand Total 232 *212.7
aNumber of conditions by forest type that were sampled. The sumof these numbers is often greater than the total number of plotsbecause a plot may sample more than one forest condition.
bSum of the condition proportions of plots by forest type that weresampled. The sum of these numbers is often less than the totalnumber of plots because of nonforest condition proportions (fromplots containing both forest and nonforest conditions) that are notincluded here.
* Number does not add to total due to rounding.
Number of live trees–Forest land can also be examinedby looking at composition of tree species. Figure 3 showstotal number of live trees for all tree species sampled forthree broad diameter classes. Most trees on the forest arein the smallest diameter class, topped by the proliferation
0% 10% 20% 30% 40% 50% 60%
Misc. western softwoodsAspen
Spruce-firWhite fir
Evergreen woodland oakDouglas-fir
Deciduous woodland oakJuniper
Ponderosa pinePinyon-juniper
For
est t
ype
Forest land area

3
Figure 3—Number of live trees 1 inch diameter and greater on forest land by species and diameter-size class, Cibola National Forest.The 1-4.9 inch class for Gambel oak and twoneedle pinyon were condensed to improve display (actual values shown).
of Gambel oak and twoneedle pinyon. Gambel oak in the1-4.9” diameter class accounts for 36 percent of all treestallied on the forest. Many oak species produce largeamounts of young trees that do not reach maturity. Con-versely, ponderosa pine displays a more even taper fromsmall, to medium, to large diameter classes. Ponderosapine comprise 29 percent of all trees in the largest diam-eter class (>= 11”), followed by oneseed juniper (26 per-cent), and twoneedle pinyon (15 percent) on the CibolaNational Forest. A complete list of tree species sampledduring this inventory is found in table 2. Less commonspecies may not be tallied with the sampling strategy usedfor this inventory.
Number and weight of dead trees—Standing and downdead trees are important to forest ecosystems becausethey provide habitat for wildlife, function as nutrient sinks,and protect the soil from erosion. Approximately 57 mil-lion standing dead trees (snags) are 1 inch diameter andgreater on Cibola forest land, averaging 32.6 snags peracre. Different size snags offer variety in habitat for wild-life. Figure 4 shows the number of snags by forest type forthree diameter size classes. Of the total numbers of snags,76 percent are between 1 inch and 4.9 inches diameter,with over half of these occurring within the ponderosapine forest type. Of the total numbers of snags, 15 percentare between 5 and 10.9 inches diameter. Snags 11 inchesdiameter or larger make up 9 percent of the total, averag-ing 3 snags per acre. Most of these large snags are found inpinyon–juniper (58 percent) and ponderosa pine (13 per-cent), with fewer snags recorded in other forest types.
261
107
0
10
20
30
40
50
60
70
Pon
dero
sapi
ne
Dou
glas
-fir
Whi
te fi
r
Sou
thw
este
rnw
hite
pin
e
Oth
er ti
mbe
r
Ariz
one
whi
teoa
k/gr
ay o
ak
Alli
gato
rju
nipe
r
Em
ory
oak
Gam
bel o
ak
New
Mex
ico
locu
st
One
seed
juni
per
Tw
onee
dle
piny
on
Roc
kyM
ount
ain
juni
per
Oth
erw
oodl
and
Timber Woodland
Species
Mill
ion
tree
s
1.0" - 4.9"
5.0" - 10.9"
>= 11"

4
Figure 4—Number of standing dead trees 1 inch diameter and greater on forest land by forest type and diameter class,Cibola National Forest. The 1-4.9" class for ponderosa pine was condensed to improve display (actual value is 24,461,096).
Table 2—Net volume, basal area, and biomass on forest land by species, CibolaNational Forest, 1997.
Volume Basal area BiomassSpecies (million cubic-feet) (million sq. ft) (million tons)
Ponderosa pine 439.7 28.7 9.0Twoneedle pinyon 225.5 19.6 2.6Oneseed juniper 133.4 23.7 1.7Douglas-fir 99.0 5.9 2.0Alligator juniper 76.7 9.7 1.0Gambel oak 55.3 4.7 1.6Rocky Mountain juniper 29.1 4.0 .4White fir 17.8 1.2 .3Aspen 16.6 .8 .3Southwestern white pine 13.3 .8 .2Engelmann spruce 10.8 .3 .1Arizona white oak/gray oak 9.7 2.3 .3Corkbark fir 7.9 .3 .1Utah juniper 3.9 .6 ‡Limber pine 1.9 .1 ‡New Mexico locust 1.2 .1 ‡Rocky Mountain Maple .3 † ‡
Total* (all tree species) 1,142.1 103.0 20.0
† less than 100,000 sq ft‡ less than 100,000 tons* numbers do not add to total due to rounding
24
0
2
4
6
8
10
Ponderosapine
Pinyon-juniper
Deciduouswoodland
oak
Douglas-fir Juniper Spruce-fir White fir Evergreenwoodland
oak
Aspen
Forest type
Mill
ion
snag
s
1-4.9"
5-10.9"
>= 11"

5
The amount of down dead material can contribute signifi-cantly to forest fuel loads and fire potential. Approximately574,269 tons of down dead trees are on the Forest, averaging.32 tons per acre. This estimate includes the merchantablebole and bark of trees 5 inches diameter and greater. Morethan one-third of this estimate is from ponderosa pine, withanother 25 percent coming from twoneedle pinyon pine.
Tree and stand size–The size distribution of trees is anindicator of diversity across a landscape. Figure 5 displaysthe tree size distribution by diameter class on the CibolaNational Forest. Seventy-five percent of the area ofnonreserved timberland is found in the 9.0 inch andlarger stand-size class. Nineteen percent of all live treesare from 5 to 10.9 inches diameter, and 6 percent are 11inches diameter and greater.
Stand-size class is a categorization of forest land basedon the predominant diameter-size of live trees that con-tribute to the plurality of stocking in a stand. The large
diameter class includes softwoods 9 inches diameter andgreater, and hardwoods 11 inches diameter and greater;the medium diameter class includes softwoods 5 to 8.9inches diameter, and hardwoods 5 to 10.9 inches diameter;and the small diameter class (saplings and seedlings) in-cludes all trees under 5 inches diameter. In terms of stock-ing, fewer large-diameter trees compared to small-diam-eter trees are required to fully utilize a site; therefore,large diameter trees have a greater impact on determiningstand-size class. Figure 6 displays a breakdown of forestland by stand-size class. Approximately 75 percent of thestands have a plurality of stocking from large trees and5 percent are nonstocked as a result of recent disturbance,such as burning or cutting.
Wood volume, basal area of live trees, and biomass–Ingeneral, estimates of volume, basal area, and biomass de-scribe the amount of wood fiber in the forest. Each esti-mate summarizes different parts of a tree and therefore
Figure 5—Number of livetrees by 2-inch diameterclass on forest land, CibolaNational Forest.
0 200 400 600 800 1,000 1,200
Nonstocked
Small
Medium
Large
Sta
nd-s
ize
clas
s
Thousand acres
Figure 6—Forest land area bystand-size class, Cibola NationalForest. Large trees includesoftwoods 9 inches and greaterand hardwoods 11 inches andgreater; medium trees includesoftwoods 5 inches to 8.9 inchesand hardwoods 5 inches to 10.9inches; saplings/seedlingsinclude trees less than 5 inches.
0
50
100
150
200
250
300
350
400
450
2 4 6 8 10 12 14 16 18 20 22 24 26+
Tree diameter class (inches)
Mill
iion
tree
s

6
Table 3—Net volume, basal area, and biomass per acre on forest land by forest type, CibolaNational Forest, 1997.
Volume Basal area BiomassForest type (cubic-feet per acre) (square feet per acre) (tons per acre)
Spruce-fir 4,791 180 75.6White fir 2,165 130 38.9Misc. western softwoods 1,913 102 35.4Douglas-fir 1,534 89 31.0Ponderosa pine 1,167 80 24.3Aspen 847 68 18.6Deciduous woodland oak 687 54 16.1Pinyon-juniper 652 75 8.9Juniper 197 38 2.7Evergreen woodland oak 136 29 3.1
All forest types (combined) 814 73 14.2
has different applications. For example, volume relates towood products, basal area to tree or stand density, andbiomass to total tree or stand production. In table 2, volumerepresents the amount of wood fiber in the merchantablebole of a tree. Basal area estimates include the cross-sectional area of a tree stem (bole) at the point where di-ameter is measured. In this summary, biomass representsthe amount of wood fiber in terms of oven-dry weight in-cluding the tree boles, bark, and branches (not foliage).Table 2 shows a breakdown by species of net volume,basal area, and biomass for live trees 5 inches diameterand greater on the Cibola National Forest. Ponderosapine leads all species in overall volume (38 percent),basal area (28 percent), and biomass (49 percent).
Figure 7 shows the distribution of net volume of woodin trees by diameter class on Cibola forest land. While the
number of trees declines with larger diameter classes(see fig. 5), volume maximizes at diameter classes from 8 to14 inches before tapering in the largest size classes.
Another way to look at wood volume is by forest type, forwhich per acre estimates can be computed along with basalarea and biomass (table 3). These numbers include the manydifferent species that can occur together within each foresttype. The highest volume per acre on the Cibola NationalForest is in the spruce-fir forest type, followed by white firand miscellaneous western softwoods. These three foresttypes also contain the highest basal area and biomass peracre, as these attributes are strongly correlated with volume.
Many of the forest types listed in table 3 may not be rep-resentative due to small sample sizes (see table 1). Onlythe ponderosa pine, pinyon–juniper and juniper foresttypes have large samples.
Figure 7—Percent of total net cubic-foot volume of live trees by diameter class, Cibola National Forest.
0%
2%
4%
6%
8%
10%
12%
14%
6 8 10 12 14 16 18 20 22 24 26 28 30 32 36 38 40 42+
Diameter class
Tot
al v
olum
e

7
0
50
100
150
200
250
300
350
400
< 10 10.0-24.9 25.0-34.9 35.0-49.9 50.0-59.9 60+
Percent of maximum stand density index
Tho
usan
d ac
res
Misc. western softwoodses
Aspen
Spruce/Fir
White fir
Evergreen woodland oak
Douglas-fir
Deciduous woodland oak
Juniper
Ponderosa pine
Pinyon-Juniper
Figure 8—Area of forest land by forest type group and percent stand density index, Cibola NationalForest.
applied to uneven-aged stands (Long and Daniel 1990;see next paragraph for explanation of even-aged and un-even-aged stands). SDI is usually presented as a percent-age of the maximum SDI for each forest type (USDA1991). SDI was computed for each location using thosemaximums, and the results were grouped into six classes(fig. 8). A site is considered to be fully occupied at 35 per-cent of SDI maximum, which marks the onset of competi-tion-related stresses and slowed growth rates (Long andDaniel 1990). Based on FIA sample data, 48 percent of all for-est stands in the Cibola National Forest are considered tobe fully occupied.
Southwest stand structure–Stands may be categorized onthe basis of tree size, often in terms of their predominatediameter or height class. This works well for stands wherejust one or two size classes dominate. Such stands arecalled single-storied, or even-aged, because they have astructure characterized by a single canopy layer or twoclosely related layers. Stands having a structure composedof three or more size classes are called multistoried or un-even-aged stands. Contrasting stand structures provide di-versity across landscapes. Differences between many lay-ers within a multistoried stand provide vertical diversity.
Figure 9 shows area of forest land by stand structureclass and diameter class for pine, mixed conifer, spruce-fir,and miscellaneous western softwoods. On the Cibola Na-tional Forest, the pine category is made up of ponderosapine; the mixed conifer category includes Douglas-fir,white fir, and blue spruce; the spruce-fir category containsEngelmann spruce; and the miscellaneous western soft-woods, on this national forest, consist only of southwest-ern white pine. The values shown are based on analysis of
Stand density index–Many factors influence the rate atwhich trees grow and thrive, or die. As tree size and den-sity increase, competition for available resources increases.Stand density index (SDI), as developed by Reineke(1933), is a relative measure quantifying the relationshipbetween trees per acre, stand basal area, average standdiameter, and stocking of a forested stand. The conceptwas developed for even-aged stands, but can also be

8
SDI and tree diameter classes, a method developed by theSouthwest Region (USDA 2002b). In general, the CibolaNational Forest is represented by both single-storied andmultistoried stands, but the distribution within single-sto-ried stands occurs mainly in the 5-11.9 inch diameter class.
Growth and Mortality–Another measure of forest vigoris net annual growth. Net annual growth is the differencebetween gross annual growth and losses due to mortality.Field crews assess which trees have died in the past 5years; these trees are used to estimate an average annualmortality. Based on this estimate, in 1997 approximately 2.4million cubic feet of wood 5 inches diameter and greaterdied on the Cibola National Forest. Ponderosa pine gener-ated the highest volume of mortality at 41 percent, fol-lowed by Douglas-fir and corkbark fir at 25 and 13 percent,respectively.
Gross annual growth of all live trees 5 inches diameterand greater on all Cibola forest land is estimated at 23 mil-lion cubic feet. By deducting the estimated mortality fromthe gross growth we calculated a net annual growth of 21million cubic feet. Total mortality is about 11 percent ofgross annual growth. In figure 10, gross annual growth iscompared to mortality for the ten species that includemortality trees. Growth in all species far outstrips mortalityon the Cibola National Forest.
Field crews also estimate the causes of mortality, whenpossible. Thirty-seven percent of the mortality on theCibola National Forest was caused by fire, 28 percent by
Figure 9—Area of forest land by stand structure class, diameter class, and timberlandsoftwood forest type groups, Cibola National Forest.
insects, and 25 percent by disease. The remaining 10 per-cent was attributed to unknown, weather, and suppressioncauses, in respective order of prominance.
Understory vegetation—Understory vegetation providesforage and cover for wildlife, contributes to forest fuelload, adds to total forest biomass, and can be an indicationof the successional stage of the forest community. Oneach plot field crews visually estimated crown canopy cov-erage for four plant groups: tree seedlings and saplings,shrubs, forbs, and graminoids (see USDA 1997 for details).Figure 11 shows the average percent cover of these plantgroups on forest land by forest type.
Nonreserved timberland:highlights of our inventory
Tree and stand size—Twenty-nine percent of forest landin the Cibola National Forest is nonreserved timberland.The distribution of nonreserved timberland by stand sizeclass is presented in figure 12. Seventy-five percent of thearea of nonreserved timberland is in the 9.0 inch andlarger stand-size class. Similar to all forest land (fig. 6),most of the nonreserved timberland area has a pluralityof stocking from large trees.
Figure 13 shows the distribution of diameter-size classesfor growing-stock trees on nonreserved timberland on theCibola National Forest. Growing-stock trees are live timber
0
20
40
60
80
100
120
140
160
180
200
220
0.0-0.9 1.0-4.9 5.0-11.9 12.0-17.9 18.0-23.9 24+
Single/two-storied Multi-storied
Stand structure class
Tho
usan
d ac
res
Pine
Mixed conifer
Spruce-fir
Misc. western softwoods

9
Figure 10—Gross annual growth of live trees 5inches diameter and greater compared tomortality on all forest land, Cibola NationalForest.
Figure 11—Average percent cover of seedlings and saplings, shrubs, forbs, and graminoids on forest landby forest type, Cibola National Forest.
0
5
10
15
20
25
30
Aspen Deciduouswoodland oak
Douglas-fir Evergreen oak Juniper Misc. westernsoftwoods
Pinyon-juniper Ponderosa pine Spruce-fir White fir
Forest type
Ave
rage
per
cent
cov
er
Seedlings/Saplings
Shrubs
Forbs
Graminoids
Figure 12—Area of nonreserved timberland by stand-size class, Cibola National Forest.
0 50 100 150 200 250 300 350
Nonstocked
Small
Medium
Large
Sta
nd
-siz
e cl
ass
Thousand acres
0 2 4 6 8 10 12
Southwestern white pine
Rocky Mountain juniper
Alligator juniperlli
White fir
Aspen
Oneseed juniper
Gambel oak
Douglas-fir
Twoneedle pinyon
Ponderosa pine
Hig
h vo
lum
e sp
ecie
s
Million cubic feet
Gross growth
Mortality
10
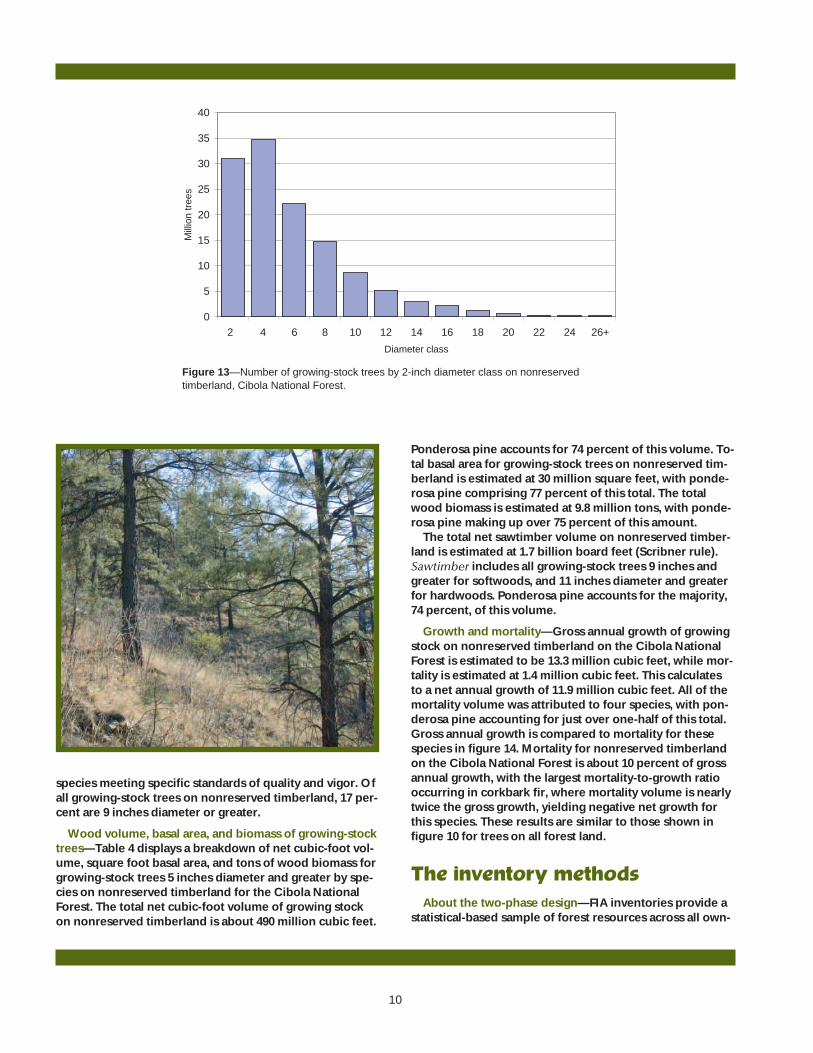
Figure 13—Number of growing-stock trees by 2-inch diameter class on nonreservedtimberland, Cibola National Forest.
species meeting specific standards of quality and vigor. Ofall growing-stock trees on nonreserved timberland, 17 per-cent are 9 inches diameter or greater.
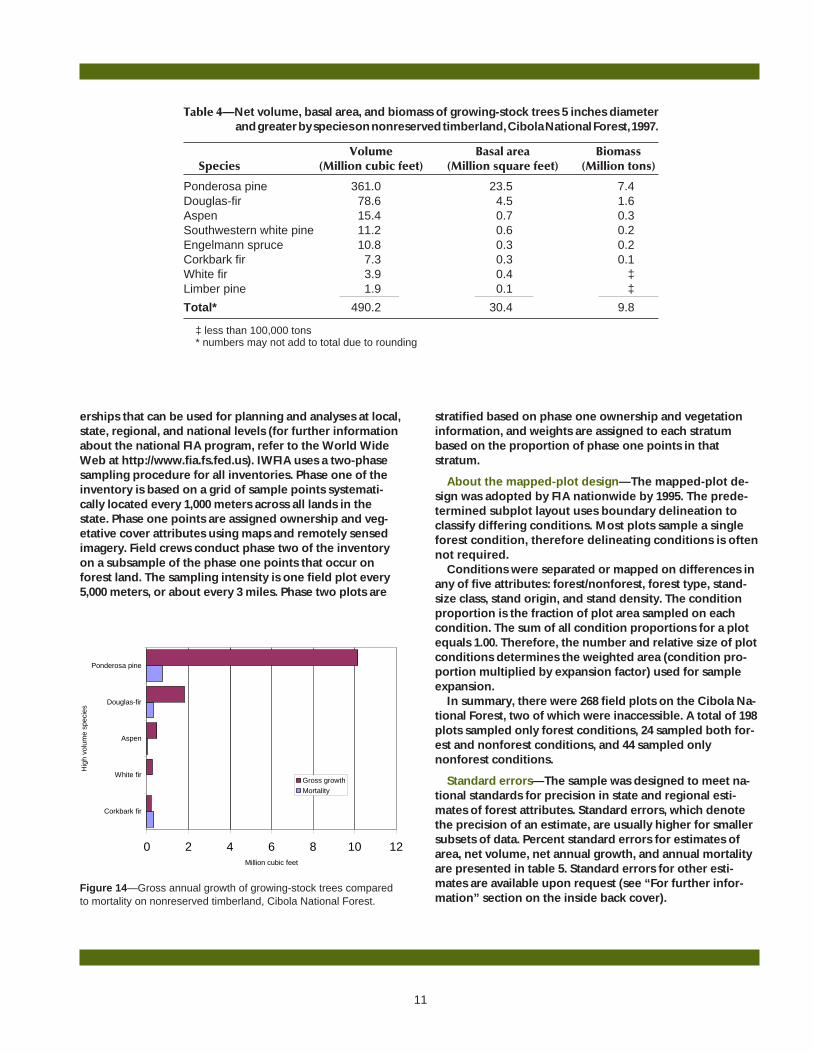
Wood volume, basal area, and biomass of growing-stocktrees—Table 4 displays a breakdown of net cubic-foot vol-ume, square foot basal area, and tons of wood biomass forgrowing-stock trees 5 inches diameter and greater by spe-cies on nonreserved timberland for the Cibola NationalForest. The total net cubic-foot volume of growing stockon nonreserved timberland is about 490 million cubic feet.
Ponderosa pine accounts for 74 percent of this volume. To-tal basal area for growing-stock trees on nonreserved tim-berland is estimated at 30 million square feet, with ponde-rosa pine comprising 77 percent of this total. The totalwood biomass is estimated at 9.8 million tons, with ponde-rosa pine making up over 75 percent of this amount.
The total net sawtimber volume on nonreserved timber-land is estimated at 1.7 billion board feet (Scribner rule).Sawtimber includes all growing-stock trees 9 inches andgreater for softwoods, and 11 inches diameter and greaterfor hardwoods. Ponderosa pine accounts for the majority,74 percent, of this volume.
Growth and mortality—Gross annual growth of growingstock on nonreserved timberland on the Cibola NationalForest is estimated to be 13.3 million cubic feet, while mor-tality is estimated at 1.4 million cubic feet. This calculatesto a net annual growth of 11.9 million cubic feet. All of themortality volume was attributed to four species, with pon-derosa pine accounting for just over one-half of this total.Gross annual growth is compared to mortality for thesespecies in figure 14. Mortality for nonreserved timberlandon the Cibola National Forest is about 10 percent of grossannual growth, with the largest mortality-to-growth ratiooccurring in corkbark fir, where mortality volume is nearlytwice the gross growth, yielding negative net growth forthis species. These results are similar to those shown infigure 10 for trees on all forest land.
The inventory methodsAbout the two-phase design—FIA inventories provide a
statistical-based sample of forest resources across all own-
0
5
10
15
20
25
30
35
40
2 4 6 8 10 12 14 16 18 20 22 24 26+
Diameter class
Mill
ion
tree
s
11
Table 4—Net volume, basal area, and biomass of growing-stock trees 5 inches diameterand greater by species on nonreserved timberland, Cibola National Forest, 1997.
Volume Basal area BiomassSpecies (Million cubic feet) (Million square feet) (Million tons)
Ponderosa pine 361.0 23.5 7.4Douglas-fir 78.6 4.5 1.6Aspen 15.4 0.7 0.3Southwestern white pine 11.2 0.6 0.2Engelmann spruce 10.8 0.3 0.2Corkbark fir 7.3 0.3 0.1White fir 3.9 0.4 ‡Limber pine 1.9 0.1 ‡
Total* 490.2 30.4 9.8
‡ less than 100,000 tons* numbers may not add to total due to rounding
erships that can be used for planning and analyses at local,state, regional, and national levels (for further informationabout the national FIA program, refer to the World WideWeb at http://www.fia.fs.fed.us). IWFIA uses a two-phasesampling procedure for all inventories. Phase one of theinventory is based on a grid of sample points systemati-cally located every 1,000 meters across all lands in thestate. Phase one points are assigned ownership and veg-etative cover attributes using maps and remotely sensedimagery. Field crews conduct phase two of the inventoryon a subsample of the phase one points that occur onforest land. The sampling intensity is one field plot every5,000 meters, or about every 3 miles. Phase two plots are
0 2 4 6 8 10 12
Corkbark fir
White fir
Aspen
Douglas-fir
Ponderosa pine
Hig
hvo
lum
esp
ecie
s
Million cubic feet
Gross growthMortality
Figure 14—Gross annual growth of growing-stock trees comparedto mortality on nonreserved timberland, Cibola National Forest.
stratified based on phase one ownership and vegetationinformation, and weights are assigned to each stratumbased on the proportion of phase one points in thatstratum.
About the mapped-plot design—The mapped-plot de-sign was adopted by FIA nationwide by 1995. The prede-termined subplot layout uses boundary delineation toclassify differing conditions. Most plots sample a singleforest condition, therefore delineating conditions is oftennot required.
Conditions were separated or mapped on differences inany of five attributes: forest/nonforest, forest type, stand-size class, stand origin, and stand density. The conditionproportion is the fraction of plot area sampled on eachcondition. The sum of all condition proportions for a plotequals 1.00. Therefore, the number and relative size of plotconditions determines the weighted area (condition pro-portion multiplied by expansion factor) used for sampleexpansion.
In summary, there were 268 field plots on the Cibola Na-tional Forest, two of which were inaccessible. A total of 198plots sampled only forest conditions, 24 sampled both for-est and nonforest conditions, and 44 sampled onlynonforest conditions.
Standard errors—The sample was designed to meet na-tional standards for precision in state and regional esti-mates of forest attributes. Standard errors, which denotethe precision of an estimate, are usually higher for smallersubsets of data. Percent standard errors for estimates ofarea, net volume, net annual growth, and annual mortalityare presented in table 5. Standard errors for other esti-mates are available upon request (see “For further infor-mation” section on the inside back cover).
12
Table 5—Percent standard error for area estimate of total forest land, andpercent errors for estimates of net volume, net annual growth, andannual mortality for all live trees on total forest land, and growing-stock trees (5 inches diameter and greater) on nonreserved timberland,Cibola National Forest.
PercentLand class Attribute Cubic feet standard error
Total forest land (acres) Area 1,403,548 ±2.4Total forest land Volume 1,142,133,941 ±6.3 (all trees cubic feet) Growth 20,600,714 ±8.6
Mortality 2,440,680 ±30.2
Nonreserved timberland Volume 490,202,444 ±13.3(growing-stock trees cubic feet) Growth 11,938,531 ±14.1
Mortality 1,381,714 ±42.1

13
Federal Recycling Program Printed on Recycled Paper
DocumentationLong, James N.; Daniel, Theodore W. 1990. Assessment of
growing-stock in uneven-aged stands. Western Journalof Applied Forestry 5(3):93-96.
O’Brien, Renee A. 2002. Arizona’s Forest Resources, 1999.Resour. Bull. RMRS-RB-2. Ogden, UT: U. S. Departmentof Agriculture, Forest Service, Rocky Mountain ResearchStation. 116 p.
Reineke, L.H. 1933. Perfecting a stand density index foreven-aged forests. J. Agric. Res. 46:627-638.
U.S. Department of Agriculture, Forest Service. 1991.RMSTAND User’s Guide, Chapter 60, p. 106. Unpublisheduser’s guide on file at: U.S. Department of Agriculture,Forest Service, Southwestern Region, Albuquerque, NM.
U.S. Department of Agriculture, Forest Service. 1996. LandAreas of the National Forest System. FS-383. As of Sep-tember 1996.
U.S. Department of Agriculture, Forest Service. 1997. Arizona/New Mexico Region 3 forest survey field procedures, 1997.Ogden, UT: USDA Forest Service, Intermountain ResearchStation.
U.S. Department of Agriculture, Forest Service. 2002a.Reference documents. [Online]. Available: http://www.fs.fed.us/rm/ogden/state_reports/arizona/az_nfs.html (alsoavailable on file at: U.S. Department of Agriculture, ForestService, Rocky Mountain Research Station, Ogden, UT).
U.S. Department of Agriculture, Forest Service. 2002b. Re-gion-3 Guide For Custom IW-FIA Table Set, 2002. Unpub-lished report on file at: U.S. Department of Agriculture,Forest Service, Southwestern Region, Albuquerque, NM.
For further information ________________Interior West Forest Inventory and Analysis ProgramRocky Mountain Research Stationc/o Program Manager507 25th Street,Ogden, UT 84401Phone: 801-625-5388FAX: 801-625-5723World Wide Web: http://www.fs.fed.us/rm/ogdenCibola National Forest
Supervisor’s Office2113 Osuna Road NE, Suite AAlbuquerque, New Mexico 87113(505) 346-3900, FAX 346-3901
Selected data for this Forest are part of a national database that housesinformation for much of the forest land in the United States. This databasecan be accessed on the Internet at the following web site:
http://ncrs2.fs.fed.us/4801/fiadb/index.htm

14
The Rocky Mountain Research Station develops scientific information and technology to improve management, protection,and use of the forests and rangelands. Research is designed to meet the needs of National Forest managers, Federal and Stateagencies, public and private organizations, academic institutions, industry, and individuals.
Studies accelerate solutions to problems involving ecosystems, range, forests, water, recreation, fire, resource inventory,land reclamation, community sustainability, forest engineering technology, multiple use economics, wildlife and fish habitat,and forest insects and diseases. Studies are conducted cooperatively, and applications may be found worldwide.
The U.S. Department of Agriculture (USDA) prohibits discrimination in all its programs and activities on the basis of race,color, national origin, sex, religion, age, disability, political beliefs, sexual orientation, or marital or family status. (Not allprohibited bases apply to all programs.) Persons with disabilities who require alternative means for communication of programinformation (Braille, large print, audiotape, etc.) should contact USDA’s TARGET Center at (202) 720-2600 (voice and TDD).
To file a complaint of discrimination, write USDA, Director, Office of Civil Rights, Room 326-W, Whitten Building, 1400Independence Avenue, SW, Washington, DC 20250-9410 or call (202) 720-5964 (voice or TDD). USDA is an equal opportunityprovider and employer.