Embed Size (px)
Citation preview
Forest Reference Emission
Level (FREL) of Myanmar
Ministry of Natural Resources and Environmental Conservation
Myanmar
January 2018
Table of Contents List of Tables .......................................................................................................................................... iii
List of Figures ......................................................................................................................................... iii
List of Annex ........................................................................................................................................... iii
Acronyms ................................................................................................................................................ v
Summary
1. Introduction .................................................................................................................................... 1
1.1. Objectives of FREL ................................................................................................................... 2
1.2. Summary of guidance considered for FREL development ..................................................... 3
2. National Context ............................................................................................................................. 5
2.1. National circumstances ........................................................................................................... 5
2.2. Myanmar’s Nationally Determined Contributions-(NDC) submission and relation to the FREL . 6
2.3. Forests in Myanmar ................................................................................................................ 7
2.4. Forest Land Use and Land Cover by Forestry Legislation ....................................................... 9
2.5. REDD+ development in Myanmar......................................................................................... 10
3. Definitions ..................................................................................................................................... 11
3.1. Forest definition .................................................................................................................... 11
3.2. Deforestation definition........................................................................................................ 12
3.3. Enhancement of forest carbon stocks through reforestation/afforestation activities ........ 12
4. Scale .............................................................................................................................................. 12
5. Scope (activities, pools, gases) ...................................................................................................... 13
5.1. REDD+ activities .................................................................................................................... 13
5.2. Pools and gases ..................................................................................................................... 14
6. Reference period of FREL .............................................................................................................. 15
7. Data used in the FREL ................................................................................................................... 15
7.1. Activity data .......................................................................................................................... 15
7.1.1. Rationale of sample-based approach: .............................................................................. 16
7.1.2. Sample design ................................................................................................................... 19
7.1.3. Response design ................................................................................................................ 21
7.1.4. Analysis design .................................................................................................................. 23
7.1.5. Estimation and uncertainty ............................................................................................... 24
7.1.6. Results ............................................................................................................................... 24
7.2. Emission factors .................................................................................................................... 27
7.2.1. Methodology for Emission Factor Calculation .................................................................. 32
7.2.2. Results ............................................................................................................................... 37

ii
8. Myanmar FREL .............................................................................................................................. 38
9. Uncertainty test ............................................................................................................................ 39
10. Future improvement opportunities ................................................................................................ 43
10.1. For Activity Data ...................................................................................................................... 43
10.2. For Emission Factors ............................................................................................................... 44
References: ........................................................................................................................................... 46
Annex .................................................................................................................................................... 49

iii
List of Tables
Table 2. 1: Area coverage of the major forest types and rainfall range .................................................. 8
Table 2. 2. : Major Land Categories Reported to CSO ........................................................................... 10
Table 7. 1: Validation datasets used to assess 1,884 samples ............................................................... 22
Table 7. 2: Structure of accuracy assessment matrix ............................................................................ 24
Table 7. 3: Confusion matrix for 2005-2015 forest change map based on 1,884 stratified random
samples ................................................................................................................................................. 25
Table 7. 4: Bias-corrected area estimates in hectare (ha) with confidence intervals (CI), weighted
producer’s accuracy and user’s accuracy under forest and non-forest cover classes for the years 2005
and 2015. .............................................................................................................................................. 26
Table 7. 5: Bias-corrected area estimates in hectare (ha) with confidence intervals (CI), weighted
producer’s accuracy and user’s accuracy for three land cover classes during 2005-2015. ................... 26
Table 7. 6: Sample Plot Design for 40 Districts used in Emission Factor Calculation ............................. 29
Table 7. 7: Per Ha Prorated Value for four different plot designs ......................................................... 34
Table 7. 8: AGB Value in CO2 eq ton per ha per plot design for each district ........................................ 34
Table 7. 9: Description on the forest types and respective value of R (Ratio of BGB to AGB) and litter
range ..................................................................................................................................................... 35
Table 7. 10: Results of the CO2 eq Mean Value ton per ha and weighted mean CO2 eq ton per ha ...... 37
Table 9. 1: Uncertainty Result for Activity Data in % ............................................................................. 40
Table 9. 2.Uncertainty Result for Emission Factor in %............................................................................52
List of Figures
Figure 7. 1: Steps followed to produce stratified random sample-based estimates of forest change
during 2005-2015 in Myanmar. ............................................................................................................. 18
Figure 7. 2: Distribution of the 1,884 samples across Myanmar. ......................................................... 19
Figure 7. 3: Decision tree for sample change analysis ........................................................................... 21
Figure 7. 4: Example of reference data (Google Earth Archive) ............................................................ 23
Figure 7. 5: Area estimates of forest cover change during 2005-2015, in million ha, from local land
cover maps and from stratified random sampling design. .................................................................... 27
Figure 7. 6: Location of Inventory plots data collected during 2005 to 2017 ........................................ 32
List of Annex
Annex 1: Datasets used to generate activity data for establishing a forest reference emission level in
Myanmar during 2005-2015 ................................................................................................................. 49
Annex 2: Harmonizing national land use categories with FRA and IPCC land use categories ................ 50
iv
Annex 3: Wall-to-wall thematic raster maps of Myanmar under seven national land use/cover
categories at three years: 2005, 2010 and 2015. .................................................................................. 51
Annex 4: A brief description of the simple and stratified random sampling estimators ....................... 52
Annex 5: Examples of sample assessment using validation datasets: ................................................... 55
Annex 6: Plot Designs and Description .................................................................................................. 58
Annex 7: Summary of information of afforestation/reforestation during reference period of 2005-
2015, as a benchmark for estimating GHG removals from the NRRPM (enhancement of forest carbon
stocks) ................................................................................................................................................... 60

v
Acronyms
AD Activity Data
AGB Above Ground Biomass
BGB Below Ground Biomass
BUR Biennial Update Report
CH4 Methane
CI Confidence Interval
CO Carbon Monoxide
CO2 eq Carbon Dioxide Equivalent
CSO Central Statistical Organization
DBH Diameter at Breast Height
ECD Environmental Conservation Department, Ministry of Natural Resources and
Environmental Conservation (MONREC)
EF Emission Factor
EIA Environmental Impact Assessment
FAO Food and Agriculture Organization of the United Nations
FD Forest Department, Ministry of Natural Resources and Environmental
Conservation (MONREC)
FRA Forest Resource Assessment
FREL/ FRL Forest Reference Emission Level/ Forest Reference Level
GDP Gross Domestic Product
GFC Global Forest Change
GFOI Global Forest Observations Initiative
Gg Gigagram
GHGs Green House Gases
GIS Geographic Information System
GOFC-GOLD Global Observation of Forest and Land cover Dynamics
GPG Good Practice Guidance
Ha hectare
INDC Intended Nationally Determined Contribution
IPCC Intergovernmental Panel on Climate Change
IRS Indian Remote Sensing Satellites
LUKE Natural Resources Institute Finland
LULUCF Land Use, Land Use Change and Forestry
MCCSAP National Climate Change Strategy and Action Plan
vi
MGD Methods Guidance Document
mm/year millimeter per year
MOALI Ministry of Agriculture, Livestock and Irrigation
MRV Measuring, Reporting and Verification
N2O Nitrous Oxide
NAPA National Adaptation Programme of Actions
NDC Nationally Determined Contribution
NFI/ NFMIS National Forest Inventory/ National Forest Monitoring Information System
NFMS National Forest Monitoring System
NO2 Nitrogen Dioxide
NRRPM National Reforestation and Rehabilitation Programme in Myanmar
PaMs Policy and Measures
PAS Protected Area System
PFE Permanent Forest Estate (RF + PPF)
PPF Protected Public Forest
REDD+ Reducing Emissions from Deforestation and Forest Degradation, and
Conservation, Sustainable Management of Forest and Enhancement of Forest
Carbon Stocks
RF Reserved Forest
RS Remote Sensing
SBSTA Subsidiary Body for Scientific and Technological Advice
SE Standard Error of Sample Mean
SEPAL System for Earth Observation Data Access, Processing and Analysis for Land
Monitoring
SIS Safeguard Information System
SNC Second National Communication
STRS Stratified Random Sample
TA Technical Assessment
TWGs Technical Working Groups (Drivers and Strategy TWG, Stakeholder Engagement
and Safeguard TWG and MRV TWG)
UNFCCC United Nations Framework Convention on Climate Change
UN-REDD United Nations Programme on Reducing Emissions from Deforestation and Forest
Degradation, and Conservation, Sustainable Management of Forest and
Enhancement of Forest Carbon Stock
Summary
The Government of Myanmar is fully aware of the causes and potential impacts of
climate change. Myanmar actively participated in global climate change mitigation
efforts as a non-Annex 1 party. Nationally Determined Contribution (NDC) was
submitted in 2016. Under the NDC, forestry is a key sector and quantitative targets are
likely to be included. Myanmar’s Initial National Communication (INC) was submitted
to UNFCCC in 2012 and the Second National Communication (SNC) is now under
preparation. Currently, Myanmar views REDD+ initiatives as a contribution to the
green development of Myanmar as well as supporting the mitigation of, and
adaptation to, climate change. In addition, the Government of Myanmar stressed that
the national REDD+ Programme is critical to their mitigation and adaptation pledges
according to its country statement to COP 23.
Following the suggestion of Decision 12/CP.17, Myanmar prepared its FREL using a
stepwise approach. This initial FREL submission will be a benchmark for assessing its
performance in implementing REDD+ activities in contribution to climate change
mitigation. The main objective of the FREL submission is to support the climate change
mitigation efforts under the national context of Myanmar. Further objectives of the
submission are;
- To assess and evaluate the performance of REDD+ policies and measures and
sustainable forest management practices
- To provide information on emission projections to stakeholders including policy
makers, government line departments, technicians and members of the public
on a clear, transparent and consistent basis.
- To facilitate access to potential funding sources for results-based payments and
to support efforts to reduce emissions from the forest and land use sector.
The development of the FREL was initiated by a group of experts; TWG on Measuring
Reporting and Verification (MRV), representing a cross-section of ministerial agencies

and organizations. This submission is largely due to the effort and commitment of the
members of this TWG.
Myanmar FREL is national level as all the existing land and forest monitoring and
measurement capacities are at the national level. Initially, Myanmar prioritized two of
the five REDD+ activities as the focus of the country’s first FREL/FRL submission;
deforestation and enhancement of forest carbon stock through
afforestation/reforestation. In particular, the Government of Myanmar aims to
include data on enhancement of forest carbon stocks, in recognition of the potential
importance of plantation and forest restoration measures to climate change
mitigation efforts. Work on improvement of data on historical forest enhancement is
currently ongoing, and once incorporated into the calculations within this document,
either during the Technical Assessment (TA) process, or as part of a revised
submission, will convert the FREL to a FRL. At the time of this submission, therefore,
the scope of the FREL is limited to deforestation only.
Three carbon pools of Above Ground Biomass (AGB), Below Ground Biomass (BGB)
and Litter are included in this FREL, using allometric equations derived from district
forest management and according to IPCC Good Practice Guidance. This submission
omitted soil and deadwood carbon pools due to limited information/data at national
level. Strategies are currently being developed to facilitate the inclusion of these two
pools in forthcoming submissions. Myanmar submitted only CO2 gas in this initial FREL
although there are also non- CO2 emissions from LULUCF.
Through a series of consultation meetings, the proposed reference period was
identified as the period from 2005 to 2015, due to the availability of the most reliable
national existing Activity Data (AD) and Emission Factors (EF) for this period.
Consistency with GHGs Inventory reporting was also considered for this submission.
Data generated in this FREL development process will benefit the SNC and the Biennial
Update Report (BUR) to the UNFCCC.
AD have been developed by estimating the extent of forest change measured as gross
area estimates of forest, non-forest and deforestation during 2005-2015, excluding

forest degradation, forest improvement and forest area gain. The amount of
deforestation (forest loss) has been estimated using a sample based approach.
Following the IPCC (2003, 2006) guidelines and the GFOI (2016) methods guidance
documents, the bias-corrected area estimates with confidence intervals were
calculated. The bias-corrected forest loss is about 387,527 ha per year over the period
2005-2015.
This submission applied data generated from 11,284 inventory plots of district level
forest inventory that were collected during 2005 to 2017. A combination of Tier 1 and
2 approaches were used in estimating these carbon pools using the management
inventory of 40 districts. Weighted mean values of tCO2 eq per ha through the
calculation based on 40 districts forest inventory result in a national EF of 125.43 tCO2
eq per ha. Annual CO2 emission from deforestation during the historical reference
period 2005-2015 is estimated as 48,607,511 tons per year.
This submission follows the IPCC Good Practice Guidance and Uncertainty
Management of National Greenhouse Gas Inventories. The uncertainty only includes
sampling error through the propagation of errors and not allometric equation errors.
The % uncertainty of AD, i.e. Forest loss area is 9.89 % for this submission whereas the
% uncertainty of 40 district forest inventory and resulting overall % is 12.10 for this
submission.
In conclusion, Specific activities which are either planned or ongoing for improvement
of AD and EF, especially strengthening of the national forest monitoring and
information system and in order to provide more qualified data and information for
future FREL/FRL submissions, are also mentioned in this submission.
1
Forest Reference Emission Level (FREL) of Myanmar
1. Introduction
The Government of Myanmar is fully aware of the causes and potential impacts of
climate change. Myanmar actively participated in global climate change mitigation
efforts by ratification of the United Nations Framework Convention on Climate Change
(UNFCCC) in 1994 and the Kyoto Protocol in 2003 as a non-Annex 1 party. Currently,
Myanmar views REDD+ initiatives as a contribution to the green development of
Myanmar as well as supporting the mitigation of, and adaptation to, climate change.
Myanmar became a partner country of the UN-REDD Programme in December 2011
and has quickly taken steps to start implementing REDD+ Readiness activities.
Regarding Decision 1/CP.16, paragraph 71(b) of the 16th Conference of Parties to the
UNFCCC (COP 16) in Cancun, 2010, a Forest Reference Emission Level and/or Forest
Reference Level (FREL/FRL) is one of the four key elements to be developed to
participate in REDD+ and its submission is on a voluntary basis.
Myanmar submitted its Intended Nationally Determined Contribution (INDC) in 2015
as a contribution to global climate change mitigation and adaptation efforts. It was
confirmed as the country’s first Nationally Determined Contribution (NDC) after
ratification of the Paris agreement in 2016. Under the NDC, forestry is a key sector and
quantitative targets are likely to be included. Furthermore, in their statement to COP
23 in 2017, the Government of Myanmar stressed that the national REDD+ Programme
is critical to their mitigation and adaptation pledges. Myanmar’s Initial National
Communication (INC) was submitted to UNFCCC in 2012 and the Second National
Communication (SNC) is now under preparation.
Following the suggestion of Decision 12/CP.17, Myanmar prepared its FREL using a
stepwise approach. Myanmar prepared this initial FREL submission as a benchmark for
assessing its performance in implementing REDD+ activities in contribution to climate
change mitigation. The proposed FREL in this submission is entirely based on historical
data which Myanmar considers to be transparent. Nonetheless, the choice of using

2
average historical emissions as its benchmark was made after consideration of the
national circumstances and expected future development plans. This submission will
also be consistent with anthropogenic forest-related greenhouse gas emissions as
contained in the country’s GHGs inventories of the SNC. This submission covers all
natural forests, covering approximately 52% of the total country land area in 2005. The
scope of this FREL submission covers one REDD+ activity (reduced deforestation),
three carbon pools (AGB, BGB and litter), and CO2 only, with the final FREL calculation
expressed in tons of carbon dioxide equivalent per year (tCO2 eq). Since the
submission covers only emissions of Greenhouse Gases (GHGs), not removals, it is
considered a Forest Reference Emission Level (FREL), rather than a Forest Reference
Level (FRL), and is referred to as such throughout this document. Myanmar intends to
expand the scope of the FREL as more extensive and better quality data become
available.
In particular, the Government of Myanmar aims to include data on enhancement of
forest carbon stocks, in recognition of the potential importance of plantation and
forest restoration measures to climate change mitigation efforts. Work on
improvement of data on historical forest enhancement is currently ongoing, and once
incorporated into the calculations within this document, either during the Technical
Assessment (TA) process, or as part of a revised submission, will convert the FREL to a
FRL.
1.1. Objectives of FREL
The main objective of the FREL submission is to support the climate change mitigation
efforts under the national context of Myanmar. The national REDD+ Programme is
critical to the mitigation and adaptation pledges according to the Myanmar Country
Statement submitted to COP 23. Further objectives of the submission are;
- To assess and evaluate the performance of REDD+ policies and measures and
sustainable forest management practices

3
- To provide information on emission projections to stakeholders including policy
makers, government line departments, technicians and members of the public
on a clear, transparent and consistent basis.
- To facilitate access to potential funding sources for results-based payments and
to support efforts to reduce emissions from the forest and land use sector.
This is also one of the key technical reports to support the efforts of multiple
stakeholders to achieve the goal of reducing deforestation. With the submission of this
initial FREL, the country team wishes to interact with the UNFCCC through a technical
assessment to improve the current document and technical approaches. This
submission will also provide information to facilitate effective implementation of
forest management plans in order to contribute to climate change mitigation targets.
1.2. Summary of guidance considered for FREL development
The following four major decisions at the level of the UNFCCC are related to the
development of FREL/FRLs and were considered during the process of developing
Myanmar´s FREL:
Decision 4/CP.15 in Copenhagen recognizes that developing countries in
establishing FREL/FRLs should do so transparently considering historic data, and
adjust for national circumstances;
Decision 1/CP.16, paragraph 71(b) of Cancun includes FREL/FRLs as one of the four
key elements to be developed for REDD+;
Decision 12/CP.17 Durban provides guidance for modalities of development of
FREL/FRLs, as follows;
o Express FREL/FRLs in tons of carbon dioxide equivalent (tCO2 eq) per year, in
order to serve as benchmarks for assessing the country’s performance in
implementing REDD+ policies and measures
o Maintain consistency with anthropogenic forest-related greenhouse gas
emissions by sources and removals by sinks as contained in the country’s GHG
inventories

4
o Follow a step-wise approach to national FREL/FRL development, enabling
Parties to improve FREL/FRLs by incorporating better data, improved
methodologies and, where appropriate, additional pools,
o Sub-national FREL/FRLs may be elaborated as an interim measure, while
transitioning to a national FREL/FRL, and
o Update FREL/FRLs periodically as appropriate, considering new knowledge,
new trends and any modification of scope and methodologies
Decision 13/CP.19 Warsaw provides guidelines on procedures for the Technical
Assessment (TA) of submissions of FREL/FRLs, including:
o Each FREL/FRL submission shall be subject to a technical assessment
o Submission is on a voluntary basis
o Technical assessment is possible also in the context of results-based payments
o A synthesis report on the TA process is prepared by the Secretariat, for
consideration by SBSTA after the first year of technical assessments
o Countries are invited to nominate experts to the roster for TA as well as to
support capacity-building efforts in relation to the development and
assessment of FREL/FRLs
The UNFCCC decisions considered at the country level in Myanmar can then be
summarized as follow:
A transparent process in developing the FREL was applied
The FREL is based on historical data
The FREL is consistent with the upcoming GHG inventory under development
for the Second National Communication (coordinated by ECD),
The FREL has been developed with a stepwise approach in mind as well as the
present measuring capacities in country (which are expected to improve over
the coming years). In particular, within the short term, it is expected that the
scope of the FREL will be extended to include enhancement of forest carbon
stocks.

5
2. National Context
2.1. National circumstances
The Republic of the Union of Myanmar is a largely rural country, with 70% of its total
population of 51.5 million people living in rural areas. In Myanmar, there are around
135 different ethnic groups with 100 different languages. The rural population still
relies primarily on biomass for energy purposes, as only 30% of the total population
has access to electricity (Population Census, 2014). The rate of population growth is
0.8% per year with an increase of 2.5% in urban areas and a decrease of 0.1% in rural
areas. The agricultural sector is still a major contributor to the country’s economy,
accounting for roughly 30%1 of Gross Domestic Product (GDP).
Myanmar is in a process of economic and political reform with the overall goal of
becoming a modern, developed and democratic nation by 2030. The political reform
process is accompanied by a structural reform process of the economic sector with
strong and increasing foreign direct investment. However, significant challenges still
exist with wide socio-economic gaps and sub-national inequalities in poverty and other
human development indicators. In particular, geographically remote areas (e.g. Chin
and Rakhine states) are suffering from low levels of infrastructure and lack of basic
social services (especially health and education) and job opportunities.
Additionally, inequalities between women and men are particularly significant in the
country. Women, especially from forest-dependent communities, participate
unequally in socio-political and decision‐making processes, due in significant part to
an inferior status in a religious context and the institutionalization of the view within
society that gender inequality is not a problem. Policies and strategies are in the
process of being reviewed and updated for all sectors of the country in order to
support gender inclusiveness in the overall comprehensive national development plan
and the fulfilment of sector specific gender-related targets and goals.
1 http://www.csostat.gov.mm/

6
Current economic development is concentrated on the regions of the country which
are particularly exposed to climate hazards such as cyclones, heavy rain, flooding,
drought or erratic rainfall (e.g. the regions of Ayeyarwady, Bago, Mon, Rakhine and
the Central Dry Zone in general). Negative impacts on agriculture, fisheries, livestock
or forestry will be especially felt by the poor and smallholder farmers which constitute
the great majority of all farmers in the country. Those regions are also the ones with
the highest rates of deforestation over the last 10 – 15 years. The economic and social
circumstances in Myanmar as well as the cultural and ethnic diversity make climate
change mitigation (including REDD+) challenging and all the proposed policies and
measures need to be thoroughly screened for potential negative impacts on people’s
livelihoods.
2.2. Myanmar’s Nationally Determined Contributions-(NDC) submission and
relation to the FREL
The 2016 NDC document of Myanmar formulates several actions relevant for climate
change mitigation. The main mitigation actions concerning forest and land use are as
follows:
Fulfilment of the national Permanent Forest Estate (PFE) target by 2030 with
an increase of Reserve Forests (RF) and Protected Public Forests (PPF) to 30%
of the national land area and the Protected Area System (PAS) to 10% of the
national land area.
Energy efficient cook stoves in order to reduce fuel wood for energy purposes,
especially for the Dry Zone of Myanmar. The target is to distribute 260,000 new
cook stoves between 2016 and 2030.
Based on the 2012 National Adaptation Programme of Actions (NAPA), adaptation
actions are described in the NDC for different levels of priority and sectors. Forest
preservation measures, together with resilience in the agricultural sector and early
warning systems, are among the first priorities. In addition, several strategies and
policies are in process of development, or already being implemented, in order to

7
support the achievement of targets such as those in the National Climate Change
Strategy and Action Plan (MCCSAP); Green Economy Strategic Framework; National
Environmental Policy, Framework and Master Plan; Environmental Conservation law;
Environmental Impact Assessments (EIAs), and state of Environment reports etc.
According to the MCCSAP, the action area of “environment and natural resources”
includes REDD+ and LULUCF. For REDD+ specifically (and linked to the overall MCCSAP
goal) the following REDD+ goal is envisioned:
“The Land Use and Forestry Sector contributes to an overall low-carbon development
pathway of the Nation through reducing deforestation and forest degradation and
the related GHG emissions while enhancing the livelihood of forest dependent people
and communities as well as ensuring inclusive sustainable growth and development
of the country as a whole”.
For the policy area of Forest Management, the implementation of the National
Forestry Master Plan (2001-2030) is mentioned as well as the national Biodiversity
Strategy and Action Plan of 2015-2020.
The NDC does not lay out quantitative targets for emission reductions. Its mitigation
section focuses on forestry by maintaining Myanmar’s carbon-sink status. An update
of the NDC, using more concrete, quantifiable data, is currently in process.
2.3. Forests in Myanmar
Myanmar forests are diverse and varied in composition and structure, and constitute
a valuable ecosystem due to their wide extent (between latitudes 958' - 28 29' N and
longitudes 92 10' - 101 10' E), varied topography and different climatic conditions. The
forests are distributed over three main climatically distinct regions (Tropical,
Subtropical and Temperate). The Forest Department of Myanmar recognized and
adopted eight dominant forest types, (Burmese Forester, June 1956, Departmental
Instructions for Forest Officers in Burma, Annex VIII, pages 214 – 217) as described in
Table 2.1.

8
Table 2. 1: Area coverage of the major forest types and rainfall range
Forest types Typical rainfall (mm/year)*
% of total forest area
I. Tidal/ Mangrove Forests II. Beach and dune forests III. Swamp forests
>3,500 4
IV. Hill and temperate evergreen forest
a. Hill evergreen forests b. Dry hill forests c. Pine forests
>3,000 26
V. Evergreen forest a. Riverine evergreen forests b. Giant evergreen forests c. Typical evergreen forests
2,500-4,000 16
VI. Mixed deciduous forest a. Moist upper mixed deciduous
forests b. Dry upper mixed deciduous forests c. Lower mixed deciduous forests
1,250-2,500 39
VII. Deciduous Dipterocarp forest a. High indaing forests b. Semi-indaing forests c. Scrub indaing forest
900-1,250 5
VIII. Dry forest a. Than-dahat forests b. Thorn forests
< 900 10
Total 100
Source: Davis, 1960, Kermode, 1964, Kress et.al. 2003, Departmental Instruction of FD
There is no recent study that provides an update of national-level distribution and
extent of these different forest types in Myanmar. According to available information,
the most abundant forest types are the tropical Mixed Evergreen and Deciduous
forest, both containing upland and lowland subtypes. These forest types are well
known for the occurrence of teak and other valuable timber species that are subject
to commercial timber logging. The subtropical forests, which are scattered over slopes
and peaks of hill and mountain ranges, e.g., in Chin and Shan states, are traditionally
under the influence of shifting cultivation carried out by local communities for their

9
livelihood. In recent years, logging has been extended to lowland Evergreen Hardwood
forests (e.g. Tanintharyi region, Southern Myanmar) sometimes followed by
conversion to oil palm and rubber plantation on accessible or degraded stands (Rao et
al., 2013). The tropical dry forest types in Myanmar, concentrated in the Central Dry
Zone of the country, are also affected by human activity (e.g. conversion to agriculture,
firewood collection) as well as forest fires. Although the latter can cause serious soil
degradation, they are part of the natural dynamics in some open dry or savannah-like
forests where species occur which can benefit from burning (Ratnam et al., 2011).
Forests on wetlands, especially mangroves along the coastlines and freshwater swamp
forests in river deltas (e.g. Ayeyarwady) are threatened by agriculture and aquaculture
(e.g., shrimp farming), unsustainable collection of firewood or coastal development
activities (Stibig et al., 2007).
2.4. Forest Land Use and Land Cover by Forestry Legislation
Myanmar has a decentralized statistical system where the Central Statistical
Organization (CSO) and line ministries have responsibilities for data collection in their
respective domains. As a decentralized statistical system, statistical production
activities are scattered across the ministries and agencies. According to the Forest Law,
all forest areas and forest tree cover are subject to declaration as Permanent Forest
Estate (PFE) and administered by the Forest Department (FD) under MONREC. The FD
is responsible for protection and conservation of biodiversity and sustainable
management of the country’s forest resources through establishment of PFE. PFEs
include all forested areas on Land at the Disposal of the Government and constitutes
Reserved Forest (RF), Protected Public Forest (PPF) and the Protected Areas System
(PAS). RF and PPF are accorded similar legal status under the Forest Law. The status
of land as PF indicates administrative responsibility for FD but does not directly imply
any information regarding tree cover. Table 2.2 shows the major land categories
reported to CSO by % of total country area;

10
Table 2. 2. : Major Land Categories Reported to CSO
No Major Land Categories 2013-2014 2015-2016
1 Forest Land (RF, PPF, PAS) 27.64% 27.42%
2 Agriculture Land (6 sub categories) 18.08% 18.41%
3 Vacant Land/Virgin Land/ Cultivable
Waste Land (2 sub categories)
29.75% 29.54%
4 Other Land (13 sub categories) 24.53% 24.62%
2.5. REDD+ development in Myanmar
Myanmar is a signatory to the UNFCCC, having ratified the convention in November
1994 and signed the Kyoto protocol in 2003. The government of Myanmar together
with many key stakeholders is aware of the causes and potential impacts of climate
change and is striving to reduce its GHG emissions and contribute to climate change
mitigation. Myanmar became a partner of the UN-REDD Programme in December
2011. During 2012 and 2013, a REDD+ Readiness Roadmap was developed through a
national multi-stakeholder consultation process2. The process of implementing the
Roadmap is currently underway, in order to establish the national REDD+ design
elements according to the Warsaw framework for REDD+ (COP 19). A stakeholder
engagement process has been established and a safeguards roadmap has been
developed with the objectives of clarifying safeguards in the national context and
setting the ground for a future Safeguard Information System (SIS). REDD+ strategy
development began in 2016 with a comprehensive driver analysis and a first draft of a
REDD+ strategy document was developed by the end of the first quarter of 2017
2 The proceedings of the workshops are available on the country page of Myanmar on the UN-REDD workspace (www.unredd.net)

11
through series of discussions with relevant Technical Working Groups3 and wider
stakeholder consultations. Sub-national consultations on the REDD+ strategy began in
the last quarter of 2017 and are expected to be completed in 2018. Action plans for a
National Forest Monitoring System (NFMS) and FREL/FRL were developed during 2015
and implementation is ongoing.
The development of the FREL was initiated by a group of experts representing a cross-
section of ministerial agencies and organizations. The TWG on Measuring Reporting
and Verification (MRV) provided technical guidance and direction on the
implementation of both the NFMS and FREL/FRL action plans. The MRV TWG provides
a forum to access national technical capacities and institutional arrangements within
Myanmar, for both NFMS and FREL/FRLs development for REDD+. This submission is
largely due to the effort and commitment of the members of this TWG.
3. Definitions
Definitions used for the FREL are also consistent with those used in relation to SNC and
NDC preparation, including as follows;
3.1. Forest definition
The definition of ‘forest’ in Myanmar follows that used for the FAO Forest Resource
Assessment (FRA): “Land spanning more than 0.5 hectares with trees higher than 5
meters and a canopy cover of more than 10 percent or trees able to reach these
thresholds in situ”. In addition to land cover, land use is also considered in identifying
areas that fall under this forest definition. Therefore it does not include land that is
predominantly under agricultural or urban land use. However, it also excludes
temporarily de-stocked land for which the long-term use remains forest. This
definition was also applied by FD, MONREC for satellite image classification in the
national forest resource assessment. In the context of this submission, ‘forest’ refers
3 There are three Technical Working Groups for REDD+ in Myanmar, which are (1) Stakeholder Engagement and Safeguard TWG, (2) Drivers and Strategy TWG and (3) Monitoring, Reporting and Verification TWG. Detail TORs are available through http://www.myanmar-redd.org/.
12
to all areas under forest cover which meet the above criteria, both under PFE and
outside PFE as mentioned in section 2.4.
3.2. Deforestation definition
Deforestation is defined as the conversion of forest land use into to non–forest land
use (i.e., 100% loss of AGB). This FREL submission takes into account the complete
conversion of forest land use to other land use during the period 2005-2015, not
including land that was temporarily de-stocked (and subsequently restocked) during
this period.
3.3. Enhancement of forest carbon stocks through reforestation/afforestation
activities
Enhancement of forest carbon stocks through reforestation/afforestation is defined
as the development of new carbon pools resulting from the change of non-forest
land use to forest land use. This submission does not include enhancement due to
reforestation/afforestation activities due to insufficient data, but work is ongoing to
include this as soon as possible. Enhancement of forest carbon stocks may also occur
in forest land remaining as forest land. This submission excludes this latter aspect of
enhancement due to data limitation, but will be included at a later date.
4. Scale
In accordance with the draft REDD+ strategy, Myanmar FREL is national level. A
national scale FREL is appropriate as all the existing land and forest monitoring and
measurement capacities are at the national level and there is currently limited capacity
at the sub-national level.
13
5. Scope (activities, pools, gases)
5.1. REDD+ activities
Myanmar prioritized two of the five REDD+ activities as the focus of the country’s first
FREL/FRL submission; deforestation and enhancement of forest carbon stock through
afforestation/reforestation, for FREL/FRL calculation due to the following reasons;
- Deforestation is estimated to be the main contribution to the total emissions
from the land use, land use change and forestry (LULUCF) sector in Myanmar;
- To measure the impact and effectiveness of the existing National Reforestation
and Rehabilitation Programme in Myanmar (NRRPM)
In common with many other developing countries, Myanmar experiences both
deforestation and forest degradation due to various anthropogenic effects. The
measurement of deforestation, however, is possible using data and methodologies
currently available at the national level, whereas considerable further work is required
before the change of carbon stocks in forest remaining as forest can be measured with
confidence. Moreover, it is currently estimated that the impact of deforestation, in
recent years, has had more of an impact on forest carbon stocks than forest
degradation. The definition of forest degradation, and methodologies to assess and
measure it, are currently under discussion and will be included in future submissions.
The definition of conservation of forest carbon stocks and sustainable management of
forests, in the context of REDD+, will also be further considered, but at present it is
assumed that the impact of these two REDD+ activities will be captured by
measurement of deforestation and forest degradation.
The NRRPM was initiated in 2017 and is intended to continue to 2026-2027. The
NRRPM has been accorded priority in national forest sector policy in recognition of the
fact that the provision of forest products and services from natural forests is
insufficient to meet demand. Under the NRRPM, establishment of new plantations in
degraded forest areas and restoration of natural forests by silvicultural practices are
being conducted through systematic planning, implementation and monitoring.

14
Enhancement of forest carbon stocks was therefore prioritized as the second activity
in the FREL/FRL submission for Myanmar, initially with a focus on
afforestation/reforestation.
The data used and the methodology employed to develop this initial submission was
sufficient to measure deforestation, due to the substantial areas affected during the
reference period of 2005-2015. However, they were insufficient to measure
enhancement from afforestation/reforestation during this period, due to the much
smaller areas affected. At the time of this submission, therefore, the scope of the FREL
is limited to deforestation only, but work is ongoing to improve data so that
enhancement from afforestation/reforestation can be added.
5.2. Pools and gases
Three carbon pools of Above Ground Biomass (AGB), Below Ground Biomass (BGB)
and Litter are included in this FREL, using allometric equations derived from district
forest management and according to IPCC Good Practice Guidance. This submission
omitted soil and deadwood carbon pools due to limited information/data at national
level. Strategies are currently being developed to facilitate the inclusion of these two
pools in forthcoming submissions. Several site-specific studies on soil carbon content
have been carried out in the past, though these have not yet been correlated with land
cover classes at national scale. Approaches to include soil carbon in future FREL/FRLs
will initially focus on expert analysis of these past studies. Dead wood is also omitted
due to a lack of country specific data. IPCC (2006) also does not provide default values
for dead organic matter stocks, particularly dead wood, due to the fact that these are
highly variable and site-specific, depending on forest type and age, disturbance history
and management. In addition, data on coarse woody debris decomposition rates are
scarce and thus, IPCC explains, it was deemed that globally applicable default factors
and uncertainty estimates cannot be developed (IPCC 2006, Volume 4 Chapter 2.2.1).
Myanmar submitted only CO2 gas in this initial FREL although there are also non- CO2
emissions from LULUCF. Myanmar’s INC report included non- CO2 gases from biomass

15
burned due to land clearing and forest fire. These non-CO2 gases included CH4, N2O
and NO2 and the total combined emissions were 637 Gg4 while that of CO2 was 102,264
Gg. Based on the data in the INC, therefore, this submission considers the contribution
of non-CO2 gases to be insignificant.
6. Reference period of FREL
Through a series of consultation meetings, the proposed reference period was
identified as the period from 2005 to 2015, due to the availability of the most reliable
national existing Activity Data (AD) and Emission Factors (EF) for this period.
Consistency with GHGs Inventory reporting was also considered for this submission.
Currently the SNC is being prepared based on 2010 data sets by using IPCC GPG 2003
and 2006 in order to ensure consistency with the development of AD and EF for the
FREL.
Although the reference period does not overlap with the INC, which used data from
the year 2000, The INC used EF based on IPCC global default factors and AD based on
the projected data from the FRA. This FREL used AD based on real time estimation and
EF from district management inventory. The emission factors are therefore considered
as national specific data and more detailed compared to the previous GHGs
inventories. Data generated in this FREL development process will benefit the SNC and
the Biennial Update Report (BUR) to the UNFCCC.
7. Data used in the FREL
7.1. Activity data
According to the revised IPCC Guidelines for National Greenhouse Gas Inventories,
Activity Data (AD) are defined as data on the magnitude of human activity resulting in
emissions or removals taking place during a given period of time. The emissions
include human activities resulting from deforestation and from forest degradation
while the removals include forest gain or enhancement of canopy cover. In this report
4 1 Gg = 1000 ton

16
the AD have been developed by estimating the extent of forest change measured as
area estimates of forest, non-forest and deforestation during 2005-2015, excluding
forest degradation, forest improvement and forest area gain. The amount of
deforestation (forest loss) has been estimated using a sample based approach. The
data sets used to generate activity data are listed in Annex 1.
7.1.1. Rationale of sample-based approach:
Wall-to-wall maps for the years 2005, 2010 and 2015 have been prepared by the
Remote Sensing and GIS (RSGIS) unit of Myanmar Forest Department (see Annex 1).
These wall-to-wall maps were pixel-based and are produced through supervised
maximum-likelihood classifiers using imagery from Landsat (30 m), for the years 2005
and 2015, and using imagery from IRS (23.5 m) for the year 2010. The eleven national
land use/cover categories are compatible with IPCC land use/cover classes and FAO-
FRA classes (Annex 2).
The post-classification change detection method could be a suitable option to
estimate changes within and across different land cover types (IPCC, 2006). In this
method, the AD for each mapping year could be derived using estimates from each
map on various land-cover classes, as sum of areas of map units assigned to map
classes are characterized as pixel counting.
The three wall-to-wall maps (Annex 3) were produced by different people in the RS &
GIS unit without defining standard operating procedures which could be followed to
maintain quality control or reproduced in the context of a long-term forest monitoring
system. Moreover, the mapping datasets (satellite imagery) used to produce maps
were not from the same reference year. For example, the year 2005 map had been
produced from Landsat imagery collected during 2004-2006.
Following a detailed evaluation, errors in the wall-to-wall maps were assumed to be
substantial because the maps have shown inconsistencies in geo-locations both within
individual maps and across three temporal maps. The causes of these inconsistencies
are uncertain and might be attributed to, for example, lack of consistent application

17
of mapping between time periods, inconsistencies in classification procedures, and
inconsistencies in map qualities (IPCC, 2006).
According to IPCC Good Practice Guidance (2003), AD should be neither over- nor
under-estimates (without bias or quantification of bias) and uncertainty should be
reduced as much as practically possible. The existing wall-to-wall maps, generally,
make no provision for accommodating the effects of map classification errors (Foddy,
2010). Moreover, the map accuracy assessment indices (error matrix) can inform
issues of systematic errors and precisions but they do not directly produce the
information necessary to construct confidence intervals. Therefore, the pixel-
counting-based wall-to-wall approach provides no assurance that estimates are
unbiased or that uncertainties are reduced (GFOI, 2016).
We therefore used a sample-based approach as an independent method to derive
estimates between 2005 and 2015 of forest, non-forest and areas of deforestation
only. Among various types of probability-based sampling design, stratified random
sample (STRS) design has been used. The STRS offers the option to increase the sample
size in change class and forest loss in a portion of the total area, and reduce the
standard errors of the class-specific accuracy estimates for rare classes such as
deforestation. In addition, STRS is one of the easier designs to implement and have
unbiased variance estimators (Olofsson et al., 2014).
It is necessary to identify a spatially-explicit forest change map for a given period by
using a combination of the multiple maps within the same period. The forest change
areas often occupy a small proportion of the landscape and assumptions of the STRS
design largely depend on accurate delineation of the change strata. Given the
limitations of the wall-to-wall maps, as described above, Global Forest Change (GFC)
maps5 (Hansen et al., 2013) were used to generate the strata map for the years 2005-
2015. The GFC maps were adjusted to the forest definition adopted by Myanmar; a
minimum of 5 m canopy height and a minimum tree canopy cover of 10% within a 0.5
ha area. The GFC maps are transparent and consistent and offer a complete
application of the independent sample-based approach. Figure 7.1 illustrates the steps
5 https://earthenginepartners.appspot.com/science-2013-global-forest

18
followed to generate stratified random sample-based estimates of forest change
between 2005 and 2015.
A tree cover map of 2000 and gross forest cover loss data from 2001 to 2015 were
used to produce forest change (loss) strata map from 2005 to 2015. A forest gain map
was not used in stratification because the gain map did not indicate the years of
change, which would be required to identify the amount of forest gain (enhancement)
between 2005 and 2015. Through the Stratified Area Estimator – Design tool within
FAO’s System for Earth Observation Data Access, Processing and Analysis for Land
Monitoring (SEPAL6), a total of 1,884 stratified random samples were generated using
the GFC-based strata map of 2005-2015.
The validation process followed recognized design considerations in which three
distinctive and integral phases are identified: sampling design, response design, and
analysis and estimation (Stehman and Czaplewski, 1998).
Figure 7. 1: Steps followed to produce stratified random sample-based estimates of forest
change during 2005-2015 in Myanmar.
6 https://sepal.io/
Step 1: Forest Change Map 2005-2015
Forest/NonForest Map 2005
Forest/NonForest map 2000 (≥10% canopy cover threshold from the treecover2000 map) + Gross forest cover loss event (loss year) 2001-2005 (Hansen et al., 2013)
Forest/NonForest Map 2015
Forest/NonForest map 2005 + Gross forest cover loss event 2006-2015 (Hansen et al., 2013)
Stratification: Forest change map 2005-2015
Stratified Forest Change Map 2005-2015: Three strata (Forest, NonForest, Loss) were generated from Forest/NonForest 2005 Map and Forest/NonForest 2015 Map
Step 2: Generate Samples
Generate stratified samples
The stratified forest change map 2005-2015
Sample size formula of Cochran (1977)
Sample generation: Sepal platform (http://sepal.io)
Sample survey design
using survey designed in Open Foris Collect

19
7.1.2. Sample design
The sampling design refers to the methods used to select the locations at which the
reference data are obtained, in this case, the methods through which the 1,884
samples were derived from the GFC-based strata map of 2005-2015 using SEPAL’s
Stratified Area Estimator – Design tool. By default, this tool allocates a minimum of 50
samples in the smallest stratum, following the Cochran (1977) formula (see Equation
1 below) (Olofsson et al., 2014), which in this case is the forest loss stratum. However,
a total of 300 samples, out of 1,884 samples, were generated for the forest loss
stratum with an aim to reduce standard error for the change user’s accuracy estimate.
Figure 7.2 shows the distribution of the samples across Myanmar.
Equation 1
𝑛 = (∑ 𝑊𝑖𝑆𝑖)2
[𝑆(�̂�)]2
+ (1𝑁) ∑ 𝑊𝑖𝑆𝑖
2≈ (
∑ 𝑊𝑖𝑆𝑖
𝑆(�̂�))
2
Where: 𝑁 = 𝑛𝑢𝑚𝑏𝑒𝑟 𝑜𝑓 𝑢𝑛𝑖𝑡𝑠 𝑖𝑛 𝑡ℎ𝑒 𝑟𝑒𝑔𝑖𝑜𝑛 𝑜𝑓 𝑖𝑛𝑡𝑒𝑟𝑒𝑠𝑡
𝑆(�̂�) 𝑖𝑠 𝑡ℎ𝑒 𝑠𝑡𝑎𝑛𝑑𝑎𝑟𝑑 𝑒𝑟𝑟𝑜𝑟 𝑜𝑓 𝑡ℎ𝑒 𝑒𝑠𝑡𝑖𝑚𝑎𝑡𝑒𝑠 𝑜𝑣𝑒𝑟 𝑎𝑙𝑙 𝑎𝑐𝑐𝑢𝑟𝑎𝑐𝑦 𝑡ℎ𝑎𝑡 𝑤𝑒 𝑤𝑜𝑢𝑙𝑑 𝑙𝑖𝑘𝑒 𝑡𝑜 𝑎𝑐ℎ𝑖𝑒𝑣𝑒,
𝑊𝑖 = 𝑚𝑎𝑝𝑝𝑒𝑑 𝑝𝑟𝑜𝑝𝑜𝑟𝑡𝑖𝑜𝑛 𝑜𝑓 𝑎𝑟𝑒𝑎 𝑜𝑓 𝑐𝑙𝑎𝑠𝑠 𝑖,
𝑆𝑖 = 𝑠𝑡𝑎𝑛𝑑𝑎𝑟𝑑 𝑑𝑒𝑣𝑖𝑎𝑡𝑖𝑜𝑛 𝑜𝑓 𝑠𝑡𝑟𝑎𝑡𝑢𝑚 𝑖, 𝑆𝑖 = √𝑈𝑖(1 − 𝑈𝑖)
Step 3: Sample Assessment
Sample assessment:
Using Collect Earth Tool in Open Foris Collect. Interpreters' check every sample for a Forest or NonForest cover, using available high-quality validation datasets in Google Earth, Bing Map and Google Earth Engine; accessible through Collect Earth.
Quality Control
Following a standard operating procedure, all interpreters were allocated 70 samples randomly selected which followed by consistance check.
All assessed samples were randomly rechecked for quality control through open discussuion for assurance of quality check.
Step 4: Straified Estimator Analysis
Prepare master sample assessment file
By combining all files from different interpreters following quality control
Stratified Estimator - Analysis: Using SEPAL platform (http://sepal.io)
Sample-based area estimates of three land cover classes: Forest, NonForest and Loss were generated from a stratified randon design sampling estimators and from a theoretical simple random design sampling estimators.

20
Figure 7. 2: Distribution of the 1,884 samples across Myanmar.
(a) Stratified forest change map 2005-15 (b) Stratified random sample
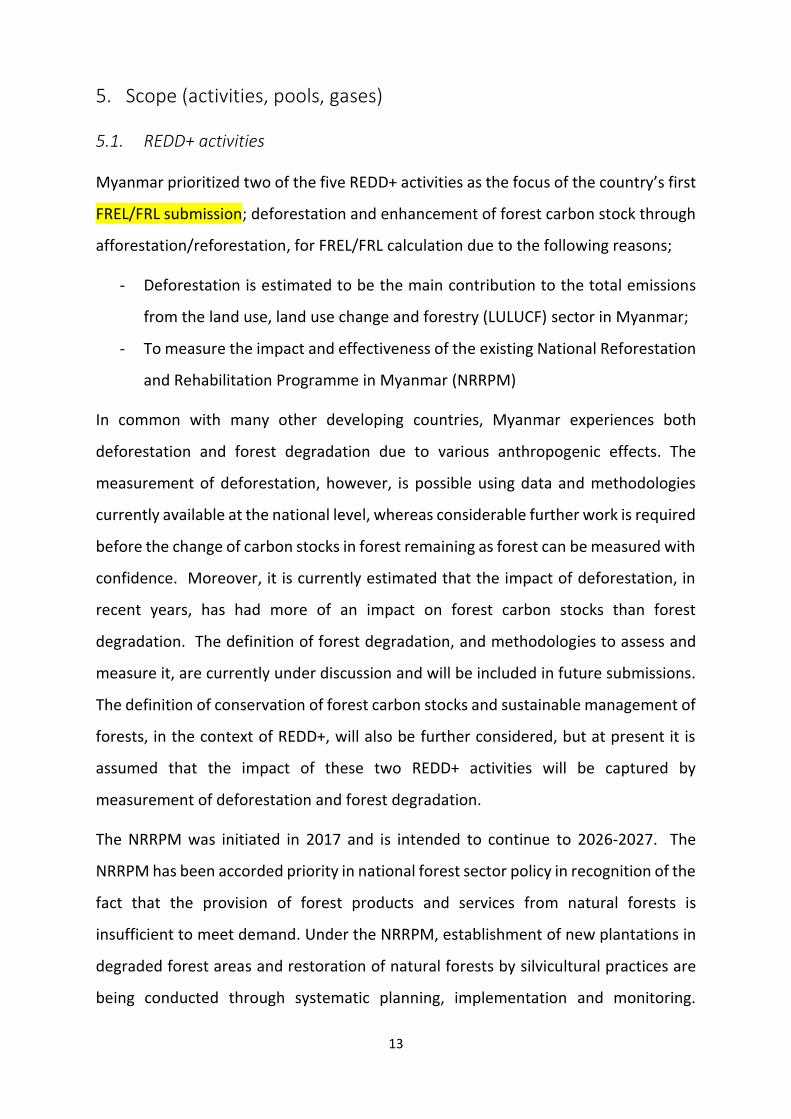
Figure 7.3 illustrates a change decision tree where the 2005 land cover is forest. There
will be equivalent decision trees for other scenarios e.g. rich forest to degraded forest,
and forest to non-forest land cover types. These statistics allow change in major land
cover categories to be reported and areas estimated.
21
Figure 7. 3: Decision tree for sample change analysis
7.1.3. Response design
The desired goal of this validation was to derive a statistically robust and quantitative
assessment of the uncertainties associated with the forest area change estimates.
Several factors potentially impact on the quality of forest mapping (GOFC-GOLD,
2015), namely:
The spatial, spectral and temporal resolution of the imagery
The radiometric and geometric pre-processing of the imagery
The automated and manual procedures used to interpret the forest map
category
Thematic standards (i.e. minimum mapping unit and land use definitions)
The availability of field reference data for evaluation of the results.
Approaches were used to minimize these sources of error following IPCC and GOFC-
GOLD good practice guidelines, as appropriate. However, the quality of reference data
and the sample selection for accuracy assessment of the change area were slightly
compromised by the restricted availability of high-spatial resolution archived imagery
in Google Earth and Bing Map across Myanmar.
Has the land cover changed between 2005 and 2015?
[YES] - Forest in 2005 but NonForest in 2015
[YES]- Loss of forest (deforestation)
[NO] - Stable condition in both years.
Was land cover forest in 2015?
[YES] - Stable forest[NO] - Stable
nonforest
22
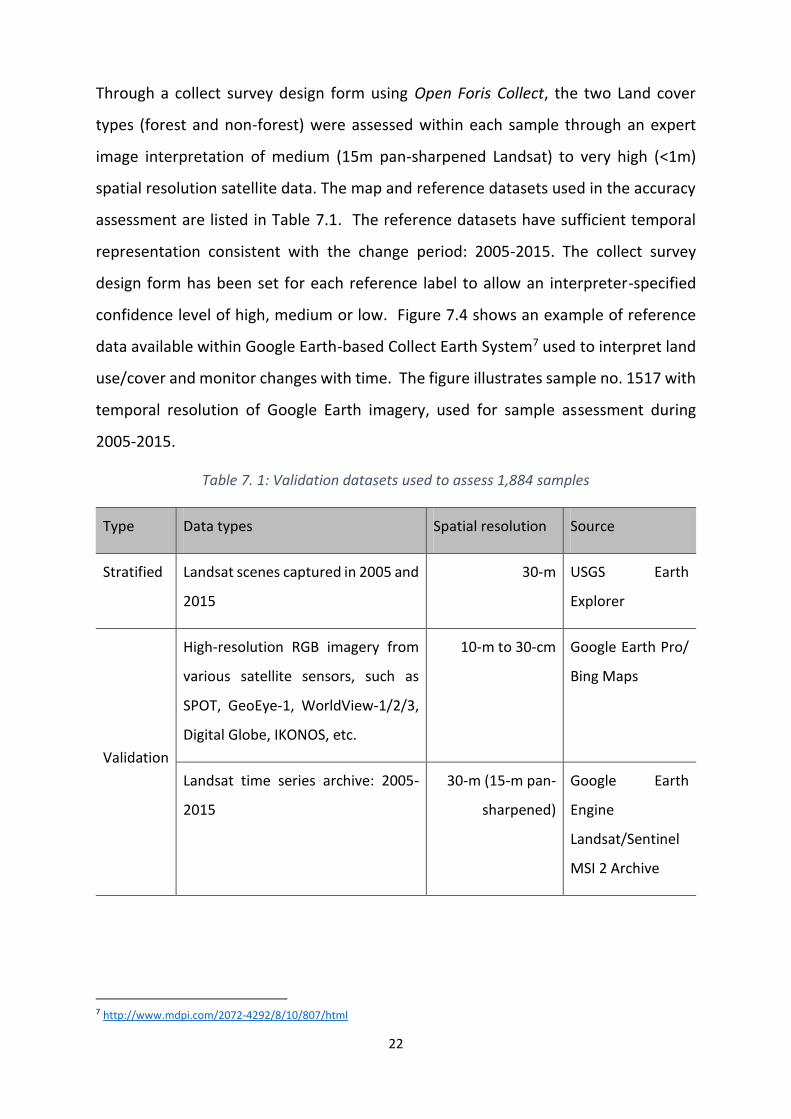
Through a collect survey design form using Open Foris Collect, the two Land cover
types (forest and non-forest) were assessed within each sample through an expert
image interpretation of medium (15m pan-sharpened Landsat) to very high (<1m)
spatial resolution satellite data. The map and reference datasets used in the accuracy
assessment are listed in Table 7.1. The reference datasets have sufficient temporal
representation consistent with the change period: 2005-2015. The collect survey
design form has been set for each reference label to allow an interpreter-specified
confidence level of high, medium or low. Figure 7.4 shows an example of reference
data available within Google Earth-based Collect Earth System7 used to interpret land
use/cover and monitor changes with time. The figure illustrates sample no. 1517 with
temporal resolution of Google Earth imagery, used for sample assessment during
2005-2015.
Table 7. 1: Validation datasets used to assess 1,884 samples
Type Data types Spatial resolution Source
Stratified Landsat scenes captured in 2005 and
2015
30-m USGS Earth
Explorer
Validation
High-resolution RGB imagery from
various satellite sensors, such as
SPOT, GeoEye-1, WorldView-1/2/3,
Digital Globe, IKONOS, etc.
10-m to 30-cm Google Earth Pro/
Bing Maps
Landsat time series archive: 2005-
2015
30-m (15-m pan-
sharpened)
Google Earth
Engine
Landsat/Sentinel
MSI 2 Archive
7 http://www.mdpi.com/2072-4292/8/10/807/html

23
Figure 7. 4: Example of reference data (Google Earth Archive)
2005 2015
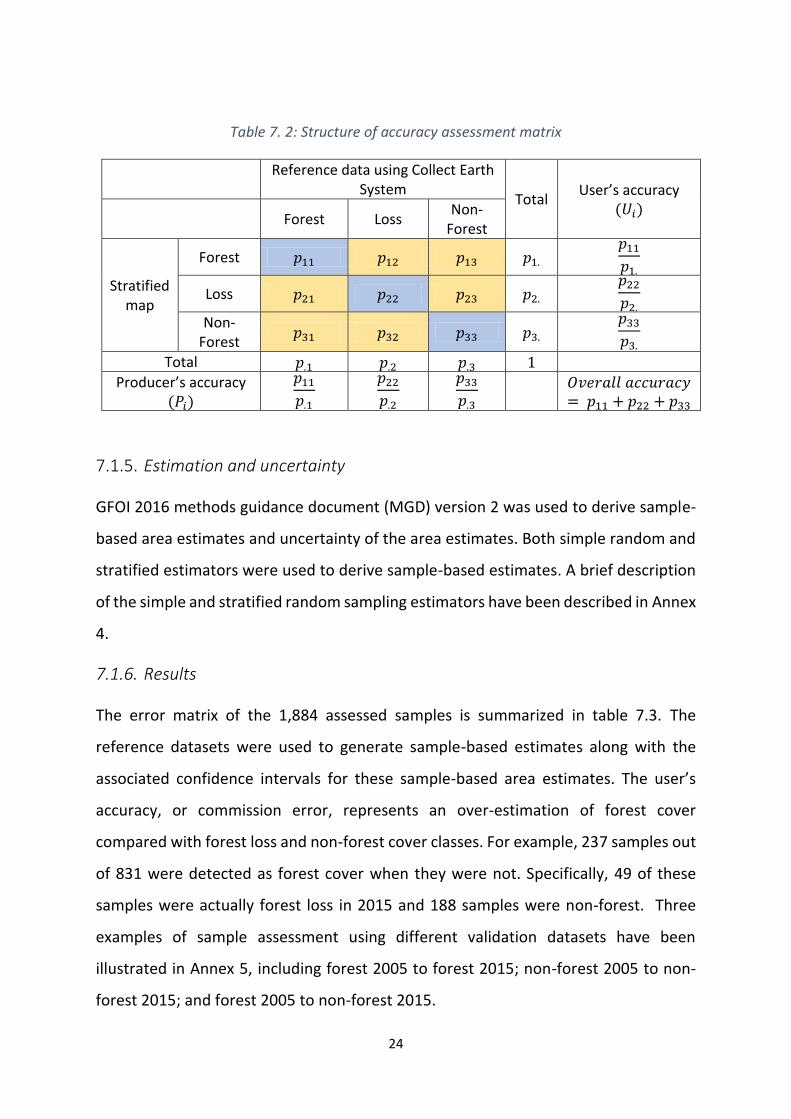
7.1.4. Analysis design
Table 7.2 shows the generic structure of error matrix that has been used to derive
sample-based area estimates. Grey coloured cells represent map areas that have been
validated as correct. Orange coloured cells, however, are either false positives or false
negatives. For example, cell 𝑝12 is false negative and cell 𝑝21 is false positive.
Interpretation of these data assumes that the reference data are error free and that
the sampling is unbiased and of sufficient size. Nevertheless, the confusion matrix
provides a simple and convenient method to illustrate the nature of any disagreement
between the stratified map and the reference data.
The accuracy of a class is expressed in two ways: user's and producer's accuracies. The
producer's accuracy provides a measure of accuracy of the classification scheme. The
producer’s accuracy is also known as the error of omission because areas that have
been incorrectly classified are “omitted” from the correct class. This accuracy indicates
how well the sample points falling on a given land cover type are classified, i.e., it is
the probability of how well the reference data fitted the map.
24
Table 7. 2: Structure of accuracy assessment matrix
Reference data using Collect Earth
System Total
User’s accuracy (𝑈𝑖)
Forest Loss Non-
Forest
Stratified map
Forest 𝑝11 𝑝12 𝑝13 𝑝1. 𝑝11
𝑝1.
Loss 𝑝21 𝑝22 𝑝23 𝑝2. 𝑝22
𝑝2.
Non-Forest
𝑝31 𝑝32 𝑝33 𝑝3. 𝑝33
𝑝3.
Total 𝑝.1 𝑝.2 𝑝.3 1
Producer’s accuracy (𝑃𝑖)
𝑝11
𝑝.1
𝑝22
𝑝.2
𝑝33
𝑝.3
𝑂𝑣𝑒𝑟𝑎𝑙𝑙 𝑎𝑐𝑐𝑢𝑟𝑎𝑐𝑦= 𝑝11 + 𝑝22 + 𝑝33
7.1.5. Estimation and uncertainty
GFOI 2016 methods guidance document (MGD) version 2 was used to derive sample-
based area estimates and uncertainty of the area estimates. Both simple random and
stratified estimators were used to derive sample-based estimates. A brief description
of the simple and stratified random sampling estimators have been described in Annex
4.
7.1.6. Results
The error matrix of the 1,884 assessed samples is summarized in table 7.3. The
reference datasets were used to generate sample-based estimates along with the
associated confidence intervals for these sample-based area estimates. The user’s
accuracy, or commission error, represents an over-estimation of forest cover
compared with forest loss and non-forest cover classes. For example, 237 samples out
of 831 were detected as forest cover when they were not. Specifically, 49 of these
samples were actually forest loss in 2015 and 188 samples were non-forest. Three
examples of sample assessment using different validation datasets have been
illustrated in Annex 5, including forest 2005 to forest 2015; non-forest 2005 to non-
forest 2015; and forest 2005 to non-forest 2015.

25
Table 7. 3: Confusion matrix for 2005-2015 forest change map based on 1,884 stratified
random samples
Reference data
Forest Loss Non-forest Total User's
accuracy
GFC Map (Modified)
Forest 0.32 0.03 0.25 0.44 0.71 Loss 0.09 0.03 0.04 0.16 0.21 Non-forest 0.16 0.02 0.22 0.40 0.55
Total 0.56 0.08 0.36 1
Producer's accuracy 0.56 0.42 0.62
0.57
Table 7.4 provides area estimates of bias-corrected forest and non-forest cover classes
for the years 2005 and 2015. Forest cover estimates reported to FRA (FA0, 2015) were
33.32 million ha in the year 2005 and 29.04 million ha in the year 2015, much lower
than sample-based forest cover estimates. Table 7.5 provides more detailed estimates
on various parameters from the sample-based assessment, considering the weighted
producer accuracy (proportional to the area per class) for forest, non-forest and loss.
This corresponds to the interpretation of the results from the perspective of the
reference data. In general, it indicates that the forest loss class has comparatively
lower producer’s accuracy in spatial detection of information. Therefore, the sample-
based estimates showed a much wider (20%) confidence interval in the forest loss class
compared to stable forest and stable non-forest classes. Apart from the usual
subjective differences between estimators, it is assumed that the uncertainty might
also be associated with misinterpretation of samples, lack of high spatial resolution
imagery for some samples, misinterpretation of some forest types with non-tree
vegetation cover, and seasonal variations.

26
Table 7. 4: Bias-corrected area estimates in hectare (ha) with confidence intervals (CI),
weighted producer’s accuracy and user’s accuracy under forest and non-forest cover classes
for the years 2005 and 2015.
Land cover classes
Accuracy GFC Map (modified) area
(ha)
Sample-based estimates
Producer’s Weighted Producer’s
User’s Area (ha) SE (ha) CI (ha) CI
(%)
Year 2005
Stable forest 0.62 0.56 0.55 44561156 44850934 694451 1361124 3.0
Non-forest 0.72 0.77 0.77 23096596 22806817 694451 1361124 6.0
Year 2015
Stable forest 0.56 0.73 0.72 42736493 41916413 769766 1508741 3.6
Non-forest 0.71 0.53 0.55 24921258 25741339 769766 1508741 5.9
Table 7. 5: Bias-corrected area estimates in hectare (ha) with confidence intervals (CI), weighted
producer’s accuracy and user’s accuracy for three land cover classes during 2005-2015.
Land cover classes
Accuracy GFC Map (modified) area
(ha)
Sample-based estimates
Producer’s Weighted Producer’s
User’s Area (ha) SE (ha) CI (ha) CI
(%)
Stable forest
0.56 0.75 0.71 42736493.2 40928208.2 789266.8 1546962.9 3.78
Loss 0.44 0.10 0.21 1768548.9 3875270.2 390950.6 766263.1 19.77
Stable non-forest
0.62 0.56 0.55 23152709.4 22854273 750506.9 1470993.4 6.44
Along with the forest and non-forest classes, the sample-based area estimate and
associated confidence interval of the forest loss class have been improved through
four approaches: increasing sample number to 300; using local knowledge and
information on areas of forest loss and cross-checking existing national maps that can
be used as proxy for the investigation of forest loss, using high spatial-resolution
imagery available in Google Earth for those samples, and following a quality control
procedure. The bias-corrected area estimates with confidence intervals outlined in
table 7.5 were calculated following the IPCC (2003, 2006) guidelines and the GFOI
(2016) methods guidance documents. It is important to underline that the map
estimates are bias-corrected (‘adjusted’) considering the national forest definition,
which includes land classification as well as tree cover.

27
In conclusion, the bias-corrected forest loss is about 387,527 ha per year over the
period 2005-2015. In comparison, the forest loss between 2005 and 2015 reported to
FRA 2015 (based on locally-produced wall-to-wall maps) was 428,000 ha per year, or
37,244 ha per year higher than the sample-based estimates. Figure 7.5 shows a
comparison of estimates from local maps and estimates after bias-correction for
forest, non-forest and forest loss classes. Given the current limitations of local maps,
as explained above, it was decided to use the bias-corrected forest loss estimates as
activity data.
Figure 7. 5: Area estimates of forest cover change during 2005-2015, in million ha, from local
land cover maps and from stratified random sampling design.
7.2. Emission factors
The FD conducted initial national forest inventory measurements in 1981-82 with the
financial and technical support of UNDP and FAO under the National Forest
Management and Inventory Project. However, resources were insufficient to extend
the project across the whole country and to all forested areas, and after 1991-92, FD
carried out the forest inventory exercises with its own resources. According to the
available records and documents, inventory surveys were based on a variety of
sampling methods. Estimates from such surveys were used in calculating annual
allowable cuts and reliable estimates for efficient management planning mainly at the
28
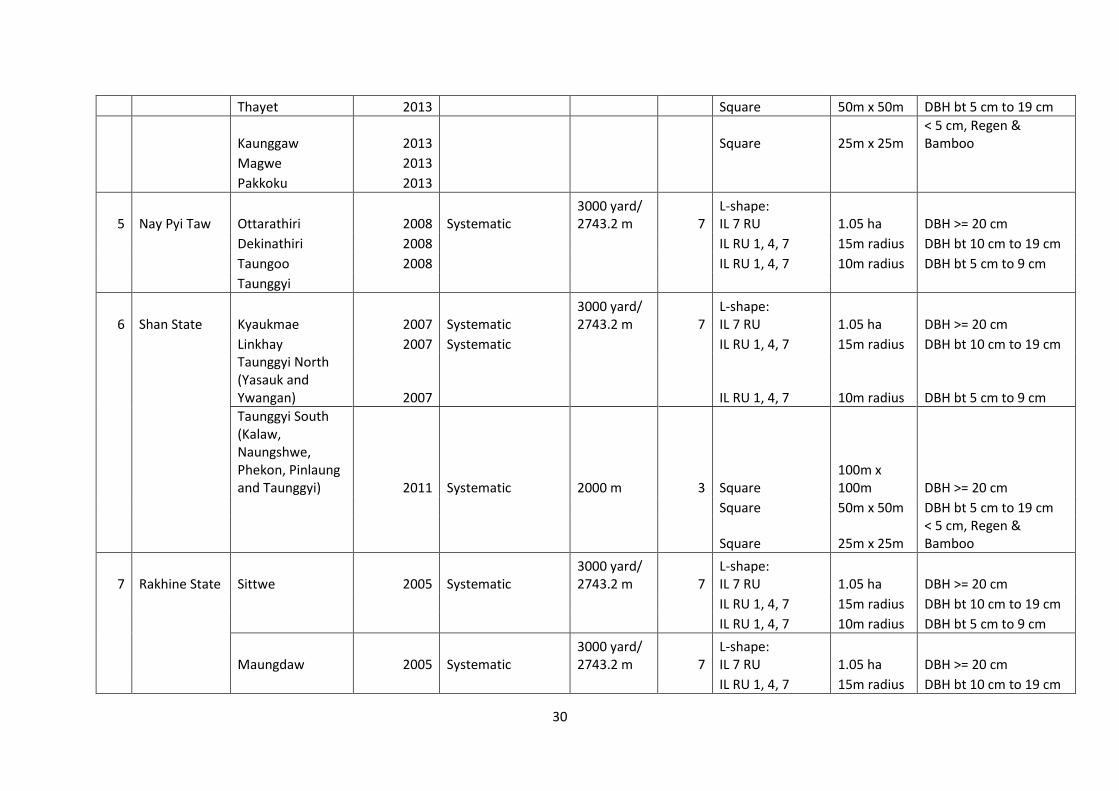
district level. There are 68 Forest Districts in Myanmar, defined by administrative
boundaries. District forest inventory surveys covered 40 Districts during a 10-year
rotation, using a variety of sampling intensities and sample plot designs (Table 7.6).
Detailed descriptions of different sample plot designs is mentioned in Annex 6. This
submission drew upon the data generated from 11,284 inventory plots of district level
forest inventory that were collected during 2005 to 2017 (Figure 7.6).

29
Table 7. 6: Sample Plot Design for 40 Districts used in Emission Factor Calculation
Sr. No. State/ Region District Year Sample Design Interval
Sub-Plots Shape Size Measurement
1 Kachin State Myintkyina 2004-2007 Systematic 3000 yard/ 2743.2 m 7
L-shape: IL 7 RU 1.05 ha DBH >= 20 cm
Bhamo IL RU 1, 4, 7 15m radius DBH bt 10 cm to 19 cm
IL RU 1, 4, 7 10m radius DBH bt 5 cm to 9 cm
2 Sagaing Region
Upper Chindwin
Tamu, Mawleik and Kalay 2014 Systematic 2000 m 3 Square
100m x 100m DBH >= 20 cm
Khanti 2015 Square 50m x 50m DBH bt 5 cm to 19 cm
Lower Chindwin
Shwebo and Monywa 2015 Square 25m x 25m
< 5 cm, Regen & Bamboo
Katha 2015
3 Bago Region Tharrawaddy 2011 Systematic 2000 m 1 Circular 50m radius all DBH classes (>=5cm)
Bago 2012 Systematic 2000 m 3 Square 100m x 100m DBH >= 20 cm
Square 50m x 50m DBH bt 5 cm to 19 cm
Square 25m x 25m < 5 cm, Regen & Bamboo
Taungoo 2010 Systematic 2000 m 1 Circular 50m radius all DBH classes (>=5cm)
Pyay 2017 Systematic 2000 m 3 Square 100m x 100m DBH >= 20 cm
50m x 50m DBH bt 5 cm to 19 cm
25m x 25m < 5 cm, Regen & Bamboo
4 Magwe Region Minbu 2013 Systematic 2000 m 3 Square
100m x 100m DBH >= 20 cm
30
Thayet 2013 Square 50m x 50m DBH bt 5 cm to 19 cm
Kaunggaw 2013 Square 25m x 25m < 5 cm, Regen & Bamboo
Magwe 2013
Pakkoku 2013
5 Nay Pyi Taw Ottarathiri 2008 Systematic 3000 yard/ 2743.2 m 7
L-shape: IL 7 RU 1.05 ha DBH >= 20 cm
Dekinathiri 2008 IL RU 1, 4, 7 15m radius DBH bt 10 cm to 19 cm
Taungoo 2008 IL RU 1, 4, 7 10m radius DBH bt 5 cm to 9 cm
Taunggyi
6 Shan State Kyaukmae 2007 Systematic 3000 yard/ 2743.2 m 7
L-shape: IL 7 RU 1.05 ha DBH >= 20 cm
Linkhay 2007 Systematic IL RU 1, 4, 7 15m radius DBH bt 10 cm to 19 cm
Taunggyi North (Yasauk and Ywangan) 2007 IL RU 1, 4, 7 10m radius DBH bt 5 cm to 9 cm
Taunggyi South (Kalaw, Naungshwe, Phekon, Pinlaung and Taunggyi) 2011 Systematic 2000 m 3 Square
100m x 100m DBH >= 20 cm
Square 50m x 50m DBH bt 5 cm to 19 cm
Square 25m x 25m < 5 cm, Regen & Bamboo
7 Rakhine State Sittwe 2005 Systematic 3000 yard/ 2743.2 m 7
L-shape: IL 7 RU 1.05 ha DBH >= 20 cm
IL RU 1, 4, 7 15m radius DBH bt 10 cm to 19 cm
IL RU 1, 4, 7 10m radius DBH bt 5 cm to 9 cm
Maungdaw 2005 Systematic 3000 yard/ 2743.2 m 7
L-shape: IL 7 RU 1.05 ha DBH >= 20 cm
IL RU 1, 4, 7 15m radius DBH bt 10 cm to 19 cm

31
IL RU 1, 4, 7 10m radius DBH bt 5 cm to 9 cm
Thandwe 2015 One Shot 2000 m 1 Circular 50m radius all DBH classes (>=5cm)
Kyaukphyu 2015 One Shot 2000 m 1 Square 1 ac plot all DBH classes (>=5cm)
MyaukOo 2005 Systematic 3000 yard/ 2743.2 m 7
L-shape: IL 7 RU 1.05 ha DBH >= 20 cm
IL RU 1, 4, 7 15m radius DBH bt 10 cm to 19 cm
IL RU 1, 4, 7 10m radius DBH bt 5 cm to 9 cm
8 Tanintharyi Dawei 2015 One Shot 2000 m 1 Square 1 ac plot all DBH classes (>=5cm)
9 Chin Falam 2015 One Shot 2000 m 1 Square 1 ac plot all DBH classes (>=5cm)
10 Ayeyarwaddy Myaungmya 2015 One Shot 2000 m 1 Circular 50m radius all DBH classes (>=5cm)
Pyarpon 2015 One Shot 2000 m 1 Square 1 ac plot all DBH classes (>=5cm)
Bogalay 2015 One Shot 2001 m 1 Square 1 ac plot all DBH classes (>=5cm)
Pathein 2015 One Shot 2000 m 1 Circular 50m radius all DBH classes (>=5cm)
Hinthada 2015 One Shot 2000 m 1 Circular 50m radius all DBH classes (>=5cm)
11 Mandalay KyaukSe 2015-2016 Systematic 2000 m 3 Square 100m x 100m DBH >= 20 cm
Mandalay 50m x 50m DBH bt 5 cm to 19 cm
Meiktila 25m x 25m < 5 cm, Regen & Bamboo
Pyin Oo Lwin
Yamethin

32
Figure 7. 6: Location of Inventory plots data collected during 2005 to 2017
7.2.1. Methodology for Emission Factor Calculation
As described above, Myanmar decided to include three carbon pools, i.e. AGB, BGB
and Litter for initial FREL development. A combination of Tier 1 and 2 approaches were
used in estimating these carbon pools using the following information from the
management inventory of 40 districts:

33
- ID of Tree/Stand and its Location (District ID, Latitude and Longitude)
- Tree Type/Categories (by two categories, i.e. stand DBH of 20 cm and above,
and that of 10 cm to 19 cm)
- Forest Types (by 19 Types that were mentioned in Section 2.3)
- Tree Species Code (based on Forest Inventory Manual of Forest Department)
- Diameter at Breast Height (DBH) in cm
For estimating stocks of three carbon pools, all individual trees in each plot were first
examined together with general plot information, basal area and stand density. AGB
was then derived based on allometric equations, then BGB and carbon content in litter
were estimated by using default factors of IPCC GPG in accordance with the AGB value.
Finally, carbon content in tCO2eq of each sample plot was calculated and plots were
grouped into districts and into different forest types. Step by step calculation of the
EFs was as follows;
Step (1)
District management inventories in Myanmar did not include tree height information,
but only DBH as the key parameter. Therefore, the AGB of individual trees in each
plots was estimated using allometric equations developed for pan-tropical forest by
the following equation from IPCC GPG for LULUCF8: (IPCC, 2006)
𝐸𝑞𝑢𝑎𝑡𝑖𝑜𝑛 2
𝐴𝐺𝐵 = 𝐸𝑋𝑃 ((−2.289 + 2.649 ∗ 𝐿𝑁(𝐷𝐵𝐻) − 0.021 ∗ (𝐿𝑁(𝐷𝐵𝐻))2
)
Where AGB= Above Ground Biomass in Kg Dry Matter/ Tree
The total AGB for each plot was quantified by the sum of AGB of all individual trees
and then converted into a per hectare value based on the respective sample plot
area/sampling design. There were four different plot designs applied by FD in the
period 2005-2017 (Table 7.7).
8 Table 4. A. 1; Allometric Equations for Estimating Above Ground Biomass of Tropical and Temperate Hardwood and Pine
Species from IPCC Good Practice Guidance for LULUCF
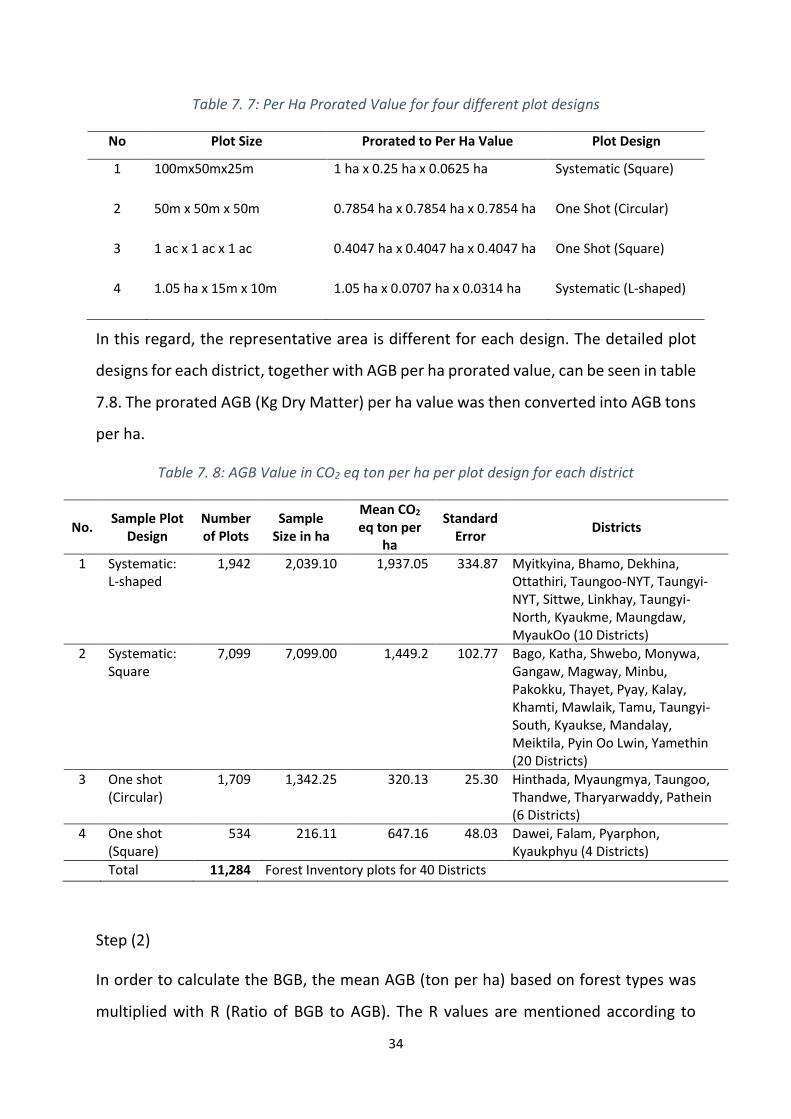
34
Table 7. 7: Per Ha Prorated Value for four different plot designs
No Plot Size Prorated to Per Ha Value Plot Design
1 100mx50mx25m 1 ha x 0.25 ha x 0.0625 ha Systematic (Square)
2 50m x 50m x 50m 0.7854 ha x 0.7854 ha x 0.7854 ha One Shot (Circular)
3 1 ac x 1 ac x 1 ac 0.4047 ha x 0.4047 ha x 0.4047 ha One Shot (Square)
4 1.05 ha x 15m x 10m 1.05 ha x 0.0707 ha x 0.0314 ha Systematic (L-shaped)
In this regard, the representative area is different for each design. The detailed plot
designs for each district, together with AGB per ha prorated value, can be seen in table
7.8. The prorated AGB (Kg Dry Matter) per ha value was then converted into AGB tons
per ha.
Table 7. 8: AGB Value in CO2 eq ton per ha per plot design for each district
No. Sample Plot
Design Number of Plots
Sample Size in ha
Mean CO2 eq ton per
ha
Standard Error
Districts
1 Systematic: L-shaped
1,942 2,039.10 1,937.05 334.87 Myitkyina, Bhamo, Dekhina, Ottathiri, Taungoo-NYT, Taungyi-NYT, Sittwe, Linkhay, Taungyi-North, Kyaukme, Maungdaw, MyaukOo (10 Districts)
2 Systematic: Square
7,099 7,099.00 1,449.2 102.77 Bago, Katha, Shwebo, Monywa, Gangaw, Magway, Minbu, Pakokku, Thayet, Pyay, Kalay, Khamti, Mawlaik, Tamu, Taungyi-South, Kyaukse, Mandalay, Meiktila, Pyin Oo Lwin, Yamethin (20 Districts)
3 One shot (Circular)
1,709 1,342.25 320.13 25.30 Hinthada, Myaungmya, Taungoo, Thandwe, Tharyarwaddy, Pathein (6 Districts)
4 One shot (Square)
534 216.11 647.16 48.03 Dawei, Falam, Pyarphon, Kyaukphyu (4 Districts)
Total 11,284 Forest Inventory plots for 40 Districts
Step (2)
In order to calculate the BGB, the mean AGB (ton per ha) based on forest types was
multiplied with R (Ratio of BGB to AGB). The R values are mentioned according to

35
different forest types as described in IPCC Guidelines.9 Although the forest type
categories according to forest inventory Field Instruction (1985) are different to the
global forest type categories, they have similar characteristics. The forest types are
then simplified according to global categories in order to select the appropriate ratio
of BGB to AGB according to Table 7.9.
Table 7. 9: Description on the forest types and respective value of R (Ratio of BGB to AGB)
and litter range
No. Forest Type Code according to Field
Instruction
Forest Type for BGB Calculation
R (Ratio of BGB to AGB) Value Range
Litter Range
1 Mangrove, Typical Tropical Rain Forest 0.37
2.1 Mangrove, high (Kanazo Forest)
2 Beach and Dune Forest
Tropical Dry Forest AGB< 20 Ton/ Ha = 0.56 (0.28-0.68) AGB> 20 Ton/Ha = 0.28 (0.27-0.28) 5.2
3 Swamp Forest Tropical Rain Forest 0.37
2.1 Evergreen Forest, Riverine
4 Evergreen Forest, Typical
Tropical Rain Forest 0.37
2.1 Evergreen Forest, Giant
Bamboo Forest
5 Mixed Deciduous Forest, Lower
Tropical Moist Deciduous Forest
AGB< 125 Ton/ Ha = 0.20 (0.09-0.25) AGB> 125 Ton/Ha = 0.24 (0.22-0.33)
2.1 Mixed Deciduous Forest, Upper Moist
6 Mixed Deciduous Forest, Upper Dry
Tropical Moist Deciduous Forest
AGB< 125 Ton/ Ha = 0.20 (0.09-0.25) AGB> 125 Ton/Ha = 0.24 (0.22-0.33) 2.1
7 Dipterocarp (Indaing) Forest, High
Tropical Dry Forest AGB< 20 Ton/ Ha = 0.56 (0.28-0.68) AGB> 20 Ton/Ha = 0.28 (0.27-0.28)
2.1 Dipterocarp (Indaing) Forest, Low
8 Dry Forest, than-dahat Tropical Dry Forest AGB< 20 Ton/ Ha = 0.56 (0.28-0.68) AGB> 20 Ton/Ha = 0.28 (0.27-0.28) 2.1
Dry Forest, Thorn
9 Table 4.4 of Chapter 4: Forest Land in 2006 IPCC Guidelines for National Greenhouse Gas Inventories

36
Dry Forest, Aukchinsa-thinwin
9 Hill Forest, Evergreen Tropical Mountain Systems
0.27 (0.27-0.28)
2.8
10 Hill Forest, Dry Tropical Dry Forest AGB< 20 Ton/ Ha = 0.56 (0.28-0.68) AGB> 20 Ton/Ha = 0.28 (0.27-0.28) 2.1
11 Hill Forest, Pine Temperate: Conifers AGB< 50 Ton/ Ha = 0.40 (0.21-1.06) AGB 50-150 Ton/ Ha = 0.29 (0.24-0.50) AGB >150 Ton/ Ha = 0.20 (0.12-0.49)
4.1
Step (3)
The sum the AGB and BGB values (ton per ha) were converted into tons of carbon per
ha by the multiplication with the default value of carbon fraction of dry matter 0.47
(IPCC Guideline 2006).
Step (4)
The default litter values10 (tons of carbon per ha) according to respective forest types
are described in table 7.9.
Step (5)
Total tons of carbon per ha was estimated by the sum of three values of AGB, BGB and
litter.
Step (6)
The default factor of 3.664 was used to convert the total tons of carbon per ha to
tCO2eq per ha value for three carbon pools.
One National Emission Factor will be used as an uncertainty test is needed for forest
type stratification and national data sources are currently insufficient for this purpose.
In future FREL/FRL submissions, more stratification will be conducted to improve the
accuracy of EFs and resulting emission and removal estimates.
10 Table 2.2: Tier 1 Default values for Litter in 2006 IPCC Guidelines

37
7.2.2. Results
The following table gives the values of tCO2 eq per ha, for three carbon pools
combined, for the respective forest districts, including the number of sample plots
used for the calculation. Myanmar will use weighted mean values of tCO2 eq per ha for
a national level EF based on 40 districts, i.e. 125.43 tCO2 eq per ha. (Table 7.10)
Table 7. 10: Results of the CO2 eq Mean Value ton per ha and weighted mean CO2 eq ton per
ha
No.
District Name Total No of sample
plots:
Weighted CO2 eq Mean Value per ha
Overall weighting
1 Bago 567 57.06 32,353.79
2 Dawei 109 535.90 23,639.58
3 Falam 159 246.24 15,844.79
4 Hinthada 68 128.78 6,877.59
5 Bhamo 427 198.56 89,023.55
6 Myitkyina 200 249.67 52,430.70
7 Katha 661 98.45 65,077.32
8 Shwebo 174 92.66 16,122.59
9 Monywa 190 110.16 20,930.61
10 Magway 8 63.92 511.32
11 Gangaw 311 124.22 38,631.23
12 Minbu 467 109.87 51,309.52
13 Pakoku 33 80.64 2,661.06
14 Thanyet 274 106.05 29,057.04
15 Myaungmya 10 22.47 176.51
16 Dekkina:NPT 105 131.36 14,482.34
17 Ottarathiri:NPT 67 118.63 8,345.42
Taungoo: NYT 10 100.17 1,051.82
Taunggyi: NYT 20 147.99 3,107.87
18 Pyarphon 47 14.99 285.05
19 Pyay 430 82.06 35,286.86
20 Sittwe 6 843.94 5,316.81
21 Taungoo 962 80.67 60,952.09
22 Thandwe 147 87.43 10,093.97
23 Tharyarwaddy 446 70.89 24,833.13
24 Kalay 869 119.52 103,861.64
25 Khamti 951 85.07 80,905.13
26 Mawlaik 971 145.56 141,341.44
27 Tamu 45 73.23 3,295.45
28 Linkhay 234 97.73 24,011.47

38
29 Taunggyi_North 225 197.36 46,625.58
30 Taunggyi_South 334 151.49 50,596.34
31 Kyaukme 519 315.70 172,038.75
32 Pathein 76 63.88 3,813.04
33 Kyaukphyu 219 93.77 8,311.04
34 Maungdaw 52 99.23 5,417.97
35 MyaukOo 77 99.65 8,056.62
36 KyaukSe 163 125.09 20,389.03
37 Mandalay 19 71.73 1,362.88
38 Meiktila 90 65.36 5,882.73
39 Pyin Oo Lwin 465 112.77 52,438.86
40 Yamethin 77 64.36 4,955.61
Total inventory plots 11,284 5,884.26 1,341,706.12
147.11 (Arithmetic
Mean)
125.43 (Weighted Mean)
8. Myanmar FREL
Myanmar proposes an initial FREL by historical average of emissions during the
reference period from 2005 to 2015. The bias-corrected area of annual deforestation
is estimated 387,527 ha per year during 2005-2015. Weighted mean values of tCO2 eq
per ha through the calculation based on 40 districts forest inventory result in a national
EF of 125.43 tCO2 eq per ha.
Annual CO2 emission from deforestation during the historical reference period 2005-
2015 is estimated as 48,607,511 tons per year.
From sample based estimation, it was not possible to develop a forest gain map for
the period 2005 to 2015 and this therefore severely limited the information available
to develop a reference level for forest gain (enhancement of forest carbon stocks).
Efforts are ongoing to improve the data available and this will be added to the
submission in due course.
In the meantime, it is recognized that an increase in biomass and carbon stocks on
afforested/reforested areas should be expected as a result of the 10-year NRRPM. A
summary of the afforestation/reforestation activities undertaken during the reference

39
period is therefore included in Annex 7, as a means of creating a benchmark against
which these gains can be measured.
9. Uncertainty test
The uncertainty test for activity data and emission factor was conducted according to
the IPCC Good Practice Guidance and Uncertainty Management in National
Greenhouse Gas Inventories. The uncertainty only includes sampling error through the
propagation of errors and not allometric equation errors.
In calculation of the % uncertainty of activity data, especially deforestation estimate,
the following equation was applied,
Equation 311
% 𝑈𝑛𝑐𝑒𝑟𝑡𝑎𝑖𝑛𝑡𝑦 =
12 (95% 𝐶𝑜𝑛𝑓𝑖𝑑𝑒𝑛𝑐𝑒 𝐼𝑛𝑡𝑒𝑟𝑣𝑎𝑙 𝑊𝑖𝑑𝑡ℎ)
𝜇 𝑥 100
Where µ=mean of the distribution
As described in the equation, the 95% Confidence Interval for all 40 districts are calculated with the equations of:
Equation 4
95% 𝑈𝑝𝑝𝑒𝑟 𝐶𝑜𝑛𝑓𝑖𝑑𝑒𝑛𝑐𝑒 𝐼𝑛𝑡𝑒𝑟𝑣𝑎𝑙 = 𝑀𝑒𝑎𝑛 𝐶𝑂2 𝑇𝑜𝑛 𝑃𝑒𝑟 𝐻𝑎 + 1.96 ∗ (𝑆𝑡𝑎𝑛𝑑𝑎𝑟𝑑 𝐷𝑒𝑣𝑖𝑎𝑡𝑖𝑜𝑛
√𝑆𝑎𝑚𝑝𝑙𝑒 𝑆𝑖𝑧𝑒 𝐼𝑛 𝐻𝑎 )
95% 𝐿𝑜𝑤𝑒𝑟 𝐶𝑜𝑛𝑓𝑖𝑑𝑒𝑛𝑐𝑒 𝐼𝑛𝑡𝑒𝑟𝑣𝑎𝑙 = 𝑀𝑒𝑎𝑛 𝐶𝑂2 𝑇𝑜𝑛 𝑃𝑒𝑟 𝐻𝑎 − 1.96 ∗ (𝑆𝑡𝑎𝑛𝑑𝑎𝑟𝑑 𝐷𝑒𝑣𝑖𝑎𝑡𝑖𝑜𝑛
√𝑆𝑎𝑚𝑝𝑙𝑒 𝑆𝑖𝑧𝑒 𝐼𝑛 𝐻𝑎 )
95% 𝐶𝑜𝑛𝑓𝑖𝑑𝑒𝑛𝑐𝑒 𝐼𝑛𝑡𝑒𝑟𝑣𝑎𝑙 𝑊𝑖𝑑𝑡ℎ = 95% 𝑈𝐶𝐼 − 95% 𝐿𝐶𝐼
The uncertainty of the overall inventory was calculated by the error propagation equation,
Equation 5
𝑈 𝑡𝑜𝑡𝑎𝑙12 =
√(𝑈1 ∗ 𝑥1) 2 + (𝑈2 ∗ 𝑥2) 2 + ⋯ + (𝑈𝑛 ∗ 𝑥𝑛) 2
𝑥1 + 𝑥2 + ⋯ + 𝑥𝑛
𝑈 𝑡𝑜𝑡𝑎𝑙= the percentage uncertainty in the sum of the quantities
𝑥𝑛 𝑎𝑛𝑑 𝑈𝑛 are the uncertain quantities and the percentage uncertainties associated with
them, respectively.
11 Box 5.2.1: Chapter 5 of IPCC Good Practice Guidance for LULUCF 12 Table 6.1: Tier 1 Uncertainty Calculation and Reporting under IPCC Good Practice Guidance and Uncertainty
Management in National Greenhouse Gas Inventory

40
Table 9.1 shows the % uncertainty of AD, forest loss area, i.e. 9.89% for this submission
whereas Table 9.2 shows the % uncertainty of 40 district forest inventory and resulting
overall % is 12.10 for this submission.
Table 9. 1: Uncertainty Result for Activity Data in %
Area in ha (estimate) Standard Error in ha Uncertainty %
Forest 40,928,208 789,266 1.89
Forest loss (deforestation area) 3,875,270 390,950 9.89
Non forest 2,2854,273 750,506 3.22
Total area 67,657,751
Combined uncertainty was finally estimated by using the uncertainty of AD, especially
uncertainty % of forest loss (deforestation) and that of EF as follows:
Equation 6
𝐶𝑜𝑚𝑏𝑖𝑛𝑒 𝑈𝑛𝑐𝑒𝑟𝑡𝑎𝑖𝑛𝑡𝑦 (%) = √𝑈𝑛𝑐𝑒𝑟𝑡𝑎𝑖𝑛𝑡𝑦 % 𝑜𝑓 𝐴𝐷2 + 𝑈𝑛𝑐𝑒𝑟𝑡𝑎𝑖𝑛𝑡𝑦 𝑜𝑓 % 𝐸𝐹2
Regarding the above calculation, uncertainty % of AD, deforestation area estimation
and EF were 9.89 % and 12.10 % respectively and therefore, combined uncertainty %
of 15.57% is estimated for this submission.

41
Table 9. 2: Uncertainty Result for Emission Factor in %
No Districts Plots (n) Plot Size
Sample Size in Ha
Mean CO2 eq
Ton Per Ha13
Standard Deviation
Confidence Level (95%)
Width/ Confidence
Interval
% Uncertainty
U x Xn (U x Xn)^2 Upper Lower
1 Bago 567 1 567 41.02 38.30 44.18 37.87 6.31 7.69 315.29 99,408.64
2 Dawei 109 0.4047 44.1123 385.55 308.31 476.53 294.57 181.97 23.60 9,098.27 82,778,547.65
3 Falam 159 0.4047 64.3473 185.81 181.23 230.09 141.53 88.56 23.83 4,428.18 19,608,738.88
4 Hinthada 68 0.7854 53.4072 100.90 65.50 118.47 83.34 35.13 17.41 1,756.61 3,085,682.03
5 Myitkyina 200 1.05 210 96.99 82.50 108.15 85.83 22.32 11.50 1,115.79 1,244,993.41
6 Bhamo 427 1.05 448.35 152.36 96.34 161.28 143.44 17.84 5.85 891.79 795,294.70
7 Katha 661 1 661 73.49 44.24 76.86 70.11 6.75 4.59 337.25 113,738.51
8 Shwebo 174 1 174 68.36 58.30 77.02 59.69 17.32 12.67 866.24 750,368.64
9 Monywa 190 1 190 84.60 34.98 89.57 79.63 9.95 5.88 497.36 247,366.59
10 Gangaw 311 1 311 96.15 71.96 104.15 88.15 15.99 8.32 799.74 639,591.49
11 Magway 8 1 8 46.85 32.13 69.11 24.59 44.52 47.52 2,226.23 4,956,078.42
12 Minbu 467 1 467 81.07 68.20 87.26 74.89 12.37 7.63 618.57 382,629.12
13 Pakokku 33 1 33 57.99 36.75 70.52 45.45 25.08 21.62 1,253.81 1,572,030.22
14 Thayet 274 1 274 78.85 51.35 84.93 72.77 12.16 7.71 607.99 369,647.99
15 Myaung-mya 10 0.7854 7.854 2.04 15.14 12.62 (8.55) 21.17 519.29 1,058.51 1,120,448.33
16 Dekhina 105 1.05 110.25 102.84 73.17 116.50 89.18 27.32 13.28 1,365.85 1,865,549.50
17 Ottarathiri 67 1.05 70.35 92.11 69.50 108.35 75.87 32.48 17.63 1,624.17 2,637,941.38
Taungoo: NYT 10 1.05 10.5 77.07 29.17 94.71 59.42 35.28 22.89 1,764.19 3,112,350.50
Taungyi: NYT 20 1.05 21 116.92 37.29 132.86 100.97 31.90 13.64 1,594.75 2,543,236.62
18 Pyarphon 47 0.4047 19.0209 5.32 6.96 8.45 2.20 6.25 58.75 312.69 97,774.36
19 Pyay 430 1 430 61.51 64.47 67.60 55.42 12.19 9.91 609.33 371,281.91
20 Sittwe 6 1.05 6.3 674.39 655.33 1,186.13 162.65 1,023.47 75.88 51,173.74 2,618,751,828.74
21 Taungoo 962 0.7854 755.5548 60.76 52.35 64.49 57.03 7.47 6.14 373.31 139,360.36
22 Thandwe 147 0.7854 115.4538 62.85 49.81 71.93 53.76 18.17 14.46 908.65 825,637.30
23 Tharyarwa-ddy 446 0.7854 350.2884 52.55 71.39 60.03 45.07 14.95 14.23 747.60 558,911.31
13 Mean CO2 eq ton per ha is only for Above Ground Biomass Pool.

42
24 Kalay 869 1 869 91.46 78.06 96.65 86.27 10.38 5.68 519.04 269,399.13
25 Khamti 951 1 951 61.90 55.83 65.45 58.35 7.10 5.73 354.87 125,931.78
26 Mawlaik 971 1 971 110.77 68.99 115.11 106.43 8.68 3.92 433.95 188,316.28
27 Tamu 45 1 45 53.07 24.20 60.14 46.00 14.14 13.32 707.02 499,875.86
28 Linkhay 234 1.05 245.7 73.29 33.62 77.49 69.08 8.41 5.74 420.33 176,674.23
29 Taunggyi_North 225 1.05 236.25 152.97 70.08 161.91 144.03 17.87 5.84 893.68 798,655.52
30 Taunggyi South 334 1 334 115.70 280.59 145.79 85.61 60.18 26.01 3,009.21 9,055,334.17
31 Kyaukme 519 1.05 544.95 245.45 164.62 259.27 231.63 27.64 5.63 1,382.14 1,910,309.77
32 Pathein 76 0.7854 59.6904 41.03 29.89 48.53 33.53 15.00 18.28 749.87 562,305.64
33 Kyaukphyu 219 0.4047 88.6293 70.48 46.13 80.09 60.88 19.21 13.63 960.34 922,246.74
34 Maungdaw 52 1.05 54.6 76.25 34.34 85.36 67.14 18.22 11.95 910.94 829,804.39
35 MyaukOo 77 1.05 80.85 76.44 41.96 85.59 67.29 18.29 11.97 914.71 836,687.16
36 KyaukSe 163 1 163 96.80 88.94 110.46 83.15 27.31 14.10 1,365.36 1,864,220.60
37 Mandalay 19 1 19 52.06 62.24 80.05 24.08 55.97 53.75 2,798.63 7,832,350.74
38 Meiktila 90 1 90 47.41 51.40 58.03 36.79 21.24 22.40 1,061.91 1,127,662.07
39 Pyin Oo Lwin 465 1 465 85.98 97.45 94.83 77.12 17.72 10.30 885.76 784,565.34
40 Yamethin 77 1 77 44.26 39.22 53.02 35.50 17.52 19.80 876.06 767,480.94
11,284 4,353.63 2,777,220,256.96
√(𝑈1 ∗ 𝑥1) 2 + (𝑈2 ∗ 𝑥2) 2 + ⋯ + (𝑈𝑛 ∗ 𝑥𝑛) 2 52,699.34
𝑈 𝑡𝑜𝑡𝑎𝑙14 =
√(𝑈1 ∗ 𝑥1) 2 + (𝑈2 ∗ 𝑥2) 2 + ⋯ + (𝑈𝑛 ∗ 𝑥𝑛) 2
𝑥1 + 𝑥2 + ⋯ + 𝑥𝑛 12.10
14 Table 6.1: Tier 1 Uncertainty Calculation and Reporting under IPCC Good Practice Guidance and Uncertainty Management in National Greenhouse Gas Inventory
Uncertainty value for overall emission factor is accepted as:

10. Future improvement opportunities
10.1. For Activity Data
Much uncertainty exists in identification of forest gain (enhancement) classes while using
remote sensing technologies because of difficulties in distinguishing between
afforestation and growing cycles of the forest plantations, and difficulties in identifying
the ecological pattern of forest regrowth. Indeed, seasonality (leaf phenology) and soil
moisture variations may have played a role in the other misclassifications such as dry
forest types or teak plantation. Therefore, forest gain has not been considered for
sample-based estimates and has been identified as one of the areas of future
improvement for the FRL.
There is a need to develop a standard operating procedure to detect land cover change
under the six IPCC land cover classes through remote sensing-based and ground-based
information to provide a more robust estimate of carbon emissions and removals.
The existing land cover maps do not allow precise estimates of forest cover change, either
loss or gain. Improvement of these maps is a priority. To reduce uncertainty and improve
the estimates of confidence intervals, it may be possible to allocate samples through
stratification using high-quality locally-produced maps.
Further developments may include analysis of degradation with particular attention to
the definitions in the national context (e.g. the types of plantations which can be classified
as forest).
Specific activities which are either planned or ongoing for improvement of AD include the
following:
The local technical team is trying to standardize the image interpretation methodology
in order to reduce the effect of interpreter and human bias in image interpretation.
- In order to set up the long term assessment, FAO Open Foris: Collect Earth System
has been introduced and sample plots have been set up throughout the country.

- Since the available datasets are from satellite images, perennial crops and home
gardens cannot be clearly distinguished from forest cover and the future plan is to
collect the attributes of recorded land areas for perennial crops/home garden and
create a spatial database through which they can be reliably identified against
satellite imagery.
- Detailed land use maps are not currently available. Ongoing land use assessment
using Rapid-eye images will assist in the development of these maps.
- Classification of rubber plantations is inconsistent. Previously, rubber plantations
fell under the management of the Ministry of Agriculture, Livestock and Irrigation
(MOALI). In the last few years, such plantations are also permitted within PFE.
Rubber plantation within PFE at the moment is consider as forest land but those
outside PFE are considered agricultural crops.
- AD calculations will be refined based on individual states and regions
- Stepwise approach should be applied to improve the current FREL over time by
incorporating more REDD+ activities, better data, improved methodologies and
additional pools.
- Although this submission is at national level, strengthening of land and forest
monitoring and measurement capacities under various projects, like the National
Forest Inventory/ National Forest Monitoring and Information System (NFI/ NFMIS)
and OneMap Myanmar, future FREL/FRL submissions may be divided into sub-
national levels based on the available improved datasets.
10.2. For Emission Factors
FD conducted district forest inventories every year in available districts and many
forest parameters are available. On the other hand, there is no database management
system or standardization of parameter coding system. The forthcoming NFI/NFMIS
project will focus on the national forest monitoring and information system and will
provide more qualified data and information to inform future FREL/FRL submissions.

The NFI/NFMIS project will also improve accuracy of geo-location of the sample plots
and integrated application of remote sensing data/ satellite and forest inventory data
for effective estimation of forest resources.
At the moment, soil data has been partially collected and analyzed by the Forest
Research Institute. Monitoring of soil organic carbon will be possible in the future and
planned to be conducted with the support of the Finland Forest Research Institute
(LUKE) and the NFI/NFMIS project.
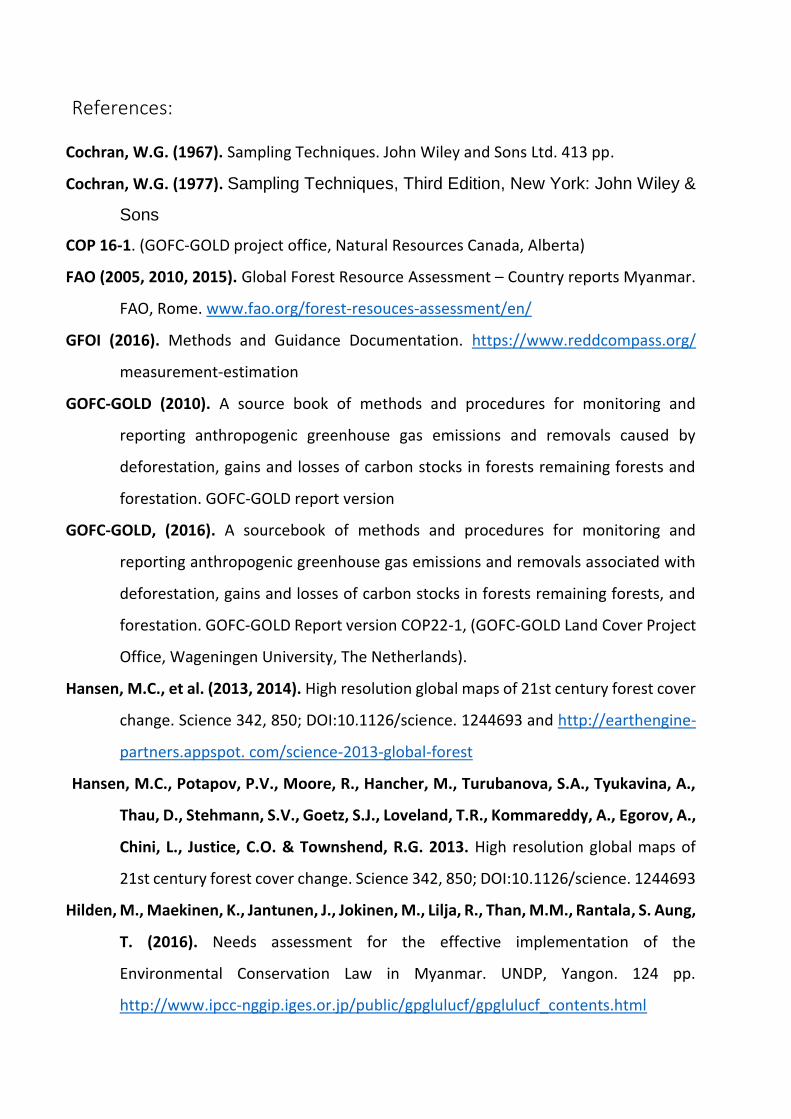
References:
Cochran, W.G. (1967). Sampling Techniques. John Wiley and Sons Ltd. 413 pp.
Cochran, W.G. (1977). Sampling Techniques, Third Edition, New York: John Wiley &
Sons
COP 16-1. (GOFC-GOLD project office, Natural Resources Canada, Alberta)
FAO (2005, 2010, 2015). Global Forest Resource Assessment – Country reports Myanmar.
FAO, Rome. www.fao.org/forest-resouces-assessment/en/
GFOI (2016). Methods and Guidance Documentation. https://www.reddcompass.org/
measurement-estimation
GOFC-GOLD (2010). A source book of methods and procedures for monitoring and
reporting anthropogenic greenhouse gas emissions and removals caused by
deforestation, gains and losses of carbon stocks in forests remaining forests and
forestation. GOFC-GOLD report version
GOFC-GOLD, (2016). A sourcebook of methods and procedures for monitoring and
reporting anthropogenic greenhouse gas emissions and removals associated with
deforestation, gains and losses of carbon stocks in forests remaining forests, and
forestation. GOFC-GOLD Report version COP22-1, (GOFC-GOLD Land Cover Project
Office, Wageningen University, The Netherlands).
Hansen, M.C., et al. (2013, 2014). High resolution global maps of 21st century forest cover
change. Science 342, 850; DOI:10.1126/science. 1244693 and http://earthengine-
partners.appspot. com/science-2013-global-forest
Hansen, M.C., Potapov, P.V., Moore, R., Hancher, M., Turubanova, S.A., Tyukavina, A.,
Thau, D., Stehmann, S.V., Goetz, S.J., Loveland, T.R., Kommareddy, A., Egorov, A.,
Chini, L., Justice, C.O. & Townshend, R.G. 2013. High resolution global maps of
21st century forest cover change. Science 342, 850; DOI:10.1126/science. 1244693
Hilden, M., Maekinen, K., Jantunen, J., Jokinen, M., Lilja, R., Than, M.M., Rantala, S. Aung,
T. (2016). Needs assessment for the effective implementation of the
Environmental Conservation Law in Myanmar. UNDP, Yangon. 124 pp.
http://www.ipcc-nggip.iges.or.jp/public/gpglulucf/gpglulucf_contents.html
IPCC (2000). Good practice guidance and uncertainty management in national greenhouse
gas inventories. http://www.ipcc-nggip.iges.or.jp/public/ gp/english/index.html
IPCC (2003). Good practice guidance for land use, land use change and forestry.
http://www.ipcc-nggip.iges.or.jp/public/gpglulucf/gpglulucf_contents.html
IPCC (2003). Good practice guidance for land use, land use change and forestry.
IPCC (2006). Guidelines for national Greenhouse Gas Inventories. Volume 4 : Agriculture,
Forestry and Other Land Use. http://www.ipcc-nggip.iges.or.jp/ public/2006gl/
vol4.html
IPCC (2006). Guidelines for national greenhouse gas inventories. Volume
4. http://www.ipcc-nggip.iges.or.jp/public/2006gl/vol4.html
IPCC (2006). IPCC Guidelines for National Greenhouse Gas Inventories
IPCC GL. (2006). Agriculture, Forestry and Other Land Use. IPCC Guidelines for national
greenhouse gas inventories.
MOECAF (2012). Myanmar’s Initial National Communication under the UNFCCC – chapter
3 GHG-Inventory. Nay Pyi Taw. 313 pp.
MOECAF (2012). Myanmar's first national communication under the United Nations
Framework Convention on Climate. MMR/COM/1 B. Nay Pyi Taw, 268pp. (url:
http://unfccc.int/resource/docs/natc/mmrnc1.pdf, date of access: 12 December
2017)
MOECAF (2015). Development of a National Forest Monitoring System for Myanmar.
Forest Department – UN-REDD Programme, Nay Pyi Taw, 84 pp.
MOECAF (2015a). Forest Reference (Emissions) Level action plan for Myanmar. Forest
Department – UN-REDD Programme, Nay Pyi Taw, 39 pp.
MOECAF-UN-REDD Programme (2013). Myanmar REDD+ Readiness Roadmap. Nay Pyi
Taw. 148 pp.
MONREC (2017). Country Statement on Climate Change COP 23, http://unfccc.int/files/
meetings/bonn_nov_2017/statements/application/pdf/myanmar_cop23cmp13c
ma1-2_hls.pdf

MONREC-ECD. (2016). Myanmar Climate Change Strategy and Action Plan, MCCSAP, Final
Draft 2016 – 2030. Nay Pyi Taw, 180 pp.
MONREC-FD (2016). National Reforestation and Rehabilitation Programme of Myanmar,
NRRPM, MONREC, Nay Pyi Taw.
MONREC-FD. (2011, 2016). Myanmar’s Biodiversity Strategy and Action Plan. MOECAF/
MONREC, Nay Pyi Taw. https://www.cbd.int/nbsap/ about/latest/ default. shtml
#mm
Olofsson et al. (2013). Making better use of accuracy data in land change studies:
Estimating accuracy and area and quantifying uncertainty using stratified
estimation, Remote Sensing of Environment 129, 122-131
Olofsson et al. (2014). Good practices for assessing accuracy and estimating area of land
change, Remote Sensing of Environment 148, 42-57

Annex
Annex 1: Datasets used to generate activity data for establishing a forest reference emission
level in Myanmar during 2005-2015
no Data type Format Note
1 Wall-to-wall maps:
Land cover map from Forest
Department
Land cover map 2005 (30 m-Landsat-
based)
Raster The maps were generated using
supervised maximum likelihood classifier
into seven land cover classes which
include: Close forest, Open Forest, Other
wooded land, Mangrove, water, snow, and
others.
Land cover map 2015 (23.5 m-IRS-
based)
Raster
Land cover map 2015 (30-m-Landsat-
based)
Raster
2 Sample-based estimates
2.1 Global Forest Change (Stratifier)
Tree canopy cover for year 2000
(treecover2000)
Raster Tree cover in the year 2000, defined as
canopy closer for all vegetation taller than
5m in height. Encoded as a percentage per
output grid cell, in the range of 0-100.
Year of forest cover loss event 2001-
20015 (loss year)
Raster Forest loss during the period 2000-2015
defined as a stand-replacement
disturbance, or a change from a forest to
non-forest state. Encoded as either 0 (no
loss) or else a value in the range of 1-15,
representing loss detected primarily in the
year 2001-2015, respectively.
2.2 1,884 stratified random samples Vector
and csv
The samples were generated following
stratified random sampling design using
stratified forest change map of 2005-2015,
derived from Global Forest Change Maps.
The samples were checked against high-
quality reference data.
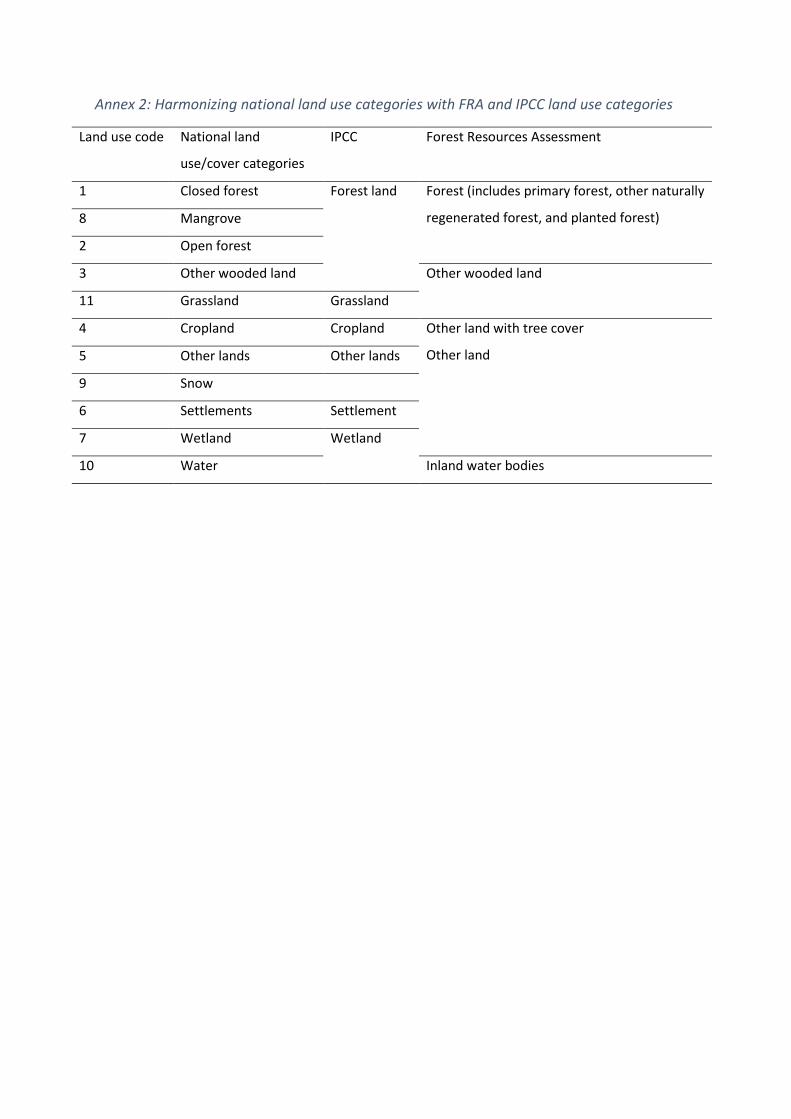
Annex 2: Harmonizing national land use categories with FRA and IPCC land use categories
Land use code National land
use/cover categories
IPCC Forest Resources Assessment
1 Closed forest Forest land Forest (includes primary forest, other naturally
regenerated forest, and planted forest) 8 Mangrove
2 Open forest
3 Other wooded land Other wooded land
11 Grassland Grassland
4 Cropland Cropland Other land with tree cover
Other land 5 Other lands Other lands
9 Snow
6 Settlements Settlement
7 Wetland Wetland
10 Water Inland water bodies

Annex 3: Wall-to-wall thematic raster maps of Myanmar under seven national land use/cover
categories at three years: 2005, 2010 and 2015.

Annex 4: A brief description of the simple and stratified random sampling estimators
Stratified estimators
Stratified estimators of the mean (�̂�𝑆𝑇𝑅) and the variance of the estimate of the mean
(𝑉�̂�𝑟(�̂�𝑆𝑇𝑅)) are provided by Cochran (1977) as,
�̂�𝑆𝑇𝑅 = ∑ 𝑤ℎ�̂�ℎ
𝐻
ℎ=1
-----------(𝐸𝑞. 3)
and
𝑉�̂�𝑟(�̂�𝑆𝑇𝑅) = ∑ 𝑤ℎ2 �̂�ℎ
2
𝑛ℎ
𝐻ℎ=1 -----------(𝐸𝑞. 2)
Where
�̂�ℎ = 1
𝑛ℎ
∑ 𝑦ℎ𝑖
𝑛ℎ
𝑖=1
------------(𝐸𝑞. 4)
And
�̂�ℎ2 =
1
𝑛ℎ − 1∑(𝑦ℎ𝑖 − �̂�ℎ)2
𝑛ℎ
𝑖=1
-------------(𝐸𝑞. 5)
ℎ = 1, … … , 𝐻denotes strata;
𝑦ℎ𝑖is the 𝑖𝑡ℎsample observation in the ℎ𝑡ℎ stratum;
𝑤ℎis the weight for the ℎ𝑡ℎ stratum;
𝑛ℎis the number of plots assigned to the ℎ𝑡ℎ stratum; and
�̂�ℎand�̂�ℎ2 are the sample estimates of the within-strata means and variance,
respectively.
Using the notation of Eq. 1 (see section 7.1.2), and adding the subscript j to indicate
reference class j,

�̂�ℎ𝑗 = 1
𝑛ℎ
∑ 𝑦ℎ𝑗𝑖------------ (𝐸𝑞. 6)
𝑛ℎ
𝑖=1
But because
𝑦ℎ𝑗𝑖 = {1 𝑖𝑓 ℎ = 𝑗0 𝑖𝑓 ℎ ≠ 𝑗
------------- (𝐸𝑞. 7)
Equation (1) can be expressed as,
�̂�ℎ𝑗 =𝑛ℎ𝑗
𝑛ℎ
-------------- (𝐸𝑞. 8)
So that from Eq. 3
�̂�𝑗 = ∑ 𝑤ℎ
𝐻
ℎ=1
. �̂�ℎ𝑗 = ∑ 𝑤ℎ
𝐻
ℎ=1
.𝑛ℎ𝑗
𝑛ℎ
= ∑ �̂�ℎ𝑗
𝐻
ℎ=1
----------------(𝐸𝑞. 9)
The area for reference class j is estimated as the product of �̂�𝑗and the total
area(𝐴𝑡𝑜𝑡).For example the estimated deforestation �̂�1 =
𝑃𝑟𝑜𝑑𝑢𝑐𝑒𝑟′𝑠 𝑎𝑐𝑐𝑢𝑟𝑎𝑐𝑦 𝑜𝑓 𝑑𝑒𝑓𝑜𝑟𝑒𝑠𝑡𝑎𝑡𝑖𝑜𝑛 𝑐𝑙𝑎𝑠𝑠 ∗ 𝐴𝑡𝑜𝑡
Confidence Interval
Using the notation of Eq. 5 and again adding the subscript to denote reference class j,
�̂�ℎ𝑗2 =
1
𝑛ℎ𝑗 − 1∑(𝑦ℎ𝑖𝑗 − �̂�ℎ𝑗)
2
𝑛ℎ
𝑖=1
-------------(𝐸𝑞. 10)
Noting from Eq. 7, the Eq. 10 can be expressed as,
�̂�ℎ2 =
1
𝑛ℎ − 1∑ �̂�ℎ𝑗 . (1 − �̂�ℎ𝑗)
𝑛ℎ
𝑖=1
-------------(𝐸𝑞. 11)
So that from Eq. 2

𝑉�̂�𝑟(�̂�𝑗) = ∑ 𝑤ℎ2
�̂�ℎ2
𝑛ℎ
𝐻
ℎ=1
= ∑ 𝑤ℎ2.
�̂�ℎ𝑗 . (1 − �̂�ℎ𝑗)
𝑛ℎ𝑗 − 1
𝐻
ℎ=1
= ∑𝑤ℎ . �̂�ℎ𝑗 − �̂�ℎ𝑗
2
𝑛ℎ𝑗 − 1
𝐻
ℎ=1
-----------(𝐸𝑞. 12)
And standard error,
𝑆𝐸(�̂�𝑗) = √𝑉�̂�𝑟(�̂�𝑗)------------(𝐸𝑞. 13)
From Eq. 13 so that the standard error of the estimated area of forest loss is
𝑆𝐸(�̂�1) = 𝑆𝐸(�̂�1) ∗ 𝐴𝑡𝑜𝑡
At 95% confidence interval of the estimates area of forest loss is ±1.96 ∗ 𝑆𝐸(�̂�1)
Strata (j) �̂�𝑗
(proportion)
𝑆𝐸(�̂�𝑗)
(proportion)
�̂�𝑗 (ha)
95% Confidence interval
Lower (ha) Upper (ha)
Stable Forest
Stable Non-Forest
Loss

Annex 5: Examples of sample assessment using validation datasets:
(i) Forest 2005 > Forest 2015; (ii) NonForest 2005 > NonForest 2015; (iii) Forest 2005 > NonForest
2015 (sample # 408). 30-m spatial resolution Landsat False Color Composite (NIR_SWIR1_R) and
high spatial resolution Google Earth natural color (RGB) imagery were used as validation datasets.
(i) Forest 2005 > Forest 2015
2005 Landsat 5 TM 2005 Google Earth Imagery
2015 Landsat 7 ETM+ 2015 Google Earth Imagery
(ii) Non-Forest 2005 > Non-Forest 2015
2005 Landsat 5 TM 2005 Google Earth RGB Imagery

2015 Landsat 7 ETM+ 2015 Google Earth Imagery
(ii) Forest 2005 > Non-Forest 2015 Time-series imagery from Google Earth
2005
2013

2014
2017
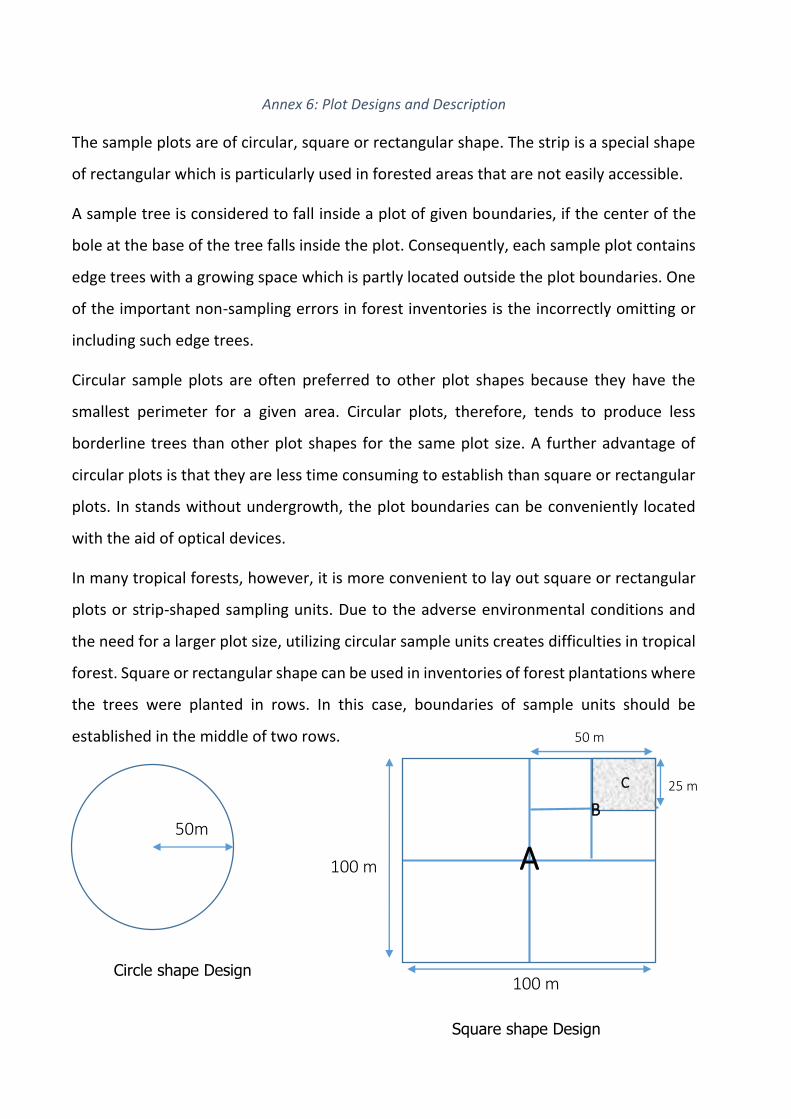
Annex 6: Plot Designs and Description
The sample plots are of circular, square or rectangular shape. The strip is a special shape
of rectangular which is particularly used in forested areas that are not easily accessible.
A sample tree is considered to fall inside a plot of given boundaries, if the center of the
bole at the base of the tree falls inside the plot. Consequently, each sample plot contains
edge trees with a growing space which is partly located outside the plot boundaries. One
of the important non-sampling errors in forest inventories is the incorrectly omitting or
including such edge trees.
Circular sample plots are often preferred to other plot shapes because they have the
smallest perimeter for a given area. Circular plots, therefore, tends to produce less
borderline trees than other plot shapes for the same plot size. A further advantage of
circular plots is that they are less time consuming to establish than square or rectangular
plots. In stands without undergrowth, the plot boundaries can be conveniently located
with the aid of optical devices.
In many tropical forests, however, it is more convenient to lay out square or rectangular
plots or strip-shaped sampling units. Due to the adverse environmental conditions and
the need for a larger plot size, utilizing circular sample units creates difficulties in tropical
forest. Square or rectangular shape can be used in inventories of forest plantations where
the trees were planted in rows. In this case, boundaries of sample units should be
established in the middle of two rows.
50m
100 m
100 m
50 m
25 m C
B
A
Circle shape Design
Square shape Design

All DBH classes are collected in 50 m radius Circular plots whereas, the trees with DBH 200
mm and above are collected within square A area (100m x 100m: 1 Ha), trees within 50
mm and 199 mm collected within square B area (50m x 50m: 0.25 Ha) and the
regeneration and bamboo are collected in square C area (25m x 25m: 0.0625Ha).
L-shaped design
The Sampling unit is composed by a strip of 15m wide to the left and right of a center line
which runs 175 meters in East-West and North-South Direction. It is distributed
systematically in a grid of 3 km x 3 km in the forest area with a sampling intensity 0.11
percent. The strip has an Inverted L-shape and is divided into seven units of size 30m x
50m equal to 1.05 ha as shown in figure.
In the three special sample plots (15 meters radius circular plots numbered 1, 4 and 7 as
in the figure, trees having diameters of 10 cm and above are enumerated. In the special
circular plots, the enumerated trees are also labelled with aluminum tags and their
position is recorded. (Source: Brief on National Forest Inventory, NFI, Forest Resources
Development Service, Rome, June 2007)
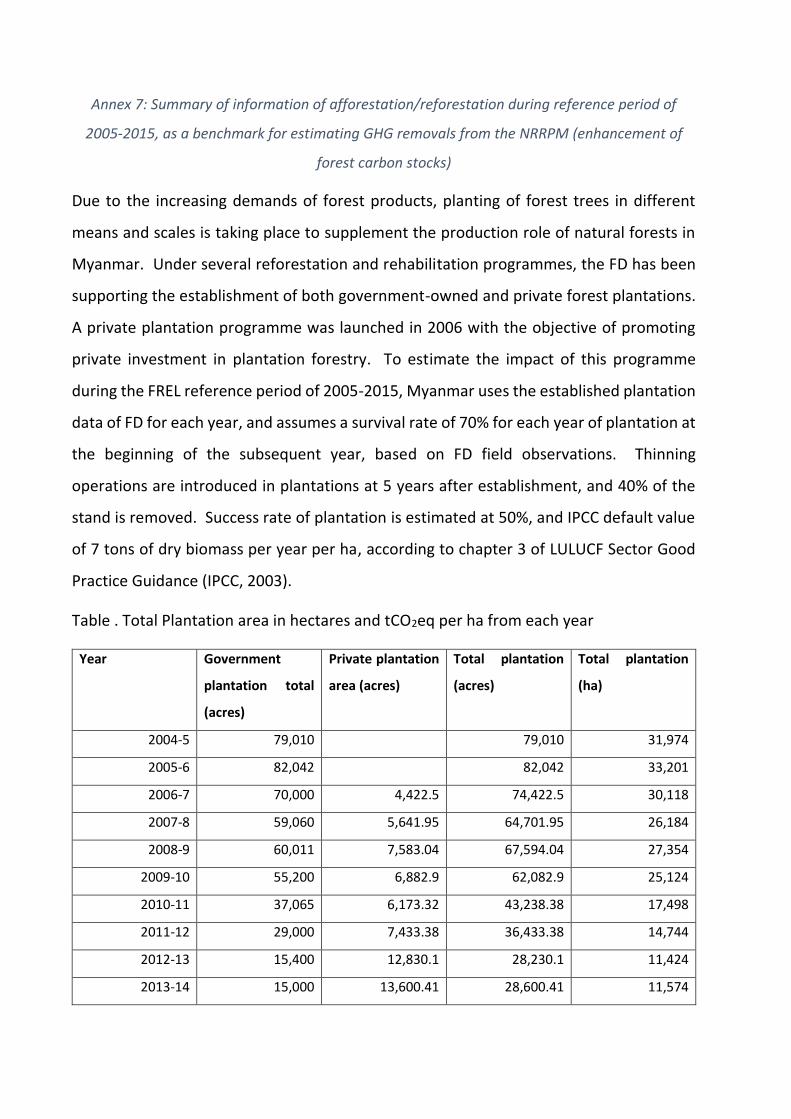
Annex 7: Summary of information of afforestation/reforestation during reference period of
2005-2015, as a benchmark for estimating GHG removals from the NRRPM (enhancement of
forest carbon stocks)
Due to the increasing demands of forest products, planting of forest trees in different
means and scales is taking place to supplement the production role of natural forests in
Myanmar. Under several reforestation and rehabilitation programmes, the FD has been
supporting the establishment of both government-owned and private forest plantations.
A private plantation programme was launched in 2006 with the objective of promoting
private investment in plantation forestry. To estimate the impact of this programme
during the FREL reference period of 2005-2015, Myanmar uses the established plantation
data of FD for each year, and assumes a survival rate of 70% for each year of plantation at
the beginning of the subsequent year, based on FD field observations. Thinning
operations are introduced in plantations at 5 years after establishment, and 40% of the
stand is removed. Success rate of plantation is estimated at 50%, and IPCC default value
of 7 tons of dry biomass per year per ha, according to chapter 3 of LULUCF Sector Good
Practice Guidance (IPCC, 2003).
Table . Total Plantation area in hectares and tCO2eq per ha from each year
Year Government
plantation total
(acres)
Private plantation
area (acres)
Total plantation
(acres)
Total plantation
(ha)
2004-5 79,010 79,010 31,974
2005-6 82,042 82,042 33,201
2006-7 70,000 4,422.5 74,422.5 30,118
2007-8 59,060 5,641.95 64,701.95 26,184
2008-9 60,011 7,583.04 67,594.04 27,354
2009-10 55,200 6,882.9 62,082.9 25,124
2010-11 37,065 6,173.32 43,238.38 17,498
2011-12 29,000 7,433.38 36,433.38 14,744
2012-13 15,400 12,830.1 28,230.1 11,424
2013-14 15,000 13,600.41 28,600.41 11,574

2014-5 8,000 12,848.22 20,848.22 8,437
Total 587,203.82 237,633
Table . Estimation on the tCO2eq of the established Plantation area
Year Total biomass in
tons
Tons carbon tCO2eq Notes
2004-5 15,486,561 7,278,683.72 26,669,097.14
2005-6 12,782,490 6,007,770.43 22,012,470.84
2006-7 9,847,096 4,458,935.28 16,337,538.87
2007-8 6,598,366 3,101,232.10 11,362,914.42
2008-9 5,361,459 2,519,885.67 9,232,861.08
2009-10 3,693,243 1,735,824.01 6,360,059.16
2010-11 1,837,285 863,524.12 3,163,952.36
2011-12 1,032,086 485,080.55 1,777,335.15
2012-13 479,822 225,516.37 826,291.97
2013-14 243,058 114,237.30 418,565.45
2014-15 59,059 27,757.69 101,704.19
Total 57,060,526 26,818,447 98,262,791 Total Removal for 10 years
Average /year 9,826,279 tCO2eq per year
For conversion of the targets of the 10-year NRRPM in terms of GHG removal, the
following activities were selected (by reason of ease of assignment of a C value):
Forest plantations by the government (commercial, watershed, mangrove,
fuelwood, mountain, other greening purposes)
Forest plantations by private actors (teak and other hardwoods)
Establishment of community forests
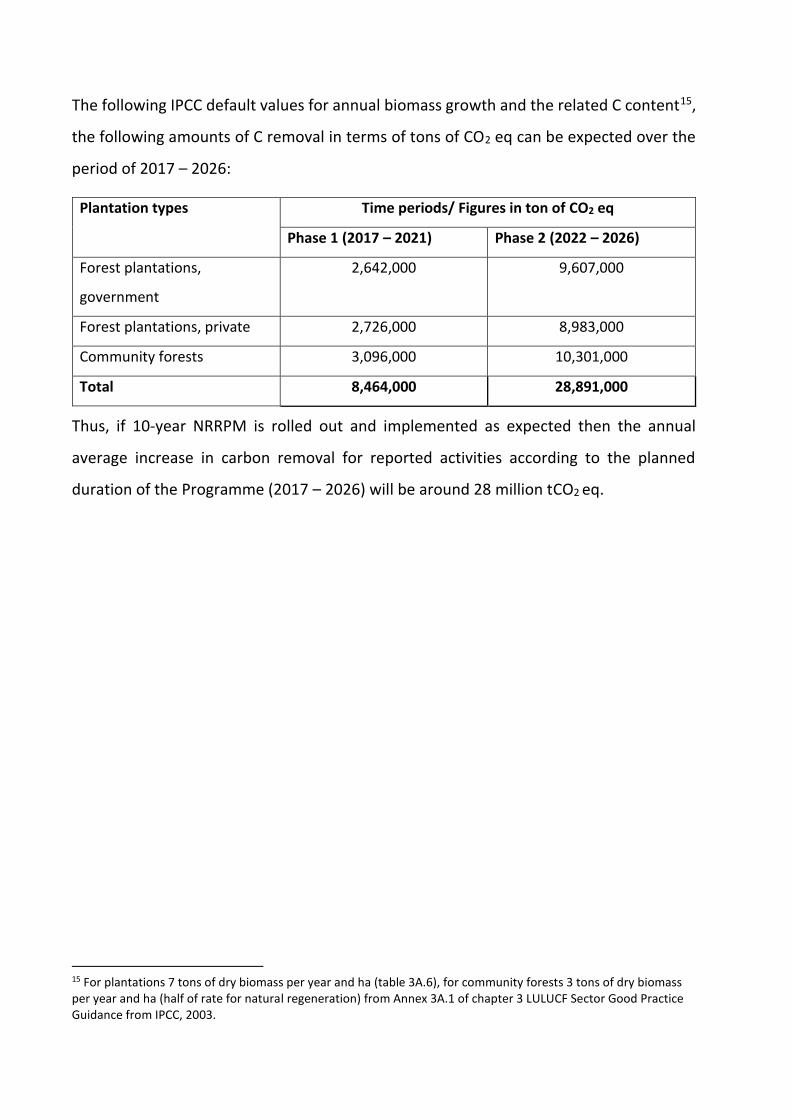
The following IPCC default values for annual biomass growth and the related C content15,
the following amounts of C removal in terms of tons of CO2 eq can be expected over the
period of 2017 – 2026:
Plantation types Time periods/ Figures in ton of CO2 eq
Phase 1 (2017 – 2021) Phase 2 (2022 – 2026)
Forest plantations,
government
2,642,000 9,607,000
Forest plantations, private 2,726,000 8,983,000
Community forests 3,096,000 10,301,000
Total 8,464,000 28,891,000
Thus, if 10-year NRRPM is rolled out and implemented as expected then the annual
average increase in carbon removal for reported activities according to the planned
duration of the Programme (2017 – 2026) will be around 28 million tCO2 eq.
15 For plantations 7 tons of dry biomass per year and ha (table 3A.6), for community forests 3 tons of dry biomass per year and ha (half of rate for natural regeneration) from Annex 3A.1 of chapter 3 LULUCF Sector Good Practice Guidance from IPCC, 2003.