Embed Size (px)
Citation preview

Forensic Testing of Stone Matrix Asphalt Rubber Material
FINAL REPORT March 2010
Submitted by
NJDOT Project Manager Eileen Sheehy
Dr. Thomas Bennert
In cooperation with
State of New Jersey Department of Transportation
And U.S. Department of Transportation
Federal Highway Administration
Center for Advanced Infrastructure and Transportation (CAIT) Rutgers, the State University of New Jersey
100 Brett Rd. Piscataway, NJ 08854
SMAR-RU0473

Disclaimer Statement
"The contents of this report reflect the views of the author(s) who is (are) responsible for the facts and the
accuracy of the data presented herein. The contents do not necessarily reflect the official views or policies of the New Jersey Department of Transportation or the Federal Highway Administration. This report does not constitute
a standard, specification, or regulation."
The contents of this report reflect the views of the authors, who are responsible for the facts and the accuracy of the
information presented herein. This document is disseminated under the sponsorship of the Department of Transportation, University Transportation Centers Program, in the interest of
information exchange. The U.S. Government assumes no liability for the contents or use thereof.
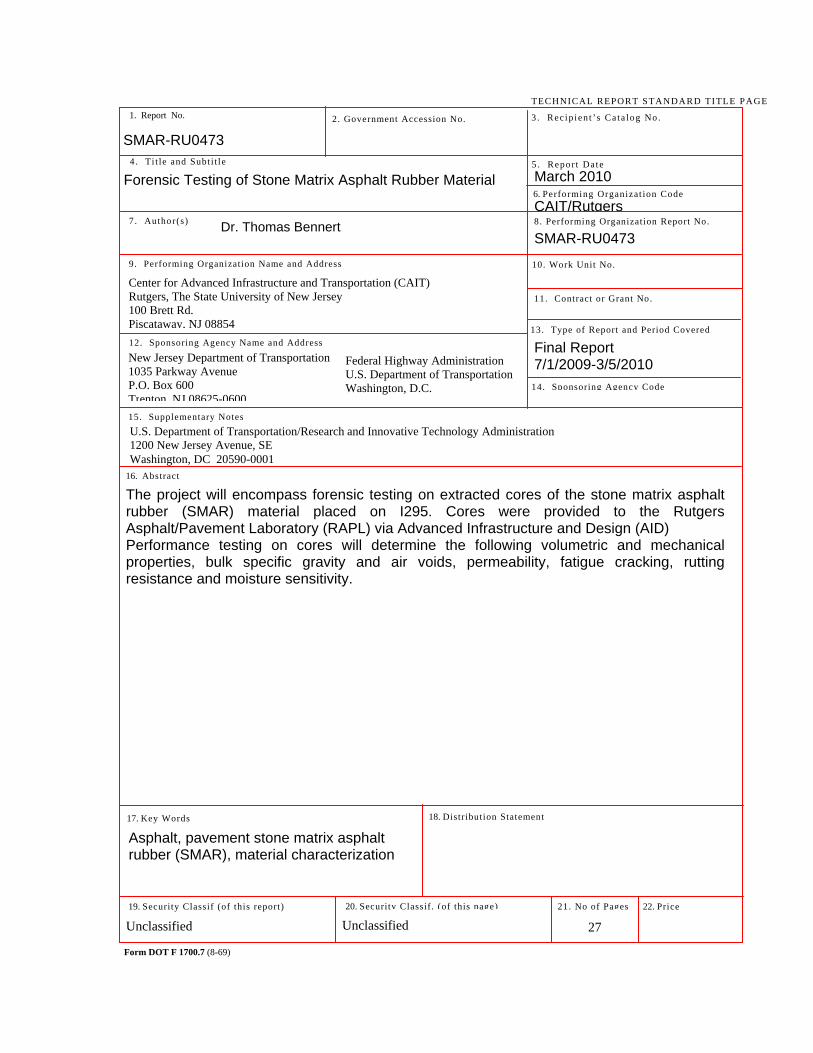
1. Report No. 2. Government Accession No.
TECHNICAL REPORT STANDARD TITLE PAGE
3. Rec ip ien t ’s Ca ta log No .
5 . Repor t Date
8. Performing Organization Report No.
6. Performing Organizat ion Code
4 . Ti t le and Subti t le
7 . Author(s)
9. Performing Organization Name and Address 10. Work Unit No.
11. Contract or Grant No.
13. Type of Report and Period Covered
14. Sponsoring Agency Code
12. Sponsoring Agency Name and Address
15. Supplementary Notes
16. Abstract
17. Key Words
19. Security Classif (of this report)
Form DOT F 1700.7 (8-69)
20. Security Classif. (of this page)
18. Distribution Statement
21. No of Pages 22. Price
March 2010
CAIT/Rutgers
Final Report 7/1/2009-3/5/2010
SMAR-RU0473
Center for Advanced Infrastructure and Transportation (CAIT) Rutgers, The State University of New Jersey 100 Brett Rd. Piscataway, NJ 08854
Federal Highway Administration U.S. Department of Transportation Washington, D.C.
New Jersey Department of Transportation 1035 Parkway Avenue P.O. Box 600 Trenton, NJ 08625-0600
The project will encompass forensic testing on extracted cores of the stone matrix asphalt rubber (SMAR) material placed on I295. Cores were provided to the Rutgers Asphalt/Pavement Laboratory (RAPL) via Advanced Infrastructure and Design (AID) Performance testing on cores will determine the following volumetric and mechanical properties, bulk specific gravity and air voids, permeability, fatigue cracking, rutting resistance and moisture sensitivity.
Asphalt, pavement stone matrix asphalt rubber (SMAR), material characterization
Unclassified Unclassified
27
SMAR-RU0473
Dr. Thomas Bennert
Forensic Testing of Stone Matrix Asphalt Rubber Material
U.S. Department of Transportation/Research and Innovative Technology Administration 1200 New Jersey Avenue, SE Washington, DC 20590-0001

Introduction Enclosed for your review are the preliminary results for the forensic testing conducted on extracted cores of the stone matrix asphalt rubber (SMAR) material placed on I295. Cores were provided to the Rutgers Asphalt/Pavement Laboratory (RAPL) via Advanced Infrastructure and Design (AID) on December 4th, 2009. The cores were provided to RAPL in plastic concrete cylinders to eliminate, as best as possible, any damage that could be caused during transport. Locations of the re-cored areas are found in the Appendix of this report. Immediately upon receipt of the cores, RAPL took photos and measured the thickness of the SMAR lift. For brevity, photos of the cores are not provided in this report. However, they will be provided to NJDOT upon request. The thickness’ of the cores collected are shown in Table 1. The average thickness of the SMAR lift was 1.79 inches with a standard deviation of 0.2 inches. After the layer thickness was measured, performance testing was conducted on various samples to determine the following volumetric and mechanical properties:
o Bulk Specific Gravity and Air Voids; o Permeability (Falling Head Permeability Testing); o Fatigue Cracking (Overlay Tester); o Rutting Resistance (Asphalt Pavement Analyzer); and o Moisture Sensitivity (Tensile Strength Ratio).

Table 1 – Thickness of SMAR from I295
1 2 3 4 Average (mm) (inches)T1 51.06 50.22 48.91 44.03 48.555 1.91T2 41.46 40.88 42.62 37.88 40.71 1.60T3 44.08 44.55 42.52 46.01 44.29 1.74T4 50.57 48.03 52.98 50.42 50.5 1.99T5 50.23 48.61 50.36 50.55 49.9375 1.97T6 40.13 38.13 47.36 40.11 41.4325 1.63T7 47.35 44.21 48.79 45.04 46.3475 1.82T8 41 40.94 45.77 44.73 43.11 1.70T9 38.34 38.49 42.05 38.8 39.42 1.55
T10 49.34 58.53 53.77 55.97 54.4025 2.14T11 47.32 47.83 46.02 52.22 48.3475 1.90T12 42.79 41.89 42.08 43.89 42.6625 1.68T13 49.16 42.24 47.4 46.29 46.2725 1.82T14 42.49 46.33 45.67 49.75 46.06 1.81T15 44.98 44.05 45.29 43.78 44.525 1.75T16 48.9 49.16 45.81 48.35 48.055 1.89T17 47.86 46.68 53.21 51.66 49.8525 1.96T18 52.29 52.05 52.65 53.04 52.5075 2.07T19 46.34 42.79 47.64 46.23 45.75 1.80T20 43.4 42.36 42.47 43.63 42.965 1.69T21 56.64 56.81 53.43 54.14 55.255 2.18T22 49.27 48.53 46.83 49.91 48.635 1.91T23 46.54 45.88 49.45 47.4 47.3175 1.86T24 43.99 40.98 39.65 44.61 42.3075 1.67T25 45.74 44.5 48.43 44.1 45.6925 1.80T26 42.11 38.98 43.41 40.33 41.2075 1.62T27 51.88 51.81 52.39 53.25 52.3325 2.06T28 43.35 42.9 46.1 43.99 44.085 1.74T29 50.77 49.91 48.45 46.34 48.8675 1.92T30 55.9 58.04 56.05 58.42 57.1025 2.25T31 44.86 47.32 42.66 41.54 44.095 1.74T32 38.84 36.63 37.98 40.09 38.385 1.51T33 49.05 47.44 46.12 42.06 46.1675 1.82T34 43.97 47.54 48.23 49.19 47.2325 1.86T35 49.51 46.42 51.4 49.23 49.14 1.93T36 45.61 42.09 46.7 46.67 45.2675 1.78T37 46.57 45.14 48.35 46.3 46.59 1.83T38 50.47 49.12 52.83 46.29 49.6775 1.96T39 48.47 49.51 51.08 49.35 49.6025 1.95T40 54.96 56.07 54.35 56.71 55.5225 2.19T41 46.01 43.72 40.53 44.71 43.7425 1.72T42 49.31 49.11 51.66 53.01 50.7725 2.00T43 41.46 40.06 38.43 39.81 39.94 1.57T44 44.12 40.96 41.85 39.05 41.495 1.63T45 44.37 46.81 46.59 45.91 45.92 1.81T46 38.5 36.78 35.39 35.87 36.635 1.44T47 35.69 35.47 35.77 37.82 36.1875 1.42T48 40.02 41.98 38.06 41.77 40.4575 1.59T49 44.2 45.04 49.7 46.98 46.48 1.83T50 41 42.67 42.01 42.78 42.115 1.66T51 47.94 47.77 44.25 45.02 46.245 1.82T52 35.6 35.86 35.61 33.52 35.1475 1.38T53 43.03 42.25 41.32 43.38 42.495 1.67T54 32.7 35.68 33.98 32.34 33.675 1.33T55 39.66 39.35 41.54 41.79 40.585 1.60
Average 1.79
Std Dev 0.20
Core ID Height Measurements

Bulk Specific Gravity Testing (AASHTO T166 and T331) The bulk specific gravity of the SMAR field cores were measured using two different test procedures; 1) AASHTO T166, Bulk Specific Gravity of Compacted Hot Mix Asphalt (HMA) Using Saturated Surface-Dry Specimens, and 2) AASHTO T331, Bulk Specific Gravity and Density of Compacted Hot Mix Asphalt (HMA) Using Automatic Vacuum Sealing Method. AASHTO T331 was included as this test procedure often results in a more realistic bulk specific gravity determination in porous compacted specimens. The test results for the bulk specific gravity indicated the following:
o AASHTO T166 o Average Bulk Specific Gravity = 2.203 g/cm3 o Standard Deviation = 0.028 g/cm3
o AASHTO T331 o Average Bulk Specific Gravity = 2.163 g/cm3 o Standard Deviation = 0.043 g/cm3
It should be noted that this is based on 48 core samples tested. Although 55 cores were extracted, some cores were left attached to the intermediate course to test for rutting in the Asphalt Pavement Analyzer (APA). As expected with higher air void specimens, AASHTO T331 resulted in lower bulk specific values than AASHTO T166. Comparison of the two test procedures are shown in Figure 1.
y = 1.4552x - 1.042R2 = 0.8875
2.040
2.060
2.080
2.100
2.120
2.140
2.160
2.180
2.200
2.220
2.240
2.260
2.040 2.060 2.080 2.100 2.120 2.140 2.160 2.180 2.200 2.220 2.240 2.260Bulk Specific Gravity (AASHTO 166)
Bul
k Sp
ecifi
c G
ravi
ty (A
ASH
TO T
331)
Figure 1 – Bulk Specific Gravity Measurements Using AASHTO T166 and T331

Similar analysis, with respect to Figure 1, was also conducted plotting the calculated air voids of the cores. The test results are shown in Figure 2. Figure 2 clearly shows the difference in calculated air voids when using either the CoreLok system (AASHTO T331) or the traditional saturated surface dry method (AASHTO T166). On average, AASHTO T166 results in a compacted air void level 17% lower (i.e. – higher density) than when using the CoreLok procedure. This is consistent with other studies that have indicated that the CoreLok procedure will result in more realistic densities when the compacted air voids in the specimens are above 6 to 7%. This is mainly due to water running out of the specimen during the saturated surface dry procedure (AASHTO T166) when surface drying the test specimen.
y = 0.8304xR2 = 0.9087
0123456789
1011121314
0 1 2 3 4 5 6 7 8 9 10 11 12 13 14Compacted Air Voids (Using CoreLok), %
Com
pact
ed A
ir Vo
ids
(Usi
ng T
166)
, %
Figure 2 – Comparison of Calculated Air Voids Between Saturated Surface Dry (AASHTO T166) and CoreLok (AASHTO T331) Test Procedures
The density specification of the NJDOT SMAR for the I295 project was 2 to 7% compacted, in-place air voids. For acceptance, the two procedures would produce very different results. If the NJDOT were to utilize AASHTO T166, which is the current test procedure, only 10 out of the 48 cores (20.8%) would have passed the NJDOT density specification. Meanwhile, if the NJDOT were to utilize AASHTO T331, which is currently not the test procedure used by the NJDOT, only 2 out of the 48 cores (4.2%) would have passed the NJDOT density specification. Falling Head Permeability The permeability of the SMAR cores was measured using the Falling Head Permeability device shown in Figure 3. The permeability properties were especially important as

neither the SMAR nor the stretch of I295 where the SMAR was placed were designed to allow water intrusion.
Figure 3 – Falling Head Permeability (4 and 6 Inch Diameter) for Asphalt Samples
The permeability test results showed that the average permeability of the 50 cores tested for permeability was 2.788 ft/day (9.84 E-4 cm/sec) with a standard deviation of 2.996 ft/day (1.06 E-3 cm/sec). Figure 4 also shows the permeability results of the SMAR cores. When incorporating the permeability criteria currently implemented by the Virginia Department of Transportation (VDOT), 15 of the 50 cores (30%) would have failed the VDOT permeability criteria, indicating the material is too porous. The permeability of the SMAR cores were also plotted against the bulk specific gravity measured by AASHTO T331 (Figure 5). The permeability results clearly show a strong relationship between the bulk specific gravity measured using AASHTO 331 (CoreLok device).

0.01
0.1
1
10
100
T1 T5 T8T11 T14 T18 T21 T24 T28 T32 T35 T38 T42 T45 T49 T53
Perm
eabi
lity
(ft/d
ay)
Virginia DOT Criteria = 3.54 ft/day (125 E-5 cm/sec)
15 Cores Fail VDOT Criteria35 Cores Pass VDOT Criteria
Average Permeability = 2.79 ft/day
Figure 4 – Permeability of SMAR Cores from I295
Figure 5 – Relationship Between Permeability and Bulk Specific Gravity
Bulk Specific Gravity from CoreLok
2.050 2.075 2.100 2.125 2.150 2.175 2.200 2.225 2.250
Perm
eabi
lity
(ft/d
ay)
0123456789
101112131415
⎟⎟
⎠
⎞
⎜⎜
⎝
⎛+
=⎟⎠⎞
⎜⎝⎛
−−
−0.0385
2.0768)(Gmb
e1
20.698(ft/day)ty Permeabili
R2 = 0.89

The compacted air voids, as shown earlier in Figure 2, were plotted against the permeability of the cores and is shown in Figure 6. The data in Figure 6 shows that perhaps the 7% air void level specified by the NJDOT is too conservative when considering the permeability characteristics of the compacted samples. At 7% air voids, the AASHTO T166 samples resulted in a permeability value of 0.4 ft/day, with the AASHTO T331 Gmb procedure resulting in a permeability of 0.15 ft/day. The heavy mastic of the SMAR clearly helped to “clog” the interconnected void structure of the SMAR. This interconnected void structure is what results in water transport through the compacted asphalt specimen. It appears from Figure 6 that the NJDOT could relax the compacted air void specification to 8%, which results in a 1 ft/day permeability when using the AASHTO T166 test procedure, and still be conservatively under the VDOT criteria.
y = 2.19E-07x6.77E+00
R2 = 8.30E-01y = 5.55E-08x7.96E+00
R2 = 8.41E-01
0.01
0.1
1
10
100
0 1 2 3 4 5 6 7 8 9 10 11 12 13 14Air Voids (%)
Perm
eabi
lity
(ft/d
ay)
Gmb Determined with CoreLok
Gmb Determined with AASHTO T166
Virginia DOT Criteria ≤ 3.54 ft/day
Figure 6 – Compacted Air Voids vs Permeability (Only 48 Samples Represented)

Fatigue Cracking Evaluation The fatigue resistance of the SMAR was evaluated using the Overlay Tester in accordance with NJDOT Procedure B-10. The TTI Overlay Tester is a relatively new test method developed by the Texas Transportation Institute, TTI (German and Lytton, 1979; Zhou and Scullion, 2005). The test device simulates the expansion and contraction movements that occur in the joint/crack vicinity of PCC pavements. Although this test procedure is essentially a fatigue-type test, it currently represents the best method to truly simulate horizontal joint movements of PCC pavements in the laboratory (Figure 7).
Figure 7 – Picture of the Overlay Tester (Chamber Door Open)
Sample preparation and test parameters used in this study followed that of NJDOT B-10 testing specifications. These include:
o 15oC (59oF) and 25oC (77oF) test temperature; o Opening width of 0.025 inches; o Cycle time of 10 seconds (5 seconds loading, 5 seconds unloading); and o Specimen failure defined as 93% reduction in Initial Load.
Recent work conducted by the TTI has also shown that the test results of the Overlay Tester correlate very well to wheel path cracking, as compared to the measured wheel-path cracking at the FHWA’s ALF facility (Zhou et al., 2007). The ALF provided an excellent tool for comparison since the pavement structure used in the comparison (Lanes 2 through 6) had the identical pavement structure, HMA thickness, testing temperature and loading conditions (speed and weight). Therefore, the only difference that could have caused a pavement failure was the mixtures themselves.

The Overlay Tester results are shown in Table 2. As expected, the test results indicated that as the test temperature decreases, so does the SMAR’s resistance to fatigue cracking. Additional comparisons were made using a database of different New Jersey surface course mixtures tested within the past 2 years at Rutgers University using the Overlay Tester at 15oC (59oF) (Figure 8). The test results indicate that the SMAR is providing better fatigue resistance than a majority of NJ’s surface course mixes, although not as good as the 9.5mm SMA, AR-OGFC, and HPTO mixes previously tested. This is most likely due to the higher air void level and lower binder content with respect to the original mixture design.
Table 2 – Overlay Tester Results for I295 SMAR
Core T2 67Core T20 260Core T43 126
Core T12 545Core T32 707Core T44 245
77 F 0.025"
Average = 499
59 F 0.025"
Average = 151
SMAR Cores
Sample ID Temp (F) Displacement (inches)
Fatigue Life (cycles)
296
27
210
39
7
16
81
33
756
151
1
10
100
1,000
HPTO 9.5H76 9.5mmSMA
12.5M76 12.5H76 12.5M64 12.5mmSMA
MOGFC-1
AR-OGFC
SMAR
Cyc
les
to F
ailu
re in
Ove
rlay
Test
er
59oF, 0.025" Horizontal Deflection
Figure 8 – Database of Overlay Tester Results for New Jersey Surface Course Mixes

Rutting Resistance The rutting resistance of the SMAR was tested in the Asphalt Pavement Analyzer in accordance to AASHTO TP63. A test temperature of 64oC, hose pressure of 100 psi, and wheel load of 100 lb were used. The test results of the cores are shown in Figure 9 along with the initial mixture design acceptance test results. The APA test results indicate that the SMAR is relatively rut resistant and has similar rutting properties of the original mix design.
64oC Test Temp.; 100psi Hose Pressure; 100 lb Load Load
0.0
1.0
2.0
3.0
4.0
5.0
6.0
7.0
8.0
9.0
10.0
0 1,000 2,000 3,000 4,000 5,000 6,000 7,000 8,000
Number of Loading Cycles
APA
Rut
ting
(mm
)
APA Rutting @ 8,000 Cycles
Earle Asphalt's SMAR (Cores) = 3.63 mm
Earle Asphalt's SMAR (Design Samples) = 2.88 mm
APA Criteria < 3mm Rutting
Figure 9 – Asphalt Pavement Analyzer Results for SMAR Samples
Tensile Strength Ratio (Moisture Susceptibility) The moisture susceptibility of the SMAR was measured using the AASHTO T283 test procedure. Currently, the NJDOT uses an 80% minimum criterion for the tensile strength ratio (TSR). Mixtures falling below the 80% TSR value would technically be classified as having a “stripping potential”. Ten cores were used to determine the moisture susceptibility of the SMAR. Five cores were conditioned, with a freeze-thaw cycle, in accordance to AASHTO T283 and the remaining five cores were unconditioned. The test results are shown in Table 3. Although the compacted air voids of the SMAR cores are higher than air void requirement in AASHTO T283 (6.5 to 7.5%), the average TSR of the SMAR was 75.2%, falling below the 80% requirement set by the NJDOT.

Table 3 – Tensile Strength Ratio (TSR) Results for SMAR
Dry Conditioned Dry Conditioned11.31 9.22 148.8 96.87.01 8.46 124.1 85.410.22 10.50 101.8 84.26.80 7.09 125.6 104.79.95 9.11 116.0 92.59.06 8.88 123.2 92.7
Specimen Type Indirect Tensile Strength Average TSR (%)
SMAR Cores
75.2%AASHTO T283 Conditioned
Average AV (%)
General Recommendations The preliminary test results indicate that the SMAR mechanical properties are generally good with respect to rutting and fatigue cracking resistance. Both the rutting and fatigue cracking properties compare well with “good performing” mixes currently in place in New Jersey. However, the permeability results indicated that the current state of the I295 SMAR is relatively porous with 15 of the 50 tested cores (30%) failing the permeability requirement currently specified by the Virginia Department of Transportation (VDOT). The tensile strength ratio values also indicate that the cores were marginal with respect to the potential for moisture damage. And with the pavement not being designed to allow for lateral drainage of trapped water, it would be prudent to apply some type of “water-proofing” surface over the in-place SMAR to preserve it from moisture and freeze-thaw related damage. A thin-lift application like an Ultra-thin Friction Course would be ideal for this situation. Additional recommendations, based on the work conducted in this study, are:
o Based on the measured permeability of the cores, and comparing them to the measured air voids, the NJDOT may want to “relax” the compacted air void specification of the SMAR from 7% air voids to 8% air voids. The test data clearly indicates that even at 8% air voids, the heavy mastic of the SMAR “clogs” the interconnected voids of the compacted asphalt sample, limiting water penetration.
o NJDOT may want to replace the currently specified AASHTO T166 (Saturated Surface Dry procedure) with AASHTO T331 (CoreLok procedure) for determining the bulk specific gravity of gap-graded mixtures (SMAR and SMA). The main reason for the replacement is that AASHTO T331 will provide a better measurement of the bulk specific gravity of the compacted specimen when air voids are above 6 to 7% than AASHTO T166. Based on the testing conducted in this study, the difference of the compacted air voids, when using AASHTO T166 and AASHTO T331 to determine the bulk specific gravity of the compacted specimen, was 15% (i.e. – AASHTO T166 resulted in bulk specific gravity values 15% higher than AASHTO T331).

APPENDIX – CORE LOCATIONS

One Crossroads Drive • Hamilton, NJ 08691 • (v) 609.838.2216 • (f) 609.586.1301
www.aidpe.com
LETTER OF TRANSMITTAL
Date: December 4, 2009
Job Number: 1437N
Attention: Tom Bennert
Reference: Rt. 295 NB/SB from Rt. 29/195 to Rt. 130
TO: Thomas Bennert
Rutgers University
93 Road 1
Piscataway, NJ 08854
The following documents are being transmitted:
COPIES DATE DESCRIPTION
1 12-4-09 Table with Core Locations
For Approval For Your Use As Requested Review & Comment
Return For Bids Due Other
SIGNED: Thomas M. Lombardi
Thomas Lombardi
Project Engineer
X
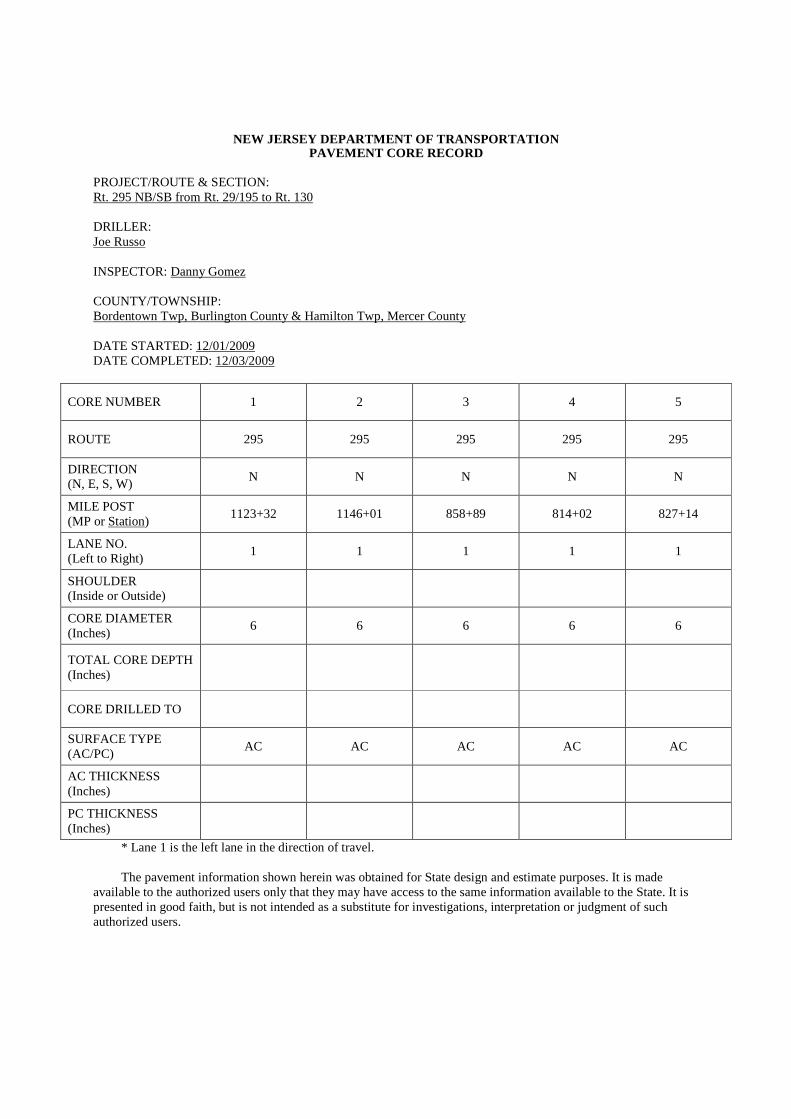
NEW JERSEY DEPARTMENT OF TRANSPORTATION
PAVEMENT CORE RECORD PROJECT/ROUTE & SECTION: Rt. 295 NB/SB from Rt. 29/195 to Rt. 130 DRILLER: Joe Russo INSPECTOR: Danny Gomez COUNTY/TOWNSHIP: Bordentown Twp, Burlington County & Hamilton Twp, Mercer County DATE STARTED: 12/01/2009 DATE COMPLETED: 12/03/2009
CORE NUMBER 1 2 3 4 5
ROUTE 295 295 295 295 295
DIRECTION (N, E, S, W)
N N N N N
MILE POST (MP or Station)
1123+32 1146+01 858+89 814+02 827+14
LANE NO. (Left to Right)
1 1 1 1 1
SHOULDER (Inside or Outside)
CORE DIAMETER (Inches)
6 6 6 6 6
TOTAL CORE DEPTH (Inches)
CORE DRILLED TO
SURFACE TYPE (AC/PC)
AC AC AC AC AC
AC THICKNESS (Inches)
PC THICKNESS (Inches)
* Lane 1 is the left lane in the direction of travel.
The pavement information shown herein was obtained for State design and estimate purposes. It is made available to the authorized users only that they may have access to the same information available to the State. It is presented in good faith, but is not intended as a substitute for investigations, interpretation or judgment of such authorized users.

NEW JERSEY DEPARTMENT OF TRANSPORTATION PAVEMENT CORE RECORD
PROJECT/ROUTE & SECTION: Rt. 295 NB/SB from Rt. 29/195 to Rt. 130 DRILLER: Joe Russo INSPECTOR: Danny Gomez COUNTY/TOWNSHIP: Bordentown Twp, Burlington County & Hamilton Twp, Mercer County DATE STARTED: 12/01/2009 DATE COMPLETED: 12/03/2009
CORE NUMBER 6 7 8 9 10
ROUTE 295 295 295 295 295
DIRECTION (N, E, S, W)
N N N N N
MILE POST (MP or Station)
749+14 763+92 778+78 790+04 798+95
LANE NO. (Left to Right)
1 1 1 1 1
SHOULDER (Inside or Outside)
CORE DIAMETER (Inches)
6 6 6 6 6
TOTAL CORE DEPTH (Inches)
CORE DRILLED TO
SURFACE TYPE (AC/PC)
AC AC AC AC AC
AC THICKNESS (Inches)
PC THICKNESS (Inches)
* Lane 1 is the left lane in the direction of travel.
The pavement information shown herein was obtained for State design and estimate purposes. It is made available to the authorized users only that they may have access to the same information available to the State. It is presented in good faith, but is not intended as a substitute for investigations, interpretation or judgment of such authorized users.

NEW JERSEY DEPARTMENT OF TRANSPORTATION PAVEMENT CORE RECORD
PROJECT/ROUTE & SECTION: Rt. 295 NB/SB from Rt. 29/195 to Rt. 130 DRILLER: Joe Russo INSPECTOR: Danny Gomez COUNTY/TOWNSHIP: Bordentown Twp, Burlington County & Hamilton Twp, Mercer County DATE STARTED: 12/01/2009 DATE COMPLETED: 12/03/2009
CORE NUMBER 11 12 13 14 15
ROUTE 295 295 295 295 295
DIRECTION (N, E, S, W)
S S S S S
MILE POST (MP or Station)
743+45 751.47 760+06 774+68 790+09
LANE NO. (Left to Right)
1 1 1 1 1
SHOULDER (Inside or Outside)
CORE DIAMETER (Inches)
6 6 6 6 6
TOTAL CORE DEPTH (Inches)
CORE DRILLED TO
SURFACE TYPE (AC/PC)
AC AC AC AC AC
AC THICKNESS (Inches)
PC THICKNESS (Inches)
* Lane 1 is the left lane in the direction of travel.
The pavement information shown herein was obtained for State design and estimate purposes. It is made available to the authorized users only that they may have access to the same information available to the State. It is presented in good faith, but is not intended as a substitute for investigations, interpretation or judgment of such authorized users.

NEW JERSEY DEPARTMENT OF TRANSPORTATION PAVEMENT CORE RECORD
PROJECT/ROUTE & SECTION: Rt. 295 NB/SB from Rt. 29/195 to Rt. 130 DRILLER: Joe Russo INSPECTOR: Danny Gomez COUNTY/TOWNSHIP: Bordentown Twp, Burlington County & Hamilton Twp, Mercer County DATE STARTED: 12/01/2009 DATE COMPLETED: 12/03/2009
CORE NUMBER 16 17 18 19 20
ROUTE 295 295 295 295 295
DIRECTION (N, E, S, W)
S S S S S
MILE POST (MP or Station)
866+70 1133+00 1143+83 1121+91 1130+56
LANE NO. (Left to Right)
1 1 1 1 1
SHOULDER (Inside or Outside)
CORE DIAMETER (Inches)
6 6 6 6 6
TOTAL CORE DEPTH (Inches)
CORE DRILLED TO
SURFACE TYPE (AC/PC)
AC AC AC AC AC
AC THICKNESS (Inches)
PC THICKNESS (Inches)
* Lane 1 is the left lane in the direction of travel.
The pavement information shown herein was obtained for State design and estimate purposes. It is made available to the authorized users only that they may have access to the same information available to the State. It is presented in good faith, but is not intended as a substitute for investigations, interpretation or judgment of such authorized users.
NEW JERSEY DEPARTMENT OF TRANSPORTATION PAVEMENT CORE RECORD
PROJECT/ROUTE & SECTION: Rt. 295 NB/SB from Rt. 29/195 to Rt. 130 DRILLER: Joe Russo INSPECTOR: Danny Gomez COUNTY/TOWNSHIP: Bordentown Twp, Burlington County & Hamilton Twp, Mercer County DATE STARTED: 12/01/2009 DATE COMPLETED: 12/03/2009
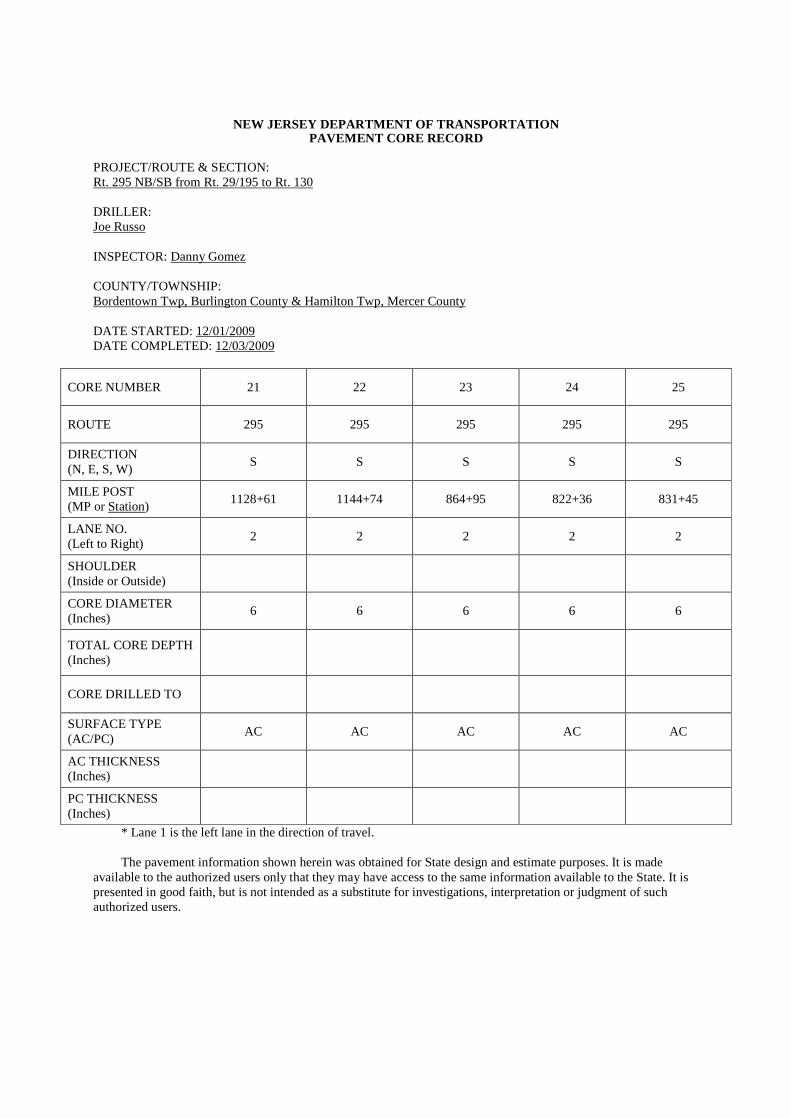
CORE NUMBER 21 22 23 24 25
ROUTE 295 295 295 295 295
DIRECTION (N, E, S, W)
S S S S S
MILE POST (MP or Station)
1128+61 1144+74 864+95 822+36 831+45
LANE NO. (Left to Right)
2 2 2 2 2
SHOULDER (Inside or Outside)
CORE DIAMETER (Inches)
6 6 6 6 6
TOTAL CORE DEPTH (Inches)
CORE DRILLED TO
SURFACE TYPE (AC/PC)
AC AC AC AC AC
AC THICKNESS (Inches)
PC THICKNESS (Inches)
* Lane 1 is the left lane in the direction of travel.
The pavement information shown herein was obtained for State design and estimate purposes. It is made available to the authorized users only that they may have access to the same information available to the State. It is presented in good faith, but is not intended as a substitute for investigations, interpretation or judgment of such authorized users.

NEW JERSEY DEPARTMENT OF TRANSPORTATION PAVEMENT CORE RECORD
PROJECT/ROUTE & SECTION: Rt. 295 NB/SB from Rt. 29/195 to Rt. 130 DRILLER: Joe Russo INSPECTOR: Danny Gomez COUNTY/TOWNSHIP: Bordentown Twp, Burlington County & Hamilton Twp, Mercer County DATE STARTED: 12/01/2009 DATE COMPLETED: 12/03/2009
CORE NUMBER 26 27 28 29 30
ROUTE 295 295 295 295 295
DIRECTION (N, E, S, W)
N N N N S
MILE POST (MP or Station)
752+57 763+52 775+50 800+90 725+83
LANE NO. (Left to Right)
2 2 2 2 2
SHOULDER (Inside or Outside)
CORE DIAMETER (Inches)
6 6 6 6 6
TOTAL CORE DEPTH (Inches)
CORE DRILLED TO
SURFACE TYPE (AC/PC)
AC AC AC AC AC
AC THICKNESS (Inches)
PC THICKNESS (Inches)
* Lane 1 is the left lane in the direction of travel.
The pavement information shown herein was obtained for State design and estimate purposes. It is made available to the authorized users only that they may have access to the same information available to the State. It is presented in good faith, but is not intended as a substitute for investigations, interpretation or judgment of such authorized users.

NEW JERSEY DEPARTMENT OF TRANSPORTATION PAVEMENT CORE RECORD
PROJECT/ROUTE & SECTION: Rt. 295 NB/SB from Rt. 29/195 to Rt. 130 DRILLER: Joe Russo INSPECTOR: Danny Gomez COUNTY/TOWNSHIP: Bordentown Twp, Burlington County & Hamilton Twp, Mercer County DATE STARTED: 12/01/2009 DATE COMPLETED: 12/03/2009
CORE NUMBER 31 32 33 34 35
ROUTE 295 295 295 295 295
DIRECTION (N, E, S, W)
S S S S S
MILE POST (MP or Station)
752+14 758+46 767+55 787+71 798+43
LANE NO. (Left to Right)
2 2 2 2 2
SHOULDER (Inside or Outside)
CORE DIAMETER (Inches)
6 6 6 6 6
TOTAL CORE DEPTH (Inches)
CORE DRILLED TO
SURFACE TYPE (AC/PC)
AC AC AC AC AC
AC THICKNESS (Inches)
PC THICKNESS (Inches)
* Lane 1 is the left lane in the direction of travel.
The pavement information shown herein was obtained for State design and estimate purposes. It is made available to the authorized users only that they may have access to the same information available to the State. It is presented in good faith, but is not intended as a substitute for investigations, interpretation or judgment of such authorized users.

NEW JERSEY DEPARTMENT OF TRANSPORTATION PAVEMENT CORE RECORD
PROJECT/ROUTE & SECTION: Rt. 295 NB/SB from Rt. 29/195 to Rt. 130 DRILLER: Joe Russo INSPECTOR: Danny Gomez COUNTY/TOWNSHIP: Bordentown Twp, Burlington County & Hamilton Twp, Mercer County DATE STARTED: 12/01/2009 DATE COMPLETED: 12/03/2009
CORE NUMBER 36 37 38 39 40
ROUTE 295 295 295 295 295
DIRECTION (N, E, S, W)
N N N N N
MILE POST (MP or Station)
1139+46 818+68 837+23 774+87 797+45
LANE NO. (Left to Right)
3 3 3 3 3
SHOULDER (Inside or Outside)
CORE DIAMETER (Inches)
6 6 6 6 6
TOTAL CORE DEPTH (Inches)
CORE DRILLED TO
SURFACE TYPE (AC/PC)
AC AC AC AC AC
AC THICKNESS (Inches)
PC THICKNESS (Inches)
* Lane 1 is the left lane in the direction of travel.
The pavement information shown herein was obtained for State design and estimate purposes. It is made available to the authorized users only that they may have access to the same information available to the State. It is presented in good faith, but is not intended as a substitute for investigations, interpretation or judgment of such authorized users.

NEW JERSEY DEPARTMENT OF TRANSPORTATION PAVEMENT CORE RECORD
PROJECT/ROUTE & SECTION: Rt. 295 NB/SB from Rt. 29/195 to Rt. 130 DRILLER: Joe Russo INSPECTOR: Danny Gomez COUNTY/TOWNSHIP: Bordentown Twp, Burlington County & Hamilton Twp, Mercer County DATE STARTED: 12/01/2009 DATE COMPLETED: 12/03/2009
CORE NUMBER 41 42 43 44 45
ROUTE 295 295 295 295 295
DIRECTION (N, E, S, W)
N S S S S
MILE POST (MP or Station)
728+23 743+32 758+26 773+37 792+57
LANE NO. (Left to Right)
3 3 3 3 3
SHOULDER (Inside or Outside)
CORE DIAMETER (Inches)
6 6 6 6 6
TOTAL CORE DEPTH (Inches)
CORE DRILLED TO
SURFACE TYPE (AC/PC)
AC AC AC AC AC
AC THICKNESS (Inches)
PC THICKNESS (Inches)
* Lane 1 is the left lane in the direction of travel.
The pavement information shown herein was obtained for State design and estimate purposes. It is made available to the authorized users only that they may have access to the same information available to the State. It is presented in good faith, but is not intended as a substitute for investigations, interpretation or judgment of such authorized users.

NEW JERSEY DEPARTMENT OF TRANSPORTATION PAVEMENT CORE RECORD
PROJECT/ROUTE & SECTION: Rt. 295 NB/SB from Rt. 29/195 to Rt. 130 DRILLER: Joe Russo INSPECTOR: Danny Gomez COUNTY/TOWNSHIP: Bordentown Twp, Burlington County & Hamilton Twp, Mercer County DATE STARTED: 12/01/2009 DATE COMPLETED: 12/03/2009
CORE NUMBER 46 47 48 49 50
ROUTE 295 295 295 295 295
DIRECTION (N, E, S, W)
S S S S S
MILE POST (MP or Station)
816+02 822+63 863+99 1121+37 1137+79
LANE NO. (Left to Right)
2 2 2 2 2
SHOULDER (Inside or Outside)
CORE DIAMETER (Inches)
6 6 6 6 6
TOTAL CORE DEPTH (Inches)
CORE DRILLED TO
SURFACE TYPE (AC/PC)
AC AC AC AC AC
AC THICKNESS (Inches)
PC THICKNESS (Inches)
* Lane 1 is the left lane in the direction of travel.
The pavement information shown herein was obtained for State design and estimate purposes. It is made available to the authorized users only that they may have access to the same information available to the State. It is presented in good faith, but is not intended as a substitute for investigations, interpretation or judgment of such authorized users.

NEW JERSEY DEPARTMENT OF TRANSPORTATION PAVEMENT CORE RECORD
PROJECT/ROUTE & SECTION: Rt. 295 NB/SB from Rt. 29/195 to Rt. 130 DRILLER: Joe Russo INSPECTOR: Danny Gomez COUNTY/TOWNSHIP: Bordentown Twp, Burlington County & Hamilton Twp, Mercer County DATE STARTED: 12/01/2009 DATE COMPLETED: 12/03/2009
CORE NUMBER 51 52 53 54 55
ROUTE 295 295 295 295 295
DIRECTION (N, E, S, W)
S S S S S
MILE POST (MP or Station)
808+33 826+41 865+64 1119+27 1133+40
LANE NO. (Left to Right)
3 3 3 3 3
SHOULDER (Inside or Outside)
CORE DIAMETER (Inches)
6 6 6 6 6
TOTAL CORE DEPTH (Inches)
CORE DRILLED TO
SURFACE TYPE (AC/PC)
AC AC AC AC AC
AC THICKNESS (Inches)
PC THICKNESS (Inches)
* Lane 1 is the left lane in the direction of travel.
The pavement information shown herein was obtained for State design and estimate purposes. It is made available to the authorized users only that they may have access to the same information available to the State. It is presented in good faith, but is not intended as a substitute for investigations, interpretation or judgment of such authorized users.