Embed Size (px)
Citation preview
RESEARCH SEMINAR IN INTERNATIONAL ECONOMICS
Gerald R. Ford School of Public Policy The University of Michigan
Ann Arbor, Michigan 48109-3091
Discussion Paper No. 590
Foreign Ownership and Firm Performance: Emerging Market Acquisitions in the United States
Anusha Chari University of North Carolina
Wenjie Chen
University of Michigan
Kathryn Dominguez University of Michigan & NBER
May 2009
Recent RSIE Discussion Papers are available on the World Wide Web at: http://www.fordschool.umich.edu/rsie/workingpapers/wp.html
NBER WORKING PAPER SERIES
FOREIGN OWNERSHIP AND FIRM PERFORMANCE:EMERGING-MARKET ACQUISITIONS IN THE UNITED STATES
Anusha ChariWenjie Chen
Kathryn M.E. Dominguez
Working Paper 14786http://www.nber.org/papers/w14786
NATIONAL BUREAU OF ECONOMIC RESEARCH1050 Massachusetts Avenue
Cambridge, MA 02138March 2009
We thank Patricia Dechow, Jeff Smith, Jim Levinsohn, James Hines, Paolo Pasquariello, Matias Busso,Taryn Dinkelman, Dean Yang, Nirvikar Singh, and participants in the UM Development seminar,the UM IPC lunch group, the NIPFP conference at the Indian Ministry of Finance, the Australian Treasury,the Reserve Bank of Australia, and North Carolina State University for helpful comments and advice.We are grateful to the International Policy Center at the Ford School of Public Policy for financialsupport. The views expressed herein are those of the author(s) and do not necessarily reflect the viewsof the National Bureau of Economic Research.
© 2009 by Anusha Chari, Wenjie Chen, and Kathryn M.E. Dominguez. All rights reserved. Shortsections of text, not to exceed two paragraphs, may be quoted without explicit permission providedthat full credit, including © notice, is given to the source.

Foreign Ownership and Firm Performance: Emerging-Market Acquisitions in the United StatesAnusha Chari, Wenjie Chen, and Kathryn M.E. DominguezNBER Working Paper No. 14786March 2009, Revised May 2009JEL No. F21,F23,G34
ABSTRACT
This paper examines the recent upsurge in foreign acquisitions of U.S. firms, specifically focusingon acquisitions made by firms located in emerging markets. Neoclassical theory predicts that, on net,capital should flow from countries that are capital-abundant to countries that are capital-scarce. Yetincreasingly emerging market firms are acquiring assets in developed countries. Using transaction-specificacquisition data and firm-level accounting data we evaluate the post-acquisition performance of publiclytraded U.S. firms that have been acquired by firms from emerging markets over the period 1980-2007.Our empirical methodology uses a difference-in-differences approach combined with propensity scorematching to create an appropriate control group of non-acquired firms. The results suggest that emergingcountry acquirers tend to choose U.S. targets that are larger in size (measured as sales, total assetsand employment), relative to matched non-acquired U.S. firms before the acquisition year. In the yearsfollowing the acquisition, sales and employment decline while profitability rises, suggesting significantrestructuring of the target firms.
Anusha Chari301 Gardner HallCB#3305, Department of EconomicsUniversity of North Carolina at Chapel HillChapel Hill, NC 27599and [email protected]
Wenjie ChenDepartment of EconomicsLorch HallUniversity of MichiganAnn Arbor, MI [email protected]
Kathryn M.E. DominguezUniversity of MichiganDepartment of Economics and Ford SchoolWeill HallAnn Arbor, MI 48109and [email protected]
1
1. Introduction
This paper examines the recent upsurge in foreign acquisitions of U.S. firms, specifically
focusing on acquisitions made by firms located in emerging markets. Neoclassical theory predicts that,
on net, capital should flow from countries that are capital-abundant to countries that are capital-scarce.1
Yet increasingly emerging-market firms are acquiring assets in the developed world. In particular, the
recent spate of cross-border acquisitions by Indian and Chinese companies is the subject of heated debate
in policy circles. For example, the acquisition bid by CNOOC, the Chinese state-owned oil company, to
takeover Unocal met with considerable resistance in Washington and was ultimately thwarted. This paper
provides a systematic analysis of what happens to U.S. firms when emerging-market acquisitions are
successfully completed. Using transaction-specific acquisition data and firm-level accounting data, the
goal of this study is to determine how U.S. firms that are acquired by firms from emerging markets fare
relative to their non-acquired counterparts.
Evidence from developed-market foreign direct investment (FDI) flows to emerging markets
suggests that foreign ownership is associated with improvements in plant productivity (Aitken and
Harrision, 1999, Perez-Gonzales, 2005, Arnold and Javorcik, 2005, Petkova, 2007).2 The sources of
productivity gains are generally attributed to the ability of foreign multinationals to transfer superior
technology, bring organizational capital and provide access to international capital markets (Caves, 1996).
In the case of recent emerging-market acquisitions, while the role of sovereign wealth funds and the
build-up of U.S. dollar reserves in emerging-markets are seen as motivations for acquisitions in
developed-markets, the productivity-improving role of technology transfers from emerging- to developed-
markets are not obvious.
Traditional theories of FDI also rely on comparative input costs or market access as the
motivating rationale for investment flows from developed to emerging markets. Whereas industrial
country acquirers often seek lower labor costs in emerging-markets, emerging-market acquirers may
relocate (or insource) manufacturing activity while keeping existing distribution networks in the host
country of the acquired business. These differences in motivation for FDI may, in turn, suggest that the
post-acquisition performance of target firms will be influenced by the country of origin of the acquiring
firm.
1 According to estimates by the International Monetary Fund (IMF), the developing economies as a group had a current account surplus of $640 billion in 2007 (IMF, 2007). Because the financial counterpart to this surplus is a deficit on the financial accounts, it represents the net capital outflow to the industrial economies. Just two years earlier, in 2005, net capital flowed in the other direction (the developing economies as a group reported a gross capital inflow of $720 billion). 2 FDI includes “Greenfield” investment in new assets in a foreign country, and acquisition of pre-existing foreign assets (also termed “Brownfield” investment).
2
The most common motivations for overseas expansions by emerging-market firms include: 1)
entering new markets, 2) obtaining natural resources, and 3) acquiring advanced technology and related
brand equity.3 An example which highlights these factors is Lenovo's 2004 purchase of IBM's personal
computer business. This acquisition involved entry into the U.S. market, acquisition of technology, and of
an established brand.4 Even unsuccessful acquisitions, such as CNOOC's bid for Unocal, point to
emerging market demand for natural resources.
The transaction-specific data on cross-border Mergers and Acquisitions (M&As) used in this
paper come from the Thompson Financial SDC Platinum database that records all M&As involving U.S.
firms that were announced between January 1, 1980 and July 1, 2007. We focus on publicly traded U.S.
targets both because open financial markets in the U.S. have led to a substantial number of cross-border
M&As, and because public U.S. firms are required to disclose detailed accounting data. It is also worth
noting that Forbes (2008) finds evidence that foreigners hold greater shares of their investment portfolios
in the United States if they have less developed financial markets, suggesting that our focus on FDI by
emerging market firms may provide insights into the implications of broader investment trends into the
U.S.
The work that follows complements the existing literature on post-acquisition firm performance.
The focus on acquisitions made by emerging country firms allows us to test the general applicability of
theories of FDI flows for firms in apparently capital scarce markets.
To evaluate the impact of emerging-country acquisitions on U.S. firm performance we examine
both stock market and accounting measures. The stock market measure, abnormal announcement returns,
provides a forward-looking estimate of expected shareholder value creation. After the acquisition has
taken place accounting measures of profitability, investment, sales and employment allow us to evaluate
the ex post performance of U.S. targets.
The first empirical challenge we face in estimating post-acquisition performance is one of
causality versus selection. Are emerging-market firms simply picking certain types of acquisition targets
or do foreign acquisitions change target-firm performance? There is some evidence in the literature of
how acquirers select targets. In particular, the Froot and Stein (1991) model shows that asymmetric
information could lead foreign firms to buy U.S. firms in times when the value of the U.S. dollar is low
relative to the foreign currency. They provide empirical evidence of a negative relationship between the
value of the dollar and FDI flows into the U.S. using aggregate FDI data, and this relationship is also
explored in Chen (2008b) using more detailed firm-level data. Harris and Ravenscraft (1990) find
3 See reports by Citigroup (2005) and Boston Consulting Group (2005). 4 Lenovo had the right to use the IBM brand for five years, but actually dropped it after three years, apparently because its own brand name was already so well established.
3
evidence that foreign firms prefer technology-intensive industries and Slaughter (2007) describes how
U.S. states differ in their incentive packages and taxes with regards to foreign acquirers.5 We also find
evidence of selection in that emerging country firms tend to acquire public U.S. targets with relatively
high levels of sales, employment and total assets.
Crucial to any comparison between pre-and post-acquisition performance of target firms is
therefore the issue of selecting an appropriate expected performance benchmark in the absence of the
acquisition (Andrade et. al., 2001). The fact is that some firms get acquired while others do not. Ideally,
one would like to compare the performance of a firm that receives foreign investment to the performance
of the firm’s identical twin with no foreign investment.6
In this paper we ask the counterfactual question: what would have happened to those firms that
did, in fact, receive foreign ownership, if they had not received it? While this exact counterfactual is not
typically observable, propensity score matching, which involves selecting a “control” group of non-
acquired firms closely matched to the “treatment” group of acquired firms, is one way to artificially create
sets of such twins. Propensity score matching can then be combined with difference-in-differences
estimates to further eliminate time-invariant and unobservable differences between the acquired and non-
acquired firms.
In order to measure the performance of U.S. target firms after they are acquired, we focus on the
accounting measure of operating income before depreciation, amortization and taxes (OIBD). In order to
control for the relative size of the target firm, we scale OIBD by total assets, thus focusing on return on
assets (ROA). We also track changes in other aspects of target firm operations, such as investment,
employment, and sales following the acquisition.
We find that the stock price response of target firms is positive and significant around the time of
acquisition announcement. Average cumulative returns on the target stock price within a three-day
window around the announcement date of the acquisition increase by 8%. This return remains significant
and positive when we extend the window to ten and twenty-one business days.
Correspondingly, we find that after acquisition the performance of acquired targets tends to
improve. The target firm's return on assets increases by 16% in the five years following acquisition.
Further, there is strong evidence that acquiring firms undertake significant restructuring of target firms.
Measures of employment, sales and plant, property and equipment in the target firms decrease in the years
after acquisition.
5 At the Federal level there were few legal restrictions on FDI into the United States during the time period studied here, although more stringent laws were recently put into place in order to restrict FDI that threatens U.S. “national security”; these restrictions came into effect in 2007. See: http://www.ustreas.gov/offices/international-affairs/cfius/ 6 An alternative question, which is explored in Chen (2008a), is whether, given that a firm is acquired, the country of origin of the acquirer matters (so that the control group is other acquired firms rather than non-acquired firms).

4
The pattern of increasing profitability (income/assets) and declining sales is consistent with
improvements in firm-efficiency following acquisition. For instance if firms shut down or get rid of
unprofitable divisions, sales would go down but profits as a percent of assets would increase. Also,
declining employment and net PP&E suggest downsizing of divisions to improve overall profitability as a
percent of assets. Declining sales in the target firms along with the downsizing of employment are also
consistent with the comparative input cost hypothesis where acquirers from emerging-markets may be in
the position to exploit the low wages in their home countries by downsizing labor-intensive activities in
the foreign country following the acquisition.
The remainder of the paper is structured as follows. Section 2 reviews the existing literature.
Section 3 introduces the various datasets employed in the empirical analysis. The details of the difference-
in-differences propensity score matching estimator are explained in Section 4. Section 5 presents the
empirical results and section 6 concludes.
2. Related Literature
A large empirical literature compares the productivity of foreign-owned versus domestic-owned
firms. Doms and Jensen (1995) find that foreign-owned companies in the U.S. are more productive than
domestic-owned ones, but are on average less productive than U.S.-owned multinational companies. A
number of studies have investigated the causal link between foreign ownership and plant performance,
where the target firm is usually situated in an emerging market while the acquirer firm is from a
developed market.
Aitkin and Harrison (1999) conclude from a sample of Venezuelan firms that foreign ownership
is correlated with productivity improvements. Using detailed plant-level information from Mexico, Perez-
Gonzales (2005) finds that multinational control leads to large improvements in total factor productivity,
particularly in industries that rely on technological innovations from their parent companies. Arnold and
Javorcik (2005) use plant-level data from Indonesia and find that foreign ownership leads to significant
improvements in productivity in the year of acquisition as well as in subsequent years. Petkova (2008)
conducts a similar study using Indian plant level data and concludes that foreign owned plants only
experience improvements in productivity at a three-year horizon.
In the developed-market context, a series of papers concentrating on acquisition targets in the
United Kingdom, Girma et al. (Girma, 2005; Girma et al., 2006, 2007) document improvements in growth
rates of firm performance following foreign acquisitions. These studies, however, do not specifically
differentiate between emerging and developed country acquirers. Antkiewicz and Whalley (2006)
highlight several case studies of recent completed and failed attempts by Chinese companies to acquire
5
firms in the OECD. They suggest that the recent wave of Chinese outbound M&A is driven by the
necessity to acquire access to resources, new technology and distribution networks in the target country.
Our study is also related to studies analyzing the effects of foreign and domestic M&As on firm
stock market performance. Harris and Ravenscraft (1991) examine the effects of inbound U.S. FDI on
shareholder wealth over the period 1970-1987 and find that target firm wealth gains are significantly
higher in cross-border takeovers than in domestic acquisitions. While they do not focus on the country of
origin of the acquiring firms, over their sample period, there were very few emerging-market acquisitions
of U.S. firms. 7
Healy, Palepu and Ruback (1992) analyze the operating performance for the combined firm in
domestic acquisitions relative to the industry median and show that the operating cash flows of merged
firms actually drop from their pre-merger level on average, but that the non-merging firms in the same
industry drop considerably more. Thus, the post-merger combined operating performance improves
relative to the industry benchmark. Andrade et. al (2001) use an annual cross sections methodology
similar in spirit to Fama and Macbeth (1973) and find that post-merger operating margins (cash flow to
sales) improve, on average, relative to industry benchmarks. Using propensity score matching, we find
that the return on assets for acquired firms increases significantly relative to the matched control group of
non-acquired firms.
3. Data Description
Our data sample contains all M&As involving U.S. firms initiated by firms in emerging markets
that are announced between January 1, 1980 and July 1, 2007, and are reported by SDC Platinum, a
database from Thompson Financial. The data include all public and private M&A transactions involving
at least 5% ownership8 of a target firm in the U.S9. SDC collates information from over 200 English and
foreign language news sources, SEC filings and the filings from its international counterparts, trade
publications, news wire reports, and proprietary surveys of investment banks, law firms, and other
advisory firms. For each transaction, the SDC database provides the date on which the transaction was
first announced as well as the date on which the transaction became effective. The database provides
characteristics of the target and acquiring firms including: name, nation, industry sector, and primary
North American Industry Classification System (NAICS). The database also includes transaction-specific
7 Edwards and Krugman (1995) provide a comprehensive empirical analysis of the growth of inward U.S. FDI from other industrial countries, focusing on economic and national security implications. 8 The IMF and the OECD define FDI using a 10% threshold, though a broader definition of FDI is ownership of an amount of shares or voting power that allows participation in the management or control of the target firm. 9 See Appendix A for a full list of the markets included in the database.
6
information on percent of shares acquired, the percent of shares owned before and after the transaction is
completed, the percent of shares sought by the acquiring firm, and the method of payment.
Over the sample period, SDC covered 7,996 completed M&A transactions between a foreign
acquirer and a U.S. target. Out of that total number, 2,368 M&A transactions (30%) were conducted
between foreign firms and publicly traded U.S. targets. The focus of the analysis in the paper is on the
subsample of 480 outbound M&A transactions by emerging country firms and U.S. target firms that
remain publicly traded after acquisition. Furthermore, we eliminate countries that are tax havens, e.g.
Bahamas, Bermudas10, etc. which leaves us with a sample of 259 M&A transactions. Among the
remaining deals, 81 transactions involve multiple acquisitions of the same target. We only include the
first of multiple acquisitions in our dataset as we are interested in what happens to a U.S. target when it is
first acquired by an emerging-market firm. This trims our sample to 214 transactions. Where information
is available, these observations cover M&A transactions that result in a change in majority control in the
target firm as well as acquisitions of minority shares. Most of our observations include information on the
method of payment, the value of the transaction, and the NAICS codes of the respective acquirer and
target firms.
Data on the U.S. target firms come from Compustat and the Center for Research in Securities
Prices (CRSP). Compustat reports financial statement data and CRSP contains stock return information.
Information provided in SDC on our target firms allows matching across these databases. During this
process, we lose observations because some of the target firms are renamed after acquisition or are
delisted. The availability of data in Compustat varies significantly by year and by variable. For example,
the employment variable is only reported on a voluntary basis in Compustat. Out of the original 214
transactions between emerging country acquirers and public U.S. targets in the SDC dataset, roughly 120
firms (56%) have performance variables reported in Compustat over the five years post acquisition and
175 firms (81%) have usable stock returns data in CRSP.
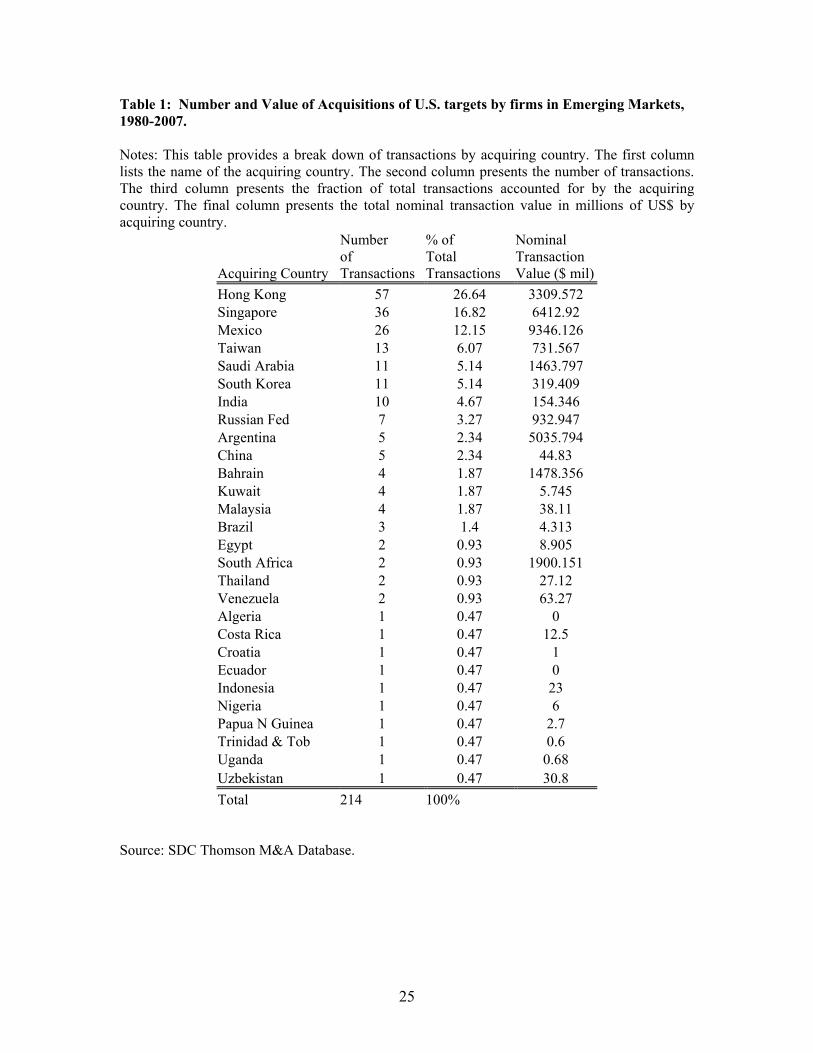
Table 1 presents information by country of origin on the number and value of acquisitions of U.S.
firms. The top five emerging market countries whose firms acquired U.S. targets over the period 1980-
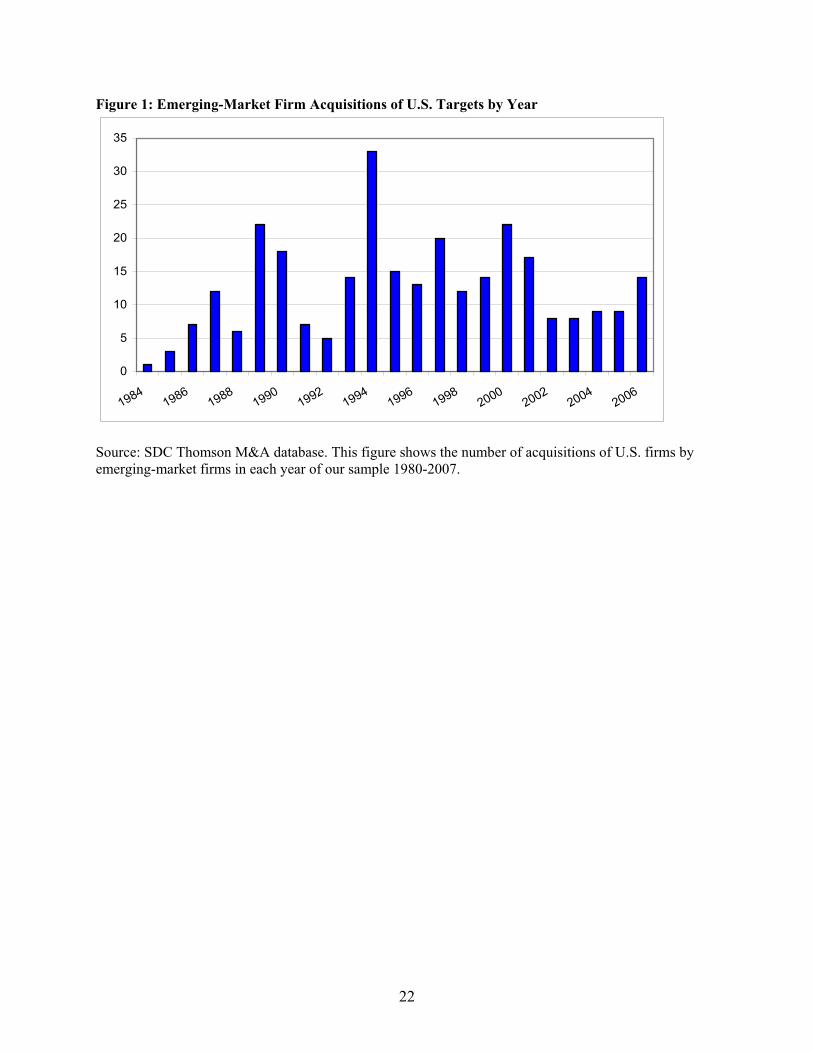
2007 are: Hong Kong, Singapore, Mexico, South Korea, and Taiwan. Figure 1 displays the number of
publicly traded U.S. firms that were acquired by emerging country firms by year; acquisitions occurred in
each of the years in our sample. In about half of all M&As reported in SDC information is available on
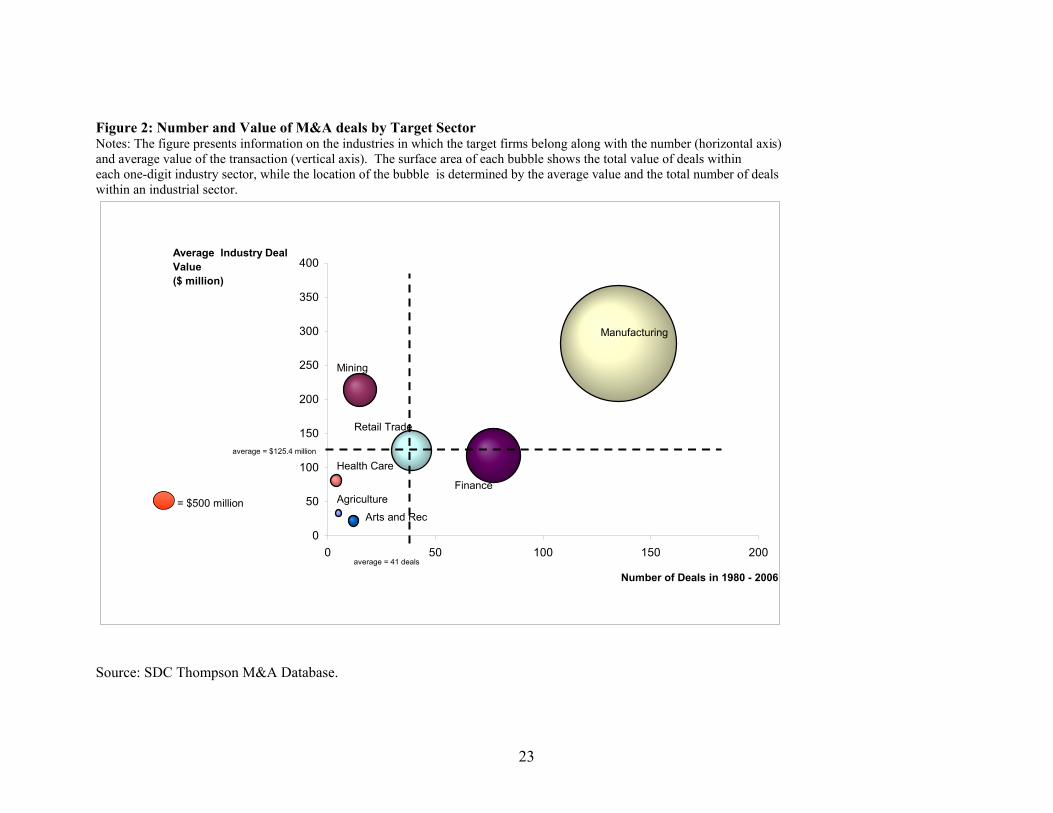
the value of the deal. Figure 2 presents this information together with the number of deals and the
industry in which the target firm is located. In the figure the surface area of each bubble shows the total
value of deals within each one-digit industry sector, while the location of the bubble is determined by the
average value and the total number of deals within an industrial sector. The figure indicates that in about 10 See Appendix A for a list of tax-haven markets as defined by the OECD (2008).
7
half of all transactions the target firm is in the manufacturing sector and the average value of acquisitions
in the manufacturing sector is much larger than the value of acquisitions in other industries.
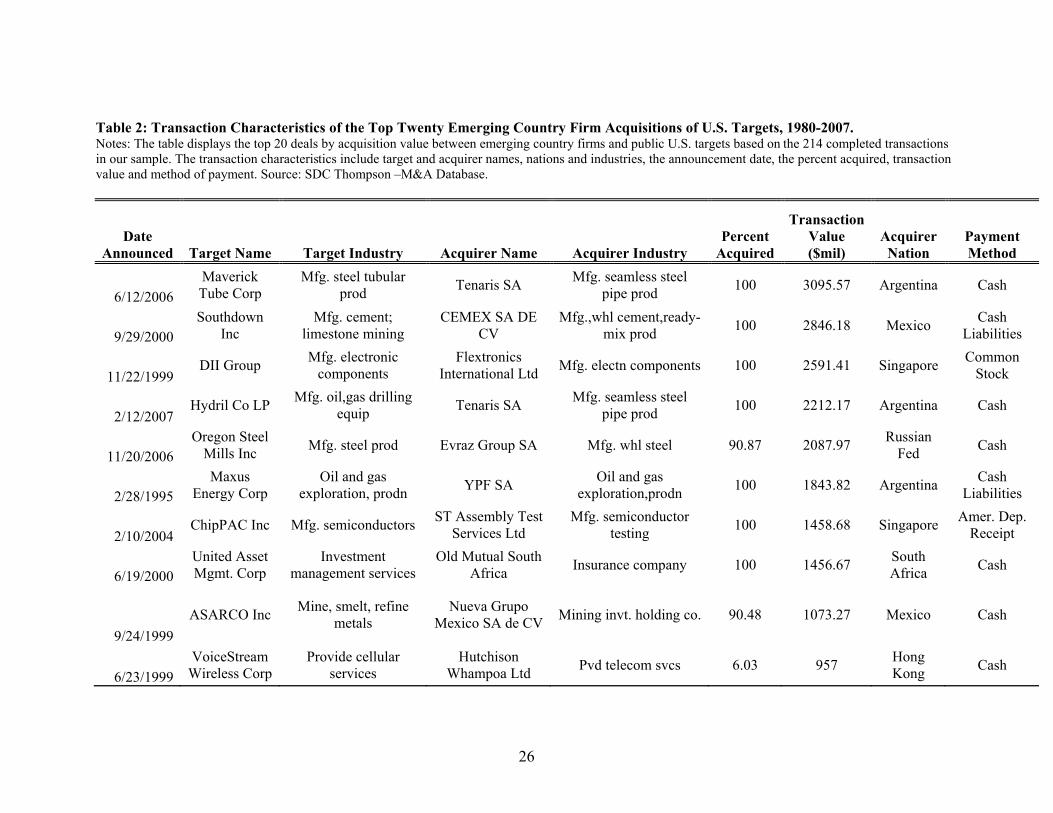
Table 2 displays the top 20 deals by acquisition value between emerging country firms and public
U.S. targets. About half of the top twenty M&A transactions are horizontal, meaning that the acquirer and
the target are in the same industry. In our full sample about one sixth of the deals involve horizontal
M&As and about one third of the deals involve an acquisition of 50 percent or more of the target. Finally,
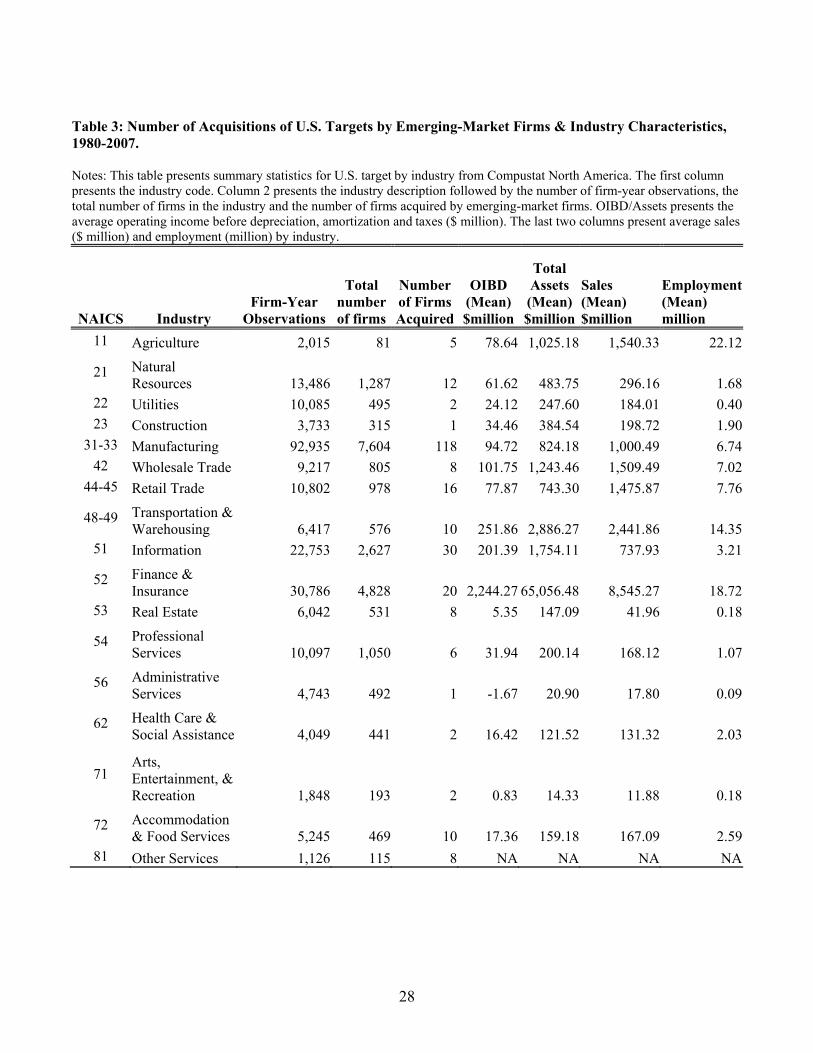
Table 3 provides average accounting information (OIBD, sales and employment) for the target firms
sorted by NAICS industry.
4. Empirical Strategy
4.1 Difference-in-Differences Matching Estimation
It seems unlikely that emerging country firms acquire U.S. firms at random. As discussed in the
introduction, ideally, in order to evaluate the impact of foreign ownership we would like to have
information on the set of prospective firms from which the target was selected. In other words, we would
like to compare the performance of a firm that receives foreign investment to the performance of the
firm’s identical twin (or multiple) with no foreign investment. While this sort of counterfactual is not
generally observable, we use propensity score matching techniques to construct a control group of non-
acquired U.S. firms that closely match the U.S. targets. A firm is “selected” into the control group if it is
sufficiently similar to acquired U.S. firms on the basis of the key determinants of the acquisition decision.
In other words, our goal is to find a set of control firms that are a priori equally likely to be acquired by an
emerging-market firm as those firms which ultimately are acquired.
Let , {0,1}i tA ! be a dummy variable indicating whether a U.S. firm is acquired by an emerging-
market firm at time t and let 1,i t uy " denote target firm performance u periods after the acquisition takes
place, where 0u # . The performance of a matched non-acquired U.S. firm is given by 0,i t uy " . For a given
U.S. firm, we will only observe performance in one of the two states; foreign acquisition ( 1,i t uy " ), or not
( 0,i t uy " ). The average effect of an emerging-market firm acquisition of a U.S. target is the following:
1 0, ,[ | 1]i t u i t uE y y A" "$ %
& '1 0 0 0, , , ,[ | 1] [ | 0] [ | 1] [ | 0]i t u i t u i t u i t uE y A E y A E y A E y A" " " "% % $ % $ % $ %
The term in the first line is the average treatment effect on the treated (ATET), and the term in the
second line in braces is a “selection'' term, which is zero if the assignment to the treatment and control
groups is random. Our assumption is that firms have observable characteristics, X, that make them

8
attractive targets. Our approach is to match acquired and non-acquired firms on the basis of these Xs and
then calculate the treatment differential (the effect of being acquired) on each of the outcome variables of
interest. The average of the differential over all acquired firms and all Xs measures the average effect of
foreign acquisition. Formally, Angrist and Krueger (2000) show that effect of the treatment on the treated
is given by
& '1 0 1 0, , , ,[ | 1] [ | , 1] [ | , 0] | 1i t u i t u i t u i t uE y y A E E y X A E y X A A" " " "$ % % % $ % %
[ | 1]xE A% ( % ,
where 1 0, ,[ | , 1] [ | , 0]x i t u i t uE y X A E y X A" "( % % $ % . The underlying assumption is that all the firms
(whether acquired or not) have the same expected performance under domestic ownership. This is
referred to as the conditional independence assumption (CIA):
0 0 0, , ,[ | , 1] [ | , 0] [ | ]i t u i t u i t uE y X A E y X A E y X" " "% % % % .
For the CIA to be satisfied, the vector X should contain all variables that affect both acquisition
and performance outcomes. The choice of variables included in X is described in more detail below.
Another assumption required for matching is that it is not possible to predict the probability of a foreign
acquisition perfectly, i.e. 0 Pr( 1| ) 1A X) % ) .
Matching on a vector of variables is difficult since it requires weighting differences in one
dimension against another. Rosenbaum and Rubin (1983) provide a solution to this dimensionality
problem by matching firms on propensity scores, which in our context is the conditional probability of
being acquired by an emerging county firm given X:
, , 1Pr( ( ))i i t i tP A A X $% % .
This matching technique allows us to take into account differences in observable characteristics
across the firms in our database. We then combine matching with difference-in-differences analysis to
eliminate the differences between the acquired and control firms that are unobservable and time invariant.
Rather than treating each of our firms linearly and with the same weight, our difference-in-
differences estimator paired with propensity score matching allows us to include only acquired firms
within the common support and picks control firms according to the metric function specific to the
matching method. We limit the common support to only contain those treated firms that do not lie above
the maximum or below the minimum propensity score for the matched control group. Similarly, matched
control group firms that lie above the maximum or below the minimum propensity score for the treated
firms are also dropped from the analysis.

9
In our analysis, we use the Mahanalobis distance metric, which allows us to confine the matching
between the acquired and control firms to the same 2-digit industry. Mahanalobis metric matching by
itself uses the observable covariates directly, by minimizing a distance defined for covariate values
X1(treated) and X2(control) as 1 1/ 2
1 2 1 2{( ) ( )}TcX X S X X$$ $ ,
where Sc is the control sample covariance matrix. For the combined method, all non-acquired U.S. firms
within intervals surrounding each acquired firm’s propensity score are identified as potential matches, and
then Mahalanobis metric matching is applied to the subset of covariates, in our case 2-digit industry
characteristics, to make final selections from these potential matches. Finally, the standard errors from
the matching estimation are bootstrapped as suggested by Becker and Ichino (2002).
4.2 Evidence of Selection
In order to examine whether our assumption that firms are not randomly selected for acquisition
is justified we check whether firm characteristics prior to acquisition are correlated with subsequent
foreign ownership. Our test involves a regression of our various performance measures on two dummy
variables. The first dummy variable indicates those U.S. firms with foreign ownership in year t. The
second dummy variable is switched on three years prior to the ownership change, for those U.S. firms that
were eventually foreign acquisition targets. We also control for industry, region and year fixed effects in
the regression. The estimation results, presented in Table 4, illustrate that future foreign acquisition
targets are larger in size, measured by log sales and log total assets, than non-acquired domestic firms up
to three years before acquisition. Furthermore, the regression estimates indicate that acquired firms have
more employees and higher debt than non-acquired firms. These systematic differences indicate that
foreign investors do not choose target firms at random. Our analysis of the post acquisition performance
of U.S. firms takes this selection into account.
4.3 Timing Issues
Unlike longitudinal matching studies, where treatment occurs uniformly at one point in time, the
firms in our data set are targets of acquisition at varying times. This variation in treatment timing poses
the challenge of how to assign counterfactual treatment dates to the firms that are not acquired by
emerging-market firms. We follow Petkova's (2008) approach of proportional-random acquisition time
assignment. We determine the fraction of the total number of acquisitions that occur in each calendar year
during our sample period, and then assign the hypothetical treatment year to the firms in the control group
in the same proportion as their occurrences in the acquisition group. For example, if one tenth of all
acquisitions occurred in 1995 in our sample of targets, then one tenth of all firms in the control group
10
receive the hypothetical treatment year 1995. Before assigning the date, we make sure that the control
firm's year of incorporation precedes the treatment year and that the firm remains non-acquired
throughout the entire span of our data.
4.4 Propensity Score Matching Estimation
After assigning the hypothetical foreign acquisition dates to the control firms that are not acquired
(do not receive treatment) over our sample period, we need to realign the time series data for each firm.
More specifically, in the year of acquisition (actual or hypothetical), we set t=0, in the year following the
acquisition t=1, and in the year prior to the acquisition, t=-1, etc. The propensity score is the estimated
probability of being acquired in period t=0 based on firm characteristics in period t=-1. We estimate this
probability using a probit model, where the dummy variable ,i tA equals 1 in the year a firm is the actual
target of acquisition and zero otherwise11.
4.4.1 Choice of Covariates
We select our control group of non-acquired firms based on a set of observable characteristics
that comprise the vector X. The control variables include factors that drive both the acquisition and
performance of the firm, such as: age, size (measured by log of total assets, log of sales and log of
employment), operating income, debt, cash, net income, and net property, plant, and equipment. In the
estimation, the values of each of these variables are from the year prior to the actual or hypothetical
acquisition year.12 The “age” of a firm indicates the level of development of a potential target. Variables
such as total assets and sales convey information about the market power of the target firm as well as its
productive capacity. Operating income before depreciation (OIBD) and net income describe the
profitability of the target firm. Debt and cash variables are indicators of the internal structure of the firm.
Measures of property, plant and equipment gauge the physical capital stock of a firm. Lastly, we include
year, region and industry dummies in the vector of control variables, where industry dummies are based
on 2-digit NAIC codes and regional dummies are based on the U.S. state where the target firm is located.
11Alternatively, we could also assign zero to a target firm where there has been an acquisition announcement that eventually fell through. Due to the limited amount of data, however, this analysis was not feasible. 12 In choosing the year preceding the acquisition, there arises a concern of an “Ashenfelter Dip.” This term is based on the finding in Ashenfelter (1978) that in job program evaluations, participants tend to experience a temporary decline in earnings prior to enrolling in a program. In this data set of target firms, however, there is no visible decline in target firm performance in the year prior to acquisition. As a robustness check we also use variables in different years prior to acquisition, the results remain unchanged.

11
5. Results
5.1 Preliminary Evidence: Stock Market Reaction to Acquisition Announcements
If capital markets are semi-strong form efficient with respect to public information, stock prices
will quickly adjust following an acquisition announcement, incorporating any expected value changes
(Andrade et al, 2001). The two commonly used event windows are the three days immediately
surrounding the acquisition announcement, and a longer window beginning several days prior to the
announcement and ending at the close of the acquisition. We examine the abnormal stock return for the
acquired targets around various different windows of time surrounding the announcement of the
acquisition.
We calculate the mean cumulative return of the target stock price within a one, three, and twenty
day window of the announcement date. We assume that stock prices follow a single factor market model.
Our estimation period is 280 days before and up until 30 days preceding the event date. Using a
standardized value of the cumulative abnormal return, we test the null hypothesis that the return is equal
to zero.13
Table 5 displays announcement period abnormal returns for U.S. targets that are acquired by
emerging country firms. The announcement period cumulative abnormal return over the three-day
window is 8.9% for 175 completed acquisitions. When the event window is expanded to three days prior
to the acquisition announcement and ending three days after the announcement, the mean abnormal return
is essentially identical. Over an even longer window of twenty days, the mean abnormal return increases
to 9.7%. In comparison to domestic U.S. M&As, where target firms' average three-day abnormal return is
around 16% for the three-day window and rises to 24% over the longer event window of 20 days
(Andrade et al. (2001)), acquisitions of U.S. targets by emerging-country firms tend to have lower
abnormal returns.
5.2 Propensity Score Matching Estimates
Our approach to constructing an appropriate comparison group of non-acquired firms involves a
two-step matching process. The first step, a probit regression, estimates the probability of foreign
acquisition based on past values of various measures of firm performance (age, OIBD, cash, sales, assets,
employment, debt, income) as well as state, year and industry fixed effects. The results of the probit
indicate that firms with more cash, and those firms located in certain states and from specific industries
are more likely to be acquired. We impose a common support by dropping treatment observations (firms
that are acquired) whose propensity score is higher than the maximum or less than the minimum
13 In future work we plan to also compare target firm returns to both their matched control firm returns and their industry average return on the announcement date.

12
propensity score of the firms that are not acquired. The second step involves using the Mahalanobis
distance metric to select firms for the control group that are within the same 2-digit industry as the
acquired firms.
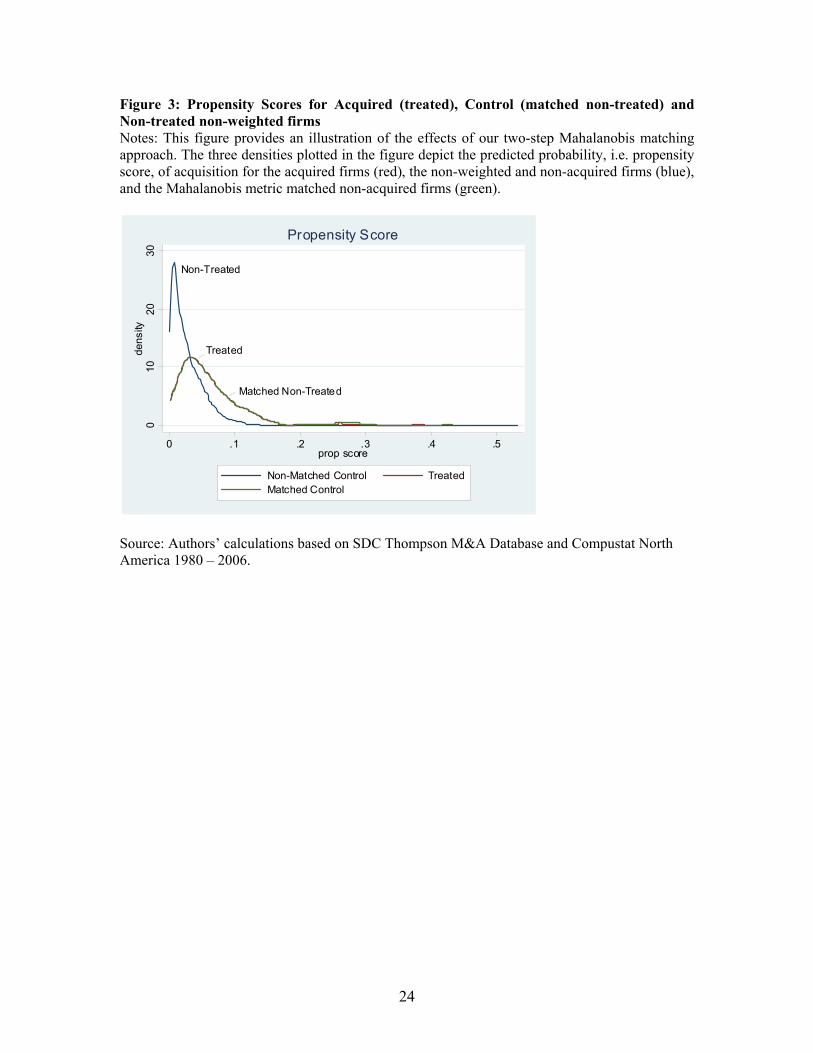
Figure 3 provides an illustration of the effects of our two-step Mahalanobis matching approach.
The three densities plotted in the figure depict the predicted probability, i.e. propensity score, of
acquisition for the acquired firms (red), the non-matched and non-acquired firms (blue), and the
Mahalanobis metric matched non-acquired firms (green). The Mahanalobis matching estimator performs
extremely well as evidenced by the proximity between the density of the acquired firms and that of the
Mahanalobis matched non-acquired firms.14 In terms of our two step process, if we did not “select” our
control group, this group would include all U.S. firms that are not acquired (the blue line). Our two-step
matching involves constructing an appropriate counterfactual for each acquired firm given the set of
observable covariates available for the firms. The propensity score provides a summary index of all the
covariates combined, so that matching essentially brings the group of control firms closer to the acquired
firms on all available dimensions.
The density plot in Figure 3 reveals that among the non-acquired firms a large proportion have
almost zero probability of being acquired. A simple difference-in-difference estimator would treat these
firms the same as those non-acquired firms that are more likely to be acquired. The Mahanalobis
matching estimator, in contrast, only selects firms that are similar to the acquired firms both in terms of
propensity score as well as in industry. In other words, propensity score matching in this context ensures
that our comparisons involve firms that are very similar prior to acquisition. One could argue that this
approach biases against finding differences in post acquisition performance (given that the firms are so
similar prior to acquisition), but it also ensures that our tests will not simply be picking up differences in
acquired and non-acquired firm performance that are unrelated to acquisition.
5.2.1 Balancing Test
One way to assess the performance of our propensity score matching is to calculate the
standardized differences for the covariates in our probit regression. Specifically, for each covariate, we
take the average difference between the acquired firms and the matched control firms and normalize it by
the pooled standard deviation of the covariate in the acquired and control group samples. Based on
Rosenbaum and Rubin (1985), we calculate the following measure:
14 We also try alternative matching estimators, such as kernel matching and propensity score reweighting. The difficulty with kernel matching is the selection of an appropriate bandwidth parameter. Although the point estimates based on propensity score reweighting are similar to our Mahalanobis results, the properties of the standard errors from propensity score reweighting are less clear.

13
{ 1} { 0}1
{ 1} { 0}
1 [ ( , ) ]( ) 100
var ( ) var ( )2
i j
i j
ki i j kji A j A
ki A ki j A kj
X W P P Xn
SDiff XX X
! % ! %
! % ! %
$
%"
* *,
where n1 is the number of acquired firms and n0 is the number of non-acquired firms in the control group.
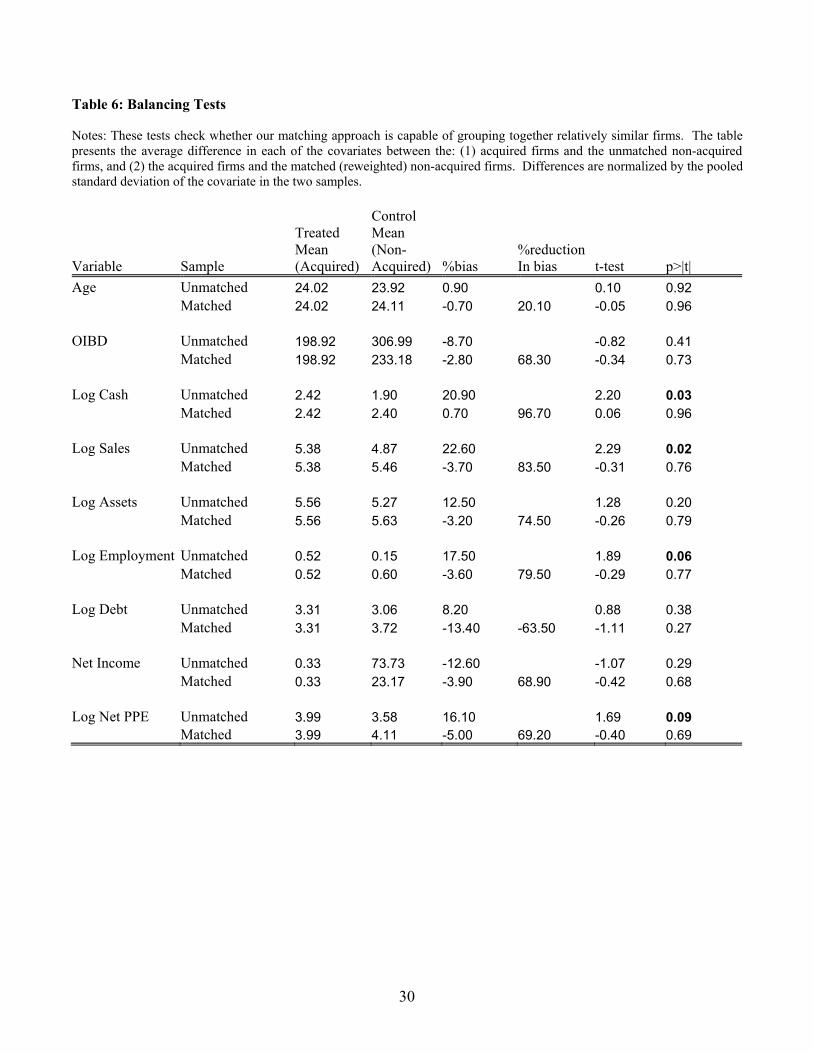
Table 6 shows that our propensity score method does a good job of matching a set of control
group firms that were not acquired to the set of firms that were acquired by emerging-market firms along
the dimensions of the observable covariates. The balancing test results indicate that the differences in our
matched parameters are all well below 2015 indicating that our approach is capable of grouping together
relatively similar firms. In particular, the covariates log cash, log sales, log employment, and log of net
property, plant and equipment before matching show significant differences in means between acquired
and non-acquired firms. After matching, however, the means of the covariates between the two groups are
not significantly different.
For instance, consider the firm-size characteristic as measured by log sales. The first row of
coefficients for log sales compares the acquired (treated) firms with the non-acquired (control,
unmatched) firms. In other words, the “unmatched control” refers to the set of firms that would have
otherwise comprised the control group had we not undertaken propensity score matching. The coefficients
for log sales in the first row suggest that the acquired firms are significantly larger, on average, than the
unmatched set of control firms. The difference in size is statistically significant as evidenced by the t-
statistic and p-values in the final two columns. The second row presents mean log sales numbers for the
acquired firms along with the “matched control” firms that were not acquired. In stark contrast, the
differences in log size are not significantly different across the treated and control groups when matching
takes place. In fact the reduction in bias as a result of propensity score matching along the dimension of
log sales is about 83%. The reduction in bias for other observable covariates ranges from 20% for the
firm-age variable to 96% for the firm-cash variable.
5.3 Post-Acquisition Performance
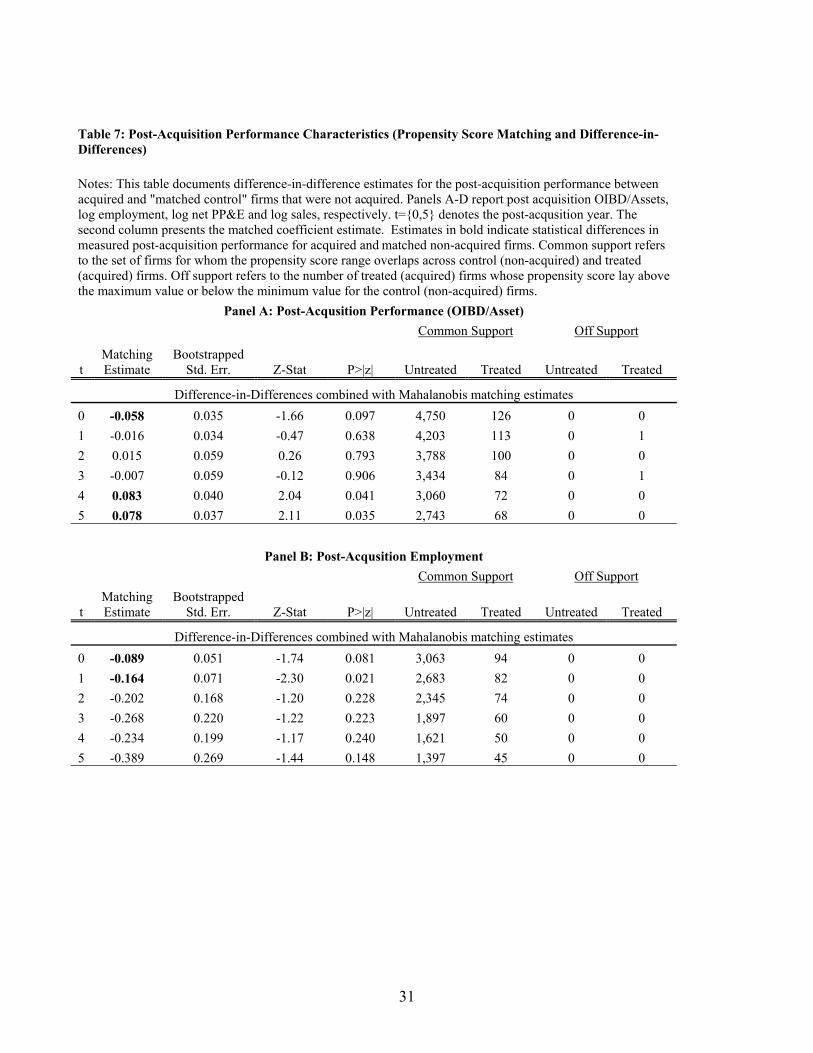
Tables 7, Panels A-D present our difference-in-differences Mahalanobis matching results for
various measures of post-acquisition firm-performance. t={0,5} denotes the post-acquisition year. The
second column presents the matched coefficient estimate. Estimates in bold indicate statistical
differences in measured post-acquisition performance for acquired and matched non-acquired firms.
15 A value for the standardized difference between treated and matched control mean values suggested by Rosenbaum and Rubin (1983).

14
Common support refers to the set of firms for whom the propensity score range overlaps across control
(non-acquired) and treated (acquired) firms. Off support refers to the number of treated (acquired) firms
whose propensity score lay above the maximum value or below the minimum value for the control (non-
acquired) firms. Note that changes in post-acquisition performance are calculated relative to year t=-1,
prior to the acquisition.
Panel A presents results for OIBD scaled by total assets, also referred to as return on assets
(ROA). These estimates indicate that the ROA for acquired firms declines significantly compared to the
firms in the “propensity score matched” control sample in the year of acquisition. It appears that profits
continue to decline in years 1-3 following the acquisition but the decline is not statistically significant. In
years four and five after the acquisitions the ROA increases significantly for acquired firms (relative to
the non-acquired firms in our control group). In particular, the ROA increases by 8.3% in year four and
7.8% in year five for the acquired firms relative to the control sample and also relative to the year prior to
the acquisition. The time-series pattern in the ROA numbers is consistent with restructuring in the early
years following the acquisition leading to improved profitability in later years. We also conducted an F-
test of joint significance that shows that the post-acquisition increase in profitability is jointly significant
across the five years following the acquisition.
The advantage of our methodology is that we are able to identify the timing of the profitability
improvements. Propensity score matching also requires large samples with substantial overlap between
groups of the treated (acquired) and control (matched non-acquired) firms. From Table 7a, we see that the
sample size of control firms under “common support” are an order of magnitude higher than the treated
group suggesting that our estimates are measured with high precision. Moreover, the numbers under “off-
support” suggest that there is substantial over lap in the treated and control samples since only two firm
years of treated observations are excluded from the estimation. A caveat that remains is that while
propensity score matching attempts to identify matched twins in the control group and difference-in-
differences estimation accounts for time-invariant, unobservable differences across treated and matched
firms, hidden bias may remain because matching only controls for observed variables to the extent that
they are perfectly measured (Shadish, Cook and Campbell, 2002). Also, to the extent that there are
unobservable time-varying differences in firm characteristics across the treated and control samples, we
are unable to account for them. However, it is not clear what unobservable and yet time-varying firm
characteristics could vary across the two samples of firms.
The results in Panels B-D in Table 7 indicate that employment, net property, plant, and equipment
(PP&E), and sales all decrease significantly for acquired firms (again, relative to matched control non-
acquired firms) in the year of and the five years after the acquisition. While the decline in employment
15
and net PP&E is significant only in the early years, the decline in sales appears to persist across the five
years following the acquisition.
The pattern of increasing profitability (income/assets) and declining sales is consistent with
improvements in firm-efficiency following acquisition. For instance if firms shut down or get rid of
unprofitable divisions, sales would go down but profits as a percent of assets would increase. Also,
declining employment and net PP&E suggest downsizing of divisions to improve overall profitability as a
percent of assets.
The results of increasing profitability are also consistent with the hypothesis that foreign
ownership is associated with improvements in plant productivity (Aitken and Harrision, 1999, Perez-
Gonzales, 2005, Arnold and Javorcik, 2005, Petkova, 2007). Declining sales in the target firms along with
the downsizing of employment are also consistent with the comparative input cost hypothesis. Acquirers
from emerging-markets come from environments where labor costs are low and they may be in the
position to “insource” jobs by exploiting the low wages in their home countries by downsizing labor-
intensive activities in the foreign country following the acquisition. However, the U.S. target also
experiences improvements in profitability with more streamlined but efficient operations following
restructuring by the emerging-market acquirer.
5.4 Simple Difference-in Differences Estimation
To highlight the importance of constructing an appropriate benchmark for comparison to evaluate
post-acquisition performance we conduct a simple difference-in-differences estimation without propensity
score matching. Here the underlying assumption is that US targets are chosen at random by emerging-
market acquirers. Table 8 (Panels A-D) present the results. From the coefficient estimates we may
erroneously conclude that there is no significant difference in the post-acquisition performance between
the treated (acquired) and control (non-matched non-acquired) firms. The estimates suggest that
OIBD/assets, employment, net PP&E and sales are not significantly different across the two groups of
firms following the acquisition. The simple difference-in-differences are essentially comparing the post-
acquisition performance of targets to the performance of all non-acquired U.S. firms. If the acquired firms
are bigger on average (as indicated in Table 4) in terms of assets, sales and employment before the
acquisition, and continue to be statistically different along these dimensions after the acquisition in
comparison to the sample of all non-acquired firms, simple difference-in-differences estimates would lead
to the inference that emerging-market acquisitions do not significantly alter the performance or operations
of the target firms.16 However, a comparison of the target firms with a set of hypothetical twin firms in the
16 In unreported results we find that the observable characteristics (such as size and employment) that distinguish the acquired and full (unmatched) set of non-acquired firms do not change significantly three years post-acquisition.
16
matched control set suggest that emerging-market acquirers undertake significant restructuring of the
target firms following the acquisition. The post-performance indicators from Section 5.3 show that the
acquirers downsize unprofitable divisions, as evidenced by falling sales and employment concomitant
with a significant increase in overall firm-profitability. This simple example serves to illustrate the
importance of constructing a careful benchmark from which to evaluate post-acquisition performance and
the advantage of propensity score matching in this context.
5.5 Robustness Checks
SDC Platinum also provides information about acquisitions that are announced but not completed
or withdrawn. Using this sample of failed transactions we can examine whether the firms that were
potential acquisition targets differ from their non-acquired counterparts. If it is foreign ownership that
drives the post-acquisition performance of the acquired firms, then we expect that following propensity
score matching, the firms that were “potential” targets should perform similarly to the firms that are in the
matched control sample but not the subject of foreign interest since the foreign acquisition was never
successfully completed. Although it is not possible to test this hypothesis given the limited number of
failed acquisitions, Table 9 provides suggestive evidence; the eighteen potential targets in our sample
experience declines in employment and increases in sales in the year the M&A transaction is announced
and are similar to a group of matched non-acquired firms in the years after the failed acquisitions,
suggesting that post-acquisition performance of acquired firms is driven by the transfer of ownership to
foreign hands. However, given the small number of failed acquisitions in our sample, more formal
statistical analysis is not possible.
We also perform a number of additional robustness checks that involve dividing our sample of
acquired firms into various subgroups consisting of: 1) majority and minority control acquisitions, 2)
acquisitions financed solely by cash, 3) only manufacturing firms, 4) acquiring firms located in Hong
Kong, Singapore, Taiwan and South Korea, and lastly, 5) firms not in the same industry as the acquiring
firm. The estimates are shown in Table 10 (Panels A-H). The statistical significance of the results varies
due to sample sizes. For example, for the group of horizontal acquisitions, in which both acquiring and
target firms share the same industry, the sample size is much smaller than that for diversifying
acquisitions. Thus, although the magnitudes of the estimates are similar to those of the whole sample, the
statistical significance is not. Overall, the robustness checks confirm the results in the main analysis when
using the full sample.
17
6. Conclusion
This paper undertakes the first systematic analysis of the performance of U.S. firms that are
acquired by firms located in emerging markets. To do so, we examine both stock market and accounting
based measures of firm performance following the announcement of an acquisition of a U.S. firm by an
emerging-market firm. In particular, we use transaction-level M&A information along with firm-level
financial statement data to examine the post-acquisition performance of publicly listed U.S. targets.
Our results suggest that emerging country firms tend to acquire public U.S. targets with relatively
high levels of sales, employment and total assets. The selection of acquisition target is therefore non-
random. To address the issue of selection, we employ propensity score matching to carefully construct a
matched sample of control firms that were not acquired. The matching methodology is combined with
difference-in-differences estimation to eliminate time-invariant unobservable firm characteristics.
The stock price response of these U.S. targets is positive and significant around the time of the
acquisition announcement. Following the acquisition, the performance of target firms tends to improve. In
particular, the return on assets in target firms increases by 16%, on average, in the five years following
the acquisition. The evidence also suggests that U.S. target firms undergo significant restructuring after
acquisition by an emerging-market firm. In particular, employment and capital decrease, suggesting that
divisions may be sold off or closed down. This conjecture is also supported by the fact that sales also
decline after acquisition.
Our results indicate that (i) acquisitions by firms from emerging markets influence post-
acquisition performance of target firms (sales and employment decline, profits rise); and (ii) there is
selection along observable characteristics based upon which emerging market firms choose acquisition
targets in the U.S. (higher sales, assets, employment). In the paper we attempt to control for (ii) using
propensity-score-matching and difference-in-difference estimation. There remains the possibility that
selection based on time-variant unobservable characteristics (that are orthogonal to the observable
characteristics used in our propensity score matching) may be driving our results. However, the evidence
presented in the paper strongly indicates that emerging market firm acquisitions impact the performance
of U.S. target firms. More generally, the results in the paper serve to illustrate the importance of
constructing careful benchmarks from which to evaluate post-acquisition performance and the advantage
of propensity score matching in this context.

18
References Aitken, Brian J. and Ann E. Harrison, 1999. Do Domestic Firms Benefit from Direct Foreign Investment? Evidence from Venezuela. American Economic Review, Vol. 89, 605-618. Andrade, G., Mitchell, M., and Stafford E., 2001. New Evidence and Perspectives on Mergers. The Journal of Economic Perspectives, Vol. 15, No. 2, 103-120. Angrist, J. D. and Krueger, A. B. 2000. Empirical Strategies in Labor Economics, in A. Ashenfelter and D. Card eds. Handbook of Labor Economics, vol. 3. Sections 1 and 2. Antkiewicz, A. and Whalley, J., 2006. Recent Chinese Buyout Activity and the Implications for Global Architecture. NBER Working Paper No. W12072. Arnold, J. M. and Javorcik, B. S. 2005. Gifted Kids or Pushy Parents? Foreign Acquisitions and Plant Performance in Indonesia. Development Studies Working Paper No. 197. Centro Studi Luca D’Agliano, March. Ashenfelter, O. 1978. Estimating the Effect of Training Programs on Earnings. Review of Economics and Statistics 60, 1, 47-57. Becker, S. and Ichino, A. 2002. Estimation of average treatment effects based on propensity scores. The Stata Journal, Vol.2(4), 358-377 Chari, A., Ouimet, P. and Tesar, L. 2007. The Value of Control in Emerging Markets, mimeo. Chen, Wenjie 2008a. Does the Country of Origin of the Acquiring Firm Impact Performance? mimeo. http://www-personal.umich.edu/~wenjiec/jobmarket/wenjiec_job_market_paper.pdf Chen, Wenjie 2008b. The Relationship between Exchange Rates and FDI, mimeo. Citigroup, 2005. Cross-Border Acquisitions: A Value Creation Strategy for Emerging Market Multinational Companies. Dehejia, R. H., And Wahba, S. 2002. Propensity score matching methods for non-experimental causal studies. Review of Economics and Statistics 84, 1, 151–161. Doms, M. E. and Jensen, J.N., 1995. Geography and Ownership as Bases for Economics Accounting. The University of Chicago Press, Ch. Comparing wages, skills, and productivity between domestically and foreign-owned manufacturing establishments in the United States, pp. 235-258. Fama, E. and MacBeth, J., 1973. Risk, Return, and Equilibrium: Empirical Tests. Journal of Political Economy, 81:3, 607 Forbes, Kristin, 2008. Why Do Foreigners Invest in the United States? NBER Working paper #13908. Froot, K, and Stein, J., 1991. Exchange Rates and Foreign Direct Investment: An Imperfect Capital Markets Approach. Quarterly Journal of Economics, 106:4, pp. 1191-1217. Girma, S., 2005. Technology transfer from acquisition FDI and the absortive capacity of domestic firms: An empirical investigation. Open Economics Review 16, 175-187.

19
Girma, S. and Goerg, H., 2007. Evaluating foreign ownership wage premium using a difference-in-differences matching approach. Journal of International Economics 72, 97-112. Girma, S., Kneller, R., and Oisu, M., 2007. Do exporters have anything to learn from foreign multinationals? European Economics Review 51, 981-998. Graham, E. and Krugman, P., 1995. Foreign Direct Investment in the United States, 3rd Edition, Institute for International Economics, Washington, D.C. Harris, R. and Ravenscraft, D., 1990. The Role of Acquisitions in Foreign Direct Investment: Evidence from the U.S. Stock Market. The Journal of Finance, Vol. 46, No. 3, 825-844. Haskel, J., Pereira, S., and Slaughter, M. 2007. Does Inward Foreign Direct Investment Boost the Productivity of Domestic Firms? Review of Economics and Statistics 89(3), 482-496. Healy, P.M., Palepu, K.G. and Ruback, R.S., 1992. Does corporate performance improve after mergers? Journal of Financial Economics 31, 135–175. International Monetary Fund (2007). World Economic Outlook. Washington: IMF, April, http://www.imf.org/external/pubs/ft/weo/2007/01/data/index.aspx OECD (2008), Tax Cooperation: Toward a Level Playing Field, http://www.oecd.org/document/55/0,3343,en_2649_33745_41233143_1_1_1_37427,00.html Perez-Gonzales, Francisco, 2004. The Impact of Acquiring Control on Productivity: Evidence from Mexican Manufacturing Plants, mimeo. Petkova, N. 2008, Does Foreign Ownership Lead to Higher Firm Productivity? mimeo. Rosenbaum, P. and Rubin, D., 1983. The central role of the propensity score in observational studies for causal effects. Biometrika 70, 41–55. Rosenbaum, P. and Rubin, D., 1985. Constructing a control group using multivariate matched sampling methods that incorporate the propensity score. The American Statistician 39, 1, 33–38. Shadish, W.R., T.D. Cook and D.T. Campbell (2002). Experimental and quasi-experimental designs for Generalized Causal Inference. Houghton-Mifflin, Boston:MA. Wells, L., 1983. Third World Multinationals: The Rise of Foreign Investment from Emerging Markets, The MIT Press, Cabridge:MA.

20
Appendix A
Acquiring Countries in the sample:
Algeria, Argentina, Bahrain, Brazil, China, Costa Rica, Croatia, Ecuador, Egypt, Hong Kong, India,
Indonesia, Kuwait, Malaysia, Mexico, Nigeria, Papua N Guinea, Russian Fed, Saudi Arabia, Singapore,
South Africa, South Korea¸ Taiwan, Thailand, Trinidad & Tobago, Uganda, Uzbekistan, Venezuela
Tax Haven Countries (as defined by the OECD, 2008) excluded from the sample:
Bahamas, Bermuda, British Virgin Islands, Cayman Islands, Cyprus, Netherland Antilles, Panama
Appendix B
Steps followed in our propensity score matching methodology:
1. Run Probit regression where: (a) Dependent variable: Y=1, if a firm is acquired by an emerging-market firm; Y = 0, otherwise. (b) Choose appropriate conditioning variables, covariates which are observable firm
characteristics such as age, size, profitability, financing-mix, etc. (c) Obtain propensity score: predicted probability (p) or log[p/(1-p)].
2. Match each acquired firm to one or more non-acquired firms based on propensity score. We use Mahalanobis metric matching in conjunction with propensity score matching to choose one non-acquired firm from multiple matches restricted to be within the same two-digit industry as the acquired firm. Procedure: (a) Calculate the distance between the acquired firm and all non-acquired firms in the same
industry. The distance, d(i,j) can be defined by the Mahalanobis distance: d(i,j) = 1 1/ 2
1 2 1 2{( ) ( )}TcX X S X X$$ $
where X1 and X2 are propensity scores for acquired firm i and non-acquired firm j, and Sc is the sample covariance matrix of the matching variables from the full set of control group firms.
(b) The non-acquired firm, j, with the minimum distance d(i,j) is chosen as the match for acquired firm i, and both are removed from the pool.
(c) Repeat the above process until matches are found for all acquired firms. (d) The standard errors from the matching estimation are bootstrapped following Becker and
Ichino (2002).
3. Run multivariate difference-in-difference regression to eliminate time-invariant, unobservable differences between acquired (treated) and non-acquired (matched control) firms to examine post acquisition firm performance.
21
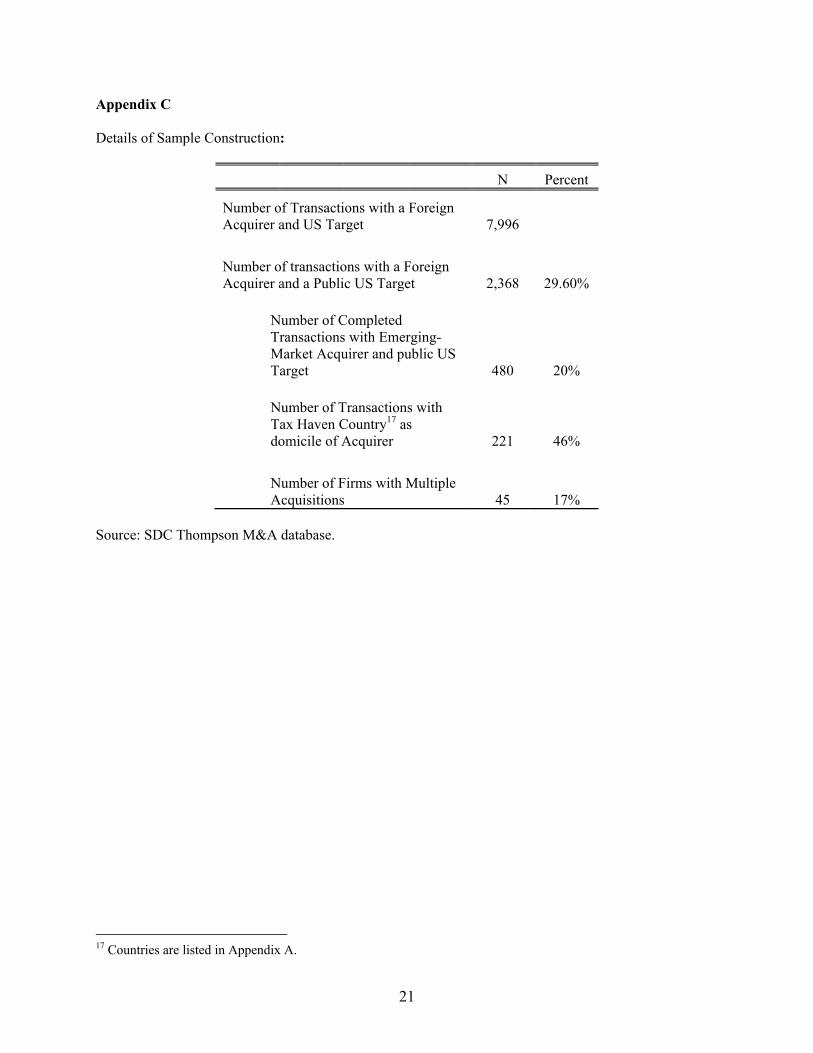
Appendix C Details of Sample Construction:
N Percent
Number of Transactions with a Foreign Acquirer and US Target 7,996 Number of transactions with a Foreign Acquirer and a Public US Target 2,368 29.60%
Number of Completed Transactions with Emerging-Market Acquirer and public US Target 480 20%
Number of Transactions with Tax Haven Country17 as domicile of Acquirer 221 46%
Number of Firms with Multiple Acquisitions 45 17%
Source: SDC Thompson M&A database.
17 Countries are listed in Appendix A.
22
Figure 1: Emerging-Market Firm Acquisitions of U.S. Targets by Year
0
5
10
15
20
25
30
35
19841986
19881990
19921994
19961998
20002002
20042006
Source: SDC Thomson M&A database. This figure shows the number of acquisitions of U.S. firms by emerging-market firms in each year of our sample 1980-2007.
23
Figure 2: Number and Value of M&A deals by Target Sector Notes: The figure presents information on the industries in which the target firms belong along with the number (horizontal axis) and average value of the transaction (vertical axis). The surface area of each bubble shows the total value of deals within each one-digit industry sector, while the location of the bubble is determined by the average value and the total number of deals within an industrial sector.
0
50
100
150
200
250
300
350
400
0 50 100 150 200
Number of Deals in 1980 - 2006
Average Industry Deal Value($ million)
Manufacturing
= $500 million
average = $125.4 million
average = 41 deals
Mining
Finance
Retail Trade
Health Care
Arts and Rec
Agriculture
Source: SDC Thompson M&A Database.
24
Figure 3: Propensity Scores for Acquired (treated), Control (matched non-treated) and Non-treated non-weighted firms Notes: This figure provides an illustration of the effects of our two-step Mahalanobis matching approach. The three densities plotted in the figure depict the predicted probability, i.e. propensity score, of acquisition for the acquired firms (red), the non-weighted and non-acquired firms (blue), and the Mahalanobis metric matched non-acquired firms (green).
Non-Treated
Treated
Matched Non-Treated
010
2030
dens
ity
0 .1 .2 .3 .4 .5prop score
Non-Matched Control TreatedMatched Control
Propensity Score
Source: Authors’ calculations based on SDC Thompson M&A Database and Compustat North America 1980 – 2006.
25
Table 1: Number and Value of Acquisitions of U.S. targets by firms in Emerging Markets, 1980-2007. Notes: This table provides a break down of transactions by acquiring country. The first column lists the name of the acquiring country. The second column presents the number of transactions. The third column presents the fraction of total transactions accounted for by the acquiring country. The final column presents the total nominal transaction value in millions of US$ by acquiring country.
Acquiring Country
Numberof Transactions
% ofTotal Transactions
Nominal Transaction Value ($ mil)
Hong Kong 57 26.64 3309.572 Singapore 36 16.82 6412.92 Mexico 26 12.15 9346.126 Taiwan 13 6.07 731.567 Saudi Arabia 11 5.14 1463.797 South Korea 11 5.14 319.409 India 10 4.67 154.346 Russian Fed 7 3.27 932.947 Argentina 5 2.34 5035.794 China 5 2.34 44.83 Bahrain 4 1.87 1478.356 Kuwait 4 1.87 5.745 Malaysia 4 1.87 38.11 Brazil 3 1.4 4.313 Egypt 2 0.93 8.905 South Africa 2 0.93 1900.151 Thailand 2 0.93 27.12 Venezuela 2 0.93 63.27 Algeria 1 0.47 0Costa Rica 1 0.47 12.5Croatia 1 0.47 1Ecuador 1 0.47 0Indonesia 1 0.47 23Nigeria 1 0.47 6Papua N Guinea 1 0.47 2.7Trinidad & Tob 1 0.47 0.6Uganda 1 0.47 0.68Uzbekistan 1 0.47 30.8Total 214 100%
Source: SDC Thomson M&A Database.
26
Table 2: Transaction Characteristics of the Top Twenty Emerging Country Firm Acquisitions of U.S. Targets, 1980-2007. Notes: The table displays the top 20 deals by acquisition value between emerging country firms and public U.S. targets based on the 214 completed transactions in our sample. The transaction characteristics include target and acquirer names, nations and industries, the announcement date, the percent acquired, transaction value and method of payment. Source: SDC Thompson –M&A Database.
Date Announced Target Name Target Industry Acquirer Name Acquirer Industry
Percent Acquired
Transaction Value ($mil)
Acquirer Nation
Payment Method
6/12/2006 Maverick Tube Corp
Mfg. steel tubular prod Tenaris SA Mfg. seamless steel
pipe prod 100 3095.57 Argentina Cash
9/29/2000 Southdown
Inc Mfg. cement;
limestone mining CEMEX SA DE
CV Mfg.,whl cement,ready-
mix prod 100 2846.18 Mexico Cash Liabilities
11/22/1999 DII Group Mfg. electronic
components Flextronics
International Ltd Mfg. electn components 100 2591.41 Singapore Common Stock
2/12/2007 Hydril Co LP Mfg. oil,gas drilling
equip Tenaris SA Mfg. seamless steel pipe prod 100 2212.17 Argentina Cash
11/20/2006 Oregon Steel
Mills Inc Mfg. steel prod Evraz Group SA Mfg. whl steel 90.87 2087.97 Russian Fed Cash
2/28/1995 Maxus
Energy Corp Oil and gas
exploration, prodn YPF SA Oil and gas exploration,prodn 100 1843.82 Argentina Cash
Liabilities
2/10/2004 ChipPAC Inc Mfg. semiconductors ST Assembly Test
Services Ltd Mfg. semiconductor
testing 100 1458.68 Singapore Amer. Dep. Receipt
6/19/2000 United Asset Mgmt. Corp
Investment management services
Old Mutual South Africa Insurance company 100 1456.67 South
Africa Cash
9/24/1999 ASARCO Inc Mine, smelt, refine
metals Nueva Grupo
Mexico SA de CV Mining invt. holding co. 90.48 1073.27 Mexico Cash
6/23/1999 VoiceStream
Wireless Corp Provide cellular
services Hutchison
Whampoa Ltd Pvd telecom svcs 6.03 957 Hong Kong Cash

27
Date Announced Target Name Target Industry Acquirer Name Acquirer Industry
Percent Acquired
Transaction Value ($mil)
Acquirer Nation
Payment Method
4/14/1997 APL Ltd Shipping,trucking company
Neptune Orient Lines Ltd Shipping company 100 878.48 Singapore Cash
1/25/2000 CompUSA Inc
Own,operate computer stores
Grupo Sanborns SA de CV Mgmt hldg cia 85.5 805.261 Mexico Cash
7/15/1987 Marine
Midland Banks
Bank holding company HSBC HK Bank (foreign) 48.42 752 Hong
Kong Cash
8/9/1989 Anchor Glass
Container Corp
Manufacture glass containers Vitro SA de CV Mfg. glass containers 96.89 737 Mexico Cash
Liabilities
1/30/1997 AST Research Inc
Mfg. computers;dvlp software
Samsung Electronics Co
LtdMfg.,whl electn prod 55.28 495.8 South
Korea Cash
Liabilities
5/7/2001 Proxicom Inc Pvd e-bus consulting,dvlp svc
Dimension Data PLC Pvd info tech svcs 100 443.481 South
Africa Cash
4/15/2005 Brookstone Inc Own,op novelty stores OSIM Brookstone
Holdings LP Investment company 100 429.656 Singapore Cash
9/24/1999 CMGI Inc Pvd direct mail advg svcs
Pacific Century CyberWorks Ltd
Internet Service Provider{ISP} 3.4 377.952 Hong
Kong Newly Issued
Ordinary Shares
11/20/2002 Stillwater Mining Co
Platinum mining company
OAO MMC Norilsk Nickel
GroupMfg. metal prod 51.12 340.9 Russian
Fed Cash, Other
Consideration 11/30/1993 Motor Coach
Industries Intl Mfg. railroad
cars,equipment Consorcio G
Grupo Dina'l'ads Manufacture trucks 100 334.64 Mexico Dep. Share
Convert. Deb.
28
Table 3: Number of Acquisitions of U.S. Targets by Emerging-Market Firms & Industry Characteristics, 1980-2007.
Notes: This table presents summary statistics for U.S. target by industry from Compustat North America. The first column presents the industry code. Column 2 presents the industry description followed by the number of firm-year observations, the total number of firms in the industry and the number of firms acquired by emerging-market firms. OIBD/Assets presents the average operating income before depreciation, amortization and taxes ($ million). The last two columns present average sales ($ million) and employment (million) by industry.
NAICS Industry Firm-Year
Observations
Total number of firms
Number of Firms Acquired
OIBD (Mean) $million
Total Assets (Mean) $million
Sales (Mean) $million
Employment(Mean) million
11 Agriculture 2,015 81 5 78.64 1,025.18 1,540.33 22.12
21 Natural Resources 13,486 1,287 12 61.62 483.75 296.16 1.68
22 Utilities 10,085 495 2 24.12 247.60 184.01 0.4023 Construction 3,733 315 1 34.46 384.54 198.72 1.90
31-33 Manufacturing 92,935 7,604 118 94.72 824.18 1,000.49 6.7442 Wholesale Trade 9,217 805 8 101.75 1,243.46 1,509.49 7.02
44-45 Retail Trade 10,802 978 16 77.87 743.30 1,475.87 7.76
48-49 Transportation & Warehousing 6,417 576 10 251.86 2,886.27 2,441.86 14.35
51 Information 22,753 2,627 30 201.39 1,754.11 737.93 3.21
52 Finance & Insurance 30,786 4,828 20 2,244.27 65,056.48 8,545.27 18.72
53 Real Estate 6,042 531 8 5.35 147.09 41.96 0.18
54 Professional Services 10,097 1,050 6 31.94 200.14 168.12 1.07
56 Administrative Services 4,743 492 1 -1.67 20.90 17.80 0.09
62 Health Care & Social Assistance 4,049 441 2 16.42 121.52 131.32 2.03
71 Arts, Entertainment, & Recreation 1,848 193 2 0.83 14.33 11.88 0.18
72 Accommodation & Food Services 5,245 469 10 17.36 159.18 167.09 2.59
81 Other Services 1,126 115 8 NA NA NA NA

29
Table 4: Evidence of Selection in the Three Years Preceding Acquisition Notes: These regressions test whether U.S. firm performance prior to acquisition is correlated with subsequent foreign ownership. The dependent variables are sales, assets, OIBD, cash, debt and employment and the independent variables include: D_ foreignt (a dummy variable which indicates those U.S. firms with foreign ownership at time t), D_futureacq (a dummy variable which indicates those U.S. firms that become acquisition targets of emerging-market firms three years prior to the ownership change), and industry, region and year fixed effects. The dependent variables are expressed in log terms. All significant coefficients are in bold and indicate that foreign investors do not choose target firms at random. * indicates significance at 10%; ** significant at 5%; *** significant at 1%. Standard errors are in parentheses. Sales Asset OIBD Cash Debt EmploymentD_foreignt 0.906*** 0.952*** 0.281 0.815*** 0.896*** 0.737*** (0.19) (0.19) (0.21) (0.20) (0.24) (0.20)D_futureacqt 0.898*** 0.897*** 0.553*** 0.925*** 0.753*** 0.790*** (0.10) (0.10) (0.11) (0.11) (0.13) (0.10)Observations 236223 244249 182936 217800 197547 161948R-squared 0.172 0.231 0.193 0.197 0.203 0.186 Table 5: Cumulative Abnormal Stock Returns for Acquisition Targets Notes: The sample covers acquisitions of U.S. targets by emerging-market firms between January 1, 1980 and July 1, 2007. The day of first mention of the acquisition in SDC Thompson is taken as day ‘0’. Abnormal gain to the U.S. target is computed as the cumulative abnormal return based on a single factor market model. The estimation period is 280 days before and up until 30 days before the event day. The CAR is the cumulative average abnormal return and is described in detail in section 4 of the paper. The Patell Z statistic is based on the Patell (1976) test that assumes cross-sectional independence. It is constructed by standardizing CAR by the respective standard errors. It follows a standard normal distribution under the null hypothesis.
Mean PatellDays N CAR Z(-3,+3) 175 8.87% 13.669***(-1,+1) 175 8.53% 20.068***(-10,+10) 175 9.71% 8.537***(-20,+20) 175 11.13% 6.466***(-30,+30) 175 11.44% 4.871***
30
Table 6: Balancing Tests Notes: These tests check whether our matching approach is capable of grouping together relatively similar firms. The table presents the average difference in each of the covariates between the: (1) acquired firms and the unmatched non-acquired firms, and (2) the acquired firms and the matched (reweighted) non-acquired firms. Differences are normalized by the pooled standard deviation of the covariate in the two samples.
Variable Sample
Treated Mean (Acquired)
ControlMean (Non- Acquired) %bias
%reduction In bias t-test p>|t|
Age Unmatched 24.02 23.92 0.90 0.10 0.92 Matched 24.02 24.11 -0.70 20.10 -0.05 0.96 OIBD Unmatched 198.92 306.99 -8.70 -0.82 0.41 Matched 198.92 233.18 -2.80 68.30 -0.34 0.73 Log Cash Unmatched 2.42 1.90 20.90 2.20 0.03 Matched 2.42 2.40 0.70 96.70 0.06 0.96 Log Sales Unmatched 5.38 4.87 22.60 2.29 0.02 Matched 5.38 5.46 -3.70 83.50 -0.31 0.76 Log Assets Unmatched 5.56 5.27 12.50 1.28 0.20 Matched 5.56 5.63 -3.20 74.50 -0.26 0.79 Log Employment Unmatched 0.52 0.15 17.50 1.89 0.06 Matched 0.52 0.60 -3.60 79.50 -0.29 0.77 Log Debt Unmatched 3.31 3.06 8.20 0.88 0.38 Matched 3.31 3.72 -13.40 -63.50 -1.11 0.27 Net Income Unmatched 0.33 73.73 -12.60 -1.07 0.29 Matched 0.33 23.17 -3.90 68.90 -0.42 0.68 Log Net PPE Unmatched 3.99 3.58 16.10 1.69 0.09 Matched 3.99 4.11 -5.00 69.20 -0.40 0.69
31
Table 7: Post-Acquisition Performance Characteristics (Propensity Score Matching and Difference-in-Differences)
Notes: This table documents difference-in-difference estimates for the post-acquisition performance between acquired and "matched control" firms that were not acquired. Panels A-D report post acquisition OIBD/Assets, log employment, log net PP&E and log sales, respectively. t={0,5} denotes the post-acqusition year. The second column presents the matched coefficient estimate. Estimates in bold indicate statistical differences in measured post-acquisition performance for acquired and matched non-acquired firms. Common support refers to the set of firms for whom the propensity score range overlaps across control (non-acquired) and treated (acquired) firms. Off support refers to the number of treated (acquired) firms whose propensity score lay above the maximum value or below the minimum value for the control (non-acquired) firms.
Panel A: Post-Acqusition Performance (OIBD/Asset) ! ! ! ! Common Support Off Support
t Matching Estimate
Bootstrapped Std. Err. Z-Stat P>|z| Untreated Treated Untreated Treated
Difference-in-Differences combined with Mahalanobis matching estimates 0 -0.058 0.035 -1.66 0.097 4,750 126 0 0 1 -0.016 0.034 -0.47 0.638 4,203 113 0 1 2 0.015 0.059 0.26 0.793 3,788 100 0 0 3 -0.007 0.059 -0.12 0.906 3,434 84 0 1 4 0.083 0.040 2.04 0.041 3,060 72 0 0 5 0.078 0.037 2.11 0.035 2,743 68 0 0
Panel B: Post-Acqusition Employment Common Support Off Support
t Matching Estimate
Bootstrapped Std. Err. Z-Stat P>|z| Untreated Treated Untreated Treated
Difference-in-Differences combined with Mahalanobis matching estimates 0 -0.089 0.051 -1.74 0.081 3,063 94 0 0 1 -0.164 0.071 -2.30 0.021 2,683 82 0 0 2 -0.202 0.168 -1.20 0.228 2,345 74 0 0 3 -0.268 0.220 -1.22 0.223 1,897 60 0 0 4 -0.234 0.199 -1.17 0.240 1,621 50 0 0 5 -0.389 0.269 -1.44 0.148 1,397 45 0 0
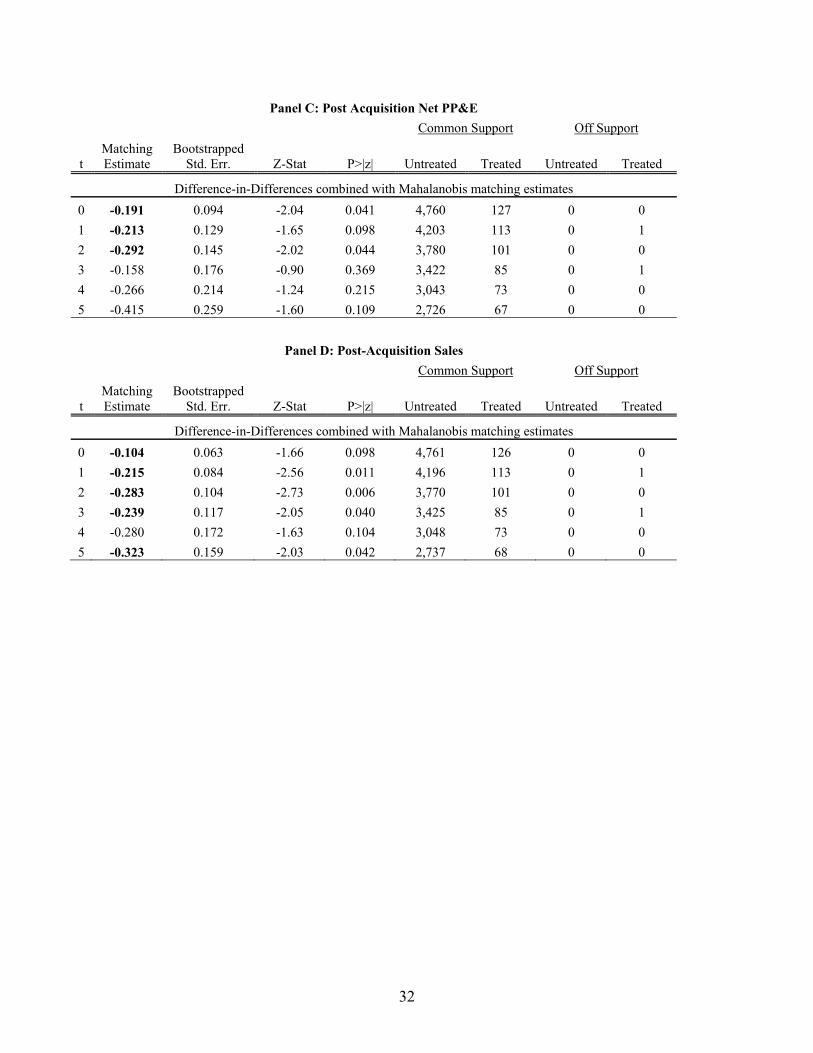
32
Panel C: Post Acquisition Net PP&E ! Common Support Off Support
t Matching Estimate
Bootstrapped Std. Err. Z-Stat P>|z| Untreated Treated Untreated Treated
Difference-in-Differences combined with Mahalanobis matching estimates 0 -0.191 0.094 -2.04 0.041 4,760 127 0 0 1 -0.213 0.129 -1.65 0.098 4,203 113 0 1 2 -0.292 0.145 -2.02 0.044 3,780 101 0 0 3 -0.158 0.176 -0.90 0.369 3,422 85 0 1 4 -0.266 0.214 -1.24 0.215 3,043 73 0 0 5 -0.415 0.259 -1.60 0.109 2,726 67 0 0
Panel D: Post-Acquisition Sales ! Common Support Off Support
t Matching Estimate
Bootstrapped Std. Err. Z-Stat P>|z| Untreated Treated Untreated Treated
Difference-in-Differences combined with Mahalanobis matching estimates 0 -0.104 0.063 -1.66 0.098 4,761 126 0 0 1 -0.215 0.084 -2.56 0.011 4,196 113 0 1 2 -0.283 0.104 -2.73 0.006 3,770 101 0 0 3 -0.239 0.117 -2.05 0.040 3,425 85 0 1 4 -0.280 0.172 -1.63 0.104 3,048 73 0 0 5 -0.323 0.159 -2.03 0.042 2,737 68 0 0
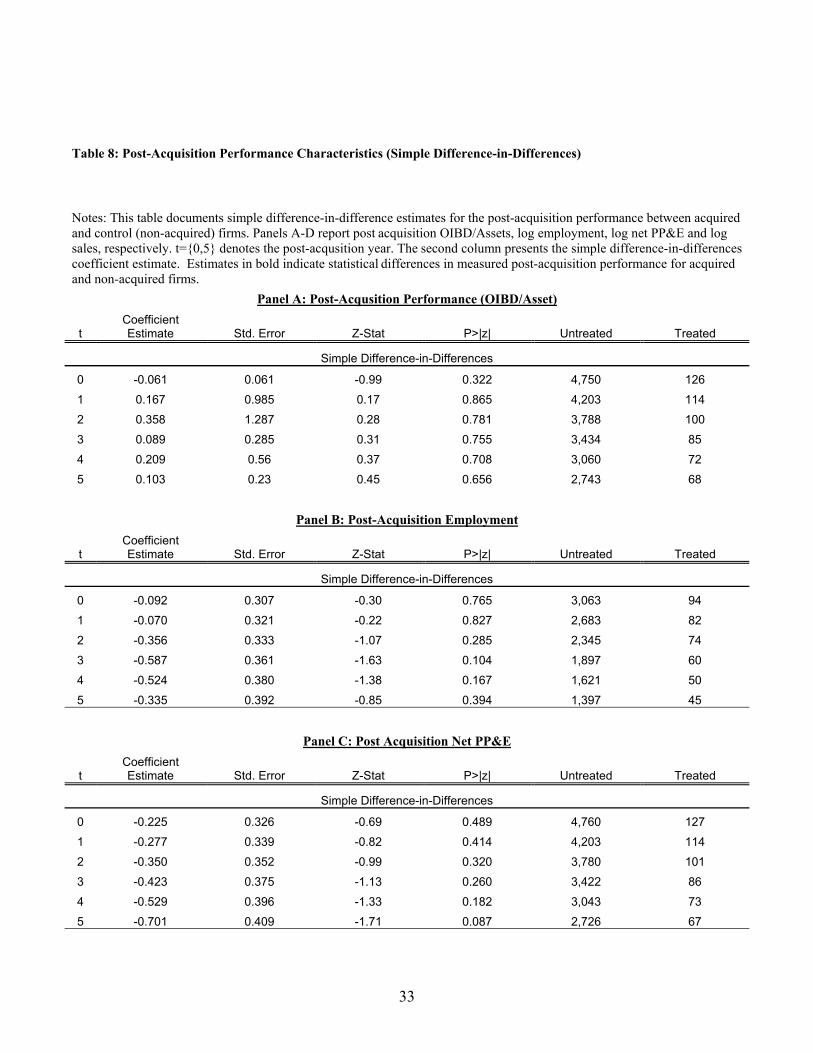
33
Table 8: Post-Acquisition Performance Characteristics (Simple Difference-in-Differences)
Notes: This table documents simple difference-in-difference estimates for the post-acquisition performance between acquired and control (non-acquired) firms. Panels A-D report post acquisition OIBD/Assets, log employment, log net PP&E and log sales, respectively. t={0,5} denotes the post-acqusition year. The second column presents the simple difference-in-differences coefficient estimate. Estimates in bold indicate statistical differences in measured post-acquisition performance for acquired and non-acquired firms.
Panel A: Post-Acqusition Performance (OIBD/Asset)
t Coefficient Estimate Std. Error Z-Stat P>|z| Untreated Treated
Simple Difference-in-Differences
0 -0.061 0.061 -0.99 0.322 4,750 126
1 0.167 0.985 0.17 0.865 4,203 114
2 0.358 1.287 0.28 0.781 3,788 100
3 0.089 0.285 0.31 0.755 3,434 85
4 0.209 0.56 0.37 0.708 3,060 72
5 0.103 0.23 0.45 0.656 2,743 68
! ! ! ! ! !Panel B: Post-Acquisition Employment
t Coefficient Estimate Std. Error Z-Stat P>|z| Untreated Treated
Simple Difference-in-Differences
0 -0.092 0.307 -0.30 0.765 3,063 94
1 -0.070 0.321 -0.22 0.827 2,683 82
2 -0.356 0.333 -1.07 0.285 2,345 74
3 -0.587 0.361 -1.63 0.104 1,897 60
4 -0.524 0.380 -1.38 0.167 1,621 50
5 -0.335 0.392 -0.85 0.394 1,397 45
! ! ! ! ! !Panel C: Post Acquisition Net PP&E
t Coefficient Estimate Std. Error Z-Stat P>|z| Untreated Treated
Simple Difference-in-Differences
0 -0.225 0.326 -0.69 0.489 4,760 127
1 -0.277 0.339 -0.82 0.414 4,203 114
2 -0.350 0.352 -0.99 0.320 3,780 101
3 -0.423 0.375 -1.13 0.260 3,422 86
4 -0.529 0.396 -1.33 0.182 3,043 73
5 -0.701 0.409 -1.71 0.087 2,726 67
! ! ! ! ! !

34
Panel D: Post-Acquisition Sales
t Coefficient Estimate Std. Error Z-Stat P>|z| Untreated Treated
Simple Difference-in-Differences
0 -0.063 0.296 -0.21 0.831 4,761 126
1 -0.220 0.306 -0.72 0.473 4,196 114
2 -0.335 0.315 -1.06 0.288 3,770 101
3 -0.379 0.335 -1.13 0.258 3,425 86
4 -0.460 0.357 -1.29 0.197 3,048 73
5 -0.454 0.364 -1.25 0.213 2,737 68
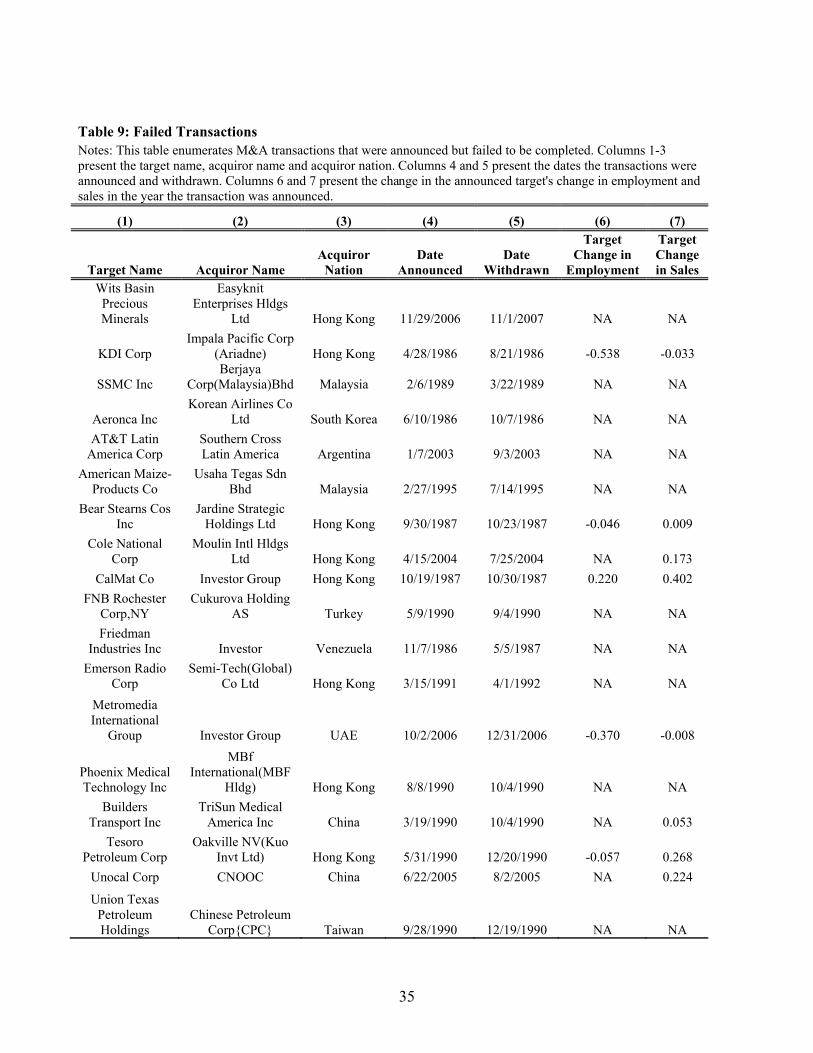
35
Table 9: Failed Transactions Notes: This table enumerates M&A transactions that were announced but failed to be completed. Columns 1-3 present the target name, acquiror name and acquiror nation. Columns 4 and 5 present the dates the transactions were announced and withdrawn. Columns 6 and 7 present the change in the announced target's change in employment and sales in the year the transaction was announced.
(1) (2) (3) (4) (5) (6) (7)
Target Name Acquiror Name Acquiror
Nation Date
Announced Date
Withdrawn
Target Change in
Employment
Target Change in Sales
Wits Basin Precious Minerals
Easyknit Enterprises Hldgs
Ltd Hong Kong 11/29/2006 11/1/2007 NA NA
KDI Corp Impala Pacific Corp
(Ariadne) Hong Kong 4/28/1986 8/21/1986 -0.538 -0.033
SSMC Inc Berjaya
Corp(Malaysia)Bhd Malaysia 2/6/1989 3/22/1989 NA NA
Aeronca Inc Korean Airlines Co
Ltd South Korea 6/10/1986 10/7/1986 NA NA AT&T Latin
America Corp Southern Cross Latin America Argentina 1/7/2003 9/3/2003 NA NA
American Maize-Products Co
Usaha Tegas Sdn Bhd Malaysia 2/27/1995 7/14/1995 NA NA
Bear Stearns Cos Inc
Jardine Strategic Holdings Ltd Hong Kong 9/30/1987 10/23/1987 -0.046 0.009
Cole National Corp
Moulin Intl Hldgs Ltd Hong Kong 4/15/2004 7/25/2004 NA 0.173
CalMat Co Investor Group Hong Kong 10/19/1987 10/30/1987 0.220 0.402 FNB Rochester
Corp,NY Cukurova Holding
AS Turkey 5/9/1990 9/4/1990 NA NA Friedman
Industries Inc Investor Venezuela 11/7/1986 5/5/1987 NA NA Emerson Radio
Corp Semi-Tech(Global)
Co Ltd Hong Kong 3/15/1991 4/1/1992 NA NA Metromedia International
Group Investor Group UAE 10/2/2006 12/31/2006 -0.370 -0.008
Phoenix Medical Technology Inc
MBf International(MBF
Hldg) Hong Kong 8/8/1990 10/4/1990 NA NA Builders
Transport Inc TriSun Medical
America Inc China 3/19/1990 10/4/1990 NA 0.053 Tesoro
Petroleum Corp Oakville NV(Kuo
Invt Ltd) Hong Kong 5/31/1990 12/20/1990 -0.057 0.268 Unocal Corp CNOOC China 6/22/2005 8/2/2005 NA 0.224
Union Texas Petroleum Holdings
Chinese Petroleum Corp{CPC} Taiwan 9/28/1990 12/19/1990 NA NA
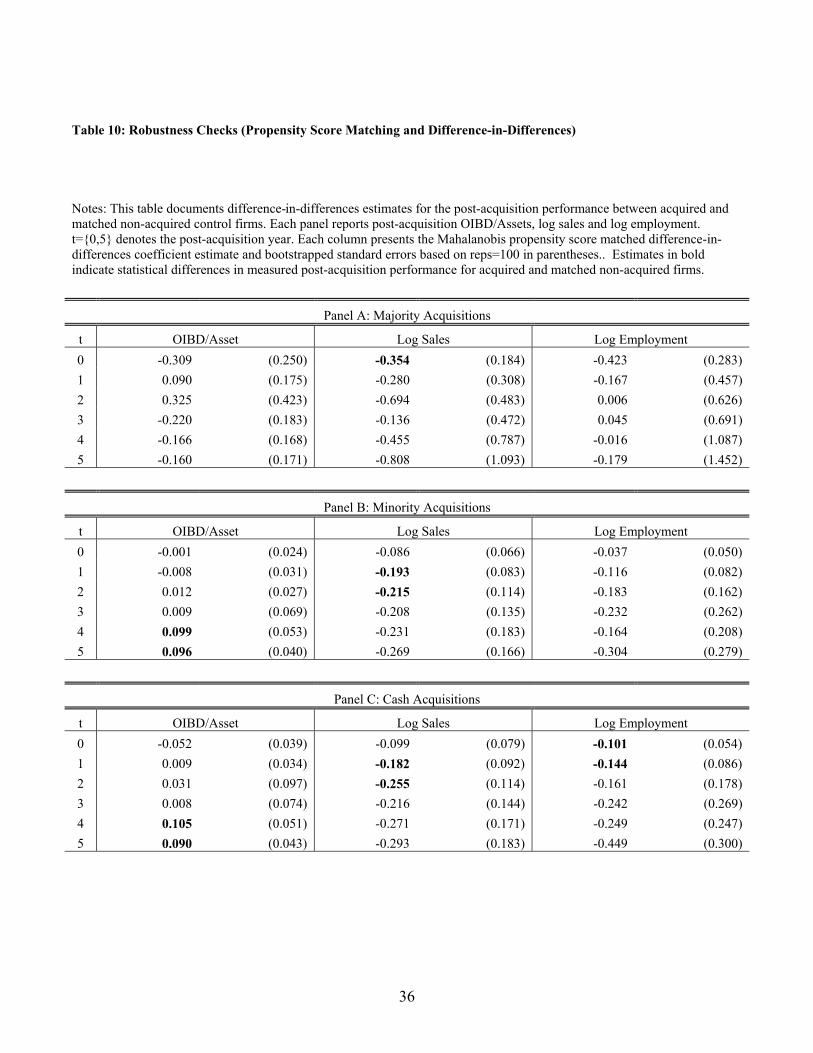
36
Table 10: Robustness Checks (Propensity Score Matching and Difference-in-Differences)
Notes: This table documents difference-in-differences estimates for the post-acquisition performance between acquired and matched non-acquired control firms. Each panel reports post-acquisition OIBD/Assets, log sales and log employment. t={0,5} denotes the post-acquisition year. Each column presents the Mahalanobis propensity score matched difference-in-differences coefficient estimate and bootstrapped standard errors based on reps=100 in parentheses.. Estimates in bold indicate statistical differences in measured post-acquisition performance for acquired and matched non-acquired firms. ! ! ! ! ! ! !
Panel A: Majority Acquisitions
t OIBD/Asset Log Sales Log Employment 0 -0.309 (0.250) -0.354 (0.184) -0.423 (0.283) 1 0.090 (0.175) -0.280 (0.308) -0.167 (0.457) 2 0.325 (0.423) -0.694 (0.483) 0.006 (0.626) 3 -0.220 (0.183) -0.136 (0.472) 0.045 (0.691) 4 -0.166 (0.168) -0.455 (0.787) -0.016 (1.087) 5 -0.160 (0.171) -0.808 (1.093) -0.179 (1.452)
Panel B: Minority Acquisitions
t OIBD/Asset Log Sales Log Employment 0 -0.001 (0.024) -0.086 (0.066) -0.037 (0.050) 1 -0.008 (0.031) -0.193 (0.083) -0.116 (0.082) 2 0.012 (0.027) -0.215 (0.114) -0.183 (0.162) 3 0.009 (0.069) -0.208 (0.135) -0.232 (0.262) 4 0.099 (0.053) -0.231 (0.183) -0.164 (0.208) 5 0.096 (0.040) -0.269 (0.166) -0.304 (0.279)
Panel C: Cash Acquisitions
t OIBD/Asset Log Sales Log Employment 0 -0.052 (0.039) -0.099 (0.079) -0.101 (0.054) 1 0.009 (0.034) -0.182 (0.092) -0.144 (0.086) 2 0.031 (0.097) -0.255 (0.114) -0.161 (0.178) 3 0.008 (0.074) -0.216 (0.144) -0.242 (0.269) 4 0.105 (0.051) -0.271 (0.171) -0.249 (0.247) 5 0.090 (0.043) -0.293 (0.183) -0.449 (0.300)
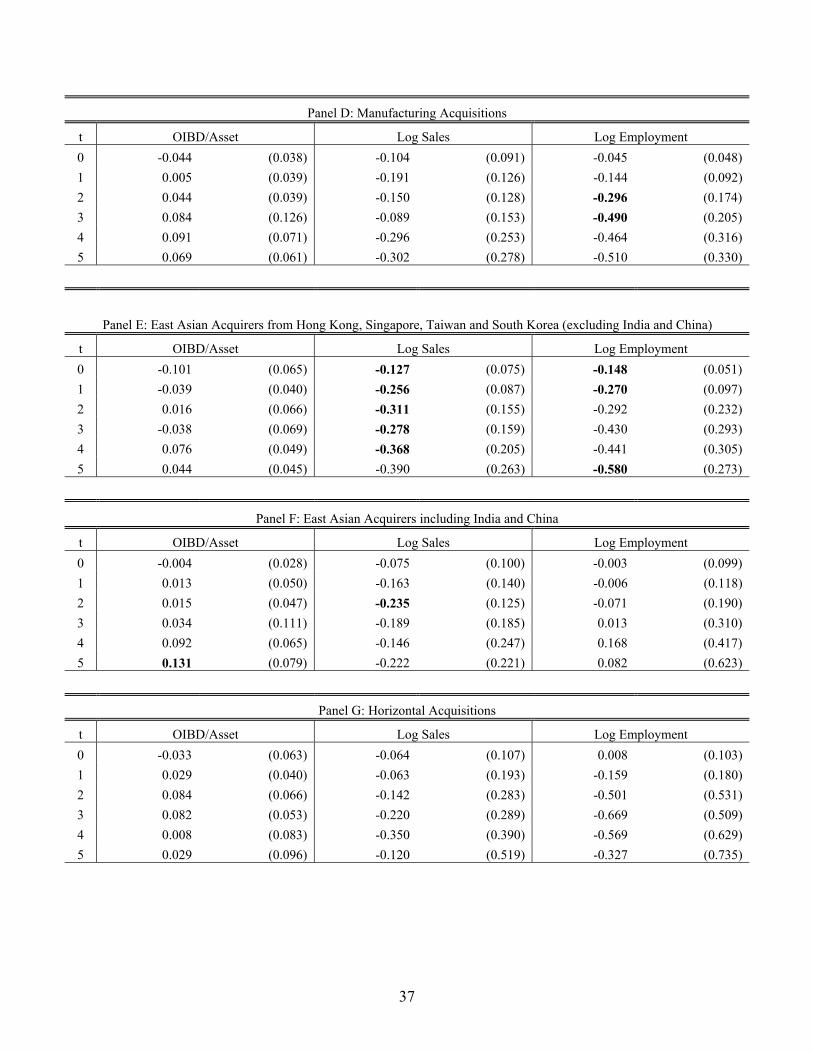
37
Panel D: Manufacturing Acquisitions
t OIBD/Asset Log Sales Log Employment 0 -0.044 (0.038) -0.104 (0.091) -0.045 (0.048) 1 0.005 (0.039) -0.191 (0.126) -0.144 (0.092) 2 0.044 (0.039) -0.150 (0.128) -0.296 (0.174) 3 0.084 (0.126) -0.089 (0.153) -0.490 (0.205) 4 0.091 (0.071) -0.296 (0.253) -0.464 (0.316) 5 0.069 (0.061) -0.302 (0.278) -0.510 (0.330)
Panel E: East Asian Acquirers from Hong Kong, Singapore, Taiwan and South Korea (excluding India and China)
t OIBD/Asset Log Sales Log Employment 0 -0.101 (0.065) -0.127 (0.075) -0.148 (0.051) 1 -0.039 (0.040) -0.256 (0.087) -0.270 (0.097) 2 0.016 (0.066) -0.311 (0.155) -0.292 (0.232) 3 -0.038 (0.069) -0.278 (0.159) -0.430 (0.293) 4 0.076 (0.049) -0.368 (0.205) -0.441 (0.305) 5 0.044 (0.045) -0.390 (0.263) -0.580 (0.273)
Panel F: East Asian Acquirers including India and China
t OIBD/Asset Log Sales Log Employment 0 -0.004 (0.028) -0.075 (0.100) -0.003 (0.099) 1 0.013 (0.050) -0.163 (0.140) -0.006 (0.118) 2 0.015 (0.047) -0.235 (0.125) -0.071 (0.190) 3 0.034 (0.111) -0.189 (0.185) 0.013 (0.310) 4 0.092 (0.065) -0.146 (0.247) 0.168 (0.417) 5 0.131 (0.079) -0.222 (0.221) 0.082 (0.623)
Panel G: Horizontal Acquisitions
t OIBD/Asset Log Sales Log Employment 0 -0.033 (0.063) -0.064 (0.107) 0.008 (0.103) 1 0.029 (0.040) -0.063 (0.193) -0.159 (0.180) 2 0.084 (0.066) -0.142 (0.283) -0.501 (0.531) 3 0.082 (0.053) -0.220 (0.289) -0.669 (0.509) 4 0.008 (0.083) -0.350 (0.390) -0.569 (0.629) 5 0.029 (0.096) -0.120 (0.519) -0.327 (0.735)
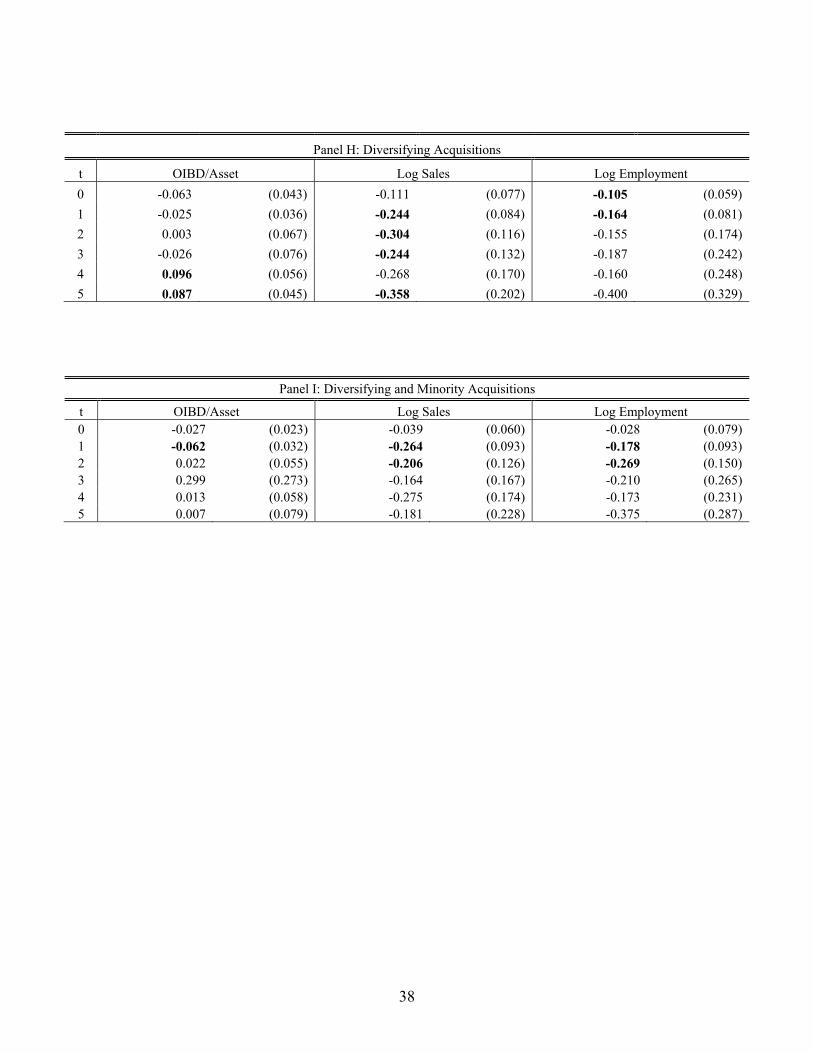
38
Panel H: Diversifying Acquisitions
t OIBD/Asset Log Sales Log Employment 0 -0.063 (0.043) -0.111 (0.077) -0.105 (0.059) 1 -0.025 (0.036) -0.244 (0.084) -0.164 (0.081) 2 0.003 (0.067) -0.304 (0.116) -0.155 (0.174) 3 -0.026 (0.076) -0.244 (0.132) -0.187 (0.242) 4 0.096 (0.056) -0.268 (0.170) -0.160 (0.248) 5 0.087 (0.045) -0.358 (0.202) -0.400 (0.329)
Panel I: Diversifying and Minority Acquisitions
t OIBD/Asset Log Sales Log Employment 0 -0.027 (0.023) -0.039 (0.060) -0.028 (0.079) 1 -0.062 (0.032) -0.264 (0.093) -0.178 (0.093) 2 0.022 (0.055) -0.206 (0.126) -0.269 (0.150) 3 0.299 (0.273) -0.164 (0.167) -0.210 (0.265) 4 0.013 (0.058) -0.275 (0.174) -0.173 (0.231) 5 0.007 (0.079) -0.181 (0.228) -0.375 (0.287)