Embed Size (px)
Citation preview

J.P. Morgan & Co.
Foreign Future Variation Margin Reconciliation Automating a Manual Reconciliation Process
Kevin Kell, Jiahui Li, Daniel Matos, Lili Zhang (Co-author of Appendix II) 12/16/2014

Contents Introduction .................................................................................................................................................. 5
Executive Summary ................................................................................................................................... 5
Abstract ..................................................................................................................................................... 5
Acknowledgement .................................................................................................................................... 6
Purpose ..................................................................................................................................................... 6
Background ................................................................................................................................................... 6
Company ................................................................................................................................................... 6
History ................................................................................................................................................... 6
Structure ............................................................................................................................................... 6
Foreign Futures ......................................................................................................................................... 7
Futures .................................................................................................................................................. 7
Variation Margin ................................................................................................................................... 7
Foreign Futures ..................................................................................................................................... 8
Variation Margin Application .................................................................................................................... 8
Methodology ................................................................................................................................................. 9
Introduction .............................................................................................................................................. 9
Analysis ..................................................................................................................................................... 9
Data Sources ......................................................................................................................................... 9
Current Reconciliation Process ........................................................................................................... 10
Analysis Results ................................................................................................................................... 13
Design ...................................................................................................................................................... 14
Future Process Options ....................................................................................................................... 14
Selected Future Process ...................................................................................................................... 16
Development........................................................................................................................................... 17
Front End ............................................................................................................................................. 17
Server .................................................................................................................................................. 18
Database ............................................................................................................................................. 18
Eagle File Storage ................................................................................................................................ 19
Report Generation .............................................................................................................................. 20
Coding Style......................................................................................................................................... 21
Testing ..................................................................................................................................................... 21

Results ......................................................................................................................................................... 22
Conclusion ................................................................................................................................................... 24
Future Work and Recommendations ...................................................................................................... 24
Time Distribution .................................................................................................................................... 26
Reflections .............................................................................................................................................. 26
Appendix I ................................................................................................................................................... 27
Appendix II: Independent Studies of Understanding Futures Contracts .................................................... 28
Introduction ............................................................................................................................................ 28
Background ............................................................................................................................................. 28
Risks of Trading Futures .......................................................................................................................... 29
How Futures Trading Works ................................................................................................................... 32
The Model and Pricing ............................................................................................................................ 34
Works Cited ................................................................................................................................................. 36
Figure 1: Illustration of the flow of money in a futures contract source:
http://www.foex.fi/index.php?page=alias-3 ................................................................................................ 8
Figure 2: Screenshot of the Foreign Futures Dashboard, part of the Variation Margin application ............ 9
Figure 3: Flow of data to the operations team. The result is the three excel files containing data
highlighted in red. ....................................................................................................................................... 10
Figure 4: Summary of reconciliation process steps and what each step compares. .................................. 11
Figure 5: Summary of the "Recon" step of the reconciliation process ....................................................... 11
Figure 6: Summary of the "No Activity" step of the reconciliation process ............................................... 12
Figure 7: Summary of the "ForCash" step of the reconciliation process .................................................... 12
Figure 8: Summary of the "Account Tie Out" step of the reconciliation process ....................................... 13
Figure 9: Manual steps involved with each step of the reconciliation process. The steps in the dotted
square will be eliminated by the new features that will be added to the Variation Margin Application. . 13
Figure 10: Feature option illustration. The different branches in the diagram represent potential
workflows based on the options that are chosen. ..................................................................................... 14
Figure 11: Chosen features. This is the new workflow based on the features that were chosen to add.
This diagram is derived from figure 10 and has had the workflows that were not chosen eliminated. .... 16
Figure 12: Unified report mockup ............................................................................................................... 17
Figure 13: Account Tie Out report mockup ................................................................................................ 16

Figure 14: Application architecture overview ............................................................................................. 19
Figure 15: Request to store eagle file illustration ....................................................................................... 19
Figure 16: Request for error report illustration .......................................................................................... 20
Figure 17: Chosen features. This is the same as figure 11. It has been inserted here for convenience. ... 21
Figure 20: Screenshot of unified error report view .................................................................................... 23
Figure 18: New eagle file upload window ................................................................................................... 22
Figure 19: New menu options ..................................................................................................................... 22
Figure 21: Time improvement .................................................................................................................... 23
Figure 22: Time utilization to complete the project. .................................................................................. 25

Introduction
Executive Summary Technology is an important aspect in any industry nowadays. It has helped improve the living and
working qualities of many individuals in society by enhancing the development of products and
performance of duties in any environment. For instance, computers are an indispensable tool in our
daily lives. They have helped us by organizing large amounts of information, automating daily processes
and reducing time consumption of necessary tasks. Like most aspects of daily life, the financial has been
greatly affected by changes in technology. Tasks that used to be done manually now can be completed
automatically by the use of different technologies.
JP Morgan Chase & Co. is one of the many financial institutions that are fully invested in the use of
technology in order to improve their business. Often, technological improvements can save the firm
large amounts of money. In addition to saving money, technology can help a firm comply with new
regulations.
One task that has yet to be automated within JP Morgan is the reconciliation process of foreign futures.
The accurate comparison of foreign future information between the firm and its counter parties ensures
the integrity of trades made by JP Morgan. However, the current process requires several manual steps
that increase the chance of human error and it requires a considerable amount of time. JP Morgan has
decided that is time to enhance this process by automating several of the manual steps.
Our team analyzed the current process and determined which steps of the process could be automated.
We took the manual steps and translated them into features that could be added to an existing
application. The next challenge was to develop those features and test them with the users. After the
implementation the new process requires a fraction of the time and presents lower risk for error. In
addition to this, the application displays the data in more simplified manner allowing an easier analysis.
Abstract The Operations team is in charge of making comparisons between an Eagle file (file that holds the firms
accounts information for trades) and a Broker file (The file that holds the accounts information of the
broker firm in charge of the trades). This comparison is called the “Reconciliation Process”. For many
years the Reconciliation process has been completed manually. However, the process has become
inconvenient for the Operations team because it requires a large amount of time to be completed,
several files to store the compared data and is prone to human error.
The MQP team was assigned the task of enhancing the current process. The team came up with several
features that could be implemented into the Variation Margin application in order to reduce the time
the Operations team would need to complete the process by analyzing the current steps required to
complete such comparisons.
Several features were implemented into the Variation margin application. These would include a
Unified Report button, which would allow the user to upload Eagle files into the data base and view a
new Unified report that would include several of the processes in one screen. The resulting product

reduced the time needed to complete the Reconciliation process by 96%, ensuring a more reliable
analysis and simpler method to accomplish the process.
Acknowledgement The team would like to thank for J.P. Morgan Chase & Co. that gave us this opportunity to get exposure
with both business and technology side under Asset Management division. In addition, we appreciate
the guidance from our sponsor, Pradeep Uderani and the technical programming support from Dan
Molda and William Freeman. The team would also like to thank for the professors: Prof. Arthur
Gerstenfeld, Prof. Kevin Sweeney, Prof. Micha Hofri and Prof. Xinming Huang for their assistance and
suggestions through the whole project.
Purpose The current process of reconciling foreign future accounts requires several manual steps. The purpose of
this project is to outline the requirements involved with reconciling foreign future accounts and specify
the technical measures that can be taken to minimize the manual steps necessary to complete this
process. Ideally this will reduce the time needed to complete each step of this process and significantly
reduce any possibilities of human error. The applications involved, sources of data necessary, and the
resulting workflow will be described in detail.
Background
Company This project was completed in a seven week period while the team worked at J.P. Morgan Chase & Co.
J.P. Morgan is among the most respected banks in the world. It is the largest in terms of total assets, and
prides itself on its reputation as a reliable financial institution. It operates in more than 60 countries and
has approximately 260,000 employees (J.P. Morgan Chase & Co., 2014).
History
J.P. Morgan Chase & Co. had its origin in the year 1799 when the earliest predecessor firm, The
Manhattan Company, was formed. The first firm to bear the name J.P. Morgan was The New York firm,
which changed its name in 1895 when J. Pierpont Morgan took control (J.P. Morgan Chase & Co., 2014).
Over the years, many mergers have grown and shaped the firm. Some of the most significant mergers
include the merger of Chase National Bank and The Bank of the Manhattan Company in 1955 and the
merger of J.P. Morgan with The Chase Manhattan Corporation in 2000 (J.P. Morgan Chase & Co., 2014).
Structure
J.P. Morgan Chase & Co. (JPM) has businesses in many lines of business that are quite varied. The one
that is relevant to this project is Asset Management. Led by Mary Erdoes, Asset Management is
responsible for approximately 1.7 trillion dollars coming from a combination of corporations and high
net worth individuals (J.P. Morgan Chase & Co., 2014). There is a technology branch of Asset
Management which develops software to support the business side of Asset Management. The users of
the final product of this project are on the business side of Asset Management.

Specifically, the users are in the operations division. The operations division is what is commonly known
as the Middle Office and is responsible for settling trades, monitoring and tracking financial information,
and making sure regulations are followed. Most of the trade settling is done electronically these days
and is almost entirely automatic. For some more complex assets, such as foreign futures, the process
still involves a human copy and pasting data into excel and manually searching for discrepancies.
Reconciling foreign futures variation margins is one of the responsibilities of the operations team, and
enhancing that reconciliation process is the focus of this project.
Foreign Futures Foreign futures are a complex asset type. They are futures that have been purchased using a foreign
currency, so the value of the foreign future in US dollars depends on two things. The first is the value of
the future, and the second is the exchange rate between the base currency (the currency used to
purchase the foreign future) and US dollars.
Futures
To fully understand foreign futures, one must first understand futures. A simplified description of a
future contract is an agreement between a buyer and a seller to exchange a specified quantity of a
specified asset at a specified time for a specified price (Heakal). Initially, futures were usually purchased
for commodities such as wheat. The future would protect both parties from radical changes in wheat
price. Today, the asset can also be something other than a commodity, such as a stock price. Futures
such as these are known as financial futures.
Modern future contracts do not require the asset to actually be exchanged. Instead, the parties will
exchange money in a way so that the agreed quantity of the asset could be bought or sold at the agreed
price, despite any changes in the price since the agreement. For example, let us say that a future
contract is made between a buyer and seller to exchange 100 bales of hay for $5 each in one year. After
a year when the contract is up, the price of hay has gone up to $7 per bale. If the buyer wanted to buy
100 bales of hay at that price he would have to pay $700. Fortunately for the buyer, he made the future
contract to buy 100 bales at only $5 each. The total cost at that price would be $500. So, instead of the
seller actually giving the buyer 100 bales of hay, he simply gives him $200, or the difference between the
agreed price and the current market price. Now, if the buyer chooses, he can get 100 bales of hay by
only paying $500 of his own money and $200 of the counterparty. Keep in mind, that this way of
managing futures does not require the buyer to actually buy hay. If he chooses, he can just keep the
$200. In the same way, if the price of hay had gone down, the buyer would owe the seller money to
make up the difference, but the seller would not actually need to sell hay.
Variation Margin
Futures contracts as described above have a big risk to them. There is a risk that at the end of the
contract, one of the parties will not be able to pay the amount that they owe. To continue the above
example, it is possible that in between the signing of the contract and the end of the contract, the seller
went bankrupt. At the end of the contract, they will owe the buyer $200 but will not be able to pay. In
this situation, the buyer would lose $200 that was rightfully his. To combat this, futures contracts are
settled on a daily basis. This means that each day, depending on the price change of the asset, the buyer

and seller will exchange the difference. For example, if the price of hay goes up during the first day of
the contract, the seller will pay the difference as if it was the end of the contract. If the next day the
price goes back down, the buyer will pay the seller the difference. This way, if one party goes bankrupt,
the other party only stands to lose the money that would have been owed to them that day.
Figure 1: Illustration of the flow of money in a futures contract source: http://www.foex.fi/index.php?page=alias-3
The difference that is paid daily as described above is what is known as a variation margin. In the
context of the Asset Management Operations Team, this amount must be agreed upon and double
checked to ensure that we are not paying too much or too little and that no mistakes are made. Each
day a manual reconciliation process must be completed to ensure the integrity of the future.
Foreign Futures
As mentioned above, a foreign future is a future that has been purchased using a foreign currency. An
example would be a future contract for wool purchased in British pounds (GBP). The account will be in
GBP, and the variation margin payments will be in GBP. The value of the account to JPM does not rely
solely on the price of wool. Since any earnings or losses have to be translated into US dollars (USD) the
value of the account relies on the conversion rate between USD and GBP in addition to the price of the
future. In the event that one of JPM’s foreign futures is doing well and is earning money day after day,
they do not want to immediately withdraw the money. It is more cost effective to wait until the balance
builds up and transfer it from GBP to USD all at the same time. One of the things that the operations
team needs to do on a daily basis is to watch the balance and wait for the best time to convert back to
USD.
Variation Margin Application The operations team currently uses an application called Variation Margin to assist them with the
foreign futures reconciliation process. The Variation Margin application has several functions. It assists
the operations team with reconciling issues with both futures and cleared OTC and provides features
that allow users to view data, upload data, and correct errors.

As can be seen in the screenshot below, the application displays data in a spreadsheet like way, and the
user can navigate to other views by using the dropdown menus. The screenshot has had account
numbers blacked out to protect sensitive information.
Figure 2: Screenshot of the Foreign Futures Dashboard, part of the Variation Margin application
Within the Variation Margin application, is the Foreign Futures Dashboard. This dashboard displays all
the data relevant to foreign futures. The screenshot above is showing the Foreign Futures Dashboard.
When the reconciliation process is begun, the operations team will download this data as a CSV file and
use the data to run the process using several excel documents.
Methodology
Introduction Four phases of development were used to produce the final product. The first phase was to analyze the
current process workflow to identify the problems of the current system and the areas for
improvement. Second was a design phase that determined what the final product should look like based
on the requirements and expectations of the users. Then the features were developed and finally it was
tested. The following sections describe our methods in completing these phases.
Analysis
Data Sources
The operations team gets data from three data sources, which are labeled emailed Eagle File, Variation
Excel File and Broker File in the diagram below. The flow chart describes the flow of data to the
operations team.

Figure 3: Flow of data to the operations team. The result is the three excel files containing data highlighted in red.
The process begins at the eagle database, which stores all the accounts, cash, and trades information. At
night, there are two batch processes that run to deliver the data to the operations team. The first
process emails the eagle file from the eagle database and the second process updates data onto the
Variation Margin application. At the same time, the broker emails the broker file, which is manually
uploaded onto the Variation Margin application. Then the operations team will manually download data
from the variation margin application as a CSV file, which is called Variation Margin Excel File. After this
process, the operations team has received three data sources, which are labeled in the above diagram
as Emailed Eagle Excel File, Variation Margin Excel File, and Broker Excel File. Then the operations team
will copy and paste the data from these three excel files onto excel sheets to start the reconciliation
analysis.
Current Reconciliation Process
The reconciliation process is comprised of four steps. The operations team calls them Recon, No Activity,
ForCash and Account Tie Out. Each step compares two items to determine if there is a situation that
needs attention from the operations team. Recon and ForCash compare balances from different sources
to ensure that there are no disagreements. No Activity compares today’s balance with yesterdays to see
if the account is active. Account Tie Out compares the accounts that are included in one data source
with the accounts included in another to ensure no accounts are left out. The following sections will
explain these four steps in detail and the process that the operations team currently goes through to
complete each step.
(2) Manually uploaded
(1) Emailed nightly from
(3)
Manually
(1) Updated nightly by
(1) Emailed nightly by
Variation
Emailed Eagle Excel
Broker Excel File
Variation Margin Excel
Eagle
Broker
Operati

Figure 4: Summary of reconciliation process steps and what each step compares.
Recon
The first step is Recon, which compares the application balance with broker balance. If there is any
difference, the analyst will raise and reconcile the issue with the counterparty or broker. The following
flow chart details the steps:
Figure 5: Summary of the "Recon" step of the reconciliation process
1. User accesses Foreign Futures Dashboard and
2. User downloads all data from Foreign Futures Dashboard data as a CSV file
3. User copies CSV file into the Error! Reference source not found.
4. User isolates the columns in spreadsheet
5. User compares columns to identify discrepancies between the broker balance and the Foreign
Futures Dashboard balance
6. User refers to the “Difference” column on sheet for indication of any discrepancies
No Activity
The second step is No Activity, which compares the previous day balance with the current day balance. If
the difference is zero for multiple days, it means the account is possibly inactive. The account balance
will be withdrawn if an account is found to be inactive. The following flowchart details the steps:
Recon
• Application Balance
• Broker Balance
No Activity
• Previous Day Balance
• Current Day Balance
ForCash
• Application Balance
• Eagle Balance
Account Tie Out
• Accounts in Broker Report
• Accounts in Eagle Report

Figure 6: Summary of the "No Activity" step of the reconciliation process
1. User downloads Foreign Futures Dashboard data as a CSV file
2. User copies data into the Error! Reference source not found.
3. User isolates the spreadsheet columns
4. Foreign Rec File checks to see if the previous day’s balance is the same as the current day’s
balance
5. Foreign Rec File fills in the column “No Activity” with the result
6. User determines which accounts have no trading activity by examining “No Activity” column
ForCash
The third step is ForCash, which compares the application balance with the eagle balance. This
difference could be caused by the commission fee that is stored by one side but not the other side. The
following flowchart details the steps:
Figure 7: Summary of the "ForCash" step of the reconciliation process
1. User gets all of the data from the Foreign Futures Dashboard
2. User gets all data from email received from Eagle
3. User gets all data received from Broker
4. User copies all data from the three sources into the Error! Reference source not found. .

5. The User uses the newly created ForCash Spreadsheet file to compares the balances from each
data from all sources for discrepancies
6. User looks primarily for balance differences between the Foreign Futures Dashboard data and the
emailed report from Eagle
Account Tie Out
The last step is Account Tie Out, which compares the number of accounts in broker report and the
number of accounts in eagle report. If there is any missing account, the analyst will figure out the
missing account and reconcile the issue with the counterparty or broker. The following flowchart details
the steps:
Figure 8: Summary of the "Account Tie Out" step of the reconciliation process
1. User receives Eagle report via email
2. User receives Broker report via email
3. User combines data from both sources into the Error! Reference source not found.
4. Account Tie Out File counts the number of accounts contained in the broker files and the number
of accounts in the Eagle report and summarizes the result
5. User looks to identify any missing accounts in either the broker files or the Eagle report
Analysis Results
Since the procedures involved with of each step of the processes described are somewhat are similar,
we summarized them into the following workflow. For each step of the reconciliation process, the
following manual steps must be completed:
Figure 9: Manual steps involved with each step of the reconciliation process. The steps in the dotted square will be eliminated by the new features that will be added to the Variation Margin Application.
Upload file to
application
Download application
data as CSV
Copy data to excel
Run analysis
Search for errors

After the data was uploaded onto the Variation Margin Application, the operations team will download
the application data as a CSV file. Then the operation analyst will copy and paste the data onto excel
sheets, conduct reconciliation analysis and identify the error accounts. However, there are some areas
need to be improved. Each step requires many manual procedures that demand a large amount of
attention and time, and it involves data in several locations. It is also hard to manually search for the
error accounts and examine the results. In order to solve these issues, the team determined that it was
possible to eliminate the manual steps, which are enclosed in the box, by adding features into the
current application.
Design Once the areas of improvement for the current application were determined, the new features were
designed by outlining the requirements and brainstorming ideas to fulfill the users’ requirements and
expectations.
Future Process Options
The following flowchart is the new feature options that were considered:
Figure 10: Feature option illustration. The different branches in the diagram represent potential workflows based on the options that are chosen.
Routine
Uploading broker file and eagle file are the daily steps that are required for the operations team to get
access to data sources. The files are parsed by the application and their data is extracted and stored in
the database for use when the reconciliation process is run.

Recon, No Activity, & ForCash
The Recon, No Activity and ForCash processes are currently being computed, stored, and displayed in
separate reports (e.g. Excel sheets). Our goal is to provide options to simplify the process of generating
and viewing these reports. To simplify the use of the reports that are generated, the results can be
combined so that they can be viewed all at once. These options would include (1) a combination of all
reports, (2) a unified Recon and No Activity report and individual ForCash report, (3) a unified Recon and
ForCash report and Individual No Activity report, and (4) Individual reports for each of the processes (as
it currently is). These four options are explained below in detail:
(1) Unify All Reports
Instead of continually downloading the entire data set from the Foreign Futures Dashboard, a
user would be able to download a completed reconciliation report containing the results of the
Recon, No Activity and ForCash processes in a single CSV file.
(2) Unify Recon and No Activity Report – Individual ForCash Report
This option would display the results of the Recon and No Activity processes as a unified report.
The ForCash data set would be displayed in a separate individual report.
(3) Unify Recon and For Cash Report – Individual No Activity Report
This option would display the results of the Recon and ForCash processes as a unified report.
The No Activity data set would be displayed in a separate individual report.
(4) Individual Recon, No Activity, and ForCash Reports
This option would separate the data set for each of the current processes (Recon, No Activity and
ForCash) into individual reports. The users are currently using this method.
The extent to which the Recon, No Activity, and ForCash reports can be unified relies upon whether or
not the data will make sense when put together.
Column Filtering
In order to only get the records that are relevant to a given analysis, a feature would be added to the
Foreign Futures Dashboard to allow the user to filter out unnecessary columns for the analysis of the
each process. This feature would include a download button that only downloads the selected columns
as a CSV file. This option could be used to generate any combination of columns, in order to provide
more flexible and simpler reports in the future.
Account Tie Out
The Account Tie Out test should be displayed separately since it requires the application to find and list
accounts that appear on one data source but not the others.
Error Display
New Error Screen
A new screen could be added to the Variation Margin Application that would collect discrepancies
among the data sources. A user could easily see what problems are occurring and which accounts are
causing them. If necessary, the screen could contain a report of the accounts in questions and enable
the user to export the report as a CSV file

New Error Column
Alternatively, a new column could be added to the current Variation Margin Application screen that
would contain a message indicating the records causing errors. The records that cause errors would be
highlighted in a different color. This will allow the problem causing records to be quickly identified
without the complexity of creating a new screen in the Variation Margin application.
Output
Export to CSV
A CSV file report can be obtain directly from the Variation Margin application. This file is downloaded by
the user, copied and pasted into an excel sheet and then formatted into the reports that are to be
analyzed.
Print from Dashboard
To avoid the process of downloading of CSV files, copying and pasting data, and analyzing the data in an
excel sheet, the Variation Margin application could have the option to print a reconciliation report
directly from the web page.
Fix Eagle Discrepancies
One of the major checks that are made in the current process is to ensure that the data from the
emailed Eagle report and the Foreign Futures Dashboard are the same. Ideally there should not be any
difference since both of these sources get their data from the same place (the Eagle database).
If this issue could be isolated and resolved then the ForCash step of the current process could be
removed and only the Recon, No Activity, and Account Tie Out will be needed. In this scenario, only the
broker files would have to be uploaded to the Variation Margin application and all error checking could
be done there. It is unclear whether this is an issue that can be resolved, and if it can be resolved it is
unknown what is necessary.
Selected Future Process
Several features will be added to the Variation Margin Application to simplify and further automate this
process.
Figure 11: Chosen features. This is the new workflow based on the features that were chosen to add. This diagram is derived from figure 10 and has had the workflows that were not chosen eliminated.

A feature allowing for Eagle Files to be uploaded and stored will be added. This way all the data used in
the reconciliation process (the broker file and the eagle file) will be available to the Variation Margin
application. The eagle file will be uploaded in a very similar way to how the broker files are currently
uploaded. The user will select the date and the file and click upload. The file will be parsed and its data
will be stored in the database for use later.
Since all the necessary data will be in the application, the tests can be run in the application without
using excel. After careful thought, it has been determined that it makes the most sense to display the
ForCash, Recon, and No Activity reports together. Since they only require that a difference be found
between various balances, the data that needs to be displayed is similar for each of them and it makes
sense to put them together. A mockup of how the data from Recon, No Activity, and ForCash can be
combined into one view can be seen below:
Figure 12: Unified report mockup
The Account Tie Out test should be displayed separately since it requires the application to find and list
accounts that appear on one data source but not the others. A mockup of how the Account Tie Out data
is displayed in below:
Development The Variation Margin application is built like most web apps. It has a front end which runs on the client’s
machine, a middle tier which runs on a server, and a back end database which runs on a dedicated
database machine. One challenge that was faced while developing the features to be added was the size
of the application. By J.P. Morgan standards, the application was not particularly large, but it still
presented a challenge to understand the existing application before new features could be added. The
first part of the development phase was spent sifting through the approximately 15,000 lines of
JavaScript on the client side and 43,000 lines of Java on the server side.
Front End
The front end, written in JavaScript, takes advantage of the Ext JS framework to create a model view
controller application. The client side actually has one more entity, called a store. The function of each
entity is the following:
Figure 13: Account Tie Out report mockup

View: Controls what the user sees. It sends all user interaction to the controller to be processed.
Controller: Works as an intermediary between the view and the model. If the view needs data to show
the user, the controller fetches it from the user. It handles all user input and mediates the flow of data
to the view.
Model: Holds the data needed for the application. In Ext JS, it is a file that defines the structure of the
data. A file maps name value pairs so data can be easily accessed.
Store: The store is responsible for determining when to fetch data from the server to refresh what is in
the models. It keeps track of the URL from which data should be requested, and when fresh data needs
to be retrieved.
Server
The middle tier, or server, is responsible for handling network requests from the client. It properly stores
any data sent from the client in the database and ensures the correct data is returned when the client
requests data. It is written in Java and uses both the Spring framework and Apache Hibernate.
Spring is used to handle network requests. The server uses Spring controllers to handle requests sent to
specific URLs. Spring makes it easy to get parameters and other information about the request to pass
on to internal methods. Spring is also used to reduce the number of dependencies within the
application. Dependencies are mapped in context xml files and spring takes care of them automatically
when the application is run.
Apache Hibernate is used to simplify access to the database. The Variation Margin application uses it in
the following way. Objects in the project are mapped to tables in the database using an xml
configuration file. The fields in the object relate to the columns in the table. A data access object is
created to provide methods for retrieving and storing data to the database. When those methods are
called, Hibernate uses the configuration files to automatically generate a query to send to the database.
For example, if the application needs to retrieve some data from the database, the application would
call a method in the data access object of the table containing the data. The method would
automatically generate a query to send to the database. It will automatically create the Java object,
which has been mapped to that table, and populate its fields with the data from the response. The
method will then return the populated object and the application can do whatever it needs to with the
data.
Database
The database for the Variation Margin application is a combination of Sybase databases and Oracle
databases. This project altered only the Oracle database. Oracle databases are high-grade relational
databases and are a standard for enterprise level applications. Relational databases have tables with a
number of columns in each table. The tables hold the data and the data are organized into the various
columns. The data can be queried using SQL, or structured query language.
To add the chosen features to the Variation Margin application, each of these entities needed to be
altered. Below is a brief overview of the changes that were made.

Figure 14: Application architecture overview
There were two major functions that needed to be added to the system. The first is the ability to upload
an eagle file and store the data it contained in the database. The second is to retrieve all the data
needed for the reconciliation tests, run the tests, and display the results to the user.
Eagle File Storage
To store the eagle file, the client needed a new view to allow the user to select a date and upload a file.
The controller for that view sends the file to the server in a network request once the upload is
complete. The client then waits for a success response from the server. Meanwhile, on the server side,
the file is received by a Spring controller and sent to a parser built to parse eagle files. The parser reads
through the excel file and populates a java object with the data it extracts. When it is done parsing, it
returns the populated object. The populated object is sent to a Spring service specifically designed to
store and retrieve eagle file data. The service sends the populated object to the data access object,
which generates an SQL query and sends it to the database.
The database stores the data in a table and sends a success response. The server gets the success
response and sends a success response to the client. Finally, the client gets the success response back
and can notify the user that the file was safely stored. Below is a diagram detailing this process.
Client Side
Create upload window view
Create error unified report view
Create controller to handle user actions
Create model to store error report data
Create store to retrieve data
Server Side
Create new controller to receive and direct
requests from client
Create new parser to parse Eagle File
Create new data access object to access
Database
Create new reconciliation service to
package data for sending
Database
Create new tables to store data

Report Generation
The second feature that needed to be added was the ability to aggregate all the data needed to produce
the Recon, No Activity, and ForCash reports, execute those reports, and then display the results to the
users. The process begins when the user requests the report by clicking on a button. The client will then
attempt to show the error report view, but will then realize that the data is needed to populate the
view. Accordingly, the store will make a request to the server asking for the required data. On the server
side, the request is received. The data necessary for the report is located in three different tables in the
database, so the server will utilize three different data access objects to make three different requests
to the database for data.
The database simply executes those requests and sends the data back. Once the data arrives back at the
server, it is sent to a reconciliation service which takes the data from the three different tables and
combines them with the other pieces of data that match. This is done by matching on the JPM account
code and the base currency of the foreign future. This is enough to uniquely identify records. Once the
data is matched up, it is used to populate a response object to be sent back to the client. It is at this time
that the calculations are done to complete the reconciliation process. With all this done, the server turns
the response object into JSON form and sends it to the client. The client receives this data and uses it to
populate the error report view. Now the user can immediately see the results of the error report. Below
is a diagram showing a summary of this process.
Figure 15: Request to store eagle file illustration

Coding Style
When developing these features, much care was taken to respect the existing coding style of the
project. The controller pattern was used to receive incoming network requests, the service pattern was
used to accomplish tasks that could be done in multiple ways to allow for interchangeability, and data
access objects were used to interface with the database. Respecting the existing style and techniques
will make the project more maintainable and understandable for any future JPM employees.
Testing JPM has a well established path that an application follows from development to production. There are
three environments that it will pass through along the way. The first environment is called DEV, which is
short for development. This is an environment that is safe to experiment in. Developers can alter the
application and database without worry that it might destroy real data that is important to the
operations of the company. All the databases are only used by developers so if something goes wrong
there will be no damage.
Once the features are added in the DEV environment, it is moved to a testing environment called UAT.
This is where the application is tested. Similar to the DEV environment, this environment is protected so
that any errors or issues caused there will not mess up any real data. In the UAT environment, quality
Figure 16: Request for error report illustration

engineers test the application rigorously and users are allowed to test the application. Any errors or
issues are noted and fixed.
Once all issues are fixed, the application will be allowed to pass to the production environment known
as PROD. PROD uses real data and is the environment used by the users on a daily basis. Ideally, by the
time an application makes it to PROD, it should work perfectly and will not cause issues.
All of the development of the features for this project was done in the DEV environment. In the last
week of the project, it was deemed good enough to pass into the UAT environment. There, the testing
process has begun. Users are experimenting and commenting on the new features, and over the course
of the next few weeks a team of quality assurance engineers will test it. After a month of testing and
fixing, the features built in this project will be able to pass into the production environment.
Results It was decided to implement two distinctive features into the Variation Margin application. These
features include (1) a Unified report button and (2) a Unified report screen. These would also allow the
current process to become simpler to analyze, less time consuming and more reliable.
The diagram shows the new process that the Operations team would follow. Notice that the Unified
report feature includes the Recon, No Activity and ForCash results. The Account tie out process was left
out as a separate report due to the nature of its data not being compatible with that of the other
reports. This process will be displayed in a separate dedicated screen.
1. Unified report button
The Unified report button is included under the Foreign Variation Margin drop down menu. It possesses
two options “View” and “Upload Eagle File”. The “View” option allows the user to display the new
Unified report in a new screen generated by the application. The “Upload Eagle File” option allows the
user to upload the Eagle file by displaying an upload box. The Upload box contains a file date and a file
picker to pick which file to upload. The application will extract data from the Eagle file for the analysis of
the Unified report processes.
Figure 17: Chosen features. This is the same as figure 11. It has been inserted here for convenience.

2. Unified Report Screen
The Unified Report Screen displays the Recon, No Activity and ForCash reports in a single screen. This
feature allows the Operations team to analyze the three processes simultaneously. This new screen has
sections for account information, the No Activity report, the Recon report, and the ForCash report.
Under each section are columns with data relating to each. This feature offers error detection by
highlighting the erroneous row in red.
Figure 20: Screenshot of unified error report view
Figure 19: New menu options
Figure 18: New eagle file upload window
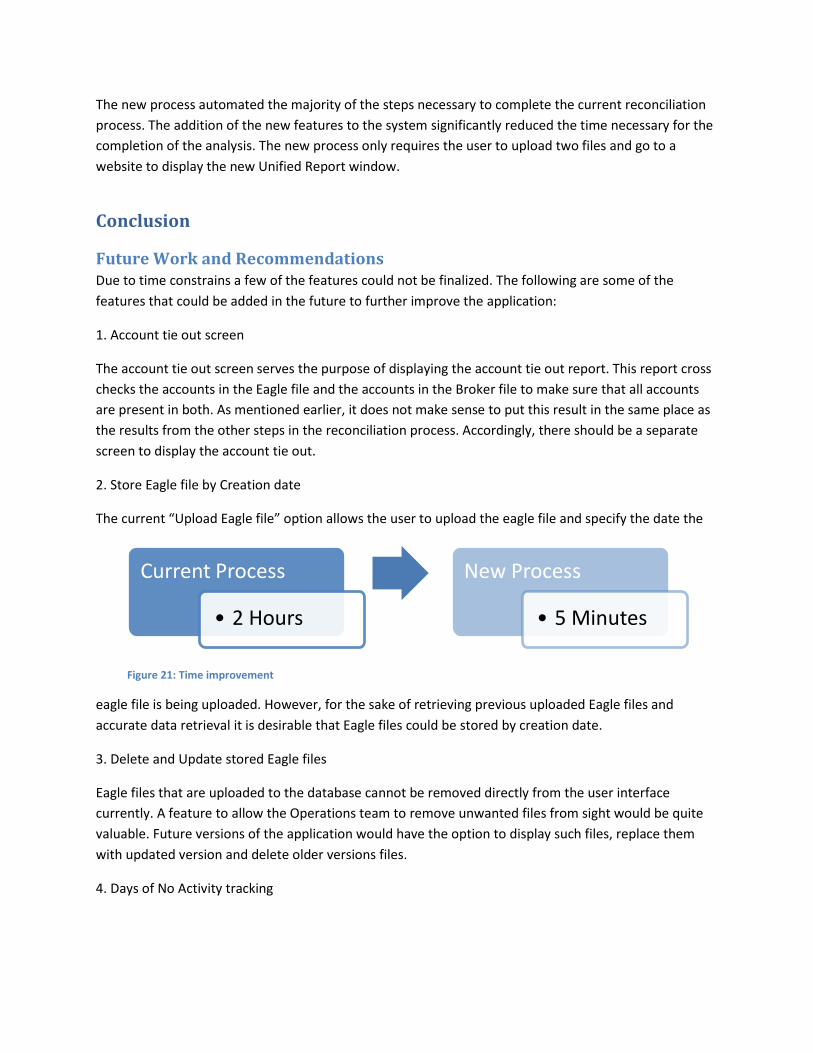
The new process automated the majority of the steps necessary to complete the current reconciliation
process. The addition of the new features to the system significantly reduced the time necessary for the
completion of the analysis. The new process only requires the user to upload two files and go to a
website to display the new Unified Report window.
Conclusion
Future Work and Recommendations Due to time constrains a few of the features could not be finalized. The following are some of the
features that could be added in the future to further improve the application:
1. Account tie out screen
The account tie out screen serves the purpose of displaying the account tie out report. This report cross
checks the accounts in the Eagle file and the accounts in the Broker file to make sure that all accounts
are present in both. As mentioned earlier, it does not make sense to put this result in the same place as
the results from the other steps in the reconciliation process. Accordingly, there should be a separate
screen to display the account tie out.
2. Store Eagle file by Creation date
The current “Upload Eagle file” option allows the user to upload the eagle file and specify the date the
eagle file is being uploaded. However, for the sake of retrieving previous uploaded Eagle files and
accurate data retrieval it is desirable that Eagle files could be stored by creation date.
3. Delete and Update stored Eagle files
Eagle files that are uploaded to the database cannot be removed directly from the user interface
currently. A feature to allow the Operations team to remove unwanted files from sight would be quite
valuable. Future versions of the application would have the option to display such files, replace them
with updated version and delete older versions files.
4. Days of No Activity tracking
Current Process
• 2 Hours
New Process
• 5 Minutes
Figure 21: Time improvement

Besides the comparison of previous day balance and current day balance, part of the No Activity process
is to determine how many days has it been since any change happened within an account. The balance
in an account should be withdrawn if no activity has happened for an extended period of time.
The following chart summarizes the above recommendations and how long they may take to complete.
Recommendations Reasons Time
Estimate
Account Tie Out Screen
Summarize accounts data automatically
Identify missing account more easily
2 weeks
Store Eagle File by Creation Date Get more accurate file information Half week
Add Ability to Delete and Update Eagle Files
Provide flexibility for editing files Half week
Keep Track of the no activity days Determine account status more accurately
Half week
The following improvements we see necessary for a better performance of the entire system:
1. Improve loading speed
After analyzing the application it became apparent that certain screens required a significant amount of
time to load. This loading time extends the analysis process. The exact cause of this delay is unclear and
would require further investigation to pinpoint. Perhaps more efficient logic could be added to the
system in order to display the screens faster. Resolving this issue would increase the work efficiency and
reduce the non-value added time to the processes.
2. Eagle file and Application data discrepancies
Since the Eagle file and the Variation Margin Application both get their data from the same location, it is
not clear why sometimes the does not match. A speculated reason is that the Eagle file is created at a
one point in time and the Variation Margin Application updates at another time and the underlying data
in the Eagle database changes between these times. It would be appropriate to resolve this discrepancy
because it would reduce reconciliation process, essentially eliminating the need for the ForCash test.
Below is a chart summarizing our recommendations for the system as a whole and an estimated time it
would take to complete.
Recommendations Reasons Time
Estimate
Improve Loading Speed Reduce non-value added time
Increase work efficiency 2 weeks
Resolve Eagle file and application data discrepancies
Reduce the work for reconciliation analysis (ForCash)
Save time
N/A

Time Distribution The project duration was seven weeks. The diagram below shows the distribution of the different tasks
in order to deliver a prototype.
Reflections The team collaborated with a coworker located in Glasgow headquarters. The collaboration allowed
exposure to managing schedules considering time zone differences. The team learned new
programming skills (Java, JavaScript, and SQL) and the use of several programming tools (Eclipse, Oracle
SQL, and Variation Margin Application). The team also did extensive research on Foreign Futures and
learned how the firm settles its trades.
Each team member contributed his or her own expertise to this project. Jiahui, an industrial engineer,
contributed mainly to the business analysis portion of the project. She used her classroom experience
with optimizing assembly lines and applied it to the optimization of this business workflow. She
contributed ideas such as the use of decision trees to help in the planning process. Daniel is an electrical
engineer and contributed organizational expertise as well as programming expertise. His experience
planning and writing labs was valuable when trying to organize ideas and laying out plans. His
knowledge of computer systems was also useful when turning the plans that were made into reality.
Kevin is a computer science major and did the bulk of the programming for this project. He turned the
plan that was created in the business analysis phase into a working prototype, and ensured that the
other partners were informed enough about the inner workings to be able to discuss the new features in
an intelligent way. Overall the varied expertise of the team members worked as an advantage so that
there was a person with expertise in each phase of the project from planning through development.
• Information Gathering
3 weeks
• Development new features
3 weeks• Testing
• Implementing
1 week
Figure 22: Time utilization to complete the project.

Appendix I
Business Requirements Document created for JPM

Appendix II: Independent Studies of Understanding Futures Contracts
Introduction
This project is designed to understand the process of futures contracts, and to develop a simple model to illustrate the basic mechanics of their operations. We begin with a brief literature review of futures contracts, such as the financial terms related to futures, history and background, general explanation of how futures work, etc., to lead those who are not familiar with finance into the financial world. Then, several risks of futures contract will be explained in detail. In addition, a model of futures contract will be built up and implemented properly. Finally, the influences and roles of futures in the financial industry will be discussed.
Background
Stocks, bonds, options, futures, portfolio and mutual funds are all rapidly growing financial derivatives, which play essential roles in the financial world. Futures are one of these derivatives, and they foster the movement of savings into productive investments. This paper will guide you into the financial field, focusing on futures contracts.
A futures contract is a financial agreement between a buyer and a seller to trade a certain amount of item at a specific price in a future date. The item could be an agricultural commodity, a metal, mineral or energy commodity, a financial element or a foreign currency. There are different types of futures contracts, indicating various “tradable” assets such as commodities, securities, currencies or intangible assets such as interest rates and indexes. The buyer and seller of the futures trade commodities in a futures market, which includes Foreign exchange market, Money market, Bond market, Equity market and Soft Commodities market.
The history of futures can be traced back to the mid-nineteenth century, when the central grain markets were created for farmers to trade their agricultural commodities. The future contracts helped farmers to reduce the risk of loss of crops and profits and stabilize the supply and prices in the off-season. However, today’s futures market comprises a broader range of commodities, including currencies and financial instruments such as treasury bonds and securities.
The two basic users of futures contracts are hedgers and speculators. Generally, hedgers use futures to protect against adverse future price movements of certain commodities. They basically include producers and consumers of an asset that is subject to external influences such as the interest rate. The other major futures players are speculators that fall into three categories: position traders, day traders and swing traders. Position traders hold a position for a long period of time (from months to years), because they believe that their long-term investments could overcome the short-term fluctuations. Day traders refer to speculators who buy and sell financial instruments within the same trading day. Swing trading happens when a tradable asset is held between one to several days in order to gain profit from price changes. These speculators are investors who trade their own accounts. If the trader can judge the market correctly, he could gain more profit in the futures market because futures prices change more quickly than other financial instruments, such as real estates or stock prices. On the other hand, incorrect

judgment will lead to greater loss comparing with other investments. The chart below classified the mission of the hedgers and speculators.
The profits and losses of a futures contract are based on the daily movements of the market. For instance, suppose the future contracts for wheat increase to $5 per bushel the day after the above farmer and bread maker enter into a futures contract of $4 per bushel. The farmer, as the holder of the short position, has lost $1 per bushel, because the farmer is obliged to sell his wheat at the future price, but the selling price now is higher. This is a simple example of how the two parties speculate and trade for futures contract to gain or lose.
The futures contract trades in the US are regulated by the Commodity Futures Trading Commission which is known as CFTC, an independent agency of US government who monitoring and regulating the futures transactions. CFTC has the responsibilities to evaluate and determine if the transactions are breaking any rules (which could lead to fines and punishments). In addition, CFTC publishes a weekly Commitment of Traders Reports on every Friday, which contains the data on all open interests.
In this section, we’ve briefly discussed the basic background of future contracts, how the two parties gain and lose from the movement of the market and its regulation. We’ll analyze in detail the various risks of trading futures in the following section.
Risks of Trading Futures
According to many futures advisers and experienced traders, all kinds of investments are risky (with no exceptions!) and future trading is just one of them. There are many examples of bankruptcy resulted from futures trading. Before doing futures trading, we have to know what risks you will be bearing.
Trader Short Long
The Hedger Secure a price now to protect against future declining prices
Secure a price now to protect against future rising prices
The Speculator Secure a price now in anticipation of declining prices
Secure a price now in anticipation of rising prices
Figure 23 The Mission of Hedger and Speculator

Figure 24 Risks of Futures Trading
Unlimited Liability The main cause of risk in futures trading is the fact that trading futures exposes you to unlimited
liability, which means the losses could accumulate beyond your committed capital or even the amount of cash in your futures trading account as long as the price of the underlying asset continues to move against your futures position.
Unlimited liability means that a strict stop loss and risk management policy needs to be in place when trading futures and that kind of sophistication may be lacking in new futures traders, which is one of the factors that makes futures trading risky for most beginners.
Leverage Compounding the problem of unlimited liability is the leverage that futures trading gives you.
Depending on the ratio of initial margin, futures trading can give you anything between 5 to 100 times leverage. Leverage is great when prices are moving in your favor, allowing you to make an advantageous positive leveraged return. However, leverage is a double-edged sword and cuts both ways. When the price of the underlying asset moves against your favor, you will begin to experience leveraged losses.
Daily Settlement Daily settlement is supposed to be a risk control measure that could preventing losses from
building up to default levels and helping lower risk on the futures exchange's end. However, daily settlement can be detrimental to futures traders, as all losses must be settled at the end of each trading day. This can lead to a situation whereby a futures position that is eventually profitable gets closed out prematurely due to losses on short-term whipsaw.
Trading Related Risks Trading related risks of futures trading has to do with your ability to make the correct futures
trading decisions and actions. This means being able to make accurate trend and price analysis as well as prediction, being able to decide on the correct futures strategy to take advantage of that prediction and be able to execute the trades without mistake. You can make correct predictions and trading decisions and still make executional mistakes such as choosing the wrong order, clicking on the wrong expiration month or setting an advanced order wrongly resulting in unforeseen losses. Another trading related risk

is the risk of your futures broker filling your futures order at a price slightly more expensive than you would like. This is known as "Slippage".
Market Related Risks Market related risks consist of three main aspects: Systemic Risk, Secondary Risk and Idiosyncratic Risk.
Systemic Risk is also known as Market Risk, which is the whole market trend moving against you. In other words, no matter which specific futures contract is chosen to trade or how stable you think the asset and industry is. Systemic risk is the risk that all futures traders will be exposed to and cannot be eliminated by diversification unless a market neutral futures strategy such as futures arbitrage is used.
Secondary Risk, also known as Industrial Risk, is the risk of a specific industry moving against you. For instance, if you are trading futures only in a certain industry, such as oil, then you are exposed to the systemic risk of global economic performance as well as the risks related to the oil market. Secondary Risk could be overcome through diversification by trading futures in several markets such as trading in both financial futures and commodity futures.
Idiosyncratic Risk, also called Company Risk, is the risk of the price for specific asset you are trading in moving against you. This occurs when you trade futures only in a certain commodity or company.
Policy Risk The policies that are used to regulate trading change all the time. Some changes, such as the “uptick rule” or changes in margin policy, may adversely affect the futures trading. Therefore, keeping track of the policy changes through the U.S Commodity Futures Trading Commission is one of the most essential thing futures traders need to do.
Currency Risk The foreign exchange market risk appears, if you are trading non-foreign exchange futures in a foreign market with a foreign currency. For instance, if you are trading in Single Stock Futures in the US market from Singapore, then you’ll encounter the exchange risk between US Dollars and Singapore Dollars. Currency risk can be strong enough to eliminate all profits if the invested currency drops heavily against your home currency.
Brokerage Risk Brokerage risk refers to the risk that the futures brokers with whom you’ve deposited your money closes down for no reason and takes all your money with them. To prevent this happening, you may have to open the trading accounts with large, reputable and trustable future brokers, even though they may be more expensive.

How Futures Trading Works
In order to understand how futures trading works, these two essential terms need to be understood, which are Initial Margin and Maintenance Margin.
Initial Margin The initial margin is the collateral per contract that you must have in your account to open a
position.
Maintenance Margin Futures contracts are traded on margin enabling you to leverage a small margin deposit for a
much greater market effect. You must maintain the maintenance margins per contract in your account at all times. If the funds in your account fall below this margin, you will be subject to a ‘margin call’ to either deposit more funds to cover your positions or to close positions. If your margin situation is not remedied, the bank will forcibly close positions at their full discretion.
Futures trading usually takes place on a futures market, where buyers and sellers meet in order to transact. A future broker acts as a communication link between the trading two parties, making transactions for the customers. The performance of every buyer and seller of a futures contract is guaranteed by the clearing corporation. For example, if trader A purchase several Swiss franc futures and the price goes up and she has accrued a $4,500 profit. The person who sold those futures contracts has incurred a loss of $4,500. The clearing corporation will make sure the trading will be completed, which eliminates the potential credit risk of the futures market.
Here is a futures trading example: An investor bought a 3-months Eurodollar contract at $94.25 and deposits an initial margin of
$675. In order to trade a Eurodollar 3-months the clearinghouse requires a trader to leave a minimal margin of $675 per contract (Contract size: $1,000,000) with a maintenance margin level of $500.
On Day 1, the price moved down to $94.225, after calculation ($94.25 - $94.225)/0.005= 5, we see the movement is 5 “ticks”. A 1-tick movement in the Eurodollar 3-months contract represents a change in value of [($1,000,000 x 0.005 x (3/12)]/100 = $12.50. Thus, the loss of value of this contract is (5-ticks x $12.50) = $62.50. Hence, the margin account balance is debited for $62.50 and the new balance becomes ($675 - $62.5) = 612.50.
On Day 2, the price declined further by 0.055 per share (equivalent to 11 ticks) to 94.17, representing a loss of (11 x $12.50) = $137.50. Thus, the margin balance has fallen again, from the previous margin balance of $612.50 to ($612.50 minus $137.50) = $475. At this point, because the margin balance has dropped below the maintenance margin requirement of $500, there will be a margin call made by the Clearinghouse. The trader will now have to deposit funds into the margin account to get the balance adjusted back to the initial margin balance level. In this case, $200 have to be deposited into the account in order to reach the initial $675.
On Day 3, the price moved up from $94.17 by 0.125 (25 ticks) to $94.295, representing a gain of (25 x $12.50) = $312.5. Now, the margin account gets credited for $312.50 and its balance becomes $987.5.

Scenario 1 (Loss Example)
If the trader decides to sell his contract on Day 2, he will lose ($62.5 + $137.5) = $200 of the initial deposit which means a 29% loss.
Scenario 2 (Profit Example)
However, if the trader decides to sell it on Day 3, he will make a gain of ($312.5 - $62.5 - $137.5) = $ 112.5 which is a 13% gain on the initial deposit.
Price Margin Account Debit/Credit Margin Call Profit/Loss
Day 0 $94.25 $675.00
Day 1 $94.23 $612.50 ($62.50)
Day 2 $94.17 $475 ($137.50) $200 -$200 (-29.60%)
Price Margin Account Debit/Credit Margin Call Profit/Loss
Day 0 $94.25 $675.00
Day 1 $94.23 $612.50 ($62.50)
Day 2 $94.17 $475 ($137.50) $200
Day 3 $94.30 $987.50 $312.50 +$112.50 (+12.90%)

The Model and Pricing
When a future contract is used by a buyer and seller to hedge other positions in the same asset, price changes in the asset after the futures contract agreement will occur. The gains to one party mean a loss to the other. If the price of the underlying asset increases after the agreement is made, the buyer gains at the expense of the seller. If the price of the asset drops, the seller gains at the expense of the buyer. The cash flow is shown in the graph below:
Figure 25Cash Flows on Futures Contracts
Pricing
When the deliverable asset exists in plentiful supply, the price of a future contract is determined via arbitrage arguments. However, when the deliverable commodity is not in plentiful supply, for instance, crops before the harvest, the future price cannot be fixed by arbitrage. Then there is only one factor that will influence the price, which is supply and demand for the assent in the future.
The forward price represents the expected future value of the underlying at the risk free rate. We define the forward price to be strike K such that the contract has 0 value at the present time. Provided that interest rates are constant and the forward price of the futures is equal to the forward price. Otherwise the difference between the forward price on the futures and forward price on the asset is proportional to the covariance between the underlying asset price and interest rates. Let the value of the futures/forward price be F (t, T), which could be found by compounding the present value S(t) at time t to maturity T by the rate of risk-free return r.
Or with continuous compounding

.
The storage costs, dividend yields, and convenience yields are all the factors that could affect this relationship, but are not considered in the above simplified formula.
However, when the deliverable commodity is not in plentiful supply, we cannot use the rational pricing. The prices of futures is determined by today’s supply and demand for the underlying asset in the future. Supply and demand could be expected based on unbiased expectation. In this case, the future price of the actual asset is given by the simple relationship:
.
The Influences and Roles of Futures in Economy
A futures market is an important part of a strong economy. It may satisfy different requirements of various market players involved and it plays many roles. Here are some points about the influence of a futures market on the economy.
The main advantage of futures is that it allows individuals and businesses to protect their own positions from the impacts of price fluctuations. For the buyer, it provides protection on future prices increasing. For sellers, it provides protection against falling prices. By allowing people to set a future sale price, the contract also helps predict future prices.
Futures help developing manufacturing goals, because they allow companies to assess future demand and prices of products. Business is benefitted in better control of prices by limiting production to compensate for the expected demand only. They also avoid the possibility of the emergence of overcapacity, including storage period of production excessing and depreciation loss in quality.
Pricing competitiveness is determined by futures trading facilities, which maintain a balance in prices of the future traded commodities in the market. It brings price stability and occurs based on a large number of futures trading transactions in a day.
Futures bring together consumers, manufacturers and speculators from different countries to create a global market. It supports buyers and sellers in different countries insulating themselves against price fluctuations since the contract is able to be completed without physical delivery of goods.

Works Cited Heakal, R. (n.d.). Futures Fundamentals: How the Market Works. Retrieved 12 18, 2014, from investopedia.com: http://www.investopedia.com/university/futures/futures2.asp
J.P. Morgan Chase & Co. (2014). About Us. Retrieved 12 18, 2014, from jpmorganchase.com: http://www.jpmorganchase.com/corporate/About-JPMC/about-us.htm
J.P. Morgan Chase & Co. (2014). Asset Management. Retrieved 12 18, 2014, from jpmorgan.com: https://www.jpmorgan.com/pages/jpmorgan/am
J.P. Morgan Chase & Co. (2014). Company History. Retrieved 12 18, 2014, from jpmorgan.com: https://www.jpmorgan.com/pages/company-history
Bodie, Zvi, and Victor I. Rosansky. "Risk and Return in Commodity Futures." Financial Analysts Journal 36.3 (1980): 27-39. Web.
"Commodity Futures Trading - Understanding Opportunities and Risks in Futures Trading." Commodity Futures Trading - Understanding Opportunities and Risks in Futures Trading. National Futures Association, 5 Nov. 2012. Web. 24 Feb. 2015.
Guidotti, Daniel. "Advanced Investing Futures Trading Strategies and Concepts." PFhub Business Financial Economic News. Advance Investing, 13 Nov. 2013. Web. 24 Feb. 2015.
"Risks of Futures Trading." By FuturesTradingpedia.com. Http://www.futurestradingpedia.com/, 07 Mar. 2011. Web. 24 Feb. 2015.
Working, Holbrook. Futures Trading and Hedging. Ithaca, NY: American Economic Review, 1953. Print.
"Futures Markets - Part 6: Who Trades Futures and Why?" Futures: Who Trades and Why? TD Ameritrade, n.d. Web. 24 Feb. 2015.
Heakal, Reem. "Futures Fundamentals: How The Market Works." Investopedia. N.p., 07 Dec. 2003. Web. 24 Feb. 2015.
"How Futures Trading Works." How Futures Trading Works. TD Direct Investing, n.d. Web. 24 Feb. 2015.
Lee, Julia. "How Futures and Options Markets Work." How Futures and Options Markets Work. Professor Satyananda Gabriel of the Economics Department, Jan. 1999. Web. 10 Feb. 2015.