Embed Size (px)
Citation preview

FOREIGN EXCHANGE MICROSTRUCTURE
A SURVEY OF THE EMPIRICAL LITERATURE
Carol L. Osler Brandeis University
Abstract This paper surveys empirical research in foreign exchange microstructure, a relatively new field focused on the currency market and exchange-rate determination. The survey first describes the institutional structure of the market and the high-frequency behavior of returns, volatility, trading volume, and spreads. It then discusses the influence of order flow on exchange rates and uses the evidence to evaluate three potential explanations for that influence: liquidity effects, inventory effects, and information. Later sections analyze the forces that determine bid-ask spreads and the price discovery process. Since this field is also called “the new microeconomics of exchange rates,” the survey highlights implications of the evidence for modeling short-run exchange-rate dynamics.
July, 2008 Carol Osler is Associate Professor of Economics and Finance at the Brandeis International Business School, Brandeis University, Waltham, MA, 02454. [email protected] . A slightly compressed version of this survey will be included in Springer’s forthcoming Encyclopedia of Compexity and System Science. The author is grateful for the comments of academics including Geir Bjønnes, Martin Evans, Rasmus Fatum, Harald Hau, Lukas Menkhoff, Bruce Mizrach, Michael Moore, Paolo Pasquariello, Dagfinn Rime, and Tanseli Savaser, as well as practitioners including Pete Eggleston, Keith Henthorn, and Peter Tordo.
2
FOREIGN EXCHANGE MICROSTRUCTURE
I. Introduction II. Institutional Structure A. Basics B. A Two-Tiered Market C. Objectives and Constraints III. Intraday Dynamics A. Intraday Seasonals B. Feedback Trading
C. News D. Intervention
IV. Returns and Volatility
A. Returns B. Volatility V. Returns and Order Flow, Part I: Liquidity and Inventories A. Interdealer Order Flow B. Customer Order Flow
C. Order Flow and Exchange Rates
VI. Returns and Order Flow, Part II: Information A. Types of Information B. The Evidence: Order Flow Does Carry Information C. The Evidence: Is the Information Really Fundamental? D. Information as an Incomplete Explanation
VII. Price Discovery in Foreign Exchange A. Adverse Selection and Customer Spreads B. What Drives Customer Spreads? C. Price Discovery in Foreign Exchange VIII. Future Directions References Glossary

FOREIGN EXCHANGE MICROSTRUCTURE Definition: “Foreign exchange microstructure” is the study of the currency trading process and high-frequency exchange-rate determination. The field is also called “the new microeconomics of exchange rates.” Research in this area began in the late-1980s, when it became clear after many years of floating rates that traditional, macro-based exchange-rate models were not able to explain short-run dynamics. Research accelerated in the mid-1990s as currency trading systems became sufficiently automated to provide useful data.
I. INTRODUCTION
Foreign exchange microstructure research, or the study of the currency trading process, is primarily motivated by the need to understand exchange-rate dynamics at short horizons. Exchange rates are central to almost all international economic interactions – everything from international trade to speculation to exchange-rate policy. The dominant exchange-rate models of recent decades, meaning specifically the monetary model and the intertemporal optimizing models based on Obstfeld and Rogoff (1995), take a macro perspective and come from the macro modeling traditions. These models have some value relative to horizons of several years, but they have made little headway in explaining exchange rate dynamics at shorter horizons (Meese and Rogoff 1983; Flood and Taylor 1996; Lane 2001). Shorter horizons are arguably of greater practical relevance for policy makers, asset managers, and others.
As elucidated by Kuhn in his seminal analysis of scientific progress (1970), the emergence of major anomalies typically leads researchers to seek an alternative paradigm. Currency microstructure research embodies the search for a new paradigm for short-run exchange-rate dynamics.
This search has focused on the currency trading process for a number of reasons. First, it is widely appreciated that macroeconomic models are enhanced by rigorous “microfoundations” in which agent behavior is carefully and accurately represented. A rigorous microfoundation for exchange rates will require a thorough understanding of the currency trading process.
Researchers are also motivated to study currency trading by evident contradictions between the way currency markets actually work and the way exchange-rate determination is represented in macro-based models. As Charles Goodhart remarked, referring to his experience as an adviser at the Bank of England, “I could not help but observe that some of the features of the foreign exchange ... market did not seem to tally closely with current theory…” (Goodhart 1988, p. 437). To other researchers with first-hand experience of the trading world, too, it seemed naturally “to ask whether [the] empirical problems of the standard exchange-rate models … might be solved if the structure of foreign exchange markets was to be specified in a more realistic fashion” (Frankel, Galli, and Giovannini 1996, p. 3).
The emergence of currency-market research in recent years also reflects a confluence of forces within microstructure. By the mid-1990s, microstructure researchers had studied equity trading for over a decade, thereby creating a foundation of theory and a tradition of rigorous analysis. Meanwhile, technological advances at foreign-exchange dealing banks made it possible to access high-frequency transactions data. Currency markets – huge and hugely influential – were a logical new frontier for microstructure research.
Currency microstructure research – like all microstructure research – embodies the conviction that economic analysis should be based solidly on evidence. As articulated by Charles
3
Goodhart, arguably the founder of this discipline, “economists cannot just rely on assumption and hypotheses about how speculators and other market agents may operate in theory, but should examine how they work in practice, by first-hand study of such markets” (1988, p. 437). Most papers in this area are empirical, and those that include theory almost always confront the theory with the data. The literature includes quite a few dealer surveys, reflecting a widespread appreciation of practitioner input. This survey of the literature, like the literature itself, emphasizes evidence.
II. INSTITUTIONAL STRUCTURE
This section describes the institutional structure of the foreign exchange market.
A. Basics Foreign exchange trading is dispersed throughout the day and around the world. Active
trading begins early in Asia, continues in Europe, peaks when both London and New York are open, and finally tapers off after London traders leave for the day. There is an “overnight” period during which trading is relatively thin, but it spans only the few hours between the end of trading in London (around 19 GMT) and early trading in Sydney (around 22 GMT). In terms of geography, currency trading takes place in almost every major city around the world, though there are major trading centers in Singapore, Sydney, and Tokyo in Asia, London in Europe, and New York in North America.
Foreign exchange trading is an intensely competitive business. Price is one dimension of competition, but there are many others. When Euromoney magazine evaluates trading institutions each year, it ranks them by pricing consistency, strategies and ideas for trading in options, and innovative hedging solutions (Euromoney 2007). Customer relations are also critically important. As in many industries, good customer relations are fostered by personal attention from salespeople and by perks for good customers, such as sports tickets and elegant feasts.
Unlike trading in stock, bond, and derivatives markets, trading in currency markets is essentially unregulated. There is no government-backed authority to define acceptable trading practices, nor is there a self-regulating body. Local banking authorities are limited to regulating the structure of trading operations: they typically require, for example, that clearing and settlement are administratively separate from trading. Any attempt to regulate trading itself would encourage dealers to move elsewhere, an undesirable outcome since foreign exchange is an attractive industry – it pays high salaries and generates little pollution. In the absence of regulation, certain practices that are explicitly illegal in other markets, such as front-running, are not only legal but common in foreign exchange.
Market Size: Spot and forward trading volume in all currencies is worth around $1.4 trillion per day (B.I.S. 2007). If foreign exchange swap contracts are included, daily trading is roughly twice as large, at $3.2 trillion. By either figure, foreign exchange is the largest market in the world. Trading on the New York Stock Exchange (NYSE), for example, is on the order of $0.050 trillion per day (NYSE 2007), while daily trading in the U.S. Treasury market, possibly the world’s second-largest market, is on the order of $0.20 trillion (Fleming 2003). Spot and forward trading, on which FX microstructure research has consistently focused, has grown rapidly for many years – average yearly growth since 1992 has been nine percent, and growth since 2004 has been 18 percent.
4

The vast bulk of foreign exchange trading involves fewer than ten currencies. The U.S. dollar is traded most actively (B.I.S. 2007) due to it’s role as the market’s “vehicle currency”: to exchange almost any non-dollar currency for any other requires one to convert the first currency into dollars and then trade out of dollars into the second currency. The value of U.S. dollars traded in spot and forward markets is roughly $1.2 trillion per day, over 86 percent of total traded value. Of course, two currencies are involved in every transaction so the total amount of currencies traded every day is twice the day’s trading volume. The euro accounts for 37 percent of all trading, a staggering $518 billion per day – this implies an average of roughly one trade per second during active trading hours. The yen and the U.K. pound each account for a further sixteen percent of traded value. The next tier of currencies, comprising the Swiss franc, the Australian dollar and the Canadian dollar, accounts for eighteen percent of traded value. The remaining 150 or so of the world’s convertible currencies account for merely thirty percent of traded value.
Only the dollar, the euro, and the yen are liquid throughout the trading day. Liquidity in most other currencies is concentrated during locally-relevant segments of the day. The Swedish krone, for example, is only liquid during European trading hours.
Quotation Conventions: Each exchange rate is quoted according to market convention: dollar-yen is quoted as yen per dollar, euro-dollar is quoted as dollars per euro, etc. Trade sizes are always measured in units of the base (denominator) currency and the price is set in terms of the numerator currency. In euro-dollar, for example, where the euro is the base currency, a customer asking to trade “ten million” would be understood to mean ten million euros and the dealer’s quotes would be understood to be dollars per euro. The minimum tick size is usually on the order of one basis point, though it is technically one “pip,” meaning one unit of the fifth significant digit for the exchange rate as conventionally quoted. Examples will be more helpful: in euro-dollar, where the exchange rate is currently around $1.5000, one tick is $0.0001; for dollar-yen, where current exchange rates are roughly ¥110.00/$, one tick is ¥0.01.
Average trades are on the order of $3 million (Bjønnes and Rime 2005); trades of $50,000 or less are considered “tiny.” Thus the average foreign exchange trade is roughly the same size as normal “block” (large) trades on the NYSE (Madhavan and Cheng 1997), which makes it large relative to the overall average NYSE trade. The average foreign exchange trade is smaller, however, than the average trade in the U.S. Treasury market, where average interdealer trades vary from $6 to $22 million depending on maturity (Fleming 2003).
B. A Two-Tiered Market
The foreign exchange market has two segments or “tiers.” In the first tier, dealers trade exclusively with customers. In the second tier, dealers trade primarily with each other. The interdealer market forms the market’s core in the sense that customer prices are all based on the best available interdealer prices. Interdealer trading in spot and forward markets now accounts for 38 percent of all trading (B.I.S. 2007). This is down sharply from its 57 percent share in 1998, a change often ascribed to rapid consolidation in the industry. The current share is comparable to the share of interdealer trading on the London Stock Exchange, which was most recently estimated to be between 25 and 35 percent (Reiss and Werner 1995). It is lower, however, than the share of interdealer trading in the U.S. Treasury market, which was 68 percent in October 2007 (Federal Reserve Bank of New York 2007).
5
The Customer Market: The customer foreign exchange market is quote-driven, meaning that instantaneous liquidity (of the sort analyzed in Grossman and Miller (1988)) is provided by professional market makers. As in most such markets, currency dealers are under no formal obligation to provide liquidity, unlike specialists on the NYSE. Failing to provide liquidity on demand, however, could be costly to a dealer’s reputation so dealers are extremely reliable. The market functioned smoothly even during the crisis of September 11, 2001. Spreads widened, as would be expected given the heightened uncertainty, but market makers stayed at their desks and trading continued uninterrupted (Mende 2006).
The customer market is fairly opaque. Quotes and transactions are the private information of the two parties involved, the customer and the dealer. Unlike equity and bond markets, which publish trading volume daily, aggregate figures for customer trading volume are published only once every three years (e.g., B.I.S. 2007). The lack of transparency is intensified by the tendency for large customer trades, meaning those over around $25 million, to be split into multiple smaller trades. Splitting trades, which is a way to minimize market impact and thus execution costs (Bertsimas and Lo 1998), also characterizes the London Stock Exchange (Reiss and Werner 2004), among other markets. Trade-splitting makes it more difficult for a dealer to know how much a customer actually intends to trade. Dealers like to know when customers are trading large amounts, since large trades move the market.
Dealers divide their customers into two main groups, and structure their sales force accordingly. The first group, financial customers, is dominated by asset managers but also includes non-dealing banks, central banks, and multilateral financial institutions. The asset managers, in turn, are divided into “leveraged investors,” such as hedge funds and commodity trading associations (CTAs), and “real money funds,” such as mutual funds, pension funds, and endowments. Financial customers account for 40 percent of foreign exchange trading (B.I.S. 2007), sharply higher than their 22 percent share in 1998 (B.I.S. 2007).
The second group of customers, referred to as “corporates,” are commercial firms that purchase currency as part of on-going real production activities or for financial purposes such as dividend payments or foreign direct investment. The share of such commercial trading has been steady at roughly twenty-percent for a decade (B.I.S. 2007). Commercial customers tend to be the mainstay of profitability for smaller banks (Mende and Menkhoff 2005). Financial customers, by contrast, tend to make bigger transactions and thus gravitate to bigger banks (Osler et al. 2007).
The customers listed above are all institutions. Unlike equity markets, where the trading of individuals for their own account can account for half of all trading, retail trading has historically been tiny in foreign exchange. The participation of individuals has been discouraged by large average trade sizes and by the need to establish lines of credit with dealing banks.
Though customer trading has historically been carried out over the telephone, trading over electronic communication networks is growing rapidly, spurred by the advent of new technologies. Formal figures are not available, but dealers estimate informally that these new networks now account for over one fifth of all customer transactions. Major dealers run single-bank proprietary networks through which they are connected to individual customers. The biggest networks, however, are managed independently. Some of these multi-bank e-portals, such as FXAll, permit customers to get multiple quotes simultaneously. FXAll has appealed primarily to commercial customers, which have historically paid relatively wide spreads on average (as discussed later), since it has brought them enhanced pre-trade transparency, intensified competition among dealers and, according to dealers, smaller spreads. Other multi-
6

bank e-portals, such as FXConnect or Hotspot FXi, focus on financial customers and are valued because they permit “straight-through processing” (STP), meaning fully automated clearing and settlement. STP handles back office functions far more efficiently than the traditional manual approach in part because it reduces the opportunity for human error. Networks of another type, such as Oanda.com, target individuals trading for their own account by permitting them to trade with no more than a small Paypal account. Such retail trading has grown rapidly in the current century, and has been estimated at up to $60 billion per day (Barker 2007). Nonetheless, dealers report that it does not yet affect market dynamics. The origins and consequences of electronic trading, as well as other important developments such as prime brokerage and algorithmic trading, are insightfully discussed in Barker (2007).
The Interdealer Market: In the foreign exchange interbank market there are no designated liquidity providers. At every moment a dealing bank can choose whether to supply liquidity or demand it. A dealer needing liquidity can, of course, call another dealer and request a quote. Until the mid-1990s such “direct dealing” accounted for roughly half of all interdealer trading (Cheung and Chinn 2001), while the other half of interdealer trading was handled by voice brokers – essentially limit-order markets in which people match the orders. During this period the best indication of the market price was often indicative quotes posted on Reuters’ “FXFX” screen.
The structure of interdealer trading changed dramatically after the introduction of electronic brokerages in 1992. In the major currencies, electronic brokerages not only took over from the voice brokers but also gained market share relative to direct dealing. Electronic Broking Service (EBS) now dominates in euro and yen while Reuters, the other major electronic brokerage, dominates in sterling. As the electronic brokerages took over, their best posted bid and offer quotes became the benchmark for market prices. By the end of the 1990s, voice brokers were only important in the “exotic” (relatively illiquid) currencies for which electronic brokers are unavailable. By now, “direct dealing among major banks has all but disappeared” (Barker 2007, p. 5). The speed of this transition reflects the intensity of competition in this market.
EBS and Reuters share a common, uncomplicated structure. Standard price-time priority applies. Hidden orders are not permitted. Limit orders are not expandable. Orders must be for integer amounts. Trading is anonymous in the sense that a counterparty’s identity is only revealed when a trade is confirmed. Dealers pay commissions on limit orders as well as market orders, though the commission on limit orders is smaller.
These markets have low pre- and post-trade transparency relative to most other limit-order markets. With respect to pre-trade information, price information is limited to the best bid and offer quotes, and depth information is limited to total depth at the quotes unless it exceeds $20 million (which it usually does during active trading hours). The only post-trade information is a listing of transaction prices. The exchanges do not publish any trading volume figures.
Trading on the electronic brokerages was restricted to dealers until 2005. Now, certain hedge funds are permitted to trade on EBS. Automated (program) trading was permitted around the same time. These shifts are reported to be a major source of the surge in trading between dealers and their financial customers since 2004 (B.I.S. 2007).
C. Objectives and Constraints To construct exchange-rate models with well-specified microfoudations it is critical to
know the objectives and constraints of major market participants. It is also critical to know the constraints that determine equilibrium.
7
Dealers’ Objectives and Constraints: Dealers are motivated by profits according to the conscious intent of their employers. Half or more of their annual compensation comes in the form of a bonus which depends heavily on their individual profits (Osler 2006). Profits are calculated daily and reviewed monthly by traders and their managers.
Dealers are constrained by position and loss limits which are, in turn, management’s response to rogue trader risk, meaning the risk that traders will incur immense losses (Goodhart 1988, Cross 1998). A single rogue trader can bring down an entire institution: Nick Leeson brought down Barings Bank in the early 1990s by losing $1.4 billion; John Rusnack brought down Allfirst Bank by losing $700 million. Such catastrophes could not occur in the absence of an information asymmetry that plagues every trading floor: management cannot know each trader’s position at all times. Traders are technically required to record their profits and losses faithfully and in a timely manner, but as losses mount they sometimes resort to falsifying the trading record. Position- and loss-limits are intended to minimize the risk that losses mushroom to that point. Intraday position limits begin at around $5 million for junior traders, progress to around $50 million for proprietary traders, and can be far higher for executive managers. Data presented in Oberlechner and Osler (2007) suggests that intraday limits average roughly $50 million. Overnight position limits are a fraction of intraday limits, and loss limits are a few percent of position limits.
Profit-maximization for dealers involves inventory management, speculation, and arbitrage. We review these activities in turn.
Inventory management: Foreign exchange dealers manage their own individual inventory positions (Goodhart 1988, Bjønnes and Rime 2005), tracking them in a “deal blotter” or on “position cards” (Lyons 1995). Large dealers as well as small dealers typically choose to end the day “flat,” meaning with zero inventory, and generally keep their inventory close to zero intraday as well. Average intraday inventory levels are $1 to $4 million in absolute value and account for less than five percent of daily trading activity (Bjønnes and Rime 2005; Osler et al. 2007). Though these absolute levels far exceed the $0.1 million median inventory level of NYSE specialists (Hendershott and Seasholes 2007), the NYSE inventories are much larger relative to daily trading (24 percent).
Dealers generally eliminate inventory positions quickly. The half-life of an inventory position is below five minutes for highly active dealers and below half an hour for less active dealers (Bjønnes and Rime 2005, Osler et al. 2007). Fast inventory mean-reversion has also been documented for futures traders (Manaster and Mann 1996), but standard practice in other markets often differs markedly. On the NYSE, for example, the half-life of inventory averages over a week (Madhavan and Smidt 1993). Even on the London Stock Exchange, which has an active interdealer market like foreign exchange, inventory half-lives average 2.5 trading days (Hansch et al. 1998).
Foreign exchange dealers in the major currencies generally prefer to manage their inventory via interdealer trades, rather than waiting for customer calls. In consequence, recent studies of dealer practices find no evidence of inventory-based price shading to customers (e.g., Osler et al. 2007). This distinguishes currency dealers from those in some equity markets (Madhavan and Smidt 1993) and bond markets (Dunne et al. 2007). Currency dealers also do not shade prices to other dealers in response to inventory accumulation (Bjønnes and Rime 2005). Instead, dealers wishing to eliminate inventory quickly choose more aggressive order strategies (Bjønnes and Rime 2005, Osler et al. 2007).
8
Speculation: Foreign exchange dealers speculate actively in the interdealer market (Goodhart 1988). Indeed, according to a dealer cited in Cheung and Chinn (2001), “[d]ealers make the majority of their profit on rate movement, not spread” (p. 447). Consistent with this, Bjønnes and Rime (2005) find that speculative profits are the dominant source of dealer profitability at the good-sized bank they analyze. Dealers’ speculative positions are based on information gathered from customers, from professional colleagues at other banks, and from real-time news services.
Arbitrage: Some dealers also engage in arbitrage across markets, such as triangular arbitrage or covered interest arbitrage. The associated software originally just identified the arbitrage opportunities, but by now it can actually carry out the trades. Arbitrage opportunities, though typically short-lived, arise frequently and occasionally provide sizeable profits (Akram, Rime, and Sarno 2005).
Customers’ Objectives and Constraints: The three main types of customers are active traders, meaning levered funds and proprietary traders, real-money funds, and commercial firms. Active Currency Traders: The objectives and constraints of active currency traders, also known as the “professional trading community” or PTC, are in some ways consistent with those assigned to international investors in standard academic models. These groups are motivated by profits: proprietary traders are motivated by an annual bonus; hedge fund managers receive a share of the firm’s net asset value growth in (Sager and Taylor 2006). Further, their risk-taking is constrained since active currency traders, like dealers, face position limits. Notice, however, that active currency traders are not motivated by consumption and they do not care about consumption risk. Indeed, there is no reason to expect the objectives of financial market participants to be aligned with those of consumers. It is agency problems that drive a wedge between the objectives of consumers and traders in foreign exchange: the institutions that employ the traders have to align the traders’ incentives with those of shareholders as best they can under conditions of asymmetric information, with the result that consumption is irrelevant. Agency problems have been show to be of overwhelming importance in understanding financial management at corporations. It would appear risky to assume that agency problems do not exist at currency-management firms. Active currency traders also differ, however, from the academic image of the international investor. The speculative horizons of active currency traders historically tended to range from a day to a month – longer than a dealer’s intraday horizon but still short by macro standards. Those horizons now include fractions of a second, as algorithmic trading on electronic platforms has surged in recent years (Barker 2007). Further, these traders rarely take positions in assets with fixed supplies, such as bonds or equities. Instead, they rely on forwards and futures, other derivatives, or possibly deposits, due to lower transaction costs and other benefits. Indeed, trading in currency futures has surged in parallel with the growth of the professional trading community, since “PTC accounts find the central clearing house exchange model [of futures markets] well suited to their preferred trading strategies. The CME [Chicago Mercantile Exchange]’s electronic trading platform also provides the high-speed API [application programming interface] access and deep, liquid markets that algorithmic trading routines depend on” (Barker 2007, p. 10). Critically, the assets preferred by the professional trading community are in flexible, not fixed, supply. This seemingly simple observation may unlock a longstanding puzzle in international macro, the apparent irrelevance of bond supplies for exchange rates. Under the standard assumption that speculative agents invest in bonds, an asset with fixed supply, bond supplies should influence exchange rates. Since bonds
9

are not widely used by active currency speculators, however, the irrelevance of bond supplies seems natural. Common speculative strategies among active currency traders are based on (i) forward bias, (ii) anticipated trends or trend reversals, and (iii) anticipated macro news.
Real-Money Managers: Most managers of “real money” funds do conform to the academic image of an international investor in terms of their investment horizon and their assets of choice: they take positions for a month or more and generally invest in bonds or equities. These managers do not, however, conform to that image in a separate, critical dimension: in calculating expected returns, real-world real money managers generally do not forecast the currency component of that return. According to Taylor and Farstrup (2006), who survey of the currency management business,
there are key participants in foreign exchange markets … that are not always seeking profit derived from their currency positions. … [I]n this category are international equity managers. While some managers factor in currency considerations as they go about picking foreign stocks, most are attempting to add value through stock, sector, and region bets rather than currency plays (p. 10, italics in original).
“Macro” funds are, evidently, an important exception to this generality. It is also important to note that funds often consider seriously the exchange-rate component of risk (Hau and Rey 2008) in making allocation decisions, even if they do not actively forecast returns per se. The decision not to forecast the currency component of returns is sometimes justified by pointing to the well-known inability of macro-based exchange-rate models to forecast more accurately than a random walk (Meese and Rogoff 1983). Further information about financial customers is presented in Sager and Taylor (2006).
Note that all speculative positions are constrained in currency markets. In exchange-rate models this would be consistent with the assumption that speculators are risk averse. It would not, however, be consistent with the assumption that deviations from purchasing power parity or uncovered interest parity are instantaneously eliminated by infinite trading. This may help explain why macroeconomic evidence of longstanding shows that these parity conditions do not hold over short-to-medium horizons.
Commercial Customers: With only rare exceptions, commercial firms do not take overtly speculative positions in spot and forward foreign exchange markets. Goodhart (1988) estimates that less than five percent of large corporate customers will speculate in the forward market, and dealers report that zero middle-market or small corporations speculate in that way. Indeed, many firms explicitly prohibit their trading staff – often administrators with other responsibilities besides trading – from engaging such transactions. Rogue trader risk is one key motivation for this choice. To impede the deception that enables rogue trading, firms that permit speculation must “separate the front office from the back office,” meaning they must prohibit traders from confirming or settling their own trades. This requires a separate staff to handle these functions (Federal Reserve Bank of New York 2004). The firms must also hire “compliance officers” to ensure that controls on the trading process are being observed faithfully (Federal Reserve Bank of New York, Best Practice 48). Since the vast majority of commercial firms need to trade only infrequently to carry out their real-side business, these heavy staffing requirements make speculative trading prohibitively expensive.
Another powerful reason why corporate customers avoid overt speculation is that it can raise corporate tax burdens. In the U.S., at least, profits from overtly speculative positions are accounted for differently from gains designed to offset losses on existing business exposures,
10
with the result that speculative profits are taxed more heavily. If a treasurer wishes to speculate, s/he can do so at a lower cost by redistributing the firm’s assets and liabilities around the world. Goodhart (1988) lists additional reasons why corporate customers generally do not speculate in spot and forward markets. The presence of non-financial customers provides a natural source of heterogeneity in the motivations for currency trading. Such heterogeneity is critical for modeling asset prices, and may thus be critical for the functioning of asset markets (Milgrom and Stokey 1982, Morris 1982). When all agents are rational speculators it is hard to find reasons why speculators would trade with each other. If the price is away from its fundamental value both agents should insist on taking the profitable side of any trade, which is impossible. If the price is at its equilibrium, however, there is no profit to be gained from trading.
In the foreign exchange market, commercial firms necessarily have different trading motivations from speculators. Speculative agents primarily care about currencies as a store of value and commercial traders primarily care about currencies as a medium of exchange. Thus the existence of high trading volumes is less difficult to explain in foreign exchange than in, say, equity markets. (In bond markets, an alternative trading motivation may be provided by insurers and others engaged in duration matching.)
To generate trading volume in models of equity markets, financial modelers typically introduce “liquidity traders” or “noise traders” (Kyle 1985, Black 1986), typically modeled as a pure random variable and verbally assigned some motivation for trading. For liquidity traders the motivation is exogenous portfolio rebalancing; for noise traders the motivation is often speculation based on misinformation (Black 1986). Neither motivation is fully satisfactory to the profession, however. Portfolio rebalancing is not sufficient to account for observed trading volumes and the professional preference for assuming rationality is not well-served by the noise trader concept. In foreign exchange markets, commercial traders provide rational trading partners for rational speculators.
Constraints on Exchange Rates: The institutional features outlined in this section reveal a key constraint on exchange rates. On most days the amount of currency purchased by end-users must (roughly) equal the amount sold by end-users. Though dealers stand ready to provide liquidity intraday, as modeled in Grossman and Miller (1988), their tendency to end the day with zero inventory means that the dealing community, as a whole, does not provide liquidity overnight. Within a day, the net purchases of any end-user group must, in consequence, ultimately be absorbed by the net sales of some other end-user group. The exchange rate presumably adjusts to induce end-users to supply the required liquidity. This same explicit constraint can be found in financial markets known as “call markets” (see glossary), where a single price is chosen to match the amount bought to the amount sold. Prominent call markets include the opening markets on the NYSE and the Paris Bourse. The very real constraint that end-user purchases equal end-user sales over a trading day differs dramatically from the exchange-rate equilibrium condition common to standard macroeconomic models. That condition is, in essence, that money demand equals money supply. The evidence does not support the relevance of aggregate money demand/supply to day-to-day exchange-rate determination (Osler 2006).
11

III. INTRADAY DYNAMICS
This section provides descriptive information about trading volume, volatility, and spreads on an intraday basis.
A. Intraday Patterns in Volume, Volatility, and Spreads Trading volume, volatility, and interdealer spreads all vary according to strong intraday
patterns that differ in certain key respects from corresponding patterns in bond and equity markets. Figures 1A and 1B show these patterns for euro-dollar and dollar-yen, based on EBS trade and quote data over the period 1999-2001 (Ito and Hashimoto 2006).
As in other markets, trading volume (measured here by the number of interbank deals) and volatility move together. As Asian trading opens they both rise modestly from overnight lows, after which they follow a crude U-shape pattern during Asian trading hours and then another U-shape during the London morning. They both peak for the day as London is closing and New York traders are having lunch and then decline almost monotonically, reaching their intraday low as Asian trading opens early in the New York evening.
Some back-of-the envelope figures may help make these trading-volume patterns concrete. In Ito and Hashimoto’s 1999-2001 EBS database there were roughly eight trades per minute in euro-dollar and six trades in dollar-yen (Ito and Hashimoto 2006). Together with the seasonal patterns, this suggests that overnight interdealer trading was on the order of one or fewer trades per minute while peak trading (outside of news events) was on the order of 10 (JPY) to 25 (EUR) trades per minute. Current interdealer trading activity would be substantially larger, reflecting subsequent market growth.
Bid-ask spreads almost perfectly mirror the pattern of volume and volatility. They are highest during the overnight period, and then decline as trading surges at the Asian open. As trading an volatility follow their double-U pattern during Asian and London trading hours, spreads follow the inverse pattern: they rise-then-fall during Asian trading and then rise-then-fall once again during the London morning. After London closes, spreads rise roughly monotonically to their overnight peaks.
Conventional interdealer spreads, as reported in Cheung and Chinn (2001), average three basis points in euro-dollar and dollar-yen, the two most active currency pairs. In sterling-dollar and dollar-swiss, the next two most active pairs, these averaged five basis points. Dealers in both the U.S. (Cheung and Chinn 2001) and the U.K. (Cheung, Chinn, and Marsh 2004) report that the dominant determinant of spreads is the market norm. One important reason for spreads to widen is thin trading and a hectic market. Another important reason is market uncertainty (Cheung and Chinn 2001), which is often associated with volatility. Since volatility also increases inventory risk, it makes sense that volatility and spreads have been shown to be positively related (Bollerslev and Melvin 1994, Jorion 1996, Hartmann 1999).
This tendency for interdealer spreads to move inversely from volume and volatility is consistent with predictions from two conceptual frameworks. Hartmann (1999) explains the relationship in terms of fixed operating costs, such as the costs of maintaining a trading floor and of acquiring real-time information. When trading volume is high these costs can easily be covered with small spread, and vice versa, so long as the extra volume is dominated by uninformed traders. The same explanation could also apply at the intraday horizon.
Admati and Pfleiderer (1988) develop an asymmetric information model consistent with some of the key properties just noted. In their model, discretionary uninformed traders (who can time their trades) choose to trade at one time since this brings low adverse selection costs to
12
dealers and thus low spreads. The low spreads encourage informed traders to trade at the same time and the information they bring generates volatility. Overall, this model predicts that trading volume and volatility move in parallel and both move inversely with spreads, consistent with the patterns in major foreign exchange markets.
In most equity and bond markets, spreads, volume, and volatility all follow an intraday (single) U-shape, so spreads move in parallel with trading volume and volatility rather than inversely. Notably, a similar U-shape characterizes interdealer foreign exchange markets in smaller markets, such as Russia’s electronic interdealer market for rubles, which only operate for a few hours every day (Menkhoff et al. 2007). In Taipei’s interdealer market, which has fixed opening and closing times and also closes down for lunch, spreads follow a double-U-shape. They begin the day high, tumble quickly, and then rise somewhat just before lunch. After lunch they follow roughly that same pattern (Gau 2005). This contrast suggests a connection between fixed trading hours and this U-shape for spreads.
Madhavan et al. (1997) provide evidence that high spreads at the NYSE open reflect high adverse-selection risk, since information has accumulated overnight. High spreads at the close, by contrast, reflect high inventory risk, according to their evidence, since dealers cannot trade until the market re-opens the next morning. In less-liquid foreign exchange markets, such as those for emerging market currencies, the overnight period is relatively long and there is little overnight liquidity, so similar patterns may arise. The failure of interdealer spreads in major currencies to follow the pattern observed in equity and bond markets need not imply, however, that adverse selection is irrelevant in the interdealer markets. In the major currencies, the overnight period is short and liquid (relative to other assets), so adverse-selection risk may not rise as sharply as the market opens and inventory risk may not rise as sharply as the overnight period approaches. In this case adverse selection could be relevant but subordinate to other factors, such as Hartmann’s fixed operating costs.
Weekends are a different story, since foreign exchange trading largely ceases from about 21 GMT on Fridays until 21 GMT on Sundays. The previous analysis suggests that foreign exchange spreads might be particularly wide on Monday mornings in Tokyo and Friday afternoons in New York. There is support for the first of these implications: Ito and Hashimoto (2006) provide tentative evidence that spreads are indeed exceptionally wide on Monday mornings in Tokyo.
Minute-by-minute data show that volume and volatility spike sharply at certain specific times of day (Chaboud et al. 2006). In the New York morning there are spikes at 8:20, 8:30, 10 and 11 am, reflecting the opening of derivatives exchanges, the release of U.S. macro news, standard option expiration times, and the WM/Reuters fixing (at 4 pm London time; this is a price at which many banks guarantee to trade with customers), respectively. Further spikes occur at 2 pm, and 8 pm New York time, reflecting the closing of derivatives exchanges and Japanese news releases, respectively. The timing of these spikes differs slightly in summer when daylight saving time is adopted in the U.K. and the U.S. but not Japan.
The high trading that typically accompanies macro news releases represents a further dimension on which the markets differ from the features assumed in macro-based exchange-rate models. In macro-based models all agents have rational expectations and all information is public. The release of macro news causes everyone’s expectations to be revised identically so the price moves instantly to reflect the new expectation without associated trading volume.
13
B. Feedback Trading The data provide substantial evidence of both positive and negative feedback trading in foreign exchange. Sager and Taylor (2006) find evidence for positive feedback trading in interdealer order flow using Granger-causality tests applied to the Evans and Lyons (2002) daily data. Marsh and O’Rourke (2005) and Bjønnes et al. (2005a) find evidence for negative feedback trading in semi-daily commercial-customer order flow but not in corresponding financial-customer order flow. Daniélsson and Love (2005) find evidence of feedback trading in transaction-level interdealer trading data. Feedback trading can greatly influence asset-price dynamics. For example, Delong et al. (1990) show that in the presence of positive-feedback traders the common presumption that rational speculators stabilize markets is turned on its head, and rational speculators intensify market booms and busts instead. Negative-feedback traders, by contrast, tend to dampen volatility.
There are at least three important sources of feedback trading in currency markets: technical trading, options hedging, and price-contingent orders. We discuss each in turn.
Technical trading is widespread in foreign exchange markets. Taylor and Allen (1992) show that 90 percent of chief dealers in London rely on technical signals. Cheung and Chinn (2001) find that technical trading best characterizes thirty percent of trading behavior among U.S. dealers and the fraction had been rising. Similar evidence has emerged for Germany (Menkhoff 1997) and Hong Kong (Lui and Mole 1998).
Trend-following technical strategies generate positive-feedback trading. Froot and Ramadorai (2005) present evidence for positive-feedback trading among institutional investors: their results indicate that, for major currencies vs. the dollar, a one standard deviation shock to current returns is associated with an 0.29-standard-deviation rise in institutional-investor order flow over the next thirty days.
Contrarian technical strategies generate negative feedback. For example, technical analysts claim that “support and resistance” levels are points at which trends are likely to stop or reverse, so one should sell (buy) after rates rise (fall) to a resistance (support) level. Support and resistance levels are a day-to-day topic of conversation among market participants, and most major dealing banks provide active customers with daily lists of support and resistance levels.
Option hedging also generates both positive- and negative-feedback trading. To illustrate, consider an agent who buys a call option on euros. If the intent is to speculate on volatility the agent will minimize first-order price risk (“delta-hedge”) by opening a short euro position. Due to convexity in the relationship between option prices and exchange rates, the short hedge position must be modestly expanded (contracted) when the euro appreciates (depreciates). The dynamic adjustments therefore bring negative-feedback trading for the option holder and, by symmetry, positive-feedback trading for the option writer.
Barrier options – which either come into existence or disappear when exchange rates cross pre-specified levels – can trigger either positive- or negative-feedback trading and the trades can be huge. Consider an “up-and-out call,” a call that disappears if the exchange rate rises above a certain level. If the option is delta-hedged it can trigger substantial positive-feedback trading when the barrier is crossed: since the short hedge position must be eliminated, the rising exchange rate brings purchases of the underlying asset. The entire hedge is eliminated all at once, however, so the hedge-elimination trade is far larger than the modest hedge adjustments associated with plain-vanilla options. Many market participants pay close attention to the levels
14

at which barrier options have been written, and make efforts to find out what those levels are. Related option types, such as TRNs, also trigger substantial feedback trading but tend to spread it out somewhat.
Price-contingent customer orders are the third important source of feedback trading in foreign exchange. These are conditional market orders, in which the dealer is instructed to transact a specified amount at market prices once a trade takes place at a pre-specified exchange-rate level. There are two types: stop-loss orders and take-profit orders. Stop-loss orders instruct the dealer to sell (buy) if the rate falls (rises) to the trigger rate, thereby generating positive-feedback trading. By contrast, take-profit orders instruct the dealer to sell (buy) if the price rises (falls) to the trigger rate, thereby generating negative-feedback trading. (Though the titles imply that anyone placing an order has an open position, this need not be – and often is not – the case.) The standard trigger for execution is a traded rate on an auditable source that matches the rate specified in the order, though other triggers can be specified (where auditable sources include EBS, Reuters, and voice brokers). Orders remain on the books until executed or cancelled, unless specified otherwise. Many orders are specified as “good ‘til close in X,” where X would be a major trading city. Take-profit orders are often used by non-financial firms that need to purchase or sell currency within a given period of time. Their option to wait is valuable due to the volatility of exchange rates. They can avoid costly monitoring of the market and still exploit their option by placing a take-profit order with a dealer. Financial firms also use take-profit orders in this way. Stop-loss orders, as their name implies, are sometimes used to ensure that losses on a given position do not exceed a certain limit. The limits are frequently set by traders’ employers but can also be self-imposed to provide “discipline.” Stop-loss orders can also be used to ensure that a position is opened in a timely manner if a trend develops quickly. Savaser (2008) finds that stop-loss order placement intensifies prior to major macro news releases in the U.S. One might imagine that these orders would tend to offset each other, since rising rates trigger stop-loss buys and take-profit sales and vice versa. However, as discussed in Osler (2003, 2005), differences between the clustering patterns of stop-loss and take-profit orders reduce the frequency of such offsets. Take-profit orders tend to cluster just on big round numbers: roughly 10 percent are placed at exchange rates ending in “00” (such as 1.2300 or 120.00) and another four percent are placed at rates ending in “50.” If orders were distributed randomly these fractions would all be about 1 percent. Stop-loss orders are less concentrated on the round numbers and more concentrated just beyond them (meaning above (below) the round number for stop-loss buy (sell) orders). Over 18 percent of stop-loss buy orders have trigger rates ending in two-digit combinations from 51 to 60, while only eight percent of stop-loss sell orders have such trigger rates. Similarly, over 16 percent of stop-loss sell orders have trigger rates ending in 40-49, while only six percent of stop-loss buy orders have such trigger rates.
Since stop-loss and take-profit orders cluster at different points, offsets are limited and these orders create noticeable nonlinearities in exchange-rate dynamics (Osler 2003, 2005). The presence of stop-loss orders, for example, substantially intensifies the exchange-rate’s reaction to macro news releases (Savaser 2008). Likewise, the tendency of take-profit orders to cluster at the round numbers increases the likelihood that trends reverse at such levels. This is consistent with the technical prediction, introduced earlier, that rates tend to reverse course at “support” and “resistance” levels. Finally, the tendency of stop-loss orders to cluster just beyond the round numbers brings a tendency for exchange rates to trend rapidly once they cross round numbers.
15
This is consistent with another technical prediction, that rates trend rapidly after a trading-range break out. Market participants often report that stop-loss orders are responsible for fast intraday exchange-rate trends called “price cascades.” In a downward cascade, for example, an initial price decline triggers stop-loss sell orders that in turn trigger further declines, which in turn trigger further stop-loss sell orders, etc. Upward cascades are equally possible: since every sale of one currency is the purchase of another, there are no short-sale constraints and market dynamics tend to be fairly symmetric in terms of direction (most notably, there is no equivalent to the leverage effect). Dealers report that price cascades happen relatively frequently – anywhere from once per week to many times per week. Osler (2005) provides evidence consistent with the existence of such cascades.
C. News
Macro news announcements typically generate a quick surge in currency trading volume and volatility. As shown in Figures 2A and 2B, which are taken from Chaboud et al. (2004), volume initially surges within the first minute by an order of magnitude or more. Dealers assert that the bulk of the exchange-rate response to news is often complete within ten seconds (Cheung and Chinn 2001).
Carlson and Lo (2006) closely examine one macro announcement the timing of which was unanticipated. They show that in the first half-minute spreads widened and in the second half-minute trading surged and the price moved rapidly. Chaboud et al. (2004) shows that after the first minute volume drops back substantially but not completely in the next few minutes. The remaining extra volume then disappears slowly over the next hour. The response of returns to news is particularly intense after a period of high volatility or a series of big news surprises (Ehrmann and Fratzscher 2005, Dominguez and Panthaki 2006, 2007), conditions typically interpreted as heightened uncertainty.
The U.S. macro statistical releases of greatest importance are the GDP, the unemployment rate, payroll employment, initial unemployment claims, durable goods orders, retail sales, the NAPM index, consumer confidence, and the trade balance (Anderson et al. 2003). Strikingly, money supply releases have little or no effect on exchange rates (Cai et al. 2001, Anderson et al. 2003, Cheung and Chinn 2001, Evans and Lyons 2008), consistent with the observation above that aggregate money supply and demand seem irrelevant for short run exchange-rate dynamics.
Statistical releases bring a home-currency appreciation when they imply a strong home economy. A positive one-standard deviation surprise to U.S. employment, which is released quite soon after the actual employment is realized, appreciates the dollar by (0.98 percent). For GDP, which is released with a greater lag, a positive one-standard deviation surprise tends to appreciate the dollar by 0.54 percent (Andersen et al. 2002). Responses are driven by associated anticipations of monetary policy: anything that implies a stronger economy or higher inflation leads investors to expect higher short-term interest rates (Chaboud et al. 2006) and thus triggers a dollar appreciation and vice versa.
Federal Reserve announcements following FOMC meetings do not typically elicit sharp increases in trading volume and volatility (Chaboud et al. 2006). Instead, FOMC announcements bring only a small rise in trading volume (Figure 2C) and tend to reduce exchange-rate volatility (Chang and Taylor 2003). This suggests that Federal Reserve policy shifts are generally anticipated, which is encouraging since that institution prefers not to surprise markets.
16
Unanticipated changes in monetary policy do affect exchange rates. Fratscher (2007) finds that an unanticipated 25 basis-point rise in U.S. interest rates tends to appreciate the dollar by 4.2 percent. Kearns and Manners (2005), who analyze other Anglophone countries, find that a surprise 25 basis-point interest-rate rise tends to appreciate the home currency by only 38 basis points. Kearns and Manners also note a more subtle dimension of response: If the policy shift is expected merely to accelerate an already-anticipated interest-rate hike, the exchange-rate effect is smaller (only 23 basis points, on average) than if the shift is expected to bring consistently higher interest rates over the next few months (43 basis points on average).
Evidence presented in Evans and Lyons (2005) suggests that exchange rates overshoot in responses to news announcements. For some types of news between a tenth and a quarter of the initial response is typically reversed over the four consecutive days. The reversals are most pronounced for U.S. unemployment claims and the U.S. trade balance. This contrasts strikingly with the well-documented tendency for initial the stock-price response to earnings announcements to be amplified after the first day, a phenomenon known as “post-earnings announcement drift” (Kothari (2001) provides a survey). Nonetheless, over-reaction to fundamentals has been documented repeatedly for other financial assets (Shiller 1981; Campbell and Shiller 1988; Barberis and Thaler 2002).
Exchange-rate responses to a given macro news statistic can vary over time, as dealers are well aware (Cheung and Chinn 2001). During the early 1980s, for example, the dollar responded fairly strongly to money supply announcements but, as noted above, this is no longer the case. This shift appears to have been rational since it reflected public changes in Federal Reserve behavior: in the early 1980s the Fed claimed to be targeting money supply growth, a policy it has since dropped. The possibility that such shifts are not entirely rational is explored in Bachetta and van Wincoop (2004). Cheung and Chinn (2001) provide further discussion of how and why the market’s focus shifts over time. Using daily data, Evans and Lyons (2005) find little evidence of such shifting during the period 1993-1999. This could reflect the masking of such effects in their daily data or it could indicate that such shifting was modest during those years of consistent economic expansion and consistent monetary policy structure.
Information relevant to exchange rates comes from many more sources than macroeconomic statistical releases. Trading volume and volatility are triggered by official statements, changes in staffing for key government positions, news that demand for barrier options is rising or falling, reports of stop-loss trading, even rumors (Oberlechner 2004). Jansen and De Hahn (2005) show that ECB statements affect conditional volatility but not the level of exchange rates. As documented in Dominguez and Panthaki, much of the news that affects the market is non-fundamental.
Numerous asymmetries have been documented in these responses to news. The effects of U.S. macro announcements tend to be larger than the effect of non-U.S. news (Goodhart et al. 1993, Evans and Lyons 2005). Ehrmann and Fratzscher (2005) attrtibute this asymmetry, at least in part, to the tendency for non-U.S. macroeconomic statistical figures to be released at unscheduled times and with a greater lag. Ehrmann and Fratzscher also shows that exchange rates respond more to weak than strong European news, and Andersen et al. (2002) report a similar pattern with respect to U.S. announcements. The source of such asymmetries is not well understood.
Carlson and Lo (2006) show that many interdealer limit orders are not withdrawn upon the advent of unexpected macro news. This might seem surprising, since by leaving the orders dealers seem to expose themselves to picking-off risk. It may not be the dealers themselves,
17

however, that are thus exposed. The limit orders left in place may be intended to cover take-profit orders placed by customers, so the customer may be the one exposed to risk.
To be concrete: suppose a customer places a take-profit order to buy 5 at 140.50 when the market is at 140.60. The dealer can ensure that he fills the order at exactly the requested price by placing a limit order to buy 5 at 140.50 in the interdealer market. Suppose news is then released implying that the exchange rate should be 140.30. The dealer loses nothing by leaving the limit order in place: the customer still gets filled at the requested rate of 140.50.
This interpretation may appear to push the mystery back one step, because now the customer is buying currency at 140.50 when the market price of 140.30 would be more advantageous. Why wouldn’t customers change their orders upon the news release, or withdraw them beforehand? This could reflect a rational response of customers to the high costs of monitoring the market intraday. Indeed, as noted earlier it is to avoid those costs that customers place orders in the first place. The customers, choosing not to monitor the market, may not even be aware of the news.
D. Intervention Numerous studies have examined the intraday effects of official (sterilized) foreign
exchange intervention. This is motivated in part by inherent limitations in the study of intervention at longer horizons: since intervention may be precipitated by intraday market developments, simultaneity may bias the analysis at daily or lower horizons (Vitale 2007). It is also intriguing to examine intraday effects since markets clearly take intervention reports seriously (see below), even though the effects of intervention at longer horizons appear to be limited (Sarno and Taylor 2001).
Studies of intervention using intraday data are often hampered by the inability to pinpoint the exact time of intervention. Such times are only revealed by the Swiss, Canadian, and Danish central banks. When exact intervention times are not available the “event” of intervention is typically identified with reference to Reuters news reports. Indirect evidence has suggested that these appear to be released with a (presumably time-varying) delay of 30 minutes to one hour (see, for example, Chang and Taylor 1998; Dominguez 2006). However, a direct comparison of the Reuters reports of Swiss intervention with actual intervention times shows that “the standard deviation of the prediction error can be measured in hours and not in minutes and there is evidence of Reuters intervention reporting before the SNB (Swiss National Bank) intervention occurs” (Fisher 2006, p. 1239). Fisher (2006) implicitly questions whether newsier reports of intervention provide a reliable basis for evaluating the intraday effects of intervention.
This section briefly reviews basic results from this literature: additional results are discussed in later sections. Studies of Swiss, Canadian, and Danish intervention show that intervention affects exchange rates as one would expect: purchases (sales) of a foreign currency (typically dollars or euros) bring a stronger (weaker) currency (see Fischer and Zurlinden (1999) for Switzerland, Fatum and King (2005) for Canada, and Fatum and Pedersen (2007) for Denmark). The effect is immediate in the Swiss and Canadian data but takes roughly 30 minutes to reach full strength in the Danish data. The effect persists for at least a few hours in the Swiss data (Payne and Vitale 2003). However, the effect may not be permanent and, if it is inconsistent with the direction of monetary policy, it is economically negligible even if it does last beyond a few hours (Fatum and Pedersen 2007). In the Swiss case rates begin to move in the quarter hour prior to the intervention (Payne and Vitale 2003). This indicates that intervention can be anticipated by the market which presumably is related to the tendency of intervention events to
18
be clustered. The ability to predict intervention could also reflect the fact that it is often precipitated by market developments.
The Swiss intervention data indicate that intervention has a stronger effect when it is coordinated with other central banks, consistent with studies using data from other countries and daily (or longer) time horizons (Dominguez 2003, Vitale 2007). The Swiss data differ from studies of Japanese intervention, however, when they indicate that intervention is more effective when it reinforces an existing trend, rather than attempting to counter a trend (Ito 2007; Payne and Vitale 2003). The Danish data indicate that intervention is only effective when it is consistent with current monetary policy fundamentals (Fatum and Pedersen 2007).
Both Fatum and Pedersen (2007) and Dominguez (2003) find that the effects are strongest during high volatility. D’Souza (2002) finds that the effects of interventions are similar to the effects of other customer trades. Dominguez finds, using Reuters intervention reports for non-Swiss authorities, that the intraday effects of intervention are strongest when the intervention is closely timed (within two hours) with macro announcements.
The intraday data tend to indicate that intervention is accompanied by a quick but brief boost to volatility, though some studies find the contrary result. Studies finding a negative association between volatility and intervention include Beattie and Fillion (1999) and Fatum and King (2005), both of which study Canadian intervention. Studies that find a positive association include Chang and Taylor (1998), which finds the effect most clearly using five- and ten-minute data, and Dominguez (2003), which finds that the peak effect lasts only a quarter hour and the overall effect disappears within an hour. Given a volatility spike, standard theories (e.g., Ho and Stoll 1981) predict that intervention would also bring higher bid-ask spreads in the interdealer market, a hypothesis that gains qualified support from the evidence. Naranjo and Nimalendran (2000) provide evidence for this hypothesis based on daily intervention data, and Chari (2007) provides support based on news reports of intervention.
IV. RETURNS AND VOLATILITY This section describes the basic statistical properties of returns and order flow.
A. Returns Major exchange rates are often described as following a random walk at the daily
horizon, since it has long been well-documented that daily returns to major exchange rates vis-à-vis the dollar are not autocorrelated and almost entirely unpredictable. The random walk description is technically inaccurate, of course, since the variance of returns can indeed be forecast: it would be statistically more accurate to describe the exchange rate as a martingale. Whatever the nomenclature, the fact that current exchange rates provide better forecasts than standard fundamentals-based models (Meese and Rogoff 1983) has long been a source of pessimism about exchange-rate theory in general.
Though the unconditional autocorrelation of daily returns is approximately zero, the conditional autocorrelation is not. Research has long shown that trend-following technical trading rules are profitable in major exchange rates (Menkhoff and Taylor 2006). Though returns to these trading rules seem to have declined in recent years, more subtle strategies remain profitable on a risk-adjusted basis (Chaunzwa 2006). Markov switching models also have predictive power for exchange rate returns (Dewachter 2001, Dueker and Neely 2007), though the switching variables must include more than mean returns (LeBaron 1998).
19
Daily returns are correlated across currencies, as one might expect given exchange-rate responses to news. The correlation between daily euro-dollar and sterling-dollar returns, for example, is 70 percent, while correlations between these European exchange rates and dollar-yen are smaller: both are 46 percent (Berger et al. 2006).
It has long been recognized that short-horizon exchange-rate returns are leptokurtotic. Kurtosis in euro-dollar returns, for example, is 24, 19, and 14 at the fifteen-minute, half-hour, and one hour horizons, respectively, all significantly higher than the level of three associated with the normal distribution (Osler and Savaser 2007). Even at the two-day horizon kurtosis is still statistically significantly above three, though it has declined to five. These figures need not be constant. Osler and Savaser (2007) demonstrate that a number of properties of price contingent orders impart high kurtosis to the distribution of returns. These properties include: high kurtosis in the orders’ own size distribution, intraday seasonals in the execution of these orders; and the clustering patterns in their trigger rates described earlier. Stop-loss orders can also contribute to high kurtosis by contributing to price cascades. This analysis suggests that changes in market reliance on price-contingent orders could bring changes in the distribution of returns.
Within the overall distribution of returns there seems to have been a shift during the 1990s from the smallest returns, meaning those within one standard deviation of the mean, towards returns between one and five standard deviations (Chaboud and Weinberg 2002). The frequency of the most extreme returns, however, showed no trend.
At the highest frequencies, returns definitely do not follow a random walk. Evans (2002) examines five-minute returns using Reuters direct-dealing prices during four months of 1996. He finds a negative autocorrelation at the first lag and negligible autocorrelation thereafter. The process seems best described as an ARMA(1,1) or possibly an ARMA(2,2).
B. Volatility Unlike returns, volatility exhibits strong autocorrelation. As shown in Table 2A, first-
order autocorrelation for daily volatility is typically above 0.50 and remains above 0.40 for at least a week. Evidence suggests that volatility is so persistent as to be fractionally integrated (Berger et al. 2006).
As recommended by Baillie and Bollerslev (1989), volatility is typically captured with a GARCH(1,1) model or a close variant. Table 2B gives illustrative results from Chang and Taylor (2003) showing that the AR component of the volatility process dominates (coefficients above 0.90) but the MA component is still significant. The MA component becomes increasingly important as the time horizon is shortened, though it remains subordinate. Table 2B also provides results suggesting that the double exponential distribution may fit return volatility better than the normal distribution. The thickness-of-tails parameter, “v,” is two for the normal distribution but lower for the double exponential: estimates place it closer to unity than two.
Ederington and Lee (2001) show, using 10-minute futures data for the DEM over July 3, 1989 through September 28, 1993, that the GARCH(1,1) model tends to underestimate the influence of the most recent shock and also shocks at long lags. These effects are captured better with an ARCH formulation that includes the lagged one-hour, one-day, and one-week return shock: , where ht is estimated conditional
volatility and εt is the shock to returns. The authors also find that daily and intraday seasonal
29
28
27
6,1
20 weekdayhour
iitith εαεαεαεαα ++++= ∑
=−
20

patterns to volatility become fairly unimportant after controlling for announcements and ARCH effects. They conclude that “much of the time-of-day patterns and day-of-the-week patterns are due to a
nted
ews
t o
behavior of volatility changed dramatically around the Japanes
d (ii)
lume
nt em, find that autocorrelation in the
umbe
s is
-lays
that trading volume has modest
. Kim
d the
information in addition to, or instead of, implied volatilities (Martens 2001, Pong et al. 2004).
LOW AND EXCHANGE RATES, PART I: LIQUIDITY AND INVENTORIES
n
nnouncement patterns” (p. 536). Volatility usually rises upon news announcements, consistent with the analysis prese
in III.C (Ederington and Lee 2001), but it can fall: Chang and Taylor (2003) find that U.S. Federal Reserve news reduces volatility. This is consistent with the earlier finding that Fed nreduces uncertainty. Volatility, like returns, can behave asymmetrically. Chang and Taylor (2003) show that, during 1992, the volatility of dollar-mark was sensitive to U.S. macro news buinsensitive to German macro news. Such asymmetries need not be stable over time: Hashimot(2005) shows that asymmetries in the
e bank failures of late 1997. It is often hypothesized that volatility persistence derives from persistence in the flow of
information, based on two premises: (i) volatility moves in parallel with trading volume, antrading volume is persistent because the advent of news is persistent. There is evidence to support both of these premises. Volatility and volume move together in most financial markets and foreign exchange is no exception, as shown in Figure 1. Foreign exchange trading voand volatility also move together at longer horizons (Bjønnes et al. 2005b, Galati 2000). Evidence also indicates persistence in the news process. Chang and Taylor (2003), who counews releases on the Reuters real-time information systn r of news items is 0.29 at the one-hour horizon. There is, however, little empirical evidence that directly traces volatility persistence in foreign exchange to news persistence. In fact, the only direct evidence on this point suggests that other factors are more important than news. Berger et al. (2006a) finds that persistence in news iprimarily relevant to shorter-term volatility dynamics while long-run persistence in volatility captured primarily by the low-frequency persistence in price impact, meaning the impact on exchange-rates of order flow. Figure 6, taken from Berger et al. (2006a), shows that daily priceimpact coefficients for euro-dollar varied quite a bit during 1999-2004, and the series dispstrong persistence at low frequencies. Further tests show explanatory power even after controlling for order flow. Implied volatilities from exchange-traded options contracts have also been studiedand Kim (2003) find that implied volatilities in futures-options are heavily influenced by volatility in the underlying futures price itself. They are not strongly influenced by news, anfew macro news releases that matter tend to reduce implied volatilities. Their analysis also indicates that implied volatilities tend to be lower on Mondays and higher on Wednesdays, though the pattern is not strong enough to generate arbitrage trading profits after transaction costs. Two studies show that daily volatility forecasts can be improved by using intraday returns
V. ORDER F
Customer currency demand usually must net to around zero on most trading days, as discussed earlier, and exchange-rate adjustment seems likely to be the mechanism that induces this outcome. If one group of customers decides to purchase foreign currency over the day, onet, the currency’s value must rise to bring in the required net liquidity supply from another
21
group o
duce overnight liquidity supply and vice versa. lently, “order imbalances,” which we examine next, can demand.
flow is calculated as market buy orders minus market sell orders; when using d
o-at an
e s
o use daily interbank order fl joint
g )
ter controlling for feedback effects;
tes, r
Indeed, th ng str
e age
e. The risk here is that the exchange rate bounces
f customers. This implies, crudely, a relationship between net liquidity demand and exchange-rate returns.
To identify this relationship empirically one must distinguish liquidity-demand trades from liquidity-supply trades on a given day. We cannot simply look at trading volume or, equivalently, total buys or total sells, since it is the motivation behind the trades that matters. Instead we need to compare the purchases and sales of liquidity consumers/demanders. If they buy more than they sell then rates should rise to inThe concept of “order flow” or, equivabe viewed as a measure of net liquidity
A. Interdealer Order Flow In the interdealer market we identify liquidity demanders with either (i) those placing
market orders or (ii) those calling other dealers to trade directly. When using transaction data from a broker, order
irect dealing data, order flow is calculated as dealer-initiated buy trades minus dealer-initiated sell trades.
Evans and Lyons (2002) were the first to show that interdealer order flow has substantial explanatory power for concurrent daily exchange-rate returns, a result that has been replicated innumerous studies (Evans 2002, Hau, Killeen, and Moore 2002). Benchmark results are providedin Berger et al. (2006b), which has the advantage of a relatively long dataset. That paper shows that the raw correlation between daily returns and interdealer order flow is 65 percent for eurdollar, 42 percent for sterling-dollar, and 49 percent for dollar-yen. Berger et al. estimates thextra $1 billion in order flow in a given day appreciates the euro, the pound, and the yen by roughly 0.40 percent, with R2s in the vicinity of 0.50. By contrast, it is well known that thexplanatory power of standard fundamentals is typically well below 0.10 (Evans and Lyon2002). Evans and Lyons (2002a) and Rime, Sarno, and Sojli (2007) find that the overall explanatory power of interdealer order flow for returns can be substantially increased by including order flow from other currencies. Evans and Lyons (2002a), wh
ows for seven currencies against the dollar over four months in 1996, find that theexplanatory power averages 65 percent and ranges as high as 78 percent.
Since feedback trading is ubiquitous in foreign exchange, one must consider the possibility that these correlations represent reverse causality – that returns are in fact drivinorder flow. Two studies investigate this possibility. Using daily data, Evans and Lyons (2005afind that the influence of order flow on price survives intact af
using transactions data, Daniélsson and Love (2005) find that the estimated influence becomes even stronger after controlling for feedback trading.
Dealers have long recognized the importance of currency flows in driving exchange raand have said as much in surveys. In Gehrig and Menkhoff’s survey (2004), for example, ove86 percent of dealers said they rely on analysis of flows in carrying out their responsibilities.
e influence of order flow on exchange rates is a critical assumption in their tradiategies, as illustrated in the following debate over optimal management of stop-loss orders.
A dealer with a large stop-loss buy order could begin filling the order after the exchange-rate rises to the trigger price. Since the order-filling trades themselves will drive the price up, however, the average price paid will exceed the trigger rate, to the customer’s disadvantage. The dealer could, alternatively, begin filling the order before the rate hits thtrigger price. The buy trades will push the price up through the trigger rate and the averfill price will be closer to the trigger rat
22
back down below the trigger rate, in which case the customer could justly complain of getting inappropriately “stopped out.”
The key observation here is that the pros and cons of both strategy options are driven by the impact of order flow. Dealers do not view this as an hypothesis or as an assumption. To them it is something they know, in the same sense that one “knows” that the sun will disappear below the hor
o
d ry
th er flow during periods of low spreads and high
trading
ct dealing nce Evans’
at
he
madorai (2005), using institut one
s are left with an inventory position and thus inventory risk. Dealers thus charge a spread which
izon at the end of the day (pace Hume). Dealers see order flow influence price too often and too consistently to question it.
The estimated price impact of interdealer order flow varies according to order size, time of day, and time horizon. Price impact has a concave relationship to size (Osler and Vandrovych2007), consistent with evidence from equity markets (Jones, Kaul, and Lipson 1994; Hasbrouck 1991). This may reflect order splitting and other dealer strategies for minimizing the impact of large trades (Bertsimas and Lo 1997). At the daily horizon, the price impact is linearly related torder flow, which makes sense since splitting a large trade into smaller individual transactionsrarely takes more than a few hours. On an intraday basis, the price impact of interdealer order flow is inversely related to trading volume and volatility, as shown for dollar-yen in Figure 7 (Berger et al. 2006b). As discussed earlier, spreads have a similarly inverse relation to trading volume and volatility (Figure 1). The strong positive intraday correlation between spreads anprice impact could reflect the influence of a third factor, depth, which might be expected to vainversely with spreads and positively with trading volume on an intraday basis. High depwould tend to dampen the price impact of ord
volume. (Unfortunately, information on the intraday behavior of depth is not yet available for the foreign exchange market.)
The overall relation between trading volume and price impact is not clear, however. Evans (2002) finds a strong positive relation using four months of direct interdealer trades from1996. The difference between the Evans and Berger et al. results could reflect differences in estimation strategy -- Evans explicitly estimates how price impact varies with trading volume while Berger et al. focus exclusively on time of day and the correlation with trading volume is implied rather than estimated; differences in market structure -- Evans’ data pertains to dire
while Berger et al.’s data pertain to brokered trades; or even sample period, sidata predate Berger et al.’s data by many years and the market has been changing rapidly.
As time horizons lengthen the price impact of interdealer order flow declines monotonically (Berger et al. 2006b). For the euro, an extra $1 billion in order flow is estimatedto bring an appreciation of 0.55 at the one-minute horizon but only 0.20 percent at the three-month horizon (Figure 5A). The explanatory power of interdealer order flow also varies with horizon but in a rising-falling pattern. The R2 is 0.36 at the one-minute horizon, reaches 0.50the 30-minute horizon, stays fairly constant to the one-week horizon, and then falls sharply to about 0.17 percent at the two-month horizon (Figure 5B). Even at 17 percent, however, texplanatory power of order flow at three months is substantially higher than has been achieved with other approaches. A similar pattern is found in Froot and Ra
ional investor order flow, though they find a peak at roughly one month rather thanweek. They attribute the initial rise to positive-feedback trading.
The positive relation between interdealer order flow and exchange rates could be influenced by inventory effects as well as the liquidity effects described above. Inventory effects were, in fact, the first connection between order flow and asset prices to be analyzed in the broader microstructure literature (e.g., Stoll 1978). Dealers that provide liquidity to other dealer
23
compensates them for this risk. The spread, in itself, generates a positive relationship between order flow and returns: prices typically rise to the ask price upon buy orders and fall to the bid
B.
y-trade
y from its own dealer at that instant while
effectiv
r in
tween order flow and returns for customer groups that typically supply overnight liquidit
k
n analysis where the key relationship is betwee
ht
e d
l.(2005) show this using comprehensive trading data on the Swedish krone sample
ty y contrast, commercial
custom in order
ons
price upon sell orders.
Customer Order Flow Order flow in the customer market is measured as customer-initiated buy trades minus
customer-initiated sell trades. This is consistent with a liquidity interpretation on a trade-bbasis, since each customer effectively demands instantaneous liquidity from their dealer. Customer order flow, however, is not ideally suited to measuring customer net liquidity demand at daily or longer horizons. If a customer is coming to the market in response to an exchange-ratechange, then the customer may be demanding liquidit
ely supplying liquidity to the overall market. This distinction proves critical when interpreting the empirical relation between daily
customer order flow and exchange rates. There should be a positive relation between daily ordeflow and returns for customer groups that typically demand overnight liquidity. An increase their demand for foreign currency, for example, should induce a rise in the value of foreign currency to elicit the required overnight supply. Implicit in that story, however, is a negative relation be
y. Researchers have documented repeatedly that, at the daily horizon, financial-customer
order flow is positively related to returns while commercial-customer order flow is negatively related to returns. Confirming evidence is found in Lyons’ (2001) study of monthly customer flows at Citibank; in Evans and Lyons’ (2007) study of daily and weekly customer flows at the same bank; in Marsh and O'Rourke's (2005) analysis of daily customer data from the Royal Banof Scotland, another large dealing bank; and in Bjønnes et al.’s (2005) comprehensive study of trading in Swedish kroner, and in Osler et al.’s (2007) study of a single dealer at a medium-sized bank. The pattern is typically examined using cointegratio
n exchange-rate levels and cumulative order flow. This pattern suggests that financial customers are typically net consumers of overnig
liquidity while commercial customers are typically net suppliers. More direct evidence that commercial customers effectively supply overnight liquidity, on average, comes from evidencthat commercial order flow responds to lagged returns, rising in response to lower prices anvice versa. Marsh and O’Rourke (2005) show this with daily data from the Royal Bank of Scotland. Bjønnes et a
d twice daily. It is easy to understand why financial customers would demand liquidity: presumably
they are speculating on future returns based on some information that is independent of past returns. It is not so immediately obvious why commercial customers would supply overnight liquidity, since our first image of a liquidity supplier is a dealer. Dealers supply intraday liquidiknowingly and are effectively passive in their trades with customers. B
ers are not supplying liquidity either knowingly or passively. Commercial customers are, instead, just responding to changes in relative prices
to maximize profits from their core real-side businesses. Suppose the foreign currency depreciates. Domestic firms note that their foreign inputs are less expensive relative to domestic inputs and respond by importing more, raising their demand for the foreign currency. This effect, a staple of all international economic analysis, has been well-documented empirically at horizof a quarter or longer (e.g., Artus and Knight 1984). On an intraday basis this effect is often
24
evident in the behavior of Japanese exporting firms, which hire professional traders to manage their vast dollar revenues. These traders monitor the market intraday, selling dollars whenever the price is attractive. The vast majority of commercial customers need to buy or sell currenonly occasionally so they can’t justify hiring professional traders. They can use take-profit orders, however, to achieve the same goal, since this effectively enlists their dealers to monitothe market for them. At the Royal Bank of Scotland take-profit orders are 75 (83) percent of price-contingent orders placed by large corporations (middle-market) corpo
cy
r
rations (Osler and Vandro
is. The
customers as short-run push customers and
commees.
,
changes. In this case commercial end-users would consume liquidity rather than supplyi
ith
he sitions in foreign assets, and as they enact the portfolio
shift fin
y
y high risk tolerance, their trading is always admini
port
s
vych 2007), but only 53 percent of price-contingent orders overall. The evidence to date suggests the following crude portrait of day-to-day liquidity
provision in foreign exchange (a portrait first articulated in Bjønnes et al. 2005). Financial customers tend to demand liquidity from their dealers, who supply it on an intraday basdealing community as a whole does not provide overnight liquidity, however. Instead, commercial customers supply the required overnight liquidity, drawn to the market by new, more attractive prices. Sager and Taylor (2006) distinguish between “push” customers, who demand liquidity, and “pull” customers, who respond to price changes by providing liquidity. The marketstructure just outlined effectively identifies financial
rcial customers as short-run pull customers. This picture is extremely preliminary and will doubtless change as new evidence arriv
There is, for example, no theoretical or institutional reason why commercial customers mustexclusively supply overnight liquidity or financial customers exclusively demand it. To thecontrary, there are good theoretical reasons why the roles could sometimes be reversed. A change in commercial currency demand could result from forces outside the currency marketsuch as a war-induced rise in domestic economic activity, rather than a response to previous exchange-rate
ng it. Rational speculators are the only overnight liquidity suppliers in the widely-respected
Evans and Lyons (2002) model. In that model the trading day begins when agents arrive warbitrary liquidity demands. The agents trade with their dealers, leaving the dealers with unwanted inventory. Dealers then trade with each other, redistributing their aggregate inventory but not reducing it. At the end of the trading day dealers sell the unwanted inventory to rationalinvestors who are induced to supply the required liquidity by a change in the exchange rate. Ifthe initial liquidity demanders have sold foreign currency, for example, the currency’s value declines thus raising the risk premium associated with holding the currency. This encourages trisk-averse investors to take bigger po
ancial order flow is positive. The Evans-Lyons scenario is necessarily simple. In a model with many assets, negative-
feedback trading among financial customers requires that the currency has no perfect substitutes (Harris and Gurel 1986). This condition holds in foreign exchange since exchange rates generallhave low correlation with each other and with equities. For the negative feedback trading to be finite it is also required that speculators are risk-averse and/or face constraints on their trading. Though currency speculators appear to have a fairl
stratively constrained, as discussed earlier. The prevalence of contrarian technical trading strategies, such as those based on sup
and resistance levels, provides a further reason to expect negative-feedback trading among financial customers. Similarly, financial agents place a hefty share of take-profit orders (Osler and Vandrovych 2007), so a liquidity response from these traders is a fact. Despite these reason
25
to expect negative-feedback trading among financial customers, the evidence does not suggest that their liquidity response is substantial relative to the overall market. Bjønnes et al.’s (2005) study of trade in Swedish kroner and Marsh and O’Rourke’s (2005) study of customer trades at the Roy
through
r. e
s are liquidated the reverse order flow could move t
ly from
ese
run he
run relevance of purchasing power parity, and the short-run failure of
C. ange
r se e continuous purchasing power parity
and/or
els,
ires
price. T
s
al Bank of Scotland both find no sensitivity of financial order flow to lagged returns. The influence of order flow on exchange rates, as described in this section, works
liquidity effects. The broader microstructure literature refers to this influence in terms of “downward-sloping demand,” highlighting that the demand for the asset has finite, rather than infinite, elasticity. Downward-sloping demand could explain why Froot and Ramadorai (2005) find that the initial influence of institutional investor order flow disappears after roughly a yeaInstitutional investors – indeed, all speculative agents – have to liquidate positions to realizprofits. When the positions are initially opened, the associated order flow could move the exchange rate in one direction; when the position
he exchange rate in the reverse direction. Finite elasticity of demand is the underlying reason for exchange-rate movements in Hau
and Rey’s (2006) model of equity and currency markets. Carlson et al. (2008) develop a relatedexchange-rate model in which financial and commercial traders can be both liquidity suppliers and liquidity demanders. This model, which takes its critical structural assumptions directthe microstructure evidence, predicts that financial (commercial) order flow is positively (negatively) related to concurrent returns, consistent with the evidence. It also predicts that threlations are reversed in the long run, consistent with evidence in Fan and Lyons (2003) and Froot and Ramadorai (2005). Investors in the model have no long-run effect on exchange rates because they ultimately liquidate all their positions. Since commercial agents dominate long-run exchange rates, fundamentals such as prices and economic activity are important in the longeven though the may not dominate in the short run. In addition to being consistent with tmicrostructure evidence, this model is also consistent with most of the major puzzles in international macroeconomics, including: the apparent disconnect between exchange-rates and fundamentals, the increase in real-exchange-rate volatility upon the advent of floating rates, the short-run failure and long-uncovered interest parity.
Order Flow and Exchange Rates The influence of order flow on exchange rates is another aspect of the foreign exch
market that “does not seem to tally closely with current theory…” (Goodhart 1988). The equilibrium exchange rate in standard models adjusts to ensure that domestic and foreign money supplies equal corresponding money demands. The currency purchases or sales that accompany portfolio adjustments are not modeled and are considered unimportant. Indeed, order flow pecannot be calculated in these models since they assum
continuous uncovered interest parity. The contrast between microstructural reality and standard models is especially clear when
we examine the mechanism through which news affects exchange rates. In macro-based modthe public release of information generates an immediate revision of shared expectations of future exchange rates, which in turn brings an immediate exchange-rate adjustment that requno trading. Trading is unlikely, in fact, since no rational speculator would trade at any other
hus order flow in the models has no role in the exchange-rate adjustment to news. The evidence shows, however, that order flow is the main conduit through which news
influences exchange rates. Roughly two thirds of the influence of news on exchange-rate leveland volatility comes from the associated order flow (Love and Payne 2003, Evans and Lyons
26
2003). During the “once-in-a-generation yen volatility” of 1998, “order flow [was the] most important …source of volatility,” according to the investigation of Cai et al. (2001), even more importa
natural extension of an imp
zed
ning these present and future economic conditions (Frenkel and Mussa 1985 p.
ss
es they should be determined like other asset prices and thus order flow should be influential.
VI. ORDER FLOW AND EXCHANGE RATES, PART II: INFORMATION
section considers a third and critically important reason:
change-
nt
rmanent relation is inevitable, however, if order
s
nthaki (2007) showing that ant
alyzed
nt than news and central bank intervention. Reassuringly, the idea that order flow affects exchange rates is a
ortant lesson learned after the advent of floating rates in the 1970s. [E]xchange rates should be viewed as prices of durable assets determined in organimarkets (like stock and commodity exchanges) in which current prices reflect the market's expectations concerning present and future economic conditions relevant for determining the appropriate values of these durable assets, and in which price changes are largely unpredictable and reflect primarily new information that alters expectationsconcer726).
There has long been extensive evidence that order flow influences price in equity markets (Shleifer 1986; Holthausen et al. 1990; Chordia, Roll, and Subrahmanyam 2002). In bond markets the evidence emerged later, due to constraints on data availability, but is nonethelesubstantial (Simon 1991, 1994; Jovanovic and Rousseau 2001; Fleming 2003; Brandt and Kavajecz 2005; Pasquariello and Vega 2007). Since exchange rates are asset pric
So far we have considered two reasons why order flow could affect exchange rates: liquidity effects and inventory risk. Thisorder flow carries private information. The information hypothesis is suggested by evidence showing that much of the exrate response to order flow is permanent. Payne (2003), who decomposes of returns into permanent and transitory components consistent with Hasbrouck (1991), finds that “the permanent component accounts for … one quarter of all return variation” (p. 324). A permaneeffect is implicit in Evans and Lyons' (2002) evidence that order flow has strong explanatory power for daily exchange-rate returns, since daily returns are well described as a random walk. Apermanent relation is also suggested by the finding, noted earlier, that cumulative order flow is cointegrated with exchange rates (Killeen et al. 2006; Bjønnes et al. 2005b; Bjønnes and Rime 2005). A permanent relation between order flow and price is not consistent with the inventory analysis presented earlier. A permanent relation is consistent with liquidity effects if the shifts in liquidity demand or supply are permanent. A peflow carries private fundamental information. The potential importance of information in the exchange-rate response to order flow is also suggested by other observations. For example, the strong relation between order flow and intra-Eurozone exchange rates essentially disappeared in May 1998, when the ultimate parities were announced (Killeen, Lyons, and Moore 2006). Likewise, studies of Swiss National Bank transactions show that its official intervention transactions have a strong intraday effect while itnon-intervention transactions have no effect (Fischer and Zurlinden 1999). The salience of the information connection is also implied by results in Dominguez and Pa
icipated but unrealized intervention influences exchange rates. The influence of private fundamental information on asset prices was originally an
in equity-inspired models (Kyle 1985, Glosten and Milgrom 1985), which begin with the
27
observation that sometimes customers have private information about an asset’s true value that dealers do not have. Since an informed customer only buys (sells) when the dealer’s price is too low (high), dealers typically lose when they trade with such customers. To protect themselves frothis adverse selection, dealers charge a bid-ask spread, ensuring that profits gained from trading with uninformed customers balance the inevitable losses from trading with informed custom(Copeland and Galai 1983). Rational dealers ensure that their prices reflect the information communicated by a customer’s choice to buy or sell (Glosten and Milgrom 1985, Easley and O’Hara 1987). Prices are “regret-free” in the sense that a dealer would not wish s/he had charga higher (lower) price after learning that the customer wishes to buy (sell). Due to the spread, prices rise when informed customers buy and fall when informed customers sell. Meanwhile, others update their conditional expectation of the asset’s true value and adjust their trades andquotes accordingly. Ultimately the information becom
ers
ed
es fully impounded in price. Since the
rma effect is permanent.
A.
te
econom
ged
ategories
t being under the
he
t rather
t for market-based
aggr
info tion is fundamental, the
Types of Information Private fundamental information in the foreign exchange market is likely to be
structurally different from private fundamental information in a stock market. The fundamental determinants of a firm’s value include many factors about which there can naturally be privainformation, such as management quality, product quality, and a competitor’s strength. The fundamental determinants of a currency’s value, by contrast are macroeconomic factors such as
ic activity, interest rates, and aggregate price levels, most of which are revealed publicly.The foreign exchange literature implicitly elaborates multiple different interpretations of
the private information customers might bring to the market. These vary along three dimensions:(i) whether the information comes from commercial customers, real-money funds, or leverainvestors; (ii) whether the information is fundamental; and (iii) whether the information ispassively or actively acquired. Though these three dimensions provide eight conceivable information categories, only a few of these appear to be relevant for research. For example, only a small minority of the thousands of non-financial firms around the world would ever attempt toacquire either fundamental or non-fundamental information before trading. The four cthat seem likely to be important, based on the current literature, are discussed below.
1. Fundamental information passively acquired by commercial customers. Information about exchange-rate fundamentals may be “dispersed” among customers withou
ir control. This hypothesis is most closely associated with Evans and Lyons: The dispersed information we have in mind in fact characterizes most variables at tcenter of exchange rate modeling, such as output, money demand, inflation, [and] consumption preferences … These variables are not realized at the macro level, bufirst as dispersed micro realizations, and only later aggregated by markets and/or governments. For some of these measures, such as risk preferences and money demands,government aggregations of the underlying micro-level shocks do not exist, leaving the full task of aggregation to markets. For other variables, government aggregations exist, bupublication lags underlying realizations by 1 – 4 months, leaving room
egation in advance of publication. (Evans and Lyons 2007, p. 3). For concreteness, suppose the economy is expanding rapidly and in consequence
commercial firms are all trading actively. Each individual firm might not recognize the generality of its experience but a dealer could potentially see the high economic activity reflected
28
in his commercial-customer order flow. This information would provide the dealer with a signof GDP concurrent with its realization and thus prior to the associated statistical release.
2. Fundamental information passively acquired by financial customers. A variant of the dispersed information hypothesis postulates that the relevant fundamentals concern capital markets as well as the real economy. For example, high demand from institutional investors might indicate that risk aversion is low (Lyons 2001; Evans and Lyons, 2002, 2007). It is not clear whether structural features of financial markets should be considered fundamental, in pabecause the definition of the term fundamental is not entirely clear. It is clear, however, that anyfundamental factor should be relevant to long run equilibrium. Certain structural features of financial markets, like risk appetite, seem likely to influence long-run international macro variables such as international net asset positions (the U.S. net asset position has changed sign but once since 1970), and these in turn seem likely to i
al
rt
nfluence exchange rates. So it seems that e d e
till
y”
trading volume,
ental
n:
som eep financial-market parameters are fundamental, or at least represent some intermediatcategory between fundamental and non-fundamental.
3: Fundamental information actively sought by customers. Certain financial customers – typically leveraged investors – forecast exchange rates by combining existing public information with their own economic insights. For example, many such agents attempt to profit from the big returns associated with macro statistical releases by generating private forecasts of upcoming announcements. These customers thus actively generate private fundamental information, ratherthan passively reflecting information that arises as a normal part of their business. This actively-acquired information could also be reflected in customer order flow, so dealers could sgenerate their own private signals by observing it. Dealers often report that currency demand is highly correlated within certain types of leveraged investors, permitting them to infer information from observing the trades of just one or a few of these investors.
Indirect evidence for the existence of actively-acquired information comes from Marsh and MacDonald (1996). They find, in a sample of exchange-rate forecasts, that a major cause of forecast heterogeneity “is the idiosyncratic interpretation of widely available information, andthat this heterogeneity translates into economically meaningful differences in forecast accurac(p. 665). They also find that heterogeneity is a significant determinant of consistent with predictions in the literature that diversity of price forecasts generates trading (Varian 1985, 1989; Harris and Raviv 1993; Kandel and Pearson 1995).
4: Non-fundamental information. Some speculative traders may respond to non-fundamental information, like noise traders. Others could respond to non-fundamental hedging needs, as suggested in Bacchetta and van Wincoop (2006). Evidence for the relevance of non-fundaminformation is provided in Osler (2005), Dominguez and Panthaki (2006), and Cao, Evans, and Lyons (2006). If the information in order flow is not fundamental it is likely to have only a transitory influence on rates.
Trades based on non-fundamental information may be informative to dealers even if theyhave only a transitory impact on the market, since dealers speculate at such high frequencies. Indeed, Goodhart (1988) insists that dealers rely on nothing but non-fundamental informatiodealers’ “speculative activities are not based on any consideration of longer-term fundamentals. … And to repeat, … the extremely large-scale, very short-term speculative activity in this market by the individual traders … is not based on a long-term future view of economic fundamentals” (pp. 456-457, italics in the original) Consistent with this, U.S. dealers assert that the high-frequency returns on which they focus are unrelated to fundamentals (Cheung and
29
Chinn 2001). For example, “at the intraday horizon, PPP has no role according to 93 percent of respondents” (p. 465). This could be relevant for understanding the apparent “information”
appears to have limited long-hat brings a reaction from market
particip
private banks
1).
s to affects the
informa
to use it
inear
(2006)
or
er ding
of n
day
R. They use the forecasts to create portfolios of the currencies. For forecast horizon and
content of actual and anticipated intervention. Since interventionrun effects, it may be just the transitory high-frequency impact t
ants.
B. The Evidence: Order Flow Does Carry Information The evidence indicates fairly clearly that some foreign exchange order flow carries information. For example, Bjønnes, Osler, and Rime (2007) show statistically that
with the most customer business have an information advantage in the interdealer market, a proposition that dealers themselves certainly support (Goodhart 1988, Cheung and Chinn 200
The broader microstructure literature identifies location, specifically proximity to relevant decision-makers, as another potential source of information advantage in financial markets (Hau 2001, Coval and Moskowitz 2001, Malloy 2005). Location also appears to be relevant in foreign exchange. Covrig and Melvin (2002) find that order flow from Japan tendlead movements in dollar-yen. Menkhoff and Schmeling (2007) find that location
tion content of interbank trades in the market for rubles. Their analysis indicates that trades originating from the two major financial centers, Moscow and St. Petersburg, have a permanent price impact while trades originating from six peripheral cities do not.
If order flow carries exchange-rate relevant information then one should be ableto forecast exchange rates. Studies consistently find that customer order flow has predictive power for exchange rates. Evans and Lyons (2005) find that daily customer order flow at Citibank has forecasting power for exchange-rate returns at horizons up to one month. Gradojevic and Yang (2006) finds that customer and interbank order flow in the Canadian dollar market jointly have forecasting power for exchange rates. They also conclude that a non-lforecasting structure, specifically an artificial neural network, is superior to linear approaches. Both Evans and Lyons (2005) and Gradojevic and Yang (2006) conclude that return forecasts areimproved when customer order flow is disaggregated according to customer type, which suggests that some participants are more informed than others. Curiously, Rosenberg and Traub
provide evidence that futures order flow has predictive power for near-term spot returns.This raises the possibility that the most informed investors choose to trade in futures markets,alternatively that when investors do choose the futures market it is because they are informed.
Studies of the forecasting power of interdealer order flow arrive at mixed conclusions. Sager and Taylor (2007) examine the predictive power of daily interdealer order flow series, including two heavily filtered commercially available order flow series, and the raw interdealflows examined in Evans and Lyons (2002). They estimate single-equation regressions incluorder flow and interest differentials as independent variables. Measuring performance in termsroot mean squared error they find that these series do not outperform the random walk wheinformation on future fundamentals is unavailable. In contrast, Rime et al. (2007) find that interdealer order flow does outperform the random walk in predicting exchange rates one ahead. Using three exchange rates (euro-dollar, dollar-yen, sterling-dollar) and associated Reuters (broker) order flow for one year they create forecasts based on what is, in essence, a structural VA
s ranging from 14 to 24 hours, the portfolios’ Sharpe ratios range from 0.44 to 2.24 average 1.59. Sharpe ratios for the random walk model and a UIP-based model are generally much lower.
30
What kind of information is carried by order flow? Evidence is consistent with the presence of both passively-acquired and actively-acquired fundamental information. Evans and Lyons (2007) show that Citibank customer order flow has substantial predictive power for future revisions in the real-time estimates of GDP, inflation, and money stocks that are induced by future macro data releases for the U.S. and Germany. The results are especially strong at lohorizons, w
nger here regressions using only order flow forecast between 21 percent and 58 percent of
change dent
nce also suggests that order flow carries actively-acquired information about upcomi
real ely-acquired
information. Rime et al. (2007) provide evidence that order flow carries info ation about upcoming
ement. d the
announ
coming announcements among speculative agents,
such
n
-
e three from leveraged investors have a strong and lasting
impact ore
03, Osler et al. 2007). In short, the evidence is consistent with the hypothesis that customer order flow carries
information about macro aggregates that is aggregated by dealers and then reflected in
s in the fundamental variables. (By contrast, regressions using only the lagged depenvariable or the spot rate generally forecast less than 10 percent.) This suggests that customer order flow concurrently reflects macro fundamentals and that the information is passively acquired.
Evideng macro events and news releases. Froot and Ramadorai (2005) show that State Street
Corporation’s institutional-investor flows have significant predictive power for changes in interest rates at horizons up to thirty days. This would appear to be activ
rmmacro news releases. Using thirty different news statistics (fifteen from the U.S., six from Europe, nine from the U.K.), the authors run the following regression:
jThurs
j
iiThursjThurs
kThursjThurs
ki OrderFlowAnnEAnn +=
+++ +=− ∑ ψθ1
.
On the left is the news “surprise” for announcement-type k (k = 1, 2, …30), meaning the difference between the announced figure and the median survey forecast for that announcOn the right is cumulative interdealer order flow for the period between the survey an
cement. The estimated relationships are generally quite strong: reported coefficients of determination range up to 0.91 and average 0.45. Since the news releases all lag the realization of the underlying macro aggregate by a month or more, the order flow would not reflect concurrent macro developments but instead appears to have been actively acquired.
This evidence suggests a strong focus on up a focus that is quite evident in the market. Dealer communication with active customers
includes regular – often daily – information on upcoming releases and extensive discussion ofthe macro context relevant for interpreting these releases. The agents that speculate onannouncements are typically leveraged investors.
Further support for the view that some private information is actively acquired in foreigexchange comes from Osler and Vandrovych (2007). They consider the information in price-contingent orders at the Royal Bank of Scotland with the agents placing those orders disaggregated into eight groups: leveraged investors, institutional investors, large corporations, middle-market corporations, broker-dealers, other banks, the bank’s own spot dealers, and thebank’s own exotic options desk. The “price impact” of executed orders, measured as the postexecution return over horizons ranging from five minutes to one week, is evaluated for thmajor currency pairs. Results show that orders
while orders from institutional investors have no impact. Consistent with the possible dominance of levered investors, further evidence indicates financial order flow carries minformation than commercial order flow, at least at short horizons (Fan and Lyons 2003, Carpenter and Wang 20
31

interdealer order flow. The evidence suggests that the customers acquire their information both passive
is un
pri po
l
w whether
.
lue
eal-
r ht
ly and actively.
C. The Evidence: Is the Information Really Fundamental? Not all researchers are convinced that the information in foreign exchange order flow
fundamental. Berger et al. (2006b), highlight their findings (reported earlier) that the long-rce impact of interdealer order flow is smaller than the initial impact, and that explanatorywer also declines at longer time horizons. They comment:
The findings … are consistent with an interpretation of the association between exchange rate returns and order flow as reflecting principally a temporary – although relatively long-lasting – liquidity effect. They are also perhaps consistent with a behaviorainterpretation … But our results appear to offer little support to the idea that order flow hasa central role in driving long-run fundamental currency values – the ‘strong flow-centric’ view (p. 9).
Bacchetta and van Wincoop (2006) suggest that this interpretation of the result may be more pessimistic than necessary regarding the relevance of fundamental information in order flow. Their model indicates that would be predicted when order flow reflects both fundamental and non-fundamental information. “In the short run, rational confusion plays an important role in disconnecting the exchange rate from observed fundamentals. Investors do not knoan increase in the exchange rate is driven by an improvement in average private signals aboutfuture fundamentals or an increase in [non-fundamentals]. This implies that [non-fundamentals] have an amplified effect on the exchange rate …” (p. 554)
Evidence presented in Froot and Ramadorai (2005) also suggests that the connection from order flow to exchange rates is transitory though long-lasting. Their institutional-flows dataset is large enough to permit a rigorous analysis of order flow and returns at horizons of a year or more (it extends from mid-1994 through early 2001 and covers 18 different currencies vsthe dollar), far longer than horizons considered elsewhere. Like Berger et al. (2006b), they find that the positive short-run correlation between order flow and returns peaks and then declines. Their correlation estimates reach zero at about 300 trading days and then becoming statistically negative. The authors note: “[O]ne can interpret the facts as suggesting that any impact of flows on currencies is transitory …[and] any information contained in flows is not about intrinsic vaper se (p. 1550).” Since this conclusion is based initially on crude correlations, the authors also undertake a sophisticated VAR decomposition of returns into permanent and transitory components, the results of which lead to the same overall conclusion. This finding cannot be explained in terms of the Bacchetta and van Wincoop (2006) insights, since these do not imply the ultimate disappearance of the effect.
Could institutional-investor order flow carry information about macro fundamentals and yet have zero price impact after a year? It was suggested earlier that these observations are consistent when liquidity effects drive the connection from order flow to exchange rates. If rmoney funds have roughly a one-year average investment horizon, then the initial upward impact of any, say, purchases – whether or not motivated by fundamental information – would ultimately be offset by a downward impact when the positions are unwound, leaving a zero impact at the one-year horizon. It is also worth noting that Froot and Ramadorai (2005) only analyze institutional order flow. As noted earlier, institutional investors typically ignore the currency component of returns when making portfolio allocations, so one would not expect theiorder flow to have a permanent relation with exchange rates. The trades of other customers migstill carry information.
32
Order flow could also have a transitory influence if exchange-rate expectations are not fully rational, as noted by both Berger et al. (2006b) and Froot and Ramadorai (2005). A tendency for professional exchange-rate forecasts to be biased and inefficient has been frequently documented (MacDonald 2000). This could explain why exchange rates apparently overreact to certain macro announcements (Evans and Lyons 2005). As in Keynes’ beauty contest, short-term traders react to
excess
of
ence. Further, they find that overconfident dealers are not driven out of the market rmanent structural feature of currency
ket
the rates. An appeal to “information” quickly becomes circular
e
. .
r
ines
s and rely instead on a model of how other people think about fundamentals prone to
ts and the exchange-rate determination
could profit by correctly anticipating news and how other market participants will it, whether or not the reaction to news is rational.
The potential relevance of the behavioral perspective is underscored by extensive evidence for imperfect rationality among currency dealers presented in Oberlechner (2004). Indeed, dealers themselves typically claim that short-run dynamics are driven in part by “speculation” (Cheung and Chinn 2001). One potential source of excess speculative trading is overconfidence, a human tendency towards which has been extensively documented by psychologists (Plous 1993). Odean (1998) shows that when agents overestimate the accuracy their information – a common manifestation of overconfidence – they trade excessively and thereby generate excess volatility. Oberlechner and Osler (2007) show, based on a sample of over 400 North American dealers, that currency dealers do not escape the tendency towards overconfidover time, suggesting that overconfidence may be a pemar s.
D. Information as an Incomplete Explanation It is important to recognize that “information” is at best a partial explanation forinfluence of order flow on exchangein the absence of a successful economic model of the underlying connections between fundamentals and exchange rates. This point is best clarified by illustration. Suppose a speculator expects a soon-to-be-released trade balance statistic to be higher than generally expected. According to the information hypothesis, three things happen: (i) the speculator evaluates whether a higher tradbalance implies a stronger or weaker home currency and then trades accordingly; (ii) the associated order flow reveals to dealers whether the currency is over- or undervalued; (iii) as more dealers learn the information, it becomes progressively impounded in the exchange rate The information research just summarized concentrate on parts (ii) and (iii) of this storyBut part (i) is also critical: Speculators must somehow evaluate the implications of the trade balance for the exchange rate in order to choose a position. To accomplish this, the speculatomight rely on a model of how fundamentals and exchange rates are connected. But that model cannot itself rely on the information hypothesis without becoming circular: The information hypothesis asserts that exchange rates are determined by order flow because order flow carries information; circularity arises if the information in the order flow is that order flow determexchange rates, which are determined by information. The speculator might alternatively ignore fundamentalinfluence exchange rates. But of course this version of Keynes’ beauty contest is equally circularity. The good news is that models intended to analyze the deep connections between fundamentals and exchange rates can now be based on more than just “assumption and hypotheses” (Goodhart 1988). Instead, they can have well-specified microfoundations based on our new understanding of the structure of currency marke
33
process. Indeed, in the philosophical outlook of Karl Popper (1959) rinformation is a key test of a model’s scientific validity.
eliance on the best available
ences exchange rates at least in part because ers. Research has also begun to clarify the
exact m
ange e selection is key. This view of price
discove m
nge is a two-tier market, in which dealers trade with custom
dest
r. Osler et al. (2007) analyzes the euro-dollar transac
zes daily flows through State Street’s global risk-
ter
case spreads could still include a significant adverse selection component (Huang and Stoll 1997). This is especially likely in limit-order markets, where the liquidity supplier (limit-order trader)
VII. PRICE DISCOVERY IN FOREIGN EXCHANGE
Research so far indicates that order flow influit carries information brought to the market by custom
echanism through which the information becomes embodied in exchange rates.
A. Adverse Selection and Customer Spreads Researchers have tended to assume that the price discovery process in foreign exch
conforms to the process discussed earlier in which adversry has been extensively elaborated in theoretical work (e.g., Holden and Subrahmanya
1992) and many of its predictions are fulfilled in the NYSE (Harris and Hasbrouck 1996; Bernhardt and Hughson 2002; Peterson and Sirri 2003).
For structural reasons, this price discovery mechanism cannot apply directly to the foreign exchange market. The mechanism assumes a one-tier market, in which dealers only interact with customers, while foreign excha
ers in the first tier and trade with each other in the second tier. While this need not implythat adverse selection is entirely irrelevant, it does mean, at a minimum, that the framework needs adjustment before it can be relevant.
Empirical evidence shows that some of the key predictions of adverse selection do not hold in foreign exchange. The framework predicts, for example, that customer spreads are wifor the trades most likely to carry information, which would be large trades and trades with financial customers. The reverse is true, howeve
tions of a single dealer over four months in 2001 and finds that customer spreads are smaller for large trades and for financial customers. The authors test three other implications of adverse selection, none of which gain support.
Further evidence for an inverse relationship between customer spreads and trade size is provided in Ding (2005), which analyzes customer trading on a small electronic communication network. Direct evidence that spreads are narrowest for customer trades that carry the most information comes from Ramadorai (2006), which analy
custody operations. He finds that asset managers with the greatest skill in predicting (adjusted) returns pay the smallest spreads. Overall it appears that adverse selection does not drive spreads in the customer foreign exchange market.
Adverse selection could, nonetheless, be an important determinant of spreads in the interdealer market. Information definitely appears to be asymmetric in that market (Bjønnes,Osler, and Rime 2007), and the evidence is consistent with the hypothesis that spreads include a significant adverse selection component. Adverse selection models predict two possible relationsbetween trades and spreads. First, quoted spreads could widen with trade size if trade size is considered informative (Easley and O'Hara (1987), Glosten (1989), Madhavan and Smidt 1991). Evidence consistent with this prediction is presented in Lyons (1995), but he examined a dealer who exclusively traded in the interdealer market, a form of trading that may no longer exist; ladealer studies fail to confirm this prediction (Yao 1998, Bjønnes and Rime 2005). It is possible,however, that trade direction is considered informative even while trade size is not, in which
34

determines trade size, rather than the liquidity demander (market-order trader). Bjønnes and Rime (2005) find strong evidence that trade direction is considered informative in the interdealer
ket fluences interdealer spreads.
B.
be
. 2006), and the U.S. municipal bond markets (Harris and Piwowar 2004, Green et al. 2
sts, which can be covered by a small spread on a large trade or
rmation they can exploit during later interdealer trading (Naik e
et
he market on an intraday basis. This may give dealers greater flexibility
C.
se
portant
t order after trading with an informed customer than after trading
a market buy order. This raises the traded price, consistent with the customer’s information.
mar and that adverse selection thereby in
What Drives Customer Spreads? The irrelevance adverse selection in the foreign exchange customer market raises an
important question: What does drive customer spreads? It appears that structural factors mayat play, since spreads are also widest for the least informed trades in other two-tier markets, including the London Stock Exchange (Hansch et al. 1999), the U.S. corporate bond market (Goldstein et al
007). Osler et al. (2007) reviews three hypotheses suggested in the broader microstructure
literature that could explain this pattern in foreign exchange markets. First, the pattern could reflect the existence of fixed operating co
a large spread on a small trade. Fixed operating costs cannot, however, explain why commercial customers pay higher
spreads than financial customers. This could result if dealers strategically subsidize informed-customer trades in order to gather info
t al. 1999; Osler et al. 2007). Commercial customers could also pay higher spreads under the “market power”
hypothesis of Green et al. (2007). This suggests that dealers have transitory market power relative to customers that do not carefully evaluate their execution quality or who do not know market conditions at the time they trade. Commercial customers in the foreign exchange marktend to be relatively unsophisticated: they are less familiar with standard market practice and typically do not monitor tto extract wider spreads.
Price Discovery in Foreign Exchange If adverse selection does not describe the price discovery process in foreign exchange,
what does? Osler et al. (2007) propose an alternative price discovery mechanism consistent with the foreign exchange market’s two-tier structure. The mechanism focuses on how dealers chooto offload the inventory accumulated in customer trades. Dealers typically use limit orders to control inventory (Bjønnes and Rime 2005), but not always. Existing theory highlights imdeterminants of this choice (Harris 1998; Foucault 1999). Market orders provide speedy execution at the cost of the bid-ask spread; limit orders provide uncertain execution at an uncertain time but earn the bid-ask spread if execution does take place. This trade-off creates incentives such that market orders are more likely when a dealer’s inventory is high, consistent with evidence in Bjønnes and Rime (2005) and Osler et al. (2007). It also implies that a dealer should be more likely to place a marke
with an uninformed customer. To clarify the logic of this second inference, suppose that an informed customer buys
from a dealer that previously had zero inventory. That dealer will have three reasons to place a market order in the interdealer market: (i) information that exchange-rate is likely to rise; (ii) a non-zero (and therefore risky) inventory position; and (iii) information that his (short) inventory position is likely to lose value because prices are likely to rise. In consequence, after an informed customer buy transaction the dealer will likely place
35

After an uninformed customer purchase, by contrast, a dealer has only one reason to place a market order: risky inventory. If the dealer places a limit order rather than a market order then the uninformed-customer purchase would tend to be associated with downward returns, as the limit buy order is executed against a market sell.
One key testable implication of this proposed price discovery mechanism is that the likelihood of an interbank market order is higher after trades that are relatively likely to carry information, specifically financial-customer trades and large trades. Osler et al. (2007) finds support for this implication using a probit analysis of their dealer’s own trading choices. This indicates that the conditional probability that the dealer places an interbank market order is 9.5 percent for small commercial-customer trades and almost twice as high, at 18.5 percent, after small financial-customer trades. After large commercial-customer trades the conditional likelihood of an interbank market order is 25.4 percent, and after large financial-customer trades the corresponding likelihood is 40.2 percent.
This proposed price discovery mechanism is consistent with much of the empirical evidence discussed so far. For example, it is consistent with the signs of the cointegrating relationships between returns and order flow: positive for financial customers and dealers, negative for commercial customers, positive for dealers. The positive cointegration between financial order flow and returns indicates that financial order flow carries fundamental information. The positive cointegration between interdealer order flow and returns suggests that dealers’ market orders reflect the information in their customer order flow. The negative cointegration between commercial order flow and returns could also be an outcome of the price discovery hypothesis: if dealers place limit orders after trades with commercial customers, and if they are indeed relatively uninformed, then a commercial-customer buy will be reflected in an interdealer market sell order, with an associated price decline.
The mechanism is also consistent with Rime et al.’s (2007) demonstration that interdealer order flow has strong predictive power for upcoming macro statistical releases, together with other evidence suggesting that leveraged investors bring the most information to the market. If leveraged investors are the most informed customers, then under this price discovery hypothesis interdealer order flow will reflect that group’s trades. Since interdealer order flow has strong predictive power for upcoming macro releases, the implication is that leveraged investors devote much effort to forecasting those releases.
VIII. SUMMARY AND FUTURE DIRECTIONS
The currency microstructure evidence summarized here provides many new insights about the economics of the currency market and thus the economics of exchange-rate determination. The field thus merits its alternative moniker, “the new microeconomics of exchange rates.” The new evidence reveals that the proximate cause of most exchange-rate dynamics is order flow, which can be interpreted as net liquidity demand. The critical role of order flow is not, of course, in itself an economic explanation for exchange-rate dynamics. Recognizing this, the new literature provides evidence for three economic mechanisms through which order flow could influence exchange rates: inventory effects, liquidity effects, and information. The information mechanism raises a critical question: What information is carried by order flow? The information apparently originates with customers; dealers then see it reflected in their customer order flow. Some of the information appears to be dispersed, passively-acquired
36
information about concurrent fundamentals. Some of the information appears to be actively-acquired information about upcoming macro news releases, with the most informative order flow coming from leveraged investors (hedge funds). Some of the information may be non-fundamental. The literature also investigates the precise mechanism through which a customer’s private information becomes reflected in exchange rates. This price discovery mechanism appears to differ strikingly from price discovery on the NYSE, a difference that could reflect a key structural difference across markets: foreign exchange dealers can trade with each other as well as with customers, but the NYSE has no interdealer market. The literature addresses many questions of importance to researchers in microstructure per se. For example, what determines spreads in foreign exchange? Customer spreads in foreign exchange behave entirely differently from those on, say, the NYSE. On the NYSE, market makers try to protect themselves from informed traders and, if possible, they charge informed traders wider spreads. By contrast, foreign exchange dealers actively court the business of informed traders by quoting them narrow spreads. This could reflect the ability of currency dealers to trade with each other. Currency dealers seek trades with informed customers because the customers’ order flow provides information the dealers can exploit in subsequent interdealer trades. Our knowledge of this market still has big gaps, of course, which provides many fascinating questions for future research. A partial list would include the following:
1. Why do interdealer spreads vary inversely with trading volume and volatility? Does this pattern reflect fixed operating costs, the optimal bunching of liquidity traders, or something else?
2. What determines intraday variations in the price impact of order flow? While it looks like this is strongly influenced by the intraday pattern in interdealer spreads, there is little hard evidence on this point. What other factors might matter?
3. What determines longer-horizon variation in the price impact of order flow? The relevance of this question is enhanced, of course, by the evidence that variation in price impact contributes importantly to the persistence of volatility.
4. There is bound to be substantially more variation across types of financial customers, and across types of corporate customers, than has yet been identified. How much technical trading is there? What fraction of international investors ignore the currency component of returns when choosing portfolio allocations? Is this fraction changing?
5. There is still much to learn about the nature of the information provided by order flow, how dealers perceive that information, and how dealers use that information. Dealers claim they don’t seek and don’t use fundamental information but the evidence reveals that much of the information moving through the market is, in fact, related to fundamentals.
6. How strong are inventory, liquidity effects, and information effects in determining the connection between order flow and exchange rates?
Even when these questions have been addressed, however, the larger question – the question that originally motivated foreign exchange microstructure research – will still remain. In dealing with this question the foreign exchange microstructure researchers have followed Karl Popper’s (1959) agenda for scientific inquiry in its purest form. According to his philosophical
37
perspective, good scientists produce evidence that “falsifies” existing paradigms and then create new paradigms consistent with all the evidence, old and new. The new evidence revealed by currency microstructure has falsified many aspects of traditional macro-based models while shedding new light on the economics of exchange-rate determination. To develop the next generation of exchange-rate models, researchers now have at their disposal an extensive body of knowledge about how exchange rates are actually determined. This information brings with it the ability – and the responsibility – to construct models with well-specified microfoundations. A rigorous, empirically-relevant paradigm for short-run exchange-rate dynamics is much closer than it was a decade ago.
38
PRIMARY REFERENCES Admati, Anat R., and Paul Pfleiderer (1988), “A Theory of Intraday Patterns: Volume and Price
Variability,” The Review of Financial Studies 1: 3-40.
Akram, Q. Farooq, Dagfinn Rime and Lucio Sarno (2005). “Arbitrage in the Foreign Exchange Markets: Turning on the Microscope,” Norges Bank Working Paper 2005-12.
Andersen, Torben G., Tim Bollerslev, Francis X. Diebold, and Clara Vega (2003), “Micro Effects of Macro Announcements: Real-Time Price Discovery in Foreign Exchange,” American Economic Review 93: 38-62.
Artus, Jacques R., and Malcolm D. Knight (1984), Issues in the Assessment of the Exchange Rates of Industrial Countries, Occasional Paper 29 (Washington, D.C.: International Monetary Fund).
Austin, M.P., R.G. Bates, M.A.H. Dempster, and S.N. Williams (2004). “Adaptive Systems for Foreign Exchange Trading,” Quantitative Finance 4: C37-45.
Bacchetta, Phillip, and Eric van Wincoop (2005), “Can Information Heterogeneity Explain the Exchange Rate Determination Problem?” American Economic Review 96: 552
Baillie, R., and Tim Bollerslev (1989), “The Message in Daily Exchange Rates: A Conditional Variance Tail,” Journal of Business and Economic Statistics 7: 297-305.
Bank for International Settlements (2007), Triennial Central Bank Survey of Foreign Exchange and Derivatives Trading Activity (Basle).
Barberis, Nicholas, and Richard Thaler (2002), “A Survey of Behavioral Finance,” NBER Working Paper No. 9222.
Barker, William (2007), “The Global Foreign Exchange Market: Growth and Transformation,” Bank of Canada Review, Autumn: 3-12.
Beattie, Neil, and Jean-Francois Fillion (1999), “An Intraday Analysis of the Effectiveness of Foreign Exchange Intervention,” Bank of Canada Working Paper 1999-4.
Beine, Michael, Agnes Benassy-Quere, and Ronald MacDonald (2007), “The Impact of Central Bank Intervention on Exchange-Rate Forecast Heterogeneity,” Journal of the Japanese and International Economies 21: 38-63.
Berger, David, Alain Chaboud, Erik Hjalmarsson, and Edward Howorka (2006). “What Drives Volatility Persistence in the Foreign Exchange Market?” Board of Governors of the Federal Reserve System, International Finance Discussion Papers No. 862.
Berger, David, Alain Chaboud, Sergei Chernenko, Edward Howorka, and Jonathan Wright (2006). “Order Flow and Exchange Rate Dynamics in Electronic Brokerage System Data,” Board of Governors of the Federal Reserve System, International Finance Discussion Papers No. 830.
Bernhardt, Dan, and Eric Hughson (2002), “Intraday trade in Dealership Markets,” European Economic Review 46: 1697-1732.
Bertsimas, Dimitris, and Andrew W. Lo (1998), “Optimal Control of Execution Costs,” Journal of Financial Markets 1: 1-50.
39

Bjønnes, Geir Høidal and Dagfinn Rime (2005), “Dealer Behavior and Trading Systems in Foreign Exchange Markets,” Journal of Financial Economics 75: 571-605.
Bjønnes, Geir Høidal, Dagfinn Rime, and Haakon O. A. Solheim (2005a), “Liquidity Provision in the Overnight Foreign Exchange Market,” Journal of International Money and Finance 24: 175-196.
_________________________________ (2005b), “Volume and Volatility in the Foreign Exchange Market: Does it Matter Who You Are?” In Exchange Rate Modeling: Where Do We Stand? Paul De Grauwe, Editor (Cambridge and London: M.I.T. Press).
Bjønnes, Geir, Carol Osler and Dagfinn Rime (2007), “Asymmetric Information in the Interdealer Foreign Exchange Market,” Presented at the Third Annual Conference on Market Microstructure, Budapest, Hungary, September 15, 2007.
Bollerslev, Tim, and Michael Melvin (1994), “Bid-ask Spreads and Volatility in the Foreign Exchange Market,” Journal of International Economics 36: 355-372.
Brandt, Michael, and Kenneth Kavajecz (2005), "Price Discovery in the U.S. Treasury Market: The Impact of Order Flow and Liquidity on the Yield Curve," Journal of Finance 59: 2623-2654.
Cai, Jun, Yan-Leung Cheung, Raymond S.K. Lee, Michael Melvin (2001), “Once-in-a-Generation' Yen Volatility in 1998: Fundamentals, Intervention, and Order Flow,” Journal of International Money and Finance 20: 327-347.
Campbell, John Y., and Robert J. Shiller (1988), “Stock Prices, Earnings, and Expected Dividends,” Journal of Finance 43: 661-676.
Cao, H., Martin Evans, and Richard K. Lyons (2006), “Inventory Information,” Journal of Business 79: 325-363.
Carlson, John A., and Melody Lo (2006), “One Minute in the Life of the DM/US$: Public News in an Electronic Market,” Journal of International Money and Finance 25: 1090-1102.
Carlson, John A., Christian Dahl, and Carol Osler (2008), “Short-Run Exchange-Rate Dynamics: Theory and Evidence,” Typescript, Brandeis University.
Chaboud, Alain P., Sergey V. Chernenko, Edward Howorka, Raj. S. Krishnasami Iyer, David Liu, and Jonathan H. Wright (2004), “The High-Frequency Effects of U.S. Macroeconomic Data Releases on Prices and Trading Activity in the Global Interdealer Foreign Exchange Market,” Federal Reserve System Board of Governors, International Finance Discussion Papers Number 823.
Chakravarty, Sugato (2000), “Stealth Trading: Which Traders’ Trades Move Stock Prices?” Journal of Financial Economics 61, 289-307.
Chang, Yuanchen, and Stephen J. Taylor (1998), “Intraday Effects of Foreign Exchange Intervention by the Bank of Japan,” Journal of International Money and Finance 17: 191-210.
__________________________ (2003). “Information Arrivals and Intraday Exchange Rate Volatility,” International Financial Markets, Institutions, and Money 13: 85-112.
40
Chari, Anusha (2007), “Heterogenous Market-Making in Foreign Exchange Markets: Evidence From Central Bank Interventions,” Journal of Money, Credit, and Banking 39: 1131-1164.
Chaunzwa, Munyaradzi Julius (2006), “Investigating the Economic Value Added of More Advanced Technical Indicators,” Typescript, Brandeis University.
Cheung, Yin-Wong, Menzie D. Chinn (2001), “Currency Traders and Exchange Rate Dynamics: A Survey of the US Market,” Journal of International Money and Finance 20: 439-471.
Cheung, Yin-Wong, Menzie D. Chinn, and Ian Marsh (2004), “How Do U.K.-based Foreign Exchange Dealers Think Their Market Operates?” International Journal of Finance and Economics 9: 289-306
Chordia, Tarun, Richard Roll, and Avanidhar Subrahmanyam (2002), “Order Imbalance, Liquidity, and Market Returns,” Journal of Financial Economics 65: 111-130.
Copeland, T., and D. Galai (1983), “Information Effects on the Bid-Ask Spread,” Journal of Finance 38: 1457-1469.
Coval, Joshua D. and Tobias J. Moskowitz (2001), The Geography of Investment: Informed Trading and Asset Prices, Journal of Political Economy, 109:4, 811-841.
Covrig, Vicentiu, and Michael Melvin (2005), “Tokyo Insiders and the Informational Efficiency of the Yen/Dollar Exchange Rate,” International Journal of Finance and Economics 10: 185-193.
Cross, Sam (1998). “All About … The Foreign Exchange Market in the United States,” Federal Reserve Bank of New York (http://www.newyorkfed.org/education/addpub/usfxm/)
Daniélsson, Jon, and Ryan Love (2006), “Feedback Trading,” International Journal of Finance and Economics 11: 35-53..
Delong, Bradford, Andrei Shleifer, Lawrence Summers, and Robert J. Waldmann (1990), “Positive Feedback Investment Strategies and Destabilizing Rational Speculation,” Journal of Finance 45: 379-395.
Ding, Liang (2006), “Market Structure and Dealer’s Quoting Behavior in the Foreign Exchange Market,” Typescript, University of North Carolina at Chapel Hill.
Dominguez, Kathryn (2003), “The Market Microstructure of Central Bank Intervention,” Journal of International Economics 59: 25-45.
_____________(2006), “When Do Central Bank Interventions Influence Intra-Daily and Longer-Term Exchange Rate Movements,” Journal of International Money and Finance 25: 1051-1071.
Dominguez, Kathryn, and Freyan Panthaki (2006), “What Defines ‘News’ in Foreign Exchange Markets?” Journal of International Money and Finance: 168-198.
_________________________________ (2007), “The Influence of Actual and Unrequited Interventions,” International Journal of Finance and Economics 12: 171-200.
D’Souza, Chris (2001), “A Market Microstructure Analysis of FX Intervention in Canada,” Bank of Canada Working Paper 2002-16.
41
Dueker, Michael, and Christopher J. Neely (2007), “Can Markov Switching Models Predict Excess Foreign Exchange Raturns?” Journal of Banking and Finance 31: 279-296.
Dunne, Peter, Harald Hau, and Michael Moore (2007): “A Tale of Two Platforms: Interdealer and Retail Quotes in European Bond Markets,” presented at the Third Annual Central Bank Workshop on the Microstructure of Financial Markets, Magyar Nemzeti Bank, Budapest, Hungary, 14-15 September, 2007.
Easley, David, and Maureen O’Hara (1987), “Price Trade Size, and Information in Securities Markets,” Journal of Financial Economics 19: 69-90.
Ederington, Louis, and Jae Ha Lee (2001), “Intraday Volatility in Interest-Rate and Foreign-Exchange Markets: ARCH, Announcement, and Seasonality Effects,” Journal of Futures Markets 21: 517-552.
Ehrmann, Michael, and Marcel Fratzscher (2005), “Exchange Rates and Fundamentals: New Evidence from Real-Time Data,” Journal of International Money and Finance 24: 317-341.
Euromoney, Foreign Exchange Poll 2006: http://www.euromoney.com/article.asp?ArticleID=1039514
Evans, Martin (2002), “FX Trading and Exchange Rate Dynamics,” Journal of Finance 57: 2405-2448.
Evans, Martin, and Richard K.Lyons (2002a), “Information Integration and FX Trading,” The Journal of International Money and Finance, 807-831.
_______________________(2002b), "Order Flow and Exchange Rate Dynamics," Journal of Political Economy 110 (2002): 170-180.
_______________________(2005a), “Do Currency Markets Absorb News Quickly?” Journal of International Money and Finance 24: 197-217.
______________________ (2005b). “Meese-Rogoff Redux: Micro-Based Exchange-Rate Forecasting,” American Economic Review Papers and Proceedings 95: 405-414.
______________________ (2006), “Inventory Information,” Journal of Business 79: 325-363.
______________________ (2007), "Exchange-Rate Fundamentals and Order Flow," NBER Working Paper 13151.
______________________ (2008), "How is Macro News Transmitted to Exchange Rates?” forthcoming Journal of Financial Economics.
Fatum, Rasmus, and Michael M. Hutchinson (2002), “Sterilized Foreign Exchange Intervention and the Euro: A Useful Policy Instrument?” Open Economies Review 13, 413-425.
Fatum, Rasmus, and Michael King (2005), “The Effectiveness of Official Foreigin Exchange Intervention in a Small Open Economy: The Case of the Canadian Dollar,” Bank of Canada Working Paper No. 2005-12. Fatum, Rasmus, and Jesper Pedersen (2007), “Real-Time Effects of Central Bank Interventions in the Euro Market,” Economic Policy Research Unit Working Paper 2007-01, University of Copenhagen.
42

Federal Reserve Bank of New York (2004), “Managing Operational Risk in Foreign Exchange.”
____________________________ (2007), http://www.newyorkfed.org/xml/gsds_transactions.html
Fischer, Andreas M. (2006), “On the Inadequacy of Newswire Reports for Empirical Research on Foreign Exchange Interventions,” Journal of International Money and Finance 25, 1226-1240.
Fischer, Andreas M., and Mathias Zurlinden (1999), “Exchange Rate Effects of Central Bank Interventions: An Analysis of Transaction Prices,” Economic Journal 109: 662-676.
Fleming, Michael (2003), “Measuring Treasury Market Liquidity,” Federal Reserve Bank of New York Economic Policy Review (September): 83-108.
Fleming, Michael, and Bruce Mizrach (2007), "The Microstructure of a U.S.Treasury ECN: The BrokerTec Platform," Typescript, Federal Reserve Bank of New York.
Flood, Robert P., and Mark P. Taylor (1996), “Exchange-Rate Economics: What’s Wrong with the Conventional Macro Approach,” in The Microstructure of Foreign Exchange Markets, Jeffrey A. Frankel, Giampaolo Galli, Alberto Giovannini, Eds (Chicago:University of Chicago Press): 261-301.
Foster, F. Douglas, and S. Viswanathan (1993), “Variations in Trading Volume, Return Volatility, and Trading Costs: Evidence on Recent Price Formation Models,” Journal of Finance 3: 187-211.
Foucault, Thierry (1999), “Order Flow Composition and Trading Costs in a Dynamic Limit Order Market,” Journal of Financial Markets 2, 99-134.
Frankel, Jeffrey A., Giampaolo Galli, Alberto Giovannini (1996), “Introduction,” in The Microstructure of Foreign Exchange Markets, Jeffrey A. Frankel, Giampaolo Galli, Alberto Giovannini, Eds (Chicago: University of Chicago Press): 1-15.
Frenkel, Jacob A, and Michael L. Mussa, “Asset markets, exchange rates, and the balance of payments.” NBER working paper 1287 (1985).
Galati, Gabriele (2000), “Trading Volume, Volatility, and Spreads in Foreign Exchange Markets: Evidence from Emerging Market Countries,” B.I.S. Working Paper 93.
Gau, Yin-Feng (2005), “Intraday Volatility in the Taipei Foreign Exchange Market,” Pacific-Basin Finance Journal 13: 471-487.
Gehrig, Thomas, and Lukas Menkhoff (2004), “The Use of Flow Analysis in Foreign Exchange: Exploratory Evidence,” Journal of International Money and Finance 23: 573-594.
Glosten, Lawrence (1989), “Insider Trading, Liquidity, and the Role of the Monopolist Specialist,” Journal of Business 62: 211-235.
Glosten Lawrence R., Milgrom Paul R. (1985). “Bid, Ask, and Transaction Prices in a Specialist Market with Heterogeneously Informed Traders.” Journal of Financial Economics 14: 71-100.
Goldstein, Michael A., Edith S. Hotchkiss, Erik R. Sirri (2006), “Transparency and Liquidity: A Controlled Experiment on Corporate Bonds,” Forthcoming, Review of Financial Studies.
43
Goodhart, Charles (1988), "The Foreign Exchange Market: A Random Walk with a Dragging Anchor," Economica 55: 437-60.
Goodhart, Charles.A.E., S.G. Hall, S.G.B. Henry, and B. Pesaran (1993), “News Effects in High-Frequency Model of the Sterling-Dollar Exchange Rate,” Journal of Applied Econometrics 8: 1-13.
Gradojevic, Nicola, and Jing Yang (2006), “Non-Linear, Non-Paramettric, Non-Fundamental Exchange Rate Forecasting,” Journal of Forecasting 25: 227-245.
Grossman, Sanford J., and Merton H. Miller (1988), “Liquidity and Market Structure,” Journal of Finance 43: 617-637.
Green, Richard C., Burton Hollifield, and Norman Schurhoff (2007), “Financial Intermediation and the Costs of Trading in an Opaque Market,” Review of Financial Studies 20: 275-314.
Hansch, Oliver, Narayan Naik, and S. Viswanathan (1998), “Do Inventories Matter in Dealership Markets? Some Evidence from the London Stock Exchange,” Journal of Finance 53: 1623-1656.
Hansch, Oliver, Narayan Naik, and S. Viswanathan (1999), “Preferencing, Internalization, Best Execution, and Dealer Profits,” Journal of Finance 54: 1799-1828.
Harris, Lawrence (1998), “Optimal Dynamic Order Submission Strategies in Some Stylized Trading Problems,” Financial Markets, Institutions, and Instruments 7, 1-75.
Harris, Lawrence, and Eitan Gurel (1986), “Price and Volume Effects Associated with Changes in the S&P 500 List: New Evidence for the Existence of Price Pressures,” Journal of Finance 41: 815-29.
Harris, Lawrence, and Joel Hasbrouck (1996), “Market vs. Limit orders: The SuperDOT Evidence on Order Submission Strategy,” Journal of Financial and Quantitative Analysis 31: 213-231.
Harris, Lawrence E. and Michael S. Piwowar (2004), Report on Transactions in Municipal Securities, Securities and Exchange Commission.
Harris, Milton, and Artur Raviv (1993), "Differences of Opinion Make a Horse Race," Review of Financial Studies, 6: 473-506.
Hartmann, Philipp (1999), “Trading Volumes and Transaction Costs in the Foreign Exchange Market: Evidence from Daily Dollar-Yen Spot Data,” Journal of Banking and Finance 23: 801-824.
Hasbrouck, Joel (1991), “Measuring the Information Content of Stock Trades,” Journal of Finance 46: 179-220.
Hashimoto, Yuko (2005). “The Impact of the Japanes Banking Crisis on the Intraday FOREIGN EXCHANGE Market in Late 1997,” Journal of Asian Economics 16: 205-222.
Hau, Harald (2001), Location Matters: An Examination of Trading Profits, Journal of Finance, 56:3, 1959-1983.
Hau, Harald, and Helene Rey (2003). “Exchange Rates, Equity Prices, and Capital Flows,” Review of Financial Studies 19: 273-317.
44
Hau, Harald, and Helene Rey (2003). “Global Portfolio Rebalancing Under the Microscope,” Mimeo, 2008.
Hau, Harald, William Killeen, and Michael Moore (2002), “How has the Euro Changed the Foreign Exchange Market?” Economic Policy: 151-177.
Hendershott, Terrence, and Mark Seasholes (2006), “Market Maker Inventories and Stock Prices,” Presented at the Second Annual Microstructure Workshop, Ottawa, Canada: October 2006.
Ho, Thomas S.Y. and Hans R. Stoll (1981), “Optimal Dealer Pricing Under Transactions and Return Uncertainty,” Journal of Financial Economics 9: 47-73.
Huang, Roger D. and Hans R. Stoll (1997), “The Components of the Bid-Ask Spread: A General Approach,” Review of Financial Studies 10: 995-1034.
Holden, Craig W., and Avanidhar Subrahmanyam (1992), “Long-Lived Private Information and Imperfect Competition,” Journal of Finance 47: 247-270.
Holthausen, Robert W., Richard W. Leftwich, and David Mayers (1990), “Large-Block Transactions, the Speed of Response, and Temporary and Permanent Stock-Price Effects,” Journal of Financial Economics 26: 71-95.
Ito, Takatoshi (1990), “Foreign Exchange Rate Expectations: Micro Survey Data,” American Economic Review 80: 434-449.
___________(2007), “Myths and Reality of Foreign Exchange Interventions: An Application to Japan,” International Journal of Finance and Economics 12: 133-154.
Ito, Takatoshi, and Yuko Hashimoto (2006), “Intraday Seasonality in Activities of the Foreign Exchange Markets: Evidence from the Electronic Broking System,” Journal of Japanese International Economics 20: 637-664.
Jansen, David-Jan, and Jakob De Hahn (2005), “Talking Heads: The Effects of ECB Statements on the Euro-Dollar Exchange Rate,” Journal of International Money and Finance 24: 343-361.
Jones, Charles M., G. Kaul, and Mark L. Lipson (1994): “Transactions, Volume and Volatility,” Review of Financial Studies 7: 631-651.
Jovanovic, Boyan, and Peter L. Rousseau (2001), “Liquidity Effects in the Bond Market,” Federal Reserve Bank of Chicago Economic Perspectives 25: 17-35.
Kandel, Eugene, and Neil D. Pearson (1995), "Differential Interpretation of Public Signals and Trade in Speculative Markets," Journal of Political Economy, 103: 831-872
Killeen, William, Richard K. Lyons, and Michael Moore (2005), “Fixed versus Flexible: Lessons from EMS Order Flow,” Forthcoming, Journal of International Money and Finance.
Kim, Minho, and Minchoul Kim (2001), “Implied Volatility Dynamics in the Foreign Exchange Markets,” Journal of International Money and Finance 22: 511-528.
Kothari, S.P. (2001), “Capital Markets Research in Accounting,” Journal of Accounting and Economics 31: 105-31.
45
Kuhn, Thomas S. (1970), The Structure of Scientific Revolutions, Second Edition (Chicago: University of Chicago Press).
Kyle, Albert (1985), “Continuous Auctions and Insider Trading,” Econometrica 53: 1315-1335.
Lane, Philip R. (2001), “The New Open Economy Macroeconomics: A Survey,” Journal of International Economics 54: 235-266.
LeBaron, Blake (1998), “Technical Trading Rules and Regime Shifts in Foreign Exchange,” in E. Acar and S. Satchell (Eds.), Advanced Trading Rules (Butterworth-Heinemann): 5-40.
Love, Ryan, and Richard Payne (2003), “Macroeconomic News, Order Flows, and Exchange Rates,” Typescript, London School of Economics.
Lyons, Richard K. (1997), “A Simultaneous Trade Model of the Foreign Exchange Hot Potato,” Journal of International Economics 42, 275-98.
________________(2001), The Microstructure Approach to Exchange Rates. (Cambridge and London: MIT Press).
MacDonald, Ronald (2000), "Expectations Formation and Risk in Three Financial Markets: Surveying What the Surveys Say," Journal of Economic Surveys 14: 69-100.
MacDonald, Ronald, and Ian Marsh (1996), “Currency Forecasters are Heterogeneous: Confirmation and Consequences,” Journal of International Money and Finance 15: 665-685.
Madhavan, Ananth N. and Seymour Smidt (1991), “A Bayesian Model of Intraday Specialist Pricing,” Journal of Financial Economics 30: 99-134.
_____________________________ (1993), “An Analysis of Changes in Specialist Inventories and Quotations,” Journal of Finance 48: 1595-1628.
Madhavan, Ananth N., and Minder Cheng (1997), “In Search of Liquidity: Block Trades in the Upstairs and Downstairs Markets,” Review of Financial Studies 10: 175-203.
Madhavan, Ananth, Matthew Richardson, and Mark Roomans (1997), “Why Do Security Prices change? A Transaction-Level Analysis of NYSE Stocks,” Review of Financial Studies 10: 1035-1064.
Malloy, Christopher (2005), “The Geography of Equity Analysis,” Journal of Finance, 60:2, 719-756.
Manaster, Stevern, and Steven C. Mann (1996), “Life in the Pits: Competitive Market Making and Inventory Control,” Review of Financial Studies 9: 953-975.
Marcel Fratscher (2007), “U.S. Shocks and Global Exchange Rate Configurations,” presented at the NBER IFM meetings, Cambridge, MA, July 10, 2007.
Meese, Richard A., and Kenneth Rogoff (1983), “Empirical Exchange Rate Models of the Seventies: Do They Fit Out of Sample?” Journal of International Economics 14: 3-24.
Mende, Alexander (2006), “09/11 and the USD/EUR Exchange Market,” Applied Financial Economics 16: 213-222.
Mende, Alexander, and Lukas Menkhoff (2006), “Profits and Speculation in Intra-Day Foreign Exchange Trading,” Journal of Financial Markets 9: 223-245.
46
Menkhoff, Lukas (1997), “Examining the Use of Technical Currency Analysis,” International Journal of Finance and Economics 2: 307-318.
_________________ (2001), “Importance of Technical and Fundamental Analysis in Foreign Exchange Markets,” International Journal of Finance and Economics 6: 81-93.
Menkhoff, Lukas, and Thomas Gehrig (2006), “Extended Evidence on the Use of Technical Analysis in Foreign Exchange,” International Journal of Finance and Economics 11: 327-38.
Menkhoff, Lukas, and Mark P. Taylor (2006), “The Obstinate Passion of Foreign Exchange Professionals: Technical Analysis,” University of Warwick, Department of Economics, The Warwick Economics Research Paper Series (TWERPS).
Menkhoff, Lukas, Carol Osler, and Maik Schmeling (2007), “Order-Choice Dynamics under Asymmetric Information: An Empirical Analysis,” Typescript, Brandeis University.
Milgrom, Paul, and Nancy Stokey (1982), “Information, Trade, and Common Knowledge,” Journal of Economic Theory 26: 17-27.
Morris, Stephen (1984), “Trade with Heterogeneous Prior Beliefs and Asymmetric Information,” Econometrica 62: 1327-1347.
Naik, Narayan Y., Anthony Neuberger, and S. Viswanathan (1999), “Trade Disclosure Regulation in Markets With Negotiated Trades,” Review of Financial Studies 12, 873-900.
Naranjo, A., and M. Nimalendran (2000), “Government Intervention and Adverse Selection Costs on Foreign Exchange Markets,” Review of Financial Studies 13: 453-477.
New York Stock Exchange (2007), “Historical Facts and Statistics,” www.nysedata.com/nysedata/Default.aspx?tabid=115.
Oberlechner, Thomas (2001), “Evaluation of Currencies in the Foreign Exchange Market: Attitudes and Expectations of Foreign Exchange Traders,” Zeitschrift fur Sozialpsychologie 3: 180-188.
_____________ (2004), The Psychology of the Foreign Exchange Market (Chichester, England: John Wiley and Sons).
Oberlechner, Thomas, and Carol Osler (2007), “Overconfidence in Currency Markets,” Typescript, Brandeis International Business School.
Odean, Terrance, (1998), “Volume, Volatility, Price, and Profit: When All Traders Are Above Average,” Journal of Finance 53: 1887-1934.
Osler, Carol L. (2003), “Currency Orders and Exchange-Rate Dynamics: An Explanation for the Predictive Success of Technical Analysis,” Journal of Finance 58: 1791-1819.
______________ (2005), “Stop-Loss Orders and Price Cascades in Currency Markets,’ Journal of International Money and Finance 24: 219-41.
____________ (2006). “Macro Lessons from Microstructure,” International Journal of Finance and Economics 11: 55-80.
47
Osler, Carol L., and Tanseli Savaser (2007), “The Microstructure of Extreme Exchange-Rate Returns,” presented at the Third Annual Central Bank Workshop on the Microstructure of Financial Markets, Magyar Nemzeti Bank, Budapest, Hungary, 14-15 September, 2007.
Osler, Carol L., and Vitaliy Vandrovych (2007), “Which Customers Bring Information to the in Foreign Exchange Market?” Typescript, Brandeis International Business School.
Payne, Richard (2003), “Informed Trade in Spot Foreign Exchange Markets: An Empirical Investigation,” Journal of International Economics 61: 307-329.
Payne, Richard, and Paolo Vitale (2003), “A Transaction Level Study of the Effects of Central Bank Intervention on Exchange Rates,” Journal of International Economics 61: 331-352.
Pasquariello, Paolo, and Clara Vega (2007), "Informed and Strategic Order Flow in the Bond Markets," Review of Financial Studies 20: 1975-2019.
Peterson, Mark A. and Erik R. Sirri (2003), “Order Preferencing and Market Quality on U.S. Equity Exchanges,” Review of Financial Studies 16, 385-415.
Plous, S. (1993). The psychology of judgment and decision making (New York: McGraw-Hill).
Popper, Karl (1959). The Logic of Scientific Discovery (Routledge, United Kingdom).
Ramadorai, Tarun (2006), Persistence, performance, and prices in foreign exchange markets, Oxford University Working Paper.
Reiss, Peter C., and Ingrid M. Werner (1995), “Transaction Costs in Dealer Markets: Evidence from the London Stock Exchange,” in Andrew Lo, ed.: The Industrial Organization and Regulation of the Securities Industry (University of Chicago Press, Chicago, Ill.).
_______________________________ (1998), “Does risk sharing motivate interdealer trading?” Journal of Finance 53, 1657-1703.
Reiss, Peter C., and Ingrid M. Werner (2004), “Anonymity, adverse selection, and the sorting of interdealer trades,” Review of Financial Studies 18, 599-636.
Rime, Dagfinn, Lucio Sarno, and Elvira Sojli (2007) “Exchange-rate Forecasting, Order Flow, and Macro Information,” Norges Bank Working Paper 2007-2.
Rogoff, Kenneth S. (1996), “The Purchasing Power Parity Puzzle,” Journal of Economic Literature 34: 647-668.
Rosenberg , Joshua V., and Leah G. Traub (2006), “Price Discovery in the Foreign Currency Futures and Spot Market,” Typescript, Federal Reserve Bank of New York.
Sager, Michael, and Mark P. Taylor (2006), “Under the Microscope: The Structure of the Foreign Exchange Market,” International Journal of Finance and Economics 11: 81-95.
_______________________(2007), “Commercially Available Order Flow Data and Exchange Rate Movements: Caveat Emptor,” Forthcoming, Journal of Money, Credit, and Banking.
Sarno, Lucio, and Mark P. Taylor (2001), “Official Intervention in the Foreign Exchange Market: Is it Effective and, If So, How Does it Work?” Journal of Economic Literature 39: 839-868.
Savaser, Tanseli (2007), “Stop-Loss Orders and Macro News in Currency Markets,” presented at the Second Annual Microstructure Workshop, Ottawa, Canada, October 2006.
48

Shiller, Robert (1981), “Do Stock Prices Move Too Much to Be Jusdtified by Subseuqent Changes in Dividends?” American Economic Review 71: 421-435.
Shleifer, Andrei (1986), “Do Demand Curves Slope Down?” The Journal of Finance 41: 579-90.
Simon, David P. (1991), “Segmentation in the Treasury Bill Market: Evidence from Cash Management Bills,” Journal of Financial and Quantitative Analysis 26: 97-108.
______________ (1994), “Further Evidence on Segmentation in the Treasury Bill Market,” Journal of Banking and Finance 18: 139-151.
Stoll, Hans (1978), “The Supply of Dealer Services in Securities Markets,” Journal of Finance 33: 1133-1151.
Taylor, Andrew, and Adam Farstrup (2006), Active Currency Management: Arguments, Considerations, and Performance for Institutional Investors, (CRA RogersCasey International Equity Research, Darien Connecticut).
Taylor, Mark P. (2002), “Purchasing Power Parity and the Real Exchange Rate,” IMF Staff Papers 48: 65-105.
Taylor, Mark P., and Helen Allen (1992), “The Use of Technical Analysis in the Foreign Exchange Market,” Journal of International Money and Finance 11: 304-314.
Varian, Hal R. (1985), "Divergence of Opinion in Complete Markets: A Note," Journal of Finance 40: 309-317.
__________ (1989), "Differences of Opinion in Financial Markets," in Courtenay C. Stone, ed.: Financial Risk: Theory, Evidence, and Implications (Kluwer): 3-37.
Vitale, Paolo (2007), “An Assessment of Some Open Issues in the Analysis of Foreign Exchange Intervention,” International Journal of Finance and Economics 12: 155-170).
Wudunn, Sherry (1995), “Japanese Delayed Letting U.S. Know of Big Bank Loss,” New York Times (October 10).
Yan, Bingcheng, and Eric Zivot (2007), “The Dynamics of Price Discovery,” Typescript, University of Washington.
Yao, Jian M. (1998), “Market making in the interbank foreign exchange market,” Stern School of Business, New York University Working Paper S-98-
49
GLOSSARY Barrier options: Options that either come into existence or disappear when exchange rates cross pre-specified levels. Barriers can be triggered by price rises or declines and reaching a barrier can either extinguish or create an option. An “up-and-out call,” for example, is a call options that disappears if the exchange rate rises above a certain level. A “down-and-in put,” by contrast, is created if the exchange rate falls to a certain level.
Bid-ask spread: The difference between the best (lowest) price at which one can buy an asset (the ask) and the best (highest) price at which one can sell it (the bid). In quote-driven markets both sides of the spread are set by one dealer. In order-driven markets, the “best bid and the best offer” (BBO) are likely to be set by different dealers at any point in time.
Brokers: Intermediaries in the interbank foreign exchange market that match banks willing to buy with banks willing to sell at a given price. Two electronic brokerages – EBS (Electronic Broking Service) and Reuters – now dominate interbank trading in the major currencies. In other currencies voice brokers still play an important role.
Call markets: Financial markets that clear periodically rather than continuously. During a specified time interval, agents submit orders listing how much they are willing to buy or sell at various prices. At the end of the interval a single price is chosen at which all trades will take place. The price is chosen to maximize the amount traded and is essentially the intersection of the supply and demand curves revealed by the submitted orders.
Clearing: The administration process that ensures an individual trade actually takes place. The amounts and direction are confirmed by both parties and bank account information is exchanged.
Corporate (or commercial) customers: The other of the two main groups of end-users in the foreign exchange market. Includes large multinational corporations, middle-market corporations, and small corporations. Their demand is driven almost entirely by international trade in goods and services, since traders at these firms are typically forbidden from speculating in spot and forward markets.
Covered interest arbitrage: A form of riskless arbitrage involving the spot market, the forward market, and domestic and foreign deposits.
Dealership market: See Quote-driven market.
Delta-hedge: A delta-hedge is designed to minimize first-order price risk in a given position. That is, small price changes should change the agent’s overall position by only a minimal amount (ideally zero). A delta-hedge gets its name from an option’s “delta,” which is the first derivative of the option’s price with respect to the price of the underlying asset. To delta-hedge a long call (put) option position, the agent takes a short (long) position in the underlying asset equal in size to the option’s delta times the notional value of the option.
Expandable limit order: An order whose quantity can be expanded if it is crossed with a market order for a larger quantity.
Financial customers: One of the two main groups of end-users in the foreign exchange market. Includes hedge funds and other highly-leveraged investors, institutional investors such as mutual funds, pension funds, and endowments, multilateral financial institutions such as the World Bank or the IMF, broker-dealers, and regional banks.
50

Feedback trading: The practice of trading in response to past returns. Positive-feedback trading refers to buying (selling) after positive (negative) returns. Negative-feedback trading refers to selling (buying) after positive (negative) returns.
Foreign exchange dealers: Intermediaries in the foreign exchange market who stand ready, during trading hours, to provide liquidity to customers and other dealers by buying or selling currency. Salespeople manage relationships with clients; interbank traders manage the inventory generated by customer sales, and also speculate on an extremely high-frequency basis, by trading with other banks; proprietary traders speculate on a lower-frequency basis in currency and other markets.
Forward market: Currencies traded in forward markets settle after more than two trading days (and infrequently after less than two trading days).
Limit order: See “Order-driven markets.”
Long position: A long position arises when an agent owns an asset outright.
Market order: See “Order-driven markets.”
Order flow: Buy-initiated transactions minus sell-initiated transactions over a given period. Since customers are always the initiators, their order flow is just their customer purchases minus customer sales. In the interdealer market, a dealer initiates a trade if s/he places a market order with a broker or if the dealer calls out to another dealer.
Order-driven markets: Also known as “limit-order markets.” Asset markets in which participants can both supply liquidity or demand it, as they choose. Liquidity suppliers place limit orders, which specify an amount the agent is willing to trade, the direction, and the worst acceptable price. A limit buy order in the euro-dollar market, for example, might specify that the agent is willing to buy up to $2 million at $1.2345 or less. These limit orders are placed into a “limit-order book,” where they remain until executed or cancelled. Agents demanding liquidity place “market” orders, which state that the agent wishes to trade a specified amount immediately at whatever price is required to fulfill the trade. Market orders are executed against limit orders in the book, beginning with the best-priced limit order and, if necessary, moving to limit orders with successively less attractive prices. The foreign exchange interdealer markets for major currencies are dominated by two electronic limit-order markets, one run by EBS and the other run by Reuters.
Overconfidence: A human tendency to have more confidence in one’s self than is justified. Humans tend to overestimate their own personal and professional success (“hubris”) and that they overestimate the accuracy of their judgments (“miscalibration”).
Over-the-counter market: See quote-driven market.
Picking-off risk: The risk that a limit order will be executed against a better informed trader, leaving the limit-order trade with a loss.
Price-contingent orders: Orders that instruct a dealer to transact a specified amount at market prices once a currency has traded at a pre-specified price. There are two types: stop-loss orders and take-profit orders. Stop-loss orders instruct the dealer to sell (buy) if the rate falls (rises) to the trigger rate. Take-profit orders instruct the dealer to sell (buy) if the price rises (falls) to the trigger rate.
51
Quote-driven markets: Also known as “dealership markets” or “over-the-counter markets.” An asset market in which dealers provide immediate liquidity to those needing it. During trading hours the dealers commit to trade at any time but at prices they quote. The price at which they are willing to buy, the “bid,” is always no greater than – and usually lower – than the price at which they are willing to sell, the “ask.” Foreign exchange dealers transact with end-users in a quote-driven market.
Settlement: The process by which funds actually change hands in the amounts and direction indicated by a trade.
Short position: A short position arises when an agent sells an asset, possibly before actually owning the asset. A “short position in euros” could arise if a dealer starts with zero inventory and then sells euros. The dealer could keep the short euro inventory overnight, but will typically close the position out at the end of the trading day by buying the equivalent amount of euros. Note that the overall bank will not have a negative inventory position, since the bank maintains balances in every currency it trades. Someone “short euros in the forward market” would have entered into a forward contract to sell euros in the future.
Slippage: The concurrent effect of a given trade on price.
Stop-loss orders: See “Price-contingent orders.”
Spot market: Currencies traded in the spot market settle after two trading days (except for transactions between the U.S. and Canadian dollars).
Swaps: A swap in the foreign exchange market is analogous to a repo in the money market. One counterparty agrees to buy currency A in exchange for currency B from another counterparty in the spot market, and simultaneously agrees to sell currency A back to the same counterparty, and buy back currency B, at a future date. The spot transaction is at the prevailing spot rate, the forward transaction is at the prevailing forward rate.
Take-profit orders: See “Price-contingent orders.”
Technical Trading: Trading based on technical analysis, an approach to forecasting asset-price movements that relies exclusively on historical prices and trading volume. In foreign exchange, the absence of frequent volume figures limits the information basis to past prices. Notably, technical forecasts do not rely on economic analysis. Nonetheless, many technical trading strategies have demonstrated to be profitable in currency markets, even after considering transaction costs and risk.
Trading volume: The value of transactions during a given time period.
Triangular arbitrage: Between every three currencies A, B, and C there are three bilateral exchange rates. Triangular arbitrage is a way to make riskless profits if the A-per-B exchange rate does not equal the C-per-B exchange rate multiplied by the A-per-C exchange rate.
52
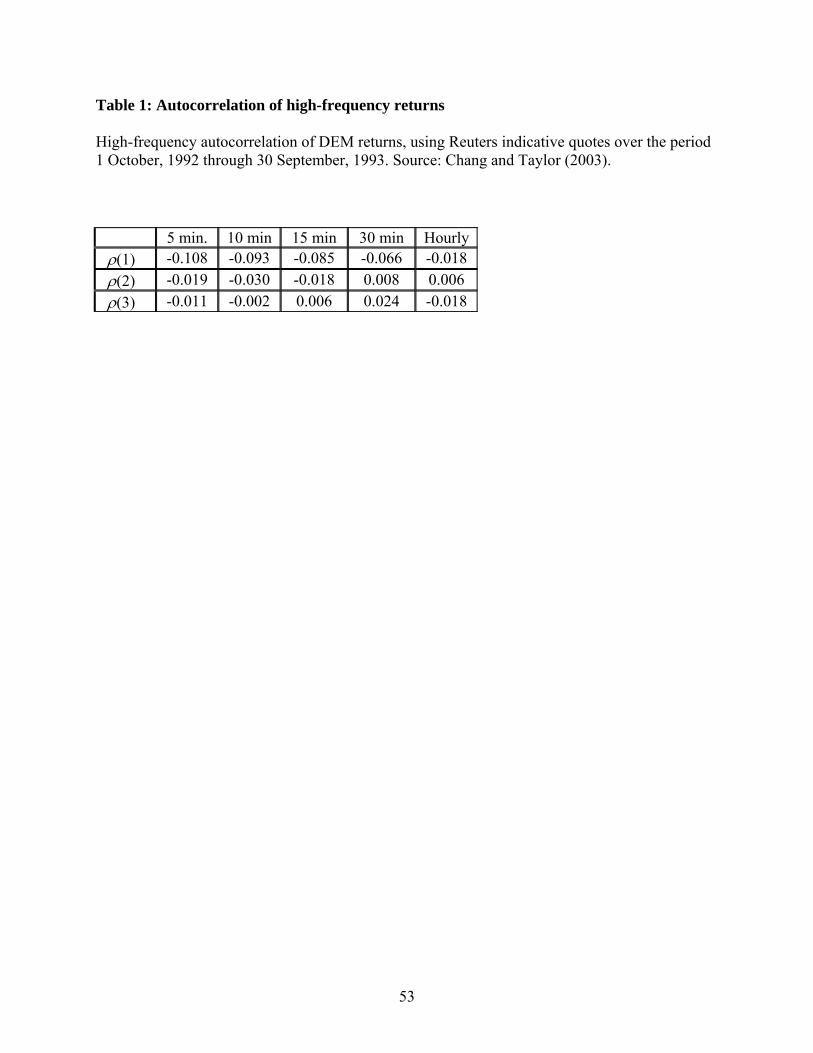
Table 1: Autocorrelation of high-frequency returns High-frequency autocorrelation of DEM returns, using Reuters indicative quotes over the period 1 October, 1992 through 30 September, 1993. Source: Chang and Taylor (2003).
5 min. 10 min 15 min 30 min Hourly ρ(1) -0.108 -0.093 -0.085 -0.066 -0.018 ρ(2) -0.019 -0.030 -0.018 0.008 0.006 ρ(3) -0.011 -0.002 0.006 0.024 -0.018
53
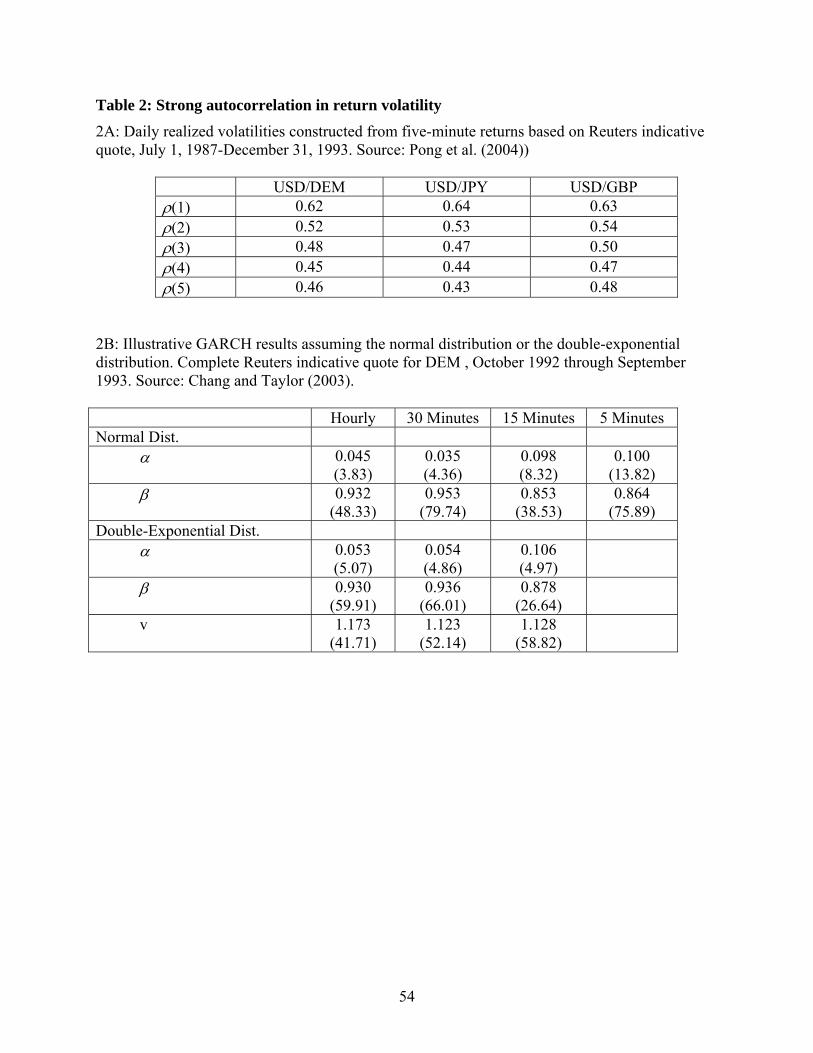
Table 2: Strong autocorrelation in return volatility 2A: Daily realized volatilities constructed from five-minute returns based on Reuters indicative quote, July 1, 1987-December 31, 1993. Source: Pong et al. (2004))
USD/DEM USD/JPY USD/GBP ρ(1) 0.62 0.64 0.63 ρ(2) 0.52 0.53 0.54 ρ(3) 0.48 0.47 0.50 ρ(4) 0.45 0.44 0.47 ρ(5) 0.46 0.43 0.48
2B: Illustrative GARCH results assuming the normal distribution or the double-exponential distribution. Complete Reuters indicative quote for DEM , October 1992 through September 1993. Source: Chang and Taylor (2003). Hourly 30 Minutes 15 Minutes 5 Minutes Normal Dist. α 0.045
(3.83) 0.035 (4.36)
0.098 (8.32)
0.100 (13.82)
β 0.932 (48.33)
0.953 (79.74)
0.853 (38.53)
0.864 (75.89)
Double-Exponential Dist. α 0.053
(5.07) 0.054 (4.86)
0.106 (4.97)
β 0.930 (59.91)
0.936 (66.01)
0.878 (26.64)
v 1.173 (41.71)
1.123 (52.14)
1.128 (58.82)
54
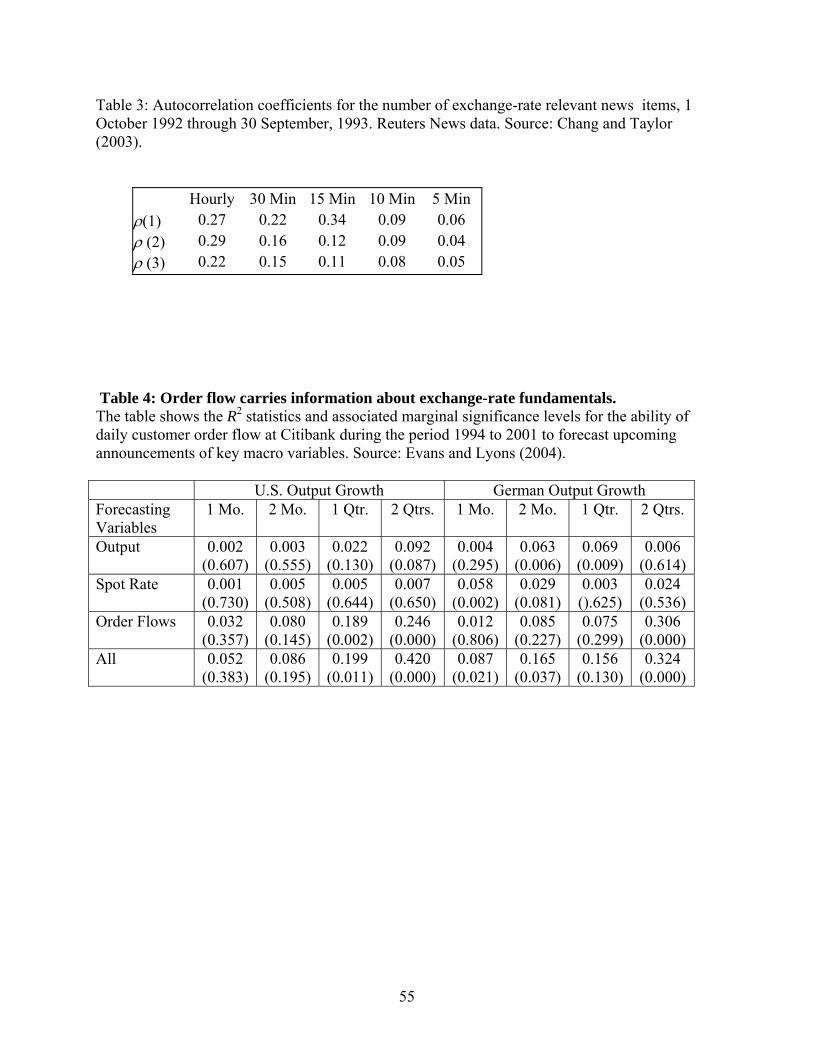
Table 3: Autocorrelation coefficients for the number of exchange-rate relevant news items, 1 October 1992 through 30 September, 1993. Reuters News data. Source: Chang and Taylor (2003).
Hourly 30 Min 15 Min 10 Min 5 Min ρ(1) 0.27 0.22 0.34 0.09 0.06 ρ (2) 0.29 0.16 0.12 0.09 0.04 ρ (3) 0.22 0.15 0.11 0.08 0.05
Table 4: Order flow carries information about exchange-rate fundamentals. The table shows the R2 statistics and associated marginal significance levels for the ability of daily customer order flow at Citibank during the period 1994 to 2001 to forecast upcoming announcements of key macro variables. Source: Evans and Lyons (2004). U.S. Output Growth German Output Growth Forecasting Variables
1 Mo. 2 Mo. 1 Qtr. 2 Qtrs. 1 Mo. 2 Mo. 1 Qtr. 2 Qtrs.
Output 0.002 (0.607)
0.003 (0.555)
0.022 (0.130)
0.092 (0.087)
0.004 (0.295)
0.063 (0.006)
0.069 (0.009)
0.006 (0.614)
Spot Rate 0.001 (0.730)
0.005 (0.508)
0.005 (0.644)
0.007 (0.650)
0.058 (0.002)
0.029 (0.081)
0.003 ().625)
0.024 (0.536)
Order Flows 0.032 (0.357)
0.080 (0.145)
0.189 (0.002)
0.246 (0.000)
0.012 (0.806)
0.085 (0.227)
0.075 (0.299)
0.306 (0.000)
All 0.052 (0.383)
0.086 (0.195)
0.199 (0.011)
0.420 (0.000)
0.087 (0.021)
0.165 (0.037)
0.156 (0.130)
0.324 (0.000)
55
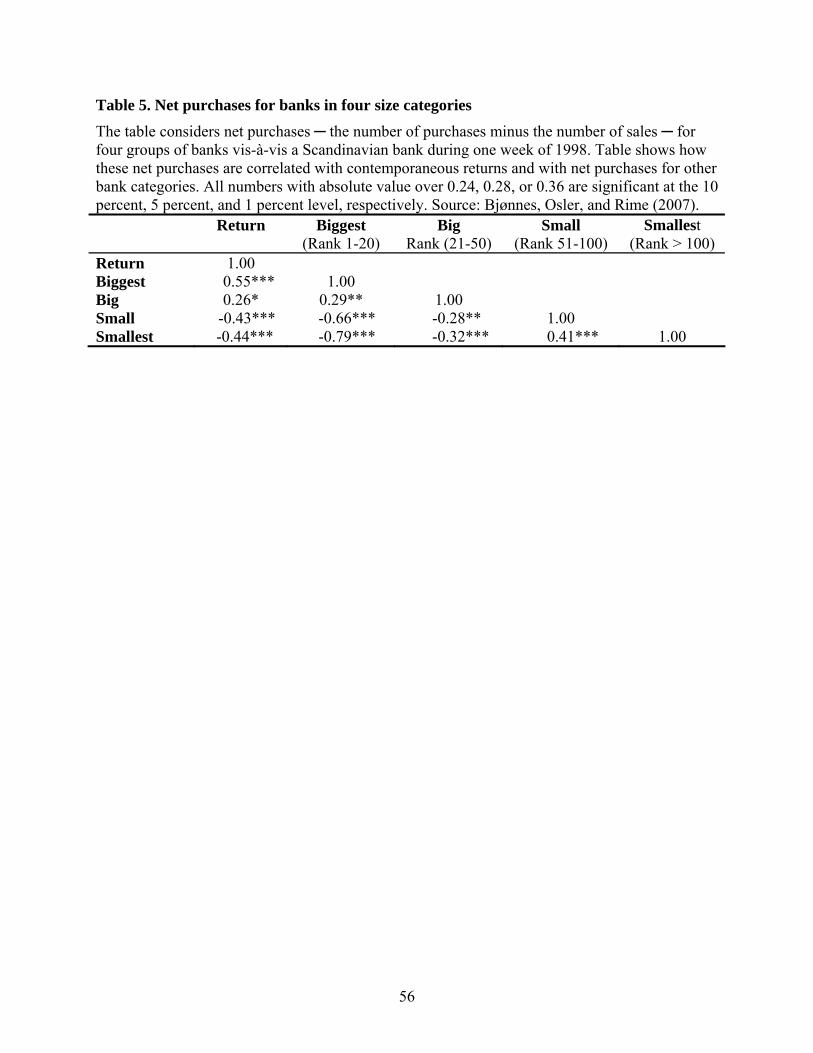
Table 5. Net purchases for banks in four size categories The table considers net purchases ─ the number of purchases minus the number of sales ─ for four groups of banks vis-à-vis a Scandinavian bank during one week of 1998. Table shows how these net purchases are correlated with contemporaneous returns and with net purchases for other bank categories. All numbers with absolute value over 0.24, 0.28, or 0.36 are significant at the 10 percent, 5 percent, and 1 percent level, respectively. Source: Bjønnes, Osler, and Rime (2007). Return Biggest
(Rank 1-20) Big
Rank (21-50) Small
(Rank 51-100) Smallest
(Rank > 100) Return 1.00 Biggest 0.55*** 1.00 Big 0.26* 0.29** 1.00 Small -0.43*** -0.66*** -0.28** 1.00 Smallest -0.44*** -0.79*** -0.32*** 0.41*** 1.00
56
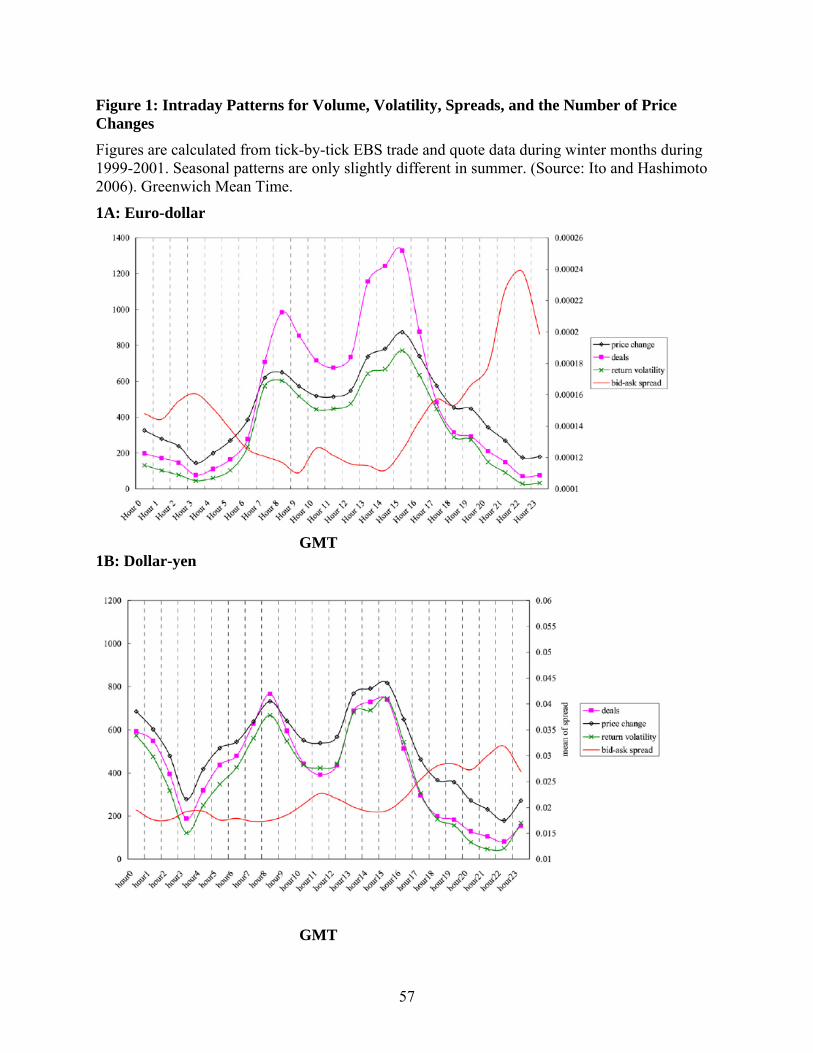
Figure 1: Intraday Patterns for Volume, Volatility, Spreads, and the Number of Price Changes Figures are calculated from tick-by-tick EBS trade and quote data during winter months during 1999-2001. Seasonal patterns are only slightly different in summer. (Source: Ito and Hashimoto 2006). Greenwich Mean Time.
1A: Euro-dollar
GMT 1B: Dollar-yen
GMT
57
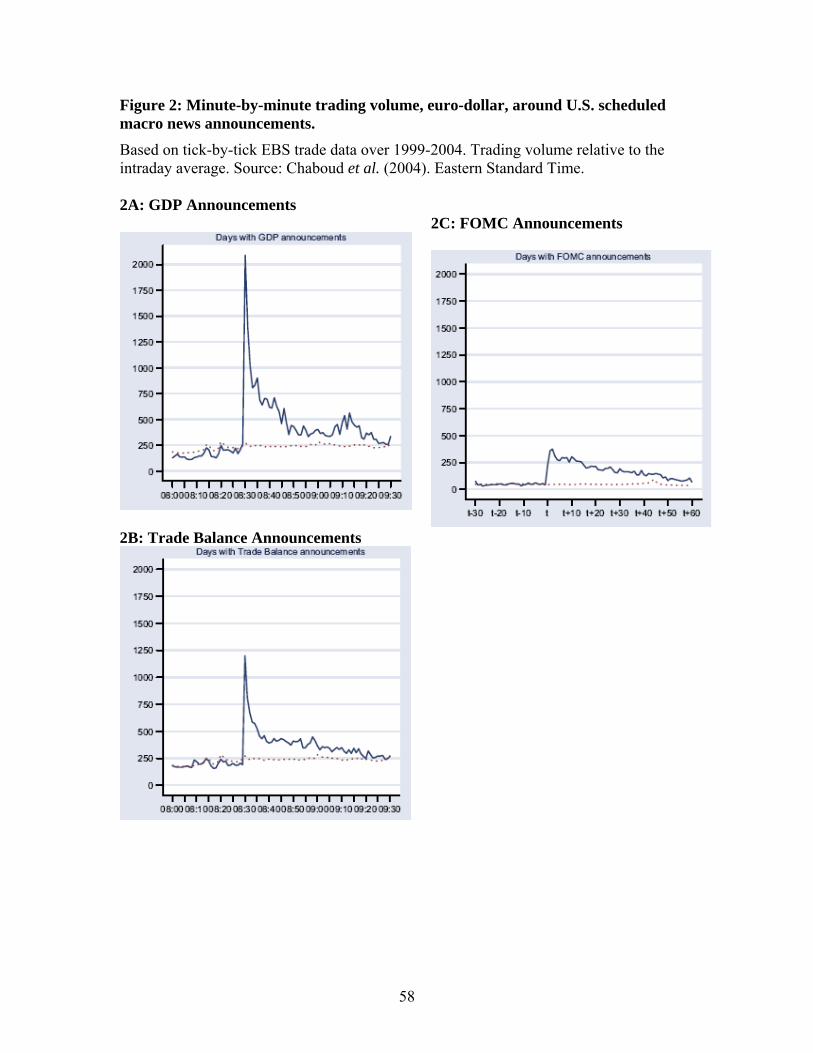
Figure 2: Minute-by-minute trading volume, euro-dollar, around U.S. scheduled macro news announcements. Based on tick-by-tick EBS trade data over 1999-2004. Trading volume relative to the intraday average. Source: Chaboud et al. (2004). Eastern Standard Time. 2A: GDP Announcements
2B: Trade Balance Announcements
2C: FOMC Announcements
58
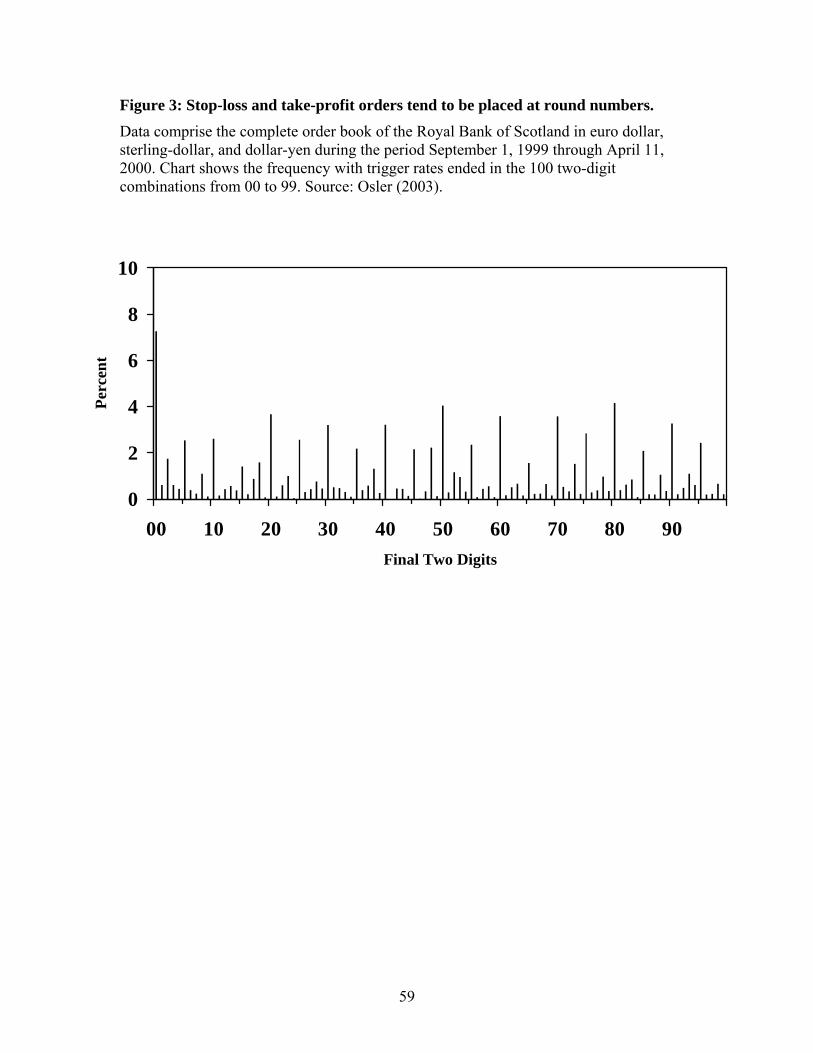
Figure 3: Stop-loss and take-profit orders tend to be placed at round numbers. Data comprise the complete order book of the Royal Bank of Scotland in euro dollar, sterling-dollar, and dollar-yen during the period September 1, 1999 through April 11, 2000. Chart shows the frequency with trigger rates ended in the 100 two-digit combinations from 00 to 99. Source: Osler (2003).
0
2
4
6
8
10
00 10 20 30 40 50 60 70 80 90Final Two Digits
Perc
ent
59
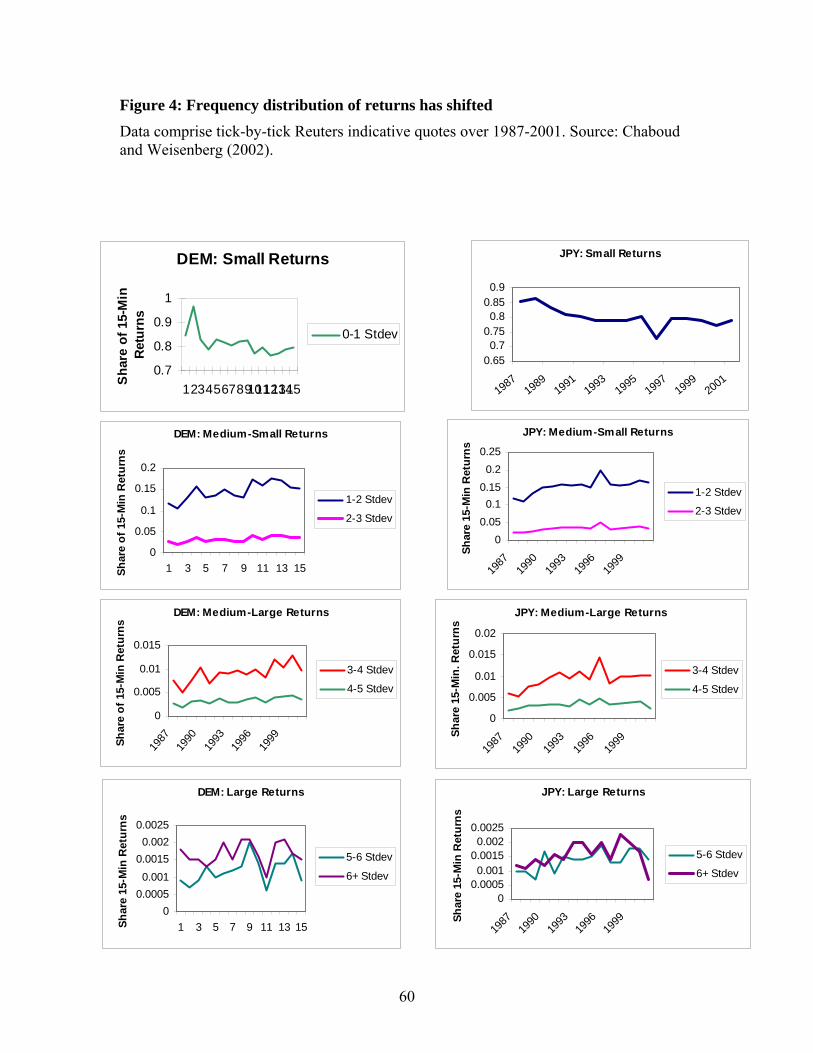
Figure 4: Frequency distribution of returns has shifted Data comprise tick-by-tick Reuters indicative quotes over 1987-2001. Source: Chaboud and Weisenberg (2002).
JPY: Small Returns
0.650.7
0.750.8
0.850.9
19871989
19911993
19951997
19992001
DEM: Small Returns
0.7
0.8
0.9
1
123456789101112131415
Sha
re o
f 15-
Min
R
etur
ns
0-1 Stdev
JPY: Medium-Small Returns
00.050.1
0.150.2
0.25
1987
1990
1993
1996
1999
Shar
e 15
-Min
Ret
urns
1-2 Stdev
2-3 Stdev
DEM: Medium-Small Returns
0
0.05
0.1
0.15
0.2
1 3 5 7 9 11 13 15Shar
e of
15-
Min
Ret
urns
1-2 Stdev
2-3 Stdev
DEM: Medium-Large Returns
0
0.005
0.01
0.015
1987
1990
1993
1996
1999Sh
are
of 1
5-M
in R
etur
ns
3-4 Stdev
4-5 Stdev
JPY: Medium-Large Returns
0
0.005
0.01
0.015
0.02
1987
1990
1993
1996
1999
Shar
e 15
-Min
. Ret
urns
3-4 Stdev
4-5 Stdev
DEM: Large Returns
00.00050.001
0.00150.002
0.0025
1 3 5 7 9 11 13 15Shar
e 15
-Min
Ret
urns
5-6 Stdev
6+ Stdev
JPY: Large Returns
00.00050.001
0.00150.002
0.0025
1987
1990
1993
1996
1999Sh
are
15-M
in R
etur
ns
5-6 Stdev
6+ Stdev
60

Figure 5: Response of returns to order flow at various horizons Charts on the left show beta coefficients from regressions of returns on contemporaneous interdealer order flow for time horizons ranging from one minute to three months. Charts on the right show coefficients of detemrination from those same regressions. Underlying data comprise minute-by-minute EBS transaction and quote records from 1999-2004. (Berger et al. 2006b).
61
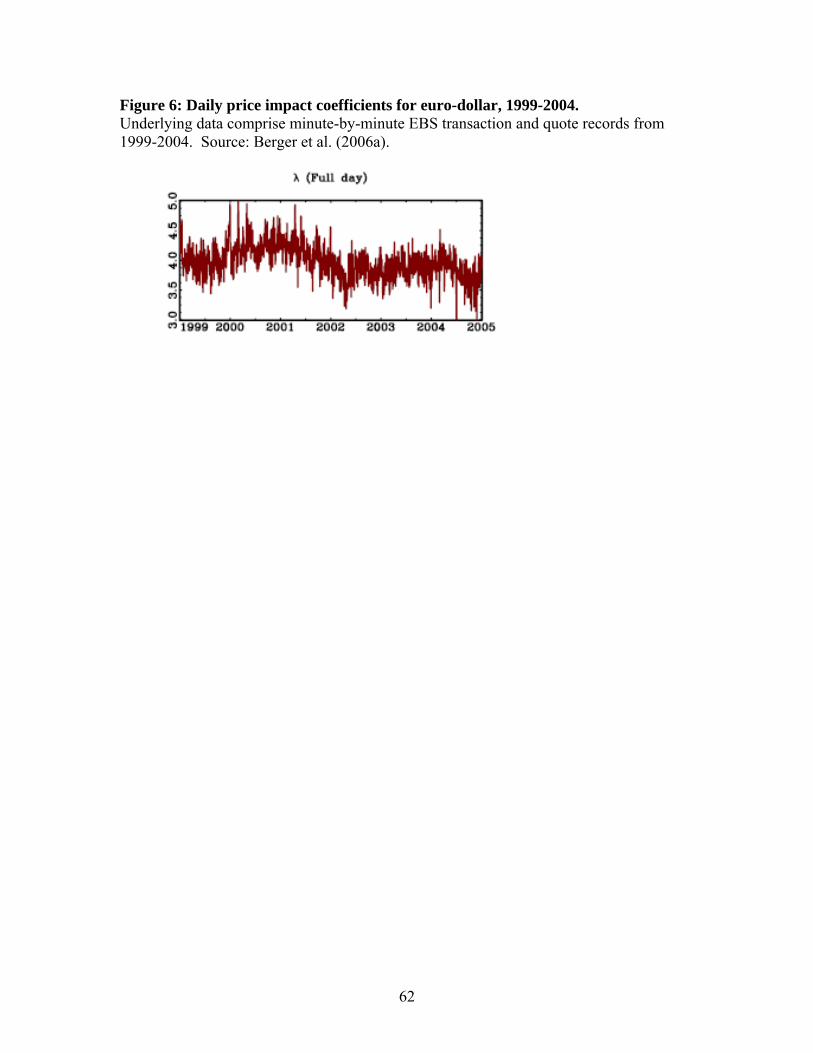
Figure 6: Daily price impact coefficients for euro-dollar, 1999-2004. Underlying data comprise minute-by-minute EBS transaction and quote records from 1999-2004. Source: Berger et al. (2006a).
62
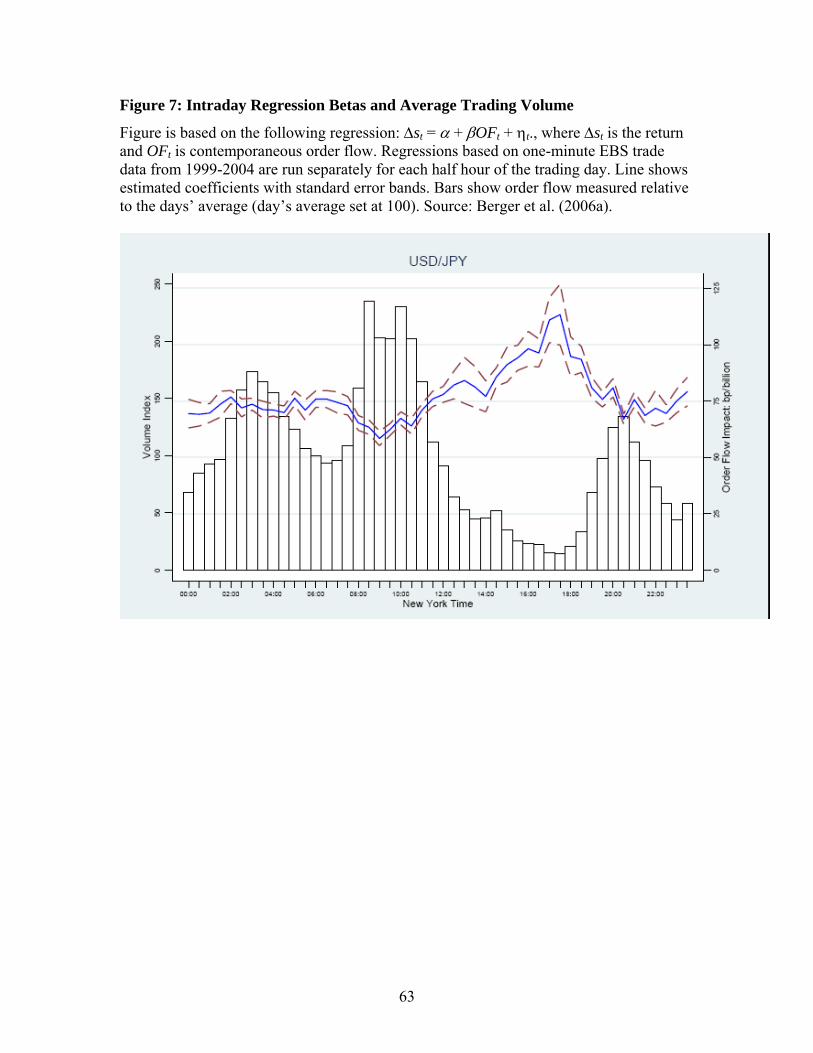
Figure 7: Intraday Regression Betas and Average Trading Volume
Figure is based on the following regression: Δst = α + βOFt + ηt., where Δst is the return and OFt is contemporaneous order flow. Regressions based on one-minute EBS trade data from 1999-2004 are run separately for each half hour of the trading day. Line shows estimated coefficients with standard error bands. Bars show order flow measured relative to the days’ average (day’s average set at 100). Source: Berger et al. (2006a).
63