Embed Size (px)
Citation preview

BIS Papers No 90
Foreign exchange liquidity in the Americas Report submitted by a study group established by the BIS CCA Consultative Group of Directors of Operations (CGDO) and chaired by Susan McLaughlin, Federal Reserve Bank of New York
Monetary and Economic Department
March 2017
JEL classification: F31, G15

The views expressed are those of the authors and not necessarily the views of the BIS.
This publication is available on the BIS website (www.bis.org).
© Bank for International Settlements 2017. All rights reserved. Brief excerpts may be reproduced or translated provided the source is stated.
ISSN 1609-0381 (print) ISBN 978-92-9259-035-2 (print)
ISSN 1682-7651 (online) ISBN 978-92-9259-034-5 (online)

BIS Papers No 90 i
Contents
Executive summary ................................................................................................................................ iii
Liquidity metrics ............................................................................................................................. iii
Liquidity conditions ...................................................................................................................... iii
Factors influencing liquidity conditions ............................................................................... iii
I. Introduction ...................................................................................................................................... 1
II. Liquidity metrics and trends ...................................................................................................... 1
A. Ways of measuring FX liquidity ....................................................................................... 1
1. FX market liquidity metrics ...................................................................................... 2
2. Use of FX liquidity metrics by central banks ..................................................... 5
B. Liquidity conditions .............................................................................................................. 7
1. Market turnover ............................................................................................................ 7
2. FX illiquidity metric (adjusted bid-ask spreads) ............................................. 10
3. Illiquidity during episodes of market stress and flash events .................. 11
III. Factors influencing liquidity conditions .............................................................................. 15
A. US dollar and Canadian dollar ....................................................................................... 16
1. Changing role of traditional liquidity providers ............................................ 16
2. Internalisation, concentration and FX liquidity .............................................. 18
3. Technology, FX market fragmentation and liquidity ................................... 19
Box 1: The impact of technological innovation on liquidity provision in fragmented FX markets .................................................................................................... 20
4. The role of regulation............................................................................................... 21
B. Latin American currencies ................................................................................................ 22
1. Reduced role of banks and foreign currency supply in Latin American FX markets .................................................................................................................... 22
2. Domestic suppliers of foreign currency ............................................................ 25
3. Onshore-offshore market integration ............................................................... 27
Conclusions .............................................................................................................................................. 29
Annex A. Research of participating central banks on FX market liquidity ...................... 31
Annex B. Role of central bank operations in the FX market ................................................. 32
Annex C. Central bank perspectives on drivers of FX liquidity ............................................ 35
Annex D. Glossary, ISO codes and acronyms ............................................................................. 37
Annex E. Graphs and tables ............................................................................................................... 41
References ................................................................................................................................................ 48
CCA/CGDO Study Group on FX Liquidity .................................................................................... 51
Acknowledgements .............................................................................................................................. 52


BIS Papers No 90 iii
Executive summary
This report (i) lists and discusses the metrics currently used by CGDO member central banks and market participants to assess FX market liquidity; (ii) describes liquidity conditions and recent trends based on some of those metrics, as well as information provided by a diverse set of market participants; and (iii) discusses the factors that appear to be influencing liquidity conditions for USD cross rates, with a focus on the CAD and currencies in Latin America.
Liquidity metrics
Definitions of liquidity vary but, for the purposes of this report, an FX market is considered liquid if an investor wishing to execute a transaction of a desired size can do so at or near the prevailing market price, relatively quickly, and with no material price impact. The report discusses a number of liquidity metrics that are currently used by market participants and that capture one or more dimensions of this definition of liquidity. Some of these metrics may have become less useful because of structural changes in FX markets. Thus, instead of focusing on a particular metric, market participants generally look at several metrics together to get an overall picture of FX market liquidity conditions. The report also indicates which metrics CGDO member central banks monitor and in which FX markets.
Liquidity conditions
The report draws on the BIS Triennial Survey for market turnover data to assess broad trends in the region’s FX markets. Furthermore, a modified bid-ask spread metric of liquidity, together with market commentary, is used to analyse liquidity changes in Latin American FX markets, as well as those for major USD currency pairs since the mid-2000s, and annual liquidity developments since the so-called taper tantrum in 2013. The report also examines liquidity conditions during several recent episodes of market stress, highlighting the magnitude and duration of changes in liquidity following an event.
From these metrics, there are some indications that global FX market liquidity may have declined in recent years. For example, market turnover for the USD and major Latin American currencies fell between 2013 and 2016, reversing an upward trend observed since 2001. Episodes in which liquidity indicators deteriorated for extended periods (higher modified bid-ask spreads and declines in market depth) in several advanced economy currencies were observed in the later part of 2014 and particularly after the CHF float of January 2015. In contrast, increases in the modified bid-ask spread during such episodes of market stress were generally smaller in Latin American currencies.
Factors influencing liquidity conditions
Global FX markets. Discussions with market participants suggest that a variety of factors have influenced the structure and liquidity of global FX markets in recent years, including changes in technology and post-crisis financial reforms.

iv BIS Papers No 90
Technology has had a large impact on the structure of the FX market, but views differ on whether it has increased or reduced FX liquidity overall. On the one hand, technology has lowered the cost of transactions in the FX market. By enabling a wider use of algorithmic and high-frequency trading strategies, as well as improving connectivity, it has helped match a wider array of liquidity providers and liquidity seekers. It has also facilitated the search for liquidity or suitable counterparties and bridged multiple platforms more cheaply than in the past. This has enabled smaller banks and other financial institutions to participate more directly in FX markets. Technology has also lowered the costs of trading for large bank dealers in recent years. As a result, manual traders have been replaced by a much smaller number of technologists and quants using more advanced algorithmic trading tools. Technology may partly explain data indicating that liquidity is higher in the internal FX markets of large dealers (where they act as liquidity providers and use algorithms to search for liquidity for their clients) than in the FX market at large. Finally, technology has helped offset the costs of executing large trades by implementing a sequence of small transactions, although this may still imply greater market risks. On the other hand, technology has contributed to FX market fragmentation by facilitating the internalisation of client flows in large dealer banks and by giving rise to new FX trading venues that have emerged as alternatives to traditional multilateral electronic trading platforms. Market fragmentation has, according to some market participants, increased the cost of accessing FX liquidity. Some recent episodes of FX market volatility, such as the sterling flash event of October 2016, suggest that technology may also have contributed to making FX markets more susceptible to order flow imbalances, which are not easily observed or anticipated but can quickly lead to large movements in prices when they occur.
As for the impact of regulation, some market participants perceive that post-crisis financial regulatory reforms designed to reduce risk-taking in the aftermath of the Great Financial Crisis (GFC) has lessened the incentive for dealers to warehouse risk, helping to reduce their participation in FX markets and to lower their provision of FX liquidity. However, while the share of traditional bank dealers (relative to other financial institutions) in FX market turnover has broadly declined since 2004, this trend began before the GFC and has partly reversed in recent years, notwithstanding new financial regulation. Also, in spite of tighter regulation, some dealers note that they continue to act as principals in the FX market because the costs of warehousing FX risk are not a significant issue, particularly in FX spot markets. Nevertheless there are indications that banks are more sensitive to regulatory and legal risks, particularly following the FX benchmark scandal, which appears to have resulted in a decline in risk-taking behaviour by banks.
Latin American FX markets. Structural changes in global FX markets, as well as certain regional market characteristics, have several implications for liquidity in Latin American FX markets. The shift away from banks to other financial institutions in cross-border financing has contributed to changes in investment strategies. For example, the execution of carry trades in some currencies shifts FX provision away from spot towards FX derivatives markets. Other types of transaction (eg foreign acquisition of domestic government bonds by real money investors) may have increased hedging in FX derivatives markets to a larger extent than in the past. FX provision in spot or derivatives markets by central banks and or/domestic residents holding large amounts of foreign assets (eg pension funds or insurance companies) may have mitigated the local impact of shocks on liquidity in global FX markets to some extent. Finally, offshore-onshore FX market segmentation on balance would

BIS Papers No 90 v
tend to reduce FX liquidity in Latin American currencies as compared with that in more integrated (ie less segmented) FX markets. Local regulation intended to reduce risks may also have contributed to FX market segmentation.
Following an analysis of these issues, the report reaches four main conclusions.
1. Structural changes in FX markets have reduced the usefulness of some conventional FX liquidity metrics. As a result, market participants and central banks stress that no single metric can give a complete picture of market liquidity independently. But in combination, these metrics can give insights into the state of market liquidity.
2. Some metrics suggest that liquidity in FX markets has declined during some recent episodes of market stress, particularly since the CHF float against the EUR of January 2015 or even earlier. While FX markets have continued to function without major disruptions, stresses to the financial system have been relatively limited in recent years, so that how FX markets deal with shocks has not been fully tested.
3. Technological innovation has lowered transaction costs, facilitating participation by a wider set of players by increasing the channels for market access. However, technological innovation may also have contributed to market fragmentation by helping highly concentrated large bank dealers to internalise client flows, by contributing to the proliferation of new platforms, and by enabling more non-banks to participate in FX markets. All in all, technology has made possible the use of (algorithmic and high-frequency) trading strategies that are viewed by many market participants as having changed liquidity dynamics – enhancing liquidity in normal conditions and offsetting the impact of market fragmentation, but also adding to FX volatility in stressed market conditions. These elements are particularly evident in global FX markets, including the USD and CAD, but are also present in Latin American currency markets.
4. The impact of post-crisis regulatory change on FX market liquidity remains unclear and requires further study. In particular, the impact on bank behaviour of regulation to discourage risk-taking in the FX market is uncertain, as the characteristics of FX markets differ from other market segments. However, some market participants indicate that other types of recent regulatory development, such as fines and requirements for participants to closely monitor trader behaviour, have reduced incentives for dealers to engage in discretionary risk trading. Some have suggested that these developments prompted large bank dealers to shift more of their market-making activity from the open FX market into their own internal market.


BIS Papers No 90 1
I. Introduction
In recent years, the issue of foreign exchange (FX) market liquidity has attracted a great deal of interest. By some conventional measures, specifically narrow bid-ask spreads, FX market liquidity appears abundant. And yet, some market participants have expressed concern about global FX market liquidity. Forces such as technological innovation and regulatory change are changing how the FX market operates. In particular, major shifts in liquidity provision and market structure suggest that liquidity is ample in some segments of the global FX market, in part because of technology. However, liquidity in some ways appears to be harder or more costly to find in other FX segments, as reflected in the significant decline in the size of transactions that can be executed at the prevailing price, challenges posed by market fragmentation (eg locating suitable counterparties or ensuring best execution), and recurrent episodes of price volatility and illiquidity.
Central banks are concerned with liquidity in FX markets and related metrics for several reasons. Prolonged illiquidity in FX markets can undermine the effectiveness with which monetary policy is transmitted to the broader economy, particularly in cases where the central bank conducts operations directly in the FX market. It can also hamper cross-border investment and financing transactions or contribute to financial market instability, which can in turn adversely affect economic activity. In extreme cases, FX liquidity may vanish, which in the past has been associated with FX market closure and even balance of payments crises, particularly in emerging market economies. While advanced FX markets are traditionally robust, a lack of FX market liquidity has sometimes been observed, particularly during the Great Financial Crisis (GFC).
To assess FX market liquidity in the Americas, a study group was formed by the CCA Consultative Group of Directors of Operations,1 comprising BIS member central banks in the Americas region, to produce a report on FX market liquidity. The report draws on data from the BIS Triennial Central Bank Survey of foreign exchange and OTC derivatives markets in 2016 and other sources, central bank information, discussions with (private sector) market participants and some recent research.
II. Liquidity metrics and trends
A. Ways of measuring FX liquidity
For the purposes of this report, an FX market is considered liquid if an investor wishing to execute a transaction of a desired size can do so at or near the prevailing market
1 The CCA is the Consultative Council for the Americas, which comprises the Governors of the BIS
member central banks in the Americas: those of Argentina, Brazil, Canada, Chile, Colombia, Mexico, Peru and the United States. It was established in 2008 to facilitate communication between these central banks and the BIS Board and Management on matters of interest to the central banking community in the region. The Consultative Group of Directors of Operations (CGDO) was formed under the auspices of the CCA to discuss or study market developments or other issues related to central bank operations.

2 BIS Papers No 90
price, relatively quickly, and with no material price impact.2 In this section, we discuss how liquidity is measured, and classify liquidity metrics as falling into four categories: cost metrics, quantity metrics, cost-quantity metrics, and proxy metrics or other indirect metrics. Two points are worth highlighting. First, any empirical measure of liquidity will necessarily be a function of time, cost and size of trade – these are all dimensions that the metrics describe to varying degrees. As discussed below, individual metrics do not provide a complete view of market liquidity on their own, but taken together may be much more informative. Second, market liquidity depends on other types of liquidity, notably funding liquidity, which can have important implications for FX liquidity dynamics.3
1. FX market liquidity metrics
A survey of CGDO members and conversations with market participants identify at least 16 different metrics of FX market liquidity (Table 1). Market participants stress that what matters most is the execution quality of large order amounts over a long period of time, which has a bearing on market strategy. Below, we list FX liquidity metrics following the classification indicated earlier and discuss the benefits and disadvantages of several of the most commonly used metrics.
i. Cost metrics. Some metrics directly measure the cost of trading liquidity. One example is the bid-ask spread. In an illiquid market, buy orders tend to push transaction prices up, while sell orders tend to do the opposite. In this setting, the best price at which a security can be bought (ask price) is considerably above the best price at which it can be sold (bid price). For this reason, the difference between these two prices – the bid-ask spread – is a common measure of liquidity conditions.4 A key shortcoming, however, is that bid-ask spreads,
2 Market liquidity will depend on the interaction of liquidity providers and consumers in the FX market.
A liquidity provider quotes prices to buy or sell. A liquidity consumer seeks prices to buy or sell. Firms that stream prices and respond to requests for quotes are liquidity-providers and firms that post requests for quotes are liquidity-takers.
3 Funding liquidity, which is access to credit on acceptable terms in order to meet obligations without incurring large losses, affects market liquidity by determining the availability of financing to take positions in the FX market.
4 See Foucault et al (2015). Illiquidity is often gauged by the implicit cost of trading. This cost can be measured by the difference between the execution price and a proxy for the price in a perfectly liquid market. This proxy is usually the midquote (the average of the best bid ask price) at the time the order was placed or executed. The measures of trading costs require knowledge of bid and ask quotes
Summary of FX liquidity metrics cited by participating central banks Table 1
Cost Quantity Cost-quantity Proxy or other indirect metrics
Bid-ask spread Volume Market depth Volatility (realised and implied)
Corwin Schultz estimator Turnover Liquidity density Markov switching
KRS illiquidity metric Average trade size Price impact of trade GARCH volatility models
Number of trades Sweep-to-fill cost USD swap basis
Onshore/offshore implied spreads
Source: Responses to a questionnaire submitted to the central banks.

BIS Papers No 90 3
particularly top-of-book spreads, represent the marginal cost of trading but give no indication of how large a transaction can be executed at the market price. Moreover, due to FX market fragmentation, bid-ask spreads may vary notably across different platforms and venues. Some recent research suggests that enhancements to data obtained from bid-ask spreads can improve their performance as a liquidity metric. For example, Karnaukh et al (2015) propose a monthly estimator (KRS) that is the average of a bid-ask spread estimator from daily high and low prices (Corwin and Schultz (2012)), and daily bid-ask quotes. Below we estimate a daily indicator of illiquidity using Karnaukh et al’s methodology to illustrate liquidity developments.5
ii. Quantity metrics. Some measures of FX market liquidity are based on the quantity of trading activity. One example is market turnover. Turnover is defined as the gross value of all new deals entered into during a given period and is measured in terms of the nominal or notional amount of the contracts.6 Turnover is often used as a metric of trends in FX market activity and as a shortcut for liquidity in the medium term, particularly in emerging economy FX markets. Turnover is easy to measure and data are readily available, but it is an imperfect metric, particularly over shorter time periods. For example, turnover volumes may overstate true liquidity, by reflecting “churn” trades done on an intraday basis; this was an issue during the GFC. Furthermore, greater trading activity than average for a given currency may be associated with higher volatility, which in turn is often associated with lower liquidity. Other quantity measures include total volume, average trade size and number of trades. Below, we illustrate FX market trends using market turnover data reported in the 2016 BIS Triennial Survey.
iii. Cost-quantity metrics. The shortcomings of bid-ask spreads or activity metrics as measures of liquidity can be partly addressed by transaction-based metrics that relate the quantity of liquidity sought to the price at which it can be obtained, combining the cost and quantity aspects of liquidity. Market depth is one example. This metric is gaining ground in segments of the FX market that are supported by an electronic platform with a central limit order book. A market where the weighted average bid-ask spread does not increase much with trade size is said to be “deep”. Therefore, market depth is inversely related to the weighted average spread for a large trade size. The central limit order book consolidates bids and offers submitted by participants in the platform in order of price, with the highest bids and the cheapest offers representing the “top of the book”. The depth of an order book may be estimated as the average amount of liquidity supplied by limit order traders across the entire set of prices on the central order book. We illustrate the use of this type of indicator below (Graph 5). Liquidity density is another example of a cost-quantity metric. It measures the average amount of order book volume per basis point for a given market or set of markets, in USD equivalent. This may be estimated by taking the sum of visible
at the time of execution (for the quoted spread), immediately before (for the effective spread) or shortly after (for the realised spread).
5 This metric has a reasonably good correlation with the effective cost spread observed in high-frequency data. Karnaukh et al (2015, Table 1) report that, at monthly frequency, the average correlation is 60% for a set of nine advanced market currency pairs, and between 69% to 77% for GBP/USD, EUR/USD, EUR/CHF and AUD/USD.
6 Definition used in this report and the BIS Triennial Survey; see BIS (2016). In the academic literature, turnover is typically calculated as the share of the amount of trades outstanding.

4 BIS Papers No 90
liquidity in an order book and dividing this by the maximum offer price minus the minimum bid price, then converting this into basis points and USD equivalents.
Market depth or similar metrics can be particularly useful when analysing the state of liquidity at a specific moment in time, but they have several disadvantages. First, their calculation requires large amounts of data. Some central banks have access to these data for onshore FX markets or trading platforms, but information on offshore FX markets may be more limited. While institutions that make markets in FX or host trade execution platforms will have such data, they can only show a partial picture using the liquidity and order data that pass through their firm’s books or platform, and may not always retain historical data. Second, market depth metrics do not directly show liquidity dynamics over time. This is revealed more clearly by price impact metrics.
Price impact metrics measure liquidity in terms of an order’s impact on market price.7 The higher the price impact of a trade, the less liquid the market.8 For price impact metrics, the overall effect of a large trade versus a sequence of small trades is of particular interest. Market participants can assess whether there is a consistent supply of liquidity and if the market is absorbing demand. However, during certain volatile episodes, spreading a large order into smaller orders over time involves taking on more risk. Compared with bid-ask spreads or quantity metrics, price impact estimators may better identify episodes of illiquidity. Trades in a market with low liquidity will have a greater price impact independent of whether transaction volumes are high or spreads are narrow. The main disadvantage of price impact metrics is that they also require the collection of large amounts of data, which may not be readily available.
iv. Proxy metrics or other indirect metrics. An often monitored proxy for illiquidity is exchange rate volatility. During normal times, and particularly in advanced economy FX markets with floating exchange rates, market volatility is an imperfect metric of illiquidity. However, illiquidity and volatility are tightly linked, ie there is a positive correlation between wider bid-ask spreads and exchange rate volatility.9 This relationship is largely intuitive as dealers account for the heightened risks in market-making by widening the spreads they offer to clients.10 During periods of market stress, the case for interpreting high FX market volatility as a metric of illiquidity is even stronger. In Latin American emerging economy markets, sharp increases in market volatility often indicate one-sided position-taking and vanishing liquidity that can lead to market closure. In advanced economy FX markets, spikes in volatility accompanied by a sharp drop in market-making activity appeared to be less common prior to the GFC but have
7 See Kyle (1985).
8 For more illiquid markets, part of the price impact will be temporary, as net buying (selling) pressure leads to an excessive increase (reduction) of the price, followed by a reversal to the fundamental value. Therefore, the price impact equation can be extended to take into account the price reversal impact of trades by including lags of the order imbalance. Mancini et al (2013) use this approach to estimate the price impact metric of the spot FX market over more than two decades and for a large cross section of currencies.
9 An analysis by an investment bank indicates that this correlation holds using intraday data from trading platforms.
10 See Mancini et al (2013).

BIS Papers No 90 5
since occurred frequently. However, most of these spikes appear to be random and one-off; their effects are short-lived and typically prices rebound close to their prior levels. There is some disagreement on the underlying causes. Some market participants note that algorithmic trading, which plays an increasing role in FX markets, tends to stop during periods of market stress, leading to sharp reductions in liquidity and much higher market volatility.11 However, the evidence suggests that algorithmic trades are not always a catalyst for sharp price moves in such events and may respond differently to market volatility in different episodes, retreating in some cases and remaining to provide liquidity in others.12 This issue is discussed further in Section II.B.3.
There are other types of metric related to liquidity that are not examined in detail in this report. Some metrics measure the quality of liquidity or fill ratio. The fill is the action of completing or satisfying an order for a security or commodity and the fill ratio shows how much of the order could be completed. Fill ratios allow comparisons with other measures such as volumes through core markets and very short-term tick volatility. As noted in the next section, central banks also monitor metrics that focus on pricing gaps that suggest incomplete, imperfectly integrated or inefficient markets, or that are based on statistical models.
2. Use of FX liquidity metrics by central banks
Based on questionnaire responses, Graph 1 illustrates the metrics monitored by central banks in the Americas region to track FX market liquidity, for the purposes of market monitoring and, in some cases, policymaking. Quantity metrics are the most widely monitored, followed by cost measures. Central banks also track onshore activity more closely than offshore activity. The following points about central bank use of liquidity metrics may be highlighted.
Varying use of metrics. The Central Bank of Chile only monitors quantity metrics and the Bank of Canada only calculates metrics for the spot market. Depth of order book and price impact metrics are used mainly to monitor spot markets. The Bank of Canada monitors market liquidity through spot checks on the bid-ask spread and market depth on Reuters Dealing (the main interbank dealing platform for the CAD), which also supplies some limited data on CAD trading volumes. Given Reuters’ declining market share, however, this is only a partial gauge of liquidity. The Federal Reserve tracks bid-ask spreads on a daily basis for major currency pairs. These include both top-of-book (or “best price”) and larger trades (such as 10 million in the base currency) spreads to get a more complete picture of liquidity costs. To get a sense of market depth, the Federal Reserve analyses order book data from EBS. Finally, the Federal Reserve tracks implied and realised volatility across currency pairs and offshore funding markets, best exhibited by trends in the FX swap basis among USD pairs.
Some reliance on liquidity metrics based on prices or spreads in derivatives markets. To assess USD liquidity and convertibility risk in the Brazilian FX market, the Central Bank of Brazil looks at respectively, the short-term cupom cambial (derivatives-implied
11 See Nguyen (2016).
12 This is observed in other markets as well. For example, during the US Treasury market decline and sharp retracement on 15 October 2014, the evidence indicates that algorithmic traders, rather than banks remained in the market as providers of liquidity throughout much of the price move. See Joint Staff Report (2014, p 28).

6 BIS Papers No 90
onshore USD interest rate) and the onshore/offshore spread implied in onshore USD futures and offshore non-deliverable forwards (NDFs)
Metrics based on statistical analysis. For example, the Bank of the Republic, Colombia, uses statistical (Markov-switching) models to assess whether FX markets are in a state of high or low liquidity. They also monitor time-varying FX volatility (estimated using a GARCH-type statistical model) and the implied volatility of FX options, as this metric is forward-looking.
Occasional use of FX liquidity metrics for policymaking. Central banks in Latin America typically take FX market liquidity metrics (quantity and cost) into account when deciding on intervention in the FX market (Graph A1). For monetary policy decisions, each country uses a different metric as an input to their decision-making process. The central banks of Argentina, Brazil and Mexico take into account FX liquidity metrics to make regulatory decisions.
Market intelligence and other information sources. Beyond looking at quantitative metrics, central banks regularly communicate with market participants to acquire intelligence and market perspective on liquidity conditions. This information is particularly valuable during periods of heightened volatility. In the case of Canada,
Central bank usage of liquidity metrics for analysis and operation
Number of countries Graph 1
Spot market Derivatives market
Onshore Offshore
Source: Responses to a questionnaire submitted to the central banks.
Quantitymetrics
Costmetrics
Liquidity depthmetrics
Price impactmetrics
Quantitymetrics
Costmetrics
Liquidity depthmetrics
Price impactmetrics
Quantitymetrics
Costmetrics
Liquidity depthmetrics
Price impactmetrics
ArgentinaBrazil
CanadaChile
ColombiaMexico
Quantitymetrics
Costmetrics
Liquidity depthmetrics
Price impactmetrics
PeruUnited States
BIS Papers No 90 7
trading desks at Canadian and other dealers are the main channel for monitoring liquidity in the CAD (including short-term FX swap funding markets for banks). Latin American central banks rely on extensive information on FX transactions that domestic residents are required to report. In some cases, these transactions data are obtained from formal FX markets (Argentina, Chile and Colombia). Annex A highlights central bank work that explores different aspects of liquidity in the foreign exchange market.
B. Liquidity conditions
To assess liquidity we focus on two metrics: (i) market turnover, based on the results of the BIS Triennial Surveys, and (ii) a modified daily bid-ask spread, which we will call the illiquidity metric (an increase means less liquidity).
Below, we use market turnover to evaluate the growth of FX markets over time, the extent to which growth momentum has been maintained in recent years, and which types of instrument have grown most rapidly. To complement this analysis, we also discuss information on liquidity developments provided by market participants.
1. Market turnover
Data from the 2016 BIS Triennial Survey show that, for the first time since 2001, global FX trading has declined between two consecutive surveys.13 The fall in total FX turnover is due mainly to the drop in spot trading, for which the average daily volume declined by $0.3 trillion between 2013 and 2016. However, global trading in FX derivatives continued to grow. Since the USD is a vehicle currency, USD turnover also declined. However, as a share of total turnover, USD trading has been stable.
Market participant reports suggest that significant declines in turnover started in late 2014. A survey by the Bank of England showed that the number of transactions per day in the London FX spot market fell from a peak of 1.3 million in October 2014 to 981,000 in October 2015.14 An investment bank reported a 21% year-on-year reduction in global volumes for all products (spot, forwards, swaps and options) in 2015.15 The global contraction in volumes appears to be the largest since the Lehman bankruptcy.
According to Triennial Survey data, in April 2016, the FX market turnover of the eight currencies of the Americas region totalled USD 5 trillion (Table A1), accounting for 97% of global FX market turnover (including OTC and exchange-traded
13 Central banks and other authorities in 52 jurisdictions participated in the 2016 BIS Triennial Survey.
They collected data from almost 1,300 banks and other dealers in their jurisdictions and reported national aggregates to the BIS, which then calculated global aggregates. Turnover data are reported by the sales desks of reporting dealers, regardless of where a trade is booked and are reported on an unconsolidated basis, ie including trades between related entities that are part of the same group.
14 See also Moore et al (2016, Box A).
15 A year-by-year analysis of global FX market turnover also finds a pattern of reduced turnover in 2013, increased turnover in 2014, a decline in turnover in 2015 and a slight recovery in 2016. See Moore et al (2016). The declines in turnover appear to have matched declines in gross current, capital, and financial account flows, which suggests that they do not necessarily reflect changes in FX liquidity.

8 BIS Papers No 90
transactions).16 USD turnover totalled $4.5 trillion of this $5 trillion, followed by the CAD at $266 billion. For the six Latin American currencies considered, turnover was $199 billion. Among the Latin American currencies, the MXN and BRL have the highest turnover, at $99 billion and $74 billion respectively.
FX market turnover in the Americas region trended upwards from 2004, but this trend went into reverse after 2013. For the USD (Graph 2, left-hand panel), OTC turnover declined between the 2013 and 2016 BIS Triennial Surveys, reflecting declines in both spot market turnover and derivatives transactions. While the reasons for this decline in USD turnover have not been fully analysed, anecdotal reports from market participants suggest that they may partly reflect structural changes (eg changes in the role of traditional liquidity suppliers in global FX markets) that are discussed in greater detail in the next section.
Graph 2 also reveals that since the mid-2000s, growth in FX derivatives markets has outpaced that in spot markets.17 A key driver behind the changing composition of FX volumes is the hedging demand of banks and corporates.18 In the USD FX derivatives markets, FX swaps represent the largest share of turnover. We also note that exchange-traded products represent a much smaller share of total turnover for FX derivatives than for USD interest rate derivatives.
The CAD has also seen large increases in market turnover over the past 12 years and, in contrast to the USD, saw no decline in turnover between 2013 and 2016
16 Futures are exchange-traded instruments. As these have a low share in total turnover (with the
exception of the BRL, see Table A1), the discussion in this report generally focuses on OTC instruments, except when referring to some instruments used in Brazil.
17 For the USD, the ratio of FX derivatives-to-spot market turnover is 2.2.
18 Moore et al (2016) show that there is a close association between FX swap turnover and US dollar cross-currency funding positions of banks and corporates, and with currency risk hedging costs, as measured by the cross-currency basis. See also Borio et al (2016).
FX market turnover by instrument1
Daily average OTC market turnover in April of each year, in billions of US dollars Graph 2
US dollar Canadian dollar Latin American currencies2
1 Adjusted for local and cross-border inter-dealer double-counting (ie “net-net” basis). OTC market. 2 Sum of market turnover by instrument in ARS, BRL, CLP, COP, MXN and PEN currencies per year.
Sources: Triennial Central Bank Survey; BIS calculations.
0
1,000
2,000
3,000
4,000
2004 2007 2010 2013 2016
Spot Outright forwards
0
60
120
180
240
2004 2007 2010 2013 2016
FX swaps Currency swaps
0
50
100
150
200
2004 2007 2010 2013 2016
FX options
BIS Papers No 90 9
(Graph 2, centre panel). As is the case for the USD, turnover in CAD FX derivatives markets exceeds turnover in the spot market.19 Derivatives transactions involve deliverable instruments, and while the exchange-traded derivatives market for FX is small, it is large for interest rate derivatives (Table A1).
Turnover for the six Latin American currencies as a group also declined between 2013 and 2016, reflecting declines in both spot and derivatives market turnover (Graph 2, right-hand panel). Cross-country variation was significant. Spot and derivatives market turnover fell in the BRL, CLP and MXN. In contrast, turnover for the ARS, COP and PEN increased due to growth in derivatives market activity.
Apart from structural factors that might have reduced global FX market liquidity, the recent falls in FX market turnover in Latin American currencies also appear to reflect cyclical downturns in cross-border financing to the region. These declines might reflect expectations of tighter global financing conditions, slowing economic growth and the collapse in commodity prices in recent years, which had a large impact on the capital flows and export revenues of Latin American countries.20 In some cases (eg Argentina, Brazil), domestic political uncertainty may also have played a role. As discussed below, restrictions that reduce onshore-offshore market integration may have exacerbated these effects.
The growth in FX derivatives markets turnover in Latin American currencies has outpaced that of spot markets, and FX derivatives volumes exceed spot volumes for all currencies except the ARS (Graph A2). Turnover trends thus suggest that derivatives markets have become more liquid than spot markets. This may partly reflect financial innovation, but in some jurisdictions (eg Brazil) it is also the result of long-standing restrictions on FX spot market transactions. The use of FX derivatives instruments for intervention by some central banks (eg Brazil, Peru) may also have played a role.21
Several characteristics of Latin American FX derivatives markets are apparent in Graph A2. FX swaps turnover is larger than outright forward turnover for MXN (as it is in the more liquid and integrated FX markets such as the CAD and USD) and also for the ARS, while outright forwards turnover is larger (by far) for the BRL, CLP and COP. The most widely used derivative instruments in the MXN market (the largest and most liquid Latin American FX market) are deliverable, and settlement involves the exchange of currencies. Foreign investors implementing carry trades typically buy MXN spot and then enter into an FX swap contract in which they sell MXN spot and purchase it forward.22 In line with this, turnover levels are similar for spot and FX swaps, and their trends are highly correlated. In contrast, spot and forward transactions in other currencies in the region do not appear to be highly correlated.
FX derivatives in other Latin American currencies (ARS, BRL, CLP, COP, PEN) are often non-deliverable and transactions are settled in local currency even if denominated in USD. The prevalence of NDFs settled in local currency also economises on the use of foreign currency, which can be helpful for financial stability during periods of market stress or FX shortages. Local regulations intended to deter speculation may also play a role. For most Latin American currencies,
19 The ratio of derivatives to spot turnover for the CAD is 1.5.
20 See Forbes and Warnock (2012).
21 See Upper and Valli (2016).
22 See BIS (2015).

10 BIS Papers No 90
exchange-traded FX turnover as a proportion of total turnover is small. The exception is the BRL, where the share of exchange-traded turnover is 31.5%, a close second to turnover in outright forwards. Exchange-traded derivatives in Latin America generally represent a much smaller share of FX market volume than interest rate derivatives (Table A1).
2. FX illiquidity metric (adjusted bid-ask spreads)
We employ the methodology in Karnaukh et al (2015) to construct an illiquidity metric using daily data from widely used sources and calculate it for the USD against other major currencies (including the CAD) and the USD against Latin American currencies.23 There are some caveats about this metric. The bid-ask spread data correspond to the closing quote of the market in Argentina, Brazil, Chile, Colombia and Peru. However, the dynamic of the market when it closes may differ from the average bid-ask spread of each trading session. Even for currencies that trade 24 hours a day, the volume traded and/or activity observed at 5 pm EST is less than a fifth of the volume observed during the New York or Mexico trading session. Hence, some central banks express concern about data accuracy or whether data contributors are representative.
Liquidity, as measured by the FX illiquidity metric, improved in 2014 for the advanced currencies considered (Graph 3, left-hand panel), but appears to have deteriorated since. The decline in liquidity in 2015 was largest for USD/CHF after the Swiss National Bank (SNB) discontinued the CHF floor against the EUR. After the CHF float, liquidity across all major currencies failed to recover throughout the year. More details of this episode are highlighted below.24
For the six Latin American currencies considered, the behaviour of liquidity in the region in 2014 was mixed (Graph 3, right-hand panel). The illiquidity metric indicates improved liquidity for USD/MXN and USD/PEN, and lower liquidity for the other four Latin American currencies. FX market illiquidity increased in 2015 for all the currencies in the region and increased further in 2016 for all currencies considered.
Further analysis is needed to determine how far these increases in the bid-ask illiquidity index reflect significant changes in market behaviour. For example, it is well known that volatility is an important driver of illiquidity and is typically highly (positively) correlated with it. In most cases, exchange rate volatility and illiquidity move closely together, but for advanced economy currencies there are cases where illiquidity episodes have recently exceeded, or persisted for longer than, volatility increases. If illiquidity changes are larger than might be expected when volatility increases, it is easier to conclude that liquidity conditions have changed. We also implemented an empirical analysis, which indicated that on average illiquidity rose
23 The bid-ask spread is obtained from Bloomberg and corresponds to the 5 pm EST spread for the
CAD, MXN and USD (which trade 24 hours), and to the closing quote of the market for the remaining currencies in the Americas (which do not trade 24 hours). Following Karnaukh et al (2015), the underlying series that form the metric (bid-ask and Corwin and Schultz) are first standardised before constructing the average. We then standardise the metric for all currencies. For advanced economy currencies, the quotes used are: USD/CAD, USD/CHF, EUR/USD, GBP/USD and USD/JPY. For Latin American currencies, the quotes used are: USD/ARS, USD/BRL, USD/CLP, USD/COP, USD/MXN and USD/PEN. Data are from January 2000 to December 2016.
24 In particular, the largest effect after the USD/CHF was observed for the EUR/USD and the GBP/USD.

BIS Papers No 90 11
relative to volatility after 2015. But the responsiveness of illiquidity to volatility declined.25
Further insights into FX liquidity can be obtained by examining its behaviour during certain episodes of stress in FX markets, which we do in the next section, for the Americas region currencies.
3. Illiquidity during episodes of market stress and flash events
Structural changes in FX markets over time, including changes in liquidity provision by traditional market-makers, fragmentation and technology, may have contributed to FX markets’ increased susceptibility to periodic episodes of illiquidity during periods of stress. To give some idea of this, we consider first the size of the change in liquidity metrics following an important announcement or decision, and later the implications of events that seem to be unrelated to announcements, but may reflect the impact of technology. These are so-called flash events.
We turn first to three episodes of market stress associated with announcements or decisions affecting at least one jurisdiction or currency that have been widely cited in market commentary. The first episode was the announcement in May 2013 of the eventual reduction in large-scale asset purchases by the Federal Reserve, which precipitated the so-called taper tantrum, a significant rise in long-term US bond yields and USD appreciation. FX liquidity in advanced economy currencies was not significantly affected (Graph 4, left-hand panel), but the FX illiquidity metric rose for the USD/MXN and USD/BRL (Graph 4, right-hand panel). The second episode was the SNB’s decision to discontinue the CHF floor against the EUR on 15 January 2015. Between 14 and 16 January 2015, the FX illiquidity metric for USD/CHF spiked 10.7 points (Graph 4, left-hand panel). This was followed by increases in the FX illiquidity
25 More precisely, we regressed, at monthly frequency, the average illiquidity metric (for 22 USD
currency pairs) on a constant, average volatility and an intercept and slope dummy starting in January 2015. The results showed a positive intercept dummy but a negative slope dummy.
Recent trends in the FX illiquidity metric1
Annual changes; in percentage points Graph 3
Advanced economy currencies Latin American currencies
1 Average annual FX illiquidity metric minus the corresponding average of the previous year.
Sources: Bloomberg; Datastream; study group calculations.
USD/JPY
GBP/USD
EUR/USD
USD/CHF
USD/CAD
–0.50 –0.25 0.00 0.25 0.50 0.75
2014 2015
USD/PEN
USD/MXN
USD/COP
USD/CLP
USD/BRL
USD/ARS
–0.50 –0.25 0.00 0.25 0.50 0.75
2016

12 BIS Papers No 90
metric for USD/CAD, GBP/USD and EUR/USD, and other major currencies. For Latin American currencies, however, the FX illiquidity metric in some cases fell or increased very little (Graph 4, right-hand panel). Finally, the most recent episode was the United Kingdom’s EU referendum on 23 June 2016. The FX illiquidity metric for GBP/USD increased by 3.7 percentage points. Graph 4 (left-hand panel) shows that FX illiquidity rose for all major currencies after the referendum, but the changes are smaller than those observed after the CHF float. The EU referendum triggered similar illiquidity increases in some Latin American currencies (Graph 4 right-hand panel), but they were generally smaller.
The increases in illiquidity metrics during the CHF float and the United Kingdom’s EU referendum episodes occurred in a setting in which the policy rates of major currencies had been close to zero or negative, and federal funds futures indicated that markets expected any tightening to be moderate. Nevertheless, liquidity reductions for major currency pairs during these episodes appear to have been comparable with, or higher than, those observed during the taper tantrum, when markets anticipated a significant tightening in financing conditions.
Further insights are provided by Graph 5, which shows three liquidity metrics for USD/CHF, based on electronic trading venues data: order book depth, bid-ask spread (here a sweep-to-fill cost for $25 million), and daily realised volatility of returns. Before the full CHF float, order book depth increased by almost 40% from January to September 2014, while the spread and volatility declined and remained below 5 bp and 10%, respectively. Order book depth fell back to its early 2014 levels in October 2014, as volatility rose, and then halved again on 15 January 2015. It has remained well below pre-float levels up to late 2016. On the day of the float, the estimated $25 million bid-ask spread spiked to around 55 bp, while daily realised volatility rose to around 60%. Both metrics have remained above pre-float levels since. The effect of the increased volatility after the CHF float has had a significant impact on spreads.
FX illiquidity metric: changes during episodes of market stress
In percentage points Graph 4
Advanced economy currencies Latin American currencies
1 The changes correspond to the following time frames: taper tantrum from 22 May 2013 to 20 June 2013, full float of CHF from 14 January2015 to 23 January 2015, and the United Kingdom’s EU referendum from 23 June 2016 to 14 July 2016. The time frame in each episode is set by the period of largest change for the most affected currency (eg the CHF for the full float of the CHF or GBP for the EU referendum) with the exception of the taper tantrum, which is set by the period which saw the largest change in the VIX since the start of the episode.
Sources: Bloomberg; Datastream; study group calculations.
USD/JPY
GBP/USD
EUR/USD
USD/CHF
USD/CAD
840–4
Taper tantrum Full float of CHF
USD/PEN
USD/MXN
USD/COP
USD/CLP
USD/BRL
USD/ARS
840–4
UK's EU referendum

BIS Papers No 90 13
Nevertheless, volatility levels had started rising as early as the later part of 2014. The behaviour of these three metrics suggests persistent reductions in USD/CHF liquidity in September 2014 and in January 2015. Furthermore, it appears that factors unrelated to USD/CHF liquidity may also have played a role in the decline in market depth. In particular, the drop observed in September 2014 may have reflected developments in the EUR market, against which a CHF floor was maintained. Estimates (not shown) for EUR/USD indicate that order book depth fell from peaks of close to 140% in August 2014 to around 80% after 15 January 2015 (100% on 6 January 2014), remaining close to that level for an extended period. The decline in liquidity metrics before the CHF float suggests that focusing on the float period alone may be misleading. Further analysis is needed of changes in liquidity in 2014 and 2015.
Some recent episodes of FX market volatility suggest that FX markets have also become more susceptible to order flow imbalances or “flash crashes”, which are not easily observed or anticipated but can quickly lead to large movements in prices when they occur.26 Flash crashes involve rapid, deep and volatile asset price declines (or currency depreciations) for very brief periods of time that cannot be fully explained by news or economic data. Trading volumes tend to rise significantly during flash events and the speed at which these episodes unfold suggests that they are mainly driven by high-frequency trading. Several flash crashes in FX markets have attracted attention in recent years.27
26 Anderson et al (2015).
27 There are several more if we look at moves of somewhat smaller magnitude that often do not even register with non-traders.
FX liquidity – order book depth – USD/CHF1 Graph 5
1 Daily averages based on data from 08:00 to 18:00 GMT. 2 Estimate of aggregated volume on the first three levels on interbank electronictrading venues (primary and secondary), indexed to 100% on 6 January 2014. 3 Estimated spread between volume-weighted average price, on the bid and offer side of the order book, on primary interbank electronic trading venues. 4 Figures multiplied by 1,000. Estimated daily realised volatility based on the standard deviation of five minutes returns, based on primary interbank electronic venue data.
Sources: BNP Paribas; primary and secondary electronic trading venues.
175
150
125
100
75
50
25
0
70
60
50
40
30
20
10
0
201620152014
15 Jan 2015
Volume on first 3 levels, per cent2Lhs:
USD 25m sweep-to-fill cost, bp3
Realised volatility4
Rhs:
14 BIS Papers No 90
In contrast to market reactions to news, flash events appear to relate more to technical factors such as hard-to-explain imbalances in order flows or outsized reactions to news that might otherwise be expected to be of little consequence. For example, a flash crash that affected mainly NZD/JPY28 reportedly occurred just before the US stock market opened sharply lower at the time of China’s share sell-off and an economic slowdown that drove commodities to a 16-year low. Some flash crashes have occurred when market conditions were fragile, eg when liquidity was thin and more susceptible to a rapid withdrawal. Market analysts suggest that the cause of the USD/ZAR flash crash29 was the lack of investors trading USD/ZAR in early Asian market hours, combined with reduced interest in South Africa’s financial assets amid uncertainty about the country’s financial and fiscal policies.30
Algorithmic market-makers often respond to stress by becoming more cautious in pricing risk during bouts of volatility and by widening prices before ceasing to quote them altogether when certain thresholds are breached (see Section III.3 on “Technology, FX market fragmentation and liquidity”).31 To the extent that such participants’ provision of liquidity responds (indirectly) to that of their peers, any significant withdrawal of liquidity has the potential to become self-reinforcing. For example during the GBP/USD flash event,32 a significant demand to sell sterling to hedge options positions, the execution of stop-loss orders, and the closing-out of positions as the currency traded through key levels contributed to the mechanical cessation of trading on the futures exchange and the exhaustion of the limited liquidity on the primary spot FX trading platform. Furthermore, the time of day played a significant role in increasing the sterling foreign exchange market’s vulnerability to imbalances in order flows.
Other factors such as the juniorisation of traders may also play a role. For example during the GBP/USD flash event, the presence of staff less experienced in trading sterling outside the currency’s core time zone, with lower risk limits, more limited risk appetite, and less expertise in the suitability of particular algorithms for prevailing market conditions, appears to have further amplified the movement.
Flash events to date have generally proved short-lived and without immediate consequences for financial stability. However, such events could undermine confidence in financial markets, with adverse consequences for the real economy. One concern is that market-makers could demand additional compensation for liquidity provision, impairing market liquidity via wider bid-ask spreads and/or higher margin requirements. Another is that investors may become less willing to hedge because of a concern that the driving force behind the instantaneous buying and
28 On 24 August 2015, several currencies unexpectedly depreciated. The most affected currency was the
NZD, which depreciated by 10% against the JPY over two minutes and recovered fully within 35 minutes.
29 On 11 January 2016, the ZAR depreciated by 8% against the USD in 10 minutes and recovered 75% of the fall within four hours.
30 See also Brockett (2015), Ismail and Mnyanda (2016), and Nelson (2016).
31 Markets Committee Report (2017).
32 On 7 October 2016, the GBP fell by 9% against the USD in early Asian trading hours. The GBP/USD did not completely recover during European trading hours, exceeding losses observed during the week of 23 June 2016 (the United Kingdom’s EU referendum). At the same time, one-week implied volatility of GBP/USD jumped to as much as 16.77%, its highest level since 14 July 2016.
BIS Papers No 90 15
selling of their hedges will be short-lived market phenomena and not the persistent changes in rates that would affect the terms of their real economy activity.
III. Factors influencing liquidity conditions
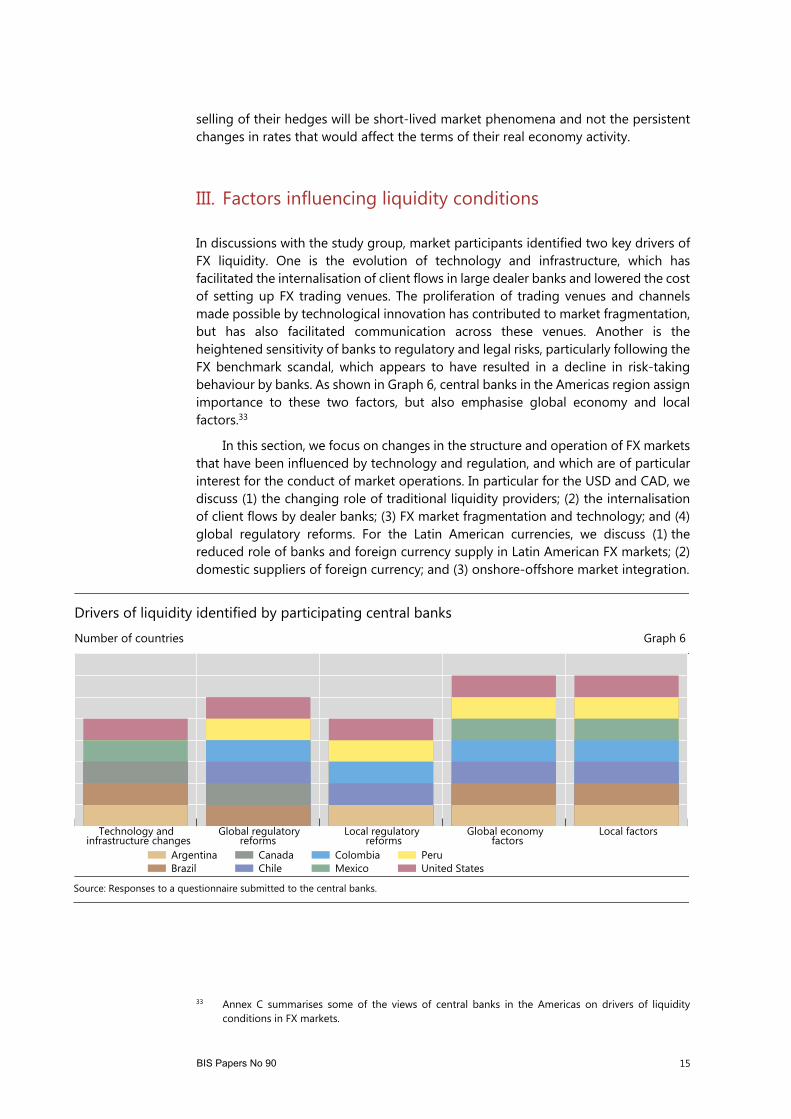
In discussions with the study group, market participants identified two key drivers of FX liquidity. One is the evolution of technology and infrastructure, which has facilitated the internalisation of client flows in large dealer banks and lowered the cost of setting up FX trading venues. The proliferation of trading venues and channels made possible by technological innovation has contributed to market fragmentation, but has also facilitated communication across these venues. Another is the heightened sensitivity of banks to regulatory and legal risks, particularly following the FX benchmark scandal, which appears to have resulted in a decline in risk-taking behaviour by banks. As shown in Graph 6, central banks in the Americas region assign importance to these two factors, but also emphasise global economy and local factors.33
In this section, we focus on changes in the structure and operation of FX markets that have been influenced by technology and regulation, and which are of particular interest for the conduct of market operations. In particular for the USD and CAD, we discuss (1) the changing role of traditional liquidity providers; (2) the internalisation of client flows by dealer banks; (3) FX market fragmentation and technology; and (4) global regulatory reforms. For the Latin American currencies, we discuss (1) the reduced role of banks and foreign currency supply in Latin American FX markets; (2) domestic suppliers of foreign currency; and (3) onshore-offshore market integration.
33 Annex C summarises some of the views of central banks in the Americas on drivers of liquidity
conditions in FX markets.
Drivers of liquidity identified by participating central banks
Number of countries Graph 6
Source: Responses to a questionnaire submitted to the central banks.
Technology andinfrastructure changes
Global regulatoryreforms
Local regulatoryreforms
Global economyfactors
Local factors
ArgentinaBrazil
CanadaChile
ColombiaMexico
PeruUnited States

16 BIS Papers No 90
A. US dollar and Canadian dollar
1. Changing role of traditional liquidity providers
Data from BIS Triennial Surveys (Graph 7, left-hand and centre panels) indicate that, for the USD and CAD, growth in FX turnover by reporting dealers (traditionally large dealer banks) has tended to lag that of other financial institutions since 2004, so that over time the share of other financial institutions in FX market turnover has started to exceed that of reporting dealers. However, as illustrated in Graph 7 (left-hand panel), the latest survey reveals that this trend was recently reversed for the USD: from 2013 to 2016, daily turnover by reporting dealers continued to grow while that of other financial institutions decreased. However, the market turnover of other financial institutions is still higher than that of reporting dealers. As for non-financial institutions, FX turnover activity has remained relatively flat over the past decade.34
In discussions with the study group, market participants noted that non-banks, including buy-side investors, are playing a growing role in supplying FX market liquidity, although their shares in market-making are still relatively small.35 They appear to be well positioned to step in as liquidity providers because they tend to be less leveraged than banks and do not face the same regulatory capital or leverage requirements.36 Furthermore, a recent survey suggests that FX markets are particularly suitable for non-bank liquidity providers.37 The reasons cited include standardisation, liquidity, the dominance of electronic trading, and daily turnover in the trillions. Some
34 The participation of prime brokers has also declined. Prime-brokered turnover averaged $1,131
billion per day in April 2013, and declined to $887 billion in April 2016.
35 Citing the Euromoney 2016 FX survey, Moore et al (2016) note that the share of non-banks is 6% of the market-maker segment and the authors speculate that it may be higher.
36 Avalos et al (2015) provide evidence that some of these institutions do take leveraged positions.
37 See Greenwich Associates (2016).
FX market turnover by counterparty1
Daily average OTC market turnover in April of each year, in billions of US dollars Graph 7
US dollar Canadian dollar Latin American currencies2
1 Adjusted for local and cross-border inter-dealer double-counting (ie “net-net” basis). OTC spot and derivatives markets. 2 Sum of market turnover by instrument in ARS, BRL, CLP, COP, MXN and PEN currencies per year.
Sources: Triennial Central Bank Survey; BIS calculations.
0
500
1,000
1,500
2,000
2004 2007 2010 2013 2016
Reporting dealers
0
30
60
90
120
2004 2007 2010 2013 2016
Other financial institutions
0
28
56
84
112
2004 2007 2010 2013 2016
Non-financial institutions

BIS Papers No 90 17
market participants believe non-bank liquidity providers can now compete more effectively with traditional liquidity providers because technology has both lowered barriers to entry into the FX market and improved risk management, thanks to advances in the stream processing of data (closer to real time, as opposed to batch data). This allows non-bank or buy-side investors to manage liquidity risk effectively without needing to manage customer order flows. The buy side has also been more consistently active in offering liquidity during episodes of market dislocation (eg tighter spreads and more consistent pricing were reportedly offered in the aftermath of the CHF float in January 2015).
Additional perspective can be obtained by reviewing the role of different market participants in supplying liquidity to the CAD market. Here, dealers play a fundamental role in providing liquidity for the spot, forward and swap markets, while futures are widely and actively traded in international money markets through foreign accounts. The Bank of Canada reports that the end users of FX liquidity (corporations, institutional investors, retail and commercial accounts) appear to be less concerned about liquidity than many other dealers trading the currency. They have had to adapt their trading behaviour to the new market structure (eg through the increased use of algorithmic order execution and transaction cost analysis (TCA)) but, for the most part, appear to be managing their business without disruption or undue costs. In the CAD market, end users would also not be especially affected by occasional one-off liquidity events but would likely be more affected if there were to be sustained market stress.
As is the case with other widely traded currencies, CAD liquidity in normal times is reported to have declined in recent years. The large Canadian banks and dealers – the sell side – are the main market-makers in the CAD for domestic accounts. They may act more as agents, however, in sourcing local demand for other currencies, such as the EUR and JPY, by accessing the liquidity of large global banks. For currency flows generated within Canada, the buy side – end-user accounts among both leveraged and unleveraged market participants38 – does not actively provide direct liquidity in the CAD though market-making. However, these accounts do provide liquidity passively by leaving off-market orders at sell-side banks and dealers. These resting bids and offers on dealers’ order boards are then encompassed by the dealers’ market-making activity, for example, by providing an offset to the dealers’ other end-user client orders through internalisation. This lack of domestic market-making by buy-side accounts reflects the fact that Canadian banks do not offer prime brokerage in currencies. Some active-trading accounts (such as high-frequency traders (HFTs), commodity trading advisors (CTA), hedge funds, and sophisticated investment managers) are becoming increasingly active in market-making through prime brokerage facilities provided by foreign banks. Almost all of these more sophisticated buy-side accounts that engage in market-making are based outside Canada.
Large global banks account for the majority of flows provided by foreign participants in the CAD market. These participants differ from Canadian dealers since
38 Real money end-user accounts would primarily encompass such market participants as pension
funds, insurance companies, mutual funds and endowments. Leveraged money end-user accounts would primarily encompass hedge funds, proprietary traders such as CTAs and HFT accounts. However, with the ongoing market structure evolution in currency markets, the distinctions between “buy-side” and “sell-side” accounts is becoming less distinct, especially as it concerns leveraged end-user accounts, who occasionally may serve as a liquidity source for dealers and act as “alternative liquidity providers”.

18 BIS Papers No 90
the end-user client list for large foreign dealers is typically more oriented to foreign-based accounts. While many Canadian banks are growing their presence in foreign markets, their market share in these markets does not yet compare with that of the large foreign dealers.
While Canadian banks are still the dominant liquidity suppliers (market-makers) for domestic end-user accounts’ currency needs in CAD, foreign dealers have made inroads among the largest domestic accounts, both corporate and investment managers. Large foreign dealers typically have well developed electronic proprietary trading platforms as well as prime brokerage facilities. These delivery mechanisms appeal to sophisticated trading accounts. Accordingly, foreign dealers account for the majority of flows sourced by active trading accounts, such as hedge funds and HFTs. Canadian banks are actively expanding their electronic trading platforms, but these are typically used by more passive domestic accounts. Foreign dealers are an important channel for domestic Canadian dealers to manage their foreign currency exposures. The domestic interbank market (ie direct transactions between Canadian-based banks) is much smaller than the interbank flows between Canadian and foreign banks.
2. Internalisation, concentration and FX liquidity
Market participants have highlighted a number of developments that have affected the provision of FX liquidity. One is a shift in the business models of some banks, which have reduced their role as principals directly providing liquidity, and increased their activities as agents searching for liquidity on behalf of their clients, particularly by matching clients with offsetting positions. Another move, favoured mainly by the largest banks, is to internalise client flows, often using their own electronic trading platforms. As much as 30% of FX volume is reportedly internalised, across all instruments, and internalisation can reach levels of over 90% for large dealers.39
The internal FX markets of large banks feature several noteworthy characteristics. First, large banks act as principals in these internal markets, although they may manage risks by matching the client position with that of another counterparty after holding the position for some time. Second, in some cases these internal FX markets are quite large. A leading bank dealer reports that the internal liquidity book can be as big as the turnover of a major FX trading platform. Third, liquidity conditions in these internal markets are reportedly quite favourable, as banks are able to quote tight bid-ask spreads. Furthermore, a recent analysis by a large bank dealer indicates that liquidity is higher in the bank’s own internal market than in the external FX market. In particular, one large bank notes that the price impact of FX trade execution in its internal market is smaller and less persistent than in the open FX market
These observations lead to two possible interpretations. One is that that liquidity is more costly to access in the external FX market than in the internal markets of large bank dealers. Internalisation may facilitate market execution and the management of risks, potentially improving liquidity for end users. Acting as principals, the larger dealers are better able to provide liquidity in their internal market and price it in a way that reduces price impact. Bank dealers may also aggregate across various heterogeneous liquidity pools, by region and platform clientele, to provide access to liquidity that clients might lack on their own. Some market participants indicate that
39 Moore et al (2016) find that internalisation ratios average 63% of spot transactions and about 40%
for both outright forwards and FX swaps.

BIS Papers No 90 19
this has led to a change in the market landscape: smaller banks have become the customers of major money centre banks and are relying on these large dealers or their platforms for liquidity because it is cheaper than in the external FX market. Large banks may also attract customers by offering the use of liquidity-seeking execution algorithms. While a one-off risk transfer price for the entire order size may be more expensive, clients also have the option of serial execution of smaller orders being run by an algorithm. Some platforms are now offering such algorithms too.
Another interpretation is that banks internalise mainly when the imbalance in order flows is small, matching buy and sell orders to the degree possible and then sending the remaining orders to the external market. These external orders are more directional and have more of an impact on market pricing and liquidity. In addition, there is some evidence that banks do not internalise as much or at all when prices are volatile. These factors taken together may explain why we observe greater illiquidity for those trades that are executed in the external market. This raises the question of whether market liquidity conditions would be improved if all orders went to an external market that is not as fragmented as today’s marketplace.
More comprehensive data are needed to fully assess the implications of internalisation for liquidity. In particular, a further comparison of the internal FX markets operated by the largest banks and the broader FX market would be of interest. Moreover, there is also the issue that internalisation implies less overall transparency. The changing participation of bank dealers in FX markets is also relevant, as the existing data give a mixed picture.40
3. Technology, FX market fragmentation and liquidity
Technology plays a large role in FX trading and has had a large impact on FX markets and their structure. According to the 2016 BIS Triennial Survey, the share of electronic trading in FX markets is around 55%. In some of the largest financial institutions, the reliance on electronic trading is even higher, with an almost complete shift to electronic trading. For example, one large bank dealer reported that 97% of its trades are done electronically.
Technology has contributed to increasing fragmentation of FX markets by lowering transaction costs and facilitating the creation of new FX trading venues. This is indicated by the decline in the share of traditional FX platforms (EBS and Reuters) in overall spot FX turnover (from around 26% in 2007 to 13% in 2014), the proliferation of trading venues and the internalisation discussed previously.41
Fragmentation creates some obstacles for market participants, as they have to seek counterparties and liquidity in different trading venues. Fragmentation may also exacerbate market illiquidity during stress episodes. Market participants noted that clients often move away from traditional platforms during normal times in search of better execution, then return during periods of market volatility.
40 On the one hand, Triennial Survey data indicate that turnover by reporting dealers increased between
2013 and 2016 even as turnover by other financial institutions fell (reversing the earlier trend). On the other hand, the share of trading by the top five bank dealers has declined from over 60% of FX turnover in 2014 to 45% in 2016.
41 One factor which contributed to this decline has been the levelling-off of HFT, as EBS and other platforms introduced “speed bumps” in the form of latency floors. See Moore et al (2016) for further details.
20 BIS Papers No 90
While technology has also offset the adverse effects of fragmentation on liquidity (see Box 1), market participant views differ on whether this offset is complete.42 This may change over time, if technology and competition further improve liquidity provision in the overall FX market.
Market participants note that, while technology has been supportive of liquidity to some degree, the risk remains of “air pockets” (periods when trades cannot be executed due to market volatility). During these episodes, algorithmic trading might exacerbate volatility for several reasons. One is that with fewer traders relying more heavily on algorithms, the market may tend to move in the same direction. In this setting, sudden FX moves might be amplified, increasing volatility. Another widely cited reason is the so-called kill switch: during periods of high volatility, algorithmic trading may stop, which then dries up liquidity. Dealers reportedly resort to the
42 One bank suggested that, as fragmentation does not appear to have changed the number of people
who want to buy and sell, connecting them differently does not necessarily have a big effect on liquidity. As multiple venues try to aggregate liquidity across different platforms, liquidity in traditional central limit order books (such as those of Reuters and EBS) declines. However, additional liquidity pools arise to offset declines in liquidity elsewhere. In contrast, another bank suggested that the Volcker rule (and other regulatory changes) has reduced market liquidity due to restrictions on proprietary trading among banks that traditionally provided liquidity.
Box 1
The impact of technological innovation on liquidity provision in fragmented FX markets
Market participants cite several ways in which technological innovation has improved market liquidity:
Facilitating greater access to data and liquidity by market participants across different venues.
Reducing the costs associated with trade execution.
Increased access for liquidity providers and users. Whereas earlier applications of technology were used to facilitate high-frequency training that could enhance arbitrage through greater speed, investment in electronic trading has more recently been aimed at supporting better transfer of liquidity from one venue to another.
Greater heterogeneity in market participants facilitated by electronic trading. Different providers offer a variety of options and can lower costs, increase workflow (including custom-tailored) solutions, or offer different ways to access liquidity as innovations in single-dealer and multi-dealer execution capabilities have reconnected liquidity providers and liquidity takers. Two changes that offer greater transparency, better price formation and better execution are the shift to multi-dealer platforms and the emergence of new bilateral trading protocols (eg streaming, API trading, midpoint matching, new lit and non-lit trading venues etc). Barriers to entry for non-bank providers of liquidity (such as HFTs) have also fallen as a result of the development of these various new entry points.
Spread of technology to Latin American currency markets. This is also occurring, but at a slower pace. Market participants report that, while most of the trading on electronic platforms occurs in the inter-dealer market, some offshore banks have begun to offer electronic trading platforms for clients. The shift to electronic trading and the use of chats in onshore markets contribute to lower bid-ask spreads as clients can compare multiple price quotes instantaneously, which is perceived by market participants as having increased competition between banks. For example, Mexico’s electronic trading systems at the interbank and bank-to-client levels have significantly reduced bid-ask spreads and improved liquidity. However, trading in Latin American currencies is still generally bifurcated between onshore and offshore market centres, so that market liquidity remains somewhat fragmented. In Brazil, it was reported that technology creates greater price transparency and less counterparty risk.

BIS Papers No 90 21
primary market as algorithmic traders go dark. This appears to describe recent flash crashes in which the GBP and ZAR suddenly collapsed.43 In such episodes, traditional inter-dealer electronic trading venues can provide a crucial backstop.
To sum up, technology appears to have affected FX market liquidity in several ways. There has been slower growth in FX turnover by reporting dealers compared with other financial institutions. One possible reason for this slower growth was that HFTs and non-bank market makers had a technology advantage over major banks that allowed them to capture a larger share of the market. However, this trend reversed in 2013–16 as reporting dealers electronified their practices, lowering execution costs, creating more trades and generating natural growth in their business. Internalisation of client flows facilitated by the use of technology has lowered trading costs but may also have contributed to illiquidity in the external market. While traditional trading platforms are still the main source of price discovery, market fragmentation has increased and these platforms have seen a decline in volume due to the rise of additional competing venues for trade execution. Technological innovation has served to drive greater fragmentation of market liquidity through the rise of additional platforms, but has also paradoxically offered market participants ways to access liquidity from those competing platforms. Finally, recurrent bouts of market volatility have raised questions about the extent to which liquidity providers are available to dampen such episodes, and how well FX markets respond to shocks.44 The answers to these questions are not yet completely clear.
4. The role of regulation
As noted earlier, global regulatory reforms have sought to limit risk-taking by banks, by reducing the incentive for dealers to warehouse risk on their balance sheets or by curtailing the role of proprietary trading. Related to this point is a change in attitude in banks and fear of legal action after the FX benchmark scandal.
While market participants and central banks generally cite global regulation as another factor that has influenced developments in FX markets and liquidity, its role requires further study. On the one hand, a case could be made that global regulation contributed to a relative decline in the share of traditional bank dealers (relative to other financial institutions) in FX market turnover since 2004 (partly reversed in recent years). On the other hand, there are several questions about the extent of the impact of regulation in FX as opposed to its effect in other financial markets. First, as noted earlier, large banks are reportedly able to act as principals in the FX market, even for trades they internalise, because the increased costs of warehousing FX risk associated with regulation (particularly in the FX spot market) are said to be relatively limited.45 This may be because the risks associated with very liquid FX positions (which may be held for minutes) are smaller than those related to positions in less liquid instruments
43 Nguyen (2016).
44 Some of the structural changes impacting the FX market have been seen in other markets, with similar effects in terms of liquidity dynamics and the occasional liquidity event. They first appeared in equity markets before making their way into FX, and more recently fixed income markets. Exchange-traded products (eg commodity futures) have also been affected.
45 Fender and Lewrick (2015) provide a framework that helps clarify the costs of warehousing risk, applied to fixed income markets.

22 BIS Papers No 90
such as bonds, which generally take much longer to close.46 Second, the relative decline in the role of large bank dealers in FX markets began before the GFC, and this trend has partly reversed in spite of regulatory changes implemented after the crisis. One possible explanation for this pattern is that banks have recently caught up with their non-bank competitors by heavily investing in electronic and algorithmic trading, which has significantly lowered their costs and allowed them to increase their activity, notably in their internal FX markets.
B. Latin American currencies
Structural changes in global FX markets, as well as certain market characteristics, may significantly affect liquidity in Latin American FX markets. First, data from the Triennial Survey show a shift away from banks to other financial institutions in global FX markets since 2007. Even though the data from the most recent survey show a drop in turnover at other financial institutions from 2013 to 2016, their share of total turnover has remained stable and well above the share of reporting dealers. Broadly in line with this, there has been a shift away from banks towards capital markets in cross-border financing.47 This shift would contribute to changes in investment strategies affecting Latin American FX markets. In some cases (eg carry trades), these would tend to shift the supply of foreign currency (with implications for FX liquidity) away from spot FX markets towards FX derivatives markets. In other cases (eg foreign acquisition of domestic government bonds), they may have increased hedging in FX derivatives markets (ie demand for FX) to a larger extent than in the past.
Second, the provision of FX in spot or derivatives markets by domestic residents holding large amounts of foreign assets (eg pension funds or insurance companies) and the central banks may have mitigated the impact of shocks to liquidity in global FX markets to some extent.
Third, offshore-onshore FX market segmentation would tend, on balance, to reduce FX liquidity in Latin American currencies as compared with that in more integrated FX markets.
1. Reduced role of banks and foreign currency supply in Latin American FX markets
The BIS Triennial Surveys (Graph 7, right-hand panel) reveal that, particularly since the GFC, and as in the cases of the USD and CAD, the growth of FX turnover in Latin American currencies by reporting dealers (traditional market-makers) has tended to
46 It may also be noted that continued deviations from the covered interest parity (CIP) observed for
several countries suggest that, in recent years, other factors may also have reduced the willingness of banks to warehouse risk. For example, Caruana (2016) notes that recent deviations from CIP have been large enough for banks to cover the cost of equity implied by regulation and engage in arbitrage trades, so that the discrepancy cannot be fully explained by regulation. Furthermore, many banks hold capital well above the regulatory requirements, so that regulation does not explain why they do not engage in these arbitrage trades. Shin (2016) suggests that one explanation is the behaviour of the dollar, which influences the appetite for leverage and risk-taking. When the dollar is strong, banks’ risk appetite is subdued and market anomalies, such as the breakdown of CIP, become more pronounced. The reason is that banks have significant liabilities denominated in dollars, so that an appreciation of the dollar is likely to constrain banks’ funding.
47 For example, see Turner (2013) and McCauley et al (2015).

BIS Papers No 90 23
lag that of other financial institutions. Among the Latin American currencies (Graph A3), the increased role of other financial institutions is particularly apparent for the BRL, COP and MXN, and is also seen in the CLP and PEN, but not in the ARS. However, between 2013 and 2016, turnover for Latin American currencies as a whole tended to decline in all groups, particularly for other financial institutions in the BRL and MXN. Nevertheless, turnover by institutional investors (not shown, part of the other financial institutions category) has continued to increase. Table A2 shows that the share of other financial institutions and its components in total Latin American currencies is comparable with that of global currencies.
Central banks highlight the importance of cross-border financing for liquidity in Latin American FX markets.48 Particularly, the offshore sector is regarded as a key provider of foreign currency in these markets. For example, in the MXN, offshore markets are usually suppliers of foreign currency and they are strongly linked to the onshore market since a big number of international banks have branches or subsidiaries in Mexico. In the offshore market, investment firms seeking to increase investments in local assets have been important buyers of MXN. Latin American firms (eg in Peru) also issue bonds directly in offshore markets. However, the implications for supply and liquidity in FX spot and derivatives markets depend on the investors and type of investment strategy. These conclusions appear to be less applicable to the ARS and PEN FX markets. In the ARS market, local exporters and importers account for the bulk of FX transactions. This characteristic contrasts with FX markets in other countries, which are driven largely by the position-taking of foreign and domestic investors. However, since changes were introduced starting in December 2015, the role of foreign participants in FX markets has begun to increase, reflecting activity related to portfolio investments. In the PEN market, banks typically buy and sell foreign currency in the FX spot and forward markets. In some cases, net exporters (eg mining companies) usually sell foreign currency.
To illustrate, consider first the case in which cross-border financing is in the form of bank loans in foreign currency. By extending a foreign currency loan, a global bank would supply foreign currency to the FX spot market, which the domestic resident may hedge by demanding FX (taking a USD long position) in the FX derivatives market. However, if non-banks play a larger role in cross-border financing, the supply of foreign currency and the impact on FX liquidity may change. We consider the cases of carry trades and foreign acquisition of domestic bonds, which have been popular portfolio investment strategies.
i. Carry trades (often implemented by hedge funds) would shift foreign currency provision from spot to FX forward markets. If MXN is the destination currency, market intelligence indicates that foreign investors would usually buy MXN spot, then implement an FX swap selling MXN spot and buying MXN forward. Here FX supply in the spot market is unchanged (the spot transactions cancel out), but foreign investors commit to supply USD in the FX derivatives market, as a result of their USD short/MXN long position. In the case of a carry trade, this position would be unhedged (there is no offsetting demand for foreign currency) and of
48 For example, in Argentina, commercial transactions played the major role in the FX markets until
2015. However, capital market and financial operations have increased since December 2015, increasing liquidity. In Colombia, difficulties in accessing credit lines could affect financial stability, funding liquidity and the possibility of hedging a long USD position in the derivatives market. Finally, in Peru FX liquidity is increased because local corporates can issue bonds directly in the international market.

24 BIS Papers No 90
very short maturity, thus implying rollover risks. The situation is quite different if the BRL is the destination currency, as market intelligence suggests that foreign investors supply USD in the offshore NDF market. BRL carry trades are reportedly implemented offshore, in non-deliverable forward FX markets. Offshore, foreign residents take a USD short (ie BRL long position). Since the transaction is a non-deliverable forward, the investor receives a payment if the BRL appreciates by less than the interest rate differential, and pays the counterparty if the BRL depreciates by more than the differential. Foreign banks operating in Brazil are the main counterparties, taking a USD long position and typically hedging their BRL exposure in offshore NDFs by taking a short position in (non-deliverable) USD futures at BM&F Bovespa, which are settled in BRL. If the position is fully hedged, onshore liquidity in the FX market is thus not immediately affected. As carry trades cannot be directly identified from available data, these comments are based on questionnaire responses for the present study, or market intelligence obtained by central banks for an earlier report.49 In Chile, restrictions limit direct foreign resident participation in the FX spot market as well as in the domestic bond markets.50 However, foreign resident participation in the offshore NDF market settled in USD has recently increased.
ii. Purchases of domestic bonds by foreign investors would imply the provision of foreign currency in the FX spot markets, but could also imply more hedging (or demand for foreign currency) in FX derivatives markets than in the past, at least for some of the more liquid FX markets. Recent data (from the IIF) indicate that, between January 2007 and June 2016, the share of foreign resident holdings of domestic sovereign bonds increased from around 2% to almost 20% in Colombia and Brazil, from 8% to 34% in Mexico, and from 22% to 42% in Peru. These investments are reportedly implemented mainly by real-money investors, who supply USD in the spot market (eg offshore in the case of MXN) in order to acquire domestic bonds. These investors may then seek USD (by taking a long USD position) in the derivatives market if they wish to hedge the resulting FX risk. However, the demand for USD hedges may exceed the FX risk from holding domestic government bonds, for two reasons. One is that foreign investors may overhedge in the FX market to cover the interest rate risk, in order to take into account the illiquidity sometimes observed in some parts of the Latin American bond markets and the shallowness of interest rate derivatives markets in the region, with the exception of Brazil (see Table A1).51 Another reason which applies to liquid currencies, such as the MXN, is so-called proxy hedging. Investors holding positions in less liquid emerging market economy currencies which are more costly or difficult to hedge, and which are correlated with the MXN, may hedge these positions by shorting the MXN against the USD instead.52 In these examples, overhedging (in all Latin American currencies except perhaps the BRL, which has a large interest rate derivatives market) would tend to reduce USD
49 See BIS (2015).
50 In Chile, foreigners cannot participate directly in the spot market by buying CLP, as they cannot take any CLP assets or earnings out of the country. Foreign investors use the USD to invest in CLP deposits and on maturity exchange the CLP for USD to withdraw their investment from the country.
51 Trade in the local interest rate swap (“swap promedio cámara”) in Chile has grown, having risen to an average of around US$ 350 million compared with an average of US$ 200 million in the past.
52 Short-term investors and speculators have supplied MXN forward to implement this type of transaction.

BIS Papers No 90 25
liquidity in the FX derivatives market, exceeding the amount of liquidity directly provided by foreign residents in FX spot markets. The effect would be larger for liquid currencies such as the MXN, in particular, due to proxy hedging, and may be smaller for currencies with less developed FX derivatives markets.
2. Domestic suppliers of foreign currency
A concern raised by structural changes in the global FX market is that the supply of foreign currency from non-residents may fall, reducing liquidity in the FX market. In this setting, the questions of interest are whether domestic suppliers of foreign currency are available for Latin American currencies, who they are, and whether the supply of foreign currency is stable. The answers vary according to the jurisdiction but, for Latin American currencies, the central bank is generally a source of foreign currency and in some jurisdictions private institutional investors also play an important role.
a. Net foreign asset holders
Whether domestic residents supply or demand foreign currency might partly depend on whether they intend to hold net foreign assets (ie positive net international investment positions) as part of their investment strategy. An analysis of balance of payments data for the six Latin American countries included in this study reveals that, in the cases for which data are available, the financial private sector (which includes pension funds and insurance companies) and the monetary authorities have positive net foreign asset holdings. Banks, the non-financial private sector and the government tend to have negative net foreign asset positions.53
b. Private and public suppliers of foreign currency
Domestic residents may find it advantageous to accumulate foreign currency assets, thus draining liquidity from the FX spot markets, as long as the gains from diversification outweigh the opportunity costs of not investing in higher-yielding domestic assets.54 We observe that, if investors who are net foreign asset holders decide to hedge such positions, they typically do so by supplying foreign currency or more precisely by providing cover for FX risk (taking a USD short position) in derivatives markets. The counterparties would be domestic residents who have incurred net external liabilities and hedge their position by going long USD. Alternatively, they could be foreign residents seeking to hedge domestic investments.
Graphs A4 to A6 illustrate positions taken in derivatives markets by different types of investor. We start with the CLP and COP markets, as they illustrate the role of private institutional investors in supplying foreign currency liquidity, and then turn to the BRL, which shows the role played by the central bank.
In the CLP derivatives markets, foreign investors have taken long positions in foreign currency, as have real sector corporations. They demand FX cover presumably to hedge CLP assets or external borrowing, respectively. As for non-bank financial
53 In Argentina, net foreign asset positions are negative for other financial institutions and positive for
the non-financial private sector.
54 However, ex ante it is not obvious whether they would do so during periods when external financing conditions are easy (when domestic returns are relatively higher, so foreign assets are relatively expensive), or when external financing conditions are tight (foreign assets are cheap).

26 BIS Papers No 90
institutions, including pension funds and insurance companies, they have hedged the FX exposure from their accumulated foreign asset positions by taking a USD short position in the forward market. They thus provide cover for FX risk (see Graph A4).55
Graph A5 reveals that, in the COP FX derivatives market, foreign residents take USD long positions and pension funds take USD short positions, providing cover for USD risk in that market. There is some evidence that pension funds moderate the volume traded in the FX market as they take into account the impact of their transactions in the market, thus playing a stabilising role.56 Graph A6 shows that, in Brazil, both domestic and foreign institutional investors, and banks have taken long USD positions, in effect taking hedges against BRL depreciation. The counterparty providing the hedges has been the Central Bank of Brazil, which has recently used an instrument known as the swap cambial. This instrument allows the central bank to take a USD short position and pay counterparties when the BRL depreciates. Since settlement in the Brazilian derivatives markets is in local currency, the intervention does not directly increase the supply of USD but is likely to reduce the demand for USD.57 The graph shows that, after the central bank stopped issuing new swap cambial, the position remained stable for an extended period in 2015. However, the position has been reduced significantly following the rebound of the BRL since early 2016 as the central bank took measures to reduce its exposure. This pattern suggests that hedges against FX depreciation may be more easily closed out during periods of appreciation.
To sum up, the private sector in Latin America plays an important role in supplying foreign currency for some currencies. For the CLP and COP FX markets, the data show that private non-bank financial investors (pension funds and, in Chile, also insurance companies) have been major providers of hedges in FX derivatives markets. In Chile, pension funds have in some cases stabilised markets during episodes of stress and local currency depreciation by repatriating offshore investments in foreign currency.58 In Brazil, however, the central bank plays the major role in providing such FX hedges. The next section highlights key features of the role of the central bank as a foreign currency supplier or provider of FX hedges.59
c. Role of central bank as supplier of foreign currency
Under floating exchange rate regimes, the supply of foreign currency and market liquidity are generally determined by the private sector, as central bank FX intervention tends to be limited. While some central banks in the Americas region (eg Canada) have not intervened in years, Latin American central banks do so to achieve
55 As pension funds have liabilities in domestic currency, they are required by regulation to hedge their
net foreign asset positions. See Avalos and Moreno (2013).
56 Vargas and Betancourt (2005).
57 Kohlscheen and Andrade (2014).
58 Foreign investors have also reportedly expanded their short forward positions in the CLP and MXN, either with hedging or speculative objectives, during periods of excess market volatility.
59 In the MXN onshore market, the foreign and domestic banks are the main suppliers of foreign currency. Until February 2016, the Bank of Mexico was also a net seller of US dollars in the spot FX market. Local banks use MXN derivative instruments frequently in order to hedge FX funding risks back into Mexican pesos. The importance and activity level of pension funds in the Mexican FX market has grown in recent years, especially in forward (and also spot) markets.

BIS Papers No 90 27
monetary policy and, at times, financial stability goals. There are some implications of this activity for FX market liquidity:60
Central bank intervention has in some instances served to offset changes in foreign currency availability. Most Latin American central banks have intervened in FX markets in some way over the past decade. During periods of domestic currency appreciation pressures, some central banks have entered the FX market to accumulate foreign reserves. During periods of depreciation pressures (notably in the aftermath of the Lehman bankruptcy), they have sometimes supplied foreign currency in the FX markets.
Non-discretionary intervention has limited the amount of foreign currency supplied, economising on FX reserves. Some central banks (eg in Argentina, Brazil, and Peru) have used discretionary intervention. Others have implemented pre-announced, rules-based intervention (non-discretionary) to reassure market participants that the exchange rate is not being targeted and that the amount of foreign reserves deployed or the quasi-fiscal cost will be limited. We note that, recently, FX traders appear to have devised ways of exploiting rules-based intervention in the MXN, prompting the Bank of Mexico to end rules-based intervention in favour of discretionary, undisclosed intervention.
The use of non-deliverable derivative instruments settled in local currency also economises on foreign currency supplied by the central bank, but may nonetheless stabilise liquidity conditions in the FX market by reducing foreign currency demand. At all the six Latin American central banks, a set of FX operations involves the use of deliverable instruments (eg spot trades, FX repos or swap lines) that entail the exchange of foreign currency. However, the Central Bank of Brazil and the Reserve Bank of Peru also influence liquidity in the FX derivatives market (without actually supplying USD through intervention in the FX spot market) by influencing the demand for foreign currency.61 For example, the Central Bank of Brazil has used the swap cambial, which is non-deliverable and settled in BRL.
Additional perspective on central bank operations in the FX market, based on information from members of the study group, is provided in Annex B.
3. Onshore-offshore market integration
FX market liquidity is also affected by onshore-offshore market integration. An increasing proportion of FX trading in Latin American currencies is taking place offshore, following a trend observed for some years now in both advanced and EME currencies (Graph 8). In Latin America, offshore transactions account for about 74% of OTC FX market turnover, close to the average for the United States and Canada, and for central and eastern Europe (Table A3). Global factors, such as the increasing share of electronic trading, have encouraged trading in major FX markets as opposed to onshore markets. Restrictions on foreign access to onshore FX markets have also encouraged migration to offshore markets.
Market participants have expressed concern that such measures reduce FX market liquidity by restricting cross-border flows of FX, although evidence is mixed.
60 See Domanski et al (2016). 61 See Kohlscheen and Andrade (2014).

28 BIS Papers No 90
On the one hand, according to a widely used financial openness index by Chinn and Ito (2006), several jurisdictions show a high degree of financial openness in the Americas region, notably Canada, Mexico and the United States, but also Chile and Peru. However, financial openness is lower in some other jurisdictions, such as Argentina and Brazil.62
On the other hand, the financial openness index is based on restrictions reported to the IMF that apply to categories defined in the financial account of the balance of payments.63 It may not fully capture other restrictions (possibly reflecting financial or market stability objectives) that may reduce FX liquidity. These include:
Restrictions that may lower currency convertibility and limit the flow of liquidity between onshore and offshore markets. For example, in Brazil, onshore and offshore bank positions cannot be netted out for the purposes of capital allocation. Furthermore, high costs (including occasional taxes on derivatives positions) reduce incentives for foreign banks to hedge offshore BRL exposure by taking a position in the onshore derivatives markets. Partly as a result, for tenors of longer than one year, there is a wide spread between the onshore bond yield and the implied yield on a BRL forward contract quoted in offshore OTC markets.
Prudential regulations or restrictions that affect participation in the FX market. A number of central banks noted that the scope for market-making had been reduced as a result of global bank regulation such as increased capital
62 It should be noted that, since December 2015, the Central Bank of Argentina has adopted a series of
monetary and exchange rate policies. With regard specifically to foreign exchange market regulations, revisions in the exchange rate policy were oriented toward greater freedom in the movement of capital.
63 See IMF (2015).
FX market share of offshore trade over total turnover1
In per cent Graph 8
1 Average OTC market turnover in April. Offshore trade defined as that executed outside the jurisdiction where a currency is issued. It is the total trade in the currencies taken into consideration adjusted for local and cross-border inter-dealer double-counting (ie “net-net” basis) minus the onshore trade of these currencies on a net-gross basis. Onshore trades includes onshore-onshore and onshore-offshore trades. 2 Latin American currencies: ARS, BRL, CLP, COP, MXN, PEN. 3 Emerging Asian currencies: INR, HKD, SGD, KRW, MYR, THB, IDR, PHP and CNY. 4 Central and eastern European currencies: CZK, HUF, PLN, RUB, TRY.
Sources: Triennial Central Bank Survey; BIS calculations.
70
60
50
40
30
2020162013201020072004
Latin America2 US dollar and Canadian dollar Emerging Asia3 Central and eastern Europe4

BIS Papers No 90 29
requirements (eg Brazil, Colombia). This affected both spot and derivatives markets. In Chile, the implementation of the Volcker rule in US markets lowered forward trades by non-residents US investors (their share fell from 36% to 20%). However, trades by residents of Canada and the United Kingdom increased. In Peru, some local banks cut back their forward business with non-residents after the Dodd-Frank reform came into force because of the requirement that such business be registered with the DTCC. In Colombia, banks, financial corporations, commercial finance companies and financial cooperatives should have an amount of capital equal to or above the minimum required by regulation to intermediate foreign currency in the spot and derivatives market. Brokerage firms are not allowed to supply derivatives contracts, unless settlement is via a central counterparty. In Argentina, all foreign exchange transactions must be settled through the local foreign exchange market (MULC) at the exchange rates offered by authorised entities (banks, other financial entities and exchange entities). In Brazil, IOF taxes implemented during 2010 on foreign inflows to the domestic fixed income market and a long history of regulatory restrictions on capital flows stimulated the development of the very liquid offshore NDF market in BRL. In Peru, legal reserve requirements for derivatives in the local market have reduced the volume of transactions. Another change in regulation in Peru was the introduction of an income tax on profits from operations with derivatives under 60 days between a local bank and non-residents, which reduced transactions.
Restrictions or practices that affect public sector participation in the FX market. For example, in Mexico, the federal government and Pemex, the national oil company, need to regularly exchange USD for MXN so that the company can meet its tax obligations but they are required to implement FX transactions directly with the central bank.64 As a result, while the impact of these operations on the central bank’s balance sheet is large, the participation of the public sector in the onshore Mexican FX market is negligible (less than half a percent in January 2015). In Chile, the creation of a sovereign wealth fund that holds assets in foreign currency may also reduce the participation of the public sector in the FX market.
Restrictions on access to spot markets or use of certain derivative instruments. In Brazil, spot market transactions can only be implemented with a bank intermediary. In Chile, foreign resident access to spot markets is restricted. In Colombia, the regulation that prohibits deliverable FX derivatives contracts unless they are for the purpose of hedging in effect implies convertibility restrictions that may reduce liquidity.
Conclusions
The report reaches four main conclusions.
1. Structural changes in FX markets have reduced the usefulness of some conventional FX liquidity metrics. As a result, market participants and central banks emphasise that no single metric can give a complete picture of market
64 See Sidaoui (2005).

30 BIS Papers No 90
liquidity independently. But, in combination, these metrics can give insights into the state of market liquidity.
2. Some metrics suggest that liquidity in FX markets has declined during some recent episodes of market stress, particularly since the CHF float against the EUR of January 2015 or even earlier. While FX markets have continued to function without major disruptions, stresses to the financial system have been relatively limited in recent years, suggesting that how FX markets deal with shocks has not yet been fully tested.
3. Technological innovation has lowered transaction costs, facilitating participation by a wider set of players by increasing the channels for market access. However, technological innovation may also have contributed to market fragmentation by helping highly concentrated large bank dealers to internalise client flows, by contributing to the proliferation of new platforms, and by enabling more non-banks to participate in FX markets. All in all, technology has made possible the use of (algorithmic and high-frequency) trading strategies that are viewed by many market participants as having changed liquidity dynamics – enhancing liquidity in normal conditions and offsetting the impact of market fragmentation, but also adding to FX volatility in stressed market conditions. These elements are particularly evident in global FX markets, including in the USD and CAD, but are also present in Latin American currency markets.
4. The impact of post-crisis regulatory change on FX market liquidity remains unclear and requires further study. In particular, the impact of regulation on bank behaviour to discourage risk-taking in the FX market is uncertain, as the characteristics of FX markets differ from those of other market segments. However, some market participants indicate that other types of recent regulatory development, such as fines and requirements for participants to closely monitor trader behaviour, have reduced incentives for dealers to engage in discretionary trading. Some have suggested that these developments have prompted large bank dealers to shift more of their market-making activity from the open FX market into their own internal markets.

BIS Papers No 90 31
Annex A. Research of participating central banks on FX market liquidity
Central bank work has explored different aspects of market liquidity in specific jurisdictions. The following research may be highlighted.
Central Bank of Brazil. De Oliveira (2004) shows that in periods of high exchange rate volatility (as in the first half of 1999 and the second half of 2002), the central bank increased the foreign exchange hedge, which was used by the financial institutions to reduce their foreign exchange exposure. Magalhães and Peixoto (2016) estimate the effects of central bank interventions on the return and volatility of the BRL’s future exchange rate. They find there is no evidence of decline in exchange rate volatility in the short term after FX interventions. D’Souza (2009) from the Bank of Canada finds that the trading activity of foreign investors is informative about the future path for the FX rate, that dealers are the usual liquidity providers for commercial customers, and that dealers react quickly to demand by selling USD in the spot market, and over time using the forward market to offload the short position.
Central Bank of Chile. Villena and Salinas (2014) compare the Chilean FX market with its international counterparts. They find that Chile presents better spot and derivatives metrics than the average of emerging and Latin American economies.
Bank of the Republic, Colombia. Cardozo et al (2014) analyse the FX derivatives market in Colombia. They conclude that market participation by offshore investors has increased in recent years and has been key to market growth in Colombia. Vargas and Betancourt (2005) find that pressure on the exchange rate is reduced because big investors (such as pension funds) take into account their influence on the exchange rate. Bank of the Republic, Colombia (2015) Annex 1 analyses the evolution of liquidity and volatility in the foreign exchange market in Colombia using different measures.
Central Reserve Bank of Peru. Choy and Cerna (2012) find that derivative-implied (NDF and cross-currency swaps) interest rates are persistently and significantly lower than the central bank policy rate. Choy and Cerna (2014) analyse the behaviour of the Peruvian financial markets before the taper tantrum announcement.
Federal Reserve. Chaboud et al (2014) study the impact of algorithmic trading in the FX market. They find that algorithmic trading causes an improvement in two measures of price efficiency: the frequency of triangular arbitrage opportunities and the autocorrelation of high-frequency returns. They also find evidence consistent with the strategies of algorithmic traders being highly correlated. Schaumburg (2014) focuses on measures of FX market efficiency, the absence of arbitrage opportunities, and the way in which improvements have coincided with significant growth in algorithmic and HFT. Schaumburg and Yang (2015) consider similarities and differences among three major flash events in US equities, EUR/USD and US treasury markets that occurred between May 2010 and March 2015.

32 BIS Papers No 90
Annex B. Role of central bank operations in the FX market
Under floating rate regimes, FX market liquidity is largely determined by the private sector, as central bank FX intervention tends to be limited.65 In the Americas region, however, there has been a significant amount of FX intervention in some jurisdictions, even if most exchange rate regimes are floating. Central banks intervene by buying or selling foreign currencies, or by taking positions in FX derivatives markets, thus adjusting FX liquidity conditions in order to achieve or preserve macroeconomic or financial stability. The choice of intervention instruments and tactics varies considerably. In many countries, intervention takes place in the FX spot market, deliverable derivatives or similar markets (eg spot markets, FX repos or swap lines in Argentina, Brazil, Chile, Colombia, Mexico, Peru and the United States), which directly affects the supply of FX liquidity. Two central banks, however, also intervene in FX derivatives markets using non-deliverable instruments that are settled in local currency (Brazil, Peru), and which tend to affect the demand for FX liquidity, There are also important differences in tactics. For example, FX intervention has largely been rule-based in Chile, Colombia and, until recently, Mexico. However, it has been discretionary in Brazil and Peru. Recent evidence suggests that FX intervention (spot or deliverable derivatives) has a significant impact on FX market liquidity.
In Argentina, until the end of 2015, the central bank followed a managed floating exchange rate regime with daily discretionary intervention in the spot and non-deliverable derivatives markets. Since early 2016, the exchange rate has been allowed to float. Daily interventions were discontinued and replaced with discretionary interventions only to correct significant imbalances or unjustified extreme levels.
In Brazil, FX interventions by the central bank respond to excess demand for FX liquidity using spot FX transactions. Likewise, when larger-than-usual flows are scheduled to be settled in the future (for instance, from a successful IPO), the central bank may conduct a forward transaction for the same settlement date. The intervention is aimed at offsetting the future flow and avoiding the volatility that a pending high-profile transaction would otherwise create. On the other hand, when volatility is caused by shifts in expectation with no major impact on capital flows, this volatility is usually managed with intervention in derivatives markets (swap cambial). Such intervention directly targets the market where price discovery takes place without drawing on the country’s foreign exchange reserves.
The Bank of Canada has not intervened since 1998, in line with its policy of spot intervention only if the market should become dysfunctional. The Bank of Canada has recently agreed to set up currency swap facilities with other major central banks (including the Federal Reserve, Bank of England, ECB and SNB). These swaps would be direct exchanges of Canadian dollars against the domestic currencies of the respective central bank counterparties. However, these swap facilities are unlikely to be used except under extreme market stress (eg shortage of foreign currency causing systemic risk to the domestic banking system).
In Chile, since adopting a floating regime in 1999, the Central Bank of Chile has intervened on four occasions. From August 2001 to December 2002 and from October 2002 to February 2003, the interventions were made though the issuance of USD-denominated instruments. The purpose was to increase the supply of hedging
65 See Domanski et al (2016).

BIS Papers No 90 33
instruments and to improve liquidity in the external currency in a context of currency depreciations worldwide. The third and fourth interventions took place in 2008 and 2011, respectively. The Central Bank of Chile implemented daily USD purchase programmes directly in the spot market. The purpose was to alleviate foreign exchange tensions and increase Chile’s international reserves to match those of other emerging economies. There has been no FX market intervention since.
In Colombia, liquidity in the FX market does not affect the choice of intervention instruments. Instead, the central bank decides which instrument to implement depending on its objective. In October 2015, the central bank announced a system of call option auctions for selling international reserves with the purpose of moderating depreciation in the exchange rate. Call option auctions were triggered on 20 May 2016 as the market exchange rate was higher than its 20-day average plus 3%. The auctions were discontinued on 31 May 2016.
In Mexico, in December 2014, the Mexican Foreign Exchange Commission (FXC) implemented auctions in which USD 200 million was offered with a minimum price equal to the previous day’s fixing plus a premium of 1.5%. In March 2015, in addition to the existing mechanism, the Bank of Mexico began to offer USD 52 million every day via auctions without a minimum price. In July 2015, the amount offered in auctions without a minimum price was raised to USD 200 million, and the premium on the USD auctions with a minimum price was lowered from 1.5% to 1%. Finally, in November 2015, the FXC announced a new mechanism that would complement USD sales with a minimum price. The Bank of Mexico would establish supplementary auctions in which USD 200 million would be offered at a premium of 1.5% over the previous day’s fixing. Overall, the Bank of Mexico sold USD 28.3 billion via these auctions, of which USD 20.7 billion was allotted via auctions without a minimum price and USD 7.6 billion was sold in auctions with a minimum price.66 After ending these auctions in February 2016, the Bank of Mexico intervened directly on 17 February 2016 by selling USD 2 billion to local banks and, on 9 and 10 January 2017, by selling USD 2 billion in total to local and foreign banks. The Bank of Mexico had not previously intervened in the liquid offshore MXN markets. Instead, it used only onshore spot and options interventions to regulate the level of foreign reserves with a minimum impact on trading conditions. However, intervention in offshore markets started in 2017.
In Peru, in recent years, the central bank has intervened by selling USD directly in the FX spot market, by issuing foreign currency indexed certificate of deposits and via FX swaps. The instrument adopted for intervention is conditioned by the objective or target, and not by the liquidity condition of each market. FX swaps, for example, are suitable instruments when intervention is intended to reduce financial stability risks arising from a retrenchment on external financing lines.
In the United States, the Federal Reserve’s participation in FX markets has generally been limited, particularly in recent years. However, there have been off-market transactions such as the creation of Federal Reserve swap lines with foreign central banks, as a means of providing temporary USD liquidity to foreign financial
66 In the first months of 2016, the MXN entered into a sustained depreciating trend against the USD,
going from 17.20 at the end of 2015 to an intraday historical high of 19.44 on 11 February 2016. The auction-based FX intervention mechanism that was being used to sell USD was unable to smooth the adjustment in the exchange rate. Furthermore, the minimum bid levels of the two auctions were acting as a resistance level for the FX market and, as soon as the auctions were executed, the market would break those levels and continue the depreciation.

34 BIS Papers No 90
institutions conducting USD intermediation activity offshore, without assuming credit risk exposure against those institutions. These swap lines were created in the aftermath of the Lehman bankruptcy, in response to large shortages of USD liquidity in global financial markets, notably in FX swap markets, and remain an important tool for central banks in their efforts to promote financial stability.

BIS Papers No 90 35
Annex C. Central bank perspectives on drivers of FX liquidity
Graph 6 shows factors that central banks consider as important drivers of liquidity. Of the eight study group member central banks, seven emphasised the importance of global and local economic factors, six cited global regulatory reforms, while five mentioned local regulatory reforms and technology and infrastructure changes.
Global trade and capital flows affect liquidity and influence trading volumes across the global currency market. However, their role varies for different currencies. For example, the Bank of Canada notes that global economy factors are not in themselves seen as major determinants of market liquidity in the CAD. Instead, global factors affect the normal ebb and flow of CAD trading activity. As for local economic conditions, these are seen as having had a marginal impact on CAD liquidity. For example, the Canadian dollar is often traded as a “petro-currency” by foreign trading accounts and domestic oil production also reflects movement in oil prices. However, the resulting shifts in speculative and hedging activity are seen as part of the normal ebb and flow of business in currency markets.
The Federal Reserve reported that other factors that affect liquidity include conduct-related dismissals. While difficult to quantify, widespread dismissals in the wake of the FX fixing scandals (well beyond those directly involved) have taken some degree of experience out of the market and may have reduced market-making risk appetite.
Central banks in Latin America reported that global factors have affected liquidity in the region, but these effects are more marginal than the market structure factors described in the main report. First, China’s economic performance affects export proceeds in some countries (eg Argentina, Chile and Peru). Second, reduced capital flows affect the spot and derivatives market (eg Brazil). Third, in other countries the drop in commodity prices may have caused a reduction in traded volumes in the FX market and widened bid-ask spreads (eg Colombia and Chile). Particularly in Chile, trading by the mining sector and non-residents tends to increase in the derivatives markets when the CLP is expected to depreciate. Finally, in the MXN market, the transmission of global factors is mainly through changes in perception in the United States and the euro zone.
With respect to local economic factors, some key changes have been highlighted by the central banks. In Argentina, since December 2015, the central bank has been moving towards a regime of inflation targeting, in which the main monetary policy tool is the interest rate, while the money supply is determined endogenously. In Chile, if there is some expectation of CLP depreciation due to monetary policy shocks or change in inflation expectations, FX trading volumes tend to increase, in particular on the part of pension funds in the spot market and non-residents in the derivatives market Also in Colombia, the deterioration in the fiscal position due to the drop in oil prices has impacted FX liquidity negatively. Finally, the Bank of Mexico reported that, except for surprises in monetary policy, local factors tend to have only a limited impact on intraday FX liquidity conditions.
The consensus among all the reporting central banks is that an increase in regulation reduces liquidity. For the MXN, regulation in the United States has increased implied yields, making funding terms less attractive and creating arbitrage opportunities. In Argentina, the easing of regulations in December 2015 resulted in improved liquidity. For the BRL, regulation hinders spot market liquidity while
36 BIS Papers No 90
collateral becomes an incentive for agents to increase their participation in the local exchange (derivatives and registered spot). In Colombia, if foreign financial entities (“FEMIs”) reach the lower liquid foreign exposure regulatory limit established by regulation and they are not able to find hedging in the forward market to offset their FX spot position, then this could affect liquidity in the FX market as the FEMIs have to assume the foreign exchange exposure of their positions. Finally, in Peru, legal reserve requirements related to banks’ FX forwards operations affect local market transaction volumes. On the other hand, the Bank of the Republic, Colombia, reports that the requirement to clear FX spot transactions between FEMIs though the foreign exchange clearing house increases liquidity by reducing credit, legal, liquidity and operational risks.
As for factors related to market structure (Graph A7), most central banks (seven out of eight) cited the concentration and heterogeneity of market participants, as well as regulatory legal requirements, as key aspects that affect FX liquidity. In order of relevance, market fragmentation was reported as an important factor (five out of eight central banks), followed by the shift towards capital markets away from banks and the reduced role of primary dealers in FX markets (four out of eight central banks). Next, the shift from principal to agents, internalisation, trading strategies, market practices and the increased offshore share were considered relevant by four out of eight central banks. Finally, liquidity bifurcation was noted as important by two out of the eight central banks.
The impact of these technology and infrastructure factors on FX liquidity for all currencies was discussed in the main report. However, some additional points can be added. Related to platform fragmentation, in some cases, there is not enough information to assess an effect (eg Argentina, Brazil, Chile and Colombia). However, the development and advent of proprietary platforms, has been reported to increase liquidity in the MXN. Measurement is difficult, however, as information on trades executed on the platforms is not public. The Reserve Bank of Peru noted that banks primarily use the Datatec platform, but they may sometimes use others, such as Reuters or GFI, reducing liquidity.
Only in the case of the COP was it reported that liquidity bifurcation might affect funding liquidity. It was noted that this depends on foreign agents’ willingness to dedicate credit lines to different market segments (eg working capital vs foreign trade). Finally, central banks have cited the increasing share of offshore markets as increasing liquidity in the MXN and BRL. First, for the MXN, the offshore market is the largest emerging market economy FX market. For BRL, the offshore markets direct and channel liquidity to the local exchange.
BIS Papers No 90 37
Annex D. Glossary, ISO codes and acronyms
Glossary
Algorithmic trading. Trading implemented using advanced mathematical models to decide on the timing, price and quantity of a market order. Trades can be made without human intervention using information received electronically. Large trades may be broken down into smaller ones to reduce market impact and risk.
Application programming interface (API). A set of rules and specifications which software programmes follow to communicate with each other; an interface between different software programmes that facilitates their interaction.
Ask price. The best price at which a security can be bought.
Bid price. The best price at which a security can be sold.
Best execution. Obligation on firms to take all sufficient steps to obtain the best possible result for their clients taking into account price, cost, speed, likelihood of execution and settlement, size, nature or any other consideration relevant to execution.
Carry trades. Transactions in which a low-interest funding currency is borrowed to invest in assets in a higher-interest destination currency without hedging for currency risk.
Central limit order book. A list recording the interest of buyers and sellers (bids and offers) in a particular instrument. By observing the order book, one can determine whether the number of bids outweighs the number of offers and use such data to inform a trading strategy.
Central counterparty (CCPs). Entity that interposes itself between the two sides of a transaction, becoming the buyer to every seller and the seller to every buyer.
Core volumes. An approximation of volumes across firm markets that trade more than USD 10 billion on average.
Counterparty. Entity that takes the opposite side of a financial contract or transaction – for example, the borrower in a loan contract, or the buyer in a sales transaction.
Dark pools. Anonymous trading venues where quotes on securities or FX are not displayed publicly and trades are executed anonymously.
Depth. This is a measure of the number of open buy and sell orders for a security or currency at different prices. The depth of market measure provides an indication of the liquidity and depth for that security or currency. The higher the number of buy and sell orders at each price, the higher the depth of the market.
Derivative. Instrument whose value depends on some underlying financial asset, commodity or predefined variable.
Electronic communications network (ECN). Electronic trading system that automatically matches buy and sell orders at specified prices. ECNs include multibank electronic trading platforms (eg Currenex, Hotspot, 360T, FXall).
Electronic broking services (EBS). This is a wholesale electronic trading platform used to trade foreign exchange (FX) with market-making banks. It was originally
38 BIS Papers No 90
created as a partnership by a number of the world's largest banks and is now part of ICAP.67
Fill ratios. The fill is the action completing or satisfying an order for a security or commodity.
Funding liquidity. Having sufficient cash or access to credit on acceptable terms in order to meet obligations without incurring large losses.
FX forwards. Contract between two parties for the delayed delivery of financial instruments or commodities in which the buyer agrees to purchase and the seller agrees to deliver, on an agreed future date, a specified instrument or commodity at an agreed price or yield. Forward contracts are generally not traded on organised exchanges, and their contractual terms are not standardised.
FX options. Contract that gives the holder the right (but not the obligation) to buy or sell foreign exchange at an agreed price during a specified period.
FX swaps. Transaction involving the actual exchange of two currencies (principal amount only) on a specific date at a rate agreed at the time of the conclusion of the contract (the short leg), and a reverse exchange of the same two currencies at a date further in the future at a rate (generally different from the rate applied to the short leg) agreed at the time of the contract (the long leg).
High-frequency trading (HFT). An algorithmic trading strategy that profits from incremental price movements, with frequent, small trades executed in milliseconds for very short investment horizons. HFT is a subset of algorithmic trading.
Institutional investors. Institutional investors such as mutual funds, pension funds, insurance and reinsurance companies and endowments. Primary motives for market participation are to trade FX instruments eg for hedging, investing and risk management purposes. A common label for this counterparty category is “real money investors”.
Internalisation. Process whereby dealers seek to match staggered offsetting client flows on their own book instead of immediately hedging in the inter-dealer market.
Intragroup. Refers to foreign resident transactions with affiliated domestic residents.
Liquidity density. The average amount of visible liquidity per basis point, for a given market or set of markets, in USD equivalent.
Market liquidity. An FX market is liquid if an investor wishing to execute a transaction of a desired size can do so quickly, at a reasonable cost, and without significantly affecting the prevailing market price.
Market-makers. Broker-dealer firm that assumes the risk of holding a certain number of shares of a particular security in order to facilitate the trading of that security. Each market-maker competes for customer order flow by displaying buy and sell quotations for a guaranteed number of shares, and once an order is received from a
67 EBS provides FX trading services, connecting buyers and sellers of currencies in more than 50
countries across six continents. Products include (i) EBS Market, an anonymous matching platform providing price discovery and execution in spot FX, Non-Deliverable Forwards (NDFs) and precious metals; (ii) EBS Direct, providing relationship-based disclosed liquidity, enabling liquidity providers to stream tailored prices direct to liquidity consumers; and (iii) EBS BrokerTec, part of ICAP, a global broker for spot FX (source: EBS).

BIS Papers No 90 39
buyer, the market-maker immediately sells from its own inventory or seeks an offsetting order.
Non-financial institutions. Sectoral classification that refers collectively to non-financial corporations, general government and households.
Onshore trade. Trades executed inside the jurisdiction where a currency is issued. They are classified into an onshore-onshore and onshore-offshore trades.
Offshore trade. Trades executed outside the jurisdiction where a currency is issued, defined as trades executed in exchanges outside the local currency jurisdiction minus onshore trades.
Other financial institutions. Financial institutions that are not classified as reporting dealers in the BIS Triennial Survey. These are typically regarded as foreign exchange and interest rate derivatives market end users. They mainly cover all other financial institutions, such as smaller commercial banks, investment banks and securities houses, and mutual funds, pension funds, hedge funds, currency funds, money market funds, building societies, leasing companies, insurance companies, other financial subsidiaries of corporate firms and central banks.
Price impact metrics. Metric of liquidity in terms of an order’s impact on market price.
Prime brokerage. A service or practice that enables a bank’s customer to conduct foreign exchange transactions in the name of the bank (the prime broker). The prime broker sets up an arrangement that permits the customer to trade directly with dealers in the name of the prime broker. These dealers recognise the prime broker (not the customer) as the counterparty in these trades.
Proprietary trading. When a financial institution trades for direct gain instead of commission.
Proxy hedging. Investors holding positions in less liquid emerging market currencies, which are more costly or difficult to hedge and that are correlated with another more liquid currency, may hedge these positions by shorting the more liquid currency instead.
Reporting dealers. Financial institutions that participate as reporters in the BIS Triennial Survey of foreign exchange and OTC derivatives markets. These are mainly large commercial and investment banks and securities houses that (i) participate in the inter-dealer market and/or (ii) have an active business with large customers, such as large corporate firms, governments and non-reporting financial institutions; in other words, reporting dealers are institutions that actively buy and sell currency and OTC derivatives both for their own account and/or in meeting customer demand.
Short-term cupom cambial. Derivatives-implied onshore USD interest rate for the BRL.
Single-bank (proprietary trading) platform. A platform developed by a bank internally both for in-house use and sometimes for the use of other banks and non-bank clients on a “white label” or prime brokerage basis. These platforms differ from multi-bank dealing systems in that the primary liquidity provider is a single bank.
Spot transaction. Outright transaction involving the exchange of two currencies at a rate agreed on the date of the contract for value or delivery (cash settlement) in two business days or less.

40 BIS Papers No 90
Sweep-to-fill cost. The cost of executing a transaction of a given amount.
Top of book. The best bid and ask prices at any given moment.
Transactions costs analysis (TCA). The study of trade prices to determine whether the trades were arranged at favourable prices – low prices for purchases and high prices for sales.
Turnover. The gross value of all new deals entered into during a given period, which is measured in terms of the nominal or notional amount of the contracts.
ISO currency codes
BRL – Brazilian real
CAD – Canadian dollar
CHF – Swiss franc
CLP – Chilean peso
COP – Colombian peso
EUR – Euro
GBP – Pound sterling
JPY – Japanese yen
MXN – Mexican peso
PEN – Peruvian New sol
USD – United States dollar
Acronyms, abbreviations and other terms
API – application programming interface
BM&F Bovespa – São Paulo Securities, Commodities and Futures Exchange
CCP– clearing counterparties
EBS – electronic broking services
ECN – electronic communications network
FX – foreign exchange
GFC – Great Financial Crisis
HFT – high-frequency trading
NFA – net foreign asset position
NDFs – non-deliverable forwards
OTC – over-the-counter
TCA – transaction cost analysis

BIS Papers No 90 41
Annex E. Graphs and tables
Metrics of liquidity used for policymaking
Number of countries Graph A1
Monetary policy decision FX intervention
Regulatory changes decisions
Source: Responses to a questionnaire submitted to the central banks.
Quantitymetrics
Costmetrics
Liquidity depthmetrics
Price impactmetrics
Quantitymetrics
Costmetrics
Liquidity depthmetrics
Price impactmetrics
Quantitymetrics
Costmetrics
Liquidity depthmetrics
Price impactmetrics
ArgentinaBrazilCanada
ChileColombiaMexico
United StatesPeru

42 BIS Papers No 90
Regional FX market turnover by instrument1
Daily average OTC market turnover in April of each year, in billions of US dollars Graph A2
Argentine peso Brazilian real Chilean peso
Colombian peso Mexican peso Peruvian sol
Adjusted for local and cross-border inter-dealer double-counting (ie “net-net” basis). OTC market.
Sources: Triennial Central Bank Survey; BIS calculations.
0.0
0.4
0.8
1.2
1.6
2004 2007 2010 2013 2016
0
13
26
39
52
2004 2007 2010 2013 2016
0
4
8
12
16
2004 2007 2010 2013 2016
0
2
4
6
8
2004 2007 2010 2013 2016
Spot Outright forwards
0
30
60
90
120
2004 2007 2010 2013 2016
FX swaps Currency swaps
0
1
2
3
4
2004 2007 2010 2013 2016
FX options

BIS Papers No 90 43
Regional FX market turnover by counterparty1
Daily average OTC market turnover in April of each year, in billions of US dollars Graph A3
Argentine peso Brazilian real Chilean peso
Colombian peso Mexican peso Peruvian sol
1 Adjusted for local and cross-border inter-dealer double-counting (ie “net-net” basis). OTC spot and derivatives markets.
Sources: Triennial Central Bank Survey; BIS calculations.
0.00
0.25
0.50
0.75
1.00
2004 2007 2010 2013 2016
0
7
14
21
28
2004 2007 2010 2013 2016
0.0
1.5
3.0
4.5
6.0
2004 2007 2010 2013 2016
0
1
2
3
4
2004 2007 2010 2013 2016
Reporting dealers
0
20
40
60
80
2004 2007 2010 2013 2016
Other financial institutions
0.0
0.4
0.8
1.2
1.6
2004 2007 2010 2013 2016
Non-financial institutions
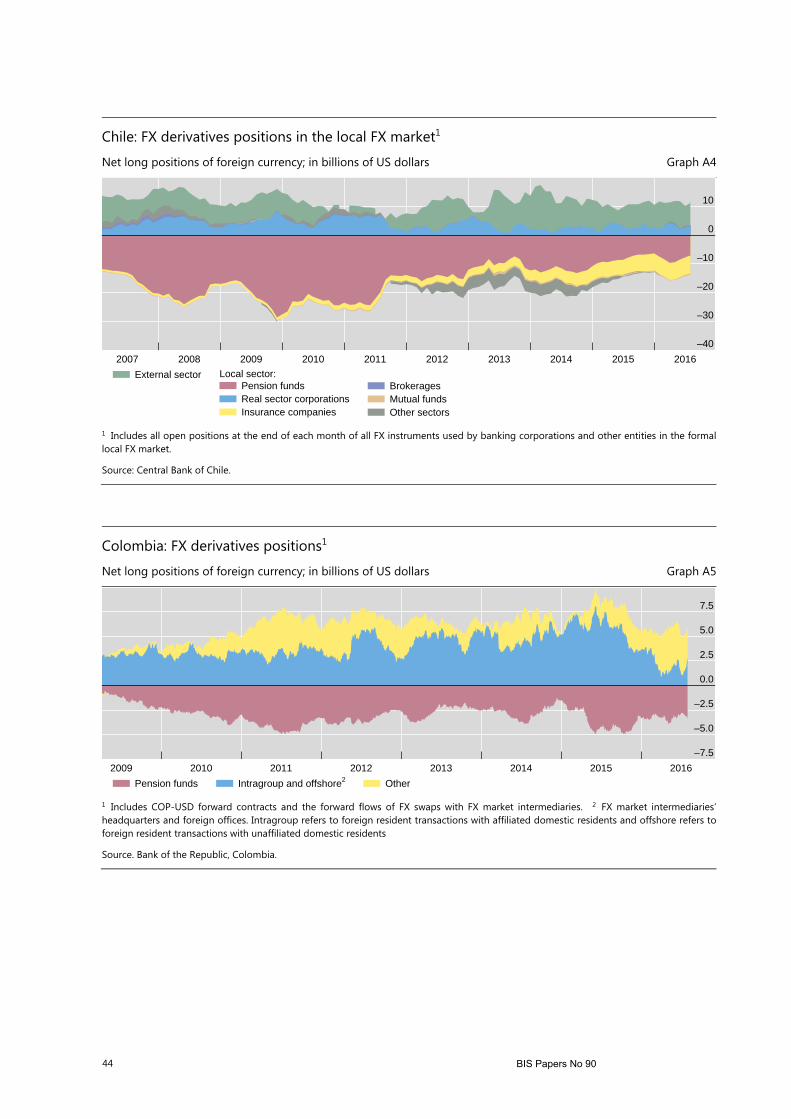
44 BIS Papers No 90
Chile: FX derivatives positions in the local FX market1
Net long positions of foreign currency; in billions of US dollars Graph A4
1 Includes all open positions at the end of each month of all FX instruments used by banking corporations and other entities in the formallocal FX market.
Source: Central Bank of Chile.
Colombia: FX derivatives positions1
Net long positions of foreign currency; in billions of US dollars Graph A5
1 Includes COP-USD forward contracts and the forward flows of FX swaps with FX market intermediaries. 2 FX market intermediaries’ headquarters and foreign offices. Intragroup refers to foreign resident transactions with affiliated domestic residents and offshore refers to foreign resident transactions with unaffiliated domestic residents
Source. Bank of the Republic, Colombia.
–40
–30
–20
–10
0
10
2007 2008 2009 2010 2011 2012 2013 2014 2015 2016
External sectorPension fundsReal sector corporationsInsurance companies
Local sector:BrokeragesMutual fundsOther sectors
–7.5
–5.0
–2.5
0.0
2.5
5.0
7.5
2009 2010 2011 2012 2013 2014 2015 2016
Pension funds Intragroup and offshore2 Other
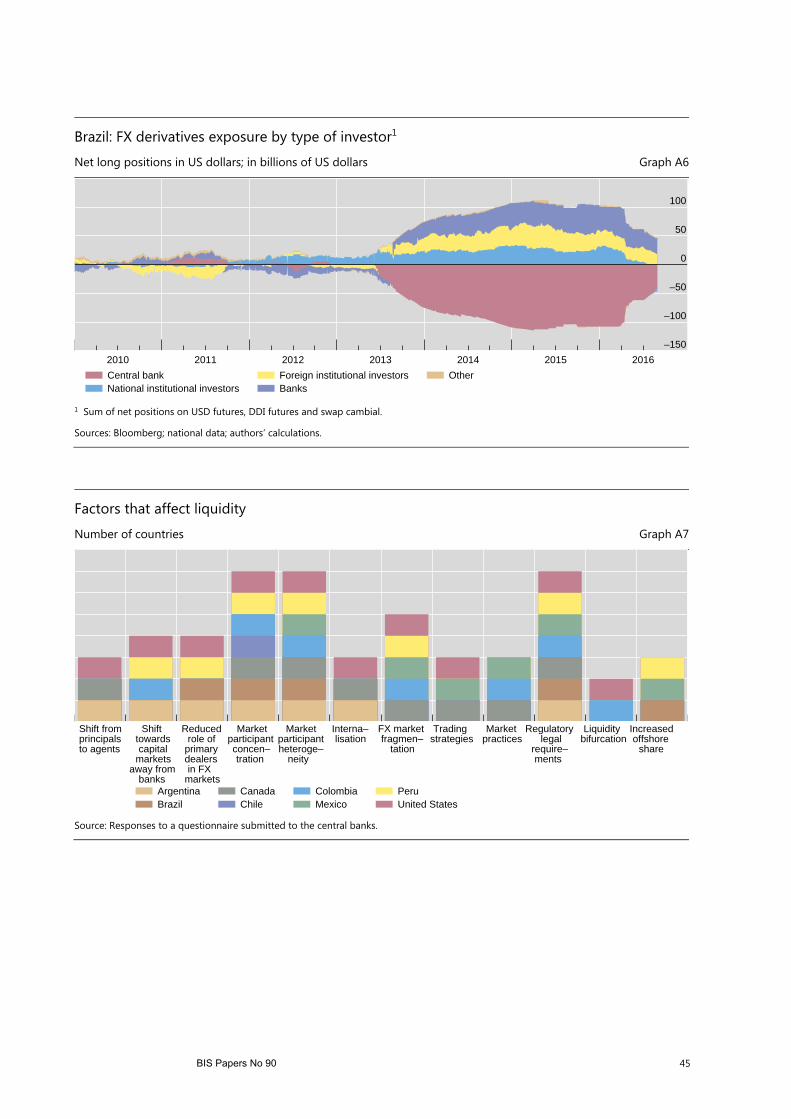
BIS Papers No 90 45
Brazil: FX derivatives exposure by type of investor1
Net long positions in US dollars; in billions of US dollars Graph A6
1 Sum of net positions on USD futures, DDI futures and swap cambial.
Sources: Bloomberg; national data; authors’ calculations.
Factors that affect liquidity
Number of countries Graph A7
Source: Responses to a questionnaire submitted to the central banks.
–150
–100
–50
0
50
100
2010 2011 2012 2013 2014 2015 2016
Central bankNational institutional investors
Foreign institutional investorsBanks
Other
Shift fromprincipalsto agents
Shifttowardscapital
marketsaway from
banks
Reducedrole of
primarydealersin FX
markets
Marketparticipantconcen–tration
Marketparticipantheteroge–
neity
Interna–lisation
FX marketfragmen–
tation
Tradingstrategies
Marketpractices
Regulatorylegal
require–
Liquiditybifurcation
Increasedoffshore
sharements
ArgentinaBrazil
CanadaChile
ColombiaMexico
PeruUnited States

46 BIS Papers No 90
OTC and exchange-traded derivatives by risk category and instrument1
Daily average turnover in April 2016 Table A1
Foreign exchange Interest rate
Total
OTC Exchange-traded
OTC Exchange-traded Spot Outright
forwards FX
swaps Currency
swaps Options
CCA countries 5,012.3 1,556.3 687.4 2,301.0 80.3 246.8 140.5 1,433.0 3,766.3
US dollar 4,547.0 1,385.4 599.8 2,160.2 73.8 218.4 109.4 1,356.6 3,639.3
Canadian dollar 266.4 104.6 34.5 103.1 4.3 14.1 6.0 38.5 86.6
Latin American currencies 198.9 66.3 53.2 37.8 2.2 14.4 25.1 37.9 40.5
Argentine peso 1.9 1.4 0.2 0.3 0.0 0.0 … 0.1 …
Brazilian real 74.0 13.3 27.0 0.5 1.7 8.2 23.3 6.6 40.4
Chilean peso 12.5 4.3 7.2 0.7 0.2 0.1 … 4.2 …
Colombian peso 7.9 2.6 4.9 0.1 0.0 0.2 … 1.4 …
Mexican peso 98.8 43.3 12.0 35.7 0.2 5.9 1.8 25.5 0.0
New sol 3.9 1.5 2.0 0.3 0.1 0.0 … 0.0 …
Shares in per cent
CCA countries 31.0 13.7 45.9 1.6 4.9 2.8 27.6 72.4
US dollar 30.5 13.2 47.5 1.6 4.8 2.4 27.2 72.8
Canadian dollar 39.2 12.9 38.7 1.6 5.3 2.2 30.8 69.2
Latin American currencies 33.3 26.7 19.0 1.1 7.2 12.6 48.3 51.7
Argentine peso 73.0 9.4 17.0 0.0 0.5 … 100.0 …
Brazilian real 18.0 36.5 0.7 2.3 11.1 31.5 14.0 86.0
Chilean peso 34.3 57.6 6.0 1.2 0.9 … 100.0 …
Colombian peso 33.1 62.1 1.8 0.4 2.7 … 100.0 …
Mexican peso 43.8 12.1 36.1 0.2 5.9 1.8 99.9 0.1
New sol 38.5 50.8 7.8 2.7 0.2 … 100.0 … 1 Turnover data. Adjusted for local and cross-border inter-dealer double-counting (ie “net-net” basis). 2 Currencies included are Argentine peso, Brazilian real, Canadian dollar; Chilean peso, Colombian peso, Mexican peso, Peruvian New sol and US dollar.
Sources: Euromoney TRADEDATA; Futures Industry Association; The Options Clearing Corporation; Triennial Central Bank Survey; BIS calculations.

BIS Papers No 90 47
Turnover driven by non-dealer financial counterparties1
Percentage shares in April 2016 Table A2
Other financial institutions (disaggregated)
Other financial
institutions
Non-reporting
banks
Institutional investors
Hedge funds2 Official sector Others
Total 51 22 16 8 1 4
By currency:
CAD and USD 50 22 15 8 1 4
Asian currencies3 50 19 17 7 2 4
Other advanced countries currencies4
53 22 17 8 2 4
Latin American currencies5
56 27 16 10 1 3
By instrument:
Spot 56 21 18 12 1 4
Outright forwards 62 19 24 12 2 4
FX swaps 43 24 12 3 2 3
FX Options 55 17 20 12 0 5 1 Daily average turnover data. Adjusted for local and cross-border inter-dealer double-counting (ie “net-net” basis). 2 This counterparty also includes proprietary trading firms. 3 Hong Kong dollar, Singapore dollar and yen. 4 Australian dollar, euro, pound sterling and Swiss franc. 5 Argentine peso, Brazilian real, Chilean peso, Colombian peso, Mexican peso and Peruvian New sol.
Sources: Triennial Central Bank Survey; BIS calculations.
FX onshore and offshore trading by region in 20161 Table A3
Offshore2 Onshore3
Spot Derivatives Memo: Exchange-
traded4
Spot Derivatives Memo: Exchange-
traded5
Shares in per cent6 USD bn Shares in per cent6 USD bn
Latin American currencies7 27.6 45.9 1.6 10.5 15.9 23.4
US dollar and Canadian dollar
21.1 54.4 44.4 10.6 13.9 71.0
1 Daily average turnover data in April. 2 Offshore trades defined as trades executed outside the jurisdiction where a currency is issued. It is the total trade in the currencies taken into consideration adjusted for local and cross-border inter-dealer double-counting (ie “net-net” basis) minus the onshore trade of these currencies in a net-gross basis. 3 Onshore trade defined in an onshore-onshore and onshore-offshore basis which takes local dealers transactions vis-à-vis local customers plus the cross-border trades by residents of the jurisdiction where a currency is issued. Adjusted for local inter-dealer double-counting (ie “net-gross” basis). 4 Offshore trade defined as trades executed in exchanges outside the local currency jurisdiction minus onshore trades (see next note) 5 Onshore trade defined in an onshore-onshore basis taking local exchanges’ transactions in the local currency. 6 Considering only OTC turnover. 7 Argentine peso, Brazilian real, Chilean peso, Colombian peso, Mexican peso and Peruvian New sol.
Sources: Euromoney TRADEDATA; Futures Industry Association; The Options Clearing Corporation; Triennial Central Bank Survey; BIS calculations.
48 BIS Papers No 90
References
Anderson, N, L Webber, J Noss, D Beale and L Crowley-Reidy (2015): “The resilience of financial market liquidity”, Bank of England, Financial Stability Paper, no 34, October.
Avalos, F and R Moreno (2013): “Hedging in derivatives markets: the experience of Chile”, BIS Quarterly Review, March, pp 53–63.
Avalos, F, R Moreno and T Romero (2015): “Leverage on the buy side”, BIS Working Papers, no 517.
Bank for International Settlements (2011): “High-frequency trading in the foreign exchange market”, Markets Committee, no 5, September.
——— (2015): “Currency carry trades in Latin America”, BIS Papers, no 81.
——— (2016): “Foreign exchange turnover in April 2016”, Triennial Central Bank Survey, September.
Bank of the Republic, Colombia (2015): “Reporte de Mercados Financieros, cuarto trimestre. Recuadro 1: Indicadores de liquidez y volatilidad del mercado cambiario”.
Borio, C, R McCauley, P McGuire and V Sushko (2016): “Covered interest parity lost: understanding the cross-currency basis”, BIS Quarterly Review, September, pp 45–64.
Brockett, M (2015): “Kiwi's biggest dislocation in 30 years flags risk of losses”, Bloomberg, 24 August.
Caruana, J (2016): “What are capital markets telling us about the banking sector?”, speech delivered at the IESE Business School conference on “Challenges for the future of banking: regulation, governance and stability”, London, 17 November.
Cardozo N, J Rassa and J Rojas (2014): “Caracterización del Mercado de Derivados Cambiarios en Colombia”, Borradores de Economía, no 860, December.
Chaboud, A, B Chiquoine, E Hjalmarsson and C Vega (2014): “Rise of the machines: algorithmic trading in the foreign exchange market”, Journal of Finance, vol 69, no 5, pp 2045–84.
Chinn, M and H Ito (2006): "What matters for financial development? Capital controls, institutions, and interactions”, Journal of Development Economics, vol 81, no 1, pp 163–92.
Choy, M and J Cerna (2012): “Interrelación entre los mercados de derivados y el mercado de bonos soberanos del Perú y su impacto en las tasas de interés”, Reserve Bank of Peru Working Paper Series, no 21, November.
——— (2014): “Comportamiento de los mercados financieros peruanos ante el anuncio del tapering”, Reserve Bank of Peru Working Paper Series, no 11, August.
Committee on the Global Financial System (2011): “Global liquidity – concept, measurement and policy implications”, CGFS Papers, no 45, November.
Corwin, S and P Schultz (2012): “A simple way to estimate bid-ask spreads from daily high and low prices”, Journal of Finance, vol 67, no 2, pp 719–60.
De Oliveira, F (2004): “O Mercado de Hedge Cambial no Brasil: Reação das Instituições Financeiras a Intervenções do Banco Central”, BCB Working Papers, no 89.

BIS Papers No 90 49
D’Souza, C (2009): “The role of dealers in providing interday liquidity in the Canadian dollar market”, Bank of Canada Review, pp 5–16.
Domanski, D, E Kohlscheen and R Moreno (2016): “Foreign exchange market intervention in EMEs: what has changed?”, BIS Quarterly Review, September, p 65.
Euromoney (2016): Foreign Exchange Survey, May.
Fender, I and U Lewrick (2015): “Shifting tides – market liquidity and market-making in fixed income instruments”, BIS Quarterly Review, March.
Forbes, K and F Warnock (2012): "Capital flow waves: Surges, stops, flight, and retrenchment”, Journal of International Economics, vol 88, no 2, pp 235-51.
Foucault, T, M Pagano and A Röell (2015): Market liquidity: theory, evidence, and policy, Oxford University Press.
Greenwich Associates (2016): “Diversifying liquidity: attaining best execution in FX trading”, Doc ID 16-2029, June.
International Monetary Fund (2015): Annual report on exchange arrangements and exchange restrictions.
Ismail, N and L Mnyanda “Flash crash of the pound baffles traders with algorithms being blamed”, Bloomberg, 7 October.
Joint Staff Report (2015): “The U.S. Treasury Market on October 15, 2014”, A report by U.S. Department of the Treasury, Board of Governors of the Federal Reserve System, Federal Reserve Bank of New York, U.S. Securities and Exchange Commission and U.S. Commodity Futures Trading Commission, 13 July.
Karnaukh, N, A Ranaldo and P Söderlind (2015): “Understanding FX liquidity”, Review of Financial Studies, vol 28, no 11, pp 3073–108.
Kohlscheen, E and S Andrade (2014): “Official FX interventions through derivatives”, Journal of International Money and Finance, vol 47, pp 202–16.
Kyle, A (1985): “Continuous auctions and insider trading”, Econometrica: Journal of the Econometric Society, pp 1315–35.
Magalhães, M and L Peixoto (2016): “Efeitos das Intervenções Cambiais sobre a Taxa de Câmbio Futura no Brasil”, BCB Working Papers, no 413, January.
Mancini, L, A Ranaldo and J Wrampelmeyer (2013): “Liquidity in the foreign exchange market: measurement, commonality, and risk premiums”, The Journal of Finance, vol 68, no 5, pp 1805–41.
Markets Committee Report (2017) “The sterling ‘flash event’ of 7 October 2016”, 13 January.
McCauley, R, P McGuire and V Sushko (2015), “Dollar credit to emerging market economies”, BIS Quarterly Review, December.
Moore, M, A Schrimpf and V Sushko (2016): “Downsized FX markets: causes and implications”, BIS Quarterly Review, December.
Nelson, E (2016): “South Africa's flash crash exposes cracks in currency liquidity”, Bloomberg, 12 January.
Nguyen, L (2016): “Liquidity, kill switches are the talk of the currency universe”, Bloomberg, 25 February.

50 BIS Papers No 90
Schaumburg, E (2014): “Has automated trading promoted efficiency in the FX spot market?“, Liberty Street Economics, 10 March.
Schaumburg, E and R Yang (2015): “Liquidity during flash events“, Liberty Street Economics, 18 August.
Shin, H S (2016): “The bank/capital markets nexus goes global“, speech by Hyun Song Shin, BIS Economic Adviser and Head of Research, at the London School of Economics, 15 November 2016.
Sidaoui, J (2005): “Central banking intervention under a floating exchange rate regime: ten years of Mexican experience”, in “Foreign exchange market intervention in emerging markets: motives, techniques and implications”, BIS Papers, no 24, May.
Turner, P (2013): “Caveat creditor”, BIS Working Papers, no 419, July.
Upper, C and M Valli (2016): “Emerging derivatives markets”, BIS Quarterly Review, December.
Vargas, H and R Betancourt (2005): “Pension funds managers’ behavior in the foreign exchange market”, Borradores de Economía, no 391, March.
Villena, J and J Salinas (2014): “Mercado Cambiario Chileno, Una Comparación Internacional: 1998 a 2013”, Estudios Económicos Estadísticos, no 106, May.

BIS Papers No 90 51
CCA/CGDO Study Group on FX Liquidity
Study group members and other contributors to this project
Name Affiliation Designation
Susan McLaughlin Federal Reserve Bank of New York Chair
Martin Alejandro Corvo Central Bank of Argentina Member
Afonso Veiga Barros e Silva Central Bank of Brazil Member
William Barker Bank of Canada Member
Claudia Sotz Central Bank of Chile Member
Fredy A Gamboa Estrada Bank of the Republic, Colombia Member
Gabriel Anaya Gonzalez Bank of Mexico Member
Ricardo Alvarado Central Reserve Bank of Peru Member
Alex Cohen Federal Reserve Bank of New York Member
Ramon Moreno BIS Secretariat
Carlos Cantu BIS Secretariat

52 BIS Papers No 90
Acknowledgements
Central bank or BIS contributors
Central banks. Gerardo Molina Adame (Bank of Mexico) was formerly a member of the study group. Diego Jorge Lopez Airaghi (Central Bank of Argentina) contributed to the content of the report. Emily Howard and Dan Reichgott (Federal Reserve Bank of New York) contributed to the drafting of this report. Benedict Wensley (Federal Reserve Bank of New York) participated in meeting with market participants.
BIS. Angelo Duarte, formerly BIS Visiting Economist, was part of the Secretariat of the Study Group until July 2016. Ingo Fender, Andreas Schrimpf and Vlad Sushko provided helpful comments. Julieta Contreras, Berenice Martinez and Tania Romero provided research assistance.
Market participants who met with the study group
The following market participants shared their insights and information at a meeting with the study group: Claudio Irigoyen (BAML), Petra Wikstrom (BNP Paribas), Fergal Walsh (Citibank), Mike O’Brien (Eaton Vance), Alan Schwarz (FXSpotStream), Kevin McPartland (Greenwich Associates), Claudia Jury and Eddie Wen (JP Morgan), Peter Humphrey (Ogg Trading), Ronie Germiniani (Itau), Hari Hariharan (NWI Management), Leonardo Ferreira (Santander), Cristiano Serrao (Barclays), Frank Seibold (EBS), Venu Palaparthi and Andrew Smith (Virtu Financial). Petra Wikstrom (BNP Paribas) kindly provided the data used in Graph 5.

BIS Papers No 90 53
Previous volumes in this series
No Title Issue date
BIS Papers No 89 Inflation mechanisms, expectations and monetary policy
November 2016
BIS Papers No 88 Expanding the boundaries of monetary policy in Asia and the Pacific
October 2016
BIS Papers No 87 Challenges of low commodity prices for Africa
September 2016
BIS Papers No 86 Macroprudential policy September 2016
BIS Papers No 85 A spare tire for capital markets: Fostering corporate bond markets in Asia
June 2016
BIS Papers No 84 Towards a “new normal” in financial markets? May 2016
BIS Papers No 83 What do new forms of finance mean for EM central banks?
November 2015
BIS Papers No 82 Cross-border Financial Linkages: Challenges for Monetary Policy and Financial Stability
October 2015
BIS Papers No 81 Currency carry trades in Latin America April 2015
BIS Papers No 80 Debt January 2015
BIS Papers No 79 Re-thinking the lender of last resort September 2014
BIS Papers No 78 The transmission of unconventional monetary policy to the emerging markets
August 2014
BIS Papers No 77 Globalisation, inflation and monetary policy in Asia and the Pacific
March 2014
BIS Papers No 76 The role of central banks in macroeconomic and financial stability
February 2014
BIS Papers No 75 Long-term finance: can emerging capital markets help?
December 2013
BIS Papers No 74 Navigating the Great Recession: what role for monetary policy?
December 2013
BIS Papers No 73 Market volatility and foreign exchange intervention in EMEs: what has changed?
October 2013
BIS Papers No 72 Sovereign risk: a world without risk-free assets?
June 2013
BIS Papers No 71 Central bank finances April 2013
BIS Papers No 70 Globalisation and inflation dynamics in Asia and the Pacific
February 2013
All volumes are available on the BIS website (www.bis.org).