Embed Size (px)
Citation preview

DIRECTORATE-GENERAL FOR EXTERNAL POLICIES
POLICY DEPARTMENT
DG EXPO/B/PolDep/Note/2018_20 EN
February 2018 - PE 570.489 © European Union, 2018
IN-DEPTH ANALYSIS
Foreign Direct Investment in the EU
and the Eastern Partnership Countries
Author: Mario DAMEN

Policy Department, Directorate-General for External Policies
2
This paper was requested by the European Parliament's Delegation to the Euronest Parliamentary Assembly.
English-language manuscript was completed on 5 February 2018.
Printed in Belgium.
Authors: Mario DAMEN with substantial input from Benedikt WIEDENHOFER (trainee).
Editorial Assistant: Jakub PRZETACZNIK
Feedback of all kind is welcome. Please write to the author: [email protected].
To obtain copies, please send a request to: [email protected]
This paper will be published on the European Parliament's online database, 'Think tank'.
The content of this document is the sole responsibility of the author and any opinions expressed therein do not necessarily represent the official position of the European Parliament. It is addressed to the Members and staff of the EP for their parliamentary work. Reproduction and translation for non-commercial purposes are authorised, provided the source is acknowledged and the European Parliament is given prior notice and sent a copy.

Foreign Direct Investment in the EU and the Eastern Partnership Countries
3
Table of contents
Introduction 4
1 The European Union: an investment heavyweight 5
1.1 Investment between the EU and its main partners 5
1.2 Investment protection in the EU 6
1.3 Investment screening in the EU 7
2 Eastern Partnership countries: steady transformation 9
2.1 Investment in and from Eastern Partnership countries 9
2.2 Investment support in Eastern Partnership countries 12
2.3 Investment protection and openness 14
3 EU- Eastern Partnership investment per country 17
3.1 Armenia 17
3.2 Azerbaijan 18
3.3 Belarus 19
3.4 Georgia 20
3.5 Moldova 22
3.6 Ukraine 23
Conclusion 25
Annex : Explanation of some basic concepts of investment 27

Policy Department, Directorate-General for External Policies
4
Introduction This in-depth analysis has been written upon a request of the Economic Committee of the Euronest Parliamentary Assembly. The original request was to do a full study on Foreign Direct Investment (FDI) in the EU and its Member States and in Eastern Partnership countries, as well as the flows of FDI between those two. It would have to include financial, legal and compliance aspects, as well as information on specific sectors.
As it was not possible to commission an external study on such a vast topic in the limited time available, this short analysis will only paint the broad picture of investment in the EU and the Eastern Partnership countries. By doing so, it will show there are fundamental differences between these groups of countries and the role of investment in their economies. The European Union encompasses some of the strongest economies in the world, which are not only desired locations for inward FDI, but also strong players in outgoing FDI to third countries. The Eastern Partnership countries, however, although they have come a long way since 1989 in transforming themselves from state-driven into market-driven economies, still have less globalised economies and much lower levels of inward and outward investment.
When writing about FDI and the economy in Eastern Partnership countries, politics has to be taken into consideration. First, the fact that three of the Eastern Partnership countries have Association Agreements with the European Union and the other three do not, will be one of the elements foreign investors will take into account when deciding on an investment. The Association Agreements come with the intention to create deep and comprehensive trade areas in which technical and economic national legislation is to converge towards EU legislation. The agreements signed or under negotiation between the EU and Armenia and Azerbaijan do not go that far, but also contain assurances for foreign investors. Secondly, economic relations with Russia dating back to the Soviet era are still of relevance. Not only trade flows but also investment patterns between the Eastern Partnership countries and Russia are considerable.
When it comes to the investment environment, differences are fundamental as well. Whereas investing in EU Member States is considered safe and stable, investing in Eastern Partnership countries is from the Western perspective considered to entail more risks. Changes in government or policy can lead to changes in the regulatory environment, or changes regarding the allocation of public procurement contracts. Unfortunately, corruption is still a considerable problem in all Eastern Partnership countries. Finally, although not acute, the geopolitical circumstances are less stable. For this reason, many Member States have tried to protect their national investors’ rights through Bilateral Investment Treaties (BITs). At the same time, international investment banks are trying to encourage investments in these countries that will allow structural development of their economies.
Chapter 1 will describe investment patterns and recent developments in investment policy in the EU. Chapter 2 will do the same for the Eastern Partnership countries. Chapter 3 will look more in detail at Member State investment in Eastern Partnership countries, as well as inward and outward FDI stocks to and from the EU for each Eastern Partnership country. Finally, some conclusions will be drawn. For those not familiar with investment, some basic concepts are explained in the annex.

Foreign Direct Investment in the EU and the Eastern Partnership Countries
5
1 The European Union: an investment heavyweight
1.1 Investment between the EU and its main partners The EU is not only the world’s greatest single market but also the largest source and destination of FDI in the world, measured by stocks and flows. On the one hand, international investments into the EU are worth €5.4 trillion or about 36% of the wealth produced annually by the EU and directly support 7.6 million jobs in its Member States. EU investments abroad, on the other hand, are worth €6.9 trillion – about 46% of the wealth produced annually by the EU - and directly support 14.4 million jobs abroad. While inward FDI provides capital and technology to foster European research, innovation and competition, EU businesses invest abroad to optimise their production, to access raw materials and components, and to better serve foreign markets1.
As can be seen in Figure 1, in spite of the financial crisis, between 2009 and 2015 the EU FDI inward and outward stocks grew steadily. In 2015, the rate of increase was slightly higher than recorded in the preceding years. At Member State level, growth of FDI inward and outward stocks was higher than average in Germany, Ireland, Luxembourg and the Netherlands while Spain, the United Kingdom, Sweden, Cyprus, Austria and Greece registered an above-average decrease in their FDI inward and outward stocks between 2014 and 2015.
Figure 1 EU 28 FDI Flows and Stocks, 2009-2015
Source: http://ec.europa.eu/eurostat/statistics-explained/index.php/File:FDI_flows_and_stocks,_EU-28,_2009%E2%80%932015_(billion_EUR)_YB17.png
1 http://ec.europa.eu/trade/policy/accessing-markets/investment/

Policy Department, Directorate-General for External Policies
6
Despite the disinvestment in 2014, the United States maintained their position as the main partner for the EU-28 with respectively 34.5% of outward stocks and 39.5% of inward stocks from the rest of the world. In addition, emerging economies like Brazil, China, Russia and Mexico were important EU partners for FDI stocks throughout the 2010-2015 period. However, Eastern Partnership countries do not figure amongst the EU’s main FDI partners.
Table 1: Top 10 countries as extra EU-28 partners for FDI stocks, 2010-2015
Source: http://ec.europa.eu/eurostat/statistics-explained/index.php/File:Top_10_countries_as_extra_EU-28_partners_for_FDI_stocks,_EU-28,_end_2012%E2%80%932015_(billion_EUR)_YB17.png
When looking at the FDI flows (the thin lines in figure 1), in 2014, both EU inward and outward FDI flows fell sharply to their lowest levels during the period 2009–2015. This major decrease was mainly due to large disinvestments in the traditional partner countries — the United States and Switzerland — as well as disinvestments from the United States in the EU, while FDI inflows in the EU also declined from all other continents except for non-EU Europe. The drop in inward flows from and outward flows to the USA in 2014 mainly resulted from one very large transaction in the first quarter of the year, in which the British company Vodafone sold its interest in Verizon Wireless to the US-firm Verizon Communications for a reported USD 130 billion. This major deal resulted in a significant reduction of outward FDI flows from the United Kingdom and partly explains the dent2. More broadly, the decrease in EU inward and outward FDI is in line with the global decline in FDI flows in 2014, due to elevated geopolitical risks, policy uncertainty for investors and the overall fragility of the global economy at the time3. In 2015, the level of inward and outward FDI flows returned to a similar level to that recorded in 2013.
1.2 Investment protection in the EU Because the EU is collectively the biggest source and host country of FDI, investment protection is an important part of EU trade policy. The Treaty of Lisbon , which entered into force on 1 December 2009, added FDI to Article 207 TFEU on trade policy, which made it an exclusive competence of the EU. While it was, prior to the Lisbon Treaty, a Member State competence, EU Member States negotiated more than 1,400 Bilateral Investment Treaties (BITs). Building on Member State practice, the Commission relied on Investor-State Dispute Settlement (ISDS)4 as ‘an important tool for the enforcement of substantive protection standards’5. However, things changed in 2015 with the negotiations on TIIP and later on CETA, with civil society questioning the investment protection mechanism. Much of the criticism of these
2 OECD, ‘FDI in Figures, December 2014’, p. 2. 3 UNCATD, ‘World Investment Report 2015: Reforming International Investment Governance’, p. IX. 4 More on ISDS in the Annex to this analysis. 5 European Commission, ‘Factsheet on Investor-State Dispute Settlement’, p. 2.
Foreign Direct Investment in the EU and the Eastern Partnership Countries
7
agreements revolved around ISDS, which detractors perceived as an instrument for Multinational Enterprises to exert pressure on states’ right to regulate in the public interest.
In response to these concerns, the Commission held a public consultation on investment protection in 2014. Civil society used the occasion to demand reforming investment dispute resolution. In parallel, the European Parliament also demanded reforms. In its May 2015 Concept Paper on investment in TTIP and beyond6, the Commission indicated its intention to reform the ISDS system in bilateral negotiations and transform it into an instrument that functions more like traditional courts systems and includes an appellate mechanism. These changes were intended to be the stepping stones towards a permanent multilateral system for investment disputes, on which the Commission sought to work in parallel. In September 2015, the Commission published its proposal7 on a new Investment Court System (ICS). Although the discussion about ISDS started on the TTIP negotiations, the concrete proposals were used in the CETA agreement with Canada and in the trade agreement with Vietnam. Whether the USA would have accepted these reforms is unclear because the TTIP negotiations were put on ice soon after.
The ICS departs substantially from the old ISDS framework, especially since parties to the dispute are no longer supposed to choose their tribunal members. These will instead be selected on a rotational basis from a group of judges, appointed for a specified period of time by a joint committee of the EU and its respective FTA-partner8. Moreover, in the October 2015 ‘Trade for all’ communication, the Commission set the goal of engaging with partners to build consensus for a fully-fledged, permanent Multilateral Investment Court (MIC) so as to develop a coherent, unified and effective policy on investment-dispute resolution.
In September 2017, the Commission adopted a recommendation9 to open negotiations to discuss the establishment of a MIC in the framework of the UN Commission for International Trade Law (UNCITRAL). The proposal addresses the limitations of the ICS, which involved costs in terms of administrative complexity and budgetary impact and, due to its bilateral nature, could not fully meet civil society demands for transparency, consistency, and legitimacy. The MIC initiative seeks to establish a framework for the resolution of international investment disputes that is permanent, independent and legitimate; predictable in delivering consistent case-law; allows for appeals against decisions; is cost-effective; and whose proceedings are transparent and efficient and allow for third-party interventions (including for example interested environmental or labour organisations). The independence of the Court would be guaranteed by stringent requirements on ethics and impartiality, non-renewable appointments, full-time employment of adjudicators and independent mechanisms for appointment. The EU is now seeking supporters for this initiative amongst its key trading partners. For example, both CETA and the EU-Vietnam FTA include provisions anticipating the transition from the bilateral Investment Court System included in the agreements to a permanent MIC. Currently, the EU is trying to find supporters for this initiative on the international level and thereby significantly change the natureof international investment protection.
1.3 Investment screening in the EU The reform of investment protection is not the only initiative in the field of FDI that the EU initiated recently. The Commission also presented in September 2017 a proposal to set up a European framework for screening foreign direct investment into the European Union. Since the EU has one of the most open investment regimes in the world, the proposal seeks to prevent takeovers of strategic assets that could
6 Investment in TTIP and beyond - the path for reform. 7 http://trade.ec.europa.eu/doclib/docs/2015/september/tradoc_153807.pdf. 8 EPRS, ‘From arbitration to the investment court system (ICS): The evolution of CETA rules’ 9 COM(2017)493 final ‘Recommendation for a Council decision authorising the opening of negotiations for a Convention establishing a multilateral court for the settlement of investment disputes’.

Policy Department, Directorate-General for External Policies
8
threaten security or public order while at the same time maintaining EU openness to FDI. The proposal is directed at FDI in sectors which, for example, involve activities related to the operation or provision of critical technologies, infrastructure, inputs or sensitive information.
Twelve EU Member States10 already have mechanisms that assess the risk of FDI, differing in design and scope. The Commission proposal seeks to establish a uniform mechanism allowing the Commission and Member States to screen FDI in a transparent, non-discriminatory and predictable way and with adequate possibilities for redress. This includes a cooperation mechanism between Member States and the Commission for cases in which an investment in one or more Member States might affect the security or public order of another. The European framework also foresees a European Commission FDI screening mechanism when FDI is likely to affect projects or programmes of Union interest in the area of research, space, transport, energy and telecommunication networks.
The investment screening proposal is mainly aimed at non-EU investors, particularly state-owned enterprises, whose countries of origin have maintained significant investment barriers towards EU investors. It is in line with a generally increased concern about reciprocity in recent EU trade policy. Although the proposal does not target any country in particular, it is clear that China is among the countries raising concern. More relevant to this analysis is probably that some EU Member States also have concerns about investment from Russia in sectors considered strategic. The screening mechanism seems of little relevance however to investments from Eastern Partnership countries, for the simple reason that they amount to merely 0,014% of total FDI stocks in the EU (in 2016). The share in FDI flows to the EU from Eastern Partnership countries is equally too low to pose a threat.
Figure 2
Source: Eurostat
10 Austria, Denmark, Finland, France, Germany, Italy, Latvia, Lithuania, Poland, Portugal, Spain, UK

Foreign Direct Investment in the EU and the Eastern Partnership Countries
9
2 Eastern Partnership countries: steady transformation
2.1 Investment in and from Eastern Partnership countries Figure 3 shows that the economic profiles of all Eastern Partnership countries differ significantly from that of the EU. The relative weight of agriculture, forestry and fishing in the total economic activity was considerably higher than in the EU in 2013. In Armenia, the sector even made up 21.2% of total gross value added. While generally, the importance of the services industry has been growing in all countries in the past decade, the shift to a service dominated economy has been particularly marked in Georgia, Moldova and Ukraine, as well as in Armenia. In Azerbaijan, however, the share of the industrial sector increased by almost 10% from 2003 to 2013. Industry accounted for almost half (49.4%) of gross value added in 2013. Industry also plays a major role in the economy of Belarus, where it counts for 31.1% of the GVA.
Figure 3 Percentage of Gross Value Added by economic activity (NACE Rev.2), 2013
Source: Eurostat, ‘European Neighbourhood Policy - East countries: Key economic statistics’, p. 4.
Despite the differences, there are some important common elements between the six: having their origins in the highly integrated and centralised Soviet economy, they have all retained significant trade and economic ties with Russia and the Commonwealth of Independent States (CIS) area. Furthermore, they use the same industrial standards, namely the GOST standard11 of the CIS, which is recognised by the ISO. Yet, while the infrastructure and energy networks in the area are rather integrated, trade with the EU has surpassed trade with the CIS area. On the one hand, this is due to a stronger demand from the EU, and on the other hand to the EU’s eastward enlargements, which brought the Union closer to these countries’ doorstep. Given this specific situation, it is important for Eastern Partnership Countries to maintain and develop close economic ties with both areas since losing one of the two markets would be potentially harmful to their wealth12. This is a delicate balancing act, with which each of the countries deals in its own way.
11 GOST standards cover energy, oil and gas, environmental protection, construction, transportation, telecommunications, mining, food processing and other industries and serve as the regulatory basis for government and private-sector certification programmes throughout the CIS. 12 DG EXPO Policy Department, ‘When choosing means losing: The Eastern partners, the EU and the Eurasian Economic Union’, p. 16-19.

Policy Department, Directorate-General for External Policies
10
The FDI balance remained negative for all Eastern Partnership countries throughout the 2013-2016 period, meaning that they all received more FDI than they invested abroad. But there are major differences between the countries. Figure 4 shows the FDI inflows in Eastern Partnership countries from the world. While Ukraine was the greatest FDI recipient until 2013, flows collapsed in 2014 after the Russian annexation of Crimea. They recovered in 2015, but remained below their original level. During the same period, FDI inflows into Azerbaijan strongly increased, making the fuel-rich country the biggest recipient of FDI inflows in the region. Belarus and Georgia converged on a level half as high as that of Azerbaijan. Armenia and Moldova received the lowest inflows, with FDI flows to Moldova decreasing since 2014.
Figure 4 FDI Net Inflows in Eastern Partnership Countries (Million Current USD)
Source: World Bank DataBank http://databank.worldbank.org/data/reports.aspx?source=world-development-indicators
Regarding FDI outflows, Figure 5 shows that Azerbaijan is also the region’s largest source of outward FDI flows to the world. While its outward flows more than doubled between 2013 and 2015, they decreased in 2016. FDI outflows from the rest of the Eastern Partnership countries remained rather stable at a much lower level throughout the period. Only Ukraine displays a stark decrease of outflows after 2014 and a slight recovery in 2016, albeit with flows still far below the original level.
Figure 5 FDI Net Outflows from Eastern Partnership Countries (Million Current USD)
Source: World Bank DataBank http://databank.worldbank.org/data/reports.aspx?source=world-development-indicators

Foreign Direct Investment in the EU and the Eastern Partnership Countries
11
The share of FDI stocks from Eastern Partnership countries in the total FDI stocks that non-EU28 countries have in the EU is almost negligible (see figure 2 above). In 2013, at its highest level during the period under consideration, it was below 0.03% of inward stocks from Extra EU28 countries and it fell to 0,014% in 2016. Since then, the share has decreased further. Low shares in percentage terms aside, in terms of absolute figures there actually was an increase of EU inward FDI stocks from the Eastern Partnership region in 2015. The total EU inward FDI stocks from the region amounted to EUR 896 million in 2016. In comparison to total EU outward FDI stocks to non-EU countries, Eastern Partnership countries also play only a small role as host economies. At their peak in 2013, EU outward FDI stocks in the region constituted a share of less than 0.6% in EU total outward FDI stocks outside the EU28. By 2016, this share had fallen to almost half of its 2013 value. The total outward FDI stocks of EU Member States in Eastern Partnership countries amounted to EUR 26,488.6 million in 2016.
Therefore, it makes sense to focus on the relative share that each country has in the FDI stocks that Eastern Partnership countries hold in the EU. Figure 6 gives a clearer picture. While Ukraine used to hold the highest share of FDI stocks, its share decreased in 2014, when it was overtaken by Belarus, whose share kept rising thereafter. The shares of Azerbaijan and Georgia kept falling throughout the period while the shares of Armenia and Moldova fluctuate.
Figure 6
Source: Eurostat
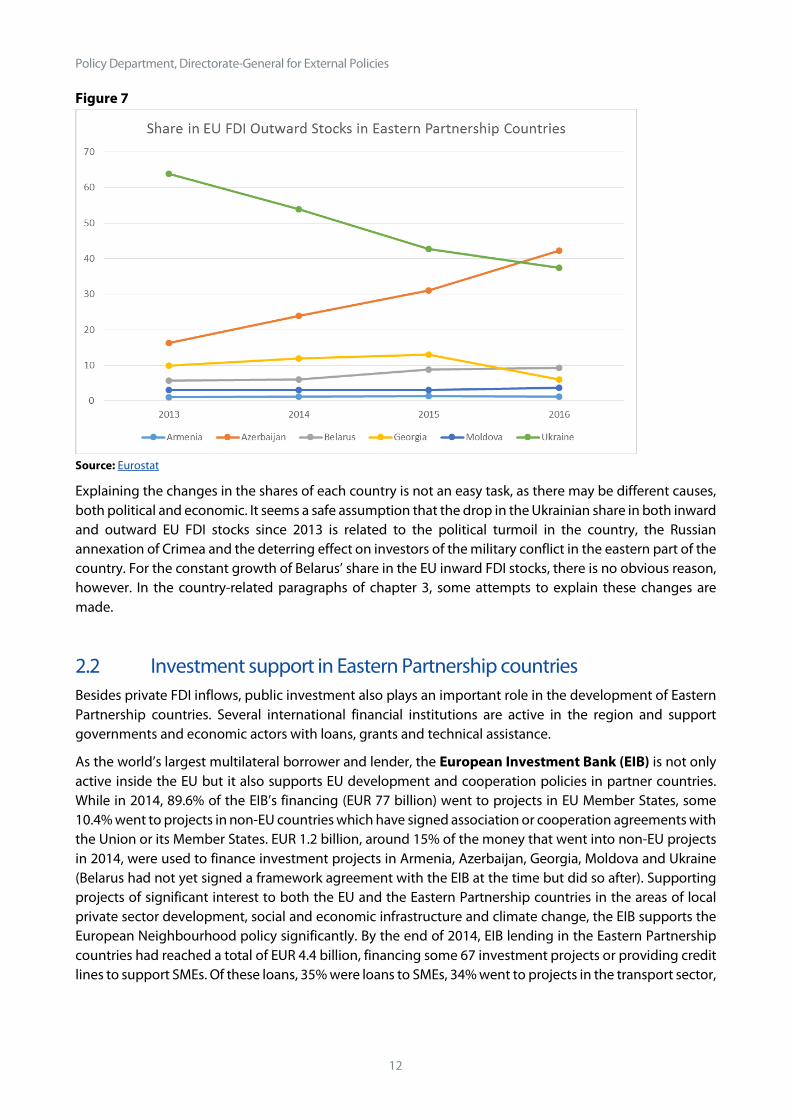
Figure 7 shows the relative share of each country in total EU outward FDI stocks in the Eastern Partnership. While in 2013 Ukraine hosted more than 60% of EU outward FDI stocks in the region, its share fell to less than 40% in 2016. During the same period, the share of Azerbaijan in total outward EU FDI stocks in the region more than doubled. Belarus’s share increased slightly, too, while Georgia’s share began to fall in 2015.
Policy Department, Directorate-General for External Policies
12
Figure 7
Source: Eurostat
Explaining the changes in the shares of each country is not an easy task, as there may be different causes, both political and economic. It seems a safe assumption that the drop in the Ukrainian share in both inward and outward EU FDI stocks since 2013 is related to the political turmoil in the country, the Russian annexation of Crimea and the deterring effect on investors of the military conflict in the eastern part of the country. For the constant growth of Belarus’ share in the EU inward FDI stocks, there is no obvious reason, however. In the country-related paragraphs of chapter 3, some attempts to explain these changes are made.
2.2 Investment support in Eastern Partnership countries Besides private FDI inflows, public investment also plays an important role in the development of Eastern Partnership countries. Several international financial institutions are active in the region and support governments and economic actors with loans, grants and technical assistance.
As the world’s largest multilateral borrower and lender, the European Investment Bank (EIB) is not only active inside the EU but it also supports EU development and cooperation policies in partner countries. While in 2014, 89.6% of the EIB’s financing (EUR 77 billion) went to projects in EU Member States, some 10.4% went to projects in non-EU countries which have signed association or cooperation agreements with the Union or its Member States. EUR 1.2 billion, around 15% of the money that went into non-EU projects in 2014, were used to finance investment projects in Armenia, Azerbaijan, Georgia, Moldova and Ukraine (Belarus had not yet signed a framework agreement with the EIB at the time but did so after). Supporting projects of significant interest to both the EU and the Eastern Partnership countries in the areas of local private sector development, social and economic infrastructure and climate change, the EIB supports the European Neighbourhood policy significantly. By the end of 2014, EIB lending in the Eastern Partnership countries had reached a total of EUR 4.4 billion, financing some 67 investment projects or providing credit lines to support SMEs. Of these loans, 35% were loans to SMEs, 34% went to projects in the transport sector,

Foreign Direct Investment in the EU and the Eastern Partnership Countries
13
19% to the energy sector, 7% to water and urban infrastructure, and 5% to industry and agriculture13. For the period 2014 to 2020, the EIB has a EUR 4.8 billion mandate covering the Eastern Partnership countries and Russia14. In addition to lending money on advantageous terms, the EIB also provides project-related technical advisory support as well as institutional support and capacity-building via the Eastern Partnership Technical Assistance Trust Fund15.
Figure 8
Source: European Investment Bank, ‘EIB financing in the Eastern Partnership’.
The EIB carries out its operations in Central Asia in close cooperation with the European Bank for Reconstruction and Development (EBRD). The two donors share appraisal work and conduct joint appraisal missions. They typically divide their work as follows: the EBRD undertakes the financial analysis, projections modelling and the security structuring, and the EIB, the project’s technical and economic appraisal work. The two institutions then use each other’s work as input in their respective, independent, credit and project evaluations16.
Having supported 1,124 projects, the EBRD is a major investor in the region. Its cumulative investment in Eastern Partnership countries amounts to EUR 21.6 billion while its current portfolio of projects is EUR 6.8 billion. More than half of the current portfolio is allocated to projects in Ukraine, 17,4% in Azerbaijan, 10% in Georgia, 7,2% in Belarus, 6,8% in Moldova and 4,2% in Armenia. The projects support the development of infrastructure, the energy sector, financial institutions and industry, commerce and agribusiness17.
Since the fall of the Iron Curtain, the World Bank has also been a major donor in the region, supporting 535 projects with a total commitment amount of USD 27.96 billion18.
The Asian Development Bank funds projects in Armenia, Azerbaijan and Georgia. While it has been working with Armenia since 2005, having approved loans and technical assistance grants totaling USD 1.2
13 European Investment Bank, ‘EIB financing in the Eastern Partnership’. 14 http://www.eib.org/projects/regions/eastern-neighbours/index.htm 15 http://www.eib.org/projects/regions/eastern-neighbours/instruments/technical-assistance/index.htm 16 http://www.eib.org/projects/regions/eastern-neighbours/partners/index.htm 17 http://www.ebrd.com/where-we-are.html 18 http://projects.worldbank.org/country?lang=en&page=

Policy Department, Directorate-General for External Policies
14
billion, it started to support Georgia’s development in 2007, since having disbursed means worth USD 2.13 billion to the country. Azerbaijan has been a member of the bank since 1999 and has received USD 3.65 billion in loans, grants and technical assistance. The money mainly went into projects supporting development in the water, transport, finance, energy, and public sectors19.
Other International Financial Institutions active in the region include the Russian-led Eurasian Development Bank, of which Armenia and Belarus are members, and the Chinese-led Asian Infrastructure Investment Bank, of which Azerbaijan and Georgia are members and Armenia and Belarus are prospective members20.
2.3 Investment protection and openness Since FDI only became an EU competence with the Lisbon Treaty in December 2009, it is not surprising that in 1998/99 no provisions on investment protection were included in the Partnership and Cooperation Agreements that the EU concluded with all Eastern Partnership countries but Belarus. In fact, the agreements did not even grant trade preferences. The Partnership and Cooperation Agreements with Armenia (Article 47) and Azerbaijan (Article 48), the only of these early agreements still in force, both contain an article on investment promotion and protection. However, the Articles merely express the aim to cooperate to ‘establish a favourable climate for private investment, both domestic and foreign, especially through better conditions for investment protection, the transfer of capital and the exchange of information on investment opportunities’. Concrete aims of this cooperation include the conclusion of agreements between EU Member States and the respective country to promote and protect investments and to avoid double taxation.
A decade later, the EU started to move towards a deeper relationship with most Eastern Partnership countries, launching negotiations on an Association Agreement along with a Deep and Comprehensive Free Trade Area (DCFTA) with Armenia (2012), Georgia (2012), Moldova (2012) and Ukraine (2008). Although these agreements do not include a chapter on investment protection, two other important elements help to foster and protect FDI. First, the chapter on regulatory approximation in each agreement, which includes extensive harmonisation of laws, norms and regulations in various trade-related sectors, creates conditions for aligning key sectors of the Eastern partners’ economies to EU standards. Second, if investment is related to the energy sector, investors can also rely on the Energy Treaty Charter (ETC), to which EU Member States, the EU and Eastern partners are party. This Charter includes a pillar on investment protection with an ISDS enforcement mechanism. The chapters on energy in the DCFTAs usually refer to the ETC21. The lack of investment protection at EU level is partly compensated by a number of Bilateral Investment Treaties (BITs) between EU Member States and Eastern Partnership countries. In total, EU countries signed 122 BITs with Eastern Partnership countries between 1990 and 2011, of which 109 are in force. Based on international law, BITs protect investments of investors who are nationals of one state, in another. These will continue to exist until they are replaced by EU agreements.
19 https://www.adb.org/countries/main 20 https://www.aiib.org/en/about-aiib/governance/members-of-bank/index.html 21 https://energycharter.org/who-we-are/members-observers/

Foreign Direct Investment in the EU and the Eastern Partnership Countries
15
Table 2
Country BITs Signed / in Force with EU Countries22
Total BITs Signed / in Force
Armenia 16 / 14 39 / 30
Azerbaijan 18 / 13 44 / 25
Belarus 22 / 18 62 / 52
Georgia 17 / 17 32 / 30
Moldova 24 / 23 43 / 39
Ukraine 25 / 24 70 / 47
Eastern Partnership Countries 122 / 109 290 / 223
Source: https://icsid.worldbank.org/en/Pages/resources/Bilateral-Investment-Treaties-Database.aspx#a6
Each of the Eastern Partnership countries followed a different path in the Association process:
Although Armenia completed negotiations with the EU in July 2013, it did not sign the agreement and instead joined the Russia-led Eurasian Economic Union (EAEU) in January 2015. This necessarily constrained the scope of a possible agreement with the EU. Therefore, the Comprehensive and Enhanced Partnership Agreement, on which the EU and Armenia completed negotiations in February 2017, reflects the attempt of the negotiators to preserve as many commitments as possible of the draft Association Agreement without coming into conflict with the commitments that Armenia has in the framework of the EAEU. The new agreement, on which EU-Armenia relations will be based once all parties have ratified it, does not contain a chapter on investment but is expected to include a review clause that will allow the EU and Armenia to revisit the issue of investment at a later stage23.
Negotiations to update the EU-Azerbaijan agreement began in July 2010 but progress stalled since negotiations of a DCFTA are not possible as long as Azerbaijan is not a member of the WTO. It has been negotiating its accession since 1997. Thus, the EU suggested to Azerbaijan in May 2013 to negotiate a Strategic Modernisation Partnership, negotiations on which are currently ongoing. This was also due to the countrie’s role as an important exporter of oil and gas to the EU.24
The Association Agreements with Georgia and Moldova, which both entered into force in July 2016, as well as the Association Agreement with Ukraine, which has been provisionally applied since January 2016, do not contain investment protection provisions either. They merely include a general state-to-state dispute settlement mechanism ‘for avoiding and settling any dispute between the Parties concerning the interpretation and application’ applying to the title on trade and trade-related matters of the respective agreements. However, all three agreements contain a review clause (Georgia: Art. 80; Moldova: Art. 206; Ukraine: Art. 89). While differing slightly in its exact wording in the three agreements, the clause stipulates that: in their review, the parties shall assess any obstacles to establishment that have been encountered and address these, possibly through further negotiations, including with respect to investment protection and to investor-to-state dispute settlement procedures.
22 Belgium and Luxemburg negotiate BITs as one entity; in some cases one EU member state has two BITs with the same country 23 DG EXPO Policy Department,’EU relations with Armenia and Azerbaijan’; DG Expo Policy Department, ‘When choosing means losing: The Eastern partners, the EU and the Eurasian Economic Union’, p. 11-16. 24 DG EXPO Policy Department, ‘The Eastern Partnership after five years: Time for deep rethinking’, p.16.

Policy Department, Directorate-General for External Policies
16
Regarding Belarus, the EU has not yet ratified the bilateral Partnership and Cooperation Agreement concluded with the country in 1995 due to the country’s lack of commitment to democracy, and politicaland civil rights. Therefore, EU-Belarus bilateral trade and economic relations remain covered by the Trade and Cooperation Agreement concluded between the European Community and the Soviet Union in 1989. Moreover, Belarus is not a member of the WTO. Accession talks started in 1993 and are still ongoing. Nevertheless, the EU and Belarus recently established a formal Dialogue on Trade, which convenes twice a year in order to discuss trade concerns, including domestic regulations25.
Corruption is one of the key obstacles to improving the business and investment climate in Eastern Partnership countries. Lack of transparency in public procurement, government favouritism and inconsistent, and therefore unpredictable, policies can also constitute barriers to foreign investors.
In the 2016 Transparency International corruption perception index, Georgia ranked 44th among 176 states, an improvement of four places compared the previous year. In line with its commitments in its Association Agreement with the EU, it is successfully implementing an anti-corruption strategy and action plan. In January 2017, for example, it introduced a monitoring system for asset declarations submitted by public officials. For Moldova, too, systemic corruption, lack of judicial independence and excessive polarisation of state institutions are amongst the key challenges and main reform areas to be tackled. In 2016, an EU-funded peer-review mission evaluated Moldova’s institutions and rule of law and made several recommendations on how to address concerns on the independence of the judiciary and corruption. In Ukraine, an increasing number of anti-corruption, investigations were launched recently and an electronic asset declaration system was introduced, but a lot remains to be done there too.
Although further substantial work is still outstanding, in the framework of their Association Agreements with the EU and with extensive EU support, Eastern Partnership countries are making slow but steady progress in the fight against corruption. Moreover, in recent years, civil society has played a critical role in denouncing corrupt practices and in the promotion, design and oversight of reforms.26
25 EEAS, EU Belarus Relations’; http://ec.europa.eu/trade/policy/countries-and-regions/countries/belarus/. 26 SWD(2017) 110 final, ‘Joint Staff Working Document: Association Implementation Report on the Republic of Moldova’; SWD(2017) 371 final, ‘Joint Staff Working Document: Association Implementation Report on Georgia’; SWD(2017) 376 final, ‘Joint Staff Working Document: Association Implementation Report on Ukraine’

Foreign Direct Investment in the EU and the Eastern Partnership Countries
17
3 EU- Eastern Partnership investment per country This chapter analyses the FDI relations between the EU and Eastern Partnership at country level. On the one hand, data on the main source countries of FDI inflows in each Eastern Partnership country is presented27. On the other hand, EU FDI stocks with each Eastern Partnership country are evaluated for the years 2013 to 2016.
3.1 Armenia Figure 9 shows the main source countries of FDI inflows in Armenia. While the European Union as a whole accounted for roughly 52% of FDI inflows in 201228, a major part of these investments came from France (40% of total) and Germany (8% of total). Other important investors were Russia (15%), Argentina (9%), Switzerland (7%) and Lebanon (2%). A well-known tax-haven, the Seychelles, also figures in the top seven of FDI inflows, albeit with only 4%.
Figure 9
While EU FDI outflows to Armenia were consistently higher than inflows from Armenia, the development of EU FDI stocks in Armenia displayed in Figure 10 was ambiguous. While they increased between 2013 and 2014 (inversely to the general trend at the time), they decreased in the following two years. This might be a result of EU investors becoming wary after the country’s decision to join the Russia-led Eurasian Economic Union in January 2015 instead of signing the Association Agreement and DCFTA with the EU. Armenian FDI stocks in the EU grew between 2013 and 2014 and then remained rather stable.
27 The most recent data that could be found on FDI inflows into Eastern Partnership countries by source country is on UNCTAD Bilateral FDI statistics, which provides data until 2012, and in statistics provided in the European Commission document ’EU support to SMEs in the Eastern Partnership countries 2014-2020: The way forward for the SME Flagship Initiative’ (Ref. Ares(2015)1120506 - 13/03/2015). 29 UNCTAD, ‘Bilateral FDI Statistics’.

Policy Department, Directorate-General for External Policies
18
Figure 10
Source: Eurostat
3.2 Azerbaijan According to the UNCTAD FDI Database, 83% of FDI flows to Azerbaijan in 2012 came from unspecified source countries, making it impossible to establish the share of the EU in FDI flows to the country29. Nonetheless, Figure 11 shows that six EU Member States (the Netherlands, the United Kingdom, Italy, Germany, France and Cyprus) figure among the most prominent investors in Azerbaijan in 2013.
Figure 11
29 UNCTAD, ‘Bilateral FDI Statistics’.
Foreign Direct Investment in the EU and the Eastern Partnership Countries
19
However, they play a far less important role as FDI source countries than Turkey, from which almost 40% of Azeri FDI inflows originated. With around 10%, the United Arab Emirates was also a major investor in the country in 2013.
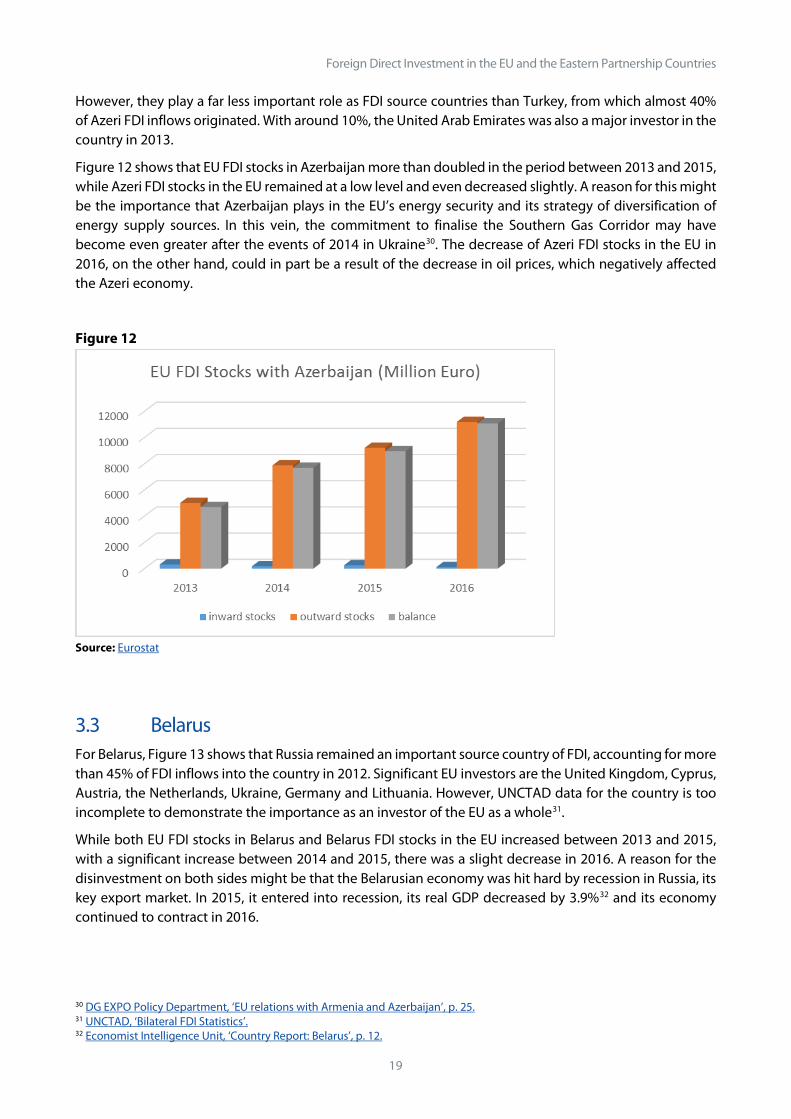
Figure 12 shows that EU FDI stocks in Azerbaijan more than doubled in the period between 2013 and 2015, while Azeri FDI stocks in the EU remained at a low level and even decreased slightly. A reason for this might be the importance that Azerbaijan plays in the EU’s energy security and its strategy of diversification of energy supply sources. In this vein, the commitment to finalise the Southern Gas Corridor may have become even greater after the events of 2014 in Ukraine30. The decrease of Azeri FDI stocks in the EU in 2016, on the other hand, could in part be a result of the decrease in oil prices, which negatively affected the Azeri economy.
Figure 12
Source: Eurostat
3.3 Belarus For Belarus, Figure 13 shows that Russia remained an important source country of FDI, accounting for more than 45% of FDI inflows into the country in 2012. Significant EU investors are the United Kingdom, Cyprus, Austria, the Netherlands, Ukraine, Germany and Lithuania. However, UNCTAD data for the country is too incomplete to demonstrate the importance as an investor of the EU as a whole31.
While both EU FDI stocks in Belarus and Belarus FDI stocks in the EU increased between 2013 and 2015, with a significant increase between 2014 and 2015, there was a slight decrease in 2016. A reason for the disinvestment on both sides might be that the Belarusian economy was hit hard by recession in Russia, its key export market. In 2015, it entered into recession, its real GDP decreased by 3.9%32 and its economy continued to contract in 2016.
30 DG EXPO Policy Department, ‘EU relations with Armenia and Azerbaijan’, p. 25. 31 UNCTAD, ‘Bilateral FDI Statistics’. 32 Economist Intelligence Unit, ‘Country Report: Belarus’, p. 12.

Policy Department, Directorate-General for External Policies
20
Figure 13
Figure 14
Source: Eurostat
3.4 Georgia In 2012, EU Member states accounted for 48,3% of FDI inflows in Georgia33. Figure 15 shows that the Netherlands was the leading investor in 2013, followed with some distance by Denmark and Cyprus. Moreover, Luxembourg and the United Kingdom figured amongst the main investors in the country but were less important than Turkey, Russia and Azerbaijan. It would be interesting to investigate what kind of investment is coming from the British Virgin Islands, another investor known for its tax arrangements, whose investment share is even slightly bigger than the UK’s itself.
33 UNCTAD, ‘Bilateral FDI Statistics’.

Foreign Direct Investment in the EU and the Eastern Partnership Countries
21
Figure 15
After EU FDI stocks in Georgia reached their peak in 2014, they began to decrease slightly in 2015 and lost more than half of their value in 2016. Simultaneously, Georgian FDI stocks in the EU fell, albeit on a much smaller scale, as can be seen in Figure 16. This might be due to the slowdown of the Georgian economy from 2015 when the county’s GDP grew by 2.8%, the lowest rate of growth since 2009. The contraction of the Russian economy had depressed the value of remittances to Georgia and decreased its exports, which had a negative effect on economic activity in the country34.
Figure 16
Source: Eurostat
34 Economist Intelligence Unit, ‘Country Report: Georgia’, p. 7.

Policy Department, Directorate-General for External Policies
22
3.5 Moldova Figure 17 shows that in 2012, with almost 25% of total FDI inflows, Russia was the most important source country of FDI in Moldova. Many EU countries also feature amongst the most prominent investors: the Netherlands, France, Cyprus, Romania, Spain, Germany, the UK and Italy, who each account for a greater share than the USA. The share of FDI inflows of the EU as a whole to Moldova cannot be calculated35.
Figure 17
Figure 18
Source: Eurostat
35 Due to a lack of data, UNCTAD, ‘Bilateral FDI Statistics’.

Foreign Direct Investment in the EU and the Eastern Partnership Countries
23
Despite minor fluctuations, Figure 18 shows that EU FDI stocks in Moldova remained quite stable throughout the 2013-2016 period, while Moldovan FDI stocks in the EU increased. Only 2015 saw a slight decrease of EU FDI stocks in Moldova. In 2015, Moldova, like other Eastern Partnership countries, suffered the consequences of the recession in Russia (lower remittances and exports). In addition, a poor harvest in 2015 dampened the recovery of industrial production, a prospect that might have deterred foreign investors36.
3.6 Ukraine Accounting for 73% of total inward FDI flows in Ukraine, the EU was the most important investor in the country in 201237. At Member State level, Figure 19 shows that Cyprus was of particular significance, being the source of more than 30% of total FDI inflows in Ukraine. Other EU Member States figure prominently, too, whilst Russia accounted for a share of 7%. However, due to the events of 2014, the data has likely changed significantly since then. Again, the British Virgin Islands figure in the top 10 of inward FDI flows, this time directly behind the UK itself.
Figure 19
Figure 20 shows that the drop in the relative share of Ukraine in EU investment from and to the Eastern Partnership countries (shown in figures 6 and 7 in chapter 2.1), is confirmed by the absolute figures. The EU FDI stocks in Ukraine decreased steadily from almost EUR 20 billion to less than EUR 10 billion per year in the period 2013-2016. A considerable fluctuation can be observed for Ukrainian FDI stocks in the EU over the same period, although the numbers are significantly smaller.
36 Economist Intelligence Unit, ‘Country Report: Moldova’, p. 7. 37 UNCTAD, ‘Bilateral FDI Statistics’.

Policy Department, Directorate-General for External Policies
24
As mentioned, the decrease is most likely linked to the political developments in the country leading to the Russian annexation of Crimea and the military conflict in its eastern regions, which investors may consider a serious risk. Corruption may also have played a part in investor’s decisions to withdraw capital.
Figure 20
Source: Eurostat

Foreign Direct Investment in the EU and the Eastern Partnership Countries
25
Conclusion Investment strength
There is a substantial difference in economic strength between the EU and the Eastern Partnership countries, which is also reflected in the investment figures. When looking for instance at the investment stocks for the year 2016 in the country-specific figures, we see that EU stocks in Eastern Partnership countries were at least three times greater (in the case of Armenia) and sometimes even 97 times greater (in the case of Azerbaijan) than the stocks of Eastern Partnership countries in the EU. The difference is most significant in the two countries where the EU invests the most: Azerbaijan and Ukraine. In the case of Ukraine, even though EU FDI stocks in the country have halved since 2013, its column in the diagram still dwarfs the reverse investment from Ukraine in the EU. For the region as a whole, EU FDI stocks in the Eastern Partnership were 30 times as big as FDI stocks of Eastern Partnership countries in the EU in 2016. The big economic differences we are dealing with may be sobering in the light of the ambitions of the deep and comprehensive free trade area the Association Agreements seek to create.
Investment countries
Although data for some countries is incomplete, tentative conclusions may be drawn with regards to the countries investing in Eastern Partnership countries, at least for the years 2012 or 2013. A remarkable conclusion is that each Eastern Partnership country seems to have a clear lead investor: a country that stands out above the others. This is very clearly the case for Belarus (about 45% of FDI comes from Russia), Armenia (about 40% of FDI comes from France) and Azerbaijan (about 40% of FDI comes from Turkey). To a lesser extent, we see leading investors for Ukraine (Cyprus accounts for about 32%), Moldova (Russia accounts for about 24%) and Georgia (the Netherlands accounts for about 22%).
Some of these relations could be explained by geographical proximity combined with historical or political ties, in particular the big share of Russia in Belarus, to a lesser extent Turkish investment in Azerbaijan, and Russian investment in Moldova. The dominant positions of France in Armenia, Cyprus in Ukraine and the Netherlands in Georgia need more research. Apart from these lead investors in each country, there are some countries which are active in several Eastern Partnership countries with investment shares of at least 5%. Leading in that sense is Russia, with investment above 5% in all six Eastern Partnership countries. Second is the Netherlands, with FDI above 5% in four of the six countries, with some 14% both in Azerbaijan and Moldova. In third place is Cyprus, equally present with FDI above 5% in four of the six countries. Fourth in this ranking is Turkey, lead investor in Azerbaijan and about 8% in Georgia, followed by the UK with major investments in Azerbaijan (about 13%) and Belarus, with a remarkable share of about 25%.
Investment policies
Even though the investment strength of the Eastern Partnership countries lags far behind that of the EU, there is the will on the EU side to promote and actively support investment in the region. This is shown by the growing involvement of the European Investment Bank and the steady increase of its lending capital. This much can also be concluded indirectly from the relatively high number of Bilateral Investment Treaties signed between EU Member States and Eastern Partnership countries. Even though the Association Agreements do not have investment provisions, or only very limited ones, the will from the EU as a whole to enhance growth in the Eastern Partnership region through trade and investment, can safely be concluded from the Deep and Comprehensive Free Trade Areas these agreements intend to establish. As we have seen, screening of investment in sensitive sectors does not seem to be of much importance with regards to the countries of the Eastern Partnership in terms of numbers. However, when smaller investments into such sectors are also taken into account, it cannot be excluded that it may be relevant in the future. The fact that well-known tax havens (the Seychelles and the British Virgin Islands) feature in the list of main investors in three of the Eastern Partnership countries, could be topic of further research, although the share of these investments is in all cases below 5%.

Policy Department, Directorate-General for External Policies
26
Figure 21
Source: Council of the European Union

Foreign Direct Investment in the EU and the Eastern Partnership Countries
27
Annex : Explanation of some basic concepts of investment Foreign Direct Investment - FDI
Foreign direct investment (FDI) is the category of international investment that reflects the objective of obtaining a lasting interest by an investor in one economy, in an enterprise resident in another economy. The lasting interest implies that a long-term relationship exists between the investor and the enterprise, and that the investor has a significant influence on the way the enterprise is managed. In this sense, it can be considered as a complement to or substitute for international trade, for example when enterprises invest to establish a new plant or office, or alternatively, purchase existing assets of a foreign enterprise in order to produce — and often sell — goods and services in countries other than where the enterprise was first established.
Formally, such a lasting interest exists when a direct investor owns 10% or more of the voting power on the board of directors (for an incorporated enterprise) or the equivalent (for an unincorporated enterprise). Under this threshold, investments are not considered as FDI in statistics. In this sense, FDI differs from portfolio investments because it is made with the purpose of having control, or an effective voice, in the management of the enterprise concerned and a lasting interest in the enterprise. It not only includes the initial acquisition of equity capital, but also subsequent capital transactions between the foreign investor and domestic and affiliated enterprises.
Investment Flows
In measuring FDI, one mainly distinguishes between FDI flows and FDI stocks. FDI flows record the value of cross-border transactions related to direct investment during a given period of time, normally a quarter or a year. They consist of three components: equity capital, reinvested earnings and intra-company loans. FDI flows with a negative sign indicate that at least one of the three components of FDI is negative and not offset by positive amounts of the remaining components. These are instances of reverse investment or disinvestment.
FDI flows are measured on a net basis. Net outward flows are transactions that increase the investment that investors in the reporting economy have in enterprises in a foreign economy. For example through purchases of equity or reinvestment of earnings, minus any transactions that decrease the investment that investors in the reporting economy have in enterprises in a foreign economy, such as sales of equity or borrowing by the resident investor from the foreign enterprise. Net inward flows are transactions that increase the investment that foreign investors have in enterprises resident in the reporting economy, minus transactions that decrease the investment of foreign investors in resident enterprises.
Investment Stocks
FDI stocks, on the other hand, measure the total level of direct investment at a given point in time, usually the end of a quarter or of a year. Thus, stocks are used mainly to establish the importance of direct investors of a country in a foreign economy. The outward FDI stock is the value of the resident investors' equity in and net loans to enterprises in foreign economies. The inward FDI stock is the value of foreign investors' equity in and net loans to enterprises resident in the reporting economy.
FDI stocks differ from the accumulated flows because of revaluation (changes in prices or exchange rates), and other adjustments like rescheduling or cancellation of loans or debt-equity swaps. Therefore, even if FDI flows indicate a significant disinvestment (negative values) this may not reduce the level of FDI stocks in a country if the other volume components (price changes, exchange rate changes or changes due to the recent inclusion of enterprises in the population of FDI statistics) substantially increased in the same period. For example, an equity capital acquisition abroad of 4% (i.e. less than 10%) in year n does not necessarily qualify a resident enterprise as being in a direct investment relationship with the non-resident company

Policy Department, Directorate-General for External Policies
28
(i.e. not in FDI flows statistics). Yet, if this company already had 7% of shares in the same foreign entity then this resident entity will have a total of 11% of shares in the non-resident entity and will enter in the population of FDI enterprises. At the end of year n, the external foreign assets of this company will be reclassified and included in the FDI stocks statistics.
Bilateral Investment Treaties and EU competence
EU Member States have negotiated Bilateral Investment Treaties (BITs) with investee countries to regulate and protect their investment. The first agreements date back to the 1960s. Today there are more than 3,000 BITs. EU member States account for 1,400 of these. In these investment agreements, countries have agreed upon a number of limited rules on how to treat foreign investors established in their country. For example, these may include the obligation not to discriminate against foreign investors, but to provide fair treatment, to compensate in case of expropriation, and to allow the investor to transfer funds freely.
Article 207 of the Treaty on the Functioning of the European Union, which entered into force on 1 December 2009, added FDI to the exclusive external trade competence of the EU. This means that the EU, while negotiating trade agreements, can include provisions on FDI in its trade agreements. However, following a recent opinion by the Court of Justice of the EU, some aspects of investment are excluded from the EU competence, in particular portfolio investment and dispute settlement.
Dispute settlement
If an investor considers that the basic rules laid down in a BIT have been breached by the state in which the investment is made, the investment agreements provide the possibility for investors to bring the matter before specialised investment tribunals set up under international UN or World Bank rules on arbitration. In this vein, most BITs include provisions on Investor-State Dispute Settlement (ISDS). ISDS is a mechanism that aims to ensure that commitments that countries have made to one another to protect mutual investments are respected.
International agreements, including investment agreements, are based on international law and most often do not form part of the domestic legal system. As a result, they cannot be invoked before domestic courts since the latter are only competent to rule on disputes brought on the basis of national law. This is the raison d'être for international tribunals, including for investment matters38.
In recent years, the system of ISDS has been subject of discussion, starting with possible inclusion of such provisions in the trade agreements the EU was negotiating with the USA (TTIP) and Canada (CETA). The ISDS tribunals were criticised for a lack of transparency and for the fact that they were not composed of professional judges. Therefore, the EU has decided to base its trade agreements on an enhanced form of dispute settlement, called International Court System (ICS). In the long run, the EU aims to set up a multilateral investment court, together with other countries.
38 European Commission, ‘Investor-to-State Dispute Settlement (ISDS) - Some facts and figures’.


