Embed Size (px)
Citation preview

FOREIGN DIRECT INVESTMENT (FDI) IN CHINA:
RECENT TRENDS AND CURRENT POLICY ISSUES
By John Henley, Colin Kirkpatrick, Georgina Wilde
John Henley is Professor of International Management at the Department of Business Studies, University of Edinburgh; Colin Kirkpatrick is Professor of Development Economics at the Institute for Development Policy and Management, University of Manchester; Georgina Wilde was previously Regional Director, Asia-Pacific with the Economist Intelligence Unit, London, and is now an independent consultant. The paper has been developed from presentations made at a Seminar on Investment and Development in Central and Western China, Wuhan, Hubei Province, PR China, November 1997, and was also presented at the Development Studies Association Trade and Industry Study Group meeting, March 1998. The comments of participants at both meetings, and of two anonymous referees, are gratefully acknowledged. I INTRODUCTION Foreign direct investment (FDI) is probably the single most important factor contributing to
the globalisation of the international economy. Flows of FDI are forging increasingly strong
economic links between developing and industrialised countries, and also among developing
countries. Foreign direct investment flows to developing countries (LDCs) have increased
nearly four-fold in the 1990s and now account for almost 40 per cent of global FDI, reaching
some $120 billion in 1997.
China is one of the most attractive locations for FDI in the world. In 1997, for example,
China accounted for 38 per cent of all FDI flows to developing countries. Net FDI has risen
from less than $5 billion in the early 1990s, to $37 billion in 1997 (World Bank, 1998). Yet,
despite this success, government policy towards FDI is faced with a number of significant
challenges. There is growing pressure for further opening of protected and restricted sectors
to foreign investors, as a necessary measure for facilitating China’s membership of the World
Trade Organisation; the regional and sectoral pattern of FDI has been highly skewed; in 1996

2
the value of contracted FDI fell by a fifth and it fell by a further 24 per cent in 1997,
heralding lower actual inflows in the years to come.(1)
The focus of this article is on the current policy issues relating to the attraction of FDI flows
to China. Part II considers the contribution that foreign direct investment can make to the
recipient economy, and discusses the policy issues associated with attracting FDI inflows and
ensuring that the benefits are shared between investor and the domestic economy to the
mutual advantage of both parties. Part III summarises recent trends in private capital flows to
developing countries and in particular East Asia, including China. Part IV focuses on FDI in
China, starting with a review of recent trends and continuing with a discussion of the main
vehicles of FDI, the importance of Hong Kong, the regional distribution, and contribution of
FDI to growth. The policy issues currently confronting decision-makers in China are
examined in section V. The final section concludes the paper.
II PROMOTING FOREIGN DIRECT INVESTMENT
Governments seek to promote inward foreign direct investment for a number of reasons.
First, transnational corporations (TNCs) may be able to supply scarce financial capital at a
relatively low cost since they can exploit their scale and the credit rating of the parent
company to obtain competitively priced finance. Key suppliers, international banks and other
financial services companies may also be expected to be drawn in to establish branch
operations to support major customers. A foreign partner can sometimes help a local partner
mobilise savings from domestic investors by adding credibility to a joint venture. TNCs may
also lend to associated domestic enterprises at competitive rates as part of developing
supplier or end user networks.

3
Where liberalisation and deepening of financial markets have occurred, options for raising
capital on the international market are increased. Nevertheless, for major capital projects
international bankers generally expect the business plan of the new venture to be at least, in
part, underwritten by a TNC. The same is also usually true of major privatisations where the
government seeks a so-called strategic investor with the necessary commercial vision and
resources with which to restructure former state-owned enterprises. This aspect of
privatisation is likely to feature significantly over the next few years as the Chinese
Government seeks to recapitalise, restructure or dispose of around one hundred thousand
state-owned enterprises.
A second and related benefit that foreign investors are expected to provide to the host country
is a commercially viable package consisting of superior process and product technology
supported by appropriate organisational and managerial capacities. Trade-related benefits
may be expected to flow from participating in the TNC’s global production and trading
network. TNCs should be well-equipped to exploit product and process technologies because
of their access to international markets and the economies of scale and scope they achieve.
Global competitive pressure and the need to innovate encourage TNCs to invest continually
in research and development. The ability to tap global markets for scientific talent and
organise research and development worldwide further strengthens this competitive advantage
of TNCs.
Foreign investment comes in many forms and the needs of investors vary. Thus the priorities
of a TNC establishing a new manufacturing facility on a greenfield site are likely to be very
different from those of an investor taking over an existing venture. Again, if a local joint
venture partner is involved the need for assistance with negotiating with the state bureaucracy

4
will be substantially reduced. A full-function manufacturing plant has much more complex
needs in getting established than a plant assembling products from imported components.
Perhaps of greatest concern to policy makers in China is the need to create a business
environment in which the positive effects of technology transfer and the benefits of other
intangibles such as modern management systems including marketing, accounting and quality
assurance systems are efficiently transferred. Without these transfers and resulting
productivity growth, there will, over time, be a net reduction in investable international
savings available to the domestic economy as a result of dividend outflows. Moreover many
studies confirm that without a minimum threshold stock of human capital and efficient
infrastructure, together with a conducive economic policy and regulatory framework that
results in a cost of doing business that is internationally competitive, FDI is unlikely to be
beneficial to the domestic economy.
Policy makers need to consider that decision makers in TNCs face inherent uncertainty about
the future benefits and costs of a given investment. One important policy objective must be
to reduce as much as is economically justifiable the uncertainty facing all potential investors.
This applies as much to domestic investors as foreign. While the latter face greater risks
associated with lack of familiarity with the Chinese business environment, foreign enterprises
tend to have more resources on which to draw. Uncertainty tends to favour labour-intensive
sectors over capital intensive ones. This is because labour can be shed more easily when
demand turns out to be lower than expected and can adapt more flexibly to changing
consumer preferences than product-specific machines. It also has to be remembered that
investors can control the timing of investment so that anything which improves the supply of

5
relevant information to investors is likely to prove beneficial in reducing uncertainty and
therefore enhance the probability of the correct investment decision being made.
Once investors have been attracted to a particular destination country, they expect a high
level of facilitation services. Governments all too often give inadequate attention to servicing
investors’ needs, even though large sums of money may have been spent on promotion
activities and success has been achieved against fierce international competition.
The provision of assistance to potential investors out of public funds is vital because
bureaucratic barriers turn away would-be investors. They can represent a significant start-up
cost to investors and are actively compared between alternative investment locations. The
quality of assistance is also usually the first real test for the investor of whether the host
authorities are genuinely friendly towards business. Supposedly ‘one-stop’ investment
promotion agencies are now virtually universal. However, the quality of the facilitation
process varies widely. While governments and provincial authorities may proclaim that their
agency has sole discretion in granting the variety of licenses and permissions required to
operate legally in their country, many, in practice, do not have the power to do so.
In China there still remain many overlapping responsibilities between local government
agencies and central government sectoral ministries and departments. Efficient public
interest regulation is an essential part of developing and maintaining a policy environment
conducive to private sector growth and investment. Unfortunately, in this regard, China has a
poor reputation for transparency and bureaucracy. Because China does not yet routinely
publish its rules and regulations, applicable laws are difficult to determine. The existence of
further internal (neibu) rules and regulations, which are unavailable to foreigners has long

6
been a source of contention and uncertainty for investors. For corporate strategists, the key
issues, as trade barriers fall, are increasingly enterprise-centred and revolve around where
firms locate their highly knowledge intensive activities. Once a locational decision has been
made, investment and trade flows within the TNC are determined simultaneously. What
matters are the factors that make particular locations attractive for a given set of activities for
both domestic and foreign investors.
There is mounting evidence that the gap between the winners and the losers in the
competition for domestic, regional and international markets is increasing in many countries.
In China, it is widely acknowledged that the major losers are primarily state-owned
enterprises. At the 15th National Party Congress it was announced that the Government was
going to become very much more active in tackling the problems of inefficient state
enterprises and facilitate industrial restructuring. No doubt the real work will devolve to
local governments and there will be many opportunities for creative collaboration with
foreign investors.
Even so, liberalisation can only take place at a speed compatible with the capacity and
capability of the institutions and political processes involved. As long as there is any
possibility of manipulating imperfections in international markets, national leaders need to be
able to shape market, investment and trade policies in order to protect the welfare of their
citizens. Any realistic portfolio of policy instruments has to allow for the possibility that a
country may have to insulate itself from threats to its economic well-being, for example, from
the consequences of extreme volatility in foreign capital flows or dumping of goods in the
domestic market by foreign producers (Moran, 1996). While defensive policies need to be
held in reserve, investment promotion relies on proactive policies that seek to enhance the

7
attractiveness of a country or region to investors - domestic and foreign - through appropriate
investment in physical infrastructure and human capital and in the provision of a market
friendly policy environment.
To summarise, a country’s domestic policy framework, combined with local economic
factors, including physical infrastructure provision, size of the domestic market, and labour
costs, all play a critical part in influencing the transnational corporation’s choice of location
for its foreign investment and production activities. The challenge to policy-making is to
develop a policy environment which encourages and facilitates FDI inflows, which ensures
that the benefits flowing from the foreign investment are shared between the investor and the
domestic economy in ways that are acceptable and to the mutual advantage of both parties.
The following sections of this paper examine the ways in which policy makers in China have
addressed the challenge of promoting and sustaining foreign direct investment inflows.
III RECENT TRENDS IN INTERNATIONAL INVESTMENT FLOWS TO DEVELOPING COUNTRIES
Private net capital flows to developing countries have risen dramatically in recent years and
now account for 85 per cent of aggregate net long-term resource flows to LDCs (Table 1).
All categories of private flows have risen significantly during the past decade, although FDI
continues to account for the major share, contributing about half of total private flows (Table
2).
The distribution of FDI among developing regions is very uneven (Table 3) with East Asia
and Latin America between them accounting for close to 80 per cent in 1995. China is by far
the largest country recipient of FDI, with inflows of $37 billion in 1997. But the closed
nature of its capital account has kept the flow of portfolio investment modest.(2)

8
Table 1: Net long-term resource flows to developing countries, 1990-97 (billions of US dollars)
Type of flow 1990 1991 1992 1993 1994 1995 1996 1997a All developing countries Official development finance Total private flows Debt flows Commercial bank loans Bonds Other Foreign direct investment Portfolio equity flows
98.3 56.4 41.9 15.0 3.8 0.1
11.1 23.7 3.2
116.362.753.613.53.47.42.7
32.97.2
143.953.890.133.813.18.3
12.445.311.0
208.153.6
154.644.02.8
31.89.4
65.645.0
206.245.5
160.641.18.9
27.54.7
86.932.6
243.1 54.0
189.1 55.1 29.3 23.8 2.0
101.5 32.5
281.
6 34.7 246.
9 82.2 34.2 45.7 2.3
119.0
45.8
300.344.2
256.0103.241.153.88.3
120.432.5
a. preliminary Source: World Bank (1998)
Table 2: Aggregate net private capital flows to developing countries, 1990-97
(billions of US dollars) Type of flow 1990 1991 1992 1993 1994 1995 1996 1997a Total private flows Portfolio flows Bonds Equity Foreign direct investment Commercial banks Others Memo items Aggregate net resource flows Private flows’ share (percent)
41.9 3.3 0.1 3.2
23.7 3.8
11.1
98.3 42.6
53.614.67.47.2
32.93.42.7
116.3
46.1
90.119.38.3
11.045.313.112.4
143.9
62.6
154.6
76.831.845.065.62.89.4
208.1
74.3
160.6
60.127.532.686.98.94.7
206.2
77.9
189.1
56.323.832.5101.
529.32.0
241.1
78.4
246.9 91.5 45.7 45.8
119.0 34.2 2.3
281.6 87.7
256.686.353.832.5
120.441.18.3
300.385.4
a. Preliminary Source: World Bank (1998)

9
Table 3: Net foreign direct investment in developing countries, 1990-96 (billions of US dollars)
Country or country group 1990 1991 1992 1993 1994 1995 1996 1997a All developing countries Sub-Saharan Africa East Asia and the Pacific South Asia Europe and Central Asia Latin America and the Caribbean Middle East and North Africa Income group Low-income countries Middle-income countries Major recipient countries China Mexico Malaysia Brazil Indonesia Thailand Argentina Hungary Poland Chile Memo item Low-income countries excluding China
24.50.9
10.20.52.18.12.8
4.520.0
3.52.52.31.01.12.41.80.00.10.6
1.0
33.51.6
12.70.54.4
12.51.8
7.126.3
4.44.74.01.11.52.02.41.50.30.5
2.7
43.60.8
20.90.66.31.72.2
13.929.8
11.24.45.22.11.82.12.61.50.70.7
2.7
67.21.6
38.10.88.4
14.14.2
32.035.2
27.54.45.01.32.01.83.52.41.70.8
4.5
83.73.1
44.11.28.1
24.23.0
39.144.6
33.811.04.33.12.11.40.61.11.91.8
5.3
95.5 2.2
51.8 1.8
17.2 22.9 -0.3
41.6 53.9
35.8 7.0 5.8 4.9 4.3 2.1 1.3 4.5 3.7 1.7
5.8
119.0
3.3 58.7 3.4
14.9 38.0 0.6
49.5 69.4
42.3 6.4 6.2 5.5 5.8 2.9 2.0 1.7 4.2 2.2
7.2
120.43.0
53.24.1
15.542.02.6
46.773.6
37.08.14.1
15.85.8
N/A3.8
N/A4.53.5
9.7
a. Preliminary Source: World Bank (1998)
A distinctive feature of FDI in the East Asia region is the importance of intra-regional
investment flows. For the major Asian developing countries, nearly 40 per cent of FDI stock
is attributed to other Asian economies. The ‘flying-geese’ process of industrial restructuring
has been the driving force behind these intra-regional flows, with the newly industrialising
countries (NICs) especially Hong Kong S.A.R. and Singapore competing to become regional
business centres that will attract FDI in services and high technology industries, while the

10
South East Asian countries and China have targeted investments which will contribute to the
upgrading of existing labour intensive, low technology industrial bases (UNCTAD, 1997).
The upsurge in global FDI has been accompanied by new forms of transnational involvement
and organisation. In contrast to earlier periods of FDI when greenfield investment was the
most popular mode of market entry, since the mid-1980s mergers and acquisitions have been
used increasingly as a means of entering foreign markets. This trend has been reinforced by
the worldwide wave of privatisation which has given foreign investors new opportunities to
purchase existing firms and assets. Complementing the growth in mergers and acquisitions,
the number of cross-border inter-firm agreements (equity and non-equity) has also increased.
These include arrangements involving joint-ventures, licensing, sub-contracting, franchising,
marketing, research and development agreements. Inter-firm agreements in the form of
strategic partnerships have little or no equity involvement, but are used to gain access to
complementary technology and to reduce the costs and risk to each partner firm.(3)
These changes in the organisational structures of TNCs have been driven by the pressures of
international competitiveness and have in turn stimulated the growth in FDI. The major
unknown factor with respect to FDI trends in the East Asia region is the impact of the
financial turbulence in Asian financial markets triggered by the float of the Thai baht on 2
July 1997, and the sharp loss of value in regional stock markets that followed. The
turbulence on Asian financial markets, accompanied by the continuing and persistent
recession in Japan, has lowered regional growth prospects and raised demand for foreign
capital. Competition for FDI flows within Asia has been intensified. At the same time, the
increasing global integration of financial markets and the internationalisation of investment
portfolios have facilitated greater financial flows to and out of the developing countries, as
11
investors have become more willing and able to invest internationally. Unfortunately for
investment in productive capacity, portfolio investments are inherently more volatile than
FDI and the crises in the financial markets of Southeast and East Asia provoked by a series of
competitive devaluations in the region, have led to a sharp fall in net private flows to Asia in
the second half of 1997. Net private flows fell from $141.8bn in 1996 to $107.1bn in 1997
with no rebound expected in 1998. As a high proportion of total borrowing by enterprises is
in short-term debt, much of it denominated in US dollars, this reduction in liquidity has been
immediate and severely damaging. The costs of debt servicing have risen dramatically,
damaging demand and in many cases fatally damaging cash flow at enterprise level. Some
governments in the region have been forced to call in the IMF which in turn has required the
authorities to introduce far-ranging reforms of financial institutions and domestic financial
markets and to tighten fiscal and monetary policy, reducing growth. China and Hong Kong
S.A.R. have so far been able to resist downward pressure on their currencies; the former by
virtue of its limited integration with global financial markets, a result of a closed capital
account; the latter at the cost of sharply higher interest rates and direct government support of
the Hong Kong stock market. Both also have strong external accounts.
Since the mid-1980s, a growing number of developing countries, not just in Southeast and
East Asia, have increased the openness of their markets through the progressive lowering of
barriers to trade and foreign investment, the liberalisation of domestic markets and the
removal of restrictions on capital movements. Indeed Latin America only began to
experience a significant loss in private flows as a result of financial “contagion” from Russia
in August 1998. Of course, the continuing financial crisis and worsening recession in Asia
remained an important contributory factor in the sharp decline of investor confidence
worldwide in 1998. Although many changes have been embodied in new investment laws,

12
events in South East and East Asia since July 1997 and Russia in 1998 have demonstrated
that reform of domestic financial institutions and the creation of appropriate regulatory
regimes, have not gone far enough to secure stability and reduce uncertainty for foreign
investors in the region.
IV FOREIGN DIRECT INVESTMENT IN CHINA
Recent FDI Inflows
Following the establishment of the first four Special Economic Zones in 1979, the opening of
14 coastal cities in 1984 and subsequently the interior provinces, to foreign direct investment,
China has been highly successful at attracting FDI in various forms. By mid 1997, about 200
of the world’s 500 largest transnational corporations had established operations in China. As
Table 4 shows, cumulative net inflows of direct investment between 1979 and 1997 were
worth a reported $220 billion. From modest amounts in the 1980s, and only exceeding some
$3 billion a year in 1988, FDI flows started to accelerate sharply from 1991, especially after
the famous ‘southern journey’ endorsing rapid growth and reform made by the late Deng
Xiaoping in early 1992. In 1995 the ratio of FDI to GDP was 5.5 per cent, ranking China
third among developing countries (Table 5).(4)
Table 4: Utilisation of direct foreign investment
Year ($m)
Cumulative ($m)
1979-83 1,802 1,8021984 1,258 3,0601985 1,661 4,7211986 1,874 6,5951987 2,314 8,9091988 3,194 12,1031989 3,392 15,4951990 3,487 18,9821991 4,366 23,3481992 11,007 34,3551993 27,515 61,870

13
1994 33,767 95,6371995 37,521 133,1581996 41,726 174,8841997 (a) 45,000 219,141
(a) press reports Source: State Statistical Bureau (SSB), China Statistical Yearbook, 1997
Table 5: FDI ranked by Share of GDP, 1995
Share of GDP (%)
Share of total investment (%)
Hungary 9.3 46 Malaysia 6.9 21 China 5.5 13 Chile 4.6 18 Indonesia 2.3 8 Nigeria 1.7 11 Poland 1.6 10 Argentina 1.4 8 Thailand 1.4 3 Mexico 1.2 5 Greece 0.9 4 Brazil 0.5 3
Source: EIU, China Market Atlas, 1997.
The main vehicles for FDI
There are three main vehicles for foreign investment: equity joint ventures (EJV);
cooperative joint ventures (CJV) and wholly foreign-owned venture (WFO). Joint-stock
companies and limited-liability companies are less prevalent, but have started to appear.
Various rules apply, covering: the minimum level of foreign participation (25 per cent in an
EJV and CJV); debt/equity limits; definition of approval authorities and levels of government
able to give approval; general and preferential tax rates.(5)

14
Numerous less formalised assembly and processing agreements also operate, under which
Chinese factories produce on behalf of foreign partners, chiefly for export. Foreign investors
in China fall into two very broad categories: those using its cheap labour for an export
platform and those whose target is the Chinese market itself. Generally speaking,
comparatively small scale investments, often originating from Hong Kong and Macau fall
into the first category and transnational corporations fall into the second.
Table 6: FDI by type of investment, 1992 and 1996
1992 1996 No of
Projects Value ($m)
% of total No of Projects
Value ($m)
% of total
Joint venture
34,354 29,128.5 50.1 12,628 31,876.4 43.5
Co-operative venture
5,711 13,255.5 22.8 2,849 14,297 19.5
WFO 8,692 15,696.2 27.0 9,062 26,810.3 36.6Total 48,764 58,123.5 100 24,556 73,276.4 100
Sources: SSB, China Statistical Yearbook, 1994 and 1997 Of the three main kinds of foreign direct investment, Table 6 shows wholly foreign-owned
enterprises have become an increasingly popular investment vehicle during the 1990s, rising
from 27 per cent of the total value of projects signed in 1992 to 37 per cent in 1996. The
increasing popularity of this form of foreign direct investment testifies, inter alia, to a
growing confidence which investors feel about establishing a presence in China. The
reassurance provided by having a Chinese joint-venture partner is clearly deemed less
necessary than it once was.
The predominance of flows from Hong Kong
Although, as noted, about 200 of the world’s largest multinationals have established
operations in China, the bulk of the realised investment, 58 per cent according to official
15
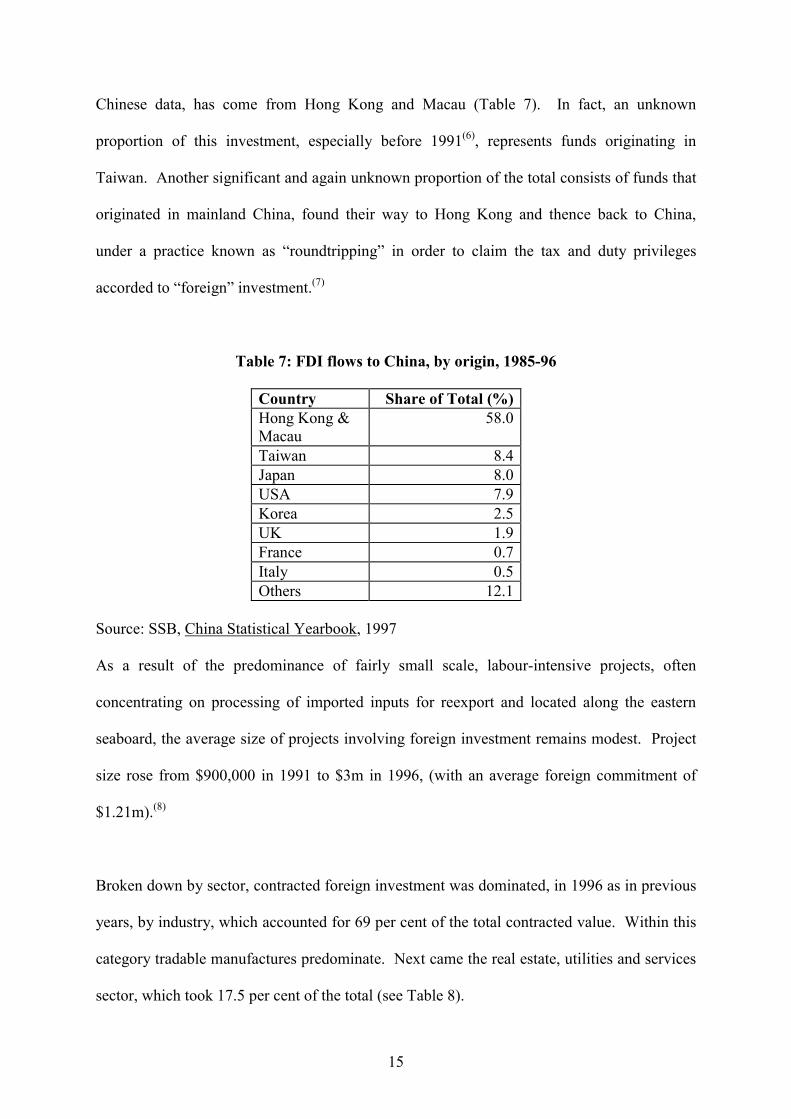
Chinese data, has come from Hong Kong and Macau (Table 7). In fact, an unknown
proportion of this investment, especially before 1991(6), represents funds originating in
Taiwan. Another significant and again unknown proportion of the total consists of funds that
originated in mainland China, found their way to Hong Kong and thence back to China,
under a practice known as “roundtripping” in order to claim the tax and duty privileges
accorded to “foreign” investment.(7)
Table 7: FDI flows to China, by origin, 1985-96
Country Share of Total (%)Hong Kong & Macau
58.0
Taiwan 8.4Japan 8.0USA 7.9Korea 2.5UK 1.9France 0.7Italy 0.5Others 12.1
Source: SSB, China Statistical Yearbook, 1997 As a result of the predominance of fairly small scale, labour-intensive projects, often
concentrating on processing of imported inputs for reexport and located along the eastern
seaboard, the average size of projects involving foreign investment remains modest. Project
size rose from $900,000 in 1991 to $3m in 1996, (with an average foreign commitment of
$1.21m).(8)
Broken down by sector, contracted foreign investment was dominated, in 1996 as in previous
years, by industry, which accounted for 69 per cent of the total contracted value. Within this
category tradable manufactures predominate. Next came the real estate, utilities and services
sector, which took 17.5 per cent of the total (see Table 8).

16
Table 8: Contracted foreign investment, by sector, 1996
No of Projects Value ($m) % Share Agriculture, forestry, fishery and water conservancy
812 1,139 1.6
Industry 18,280 50,486 68.9Construction 387 2,001 2.7Transport and telecommunications 196 1,599 2.2Commerce, catering and marketing 1,655 2,347 3.2Real estate, utilities and services of which: Hotels Education Science and research Others
1,961
8163
124950
12,850
291 171 175
2,154
17.5
0.40.20.22.9
Total 24,241 72,576 100.0 Source: SSB, China Statistical Yearbook, 1997
Table 9: Foreign direct investment inflows, by province, $m
1985-89
1990 1991 1992 1993 1994 1995 1996 Total % shar
e
Population m
% shar
e Eastern Provinces Beijing Tianjin Liaoning Shanghai Jiangsu Zhejiang Fujian Shandong Guandong Hainan
1167.7 424.3 421.5 1127 435.5 185.5
820 419.3
4825.2 212.4
279 36.9 257.
3 174 134 41.9 319.
9 185.
7 1582
.3 103
245 132.
6 362.
4 145.
2 219.
2 92.3 471.
2 216.
4 1942
.9 176.
7
349.9 107.8 516.4 493.6 1463.
2 239.8 1423.
6 1003.
4 3701.
1 452.6
666.9613.71279.
13160.
32843.
71031.
82874.
41874.
17555.
8707.1
1371.6
10151440.
12473.
13763.
21150.
33713.
22552.
49463.
4918.1
10801520.
91424.
62892.
65190.
81258.
14043.
926891026
0.11062.
1
1552.9
2152.7
1737.8
3940.9
5210.1
1520.5
4084.5
2633.5
1175.4
6713 6003.
9 7439.
2 14406
.7 19259
.7 5520.
2 17750
.7 11573
.8 40506
.2 4421.
4.2 3.8 4.7 9.0
12.0 3.5
11.1 7.2
25.3 2.8
12.69.5
41.114.271.143.432.687.469.67.3
1.00.83.41.25.83.52.77.15.70.6

17
789.1 1
Central and Western Provinces Hebei Shanxi Inner Mongolia Jilin Heilongjiang Anhui Jiangxi Henan Hubei Hunan Guangxi Sichuan Chongqing Guizhou Yunnan Tibet Shaanxi Gansu Qinghai Ningxia Xinjiang
180.4 21.9
26
146.1 169.2 78.1 43.1
142.8 97.3 98.6
199.1 138.2
49.7 27.9
334.6
4.5 2.9 1.8
48.5
44.5 3.4
10.6 17.6 28.4 13.5 7.5
11.4 31.8 14.2 35.6 24.4
11.1 7.4
47.3 1.2
0.3 5.4
56.6 3.8
1.7
31.6 20.9 10.7 19.5
38 46.6 25.4 31.9 80.9
16.3 3.5
31.8 4.8
0.2 0.2
113.1 53.8
5.2
75.3 72.2 54.7 99.7 53.2
203.1 132.7
182 112.1
19.8 28.8
45.5 0.4 0.7 0.4
396.586.4
85.3275.3232.3257.6208.2304.9540.5437.5884.6571.4
42.997
234.3123.2
11.953
523.431.7
40.1241.9347.6
370261.7386.7601.9331.1836.3921.7
63.665
238.887.82.47.3
48.3
546.763.8
57.8408
516.9482.6288.9478.6625.1507.7672.6541.6
5797.7
324.163.91.63.9
54.9
830.2138.1
71.9451.5
567506.6301.3523.6680.8745.3663.1440.9
31.465.4
326.1901
5.563.9
2691.4
402.9
298.6 1647.
3 1954.
5 1773.
8 1229.
9 1939.
2 2827.
1 2292.
5 3505.
2 2831.
2
291.8 392.7
1582.
5 264.6 11.8 31.3
274.2
1.7 0.3
0.2 1.0 1.2 1.1 0.8 1.2 1.8 1.4 2.2 1.8
0.2 0.2 0.0 1.0 0.2 0.0 0.0 0.2
64.831.1
23.126.137.360.7
4191.758.264.3
46114.3
35.540.42.4
35.424.74.95.2
16.9
5.32.5
1.92.13.05.03.37.54.85.33.89.3
2.93.30.22.92.00.40.41.4
Total
11849.
1
3429
.6
4428
.3
1100
4.1 2734
1.73326
7.73721
5.53130
1
15983
7
100.
0 1224 100.
0 Sources: SSB, China Statistical Yearbook, various years

18
FDI inflows are unevenly distributed
The unevenness of the distribution of FDI inflows by province is well known. As Table 9
shows, inflows to the ten (eastern) provinces which each took more than 2.5 per cent of
cumulated FDI inflows in 1985-96, accounted for 83.8 per cent of the total inflows in the
same period. These ten provinces (the three municipalities of Beijing, Tianjin, and Shanghai
plus the six eastern provinces of Liaoning, Jiangsu, Zhejiang, Fujian, Shandong, Guangdong
and the island of Hainan), moreover, accounted for only 31.8 per cent of China’s population
in 1996.(9)
The distribution of the 500 largest foreign-funded enterprises (FIEs) (in terms of sales value
in 1995) is even more skewed. The top 500 FIEs were mainly engaged in electronics;
machine-making; food-processing; textiles and clothing and automobiles and more than half
of them (257) were funded with capital from Hong Kong and Macau. Of the rest, Japan
accounted for 66 and the USA for 50. The top 500 were distributed among 24 provinces and
municipalities, 91 per cent of them along the coast.(10)
The contribution of FDI to growth
The contribution that foreign direct investment has made to the Chinese economy during the
period since 1980, and especially since 1992, has been considerable. Inflows of FDI have
been more than sufficient to finance periodic current account deficits on the balance of
payments.(11) As Table 10 shows, moreover, FIEs have made a significant contribution to
investment and industrial output. Between 1991 and 1995, employment in FIEs rose from
4.8 million to 16 million. By 1995 FIEs were also significant contributors to central and local
government revenues, contributing 10 per cent of all taxes paid.

19
Table 10: Role of foreign direct investment in China, 1991-96 (percentage shares)
1991 1992 1993 1994 1995 1996FDI/gross domestic investment 3.3 6.4 10.7 17.5
13.5 12.2
FDI exports/total exports 17 20.4 27.5 28.7 31.3 40.7FDI imports/total imports na 32.7 40.2 45.8 47.7 54.5FDI industrial output/total industrial output 5 6 9 11
13 14.5
Sources: EIU, China Market Atlas, 1997. The available data may exaggerate the contribution of foreign investment for a number of
reasons. First, an unknown proportion of the FDI flows are in fact moneys that originated in
China and have returned, via Hong Kong, to seek the privileges afforded only to foreign
investment under the prevailing investment regime. Second, the overvaluation of capital
equipment contributed to joint ventures by foreign investors may contribute to overestimation
of FDI inflows. About 70 per cent of FDI inflows into China are ‘in kind’, and the translation
of these investments into cash tends to overvalue the amount of FDI. The motives behind
overvaluation include a larger share of dividends vis a vis local partners, lower taxes arising
from larger capital expenditures and depreciation credits, and greater management control
(UNCTAD, 1995).
Finally, the share of FDI flows in GDP and investment may also be exaggerated by a
downward bias in the data for GDP. The World Bank now considers that China’s GNP per
capita at purchasing power parity (PPP) lay in the range of $2920 in 1995(12), compared with
an official exchange rate GNP per capita valuation of $620. Even if the official data no
longer underestimate China’s GDP by a factor of four, as implied by the World Bank
estimate, there is no doubt that the data as currently presented contain significant distortions.
It is also probable that domestic production, output and domestic consumption are quite
significantly underestimated with the result that trade as a share of GDP is exaggerated.(13)

20
The same reasoning applies to the apparent trade benefits of FDI: an exaggerated numerator
is being applied to an underestimated denominator.
Balance of payments effects of FDI
As noted above, because of deficiencies in trade and investment statistics, it is difficult to
estimate the balance of payments effects of FDI in China. Moreover, dividends and profit
remittances overseas were not reported until 1995. While the total direct impact of the
transactions of FIEs on the BOP has been positive, this is largely due to continuing heavy
inflows of FDI. By contrast, the net trade effect has been substantially negative. Thus in
1995, for example, FIEs exported $46.9 billions worth of goods and imported $62.9 billions.
Dividends and profit remittances amounted to $10 billions so the overall current account
effect of FEI transactions was a deficit of $26 billions. However after adjusting for capital
account inflows of $35.8 billions of FDI, there was a surplus of $9.8 billions.
UNCTAD (1997) decomposes the trade statistics of FEIs between 1994 and 1996 into
processing and non-processing trade. Non-processing trade (mostly capital goods for
investment), showed large deficits. Processing trade registered a net surplus, as might be
expected, but more encouraging, the import intensity of processed exports declined from 92
per cent in 1994 to 78 per cent in 1996.(14) There is most probably scope for further
improvement, always provided that more local suppliers become competitive and are able to
match international quality standards and delivery schedules.
It is also noteworthy the extent to which all Chinese exports are still import intensive. About
two-thirds of all China’s exports are based on the processing of imports with a domestic
value-added of only about 25 per cent. Unfortunately for trade relations, a substantial

21
proportion of these imported raw materials and intermediate goods are sourced in Asia and
exported as finished goods to the US, and to a lesser extent, to Europe. It is becoming
increasingly important that China improves the domestic value added of all its manufactured
exports, regardless of whether foreign investment is involved, if it is to progress beyond its
current function as a manufacturing processing centre for the world economy (Bosworth,
1996).
Increasing domestic value added implies development and use of modern product and process
technologies. One of the major barriers to the adoption and diffusion of these technologies in
China is the lack of an effective legal system to enforce intellectual property rights.
Copyright infringement is rampant in China, damaging to the domestic producers’ profits and
foreign investors. It deters both domestic innovation and the transfer of state of the art
technology to China from outside. Presently, the Chinese government seems incapable of
controlling piracy. Progress towards developing an effective Chinese system for protecting
intellectual property is painfully slow, primarily because enforcement is the responsibility of
local officials who are less than impressed by the international commitments of central
government (Ross, 1996).
Summary
There is no doubt that foreign direct investment has played an increasingly important role in
China’s economic development in the reform era. In tangible terms, it has contributed to
investment, to exports, to employment and to the coffers of central and local governments. It
has stimulated the creation of many thousands of enterprises, often export-oriented and has
thus contributed significantly to growth. It has helped forward the modernisation drive by
introducing new technologies and management techniques. It has introduced and spread

22
concepts of competition and marketing and helped Chinese products to find markets abroad.
It has arguably fostered the development of a more demanding and discriminating domestic
consumer market which has in turn helped to stimulate a response among Chinese enterprises.
V POLICY ISSUES
Pressures for Policy Reform
China’s policy towards FDI is now at a cross-roads. During 1996 the value of contracted (as
opposed to realised) FDI fell by 20 per cent; it fell by another 24 per cent, to $55.9 billion in
1997, and there was, according to press reports, a slowdown in realised inflows in recent
years.(15) Data on rates of return on FDI in China are scarce, but it has been reported recently
that more than half the multinational corporations in China are failing to make a profit.(16)
The Asian currency crisis, with its inevitable toll on growth, will effect investment flows to
China from within the region and there may be a further slowdown of commitments from the
developed world, as other countries compete for investment flows. It is arguable, in any case,
that the large flows of the 1990s were not sustainable, or readily absorbable, in the longer
term. An additional pressure for policy changes is the recognition that the devolved and
localised character of the investment regime has inhibited the development of transparency,
especially in the realm of taxation and the foreign exchange regime. It has also, by allowing
local governments to engage in competitive bidding for inflows, fostered some uncompetitive
investments and encouraged local governments to protect some of those enterprises with
foreign investment (FIEs) under their jurisdiction in ways that pervert the development of an
open market in China. The result of the high degree of local government autonomy, de facto
and de jure, in negotiating with foreign investors and doing deals has been that prospective
foreign investors are often unclear as to what investment regime will actually apply once an
investment has been made. Hence the incentive effect of what is on offer is thereby reduced.
23
As elsewhere in the region, the “enclave” approach to FDI has outgrown its usefulness in the
areas where investment has been most buoyant. The prosperous eastern seaboard of China
has, with the help of large inflows of FDI, and in the case of Shanghai in particular, with
huge amounts of public money allocated to infrastructure projects that are coming rapidly on
stream, reached a development stage that is largely self-sustaining. FDI inflows can be
expected to continue to come to the coastal provinces. But the investment will come in
search of a comparative advantage that no longer rests, as before, on a combination of cheap
labour costs and locational advantages. It has shifted towards a more complex offering,
based on the quality and productivity of labour and capital. Moreover, the reasons why
foreign investors will seek to establish ventures in this most developed region will not differ
greatly from the motivation for domestic investors in the same area.
The fundamental reason why most transnational companies invest in China is a desire to
position themselves for easy access to the huge domestic market. There is mounting pressure
from the requirements of the World Trade Organisation, China’s major trading partners, and
from the desire of local and provincial governments to attract inflows of foreign capital, to lift
restrictions and open protected and restricted sectors to foreign investment.
The 1995 Guidelines
The central government, recognising the need to provide a clearer picture of evolving policy
towards foreign direct investment, issued a new set of guidelines in June 1995. These charge
the State Planning Commission with publishing a Foreign Investment Catalogue to be used
by the Ministry of Foreign Trade and Economic Co-operation (MOFTEC) and other

24
authorities assigned with responsibility for approval of foreign investment. This divides
projects into four categories:
• encouraged - including new agricultural technology; construction of energy
communications and raw materials projects for industry; new or advanced technology;
projects that enhance exports; projects that use renewable resources or involve new
technology or equipment for pollution control or prevention; investments developing the
central and western part of China;
• restricted - including projects already developed in China where the technology had
already been imported and capacity can meet demand; industries where the state is
experimenting with foreign investment, although a state monopoly still exists; exploration
and/or extraction of minerals; projects in industries requiring central planning. Projects in
the restricted category are divided into A and B categories. For A category projects the
assets of Chinese investors must come from their own funds and are subject to the normal
hierarchy of approval, while for B projects approval below the limit for central approval
must still be examined by the relevant central authorities;
• prohibited - include dangerous, polluting or wasteful processes.
As well as encouraging investment in the broad categories outlined above, China has
announced plans to encourage foreign investment in infrastructure. It is also beginning to
allow Sino-foreign joint-ventures in retailing. The financial sector - banking and insurance -
is beginning to be opened to foreign investment on a trial basis.
Levelling the playing field
In pursuit of the policy of national treatment for all investors, the Chinese government
announced the removal of duty-free status on capital goods imports by FIEs with effect from

25
April 1996. Although this was heavily qualified with grandfather provisos, its removal, along
with that of other tax breaks, provoked protests by prominent foreign investors to the effect
that such changes would render their operations excessively costly(17). These changes have
been cited as one of the reasons for the falloff in investment commitments in 1996-97 noted
above. The then deputy premier, Zhu Rongji, speaking at a meeting held during the annual
meeting of the World Bank and the International Monetary Fund in September 1997, in Hong
Kong, seemed to suggest that the lobbying of foreign companies, supported by provincial
officials eager to attract investment, was having some effect. It has since been announced
that previous exemptions constituting a list of eighteen separate, mainly high technology,
industries will be restored. This apparently retrogressive step back towards ‘lists’ of
approved projects along the lines of the 1995 Guidelines has been met by some dismay.
Meanwhile, on another track, it was announced that from January 1997 the Shenzhen Special
Economic Zone authorities would allow FIEs with “advanced technology” to sell 100 per
cent of their products on the domestic market.
VI CONCLUSIONS
The Chinese government currently faces a number of major policy choices relating to the
foreign investment policy framework. Judged by recent statements, its priorities are:
• To continue to attract high-technology, large ticket investment, in order to pursue
industrial restructuring and to foster import-substituting investment;
• To attract large sums of FDI into infrastructure, where expenditure of over nearly $750bn
is expected to be needed between 1995 and 2004(18);
• To attract investment into the interior provinces, consonant with the aim, enshrined in the
current ninth Five Year Plan, of spreading development inland;
26
• To design an investment regime which, while it does not conflict with the demands of
membership of the World Trade Organisation, also allows for the pursuit of industrial
reform at a measured pace;
• To open the domestic market to foreign investment across a broader spectrum,
encompassing services, but not so rapidly that existing or as yet undeveloped national
enterprises are unable to compete.
Macroeconomic considerations, pressed home by such advocates of liberalisation as the
World Bank, would argue for a levelling of the playing field and thus abolition at the earliest
date possible, of the special privileges accorded to foreign investment. It is indeed true that
the “enclave” approach adopted to date embodies opportunity costs in terms of taxation
foregone. Because of its bias towards the processing of import-intensive manufactures for
export the current investment regime has not encouraged investment in projects with strong
linkages to the rest of the economy.(19) In addition, the devolved and localised character of
the investment regime has inhibited the development of transparency, especially in the realm
of taxation and the foreign exchange regime. It has also, by allowing local governments to
outbid each other for inflows, fostered some dubious investments and helped to encourage
local governments to seek to protect the FIEs under their jurisdiction from legitimate
competition.
These arguments for abolishing special privileges are based on the well-documented view
that it is the size of the Chinese market, its rate of growth, costs, skills, infrastructure, and the
stability, transparency and effectiveness of the regulatory framework which are of key
importance to transnational corporations in their investment decisions, rather than the
presence or absence of special privileges. If they hold sway with the leadership, a steady

27
opening of the investment regime, along with the creation of a robust and transparent
institutional framework can be expected. Particular attention at the national level needs to be
paid to establishing an institutional and regulatory environment that will be conducive to
attracting investment. The powers that local governments have to act flexibly in order to
attract investment will need to be redefined and articulated to further these aims. There will
still be plenty of opportunity for entrepreneurial local government administrations to facilitate
inward investment in ways that reduce the perceived risk of investment in a given location
but do not interfere with commercial competition. The infrastructural deficiencies of much of
central and western China continue to provide substantial barriers to entry for all investors.
Free access to the domestic market is a pre-condition of inward investment in the interior by
domestic investors based in the coastal provinces as much as for foreign investors. Much
remains to be done to improve administrative efficiency and reduce the cost of doing business
even in the coastal provinces. Less attention to “special deals” and more emphasis on
improving good governance overall will also improve the quality of inward investment by
making sure that investors are making decisions based on an accurate appraisal of the
medium-to-long term economic and political risks involved.
The financial crisis in Asia has damaged investor confidence in the region. No less than 77
per cent of Chinese inward FDI in the period 1985 to 1996 originated in east and north-east
Asia (Table 7). No one yet knows what the consequences are going to be for investment and
economic growth of the radical re-alignment of exchange rates that has occurred since July
1997. Certainly China has lost some short-run price advantage to competitors for foreign
investment in the region, but more damaging in the medium term is the potential impact on
the overall supply of investable funds from the region and the recession in regional export
markets.(20) China needs to be able to attract inflows of investment in order to help finance

28
the very large infrastructural projects that it must undertake. It also needs to maintain a
buoyant export sector to provide jobs and foreign exchange, but it has pledged not to engage
in competitive devaluations that anyway, would not be in China’s national interest. Under
these conditions, maintaining the flow of foreign investment into China, and increase the
flow of funds to the central and western provinces in particular, is likely to be difficult and
will depend crucially on two factors. First, success in further opening up the domestic market
to greater foreign competition, and second, at the same time managing macroeconomic policy
so that domestic demand absorbs some of the slack in export markets.
CHK/klh/19.10.98/FDICHINA.PAP
Notes
(1) See SSB, China Statistical Yearbook, 1997, p.605. Contracted FDI always exaggerates actual investment, sometimes by as much as four fold.
(2) Portfolio investment in China has only just started to reach significant amounts; it was
$ 6.9 billion in 1997. (3) These new forms of inter-firm cooperation are discussed in detail in UNCTAD (1997). (4) But see below for a discussion of why FDI flows and GDP may be measured
inaccurately. (5) See, Economist Intelligence Unit (EIU), Investing, Licensing and Trading Conditions
Abroad (IL&T), China, 1997. A fourth category of FDI Project a so-called “Joint Development” or production sharing agreement was popular in the 1980s but had all disappeared by 1995.
(6) Before that date, investment from Taiwan in mainland China was forbidden; since
then it has been permitted with certain restrictions. (7) The size of these flows is unknown but some estimates quoted in UNCTAD, World
Investment Report 1995, put them at about 20 per cent of FDI flows in the 1990s. (8) See SSB, China Statistical Yearbook, 1997, pp.605 and 609. (9) The regional distribution of FDI flows is discussed in Wilde (1998). (10) See China Economic News, 1996, 12.2, Supplement no. 9.
29
(11) Since 1981 China has experienced deficits on current account only in the five years 1985, 1986, 1988, 1989 and 1993.
(12) See World Bank, 1997b. (13) Although official data show an average growth rate of 12 per cent in 1990-95, up
from 8 per cent in the previous five years, it is generally believed that these figures overstate a rate of growth that is probably in the 7-8 per cent rate rather than in double digits.
(14) See UNCTAD, World Investment Report, 1997, pp.89 and 92-93. (15) See SSB, China Statistical Yearbook, 1997. (16) This finding is based on a survey of 70 companies operating a total of 229 projects,
both wholly owned and joint ventures. Financial Times, 2 October 1998. (17) The duty and tax exemption on imported plant within the investment value of a
venture was lifted with effect from April 1 1996 and applies to all ventures started after that date, adding an estimated 40 per cent to the cost of imports under the then prevailing regime. Exemptions on import duty and VAT for equipment to be used by a Chinese factory under a processing or assembly agreement were also removed. From 1 January 1996 the VAT rebate on domestically sourced materials used to produce exports was reduced, following an earlier reduction in July 1995. As part of a general effort to improve the tax yield and streamline the taxation system, all domestic companies, including FIEs were told in March 1996 to apply for their Tax Registration Certificates, and were issued with new codes. See EIU, IL&T, China, 1997.
(18) See The World Bank, Infrastructure Development in East Asia and Pacific, Towards a
New Public-Private Partnership, November 1995. (19) In 1996, for example, the FIE sector as a whole had a deficit of $14bn, although it
should be noted that import values were inflated by a surge of purchases in the first quarter. While exports were depressed by the high basis for comparison of the previous year, in anticipation of the reduction in rebates discussed above.
(20) Exports grew 11.6 per cent in the first quarter of 1998, down 15.3 percentage points
from the same period in 1997. Financial Times, 14 May 1998. References Bosworth, B.P. (1996), ‘Growing Pains’, Brookings Review, Winter, pp.4-9. Moran, T.H. (1996), ‘Grand strategy: the pursuit of power and the pursuit of plenty’,
International Organisation, 50, 1, Winter, pp.175-205. Overseas Development Institute (1997), Foreign Direct Investment Flows to Low Income
Countries: A Review of the Evidence, Briefing Paper no. 3, September, London: Overseas Development Institute.

30
Ross, R.S. (1996), ‘Enter the Dragon’, Foreign Policy, Vol. 104 (Fall), pp.18-25 United Nations Conference on Trade and Development (UNCTAD) (1995), World
Investment Report, Transnational Corporations and Competitiveness, New York and Geneva: United Nations.
United Nations Conference on Trade and Development (UNCTAD) (1997), World
Investment Report, Transnational Corporations, Market Structure and Competition Policy, New York and Geneva: United Nations.
United Nations Industrial Development Organisation (UNIDO) (1996), Industrial
Development Global Report, Vienna: Oxford University Press for UNIDO. Wilde, G. (1998), China to 2010: The Pace of Reform, Research Report, Economic
Intelligence Unit: London. World Bank (1998), Global Development Finance (2 volumes), Washington DC: World
Bank. World Bank (1997a), Private Capital Flows to Developing Countries, World Bank Policy
Research Report, Washington DC: Oxford University Press for the World Bank. World Bank (1997b), World Development Report 1997, Oxford University Press for the
World Bank. CHK/klh/19.10.98/FDICHINA.PAP
Source: http://idpm.man.ac.uk/ 1998