Embed Size (px)
Citation preview

Foreign direct investment
and productivity:
evidence from the
East Asian economies
R e s e a r c h a n d Sta t i s t i c s B r a n c h
UNITED NATIONS INDUSTRIAL DEVELOPMENT ORGANIZATION
R e s e a r c h a n d Sta t i s t i c s B r a n c h
s ta f f w o r k i n g p a p e r 0 3 / 2 0 0 6
Foreign Direct Investment and Productivity: Evidence from the East Asian Economies
Thiam Hee Ng
Research and Statistics Branch
December 2006

Acknowledgements
The author wishes to thank Anders Isaksson and Tetsuo Yamada for their useful comments and suggestions and Maria Fermie, who was responsible for copy-editing. _____________________________________________________________________ This paper has not been formally edited. Countries are referred to by names that were in official use at the time the relevant data were collected. The designations employed and the presentation of material do not imply the expression of any opinion whatsoever on the part of the Secretariat of UNIDO concerning the legal status of any country or its authorities, or concerning the delimitation of its frontiers. The views expressed in this paper are those of the authors and not necessarily those of UNIDO. Material in this paper may be freely quoted or reprinted, but acknowledgement is requested, together with a copy of the publication containing the quotation of reprint.
ii

Abstract In this paper, an examination is made of the linkage between foreign direct investment and productivity in eight East Asian economies–China, Hong Kong SAR, Indonesia, Malaysia, Republic of Korea, Singapore, Taiwan Province of China and Thailand. The Granger causality test and the Toda-Yamamoto version of the Granger causality test are used to test if inflows of foreign direct investment “cause” productivity growth. The results show that only two countries reveal evidence of a one-way causality between inflows of foreign direct investment and total factor productivity growth. Similarly, there is also little evidence that inflows of foreign direct investment cause technical change or efficiency change in the sample economies. Keywords: Total factor productivity, foreign direct investment, East Asia, Granger causality
iii

Foreign Direct Investment and Productivity: Evidence from the East Asian Economies
Introduction
In this paper, an attempt is made to examine the direct impact of foreign direct
investment (FDI) on productivity, specifically because the spillover effects of FDI
have been hypothesized to be technological and organizational in nature. As the
impact of FDI is expected to manifest itself in higher productivity growth, it is
necessary to examine the direct relationship between FDI and productivity.
Past research has concentrated on examining the link between FDI and economic
growth. Attempts have also been made to quantify the effect that FDI has on
economic growth apart from its direct impact on increasing investment. In a sense,
such studies attempted to measure the spillover effects of FDI on the economy, albeit
indirectly. Currently, research that examines the direct link between FDI and
productivity is limited, especially for many developing countries. This is partly due to
the lack of data on productivity at the country level.
Recently, UNIDO has embarked on a project to create a database on productivity for a
large number of countries, including many developing countries. The results from the
UNIDO productivity database have been used here to examine the relationship
between FDI and productivity. The productivity estimates from the UNIDO database,
obtained from Data Envelopment Analysis (DEA), decomposed the change in
productivity into technological change and technical efficiency change. Therefore, in
addition to examining whether FDI contributes to productivity overall, one is able to
examine how FDI influences these two components of productivity. Does FDI
contribute to higher productivity by bringing in newer technology, or does FDI
contribute to higher productivity by introducing more efficient management process?
These are interesting questions for both academics and policy makers. There are many
incentives provided to encourage FDI because it is assumed that FDI can introduce
advanced technology to a country. It would be interesting to test if this is indeed the
case.
1

The flow of private capital to developing countries has been increasing in recent
years. Between 1990 and 2004, total private capital flows increased from US$42
billion to almost US$250 billion. In particular, the growth of private capital flow has
been driven mainly by growth in FDI. Between 1990 and 2004, the net flow of FDI to
developing countries increased from US$22 billion to US$165 billion. This rapid rise
in private capital flow means that such flows are becoming a much more important
source of financing than official sources, namely, official development assistance. In
contrast, official flows to developing countries declined from US$54 billion to US$33
billion over the same period.
FDI has been playing an important role in the development process of many countries.
In particular, FDI provides both the capital and technology that developing countries
lack. Therefore, there are broadly two channels through which FDI can flow. One is
by providing capital to build up the productive capacity in the economy, and the other
is by providing advanced technology and organizational know-how that will help to
increase the efficiency or productivity of investment.
This is, of course, an important issue for policy makers in developing countries. Many
governments have taken steps to encourage FDI flows by setting up foreign
investment promotion agencies, or even by offering tax and fiscal incentives to
foreign firms that invest in the country. These benefits can be quite costly, in terms of
tax revenues foregone. Therefore, it is important that the benefits of FDI are clearly
identified in order to justify the costs of activities initiated to attract FDI.
In the standard neoclassical model for economic growth, increases in capital stock and
labour force contribute to higher economic growth. Therefore, the flow of FDI, by
increasing the domestic capital stock, will contribute to increasing the growth of the
economy. More importantly, it has often been argued that FDI contributes to growth
beyond the direct effect of increasing the capital stock. FDI is also seen to bring to the
host country additional benefits, such as new technology, access to foreign markets
and managerial know-how. Expectations of these extra benefits are part of the reason
why governments in developing countries provide special incentives to attract FDI.
In this paper, the focus is on examining the link between FDI and productivity in eight
2

East Asian economies – China, Hong Kong Specially Administered Region of China
(SAR), Indonesia, Malaysia, Republic of Korea, Singapore, Taiwan Province of
China and Thailand. This group of economies has been selected because they received
substantial amounts of FDI. Furthermore, they have been relatively successful--some
more than others--and they are at different stages of development. This makes it
possible to examine if economies at different stages of development respond
differently to FDI.
Here, the Granger causality test (1969) and the Toda-Yamamoto (1995) version of the
Granger causality test are used to examine the relationship between the inflows of
FDI and various measures of productivity that have been compiled by UNIDO.
Although it is often assumed that FDI inflows can help to increase productivity in
developing countries, limited research has been undertaken to examine the direct link
between FDI and productivity at the macro level. This paper attempts to fill that gap.
The results from the sample of East Asian countries reveal that only in two countries
there is evidence of a one-way causality between FDI inflows and total factor
productivity (TFP) growth. Similarly, there is also little evidence that FDI inflows
cause technical change or efficiency change in the sample countries.
Literature Review There is a large body of literature on the impact of FDI. In this literature review, the
focus is on reviewing some of the studies on the impact of FDI on technology,
economic growth and productivity. This review is not meant to be exhaustive, as
large-scale literature surveys, such as JBIC (2002), already exist.
FDI is seen as an important channel for transmitting technology to many developing
countries. Findlay (1978) suggests that FDI can increase the productivity of the host
country as the more advanced management techniques and technologies of foreign
firms spread to local firms. Multinational firms are usually at the technological
frontier and have access to the latest and most advanced technologies. It is expected
that as they invest in plants in developing countries they will, at the same time,
transfer these high-level technologies. It is also hoped that the technology that is
3

embedded in plants of multinational firms will spread to other plants in the countries.
However, based on data from developed countries, van Pottelsberghe de la Potterie
and Lichtenberg (2001) show that FDI in the form of technology transfer is only
possible if the country invests in foreign countries intensively engaged in research and
development (R&D). Inward FDI from R&D-intensive countries does not seem to
increase productivity. This suggests that foreign firms invest abroad in order to
exploit their technological advantage rather than to diffuse their technology.
There has also been extensive evidence in the literature that documents the
contribution of FDI to economic growth. De Gregorio (1992), by examining the
experiences of 12 Latin American countries over the period 1950-1985, found that
FDI boosted economic growth three times as much when compared with aggregate
investment. Blomstrom et al. (1992) arrived at a similar conclusion using a larger
sample of developing countries. They not only found that FDI has a strong impact of
the economic growth of developing countries, but also that this effect is limited to
higher-income developing countries. For lower-income developing countries, other
factors, such as secondary education, were more important. Ram and Zhang (2002),
using data from the 1990s from a large cross-section of countries, also found that FDI
has a positive impact on economic growth.
Carkovic and Levine (2002), who used macro-level data, found little support for the
importance of FDI in stimulating growth. They argue that previous studies, which
show the benefits of FDI on economic growth, have not fully taken into account the
endogeneity problem. Countries with a good economic performance tend to attract
more FDI. Therefore, if the endogeneity problem is not taken into account, it is
unclear whether FDI drives economic growth, or vice versa. Once the endogeneity
problem is considered, it was concluded that growth drives FDI and not the other way
around.
This result has been supported by other studies as well. Li and Liu (2005), using a
large sample of developed and developing countries, find that since the mid-1980s the
relationship between FDI and economic growth has become increasingly endogenous.
Both Zhang (2002) and Zhang (1999) find evidence of a two-way Granger causality
in the relationship between FDI and China’s economic growth. Similarly, Choe
4

(2003) in a large sample of 80 countries finds evidence of a two-way causality
between FDI and economic growth. In addition, he also states that the effects are
more apparent from economic growth to FDI.
The evidence that only higher-income developing countries benefit from FDI suggests
that there may be other factors that determine how much a country benefits from FDI.
Later research attempts to identify these factors. For example, Borensztein et al.
(1998) shows that the country needs a certain level of human capital in order for it to
benefit fully from FDI. They performed cross-country regressions on a sample of 69
developing countries and found that FDI contributes more to growth than domestic
investment. Furthermore, they also found that FDI is complementary with human
capital, that is, human capital needs to be above a certain threshold for FDI to be more
productive than domestic investment. It would seem that although FDI may bring
with it advanced technology and techniques, the country must have sufficient
absorptive capacity, in terms of qualified people, to benefit fully from it. Without a
sufficient level of human capital, the country will not have the absorptive capacity to
take full advantage of FDI. Therefore, FDI cannot be viewed as a perfect cure-all
strategy.
This result has been confirmed by Xu (2000) who uses data from United States’
multinational enterprises in the manufacturing sector to examine the diffusion of
advanced technology. Although this study covers only 40 countries (20 developed and
20 developing), the advantage is that by using high-quality data, such as data on
spending on royalties and license fees, it is possible to quantify the intensity of
technology transfer of multinational affiliates. The study reveals strong evidence of
the impact of technology transfer from affiliates of United States’ multinational
enterprises in developed countries, but rather weak evidence of the impact in
developing countries. However, although there is still evidence of a positive impact of
investment by affiliates of the United States in developing countries, it cannot be
traced to technology transfer. The main reason for the lack of technology transfer in
developing countries is the low level of human capital. The study argues that the
human capital threshold must be even higher to benefit from technology transfer as
opposed to just benefiting from FDI.
5

In another paper, Balasubramanyam et al. (1996) emphasise the importance of
providing the right economic environment to ensure that FDI is beneficial to the
economy. They find that countries with a neutral trade regime, where artificial
incentives favour neither export-oriented nor domestic-oriented industries, fare better
than countries where a specific industry is favoured. This is because in a neutral
regime, firms’ decisions are governed by market forces rather than by artificial
incentives. Furthermore, a liberal regime also allows for competition between
domestic and foreign firms and these in turn provide innovation and learning that
contribute to economic growth.
This is further supported by Busse and Groizard (2006) who found that FDI does not
have any impact on economic growth in a very highly regulated country. However, it
seems that there can be a wide range of regulatory regimes under which FDI can still
prove beneficial. This is encouraging as it suggests most countries, even those with a
rather restrictive regulatory environment, can benefit from FDI.
However, the belief that FDI provides extra benefits to the economy is not universally
shared. Nunnenkamp and Spatz (2003) found, using data of United States FDI stock
abroad, that the link between FDI and economic growth is quite weak. On a slightly
brighter note, they found that the link tends to be stronger in countries with more
favourable characteristics, such as better institutions, more educated workforce and
openness to trade. In general, however, they are quite sceptical about the benefits of
FDI. They argue that it is easier to attract FDI than to derive benefits from it.
Micro-level studies, using firm-level data, generally have not been as positive. Aitken
and Harrison (1999), using data for over 4,000 Venezuelan firms, found that there are
very limited spillover effects from foreign firms to domestic firms. There are some
benefits to small individual plants from FDI, but for large firms there is no evidence
of such benefits, when differences in plant characteristics are taken into account.
More disappointingly, they also found evidence of negative spillover effects from
foreign to domestic enterprises, that is, productivity in domestic firms decreases as
foreign investment increases. This is in contrast with most other studies that find
positive spillovers. The reason is that these studies are often estimated at the industry
level and do not take into account differences in productivity across industries.
6

Therefore, if foreign investors are attracted to more productive industries, these could
lead to the (wrong) conclusion that foreign investment has positive spillover effects
on the economy.
A similarly pessimistic result can be found in Sasidharan (2006) where FDI does not
have significant vertical or horizontal spillover effects in a sample of some 2,700
manufacturing firms in India between 1994 and 2002. Although India witnessed large
inflows of FDI during this period, it is rather disappointing to see that they appear to
have benefited domestic firms very slightly.
Micro studies, for their part, do not universally reveal a negative impact of FDI and
productivity growth. Using data from Czech enterprises over the period 1992-1996,
Djankov and Hoekman (2000) found that FDI has contributed to increasing the
productivity growth of firms. This positive effect continues even after the authors
took into account that foreign investment tends to flow into companies that had higher
productivity initially. However, it must be noted that the Czech Republic is not a
typical case, since it has a strong industrial base and a highly educated workforce. It
is, therefore, unclear if the experience there can be readily applicable to other
developing countries.
Hale and Long (2006) provide a more positive view of spillover effects from FDI.
They use the survey of 1,500 firms in China to examine if there are technological
spillover effects from foreign firms to domestic firms in the same city and industry.
Indeed positive spillover effects are found from foreign firms operating in China,
even though they are unevenly spread. Domestic firms that have relatively higher
productivity obtained positive spillover effects from foreign firms, whereas domestic
firms with lower productivity derived negative effects.
The paper then proceeds to examine how the positive spillover effects from foreign
firms are channelled to domestic firms. One such channel is the movement of high-
skilled workers from foreign firms to domestic firms. Another finding is that domestic
firms that have a more highly skilled workforce tend to have higher productivity in
the presence of increased FDI. Positive spillover effects are also evidenced from
technologically advanced firms working mainly through the movement of high-skilled
7

workers from foreign firms to domestic firms and through the network externalities
effect. Hence, a well-functioning labour market is very important for ensuring that the
benefits of FDI are fully realized. This could be one reason why most studies contain
little evidence of positive spillover effects of FDI in developed and not developing
countries, where labour institutions are not so well developed. However, while they
do not assume that the spillover effects can be spread to firms outside the industry,
this could be the case if the spillovers are in terms of managerial and organizations’
ability. The main drawback of these micro-level studies is that they only take into
account the effect of spillovers within the sector surveyed. Most of the surveys are
carried out on manufacturing firms. Hence, if there are spillover effects from the
manufacturing sector into the service sector, these effects will not be fully captured in
these studies. Therefore, macro-level data has been used in this paper to examine the
spillover effects, so that these effects from FDI can be captured to the fullest extent.
Data Data on FDI are obtained from the UNCTAD Foreign Direct Investment database on
the Internet.1 Several measures of FDI have been used in the literature. In this paper,
the share of FDI in GDP is used as the measure of FDI, as it is believed to be the
measure that best represents the impact of FDI on the economy as a whole.
Furthermore, estimates of TFP from the UNIDO productivity database will be used as
indicators of productivity at the country level. Full details on the methods used to
obtain the TFP estimates can be found in Isaksson (2006). The first step in estimating
productivity is the assumption of the existence of an aggregate production function for
each country. Without this assumption, it is not possible to measure TFP.
Traditionally, TFP has been estimated by using the growth accounting method.
However, for this paper, the TFP estimates have been taken from data envelopment
analysis (DEA). The main advantage that DEA has over growth accounting is that it
does not require too many assumptions. For example, DEA does not assume that
countries are technically efficient or that they are perfectly competitive. On the
1 http://www.unctad.org/Templates/Page.asp?intItemID=1923&lang=1
8

downside, DEA is more sensitive to outliers and mis-measurement. Another
advantage of DEA is that one is able to decompose the change in TFP into a change in
technical efficiency and technological change. This has important implications as it
can help to identify whether FDI contributes to higher productivity by inducing
greater efficiency or through technology transfer, which increases technological
change.
In adopting the DEA method for calculating productivity at the country level, the Färe
et al. (1994) approach has been followed. Each country’s output and inputs, at any
given point of time, is treated as a production point in the sample. The production
function has GDP as output, and labour and capital as inputs. Technically, DEA uses
linear programming methods to construct a non-parametric piece-wise frontier. This
frontier can be viewed as the world technology frontier. Movements of the world
technology frontier can be viewed as technical change and movements towards the
world technology as a change in technical efficiency. The Malmquist Index can then
be used to measure TFP growth.
The data for each country’s GDP, labour and capital used in the DEA are obtained
from the Penn World Tables (6.1). The estimate for capital is obtained from
investment data, and follows the assumption of Crego et al. (1998) that capital stock
lasts for 20 years with a decay parameter of 0.70.
As already mentioned, the focus in this paper is on examining the link between FDI
and productivity in eight East Asian economies–China, Hong Kong SAR, Indonesia,
Malaysia, Republic of Korea, Singapore, Taiwan Province of China and Thailand.
This group of economies has been selected because it received substantial amounts of
FDI, and is considered to have been relatively successful--some more than others.
Besides, since these economies are also at different stages of development, one is able
to examine if they respond differently to FDI. Data for these economies cover the
period 1970-2000, with the exception of China, for which data on FDI were not
available prior to 1980.
9

Table 1. Productivity and FDI in Selected East Asian Economies, 1970-2000 (Annual average*)
Country or area
TFP growth (percentage per
annum)
FDI
(US$ million)
FDI per capita
(US$)
FDI share of GFCF**
(percentage)
FDI share of GDP
(percentage) China 0.9 16,540 13 6.0 2.2
Hong Kong SAR 1.2 5,686 908 20.7 5.5
Indonesia -1.3 799 5 4.8 1.0
Korea, Republic of -0.1 1,199 27 2.1 0.6
Malaysia -0.1 2,092 111 14.3 4.3
Singapore 1.4 3,975 1,173 26.5 9.5
Taiwan Province of China
0.9 803 38 2.4 0.6
Thailand 0.2 1,325 23 5.2 1.4
* Except FDI indicators for China which are from 1980-2000. ** Gross fixed capital formation.
Table 1 presents an overview of productivity and the various measures of FDI in the
sample of East Asian economies. There are some, though not very significant,
variations in the productivity performance. Singapore has the best productivity
performance in the sample countries, followed closely by Hong Kong SAR. While
Indonesia has the worst productivity performance, in terms of the level of FDI
inflows, China is the biggest recipient. Inflows of FDI to China are almost three times
that of the next largest recipient, Hong Kong SAR. However, relative to the size of the
economy, FDI has had the biggest impact on the economy of Singapore, accounting
for more than a quarter of its investment and almost 10 per cent of its GDP. For both
Singapore and Hong Kong SAR, where FDI represents a substantial fraction of
investment, productivity performance has been relatively good. However, although
Malaysia also enjoyed substantial FDI inflows, its productivity performance has been
rather mediocre.
Empirical Analysis
As a first step, the correlation between FDI and productivity in the sample of eight
East Asian economies is examined.
10

Table 2. Correlation between FDI as a share of GDP with TFP growth, technical change and efficiency change, 1970-2000*
Country or area
∆TFP
T Technical change
Efficiency change
China -0.17 0.58 -0.56
Hong Kong SAR 0.09 0.27 -0.10
Indonesia 0.14 -0.47 0.47
Korea, Republic of 0.01 0.42 -0.29
Malaysia 0.11 0.26 -0.22
Singapore 0.37 0.15 0.21
Taiwan Province of China 0.12 0.26 -0.15
Thailand -0.35 0.43 -0.55
* Data for China are available only from 1980 to 2000.
Table 2 presents the correlation between FDI as a share of GDP and TFP, technical
change and efficiency change for each country in the sample. The results do not
change much if a different measure of FDI is applied. Overall, there seems to be little
positive correlation between FDI and TFP, with probably one exception, Singapore.
However, there is a stronger correlation between FDI and technical change. Finally,
the relationship between FDI and efficiency change is weak and often negative. It is
important to interpret these results carefully, as these are contemporaneous
correlations and the effects of FDI may take several years before they manifest
themselves. It is also important to note that correlation here does not imply causation.
To determine whether there is a causal relationship between FDI and productivity,
Granger causality tests on FDI and productivity were performed. This test, introduced
in Granger (1969), has been widely utilized to examine the direction of causality
between two time-series variables. However, to proceed with the Granger causality
test, the time series properties of the variables must be checked. In cases where the
variables are not stationary, the usual asymptotic distribution of the test statistic may
not be valid under the null hypothesis. Therefore, it is important to ensure that the
variables are stationary before proceeding.
To check if the variables are stationary, the Phillips-Perron (1988) unit root test has
been employed. The advantage of the Phillips-Perron test over the Dickey-Fuller unit
root test is that the test statistics from the Phillips-Perron test have been adjusted to
take into account the serial correlation by using the Newey-West (1997) covariance
matrix. The null hypothesis of the Phillips-Perron unit root test is that the variable has
11

a unit root. The Phillips-Perron test statistics for each variable and economy in the
sample are shown in table 3. Basically, the results show that for the various indicators
of productivity–TFP growth, technical change and efficiency change–the null
hypothesis of a unit root can be rejected. For most of the economies, FDI/GDP is not
stationary in level, although in the first difference it is stationary. The exceptions here
are Singapore and Taiwan Province of China where FDI/GDP is stationary in level. In
order to maintain comparability with the other economies, the first difference of
FDI/GDP is used as the indicator of FDI in the estimation that follows.
Table 3. Phillips-Perron (Zt) test statistic for unit root
Country or area
Ln(FDI/GDP)
∆ ln(FDI/GDP)
∆TFP
Technical change
Efficiency change
China -3.027 -3.993 * -4.222* -3.932* -4.452*
Hong Kong SAR -3.021 -7.162* -4.100* -6.946* -4.104*
Indonesia -1.524 -10.258* -4.770* -3.332* -4.305*
Korea, Republic of -3.472 -7.370* -4.431* -6.380* -5.304*
Malaysia -2.377 -4.682* -2.876* -5.860* -6.585*
Singapore -3.607* -6.610* -3.754* -4.202* -5.251*
Taiwan Province of China -6.228* -10.065* -3.780* -5.857* -4.653*
Thailand -2.786 -5.068* -3.518* -4.776* -4.442*
* Reject the null hypothesis that the variable has a unit root at the 5 per cent level.
Now that the stationary level of the variables has been checked, one can proceed by
carrying out the Granger causality test. The concept of the Granger causality test is
based on the idea that events of the past cannot be influenced by current or future
events. Therefore, if event A occurred before event B, then event A can be seen as a
“cause” of event B. What is done when carrying out the Granger causality test is to
test whether variations in one variable occurs before variations in another variable.
Variable X is said to Granger cause variable Y if the past sees that variable X can
improve the forecast Y. It is also possible that the two variables X and Y, Granger
cause each other. If this is the case, then bi-directional Granger causality is observed.
In order to test for Granger causality, a bivariate vector autoregression (VAR) model
is estimated for each of the East Asian country in the sample. Formally, one can
estimate the VAR for each country as:
⎥⎦
⎤⎢⎣
⎡+⎥
⎦
⎤⎢⎣
⎡⎥⎦
⎤⎢⎣
⎡+⎥
⎦
⎤⎢⎣
⎡=⎥
⎦
⎤⎢⎣
⎡
−
−
=∑
t
t
it
it
ii
iip
it
t
uu
PRODFDI
PRODFDI
2
1
22
11
12
1
ϕβϕβ
αα
12

where t is the time subscript, p is the number of lags for the VAR, FDI is the FDI
share of GDP, and PROD represents the various measures of productivity growth.
β1i, β2i, φ1i and φ2i are the coefficients from the VAR; and u1t and u2t are the
uncorrelated residuals from the VAR.
In testing for Granger causality, what is done here is to check if past values of a
variable are useful for forecasting the present value of another variable. To examine if
FDI Granger causes productivity, it is necessary to see if β2i = 0 for all values of i= 1,
2, …p. This can be implemented by means of a Wald test with the null hypothesis
that the values of the estimated coefficients (β2i ) are jointly zero. Hence, if the null
hypothesis is rejected, then it can be said that FDI Granger causes productivity.
Similarly, one can also check if productivity Granger causes FDI. It is quite possible
that higher productivity in a country attracts more foreign investors. It is also possible
to have the result of bi-directional Granger causality where FDI and productivity
Granger causes one another. This would imply that there are feedback effects between
FDI and productivity.
Before the VAR is estimated, it is necessary decide on the lag length for each of
VAR. The maximum lag length for the VAR is set at 5, and the Akaike Information
Criterion is used to select the appropriate lag length. This is an important step before
estimating the VAR as the choice of lag length could influence the results obtained
from the Granger causality test. The results of the lag length selection process for the
VARs with TFP growth, technical change and efficiency change as the dependent
variables are shown in table 4.
Table 4. Optimal lag length for the Granger Causality Test
Country or area TFP growth Technical change Efficiency change
China 3 1 3
Hong Kong SAR 1 1 3
Indonesia 1 2 3
Korea, Republic of 1 1 1
Malaysia 1 1 1
Singapore 3 1 3
Taiwan Province of China 2 2 2
Thailand 1 2 2
13
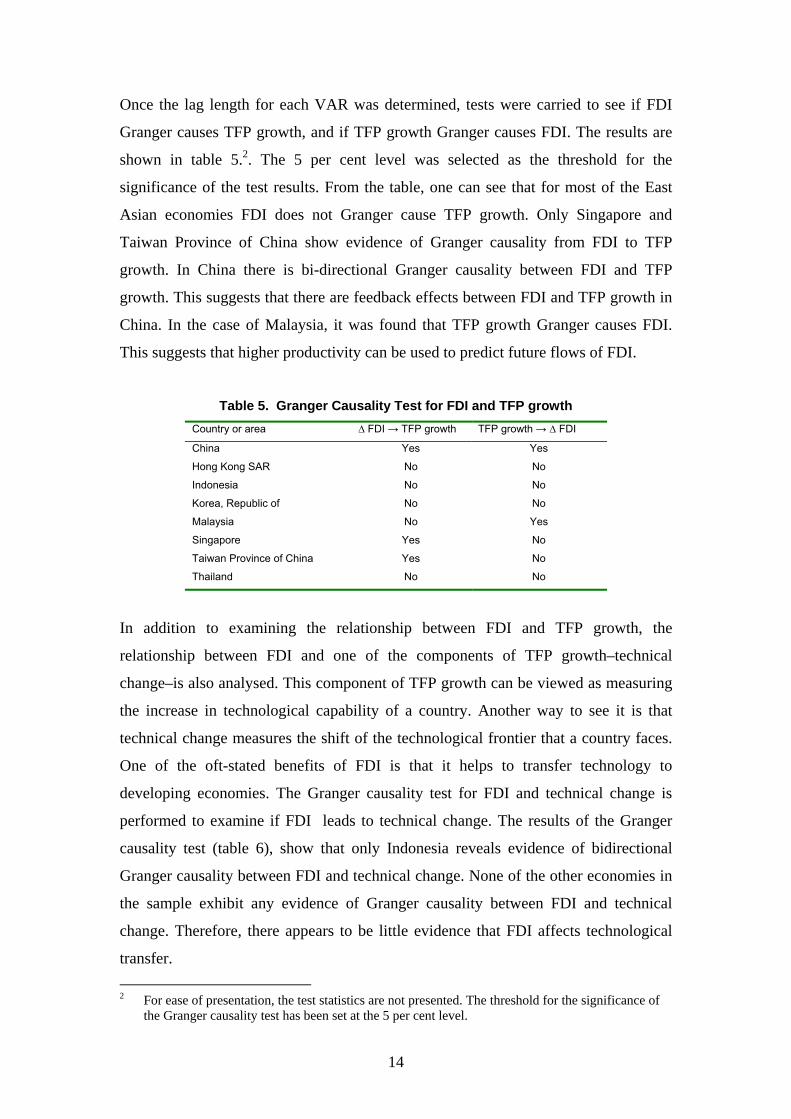
Once the lag length for each VAR was determined, tests were carried to see if FDI
Granger causes TFP growth, and if TFP growth Granger causes FDI. The results are
shown in table 5.2. The 5 per cent level was selected as the threshold for the
significance of the test results. From the table, one can see that for most of the East
Asian economies FDI does not Granger cause TFP growth. Only Singapore and
Taiwan Province of China show evidence of Granger causality from FDI to TFP
growth. In China there is bi-directional Granger causality between FDI and TFP
growth. This suggests that there are feedback effects between FDI and TFP growth in
China. In the case of Malaysia, it was found that TFP growth Granger causes FDI.
This suggests that higher productivity can be used to predict future flows of FDI.
Table 5. Granger Causality Test for FDI and TFP growth
Country or area ∆ FDI → TFP growth TFP growth → ∆ FDI
China Yes Yes
Hong Kong SAR No No
Indonesia No No
Korea, Republic of No No
Malaysia No Yes
Singapore Yes No
Taiwan Province of China Yes No
Thailand No No
In addition to examining the relationship between FDI and TFP growth, the
relationship between FDI and one of the components of TFP growth–technical
change–is also analysed. This component of TFP growth can be viewed as measuring
the increase in technological capability of a country. Another way to see it is that
technical change measures the shift of the technological frontier that a country faces.
One of the oft-stated benefits of FDI is that it helps to transfer technology to
developing economies. The Granger causality test for FDI and technical change is
performed to examine if FDI leads to technical change. The results of the Granger
causality test (table 6), show that only Indonesia reveals evidence of bidirectional
Granger causality between FDI and technical change. None of the other economies in
the sample exhibit any evidence of Granger causality between FDI and technical
change. Therefore, there appears to be little evidence that FDI affects technological
transfer. 2 For ease of presentation, the test statistics are not presented. The threshold for the significance of
the Granger causality test has been set at the 5 per cent level.
14
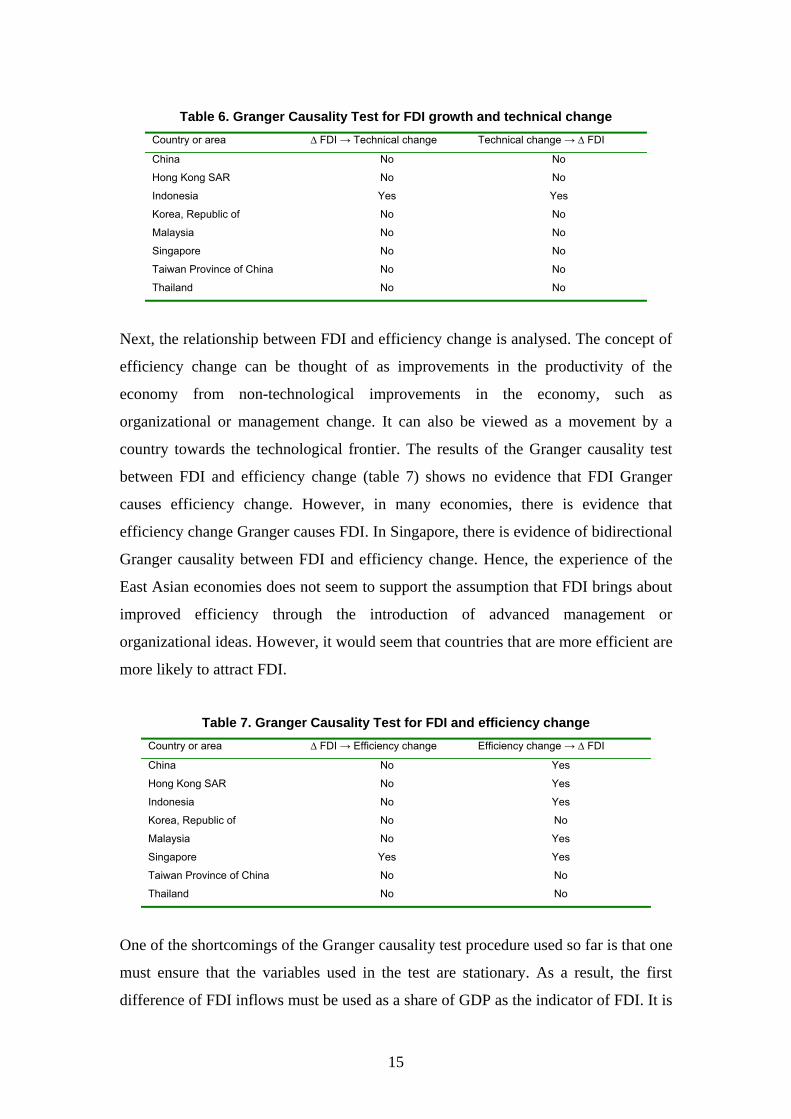
Table 6. Granger Causality Test for FDI growth and technical change Country or area ∆ FDI → Technical change Technical change → ∆ FDI
China No No
Hong Kong SAR No No
Indonesia Yes Yes
Korea, Republic of No No
Malaysia No No
Singapore No No
Taiwan Province of China No No
Thailand No No
Next, the relationship between FDI and efficiency change is analysed. The concept of
efficiency change can be thought of as improvements in the productivity of the
economy from non-technological improvements in the economy, such as
organizational or management change. It can also be viewed as a movement by a
country towards the technological frontier. The results of the Granger causality test
between FDI and efficiency change (table 7) shows no evidence that FDI Granger
causes efficiency change. However, in many economies, there is evidence that
efficiency change Granger causes FDI. In Singapore, there is evidence of bidirectional
Granger causality between FDI and efficiency change. Hence, the experience of the
East Asian economies does not seem to support the assumption that FDI brings about
improved efficiency through the introduction of advanced management or
organizational ideas. However, it would seem that countries that are more efficient are
more likely to attract FDI.
Table 7. Granger Causality Test for FDI and efficiency change
Country or area ∆ FDI → Efficiency change Efficiency change → ∆ FDI
China No Yes
Hong Kong SAR No Yes
Indonesia No Yes
Korea, Republic of No No
Malaysia No Yes
Singapore Yes Yes
Taiwan Province of China No No
Thailand No No
One of the shortcomings of the Granger causality test procedure used so far is that one
must ensure that the variables used in the test are stationary. As a result, the first
difference of FDI inflows must be used as a share of GDP as the indicator of FDI. It is
15

possible that it is not the change in FDI in flows but rather the size of FDI inflows that
affects productivity in the country. In order to test this possibility, the modified
version of the Granger causality test, Toda and Yamamoto (1995) is used to examine
the relationship between FDI and productivity. The main advantage of this test is that
it allows for the variables in the VAR to be non-stationary or even cointegrated. It
therefore allows one to test for causality between the levels of FDI inflows as a share
of GDP with various measures of productivity even though the level of FDI inflows,
as a share of GDP, is known to be non-stationary.
The first step in implementing the Toda-Yamamoto test is to determine the maximum
order of integration of the variables to be tested. In this case, the results from the test
for stationary level have determined that the maximum order of integration for the
variables is one. Toda and Yamomoto (1995) have shown that the standard
asymptotic theory holds for the results from the VAR, if extra lags of the variables
equal in number to the maximum order of integration are added. Since the maximum
order of integration has been determined as one, an extra lag is added to the VAR to
be estimated. The next step is to determine the optimal lag length for the VAR.
Following the same procedure, the optimal lag length for the VAR is determined by
using the Akaike Information Criterion. The optimal lag length for the VAR for the
various measures of productivity are shown in table 8 below.
Table 8. Optimal lag length for the Toda-Yamomoto Test
Country or area TFP growth Technical change Efficiency change
China 5 5 5
Hong Kong SAR 2 5 3
Indonesia 1 5 5
Korea, Republic of 1 1 1
Malaysia 1 2 1
Singapore 3 1 1
Taiwan Province of China 4 1 1
Thailand 1 2 1
One can then proceed to estimate the VAR for each country for TFP growth and the
level of FDI/GDP by using the optimal lag length plus one extra lag. Then the Wald
test is used to test whether the lagged coefficients of FDI/GDP (excluding the extra
lag) are jointly zero in the TFP growth equation. Again the 5 per cent level is used as
the threshold for significance. If the null hypothesis that the lagged coefficients are
16

jointly zero is rejected, this means that the level of FDI/GDP Granger causes TFP
growth. Similarly, tests have been carried out to see if the lagged TFP growth
coefficients (excluding the extra one) are jointly zero. If the null hypothesis is rejected
in this case, then this means that TFP growth Granger causes FDI/GDP. The results of
the Toda-Yamamoto version of the Granger causality test are shown in table 9.
The results from the Toda Yamamoto test on the causality between FDI and TFP
growth is broadly similar to that of the Granger causality test. One exception is that
there is currently evidence that FDI causes TFP growth in the case of Hong Kong
SAR. The other exception is that in Taiwan Province of China there is no longer a
causality running from FDI to TFP growth, but instead from TFP growth to FDI.
Overall, the results are not that different from before. Only in three of the eight
sample countries is there any causality running from FDI towards TFP growth.
Therefore, in the sample economies there is still no strong evidence that FDI inflows
drive productivity growth.
Table 9. Toda-Yamamoto Causality Test for FDI and TFP growth Country or area FDI → TFP growth TFP growth → FDI
China Yes Yes
Hong Kong SAR Yes No
Indonesia No No
Korea, Republic of No No
Malaysia No Yes
Singapore Yes No
Taiwan Province of China No Yes
Thailand No No
The results from the Toda-Yamamoto test on the relationship between the level of
FDI inflows and technical change are shown in table 10. Quite a number of
differences are obtained from these results compared with those from the Granger
test. In particular, there is evidence of a two-way causality between the level of FDI
inflows and technical change in China and Hong Kong SAR. In the Granger causality
test, no evidence of causality was found in those two economies. In addition, the
results also show that the level of FDI inflows causes technical change in Indonesia
and Thailand. Therefore, the results from the Toda-Yamamoto test are more
supportive of the idea that FDI inflows can contribute to technical change in the
17

economies. It should also be noted that, with the exception of Hong Kong, the results
show that FDI causes technical change that are at a lower level of development in the
sample. This suggests that FDI may be more effective in transferring technology
when the economy benefits from FDI is less technologically developed. For a country
that is more technologically developed, FDI may not be that important as a source of
technology transfer.
Table 10. Toda-Yamamoto Causality Test for FDI and technical change
Country or area FDI → Technical change Technical change → FDI
China Yes Yes
Hong Kong SAR Yes Yes
Indonesia Yes No
Korea, Republic of No No
Malaysia No Yes
Singapore No No
Taiwan Province of China No No
Thailand Yes No
Finally, table 11 presents the results from the Toda-Yamamoto test on the relationship
between FDI and efficiency change. Overall, the results are quite similar to that of the
Granger causality test. Besides, none of the economies, for which the level of FDI
inflows causes efficiency, changes. However, there are two economies–China and
Indonesia–where there is bi-directional causality between FDI and efficiency change.
Therefore, the results confirm the findings from the Granger causality test that there is
no evidence that FDI helps to increase efficiency in the East Asian economies.
Table 11. Toda Yamamoto Causality Test for FDI and efficiency change
FDI → Efficiency change Efficiency change → FDI
China Yes Yes
Hong Kong SAR No No
Indonesia Yes Yes
Korea, Republic of No No
Malaysia No No
Singapore No No
Taiwan Province of China No No
Thailand No No
18

Concluding Remarks The Granger causality test and the Toda-Yamamoto version of the Granger causality
test have been used to examine the relationship between FDI and productivity in an
economy at the aggregate level. Previously, most research on the relationship between
FDI and productivity is based on firm-level data. The drawback of using firm-level
data is that it may not be possible to capture the spillover effects that occur outside the
industry. By using productivity data for the whole economy, it is possible to capture
the spillover effects of FDI on the whole economy. Using a sample of eight East
Asian economies that received substantial FDI, evidence of one-way Granger
causality from the change in FDI inflows to TFP growth was found only in two
economies–Singapore and Taiwan Province. There is also little evidence from the
Granger causality test that changes in FDI/GDP contribute to technical or efficiency
change in the economies.
The Toda-Yamamoto test, which can be used to test the relationship between the
levels of FDI inflows and the various indicators of productivity growths, also shows
similar results as the Granger causality test. The main difference is that the Toda-
Yamamoto test shows stronger evidence that the level of FDI inflows causes technical
change.
In terms of the country results, China stands out as the country where there is strong
evidence of a two-way causality between FDI inflows and the various measures of
productivity growth. Meanwhile, for the Republic of Korea, FDI does not appear to
have any impact on the various measures of productivity growth there.
19

Bibliography Aitken, Brian J. and Ann E. Harrison (1999), “Do Domestic Firms Benefit from
Direct Foreign Investment? Evidence from Venezuela”, American Economic Review, vol. 89, pp. 605 - 618.
Balasubramanyam, V N, M. Salisu and David Sapsford (1996), "Foreign Direct
Investment and Growth in EP and IS Countries," Economic Journal, vol. 106, pp. 92-105.
Blomstrom, M., R. Lipsey and M. Zejan (1992), “What Explains Developing Country
Growth”, NBER Working Paper, No. 4132. Borensztein, E., J. De Gregorio and J-W. Lee (1998), “How does foreign direct
investment affect economic growth?”, Journal of International Economics, vol. 45, pp. 115-135.
Busse, M. and J.L. Groizard (2006), “Foreign Direct Investment, Regulations and Growth”, World Bank Policy Research Working Paper No. 3882, April 2006.
Carkovic, Maria and Ross Levine (2002), “Does Foreign Direct Investment
Accelerate Economic Growth?”, University of Minnesota, mimeo.
Choe, J.I. (2003), “Do Foreign Direct Investment and Gross Domestic Investment Promote Economic Growth?”, Review of Development Economics, vol. 7, pp. 44-57.
Crego, A., D. Larson, R. Butzer and Y. Mundlak (1998), “A New Database on Investment and capital for Agriculture and Manufacturing,” WPS No. 2013, Washington, D.C., World Bank.
De Gregorio, J. (1992), “Economic Growth in Latin America”, Journal of
Development Economics, vol. 39, pp. 59-84. Djankov, Simeon and Bernard Hoekman (2000), “Foreign Investment and
Productivity Growth in Czech Enterprises,” The World Bank Economic Review, vol. 14, pp. 49-64.
Färe, R., S. Grosskopf, M. Norris, Z. Zhang (1994), “Productivity Growth, Technical
Progress and Efficiency Change in Industrialized Countries”, American Economic Review, vol. 84, pp. 66-83.
Findlay, Ronald (1978), “Relative Backwardness, Direct Foreign Investment, and the
Transfer of Technology: A Simple Dynamic Model,” Quarterly Journal of Economics, vol. 92, pp. 1-16.
Granger, C.W. (1969), “Investigating Causal Relations by Econometric Models and
Cross Spectral Methods”, Econometrica, vol. 37, pp. 434-438. Hale, Galina and Cheryl Long (2006), “What determines Technological Spillovers of
Foreign Direct Investment: Evidence from China”, Yale University Economic Growth Center Discussion Paper No. 934, April 2006.
21

Isaksson, A. (2006), "World Productivity Database: Data Construction and
Measurement Methods", mimeograph, UNIDO. JBIC (2002), “Foreign Direct Investment and Development: Where Do We Stand?”,
JBICI Research Paper No. 15, JBIC Institute, Japan Bank for International Cooperation.
Li, Xiaoying and Xiaming Liu (2004), “Foreign Direct Investment and Economic
Growth: An Increasingly Endogenous Relationship,” World Development, vol. 33, pp. 393-407.
Newey, W.K. and K.D. West (1987), “A simple, positive semi-definite,
heteroskedasticity and autocorrelation consistent covariance matrix,” Econometrica, Vol. 55, pp. 703-708.
Nunnenkamp, Peter and Julius Spatz (2003), “Foreign Direct Investment and
Economic Growth in Developing Countries: How Relevant are Host-coutnry and Industry Characteristics,” Kiel Working Paper No. 1176, Kiel Institue for World Economy.
Ram, Rati and Kevin Honglin Zhang (2002), “Foreign Direct Investment and
Economic Growth: Evidence from Cross-Country Data for the 1990s,” Economic Development and Cultural Change, vol. 51, pp. 205-215.
Phillips, P.C.B and P. Perron (1988), “Testing for a Unit root in Time Series
Regression,” Biometrika, vol. 75, pp. 335-346. Sasidharan, Subash (2006), “Foreign Direct Investment and Technology Spillovers:
Evidence from the Indian Manufacturing Sector”, UNU-MERIT Working Paper Series, #2006-010.
Toda, Hiro Y. and Taku Yamamoto (1995), “Statistical inference in vector autoregressions with possibly integrated processes,” Journal of Econometrics, Vol. 66, pp. 225-250.
Van Pottlesberghe de la Potterie, Bruno and Frank Lichtenberg, “Does Foreign Direct
Investment Transfer Technology Across Borders?”, The Review of Economics and Statistics, Vol. 83, pp. 490-497.
Xu, Bin (2000), “Multinational enterprises, technology diffusion, and host country
productivity growth,” Journal of Development Economics, vol. 62, pp. 477-493.
Zhang, K.H. (1999), “How does FDI interact with economic growth in a large
developing country? The case of China”, Economic Systems, vol. 21, pp. 291-304.
Zhang, Zhaoyong (2002), “Productivity and Economic Growth: An Empirical
Assessment of the Contribution of FDI to the Chinese Economy,” Journal of Economic Development, vol. 27, pp.81-94.
22