Embed Size (px)
Citation preview

Foreign Currency Derivatives and Their Impact on Firm Value – A Study on Swedish
Non-Financial Firms
Master’s Thesis in Finance
May 2015 Author: Lejla Garibovic 19870116-3704 Supervisor: Håkan Jankensgård

2
Abstract This paper empirically examines the relationship between firm value and the
usage of currency derivatives for 85 non-financial Swedish firms listed on
Stockholm Stock Exchange. The sample includes firms operating in a wide range
of industries and with different sizes. The time period for the data is from 2005
to 2010. There is no proof of an existing relationship between currency derivative
usage and firm value. The most significant result indicates that a negative correlation
between leverage and firm value exists.
Keywords: risk management, firm value, Tobin’s Q, currency derivatives, foreign
exchange derivatives, FX risk

3
Acknowledgements I recognize the contribution of my mentor, Håkan Jankensgård who supported me through this thesis with guidance and comments. Furthermore, I would like to thank family and friends for their moral support and encouragement throughout the whole research process.

4
Table of Contents
Abstract ........................................................................................................................................ 2 Acknowledgements .................................................................................................................. 3 List of tables ................................................................................................................................ 5 List of formulas .......................................................................................................................... 5 1. INTRODUCTION ................................................................................................................. 6
1.1. Background of the study ...................................................................................................... 6 1.2. Research objectives ............................................................................................................... 7 1.3. Outline ........................................................................................................................................ 7
2. Prior research on hedging and firm value ............................................................... 8 2.1. Overview .................................................................................................................................... 8 2.2. The underinvestment problem ......................................................................................... 8 2.3. Managerial risk aversion ..................................................................................................... 9 2.4. Tax incentives ....................................................................................................................... 11 2.5. Direct relationship between firm value and hedging ............................................. 11
3. HYPOTHESIS DEVELOPMENT .................................................................................... 14 3.1. Background ............................................................................................................................ 14 3.2. Discussion and delimitations .......................................................................................... 15 3.3. Hypothesis .............................................................................................................................. 17
4. Methodology .................................................................................................................... 18 4.1. Overview ................................................................................................................................. 18 4.2. Descriptive statistics .......................................................................................................... 18
4.2.1. Firm value ...................................................................................................................................... 19 4.2.2. Derivative usage .......................................................................................................................... 20 4.2.3. Other determinants of firm value ........................................................................................ 20
4.3. Statistical distributions for diagnostic tests .............................................................. 22 4.4. Model development ............................................................................................................ 23
4.4.1. Hypothesis testing ...................................................................................................................... 23 5. Analysis ............................................................................................................................. 25
5.1. Firm value ............................................................................................................................... 25 5.2. Leverage .................................................................................................................................. 26 5.3. Profitability ............................................................................................................................ 26 5.4. Size ............................................................................................................................................ 27 5.5. Diversified .............................................................................................................................. 27 5.6. Mean values of Tobin’s Q and its explanatory variables ....................................... 29
6. Conclusion ........................................................................................................................ 31 7. References ........................................................................................................................ 32 8. Appendix ........................................................................................................................... 35

5
List of tables 1. Summary of variables and data sources………………………………………………20 2. Descriptive Statistics……………………………………..............................…................28 3. Mean values for hedger vs. non-hedgers………………………………...................29 4. Firm mean value for dividend pay outs…………………………………………........30 5. Firm Q mean value comparing diversification………………………………….…30
List of formulas 1. Main model equation………………………………………………………..…………………23 2. Fixed effects excluding all dummy variables…………………..…………………..24 3. Fixed effects excluding hedging and diversified…………………………..……...24 4. Pooled regression with all variables included……………………………….....…24

6
1. INTRODUCTION
1.1. Background of the study
The increased pace of globalization compels internationally-oriented companies to
engage in hedging activities to protect themselves against financial perils, such as
foreign exchange, commodity and interest rate risks. Financial derivatives, for
example, are a mechanism that firms can utilize to hedge their exposure to such risks
and guard their cash flows against financial market uncertainties. Various theories
state that enterprises can manage risk by other means. This research, however, refers
to hedging as using financial derivatives, unless stated differently.
Derivatives, which are merely agreements between two or more parties, derive their
value from underlying asset, such as a currency, commodity or interest rate. Using
derivatives as a mode of risk management usually requires an initial investment to
mitigate unwanted future price movements. In addition to their applicability as a
hedging instrument, companies might also use them for speculative reasons.
Numerous theories found empirical evidence on the hedging premium, which implies
a positive correlation between hedging and firm value. Additionally, previous studies
indicate that hedging helps to mitigate the underinvestment problem, agency cost and
reduce corporate taxes (Mayers and Smith, 1982; Stultz 1984; Froot, Scharfstein and
Stein, 1993). Firms can hedge in several ways, for example by using options such as
futures, forwards and swaps but also by operational and accounting strategies and by
issuing foreign debt in order to hedge foreign currency exposure (Allayanis and Ofek,
1997; Petersen and Thiagarajan, 2000).
There are many studies done on the relationship between hedging and firm value, for
example Jin and Jorion (2006) investigated the correlation between firm value and oil
hedging for US oil and gas producers between 1998-2001. Allayannis and Weston
(2001) examined the FX derivative usage and its direct impact on firm value for US
firms from 1990 to 1995. Carter, Rogers and Simkins (2006) explored commodity
hedging and firm value in the U.S airline industry. Jankensgård (2015) studied a
sample of Swedish firms listed on the Stockholm Stock Exchange in the end of 2009.
He examined whether centralized vs. decentralized decision making impacts firm
value.
7
1.2. Research objectives
The purpose of this study is to examine if there exists a difference in firm value
between users and non-users of FX derivatives. Firm value is explained by Tobin’s Q
and is defined as the ratio of the market value of the firm divided by the replacement
cost of its assets, evaluated at the end of each fiscal year. This study is based on firms
listed on the Stockholm Stock Exchange for the six-year period between 2005-2010. I
explore if hedging against FX risk has an impact on firm value, while controlling for
factors such as size, profitability, leverage, dividend payouts, diversified product
segments and capital expenditures.
As far as my knowledge goes there has not up to this date been a study that
investigates the direct relationship between firm value and FX derivative usage made
on a sample of Swedish listed firms with a longer time period that experiences a
financial crisis. The Swedish market is known to be open, which also means that
Swedish firms are more exposed to FX risks than for instance firms from the US. This
is because many Swedish firms have operations abroad and are exposed to exchange
rate movements through foreign sales and export/import activities. This study
provides no clear evidence that hedging is correlated with firm value in either
direction. The most significant result is the negative correlation between leverage and
firm value.
1.3. Outline
This paper is segmented into six sections. Section 2 summarizes previous research on
hedging and firm value. Section 3 includes the discussion and background and
develops the hypothesis. Section 4 elaborates the methodology and sample data.
Section 5 includes the empirical result and analysis. Section 6 concludes the study.

8
2. Prior research on hedging and firm value
2.1. Overview
Hedging should not be relevant to firm value in a perfect capital market (Modigliani
and Miller, 1958). Theory, however, recognizes several market imperfections that can
make risk management beneficial, thus contradicting the Modigliani and Miller
(1958) theorem. These imperfections, which will be further discussed in the context of
previous research and include; the underinvestment problem, the cost of financial
distress and costly external financing (Carter et al., 2006; Froot et al., 1993; Geczy et
al., 1997), managerial risk aversion (Guay and Kothari, 2002; Mian, 1996; Stulz,
1984; Smith; Stulz, 1985) tax incentives (Mayers and Smith, 1982; Smith and Stulz,
1985; Stulz, 1996; Leland, 1998). Most importantly, this section will examine the
direct relationship between hedging and firm value.
2.2. The underinvestment problem
Several theories suggest that derivative usage can reduce the underinvestment
problem (Carter et al., 2006; Geczy et al., 1997; Froot et al., 1993; Gay and Nam,
1998; Hagelin, 2003). The problem of underinvestment occurs when external
financing is expensive and internal capital is insufficient to finance growth
opportunities. (Ogden, Jen and O’Connor, 2003). Froot et al. (1993) argues that
hedging could reduce the underinvestment problem to firms with growth opportunities
when external financing is more costly than internal funds. They discovered that cash
flows generated within the firm could be disrupted by external factors such as volatile
market prices. The hedging firm can increase value even though the market is volatile
by ensuring that it has sufficient cash flows available to take on value-enhancing
projects. Gay and Nam (1998) directly analyzed the underinvestment problem as a
factor of derivative usage. They argue that risk management is beneficial as it
decreases the cost of external financing in poor economic climates, hence reducing the
underinvestment problem. Carter et al. (2006) examines whether jet fuel hedging is
positively related to firm value in the airline industry. They test a sample of 259 U.S.
airlines and find that hedgers trade at a premium of about 14%; moreover, they
suggest that hedging is important as it allows firms to expand operations during
unstable times, thereby alleviating the underinvestment problem. Hagelin (2003)
9
examined a sample of firms listed on the Stockholm Stock Exchange together with
their hedging policies. He finds evidence that firms hedge with the aim of reducing
their FX exposure. Consequently, this decreases the expected costs of financial
distress by lowering the cost of external financing, which will minimize the
underinvestment problem during poor economic times. Likewise, Geczy et al. (1997)
examines FX derivative activities and demonstrates that currency derivative usage is
related to research and development expenditures, which is also consistent with the
theory that hedging reduces the underinvestment problem. Nance, Smith and
Smithson (1993) corroborate this theory by proving that hedgers have higher R&D
expenditures. Furthermore, they provide evidence that hedgers have less fixed claims,
are larger and have more growth opportunities.
However, there are contradictory studies that show no evidence of a relationship
between hedging and underinvestment. Some studies, such as Mian (1996) even
reveal a negative correlation between a firm’s derivative usage and its investment
opportunities. Likewise, Berkman and Bradbury examine a sample of New Zealand
firms and find little evidence to support the underinvestment hypothesis. In New
Zealand firms are required to report the fair and notional value of their off- and on
balance sheet derivatives. Berkman and Bradbury, thus, have access to accurate data,
which gives them a more precise outcome compared to studies where information is
gathered using surveys. Several studies show no relation between hedging and firm
value, which supports the evidence of hedging not reducing the underinvestment
problem.
2.3. Managerial risk aversion
There are several contradicting theories concerning managerial risk aversion. One
theory typology suggests that managers hedge because of the incentive to maximize
their own utility. Guay and Kothari (2002) argue that a risk averse manager, one
keeps most of his wealth within the firm, will most likely attempt to reduce the firms’
risk by hedging. This will reduce the required risk premium, which means that
stakeholders will receive a smaller return on their investments.
Risk-averse managers engage in hedging for their own benefit if their wealth is
concentrated in the firm and if the cost of independently hedging for their own benefit

10
exceeds the cost of hedging at the firm level (Stulz 1984; Smith and Stulz 1985).
Managers are responsible to choose a firm’s hedging policy. Even though it is
believed that managers will pick a hedging policy that maximizes their own utility,
Stulz (1984) argues that shareholders will in the end select managers that will
maximize shareholder wealth, hence maximizing firm value. Smith and Stulz (1985)
argue that hedging should increase firm value, as long as the cost of hedging is less
than the reduction in managers’ compensation plus the increased revenues gained
through hedging.
Jin and Jorion (2007) studied the effect of hedging activities on gold mining firms and
found strong indication that supports the managerial risk aversion theory. They
suggests that managers who hold more stock tend to undertake more hedging
activities, while managers that hold more options tend to be less involved in hedging.
This is also supported by Graham and Rogers (2002), who imply that derivative usage
is related to a manager’s equity position. Tufano (1996) examined hedging activities
in the gold-mining industry and found that the use of commodity derivatives is
positively related to the value of stock that is held by managers and directors. This
implies that managers’ who have their own wealth within the company believe that
derivative usage affects firm value positively. They are more engaged in managing
risk because their own wealth is directly affected by their actions at the firm level.
This is also consistent with theories of managerial risk aversion done by Stulz (1984).
Jin & Jorion (2006) found no evidence that hedging leads to higher firm value, but
suggest that if hedging has no impact on firm value, then the management uses
hedging activities for personal utility maximization purposes.

11
2.4. Tax incentives
Several theories suggest that derivative usage may be motivated by tax incentives.
First, firms can reduce the expected cost of tax liability if the tax function is convex
(Mayers and Smith, 1982; Smith and Stulz, 1985). A convex tax function implies that
the effective tax rate increases together with the pre-tax income. Second, firms can
hedge to expand their debt capacity, which will increase interest tax deductions and
lead to greater tax advantages (Leland 1998). Nance et al. (1993) implied that hedging
will reduce financial distress costs and reduce expected taxes. Smith and Stulz (1985)
argue that tax volatility is costly for firms with a convex effective tax rate. Thus firms
will undertake hedging activities which minimizes tax related costs by reducing pre-
tax income volatility. They imply that the structure of the tax code can make it
advantageous for firms to take positions in futures, forward and option markets, if the
effective marginal tax rates are an increasing function of the firm’s pre-tax income. If
hedging reduces the variability of the pre-tax value, then the expected corporate tax
liability is reduced and the expected post tax value of the firm is increased, as long as
the cost of hedging does not exceed this value.
Graham and Rogers (2002) directly measure the tax function convexity and determine
tax savings that can be achieved by reducing the volatility of the taxable income. They
do this by studying derivative usage in 1994-1995 on a sample of 442 firms and find
no evidence that firms engage in hedging activities in order to reduce the expected tax
liability by decreasing the volatility of the taxable income. Their study shows that
there is no evidence implying a positive relationship between derivative usage and tax
convexity. Graham et al. (2002), Leland (1998) and Stulz (1996) illustrate that
hedging increases debt capacity by minimizing the volatility of income and reducing
the probability of financial distress.
2.5. Direct relationship between firm value and hedging
Clark and Mefteh (2010) examine the direct relationship between FX derivatives
usage and firm value for 240 of the largest French non-financial firms in 2004. They
find evidence implying that derivative usage significantly adds value to French firms,

12
but that this effect mainly applies to larger firms. However, the limitation of this
study is that seasonal effects might influence their results as they only use cross-
sectional data. Similarly, Allayannis and Weston (2001) examined the relationship
between firm value and the usage of foreign currency derivatives on 270 large non-
financial firms. They use panel data, with a time period of 5 years (1990-1995), which
gives a more accurate result as the longer time period accounts for seasonal effects.
They find that the firm market value of foreign currency derivative users is about 5%
higher compared to non-users, which is almost $200 million of added value to
hedging firms. However, they argue that companies that enjoy high growth
opportunities tend to have higher firm value, and therefore have bigger incentives to
hedge. They tested for reverse causation and found no evidence that enterprises
merely based on their large firm value choose to hedge, and that firms with lower firm
value would chose to stay un-hedged. They found evidence that companies that begin
to use derivatives experience increased firm value compared to firms that choose to
remain un-hedged. Likewise, firms that quit hedging experience decreased firm value
compared to firms that remain hedged.
Jankensgård (2015) studied a sample of 257 Swedish firms that were listed on
Stockholm Stock Exchange in the end of 2009. Because of the data scarcity on
centralization /decentralization, his research is limited to cross-section data. This can
give biased results due to seasonal cycles and macroeconomic effects. Jankensgård
showed that derivative usage is value adding to firms with a centralized foreign
exchange exposure management, while firms with a decentralized approach showed
no evidence of FX derivative premium. He called this the “centralized premium” and
argued that firms with a decentralized risk management suffer from coordination
problems and cost inefficiencies.
In contrast to Allayannis and Weston (2001) and Clark and Mefteh, (2010), Jin &
Jorion (2006), finds no support that hedging leads to higher firm value. They
investigate the hedging activities of a sample of 119 U.S oil and gas producers from
1998 to 2001 and conclude that hedging reduces stock price sensitivity to oil and gas
prices. However, they found no evidence that there is a variance in firm values
between hedgers and non-hedgers. They also argue that the hedging premium is
associated with the types of risks a company is exposed to. However, they claim that

13
if hedging does not impact firm value, then management uses hedging for personal
utility maximization.
Likewise, Hentschel and Kothari (1997) argue that numerous firms actively manage
their foreign exposure with derivative usage. But, when comparing hedgers to non-
hedgers, they barely show any differences in their risk characteristics that can be
linked to derivative usage. Tufano (1996) examined hedging activities in the gold-
mining industry and state that more than 85% of all gold mining firms engaged in
some sort of gold price hedging in 1990-1993. Nevertheless, he finds little empirical
support that risk management increases firm value. Jin and Jorion (2007) contributed
with an additional study on the relation between hedging activities and gold mining
firms. They found no evidence that derivatives would have a positive impact on firm
value.
Adam and Fernando (2006) examined gold mining firms in the period 1900-2000 and
found that companies that engage in hedging experience an economically significant
increase in cash flows. They have a considerable longer time period compared to
other studies, which should reduce seasonal and macroeconomic effects and provide
unbiased results. They claim that forward prices are usually higher than spot prices,
which will allow firms to sell at a forward price that is on average higher than the spot
price, earning on typically a premium of 3%. However, there is no evidence that this
contributes to higher firm value.
Petersen and Thiagarajan (2000) provide a different and very detailed case study
made on two gold mining firms, whereas one of them uses derivatives and the other
one does not. They find no premium for the user of derivatives and conclude that the
equity exposure to gold prices is almost the same for the two firms. However, they
claim that risk management can be done in other ways besides using derivatives. They
imply that the firm that does not use derivatives manages its risk through operational
and accounting strategies, which can be a reason to why they do not find any
differences in firm value. These studies are made on firms operating in specific
industries; hence the outcomes of their research can highly be affected by industry-
specific factors.

14
3. HYPOTHESIS DEVELOPMENT
3.1. Background
According to the classic Modigliani and Miller paradigm; risk management is
irrelevant, assuming that firms operate in a frictionless capital market. They argue that
investors are rational and can protect themselves by keeping a well-diversified
portfolio, but also that they are able to reduce risk by themselves at the same cost
(Modigliani and Miller, 1958). However, we do not live in a perfect world and recent
studies show that in the presence of capital market imperfections, such as agency
costs, costs of external financing, information asymmetries, direct and indirect
bankruptcy costs, as well as taxes, corporate hedging will add value to shareholders
(Bartram & Dufey, 2007; Gay and Nam, 1998; Graham and Rogers, 2002; Hagelin,
2003; Judge, 2003; Mian, 2006; Smith and Stulz, 1985).
Several empirical studies provide evidence on reasons to why firms participate in
hedging activities. Carter et al. (2006), Gay and Nam (1998) and Hagelin (2003)
argue that risk management is relevant to firms because it will alleviate the
underinvestment problem in bad economic times as it reduces the cost of external
financing. They show that there is a positive relationship between hedging and growth
opportunities. Similarly, Nance et al. (1993) and Geczy et al. (1997) examined
hedging activities and found that hedging is positively related to growth opportunities.
There are different interpretations on the value maximization theory. Numerous
studies found empirical evidence that corporate hedging has no impact on firm value,
as investors can by themselves reduce risk at least as efficiently through
diversification. Managing risk that investors cannot diversify away by themselves
may not increase shareholder value because investors receive a premium return for
holding risky securities (Hentschel and Kothari, 1997; Jin and Jorion, 2006; Jin and
Jorion 2007; Tufano, 1996). Dufey and Srinivasulu (1983) argue that hedging market
risk is a trade-off between risk and reward in the market.
Jin and Jorion (2007) and Tufano (1996) studied the effect of hedging activities on
gold mining firms and could not find evidence that hedging positively impacts firm

15
values. As mentioned previously, Jin & Jorion (2006) tested for a difference in firm
value between firms that hedge and those that do not hedge their oil and gas price risk.
Their findings indicate that there is generally no difference in firm value between
hedging and non-hedging companies. These studies are contrary to the findings
reported in Allayannis and Weston (2001) and Carter et al. (2006).
As we know, a frictionless market only exists in order to support and develop
theories, and corporate hedging can according to several empirical studies enhance
shareholder’s value through its impact on agency costs, costly external financing,
direct and indirect costs of bankruptcy, as well as taxes (Jankensgard, 2015).
According to theory, risk management can create value by reducing various forms of
financial distress costs such as costs of bankruptcy or alleviating underinvestment
problems by decreasing cash flow volatility (Bartram and Dufey 2007; Smith and
Stulz 1985).
3.2. Discussion and delimitations
Several theories have been developed on the derivative premium and the numerous
factors that might impact firm value. A limitation to this study is that some of the
explanatory variables that are not included in the research possibly impact firm value
and the decision to hedge. Some of these variables are not observable, or have been
excluded due to the data and time constraints. To allow for a better analysis, some of
the omitted variables will be deliberated; a managers’ own stake in the company,
foreign sales, a manager’s quality, the faced risk exposure, industry-specific factors,
the aim of hedging and whether the firm has a centralized or decentralized approach
to risk management. Foreign sales or other international activities are important
factors to why firms chose to hedge against currency fluctuations. Figures on foreign
sales were obtained from Datastream, but was excluded due to huge data
inconsistency. Jankensgård (2015) finds that firms with a centralized approach to risk
management experience a derivative premium while firms with a decentralized
approach do not show an increase in firm value associated wiith derivative usage.
Managerial quality is rather an unobservable firm characteristic and is difficult to
measure. Additionally, my econometric model is bound to several limitations and
provides evidence of robustness.

16
Studies illustrate mixed empirical results regarding the hedging premium, but most of
these analyses were based on data before the financial crisis in 2007-2008. Therefore
they do not examine change in firm value that experienced a severe financial crisis.
The hedging premium of hedging firms should – according to some theories – have a
lower financial distress cost during poor economic times (Smith and Stulz, 1985).
Consequently, the difference in firm value between hedgers and non-hedgers should
be even greater during this volatile period. After reading numerous articles, I observed
that most studies have a relative short time period; in most cases the time period
varies between 1-3 years. Therefore, I use panel data with a time period of 6 years,
which should be sufficient to get appropriate results and account for seasonal effects.
Another important factor is whether companies hedge with the aim of protecting
themselves from market uncertainties or for speculative reasons. There are several
studies indicating that firm’s hedge for other reasons that managing risk (Mian, 1996;
Nance et al., 1993; Tufano, 1996; Geczy et al., 1997). It is vital to mention that
Allayannis and Ofek (1997) examined whether firms hedge to reduce foreign
exchange risk or for speculative purposes and discovered that firms use derivatives to
reduce their risk exposure, and not to speculate. This indicates that the purpose of
derivative usage is to manage risk and is part of a value-increasing strategy.
Additionally, they found a positive relationship between foreign sales and the decision
of a firm to issue foreign debt. This suggests that companies can by issuing foreign
debt manage foreign exchange instability. This can affect my results as we are only
examining how derivative usage impact firm value. The fact that firms may hedge for
speculative reasons and that can firms are able manage risk in other ways than by
using derivatives is disregarded. This is supported by Petersen and Thiagarajan (2000)
who claim that firms are able to decrease their risk exposure through operational and
accounting choices.
An additional problem is the relationship between the dependent variable and the
independent variables. For example, Froot et al. (1993) pointed out that the more
valuable the firm’s investment opportunities, the more attractive risk management
becomes because disruptions to the investment program are more costly, this leads to

17
the endogeneity problem, that is the independent variable is correlated with the error
term. It is possible to test for this possibility by running the Hausman test.
3.3. Hypothesis
The purpose of this research is to examine if there exists a relationship between firm
value and the usage of FX derivatives. Due to the mixed results on the derivative
premium in previous studies, I want to study the relationship between FX derivatives
and firm value. A large number of Swedish firms have operations abroad, hence are
exposed to foreign exchange risk. This fact makes is suitable to study Swedish
companies. The time period is from 2005 to 2010, where the economy witnessed one
of the most severe financial crises in history, which could have an affect on the
results.
Due to the facts mention in the background and discussion and given that we are
living in an uncertain financial world, I aim to test if hedging impacts firm value.
Hedging does not only serve as a measure against instability but it also sends signals
to investors that the firms’ future cash flows are secured and that the risk of financial
distress is reduced.
The hypothesis is the following:

18
4. Methodology
4.1. Overview
The focus of my research lays on a sample of Swedish firms that are listed on the
Stockholm Stock Exchange. The aim is to examine if the usage of foreign currency
derivatives impacts firm value. To my research I have used numerous empirical
studies based on similar topics, but would point out Jankensgård (2015) and
Allayannis and Weston (2001) as the main benchmarks. Both studies provide
exceptional analyses and examine the relation between FX derivative usage and firm
value. Jankensgård research is important because his sample collection is based on
Swedish firms. He studies the impact of centralized vs. decentralized risk
management, but has the limitation of only using cross-sectional data.
4.2. Descriptive statistics
The choice of sample selection is very critical to the accuracy of the results. The
sample selection is narrowed down to Swedish firms with different size that are
operating in different industries. Second, firms operating in different industries and
with different growth rates can make the comparison biased since firm value can be
affected by industry-specific variables not included in our analysis. But, as my focus
is country-specific, I chose to study a wide range of industries in order to measure the
overall effect of hedging. The choice of currency derivatives is due to the fact that
they are one of the most frequently used derivatives and I want to examine how their
usage affects firm value.
This study is conducted on 85 Swedish firms that were listed on the large, mid, and
small cap lists on the Stockholm stock exchange from 2005 to 2010, totaling (85
firms*6 years) 520 observations. As we know, 2007-2008 experienced a severe
financial crisis. This is a relevant time period to test the hedging premium, because if
it exists, hedging firms will reduce the financial distress cost during poor periods and
consequently show an even greater difference in firm value than non-hedging firms
(Smith and Stulz, 1985). Froot et al. (1993) and Gay and Nam (1998) found that
hedging firms could increase firm value in the case of market volatility, because
hedging will reduce the underinvestment problem when external financing is costly.

19
The reason I study firms from Sweden is because the country is largely dependent on
export, has an open economy and a well-integrated financial market. Nevertheless,
Sweden has not been studied thoroughly in previous researches and is a country that
has managed to cope with the financial crisis better than many other economies.
We have included firms that operate in different industries and with different sizes;
hence the study includes companies that are listed as small, mid and large cap. All the
financial service firms were excluded, because most of them are market makers in
foreign currencies derivatives, thus their motivations for using derivatives may differ
from the motivations of nonfinancial firms. I also excluded public organizations
because they are heavily regulated. After excluding these, I was left with 353 firms
that were extracted from Datastream. Many of them lacked data for the whole sample
period and had to be omitted. There was also evidence of the financial crisis during
200-2008 as many firms were being unlisted in this period. Due to incomplete data
and missing relevant information both in Datastream and the annual reports; left were
only 85 companies to include in the research. As many as 66 (78%) of them are
currency derivative users while only 19 (22%) do not use FX derivatives. As noted,
the proportion of derivative users is much higher, which can be expected in an open
economy where firms in one way or another deal with foreign currencies.
4.2.1. Firm value
Tobin’s Q is used as a measure of a firm’s market value. Tobin’s Q is defined as the
ratio of the market value of the firm to replacement cost of assets, evaluated at the end
of the fiscal year. We compute Tobin’s Q for a total of 85 firm-year observations
(Total 85 firms*6 years). The natural logarithm of Tobin’s Q was calculated as it can
account for skewed distribution. Tobin’s Q has been used as a firm value measure in
numerous previous researches which also makes it suitable to include in my research,
as it can serve as a benchmark when comparing my results to other studies.
Additionally, all the data needed to calculate Tobin’s Q is obtainable from
Datastream.

20
4.2.2. Derivative usage
Information on whether firms use currency derivatives is found in their annual reports,
which requires manually going through each individual statement. In some cases, this
information was easy to obtain as some companies have transparent risk management
programs and are also clear about why they use derivatives. Several enterprises stated
that the purpose of hedging is not for speculative activities but rather to minimize the
volatility of future cash flows and exposure to currency exchange rates. Others are not
as transparent and required careful analysis of their annual reports. In this study, the
usage of FX derivatives is a dummy variable that will take on the value of “1” for
users and “0” otherwise.
4.2.3. Other determinants of firm value
Similar to Jankensgårds (2015) research, the control variables included in this study
are: dividends, firm size, profitability, leverage, diversification and capital
expenditures. As mentioned, the aim was to use foreign sales as a control variable, but
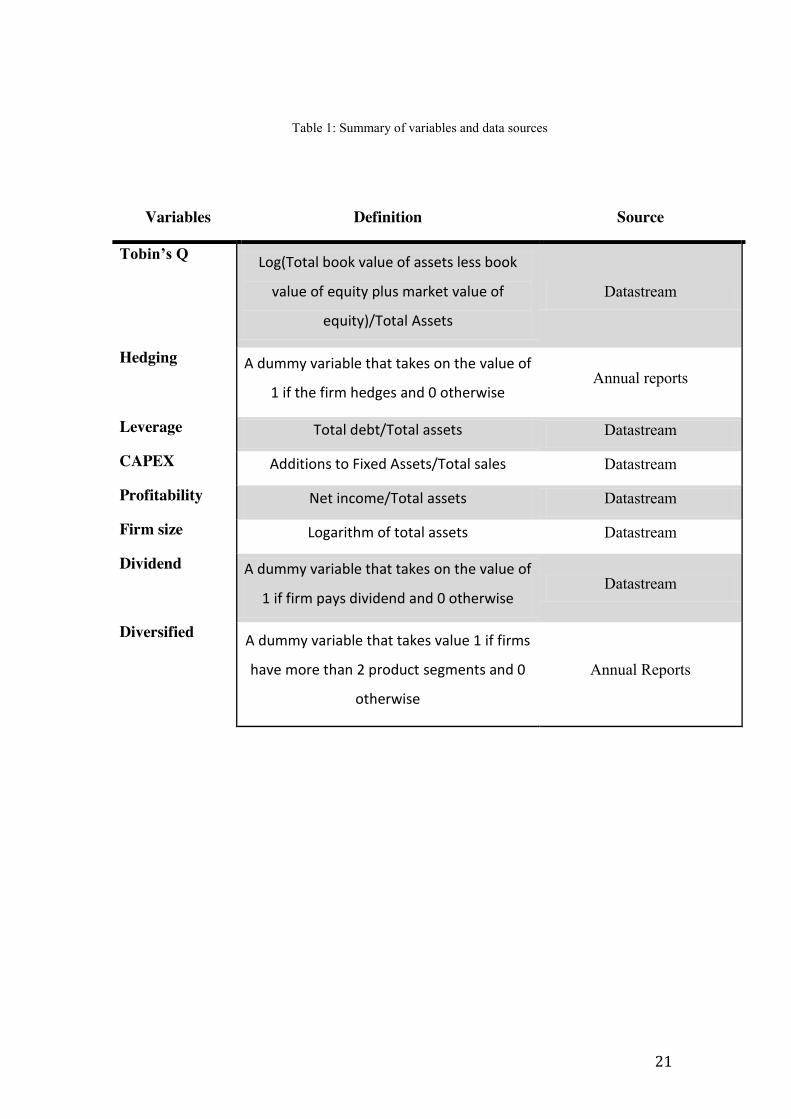
due to the severe lack of relevant data, this variable had to be excluded. Table 1
summarizes the sample construction.
21
Table 1: Summary of variables and data sources
Variables Definition Source
Tobin’s Q Log(Total book value of assets less book
value of equity plus market value of
equity)/Total Assets
Datastream
Hedging A dummy variable that takes on the value of
1 if the firm hedges and 0 otherwise Annual reports
Leverage Total debt/Total assets Datastream
CAPEX Additions to Fixed Assets/Total sales Datastream
Profitability Net income/Total assets Datastream
Firm size Logarithm of total assets Datastream
Dividend A dummy variable that takes on the value of
1 if firm pays dividend and 0 otherwise Datastream
Diversified A dummy variable that takes value 1 if firms
have more than 2 product segments and 0
otherwise
Annual Reports

22
4.3. Statistical distributions for diagnostic tests
In order to run an OLS regression that will provide as accurate results as possible, it is
necessary to run various regression diagnostic tests. To obtain an unbiased OLS, there
are four desirable properties that should be satisfied:
(1) E(ut ) = 0
(2) Var(ut)= σ 2 < ∞
(3) cov(ui , u j ) = 0
(4) cov(ut , xt ) = 0
The first assumption (1) requires that the average value of the errors is zero. To solve
this, when estimating the OLS regression we include a constant term is included in the
equation to avoid violation of this assumption.
For the second assumption (2), it is assumed that the variance of the errors is constant
and finite over all values of xt. This is known as the assumption of homoscedasticity.
If the errors do not have a constant variance, they are said to be heteroscedastic. The
consequence of not having a constant variance is that the OLS estimation will be
biased.
Assumption (3) requires that the covariance between the error terms over time is zero,
which implies that errors are linearly independent of one another. The Watson Durbin
statistics can expose this problem.
Assumption (4) requires that there is no relationship between the error term and the
corresponding xt values.

23
4.4. Model development
Panel data is used as multiple companies together with their characteristics over a
time period of 6 years are being analyzed; consequently we have both time series and
cross-section data. The data has been organized according to panel data in Excel and
was then extracted to the software program EViews.
As I aim to examine is hedging is associated with firm value, we use Tobin’s Q as the
dependent variable. In my initial model, Tobin’s Q is on the left side of the equation
in and the explanatory variables are on the right side. To test for the hedging premium
I used an OLS model that is based on the following equation:
Log(Tobin’s Q) = * + *hedging + *leverage
+ *CAPEX + *profitability + *size
+ *dividend + *diversified
Because firm value is affected by several variables, I use a multivariate test where I
am able to control for other variables besides hedging. I test whether derivative usage
has an impact on firm value and control for size, profitability, leverage, capital
expenditures, diversification and dividend payouts.
4.4.1. Hypothesis testing
The first regression was made with the random effects specification. In order to
evaluate if there exists a significant difference in the estimates of the two models, I
employed the Hausman test. Giving a probability of 0.000, it implies that the fixed
effect for both time-series and cross-section is a more appropriate model to use on my
data. However, two of the dummy variables take on the same value through the whole
sample period for a given firm, that is for example when a given firm hedges
throughout the whole 6-year period. This is problematic because it is not possible to
run the fixed cross-section effects when including these dummy variables in the
regression. The fixed effects model assigns a unique intercept to each individual firm
and is useful because it controls for unobservable firm characteristics that may affect a
firm value (Hausman and Taylor, 1981). Given the unique intercept, fixed effects can
(1)

24
control for individual firm specific effects. The regression for fixed cross-section
effect is done without the dummy variables in order to compare the other variables
with the pooled and random regression. Running a regression without these dummies
means that hedging is excluded, which is the main aspect of this thesis. However, it
should serve as a comparable regression of the other variables.
Excluding the dummy variables “hedge”, “diversified” and “dividend”:
Log(Tobin’s Q) = + *leverage
+ *CAPEX + *profitability + *size
I added back dividend, as it is the only dummy variable that does not take on the same
value throughout the whole sample period for an individual firm:
Log(Tobin’s Q) = + *leverage + *CAPEX
+ *profitability + *size + *dividend
Afterwards, I ran the pooled regression with all variables included:
Log(Tobin’s Q) = + *hedging + *leverage
+ *CAPEX + *profitability + *size
+ *dividend + *diversified
To check for robustness, I additionally complemented with testing several models and
ran the pooled regression, fixed time-series effects and the cross-section random
effects test equation. Running different models permits me to compare the results of
multiple regressions, which results in a more comprehensive analysis. Additionally, I
ran two separate regressions with fixed effects, one made only on hedgers and the
other one on non-hedgers.
(3)
(4)
(2)

25
5. Analysis
5.1. Firm value
The regression output shows no evidence that hedging would impact firm value in any
of the tested models. Interpreting in the pooled and the fixed period effects
regression; around 13% vs. 22% of firm value is explain by the independent variables.
This indicates that the rest is explained by external factors not included in this
research. This is also supported by the Durbin Watson statistics for both regressions,
which suggest that there exists a positive serial correlation in the residuals. Omitting
variables in the model can be the main cause of autocorrelation, because an
explanatory variable is excluded, its effect on the regressand instead becomes a part of
the residuals. Consequently, if the excluded regressor is positively related to the
dependent variable, it can lead to positively correlated residuals. One example of an
omitted variable could be managers quality, which logically suggest that the better the
manager, the higher the firm value. In previous sections, additional explanatory
variables are described that most likely will impact firm value but are not included in
this research. It is evident that we are not able to draw a robust conclusion due to
variations in the regression results.
When running the fixed effects model and excluding all the dummy variables, the
suggested that roughly 80% of firm value is explain by the independent variables.
This implies that dividend, diversification and hedging should not have any
noteworthy effects on firm value.
As noted, the empirical evidence indicates that there is no significant difference in
firm value between hedgers and non-hedgers, in contrast to what Allayannis and
Weston (2001) found. However, Guay and Kothari (2003) question their findings and
suggest that derivative usage will not increase firm value under extreme market
instability. This supports my research as data have been collected from a time period
that experienced a financial crisis. This is also backed by Jin & Jorion (2006) who
studied oil hedging and its impact on firm value. They do not find any significant
differences between hedgers and non-hedgers. Similarly, Jin and Jorion (2007) could
not find any positive relationship between firm value and derivative usage in their
26
study based on North American gold mining firms. Copeland and Joshi (1996) and
Hagelin and Prambourg (2004) also imply that hedging might be ineffective when it
comes to reducing risk. However, their findings may be affected by industry-specific
factors.
5.2. Leverage
Comparing the different regression results in table 2, the independent variable
LEVERAGE appears to have the most significant influence on firm value, implying a
negative relationship between leverage and firm value. This is contradictory to
evidence found by Clark and Mefteh (2010) who argues that leverage is not a
significant explanatory variable of firm value. Table 3 shows that hedgers tend to
employ higher levels of leverage. Moreover, it also demonstrates that hedgers on
average have lower firm values than non-hedgers. This can support the regression
results of negative correlation between leverage and firm value, as it shows that
hedgers who employ more leverage have a lower firm value. This is consistent with
the research done by Aggarwal and Zhao (2007) who also reports a constant negative
relationship between leverage and firm value. This is also in line with theories
indicating that firm’s hedge with the purpose of increasing their debt capacity. Higher
leverage leads to greater tax advantages as it increases the interest tax deductions
(Leland 1998).
5.3. Profitability
There are significant outcomes for PROFITABILITY but with mixed results
regarding its impact on firm value. Model 2 shows a negative relationship between
profitability and firm value while the pooled and fixed period effects imply a positive
correlation, which one would expect. According to several theories, profitable firms
should have higher market value, because profitable firms tend to trade at a premium
(Allayannis and Weston, 2001). This is inconsistent with the mean values calculated
in table 3; indicating that hedgers are less profitable than non-hedgers. This outcome
can also be caused by reverse causation meaning that risk management is more
valuable to less profitable firms.

27
5.4. Size
Similarly, the explanatory variable SIZE gives mixed results. While the pooled and
fixed for period regression imply that there is a positive relationship between size and
firm value, the cross-section random effect specification indicates that size negatively
influences firm value. This is supported by evidence from Land and Stultz (1994) who
found a negative correlation between size and firm value. Size might impact firm
value negatively because the bigger the firm, the harder it becomes to manage and
control. As can be seen in table 3, hedgers have on average a lower firm size and are
less profitable. But as already mentioned, this can be a sign of reverse causation.
5.5. Diversified
According to the pooled and fixed period models, diversity impacts firm value
negatively, meaning that firms with more than 2 product segments have lower firm
values than specialized firms that focuses on 2 or less products. Firms that operate in
different fields might have a decentralized decision making for each product segment,
which will make them harder to manage. This is also supported by the mean values
implying that diversified firms have a lower Q (1.555), compared to non-diversified
firms (1.8).

28
Table 2: OLS model of firm value
Table 2 shows the results from the OLS regressions, where the dependent variable is Tobin’s Q and defines firm value. The first model gives no significant results, where the dummy variable hedging, dividend and diversified has been excluded. The model is re-estimated adding back dividend; where profitability becomes significant, affecting firm value negatively. The model is re-estimated in a pooled OLS regression, where profitability, size, diversification and leverage are significant, but obtains a very low , meaning that the independent variables only explain 12.6% of the dependent variable. The model is once again re-estimated where the period is fixed and includes all the independent variables. Once again the profitability, size, diversified and leverage variables are significant, with similar effects as the pooled regression. The random effects regression is once again estimated, where size, leverage and dividend are significant. I then chose to separate hedgers and non-hedgers and ran a separate regression for each of them.
P-values are reported in (parenthesis)
Results significant at the 5% level are donated with a star*
Results significant at the 10% level are donated with two stars**
1. Fixed/Fixed
2. Fixed/Fixed
3. Pooled 4. Fixed period
5. Random effects
6. Hedgers FF
7. Non-hedgers FF
Constant -0.188607 (0.609)
-0.407 (0.326)
0.5184 (0.386)
-0.058 (0.518)
1.951 (0.000)*
-0.359 (0.374)
0.361 (0.666)
Hedging -0.040 (0.30)
0.029 (0.348)
N/A
Capex 0.033 (0.1165)
0.029 (0.144)
0.0435 (0.219)
0.051 (0.13)
0.035 (0.184)
0.029 (0.145)
0.339 (0.32)
Profitability -0.287 (0.244)
-1.71 (0.000)*
0.63 (0.041)*
0.626 (0.034)*
-0.047 (0.878)
-1.694945 (0.000)*
0.262 (0.46)
Size 0.050 (0.369)
0.08 0.197)
0.03 (0.0498)*
0.042 (0.001)*
-0.262 (0.000)*
0.075 (0.220)
-0.029 (0.817)
Dividend 0.013 (0.6)
-0.015 (0.643)
-0.055 (0.91)
-0.053 (0.059)**
Diversified -0.049 (0.098)**
-0.055 (0.033)*
N/A
Leverage -0.0575 (0.550)
0.001 (0.996)
-0.595 (0.00)*
-0.54 (0.00)*
-0.337 (0.004)*
0.000272 (0.998)
-0.193 (0.355)
0.84 0.866 0.126 0.22 0.746 0.866 0.8174
(F-stat) 0.0000 0.000 0.0000 0.0000 0.0000 0.0000 0.0000
Durbin-Watson
1.745 1.82 0.713 0.597 1.824 1.824 1.61

29
5.6. Mean values of Tobin’s Q and its explanatory variables
Table 3 shows that the average value for Tobin’s Q is higher for non-hedgers
compared to hedgers. This means that we are checking for differences in firm value
between hedgers and non-hedgers without considering the impact of other control
variables. Both hedgers and non-hedgers have a Tobin’s Q larger than 1, which
implies that they are trading at a premium. Considering that the sample period
included the financial crisis of 2007-2008 is actually consistent with the fact that the
Swedish economy managed to better survive and recover from the financial crisis
compared to other economies. Excluding the control variables, we can based on this
simple interpretation conclude that; non-hedgers have higher firm value than hedgers,
which is inconsistent with theories stating that hedging impacts firm value positively
(Clark and Mefteh, 2010; Allayannis and Weston, 2001).
Similarly, the mean value of leverage for hedgers is almost the double compared to
non-hedgers. The differences in size is not noteworthy, but we can see that non-
hedgers tend be larger than hedgers. However, when looking at profitability, non-
hedgers are significantly more profitable than hedgers. One interpretation of this is
that less profitable firms chose to hedge their risks to protect their cash flows, while
more profitable firms do not hedge as they have enough cash flows to cover potential
losses incurred by foreign exchange volatility.
Table 3: Mean values for hedger vs. non-hedgers
Tobin's Q Leverage Size Profit
Hedgers 1.663 0.212 6.559 0.006
Non-hedgers 1.797 0.107 6.636 0.014

30
Table 4 shows the differences in dividend policies between hedgers and non-hedgers.
It reveals that Tobin’s Q is the highest for hedgers who do not pay dividend, and
lowest for hedgers who pays dividend. There are mixed empirical findings on how
dividends impact firm value and are not further studied in this research. Additionally,
as can be seen from table 5; diversified firms have on average a lower Tobin’s Q
compared to firms are focused on two or less product segments.
Table 4: Tobin’s Q mean values of dividend policies between hedgers vs. non-hedgers
Tobin's Q No dividend Dividend
Hedge 2,105 1,647
No Hedge 1,744 1,862
Table 5: Tobin’s Q mean value compared to diversified vs. non-diversified firms
Tobin's Q
Diversified 1.56
Not diversified 1.80

31
6. Conclusion This research studies the usage of currency derivatives and their impact on firm value
in a sample of 85 firms listed on the Stockholm Stock Exchange from 2005 to 2010.
No clear evidence is found that hedging impacts firm value. The results are extremely
mixed, which can be justified by several factors. First, we study firm value during a
period that experienced a financial crisis. This was done purposely, as theories state
that hedging reduces financial distress cost. If this theory holds, hedgers should have
coped with the financial crisis better than non-hedgers. However, there are valid
reasons to why hedging does not impact firm value, or why it even decreases it (Jin &
Jorion, 2006; Hentschel and Kothari, 1997; Tufano, 1996). Second, this research
makes the assumption that hedging has been used for the purpose of managing risk.
As mentioned in previous sections, derivative usage can be among others, used for
speculative reasons. This can increase exposure and lead to losses for a firm. The
average value of profitability shows that hedgers are less profitable, which goes in
line with this theory. Furthermore, we find that leverage has a negative influence on
firm value. This research contributes with studying the hedging premium during crisis
and on a national level. It shows that there is no relationship between FX derivative
usage and firm value, even in time of crisis. It is evident that we are not able to draw a
robust conclusion due to variations in the regression outputs. Clearly, this topic is
subject to additional and deeper research. Future study should include more
comprehensive data and take into account additional explanatory variables. Besides, it
will be beneficial to test this relation using the most recent available figures. This will
provide evidence of current market condition, because the impact of hedging might
change through times.

32
7. References Adam T. and Fernando C., 2006. “Hedging, Speculation and Shareholder Value.”
Journal of Financial Economics 81, pp. 283-309
Allayannis G. and Ofek E., 1997, “Exchange rate exposure, hedging and the use of
foreign currency derivatives”, Department of Finance, Working series paper 1998
Allayannis G. and Weston J., 2001, “The use of Foreign Currency Derivatives and
Firm market value”, the review of financial studies Spring 2001, Vol. 14. No.1
pp.243-276
Bartram A. & Dufey G., 2007, “Why hedge? Rationales for corporate hedging and
value implications”, The Journal of Risk Finance, Vol.8 No.5 pp. 434-449
Berkman, H. and Bradbury M.E., 1996, “Empirical Evidence on the Corporate Use of
Derivatives,” Financial Management (Summer), 5-13
Carter D., Rogers D., and Simkins B., 2006, “Does Hedging Affect Firm Value?
Evidence from the US Airline Industry.” Financial Management 35:1, pp. 53-86
Coles J., Lemmon M., and Meschke F., 2003, “Structural models and endogeneity in
corporate finance: The link between managerial ownership and corporate
performance”, Working paper, Arizona State University.
Copeland, T.E., and Y. Joshi, 1996, “Why Derivatives Do not Reduce FX Risk?”
Corporate Finance, 35-41
Dufey, G. and Srinivasulu, S.L., 1983, “The case for corporate management of foreign
exchange risk”, Financial Management, Vol. 12 No. 4, pp. 54-62
Ephraim Clark and Selma Mefteh, 2010, “International Journal of Business”
Froot K., Scharfstein D. and Stein J., 1993, “Risk management: Coordinating
corporate investment and financing policies”, Journal of Finance 48, 1629–1658
Gay G. & Nam J, 1998, “The underinvestment problem and corporate derivatives

33
use”, Financial Management, Vol. 27, No. 4
Geczy, C., B.A. Minton, and C. Schrand, 1995, “Why Firms Hedge: Distinguishing
Among Existing Theories” Ohio State University Working Paper
Geczy, C., Minton, B., Schrand, C., 1997, “Why firms use currency derivatives”,
Journal of Finance 52, 1323-1354
Graham, J. and Rogers D., 2002, “Do Firms Hedge in Response to Tax Incentives?”,
Journal of Finance 57:2, pp. 815-39
Guay W. & Kothari. S. P, 2002, “How much do Firms Hedge with Derivatives?”
Hagelin, N., 2003, “Why Firms Hedge with Currency Derivatives: An Examination of
Transaction and Translation Exposure”, Applied Financial Economics, 13, 55–69
Hagelin, N., and Prambourg B., 2004, “Hedging Foreign Exchange Exposure: Risk
Reduction from Transaction and Translation Exposure”, Journal of International
Financial Management and Accounting, 15, 1, 1-20
Hausman A. and Taylor W., 1981, “Panel data and unobservable individual effects”,
Econometrica, Vol. 49, No. 6
Hentschel L. and Kothari S.P., 1997, “Life insurance or lottery: Are corporations
managing or taking risks with derivatives?”, Managing Paper, University of
Rochester, Rochester New York
Judge A., 2003, “The deteminants of Foreign Currency Heding of UK Non-Financial
Firms”, Economics Group, Middlesex University, London
Leland, H., 1998, “Agency costs, risk management, and capital structure”, Journal of
Finance 53, 1213-1243
Mayers, D. and C. Smith, 1990, “On the corporate demand for unsurance”, Journal of
Business, Vol 55, 281-296
Mian, S.L., 1996, “Evidence on Corporate Hedging Policy”, Journal of Financial and
Quantitative Analysis (September), 419-439

34
Modigliani, F., Miller, M., 1958, “The cost of capital, corporation finance and the
theory of investment”, American Economic Review 48, 261-297
Nance D., Smith C., Smithson C., 1993, “On the Determinants of Corporate
Hedging”, The Journal of Finance, Vol. 48, No 1, 267-284
Ogden J., Jen F. and O’ Connor P., 2003, ”Advanced Corporate Finance: Policies and
Strategies”, 1th Edition, Pearson Eduction, 93-94
Stulz R, 1984, “Optimal Hedging Policies”, Journal of Financial and quantitative
analysis, VOL. 19, NO. 2. June 1984
Smith, C. and Stulz R., 1985, “The Determinants of Firm's Hedging Policies.”,
Journal of Financial and Quantitative Analysis 20:4, pp. 391-405
Tufano P., 1996, “Who Manages Risk? An empirical Examination of Risk
Management Practices in the Gold Mining Industry”, Journal of Finance, 51 (4), pp.
1097-1137
Tufano, P., 1998, “Agency Costs of Corporate Risk Management,” Financial
Management (Spring), 67-77.
Warner, J.B., 1977, “Bankruptcy Costs: Some Evidence,” Journal of Finance (May),
337-348.
Wysocki, P.D., 1996, “Managerial Motives and Corporate Use of Derivatives: Some
Evidence,” Simon School of Business, University of Rochester Working Paper.
Jin Y. and Jorion P, 2006, “Firm Value and Hedging: Evidence from U.S Oil and Gas
Producers” The Journal of Finance. Vol. LXI
Jin Y. and Jorion P, 2007, “Does Hedging increase firm value? Evidence from the
Gold Mining industry”

35
8. Appendix
1. Fixed for cross-section and time-series
Dependent Variable: TOBQ_LOG Method: Panel Least Squares Date: 05/22/15 Time: 11:24 Sample: 2005 2010 Periods included: 6 Cross-sections included: 85 Total panel (balanced) observations: 510
Variable Coefficient Std. Error t-Statistic Prob. C -0.188607 0.368220 -0.512212 0.6088
LEVERAGE -0.057498 0.096041 -0.598676 0.5497 CAPEX 0.033026 0.020997 1.572861 0.1165 PROFIT -0.286623 0.245785 -1.166151 0.2442
SIZE 0.050239 0.055878 0.899084 0.3691 Effects Specification Cross-section fixed (dummy variables)
Period fixed (dummy variables) R-squared 0.839637 Mean dependent var 0.130871
Adjusted R-squared 0.803786 S.D. dependent var 0.298448 S.E. of regression 0.132200 Akaike info criterion -1.044093 Sum squared resid 7.270417 Schwarz criterion -0.263632 Log likelihood 360.2436 Hannan-Quinn criter. -0.738101 F-statistic 23.42053 Durbin-Watson stat 1.745131 Prob(F-statistic) 0.000000

36
2. Pooled regression including all variables
Dependent Variable: TOBQ_LOG Method: Least Squares Date: 05/22/15 Time: 11:34 Sample: 1 432 Included observations: 432
Variable Coefficient Std. Error t-Statistic Prob. C 0.104003 0.119952 0.867033 0.3864
HEDGE -0.040631 0.039184 -1.036914 0.3004 LEVERAGE -0.595278 0.092439 -6.439655 0.0000
CAPEX 0.043527 0.035361 1.230936 0.2190 PROFIT 0.629760 0.307797 2.046027 0.0414
SIZE 0.032083 0.016307 1.967436 0.0498 DIVIDEND -0.014765 0.031800 -0.464293 0.6427
DIVER -0.049030 0.029595 -1.656686 0.0983 R-squared 0.126370 Mean dependent var 0.157973
Adjusted R-squared 0.111947 S.D. dependent var 0.300460 S.E. of regression 0.283143 Akaike info criterion 0.332618 Sum squared resid 33.99214 Schwarz criterion 0.407959 Log likelihood -63.84547 Hannan-Quinn criter. 0.362362 F-statistic 8.761606 Durbin-Watson stat 0.712871 Prob(F-statistic) 0.000000

37
3. Fixed for time-series including all variables
Dependent Variable: TOBQ_LOG Method: Panel Least Squares Date: 05/22/15 Time: 12:20 Sample: 2005 2010 Periods included: 6 Cross-sections included: 85 Total panel (balanced) observations: 510
Variable Coefficient Std. Error t-Statistic Prob. C -0.058275 0.090162 -0.646339 0.5184
HEDGE 0.029058 0.030926 0.939606 0.3479 LEVERAGE -0.541585 0.080453 -6.731669 0.0000
CAPEX 0.050967 0.033654 1.514452 0.1305 PROFIT 0.626304 0.294934 2.123538 0.0342
SIZE 0.041996 0.012863 3.264921 0.0012 DIVIDEND 0.003315 0.028483 0.116397 0.9074
DIVER -0.054978 0.025674 -2.141419 0.0327 Effects Specification Period fixed (dummy variables) R-squared 0.220301 Mean dependent var 0.130871
Adjusted R-squared 0.201475 S.D. dependent var 0.298448 S.E. of regression 0.266693 Akaike info criterion 0.219726 Sum squared resid 35.34933 Schwarz criterion 0.327662 Log likelihood -43.03020 Hannan-Quinn criter. 0.262044 F-statistic 11.70213 Durbin-Watson stat 0.596849 Prob(F-statistic) 0.000000

38
4. Only included hedgers – Fixed for cross-section and time-series
Dependent Variable: TOBQ_LOG Method: Panel Least Squares Date: 05/22/15 Time: 17:13 Sample: 2005 2010 Periods included: 6 Cross-sections included: 66 Total panel (balanced) observations: 396
Variable Coefficient Std. Error t-Statistic Prob. C -0.358635 0.403058 -0.889785 0.3742
LEVERAGE 0.000272 0.107551 0.002525 0.9980 CAPEX 0.028793 0.019714 1.460533 0.1451 PROFIT -1.694945 0.411828 -4.115659 0.0000
SIZE 0.074597 0.061165 1.219609 0.2235 Effects Specification Cross-section fixed (dummy variables)
Period fixed (dummy variables) R-squared 0.865528 Mean dependent var 0.122550
Adjusted R-squared 0.834528 S.D. dependent var 0.302364 S.E. of regression 0.122996 Akaike info criterion -1.184508 Sum squared resid 4.856130 Schwarz criterion -0.430452 Log likelihood 309.5325 Hannan-Quinn criter. -0.885774 F-statistic 27.92041 Durbin-Watson stat 1.824009 Prob(F-statistic) 0.000000

39
5. Includes only non-hedgers. Fixed for cross-section and time-series
Dependent Variable: TOBQ_LOG Method: Panel Least Squares Date: 05/22/15 Time: 12:09 Sample: 2005 2010 Periods included: 6 Cross-sections included: 19 Total panel (balanced) observations: 114
Variable Coefficient Std. Error t-Statistic Prob. C 0.361151 0.834153 0.432955 0.6661
LEVERAGE -0.192669 0.207130 -0.930187 0.3549 CAPEX 0.339015 0.338585 1.001270 0.3195 PROFIT 0.262288 0.353522 0.741929 0.4602
SIZE -0.029194 0.126057 -0.231594 0.8174 Effects Specification Cross-section fixed (dummy variables)
Period fixed (dummy variables) R-squared 0.782962 Mean dependent var 0.159776
Adjusted R-squared 0.714822 S.D. dependent var 0.283811 S.E. of regression 0.151561 Akaike info criterion -0.726285 Sum squared resid 1.975473 Schwarz criterion -0.054237 Log likelihood 69.39826 Hannan-Quinn criter. -0.453538 F-statistic 11.49053 Durbin-Watson stat 1.611079 Prob(F-statistic) 0.000000

40
6. Cross-section random effects test equation
Cross-section random effects test equation: Dependent Variable: TOBQ_LOG Method: Panel Least Squares Date: 05/22/15 Time: 16:14 Sample: 2005 2010 Periods included: 6 Cross-sections included: 85 Total panel (balanced) observations: 510 WARNING: estimated coefficient covariance matrix is of reduced rank
Variable Coefficient Std. Error t-Statistic Prob. C 1.951119 0.386389 5.049617 0.0000
HEDGE NA NA NA NA DIVIDEND -0.052817 0.027932 -1.890869 0.0593
DIVER NA NA NA NA LEVERAGE -0.336977 0.116686 -2.887895 0.0041
CAPEX 0.034943 0.026230 1.332174 0.1835 PROFIT -0.046639 0.304752 -0.153040 0.8784
SIZE -0.261930 0.058469 -4.479830 0.0000 Effects Specification Cross-section fixed (dummy variables) R-squared 0.746019 Mean dependent var 0.130871
Adjusted R-squared 0.692199 S.D. dependent var 0.298448 S.E. of regression 0.165578 Akaike info criterion -0.599960 Sum squared resid 11.51480 Schwarz criterion 0.147289 Log likelihood 242.9897 Hannan-Quinn criter. -0.306989 F-statistic 13.86140 Durbin-Watson stat 1.740849 Prob(F-statistic) 0.000000