Embed Size (px)
Citation preview

Congressional Budget Justification
FOREIGN ASSISTANCE
SUMMARY TABLES
Fiscal Year 2014

ii
This page intentionally left blank.

iii
Overview of Tables …………………………………………………………………………………………………………… vList of Acronyms………………………………………………………………………………………………………………… vii
Table 1 State Operations and Foreign Assistance Request - FY 2012 - FY 2014……………………………………………………… 1Table 2 State Operations and Foreign Assistance Request, Overseas Contigency Operation (OCO) - FY 2012 - FY 2014…………… 5Table 3a Country/Account Summary [Spigots] FY 2012 Actual………………………………………………………………………… 7Table 3b Country/Account Summary [Spigots] FY 2014 Request……………………………………………………………………… 13Table 4 Country/Account Summary FY 2012 - FY 2014 Overseas Contingency Operations (OCO)………………………………… 20Table 5 Objectives, Program Areas: Summary – FY 2012 – FY 2014………………………………………………………………… 23Table 6 Objectives, Program Areas by Account – FY 2012 Actual…………………………………………………………………… 24Table 7 Objectives, Program Areas by Account – FY 2014 Request…………………………………………………………………… 25Table 8 Global Climate Change Initiative: Adaptation by Account - FY 2014………………………………………………………… 26Table 9 Global Climate Change Initiative: Clean Energy by Account – FY 2014……………………………………………………… 28Table 10 Global Climate Change Initiative: Sustainable Landscapes by Account – FY 2014…………………………………………… 30Table 11 Feed the Future Initiative – FY 2014…………………………………………………………………………………………… 31Table 12a Global Health Initiative: Summary – FY 2014………………………………………………………………………………… 34Table 12b Global Health Initiative by Strategic Framework – FY 2014…………………………………………………………………… 35Table 13a Country/Key Interest: Biodiversity – FY 2014………………………………………………………………………………… 38Table 13b Country/Key Interest: Basic Education – FY 2014……………………………………………………………………………… 39Table 13c Country/Key Interest: Higher Education – FY 2014…………………………………………………………………………… 41Table 13d Country/Key Interest: Evaluation – FY 2014…………………………………………………………………………………… 43Table 13e Country/Key Interest: Gender – FY 2014……………………………………………………………………………………… 47Table 13f Country/Key Interest: Family Planning and Reproductive Health – FY 2014………………………………………………… 55Table 13g Country/Key Interest: HIV/AIDS – FY 2014…………………………………………………………………………………… 57Table 13h Country/Key Interest: Malaria – FY 2014……………………………………………………………………………………… 59Table 13i Country/Key Interest: Maternal and Child Health – FY 2014………………………………………………………………… 60Table 13j Country/Key Interest: Neglected Tropical Diseases & Other Public Health Threats – FY 2014……………………………… 62Table 13k Country/Key Interest: Nutrition – FY 2014…………………………………………………………………………………… 63Table 13l Country/Key Interest: Pandemic Influenza and Other Emerging Threats – FY 2014………………………………………… 64
Table of Contents

iv
Table 13m Country/Key Interest: Polio – FY 2014…………………………………………………………….…………………………………………………………………… 65Table 13n Country/Key Interest: Tuberculosis – FY 2014…………………………………………………...……………………………………………………………………… 66Table 13o Country/Key Interest: Microenterprise – FY 2014……………………………………..………………………………………………………………………………… 68Table 13p Country/Key Interest: Trans-Sahara Counter Terrorism Partnership – FY 2014………………………………………………………………………………………… 70Table 13q Country/Key Interest: Science, Technology, & Innovation – FY 2014…………………………………………………………………………………………………… 71Table 13r Country/Key Interest: Trafficking in Persons – FY 2014………………………………………………………………………………………………………………… 75Table 13s Country/Key Interest: Water – FY 2014………………………………………………………………..………………………………………………………………… 77Table 14 Transition Initiatives FY 2012 – 2014 Assistance Levels by Country …………………………………………………………………………………………………… 79Table 15a USAID Operating Expenses, FY 2012 – 2014…………………………………………………………………………………………...……………………………… 81Table 15b Overseas Operating Expenses – Africa, FY 2012– 2014……………………………………………………………………...………………………………………… 82Table 15c Overseas Operating Expenses – Asia, FY 2012– 2014…………………………………………………………………..……………………………………………… 83Table 15d Overseas Operating Expenses – Office of Afghanistan & Pakistan Affairs, FY 2012– 2014…………………………………………………………………………… 83Table 15e Overseas Operating Expenses – Europe & Eurasia, FY 2012– 2014……………………………………………………………...……………………………………… 84Table 15f Overseas Operating Expenses – Latin America and Caribbean, FY 2012– 2014………………………………………………………………………………………… 84Table 15g Overseas Operating Expenses – Middle East, FY 2012– 2014…………………………………………………………………………...……………………………… 85Table 15h Overseas Operating Expenses – Policy, Planning & Learning, FY 2012 – 2014………………………………………………………………………………………… 85Table 15i Overseas Operating Expenses – Democracy, Conflict, and Humanitarian Assistance, FY 2012 - 2014………………………………………………………………… 85Table 16a USAID Workforce – FY 2012- FY 2014……………………………………………………………………………….………………………………………………… 86Table 16b USAID Workforce – Africa: FY 2012 - FY 2014 ……………………………………………………………..………………………………………………………… 87Table 16c USAID Workforce – Asia: FY 2012 - FY 2014………………………………………………………………...………………………………………………………… 88Table 16d USAID Workforce – Office of Afghanistan and Pakistan Affairs (OAPA): FT 2012 - FY 2014……………………………………………….……………………… 89Table 16e USAID Workforce – Europe and Eurasia: FY 2012 - FY 2014 ……………………………………………………….………………………………………………… 89Table 16f USAID Workforce – Latin America and Caribbean: FY 2012 - FY 2014……………………………………………………...………………………………………… 90Table 16g USAID Workforce – Middle East: FY 2012 - FY 2014 ………………………………………………………………………..………………………………………… 91Table 16h USAID Workforce – Office of Policy, Planning & Learning: FY 2012 - 2014………………………………………….……………………………………………… 91Table 16i USAID Workforce – Democracy, Conflict, and Humanitarian Assistance: FY 2012 -2014……………………………………………………………………..……… 92Table 17 USAID Overseas Admininstrative Support Trust Fund Obligations………………………………………………………………………...…………………………… 93Table 18 USAID Operating Expenses by Object Class Code………………………………………………………………………………….…………………………………… 94Table 19 P.L. 480 Title II, FY 2012 - 2014………………………………………………….……………………………………………………………………………………… 98
Table of Contents

v
Table 1 State Operations and Foreign Assistance Request FY 2012 - FY 2014Table 1 shows the actual levels for FY 2012, the Continuing Resolution (CR) levels for FY 2013, and the request levels for FY 2014. The FY 2012 actual levels include statutory transfers and other transfers but do not include carryover or funds available under deobligation/reobligation authority.
Table 2 FY 2012 - FY 2013 - FY 2014 State Operations and Foreign Assitance Request - Overseas Contingency Operations TableTable 2 shows the actual levels for FY 2012, the Continuing Resolution levels for FY 2013, and the request levels for FY 2014 Overseas Contingency Operations (OCO) funding by account. The FY 2012 actual levels include statutory transfers and other transfers.
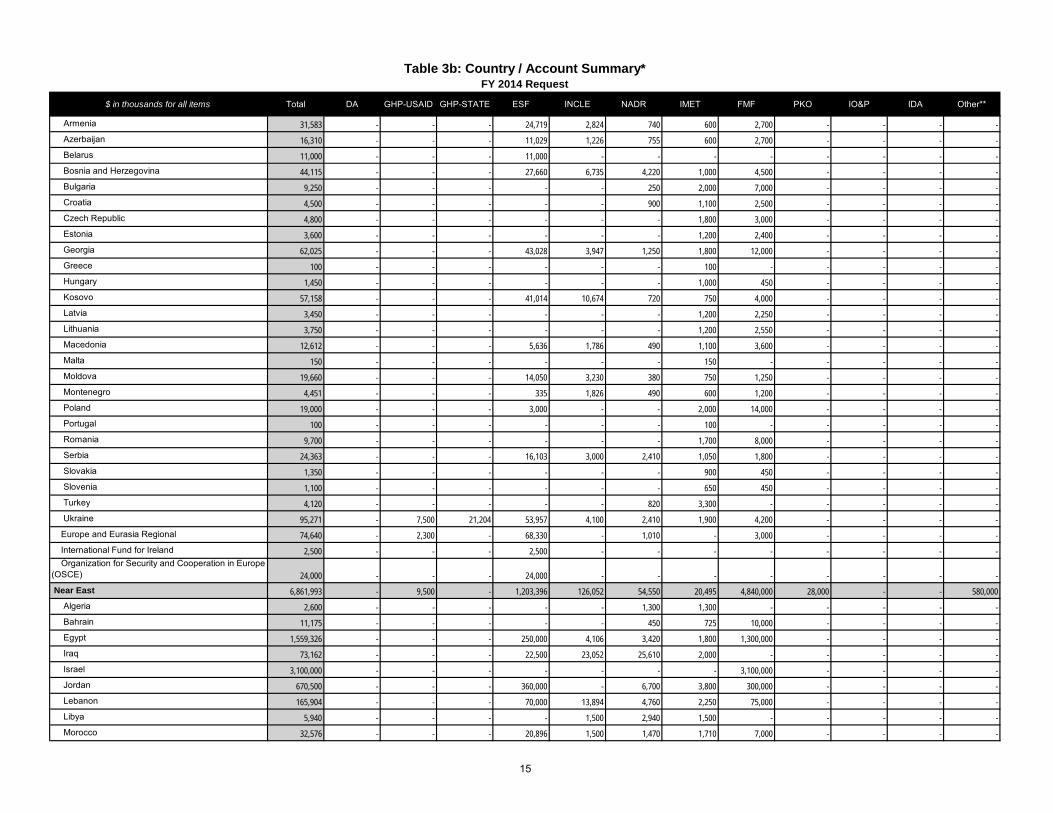
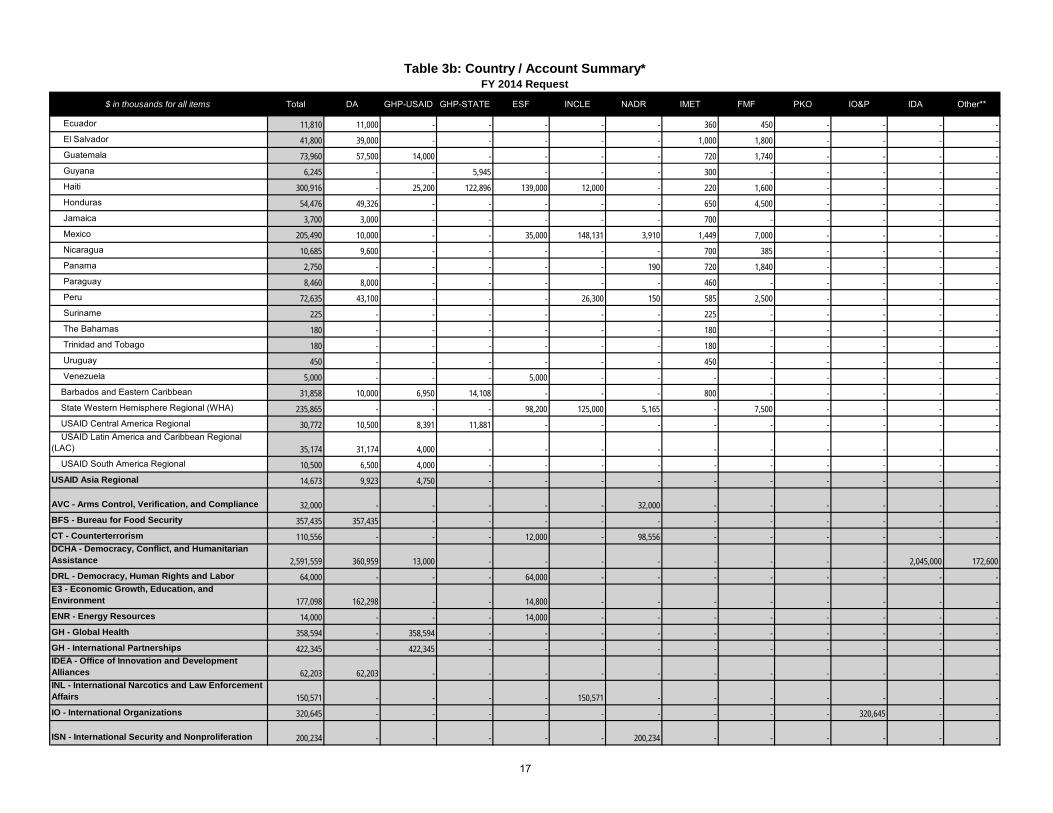
Table 3a - b Country/Account Summary [Spigots] FY 2012 Actual - FY 2014 RequestTable 3a reports the FY 2012 allocations of Foreign Operations and Food for P.L. 480 II by country and by account. Table 3b reports the country and account allocations for the FY 2014 Request.
Table 4 Country/Account Summary FY 2012 Actual - FY 2014 Request - Overseas Contingency Operations (OCO)Table 4 shows the allocations for Foreign Assistance programs by country and account for the FY 2012 Actual and FY 2014 Request for Overseas Contingency Operations (OCO) funding.
Table 5 Objectives, Program Areas: Summary – FY 2012 Actual – 2014 RequestTables 5 summarizes total resources by objectives and program areas for FY 2012 actual and FY 2014 Request. The table only includes State, USAID and P.L. 480 Title II resources.
Tables 6-7 Objectives, Program Areas by Account - FY 2012 Actual & FY 2014 RequestTables 6 and 7 detail each account by Objectives and Program Areas. The tables only includes State, USAID and P.L 480 Title II resources.
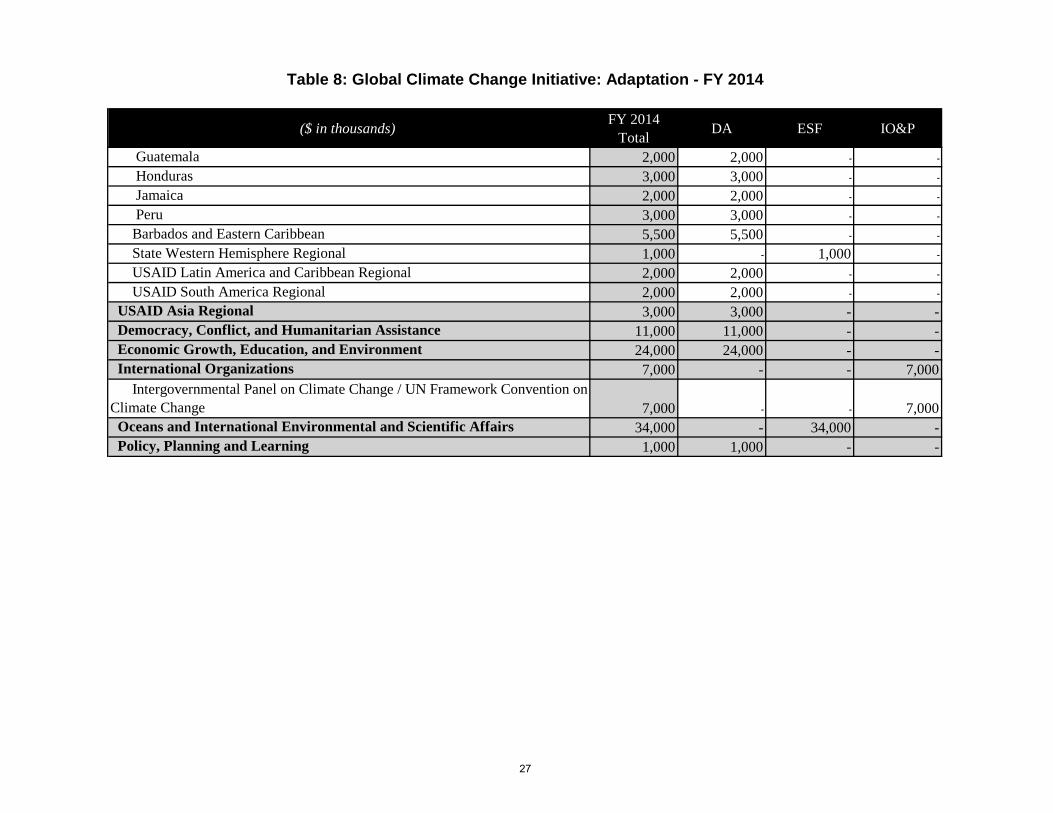
Tables 8-12 Global Initiatives - FY 2014Tables 8-11 provide information on resources budgeted for priority Global Initiatives.
Overview of Tables

vi
Tables 13a-13s Key Interest Areas by Country/Account, FY 2014Tables 12a-12t provide information on resources budgeted for Key Areas of special concern or interest, including (1) those which are represented below the Program Area level in the Strategic Framework, such as Basic Education and HIV/AIDS, and (2) those which are cross-cutting areas budgeted in multiple Program Elements, Areas, or Objectives, such as Biodiversity and Clean Energy.
Table 14 Transition Initiatives FY 2012 - FY 2014 Assistance Levels by CountryThis table breaks out actual or proposed Transition Initiative assistance funding levels by country.
Table 15a-15i USAID Operating Expenses - FYs 2012 – 2014The summary tables show USAID Operating Expenses by Washington offices, overseas operations, and centrally-funded costs. The individual regional bureau tables show overseas Operating Expenses by mission. Includes supplementals, carryover, transfers, and trust funds.
Tables 16a-16i USAID Workforce - FYs 2012 – 2014The summary table shows USAID workforce by location and funding source. The individual regional bureau tables show workforce by mission and funding source.
Tables 17 USAID Overseas Administrative Support Trust Fund Obligations - FYs 2012 – 2014This table shows administrative support Trust Fund obligations by bureau and mission.
Table 18 USAID Operating Expenses by Object Class Code - FYs 2012 – 2014This table shows the actual or proposed USAID Operating Expenses by Object Class code.
Table 19 P.L. 480 Title II, FY 2012 - 2014USAID is responsible for the administration and implementation of P.L. 480 Title II resources. Table 19 shows actual program levels for FY 2012, Continuing Resolution totals for FY 2013, and the FY 2014 budget request, including transport, voluntary agencies, the World Food Program, and the International Emergency Food Reserve.
Overview of Tables (con't.)

vii
AEECA Assistance to Europe, Eurasia and Central AsiaDA Development AssistanceESF Economic Support FundP.L. 480 P.L. 480 Title IIFMF Foreign Military FinancingGHP - State Global Health Programs - StateGHP - USAID Global Health Programs - USAIDIDA International Disaster AssistanceIMET International Military Education and TrainingINCLE International Narcotics Control and Law EnforcementIO&P International Organizations and ProgramsMCA Millennium Challenge AccountMENA-IF Middle East and North Africa Incentive FundNADR Nonproliferation, Anti-Terrorism, Demining and Related ProgramsOCO Overseas Contingency OperationsPKO Peacekeeping OperationsTI Transition InitiativesOther
ACRONYMS
Other Accounts include Transition Initiatives, Democracy Fund, Migration and Refugee Assistance, U.S. Emergency Refugee and Migration Assistance Fund, Complex Crises Fund, Global Security Contingency Fund, the Pakistan Counterinsurgency Capability Fund, the Emergency Food Assistance contingency Fund, Independent Agencies and International Financial Institutions (IFIs).
viii
This page intentionally left blank.

FY 2012 Enduring Actual
FY 2012 OCO Actual
FY 2012 Actual Total
FY 2013 CR Enduring1
FY 2013 CR OCO1
FY 2013 CR Total1
FY 2014 Request Enduring
FY 2014 Request OCO
FY 2014 Request Total
Change from FY 2012 Actual to FY
2014 Request
INTERNATIONAL AFFAIRS (Function 150) and International Commissions (Function 300) 43,289,158 11,202,787 54,491,945 43,640,900 11,202,787 54,843,687 48,272,587 3,807,341 52,079,928 (2,412,017)
INTERNATIONAL AFFAIRS (Function 150 Account) Only 43,164,996 11,202,787 54,367,783 43,515,978 11,202,787 54,718,765 48,151,625 3,807,341 51,958,966 (2,408,817)
Total - State Department and USAID (including 300) 39,675,337 11,188,424 50,863,761 39,887,058 11,188,424 51,075,482 43,982,133 3,807,341 47,789,474 (3,074,287)
STATE OPERATIONS & RELATED ACCOUNTS 13,222,948 4,627,457 17,850,405 13,258,997 4,627,457 17,886,454 15,212,905 1,499,141 16,712,046 (1,138,359)
STATE OPERATIONS 12,445,229 4,614,646 17,059,875 12,476,519 4,614,646 17,091,165 14,446,138 1,499,141 15,945,279 (1,114,596)
Administration of Foreign Affairs 8,890,006 4,513,346 13,403,352 8,899,539 4,513,346 13,412,885 10,525,308 1,499,141 12,024,449 (1,378,903)
State Programs 6,617,261 4,306,364 10,923,625 6,636,998 4,389,064 11,026,062 7,359,263 1,199,491 8,558,754 (2,364,871)
Diplomatic and Consular Programs2 6,557,881 4,306,364 10,864,245 6,577,255 4,389,064 10,966,319 7,282,363 1,199,491 8,481,854 (2,382,391) Ongoing Operations 5,202,881 4,070,163 9,273,044 5,222,011 4,152,863 9,374,874 5,491,189 808,530 6,299,719 (2,973,325) Worldwide Security Protection 1,355,000 236,201 1,591,201 1,355,244 236,201 1,591,445 1,791,174 390,961 2,182,135 590,934
Capital Investment Fund 59,380 - 59,380 59,743 - 59,743 76,900 - 76,900 17,520
Embassy Security, Construction, and Maintenance2 1,537,000 115,700 1,652,700 1,546,406 33,000 1,579,406 2,399,351 250,000 2,649,351 996,651 Ongoing Operations 762,000 115,700 877,700 766,663 33,000 799,663 785,351 250,000 1,035,351 157,651 Worldwide Security Upgrades 775,000 - 775,000 779,743 - 779,743 1,614,000 - 1,614,000 839,000
Other Administration of Foreign Affairs 735,745 91,282 827,027 716,135 91,282 807,417 766,694 49,650 816,344 (10,683) Conflict Stabilization Operations (CSO) 21,816 8,500 30,316 - 8,500 8,500 45,207 - 45,207 14,891 Office of the Inspector General 61,904 67,182 129,086 62,283 67,182 129,465 69,406 49,650 119,056 (10,030) Educational and Cultural Exchange Programs 583,200 15,600 598,800 586,769 15,600 602,369 562,659 - 562,659 (36,141) Representation Allowances 8,030 - 8,030 7,345 - 7,345 7,679 - 7,679 (351) Protection of Foreign Missions and Officials 27,750 - 27,750 27,165 - 27,165 28,200 - 28,200 450 Emergencies in the Diplomatic and Consular Services 9,073 - 9,073 9,357 - 9,357 9,652 - 9,652 579 Buying Power Maintenance Account - - - - - - - - - Repatriation Loans Program Account 1,674 - 1,674 1,456 - 1,456 1,700 - 1,700 26 Payment to the American Institute in Taiwan 21,778 - 21,778 21,237 - 21,237 36,221 - 36,221 14,443
International Chancery Center3 520 - 520 523 - 523 5,970 - 5,970 5,450 Foreign Service Retirement and Disability Fund [158,900] - [158,900] [158,900] - [158,900] [158,900] - [158,900] -
International Organizations 3,277,882 101,300 3,379,182 3,297,942 101,300 3,399,242 3,668,115 - 3,668,115 288,933 Contributions to International Organizations (CIO) 1,449,700 101,300 1,551,000 1,458,572 101,300 1,559,872 1,573,454 - 1,573,454 22,454 Contributions for International Peacekeeping Activities (CIPA) 1,828,182 - 1,828,182 1,839,370 - 1,839,370 2,094,661 - 2,094,661 266,479
Related Programs 153,179 - 153,179 154,116 - 154,116 131,753 - 131,753 (21,426) The Asia Foundation 17,000 - 17,000 17,104 - 17,104 17,000 - 17,000 -
Table 1: STATE OPERATIONS and FOREIGN ASSISTANCE REQUEST FY 2012 - FY 2014($000)
1

FY 2012 Enduring Actual
FY 2012 OCO Actual
FY 2012 Actual Total
FY 2013 CR Enduring1
FY 2013 CR OCO1
FY 2013 CR Total1
FY 2014 Request Enduring
FY 2014 Request OCO
FY 2014 Request Total
Change from FY 2012 Actual to FY
2014 Request
Table 1: STATE OPERATIONS and FOREIGN ASSISTANCE REQUEST FY 2012 - FY 2014($000)
Center for Middle Easter-Western Dialogue 840 - 840 845 - 845 90 - 90 (750) Eisenhower Exchange Fellowship Program 500 - 500 503 - 503 400 - 400 (100) Israeli Arab Scholarship Program 375 - 375 377 - 377 13 - 13 (362) East-West Center 16,700 - 16,700 16,802 - 16,802 10,800 - 10,800 (5,900) National Endowment for Democracy 117,764 - 117,764 118,485 - 118,485 103,450 - 103,450 (14,314)
International Commissions (Function 300) 124,162 - 124,162 124,922 - 124,922 120,962 - 120,962 (3,200) International Boundary and Water Commission - Salaries and Expenses 44,722 - 44,722 44,996 - 44,996 45,618 - 45,618 896 International Boundary and Water Commission - Construction 31,453 - 31,453 31,645 - 31,645 31,400 - 31,400 (53)
American Sections 11,687 - 11,687 11,759 - 11,759 12,499 - 12,499 812 International Joint Commission 7,012 - 7,012 7,055 - 7,055 7,664 - 7,664 652 International Boundary Commission 2,279 - 2,279 2,293 - 2,293 2,449 - 2,449 170 Border Environment Cooperation Commission 2,396 - 2,396 2,411 - 2,411 2,386 - 2,386 (10)
International Fisheries Commissions 36,300 - 36,300 36,522 - 36,522 31,445 - 31,445 (4,855)
Broadcasting Board of Governors 747,130 4,400 751,530 751,702 4,400 756,102 731,080 - 731,080 (20,450)
International Broadcasting Operations 740,100 4,400 744,500 744,629 4,400 749,029 722,580 722,580 (21,920)
Broadcasting Capital Improvements 7,030 - 7,030 7,073 - 7,073 8,500 - 8,500 1,470
Other Programs 30,589 8,411 39,000 30,776 8,411 39,187 35,687 - 35,687 (3,313)
United States Institute of Peace 30,589 8,411 39,000 30,776 8,411 39,187 35,687 - 35,687 (3,313)
FOREIGN OPERATIONS 28,929,910 6,575,330 35,505,240 29,121,805 6,575,330 35,697,135 32,874,556 2,308,200 35,182,756 (322,484)
U.S Agency for International Development 1,268,500 259,500 1,528,000 1,276,264 259,500 1,535,764 1,500,340 71,000 1,571,340 43,340 USAID Operating Expenses (OE) 1,092,300 255,000 1,347,300 1,098,985 255,000 1,353,985 1,328,200 71,000 1,399,200 51,900
Conflict Stabilization Operations (CSO) - - - - - - - - - -
USAID Capital Investment Fund (CIF) 129,700 - 129,700 130,494 - 130,494 117,940 - 117,940 (11,760)
USAID Inspector General Operating Expenses 46,500 4,500 51,000 46,785 4,500 51,285 54,200 - 54,200 3,200
Bilateral Economic Assistance 16,995,584 3,834,516 20,830,100 16,994,155 3,177,016 20,171,171 20,045,626 1,382,200 21,427,826 597,726 Global Health Programs (USAID and State)4 8,172,660 - 8,172,660 8,217,847 - 8,217,847 8,315,000 - 8,315,000 142,340
Global Health Programs - USAID [2,629,800] - [2,629,800] [2,641,065] - [2,641,065] [2,645,000] - [2,645,000] [15,200]
Global Health Programs - State [5,542,860] - [5,542,860] [5,576,782] - [5,576,782] [5,670,000] - [5,670,000] [127,140]
Development Assistance (DA) 2,519,950 - 2,519,950 2,535,372 2,535,372 2,837,812 - 2,837,812 317,862
International Disaster Assistance (IDA)5 825,000 270,000 1,095,000 830,049 150,000 980,049 2,045,000 - 2,045,000 950,000
Emergency Food Assistance Contingency Fund - - - - - - 75,000 - 75,000 75,000
Transition Initiatives (TI)6 50,141 43,554 93,695 50,448 6,554 57,002 57,600 - 57,600 (36,095)
Complex Crises Fund (CCF)5 10,000 40,000 50,000 10,061 30,000 40,061 40,000 - 40,000 (10,000)
Development Credit Authority - Subsidy (DCA) [40,000] - [40,000] [40,000] [40,000] [40,000] - [40,000] -
Development Credit Authority - Administrative Expenses 8,300 - 8,300 8,351 - 8,351 8,200 - 8,200 (100)
Economic Support Fund (ESF)5, 6, 7 2,994,745 3,151,962 6,146,707 2,912,461 2,761,462 5,673,923 4,076,054 1,382,200 5,458,254 (688,453)
Middle East and North Africa Incentive Fund - - - - - - 580,000 - 580,000 580,000
2

FY 2012 Enduring Actual
FY 2012 OCO Actual
FY 2012 Actual Total
FY 2013 CR Enduring1
FY 2013 CR OCO1
FY 2013 CR Total1
FY 2014 Request Enduring
FY 2014 Request OCO
FY 2014 Request Total
Change from FY 2012 Actual to FY
2014 Request
Table 1: STATE OPERATIONS and FOREIGN ASSISTANCE REQUEST FY 2012 - FY 2014($000)
Democracy Fund 114,770 - 114,770 115,472 - 115,472 - - - (114,770)
Assistance for Europe, Eurasia and Central Asia (AEECA) 626,718 - 626,718 630,554 - 630,554 - - - (626,718)
Migration and Refugee Assistance (MRA)5 1,646,100 329,000 1,975,100 1,656,174 229,000 1,885,174 1,760,960 - 1,760,960 (214,140)
U.S. Emergency Refugee and Migration Assistance (ERMA) 27,200 - 27,200 27,366 - 27,366 250,000 - 250,000 222,800
Independent Agencies 1,325,700 - 1,325,700 1,333,813 - 1,333,813 1,319,100 - 1,319,100 (6,600)
Peace Corps 375,000 - 375,000 377,295 - 377,295 378,800 - 378,800 3,800
Millennium Challenge Corporation 898,200 - 898,200 903,697 - 903,697 898,200 - 898,200 -
Inter-American Foundation 22,500 - 22,500 22,638 - 22,638 18,100 - 18,100 (4,400)
African Development Foundation 30,000 - 30,000 30,184 - 30,184 24,000 - 24,000 (6,000)
Department of Treasury 37,448 1,552 39,000 37,677 1,552 39,229 23,500 - 23,500 (15,500) Treasury Technical Assistance 25,448 1,552 27,000 25,604 1,552 27,156 23,500 - 23,500 (3,500)
Debt Restructuring 12,000 - 12,000 12,073 - 12,073 - - - (12,000)
International Security Assistance 7,269,819 2,479,762 9,749,581 7,314,309 3,137,262 10,451,571 7,669,384 855,000 8,524,384 (1,225,197) International Narcotics Control and Law Enforcement (INCLE)6, 7 1,061,100 574,605 1,635,705 1,067,594 983,605 2,051,199 1,129,727 344,000 1,473,727 (161,978)
Nonproliferation, Antiterrorism, Demining and Related Programs (NADR)6 590,113 121,157 711,270 593,724 120,657 714,381 616,125 - 616,125 (95,145)
Peacekeeping Operations (PKO)5, 6 302,818 207,000 509,818 304,671 81,000 385,671 347,000 - 347,000 (162,818)
International Military Education and Training (IMET) 105,788 - 105,788 106,435 - 106,435 105,573 - 105,573 (215)
Foreign Military Financing (FMF) 5,210,000 1,102,000 6,312,000 5,241,885 1,102,000 6,343,885 5,445,959 511,000 5,956,959 (355,041)
Pakistan Counterinsurgency Capability Fund (PCCF)5 - 452,000 452,000 - 850,000 850,000 - - - (452,000)
Global Security Contingency Fund5 - 23,000 23,000 - - - 25,000 - 25,000 2,000
Special Defense Acquisition Fund - - - - - - - - - -
Multilateral Economic Assistance 2,966,293 - 2,966,293 2,989,277 - 2,989,277 3,196,424 - 3,196,424 230,131
International Organizations and Programs4 343,905 - 343,905 350,839 - 350,839 320,645 - 320,645 (23,260)
International Financial Institutions (IFIs) 2,622,388 - 2,622,388 2,638,438 - 2,638,438 2,875,779 - 2,875,779 253,391 International Bank for Reconstruction and Development 117,364 - 117,364 118,083 - 118,083 186,957 - 186,957 69,593
International Development Association (IDA) 1,325,000 - 1,325,000 1,333,109 - 1,333,109 1,358,500 - 1,358,500 33,500
African Development Bank 32,418 - 32,418 32,616 - 32,616 32,418 - 32,418 -
African Development Fund (AfDF) 172,500 - 172,500 173,556 - 173,556 195,000 - 195,000 22,500
Asian Development Bank 106,586 - 106,586 107,238 - 107,238 106,586 - 106,586 -
Asian Development Fund 100,000 - 100,000 100,612 - 100,612 115,250 - 115,250 15,250
Inter-American Development Bank 75,000 - 75,000 75,459 - 75,459 102,020 - 102,020 27,020
Inter-American Investment Corporation 4,670 - 4,670 4,699 - 4,699 - - - (4,670)
Enterprise for the Americas Multilateral Investment Fund 25,000 - 25,000 25,153 - 25,153 6,298 - 6,298 (18,702)
IDA Multilateral Debt Relief Initiative 167,000 - 167,000 168,022 - 168,022 145,300 - 145,300 (21,700)
AfDF Multilateral Debt Relief Initiative 7,500 - 7,500 7,546 - 7,546 30,000 - 30,000 22,500
Global Environment Facility (GEF) 89,820 - 89,820 90,370 - 90,370 143,750 - 143,750 53,930 Clean Technology Fund 184,630 - 184,630 185,760 - 185,760 215,700 - 215,700 31,070
Strategic Climate Fund 49,900 - 49,900 50,205 - 50,205 68,000 - 68,000 18,100
International Fund for Agricultural Development 30,000 - 30,000 30,184 - 30,184 30,000 - 30,000 -
3

FY 2012 Enduring Actual
FY 2012 OCO Actual
FY 2012 Actual Total
FY 2013 CR Enduring1
FY 2013 CR OCO1
FY 2013 CR Total1
FY 2014 Request Enduring
FY 2014 Request OCO
FY 2014 Request Total
Change from FY 2012 Actual to FY
2014 Request
Table 1: STATE OPERATIONS and FOREIGN ASSISTANCE REQUEST FY 2012 - FY 2014($000)
Global Agriculture and Food Security Program 135,000 - 135,000 135,826 - 135,826 135,000 - 135,000 -
Middle East and North Africa Transition Fund - - - - - - 5,000 - 5,000 5,000
Export & Investment Assistance (1,015,434) - (1,015,434) (906,192) - (906,192) (967,138) - (967,138) 48,296 Export-Import Bank (799,700) - (799,700) (752,925) - (752,925) (831,600) - (831,600) (31,900)
Overseas Private Investment Corporation (OPIC) (265,734) - (265,734) (203,573) - (203,573) (198,200) - (198,200) 67,534
Trade and Development Agency 50,000 - 50,000 50,306 - 50,306 62,662 - 62,662 12,662
Related International Affairs Accounts 82,000 - 82,000 82,502 - 82,502 87,320 - 87,320 5,320 International Trade Commission 80,000 - 80,000 80,490 - 80,490 85,102 - 85,102 5,102
Foreign Claims Settlement Commission 2,000 - 2,000 2,012 - 2,012 2,218 - 2,218 218
Department of Agriculture 1,650,000 - 1,650,000 1,660,098 - 1,660,098 185,126 - 185,126 (1,464,874) P.L. 480 Title II 1,466,000 - 1,466,000 1,474,972 - 1,474,972 - - - (1,466,000)
McGovern-Dole International Food for Education and Child Nutrition Programs 184,000 - 184,000 185,126 - 185,126 185,126 - 185,126 1,126
Rescissions
Total Rescissions State Operations (13,700) - (13,700) - - - - - - 13,700
Diplomatic & Consular Programs (D&CP) (13,700) - (13,700) - - - - - - 13,700 Ongoing Operations Worldwide (5,700) - (5,700) - - - - - - 5,700
Worldwide Security Protection (8,000) - (8,000) - - - - - - 8,000
Buying Power Maintenance Account - - - - - -
Total Rescissions Foreign Operations (500,000) - (500,000) (400,000) - (400,000) - - - 500,000
Bilateral Economic Assistance (100,000) - (100,000) - - - - - - 100,000 Economic Support Fund (ESF) (100,000) - (100,000) - - - - - - 100,000
Export & Investment Assistance (400,000) - (400,000) (400,000) - (400,000) - - - 400,000 Export-Import Bank (400,000) - (400,000) (400,000) - (400,000) - - - 400,000
Footnotes
7/ The FY 2012 OCO Actual level reflects the transfer of $10 million from the Economic Support Fund to the International Narcotics Control and Law Enforcement account.
5/ The FY 2012 OCO Actual level reflects the transfer of $398 million from the Pakistan Counterinsurgency Capability Fund to the Economic Support Fund ($105 million), Global Security Contingency Fund ($23 million), Complex Crises Fund ($10 million), Peacekeeping Operations ($40 million), International Disaster Assistance ($120 million) and Migration and Refugee Assistance ($100 million) accounts.
6/ The FY 2012 OCO Actual level reflects the transfer of $409 million from the International Narcotics Control and Law Enforcement account to the Economic Support Fund ($285.5 million), Transition Initiatives ($37 million), Nonproliferation, Antiterrorism, Demining and Related Programs ($0.5 million), Peacekeeping Operations ($86 million) accounts.
1/ The FY 2013 CR is based on the annualized continuing resolution calculation for FY 2013 (P.L. 112-175).2/ FY 2012 Actual includes the transfer of $82.7 million from Diplomatic and Consular Programs OCO funds for the Embassy Compound in Baghdad.
3/ Reflects scoring of obligations from the International Chancery Center Trust Fund, as included in the FY 2014 President’s Budget Appendix. Proposed appropriations language for this project is based on the Diplomatic and Consular Programs fees and payments provisions of Division I, Title I of Public Law 112-74.
4/ The FY 2012 Enduring Actual level reflects the transfer of $4.8 million from the International Organizations and Programs account to the Global Health Programs-USAID account.
4

FY 2012 Actual OCO
FY 2013 CR OCO1
FY 2014 Request OCO
Change from FY 2012 CR to FY 2014 Request
OVERSEAS CONTINGENCY OPERATIONS (OCO) TOTAL - STATE OPERATIONS and FOREIGN ASSISTANCE 11,202,787 11,202,787 3,807,341 (7,428,446)
STATE OPERATIONS - OCO 4,627,457 4,627,457 1,499,141 (3,161,316)
Administration of Foreign Affairs 4,614,646 4,614,646 1,499,141 (3,148,505)
State Programs 4,306,364 4,389,064 1,199,491 (3,106,873)
Diplomatic and Consular Programs2 4,306,364 4,389,064 1,199,491 (3,106,873) Ongoing Operations 4,070,163 4,152,863 808,530 (3,261,633) Worldwide Security Protection 236,201 236,201 390,961 154,760
Embassy Security, Construction, and Maintenance2 115,700 33,000 250,000 - Ongoing Operations 115,700 33,000 250,000 134,300 Worldwide Security Upgrades - - - -
Other Administration of Foreign Affairs 91,282 91,282 49,650 (41,632) Conflict Stabilization Operations (CSO) 8,500 8,500 - (8,500) Office of the Inspector General 67,182 67,182 49,650 (17,532) Educational and Cultural Exchange Programs 15,600 15,600 - (15,600)
International Organizations 101,300 101,300 - (101,300) Contributions to International Organizations (CIO) 101,300 101,300 - (101,300)
Broadcasting Board of Governors 4,400 4,400 - (4,400) International Broadcasting Operations 4,400 4,400 - (4,400)
Other Programs 8,411 8,411 - (8,411) United States Institute of Peace 8,411 8,411 - (8,411)
FOREIGN OPERATIONS - OCO 6,575,330 6,575,330 2,308,200 (4,267,130)
U.S Agency for International Development - OCO 259,500 259,500 71,000 (188,500) USAID Operating Expenses (OE) 255,000 255,000 71,000 (184,000) USAID Inspector General Operating Expenses 4,500 4,500 - (4,500)
Table 2: STATE OPERATIONS and FOREIGN ASSISTANCE REQUESTOVERSEAS CONTINGENCY OPERATIONS (OCO) FY 2012 - FY 2013 - FY 2014
($000)
5

FY 2012 Actual OCO
FY 2013 CR OCO1
FY 2014 Request OCO
Change from FY 2012 CR to FY 2014 Request
Table 2: STATE OPERATIONS and FOREIGN ASSISTANCE REQUESTOVERSEAS CONTINGENCY OPERATIONS (OCO) FY 2012 - FY 2013 - FY 2014
($000)
Bilateral Economic Assistance - OCO 3,834,516 3,177,016 1,382,200 (2,452,316) International Disaster Assistance (IDA)3 270,000 150,000 - (270,000) Transition Initiatives (TI)4 43,554 6,554 - (43,554) Complex Crises Fund (CCF)3 40,000 30,000 - (40,000) Economic Support Fund (ESF)3, 4, 5 3,151,962 2,761,462 1,382,200 (1,769,762) Migration and Refugee Assistance (MRA)3 329,000 229,000 - (329,000)
Department of Treasury 1,552 1,552 - (1,552) Treasury Technical Assistance 1,552 1,552 - (1,552)
International Security Assistance - OCO 2,479,762 3,137,262 855,000 (1,624,762) International Narcotics Control and Law Enforcement (INCLE)4, 5 574,605 983,605 344,000 (230,605)
Nonproliferation, Antiterrorism, Demining and Related Programs (NADR)4 121,157 120,657 - (121,157) Peacekeeping Operations (PKO)3, 4 207,000 81,000 - (207,000) Foreign Military Financing (FMF) 1,102,000 1,102,000 511,000 (591,000) Pakistan Counterinsurgency Capability Fund (PCCF)3 452,000 800,000 - (452,000) Global Security Contingency Fund3 23,000 50,000 - (23,000)
Footnotes
4/ The FY 2012 OCO Actual level reflects the transfer of $409 million from the International Narcotics Control and Law Enforcement account to the Economic Support Fund ($285.5 million), Transition Initiatives ($37 million), Nonproliferation, Antiterrorism, Demining and Related Programs ($0.5 million), Peacekeeping Operations ($86 million) accounts.5/ The FY 2012 OCO Actual level reflects the transfer of $10 million from the Economic Support Fund to the International Narcotics Control and Law Enforcement account.
1/ The FY 2013 CR is based on the annualized continuing resolution calculation for FY 2013 (P.L. 112-175).2/ The FY 2012 Actual includes the transfer of $82.7 million from Diplomatic and Consular Programs OCO funds for the Embassy Compound in Baghdad.
3/ The FY 2012 OCO Actual level reflects the transfer of $398 million from the Pakistan Counterinsurgency Capability Fund to the Economic Support Fund ($105 million), Global Security Contingency Fund ($23 million), Complex Crises Fund ($10 million), Peacekeeping Operations ($40 million), International Disaster Assistance ($120 million) and Migration and Refugee Assistance ($100 million) accounts.
6

$ in thousands for all items Total DA GHP-USAID GHP-STATE ESF AEECA INCLE NADR IMET FMF PKO IO&P P.L. 480 IDA Other**
TOTAL 34,665,580 2,519,950 2,629,800 5,542,860 2,994,745 626,718 1,061,100 590,113 105,788 5,210,000 302,818 343,905 1,466,000 825,000 10,446,783 Africa 7,620,384 1,002,140 1,375,577 2,993,255 607,731 - 85,900 35,500 15,207 16,818 182,968 - 1,305,288 - - Angola 59,735 1,000 40,500 10,300 - - - 7,500 435 - - - - - - Benin 28,630 - 28,400 - - - - - 230 - - - - - - Botswana 66,979 - - 66,000 - - - - 779 200 - - - - - Burkina Faso 35,117 - 9,000 - - - - - 308 - - - 25,809 - - Burundi 41,385 - 16,560 5,000 - - - - 420 - - - 19,405 - - Cameroon 13,972 - 1,500 11,250 - - - - 270 - - - 952 - - Cape Verde 108 - - - - - - - 108 - - - - - - Central African Republic 10,143 - - - - - - - 115 - - - 10,028 - - Chad 85,001 - - - - - - - 375 200 - - 84,426 - - Comoros 127 - - - - - - - 127 - - - - - - Cote d'Ivoire 150,688 - - 118,305 14,715 - - - 66 300 - - 17,302 - - Democratic Republic of the Congo 254,353 - 97,850 13,770 47,915 - 6,000 1,000 473 - 19,000 - 68,345 - - Djibouti 7,663 1,650 - 1,800 - - - - 363 1,500 - - 2,350 - - Ethiopia 706,716 92,898 120,500 181,241 - - - - 597 843 4,000 - 306,637 - - Gabon 212 - - - - - - - 212 - - - - - - Ghana 172,677 95,568 67,000 9,000 - - - - 759 350 - - - - - Guinea 23,657 5,700 17,500 - - - - - 57 400 - - - - - Kenya 499,425 92,000 78,150 241,512 4,750 - 2,000 1,150 910 1,500 - - 77,453 - - Lesotho 15,750 - 6,400 9,235 - - - - 115 - - - - - - Liberia 209,772 - 30,700 800 124,276 - 17,000 - 489 6,500 5,000 - 25,007 - - Madagascar 69,473 - 50,100 500 - - - - - - - - 18,873 - - Malawi 183,715 31,500 70,500 51,448 - - - - 294 - - - 29,973 - - Mali 154,629 67,143 59,650 1,500 - - - - 69 - - - 26,267 - - Mauritania 12,067 - - - - - - - 185 200 - - 11,682 - - Mauritius 115 - - - - - - - 115 - - - - - - Mozambique 347,346 37,165 65,200 224,239 - - 500 2,000 456 - - - 17,786 - - Namibia 90,945 - 2,000 88,809 - - - - 136 - - - - - - Niger 58,929 1,000 - - - - - - 47 400 - - 57,482 - - Nigeria 646,944 50,291 133,500 461,227 - - - - 926 1,000 - - - - - Republic of the Congo 66 - - - - - - - 66 - - - - - - Rwanda 197,092 53,500 42,100 99,072 - - - - 530 - - - 1,890 - - Sao Tome and Principe 118 - - - - - - - 118 - - - - - - Senegal 109,606 50,000 53,950 1,535 - - - - 939 325 - - 2,857 - - Seychelles 135 - - - - - - - 135 - - - - - - Sierra Leone 17,651 - - 500 4,500 - - - 447 - - - 12,204 - - Somalia 206,688 - 1,550 - 23,377 - 2,000 2,000 - - 97,818 - 79,943 - - South Africa 542,235 14,734 12,000 509,969 - - 3,000 1,050 782 700 - - - - - South Sudan 619,577 - 43,010 12,036 305,360 - 32,000 2,800 858 - 48,000 - 175,513 - - Sudan 196,024 - - - 30,000 - - 1,100 - - - - 164,924 - - Swaziland 31,425 - 6,900 24,425 - - - - 100 - - - - - - Tanzania 480,613 105,000 98,100 268,616 - - 450 - 461 200 - - 7,786 - - The Gambia 111 - - - - - - - 111 - - - - - -
Table 3a: Country / Account Summary*FY 2012 Actual
7

$ in thousands for all items Total DA GHP-USAID GHP-STATE ESF AEECA INCLE NADR IMET FMF PKO IO&P P.L. 480 IDA Other**
Table 3a: Country / Account Summary*FY 2012 Actual
Togo 248 - - - - - - - 248 - - - - - - Uganda 460,124 64,999 81,250 284,084 - - 600 - 613 200 - - 28,378 - - Zambia 312,825 28,726 57,075 226,661 - - - - 363 - - - - - - Zimbabwe 167,115 - 41,500 68,021 25,578 - - - - - - - 32,016 - - African Union 760 - - - 760 - - - - - - - - - - State Africa Regional (AF) 70,400 - - - 20,000 - 22,350 16,900 - 2,000 9,150 - - - - USAID Africa Regional (AFR) 68,252 50,566 17,686 - - - - - - - - - - - - USAID Central Africa Regional 22,588 22,588 - - - - - - - - - - - - - USAID East Africa Regional 62,746 45,500 9,946 800 6,500 - - - - - - - - - - USAID Southern Africa Regional 28,130 24,530 2,000 1,600 - - - - - - - - - - - USAID West Africa Regional 79,582 66,082 13,500 - - - - - - - - - - - - East Asia and Pacific 714,950 285,490 138,350 86,218 88,615 - 24,645 34,315 9,015 48,302 - - - - - Burma 46,600 - 3,000 8,500 35,100 - - - - - - - - - - Cambodia 76,098 28,350 32,500 3,000 7,000 - - 4,140 308 800 - - - - - China 14,300 - - 3,000 10,500 - 800 - - - - - - - - Indonesia 177,834 104,500 39,250 - - - 11,550 6,650 1,884 14,000 - - - - - Laos 7,626 1,350 - - - - 1,000 5,000 276 - - - - - - Malaysia 2,329 - - - - - - 1,500 829 - - - - - - Marshall Islands 536 492 - - - - - - 44 - - - - - - Micronesia 492 492 - - - - - - - - - - - - - Mongolia 7,125 3,000 - - - - - 250 875 3,000 - - - - - Papua New Guinea 5,000 - 2,500 2,500 - - - - - - - - - - - Philippines 155,784 81,055 33,800 - - - 2,450 9,525 1,954 27,000 - - - - - Samoa 115 - - - - - - - 115 - - - - - - Singapore 250 - - - - - - 250 - - - - - - - Taiwan 250 - - - - - - 250 - - - - - - - Thailand 12,246 5,051 1,000 500 - - 1,740 1,450 1,318 1,187 - - - - - Timor-Leste 14,460 9,500 3,000 - 1,000 - 660 - 300 - - - - - - Vietnam 107,654 18,000 - 66,978 15,000 - 550 4,200 611 2,315 - - - - - State East Asia and Pacific Regional 20,511 - - - 13,015 - 5,895 1,100 501 - - - - - - USAID Regional Development Mission-Asia (RDM/A) 65,740 33,700 23,300 1,740 7,000 - - - - - - - - - - Europe and Eurasia 709,274 - 15,150 10,503 8,500 513,907 - 24,210 29,994 107,010 - - - - - Albania 22,717 - - - - 16,000 - 2,650 1,067 3,000 - - - - - Armenia 44,225 - - - - 40,000 - 850 675 2,700 - - - - - Azerbaijan 20,865 - - - - 16,600 - 865 700 2,700 - - - - - Belarus 11,072 - - - - 11,072 - - - - - - - - - Bosnia and Herzegovina 49,749 - - - - 39,000 - 5,250 999 4,500 - - - - - Bulgaria 10,393 - - - - - - - 1,746 8,647 - - - - - Croatia 4,696 - - - - - - 1,250 946 2,500 - - - - - Cyprus 3,500 - - - 3,500 - - - - - - - - - - Czech Republic 6,892 - - - - - - - 1,892 5,000 - - - - - Estonia 3,612 - - - - - - - 1,212 2,400 - - - - - Georgia 85,486 - - 450 - 66,732 - 2,025 1,879 14,400 - - - - -
8

$ in thousands for all items Total DA GHP-USAID GHP-STATE ESF AEECA INCLE NADR IMET FMF PKO IO&P P.L. 480 IDA Other**
Table 3a: Country / Account Summary*FY 2012 Actual
Greece 102 - - - - - - - 102 - - - - - - Hungary 1,847 - - - - - - - 947 900 - - - - - Kosovo 66,718 - - - - 61,998 - 910 810 3,000 - - - - - Latvia 3,377 - - - - - - - 1,129 2,248 - - - - - Lithuania 3,675 - - - - - - - 1,125 2,550 - - - - - Macedonia 19,457 - - - - 14,273 - 520 1,064 3,600 - - - - - Malta 150 - - - - - - - 150 - - - - - - Moldova 23,510 - - - - 21,000 - 400 860 1,250 - - - - - Montenegro 6,414 - - - - 3,140 - 1,500 574 1,200 - - - - - Poland 29,265 - - - - 3,000 - - 2,100 24,165 - - - - - Portugal 25 - - - - - - - 25 - - - - - - Romania 13,754 - - - - - - - 1,754 12,000 - - - - - Serbia 38,837 - - - - 33,500 - 2,650 887 1,800 - - - - - Slovakia 2,003 - - - - - - - 1,003 1,000 - - - - - Slovenia 1,119 - - - - - - - 669 450 - - - - - Turkey 4,939 - - - - - - 1,100 3,839 - - - - - - Ukraine 103,593 - 4,400 8,753 - 79,100 - 2,500 1,840 7,000 - - - - - Eurasia Regional 86,315 - 10,750 1,300 1,250 71,565 - 1,450 - - - - - - - Europe Regional 10,967 - - - 1,250 9,427 - 290 - - - - - - - International Fund for Ireland 2,500 - - - 2,500 - - - - - - - - - - Organization for Security and Cooperation in Europe (OSCE) 27,500 - - - - 27,500 - - - - - - - - - Near East 6,570,786 19,039 7,989 - 1,410,930 - 135,395 59,895 17,998 4,813,500 28,000 - 78,040 - - Algeria 10,874 - - - - - - 900 1,294 - - - 8,680 - - Bahrain 11,054 - - - - - - 500 554 10,000 - - - - - Egypt 1,556,489 - - - 250,000 - 1,000 4,100 1,389 1,300,000 - - - - - Iraq 99,842 - - - 70,900 - - 26,945 1,997 - - - - - - Israel 3,075,000 - - - - - - - - 3,075,000 - - - - - Jordan 675,900 - - - 360,000 - 500 11,750 3,650 300,000 - - - - - Lebanon 191,147 - - - 84,725 - 24,000 5,050 2,372 75,000 - - - - - Libya 2,396 - - - - - - 2,100 296 - - - - - - Morocco 33,737 19,039 - - - - 1,500 3,300 1,898 8,000 - - - - - Oman 11,138 - - - - - - 1,500 1,638 8,000 - - - - - Saudi Arabia 9 - - - - - - - 9 - - - - - - Tunisia 24,837 - - - 5,000 - - 500 1,837 17,500 - - - - - West Bank and Gaza 510,256 - - - 395,699 - 100,000 - - - - - 14,557 - - Yemen 119,107 - 7,989 - 26,606 - 7,395 1,250 1,064 20,000 - - 54,803 - - Egypt Debt Relief 100,000 - - - 100,000 - - - - - - - - - - Middle East Multilaterals (MEM) 1,500 - - - 1,500 - - - - - - - - - - Middle East Partnership Initiative (MEPI) 70,000 - - - 70,000 - - - - - - - - - - Middle East Regional Cooperation (MERC) 5,000 - - - 5,000 - - - - - - - - - - Multinational Force and Observers (MFO) 28,000 - - - - - - - - - 28,000 - - - - Near East Regional Democracy 35,000 - - - 35,000 - - - - - - - - - - Trans-Sahara Counter-Terrorism Partnership (TSCTP) 4,500 - - - 1,500 - 1,000 2,000 - - - - - - -
9

$ in thousands for all items Total DA GHP-USAID GHP-STATE ESF AEECA INCLE NADR IMET FMF PKO IO&P P.L. 480 IDA Other**
Table 3a: Country / Account Summary*FY 2012 Actual
USAID Middle East Regional (OMEP) 5,000 - - - 5,000 - - - - - - - - - - South and Central Asia 915,697 127,874 197,550 10,602 110,503 112,811 12,814 62,930 13,178 90,685 - - 176,750 - - Afghanistan 123,126 - - - 21,000 - - 41,750 1,176 - - - 59,200 - - Bangladesh 204,381 81,686 71,600 - - - 1,394 3,666 994 2,200 - - 42,841 - - India 108,162 18,500 76,000 7,000 - - - 5,200 1,462 - - - - - - Kazakhstan 19,285 - 900 - - 14,100 - 1,700 785 1,800 - - - - - Kyrgyz Republic 47,399 - 3,200 - - 40,800 - 1,250 649 1,500 - - - - - Maldives 2,593 2,000 - - - - - - 193 400 - - - - - Nepal 95,404 16,188 38,500 - 26,979 - 3,700 1,014 1,142 1,240 - - 6,641 - - Pakistan 210,791 - - - 57,500 - - 800 4,868 79,555 - - 68,068 - - Sri Lanka 13,360 8,000 - - - - 720 3,450 690 500 - - - - - Tajikistan 45,089 - 3,350 - - 38,751 - 1,650 538 800 - - - - - Turkmenistan 9,199 - - - - 8,000 - 850 349 - - - - - - Uzbekistan 14,162 - 3,000 - - 7,540 - 600 332 2,690 - - - - - Central Asia Regional 8,222 - 1,000 3,602 - 3,620 - - - - - - - - -
State South and Central Asia Regional (SCA) 13,024 - - - 5,024 - 7,000 1,000 - - - - - - - USAID South Asia Regional 1,500 1,500 - - - - - - - - - - - - - Western Hemisphere 1,823,526 333,785 104,509 182,236 465,541 - 593,270 20,530 14,597 70,885 - - 38,173 - - Argentina 1,038 - - - - - - 300 738 - - - - - - Belize 687 - - - - - - 300 187 200 - - - - - Bolivia 28,827 7,000 14,100 - - - 7,500 - 227 - - - - - - Brazil 18,038 12,800 - 1,300 - - 3,000 300 638 - - - - - - Chile 1,155 - - - - - - 300 855 - - - - - - Colombia 384,288 - - - 172,000 - 160,600 4,750 1,656 40,000 - - 5,282 - - Costa Rica 1,112 - - - - - - - 297 815 - - - - - Cuba 20,000 - - - 20,000 - - - - - - - - - - Dominican Republic 23,129 12,300 6,768 3,232 - - - - 829 - - - - - - Ecuador 22,869 16,420 - - - - 4,500 200 281 450 - - 1,018 - - El Salvador 29,183 23,904 - - 2,000 - - 1,000 1,029 1,250 - - - - - Guatemala 84,475 46,325 17,600 - - - 5,000 - 840 500 - - 14,210 - - Guyana 10,864 - - 10,525 - - - - 339 - - - - - - Haiti 351,828 - 25,000 141,240 148,281 - 19,420 - 224 - - - 17,663 - - Honduras 57,040 46,266 8,000 1,000 - - - - 774 1,000 - - - - - Jamaica 6,700 6,000 - - - - - - 700 - - - - - - Mexico 329,680 33,350 1,000 - 33,260 - 248,500 5,380 1,190 7,000 - - - - - Nicaragua 12,301 9,400 2,900 - - - - - 1 - - - - - - Panama 3,252 - - - - - - 150 762 2,340 - - - - - Paraguay 3,773 2,500 - - - - 500 - 423 350 - - - - - Peru 79,129 41,280 5,000 - - - 29,250 1,000 619 1,980 - - - - - Suriname 239 - - - - - - - 239 - - - - - - The Bahamas 190 - - - - - - - 190 - - - - - - Trinidad and Tobago 175 - - - - - - - 175 - - - - - - Uruguay 539 - - - - - - - 539 - - - - - -
10

$ in thousands for all items Total DA GHP-USAID GHP-STATE ESF AEECA INCLE NADR IMET FMF PKO IO&P P.L. 480 IDA Other**
Table 3a: Country / Account Summary*FY 2012 Actual
Venezuela 6,000 - - - 6,000 - - - - - - - - - - Barbados and Eastern Caribbean 33,176 11,640 6,950 13,741 - - - - 845 - - - - - -
State Western Hemisphere Regional (WHA) 220,850 - - - 84,000 - 115,000 6,850 - 15,000 - - - - - USAID Central America Regional 32,089 15,500 5,391 11,198 - - - - - - - - - - - USAID Latin America and Caribbean Regional (LAC) 44,900 37,100 7,800 - - - - - - - - - - - - USAID South America Regional 16,000 12,000 4,000 - - - - - - - - - - - -Asia Middle East Regional 24,830 19,030 5,500 300 - - - - - - - - - - -AVC - Arms Control, Verification, and Compliance 40,500 - - - - - - 40,500 - - - - - - -BFS - Bureau for Food Security 283,900 283,900 - - - - - - - - - - - - -CT - Counterterrorism 71,368 - - - 5,000 - - 66,368 - - - - - - -DCHA - Democracy, Conflict, and Humanitarian Assistance 950,710 102,150 15,000 - 33,900 - - - - - - - -132,251 825,000 106,911
DRL - Democracy, Human Rights and Labor 74,000 - - - 6,000 - - - - - - - - - 68,000E3 - Economic Growth, Education, and Environment 181,052 165,700 - - 15,352 - - - - - - - - - -ECA - Educational and Cultural Affairs 5,000 - - - 5,000 - - - - - - - - - -ENR - Energy Resources 9,000 - - - 9,000 - - - - - - - - - -Foreign Assistance Program Evaluation 600 - - - 600 - - - - - - - - - -GH - Global Health 371,630 - 371,630 - - - - - - - - - - - -GH - International Partnerships 398,545 - 398,545 - - - - - - - - - - - -IDEA - Office of Innovation and Development Alliances 86,418 86,418 - - - - - - - - - - - - -INL - International Narcotics and Law Enforcement Affairs 190,356 - - - - - 190,356 - - - - - - - -IO - International Organizations 343,905 - - - - - - - - - - 343,905 - - -ISN - International Security and Nonproliferation 214,070 - - - - - - 214,070 - - - - - - -J/TIP - Office to Monitor and Combat Trafficking In Persons 18,720 - - - - - 18,720 - - - - - - - -
MFS - Multilateral Food Security Programs 14,600 14,600 - - - - - - - - - - - - -OES - Oceans and International Environmental and Scientific Affairs 115,552 - - - 115,552 - - - - - - - - - -Treasury GCC Transfer 100,000 - - - 100,000 - - - - - - - - - -PM - Political-Military Affairs 192,244 - - - - - - 31,795 5,799 62,800 91,850 - - - -PPL - Policy, Planning and Learning 48,000 48,000 - - - - - - - - - - - - -
PRM - Population, Refugees, and Migration 1,673,300 - - - - - - - - - - - - - 1,673,300Unallocated Earmarks 36,345 31,824 - - 4,521 - - - - - - - - - -
S/GAC - Office of the Global AIDS Coordinator 2,259,746 - - 2,259,746 - - - - - - - - - - -Special Representatives 8,000 - - - 8,000 - - - - - - - - - - S/GPI - Special Representative for Global Partnerships 1,000 - - - 1,000 - - - - - - - - - - S/GWI - Ambassador-at-Large for Global Women’s Issues 5,000 - - - 5,000 - - - - - - - - - - S/SACSED - Senior Advisor for Civil Society and Emerging Democracies 1,000 - - - 1,000 - - - - - - - - - -
11

$ in thousands for all items Total DA GHP-USAID GHP-STATE ESF AEECA INCLE NADR IMET FMF PKO IO&P P.L. 480 IDA Other**
Table 3a: Country / Account Summary*FY 2012 Actual
S/SRMC - Special Representative to Muslim Communities 1,000 - - - 1,000 - - - - - - - - - -USAID Management 1,276,800 - - - - - - - - - - - - - 1,276,800 USAID Capital Investment Fund 129,700 - - - - - - - - - - - - - 129,700
USAID Development Credit Authority Admin 8,300 - - - - - - - - - - - - - 8,300
USAID Inspector General Operating Expense 46,500 - - - - - - - - - - - - - 46,500 USAID Operating Expense 1,092,300 - - - - - - - - - - - - - 1,092,300Independent Agencies 4,699,384 - - - - - - - - - - - - - 4,699,384 Peace Corps 375,000 - - - - - - - - - - - - - 375,000 Millennium Challenge Corporation 898,200 - - - - - - - - - - - - - 898,200 Inter-American Foundation 22,500 - - - - - - - - - - - - - 22,500 African Development Foundation 30,000 - - - - - - - - - - - - - 30,000 Treasury Technical Assistance 25,448 - - - - - - - - - - - - - 25,448 Debt Restructuring 12,000 - - - - - - - - - - - - - 12,000 Export-Import Bank -799,700 - - - - - - - - - - - - - -799,700 Overseas Private Investment Corporation (OPIC) -265,734 - - - - - - - - - - - - - -265,734 Trade and Development Agency 50,000 - - - - - - - - - - - - - 50,000 International Trade Commission 80,000 - - - - - - - - - - - - - 80,000 Foreign Claims Settlement Commission 2,000 - - - - - - - - - - - - - 2,000
International Financial Institutions (IFIs) 2,622,388 - - - - - - - - - - - - - 2,622,388 International Bank for Reconstruction and Development 117,364 - - - - - - - - - - - - - 117,364
International Development Association (IDA) 1,325,000 - - - - - - - - - - - - - 1,325,000 African Development Bank 32,418 - - - - - - - - - - - - - 32,418 African Development Fund (AfDF) 172,500 - - - - - - - - - - - - - 172,500 Asian Development Bank 106,586 - - - - - - - - - - - - - 106,586 Asian Development Fund 100,000 - - - - - - - - - - - - - 100,000 Inter-American Development Bank 75,000 - - - - - - - - - - - - - 75,000 Inter-American Investment Corporation 4,670 - - - - - - - - - - - - - 4,670 Enterprise for the Americas Multilateral Investment Fund 25,000 - - - - - - - - - - - - - 25,000 IDA Multilateral Debt Relief Initiative 167,000 - - - - - - - - - - - - - 167,000 AfDF Multilateral Debt Relief Initiative 7,500 - - - - - - - - - - - - - 7,500 Global Environment Facility (GEF) 89,820 - - - - - - - - - - - - - 89,820 Clean Technology Fund 184,630 - - - - - - - - - - - - - 184,630 Strategic Climate Fund 49,900 - - - - - - - - - - - - - 49,900
International Fund for Agricultural Development 30,000 - - - - - - - - - - - - - 30,000
Global Agriculture and Food Security Program 135,000 - - - - - - - - - - - - - 135,000
Middle East and North Africa Transition Fund - - - - - - - - - - - - - - -
*Includes Enduring and Overseas Contingency Operations (OCO).
12

$ in thousands for all items Total DA GHP-USAID GHP-STATE ESF INCLE NADR IMET FMF PKO IO&P IDA Other**
TOTAL 32,874,556 2,837,812 2,645,000 5,670,000 4,076,054 1,129,727 616,125 105,573 5,445,959 347,000 320,645 2,045,000 7,635,661 Africa 6,600,516 1,043,850 1,428,970 3,205,656 564,021 60,663 40,605 13,530 15,321 227,900 - - - Angola 55,998 - 38,700 10,938 - - 6,000 360 - - - - - Benin 23,710 - 23,500 - - - - 210 - - - - - Botswana 50,471 - - 49,711 - - - 560 200 - - - - Burkina Faso 9,200 - 9,000 - - - - 200 - - - - - Burundi 31,724 - 16,500 14,899 - - - 325 - - - - - Cameroon 24,847 - 1,500 23,107 - - - 240 - - - - - Cape Verde 100 - - - - - - 100 - - - - - Central African Republic 120 - - - - - - 120 - - - - - Chad 280 - - - - - - 280 - - - - - Comoros 100 - - - - - - 100 - - - - - Cote d'Ivoire 135,370 - - 121,390 11,500 - - 280 200 2,000 - - - Democratic Republic of the Congo 235,994 - 122,700 38,332 59,892 3,250 500 320 - 11,000 - - - Djibouti 4,464 1,384 - 1,800 - - - 280 1,000 - - - - Ethiopia 417,977 90,328 135,900 190,336 - - - 570 843 - - - - Gabon 180 - - - - - - 180 - - - - - Ghana 160,016 93,254 61,500 4,042 - - 200 670 350 - - - - Guinea 19,354 3,414 15,500 - - - - 240 200 - - - - Guinea-Bissau 25 - - - - - - 25 - - - - - Kenya 563,753 89,774 81,400 382,141 - 2,000 6,500 760 1,178 - - - - Lesotho 25,658 - 6,400 19,158 - - - 100 - - - - - Liberia 157,128 - 30,700 800 106,030 11,713 - 360 5,525 2,000 - - - Madagascar 49,000 - 49,000 - - - - - - - - - - Malawi 166,388 37,500 72,400 56,248 - - - 240 - - - - - Mali 180,299 38,070 56,850 1,349 - - - 280 - 83,750 - - - Mauritania 260 - - - - - - 260 - - - - - Mauritius 110 - - - - - - 110 - - - - - Mozambique 372,351 52,706 68,100 249,180 - 500 1,525 340 - - - - - Namibia 60,795 - - 60,675 - - - 120 - - - - - Niger 2,250 2,000 - - - - - 250 - - - - - Nigeria 692,695 80,440 169,200 441,225 - - 100 730 1,000 - - - - Republic of the Congo 100 - - - - - - 100 - - - - - Rwanda 169,232 51,420 43,000 74,202 - - - 410 200 - - - - Sao Tome and Principe 100 - - - - - - 100 - - - - - Senegal 89,242 30,212 55,400 1,535 - - 1,000 770 325 - - - - Seychelles 140 - - - - - - 140 - - - - - Sierra Leone 2,380 - - 500 1,600 - - 280 - - - - - Somalia 121,380 - - - 49,400 1,780 - 200 - 70,000 - - - South Africa 445,606 17,320 10,000 414,636 - 2,000 300 650 700 - - - -
Table 3b: Country / Account Summary*FY 2014 Request
13

$ in thousands for all items Total DA GHP-USAID GHP-STATE ESF INCLE NADR IMET FMF PKO IO&P IDA Other**
Table 3b: Country / Account Summary*FY 2014 Request
South Sudan 393,048 - 35,510 13,904 280,499 22,000 2,135 800 200 38,000 - - - Sudan 11,700 - - - 10,700 - 1,000 - - - - - - Swaziland 42,065 - 6,900 35,065 - - - 100 - - - - - Tanzania 552,488 124,145 97,135 330,038 - 450 200 320 200 - - - - The Gambia 90 - - - - - - 90 - - - - - Togo 120 - - - - - - 120 - - - - - Uganda 456,327 63,112 86,100 306,195 - - 200 520 200 - - - - Zambia 362,180 12,810 56,875 292,175 - - - 320 - - - - - Zimbabwe 135,275 - 40,500 69,675 25,100 - - - - - - - - African Union 900 - - - 900 - - - - - - - - State Africa Regional (AF) 80,465 - - - 18,400 16,970 20,945 - 3,000 21,150 - - - USAID Africa Regional (AFR) 102,500 89,000 13,500 - - - - - - - - - - USAID Central Africa Regional 18,112 18,112 - - - - - - - - - - - USAID East Africa Regional 53,350 43,750 8,800 800 - - - - - - - - - USAID Sahel Regional Program 21,000 21,000 - - - - - - - - - - - USAID Southern Africa Regional 27,475 23,875 2,000 1,600 - - - - - - - - - USAID West Africa Regional 74,624 60,224 14,400 - - - - - - - - - - East Asia and Pacific 768,280 320,598 131,250 73,117 93,700 29,232 38,605 9,290 72,488 - - - - Burma 75,445 - 16,000 8,245 51,200 - - - - - - - - Cambodia 73,474 27,846 30,500 4,588 5,000 - 4,090 450 1,000 - - - - China 7,698 - - 2,398 4,500 800 - - - - - - - Indonesia 182,965 111,649 39,750 250 - 10,066 5,550 1,700 14,000 - - - - Laos 12,950 2,050 - - - 1,000 9,000 400 500 - - - - Malaysia 2,970 - - - - 800 1,270 900 - - - - - Marshall Islands 550 500 - - - - - 50 - - - - - Micronesia 500 500 - - - - - - - - - - - Mongolia 11,310 7,820 - - - - 240 850 2,400 - - - - Papua New Guinea 5,030 - 2,500 2,280 - - - 250 - - - - - Philippines 187,982 87,682 31,500 - - 8,000 9,100 1,700 50,000 - - - - Samoa 40 - - - - - - 40 - - - - - Singapore 240 - - - - - 240 - - - - - - Thailand 10,125 5,051 - - - 1,466 1,320 1,300 988 - - - - Timor-Leste 16,560 13,200 2,000 - - 660 - 400 300 - - - - Tonga 550 - - - - - - 250 300 - - - - Vietnam 96,493 34,800 - 53,173 - 450 4,070 1,000 3,000 - - - - State East Asia and Pacific Regional 35,715 - - - 26,000 5,990 3,725 - - - - - - USAID Regional Development Mission-Asia (RDM/A) 47,683 29,500 9,000 2,183 7,000 - - - - - - - - Europe and Eurasia 563,108 - 9,800 21,204 352,941 43,798 19,215 29,550 86,600 - - - - Albania 17,000 - - - 6,580 4,450 2,370 1,000 2,600 - - - -
14
$ in thousands for all items Total DA GHP-USAID GHP-STATE ESF INCLE NADR IMET FMF PKO IO&P IDA Other**
Table 3b: Country / Account Summary*FY 2014 Request
Armenia 31,583 - - - 24,719 2,824 740 600 2,700 - - - - Azerbaijan 16,310 - - - 11,029 1,226 755 600 2,700 - - - - Belarus 11,000 - - - 11,000 - - - - - - - - Bosnia and Herzegovina 44,115 - - - 27,660 6,735 4,220 1,000 4,500 - - - - Bulgaria 9,250 - - - - - 250 2,000 7,000 - - - - Croatia 4,500 - - - - - 900 1,100 2,500 - - - - Czech Republic 4,800 - - - - - - 1,800 3,000 - - - - Estonia 3,600 - - - - - - 1,200 2,400 - - - - Georgia 62,025 - - - 43,028 3,947 1,250 1,800 12,000 - - - - Greece 100 - - - - - - 100 - - - - - Hungary 1,450 - - - - - - 1,000 450 - - - - Kosovo 57,158 - - - 41,014 10,674 720 750 4,000 - - - - Latvia 3,450 - - - - - - 1,200 2,250 - - - - Lithuania 3,750 - - - - - - 1,200 2,550 - - - - Macedonia 12,612 - - - 5,636 1,786 490 1,100 3,600 - - - - Malta 150 - - - - - - 150 - - - - - Moldova 19,660 - - - 14,050 3,230 380 750 1,250 - - - - Montenegro 4,451 - - - 335 1,826 490 600 1,200 - - - - Poland 19,000 - - - 3,000 - - 2,000 14,000 - - - - Portugal 100 - - - - - - 100 - - - - - Romania 9,700 - - - - - - 1,700 8,000 - - - - Serbia 24,363 - - - 16,103 3,000 2,410 1,050 1,800 - - - - Slovakia 1,350 - - - - - - 900 450 - - - - Slovenia 1,100 - - - - - - 650 450 - - - - Turkey 4,120 - - - - - 820 3,300 - - - - - Ukraine 95,271 - 7,500 21,204 53,957 4,100 2,410 1,900 4,200 - - - - Europe and Eurasia Regional 74,640 - 2,300 - 68,330 - 1,010 - 3,000 - - - - International Fund for Ireland 2,500 - - - 2,500 - - - - - - - - Organization for Security and Cooperation in Europe (OSCE) 24,000 - - - 24,000 - - - - - - - - Near East 6,861,993 - 9,500 - 1,203,396 126,052 54,550 20,495 4,840,000 28,000 - - 580,000 Algeria 2,600 - - - - - 1,300 1,300 - - - - - Bahrain 11,175 - - - - - 450 725 10,000 - - - - Egypt 1,559,326 - - - 250,000 4,106 3,420 1,800 1,300,000 - - - - Iraq 73,162 - - - 22,500 23,052 25,610 2,000 - - - - - Israel 3,100,000 - - - - - - - 3,100,000 - - - - Jordan 670,500 - - - 360,000 - 6,700 3,800 300,000 - - - - Lebanon 165,904 - - - 70,000 13,894 4,760 2,250 75,000 - - - - Libya 5,940 - - - - 1,500 2,940 1,500 - - - - - Morocco 32,576 - - - 20,896 1,500 1,470 1,710 7,000 - - - -
15

$ in thousands for all items Total DA GHP-USAID GHP-STATE ESF INCLE NADR IMET FMF PKO IO&P IDA Other**
Table 3b: Country / Account Summary*FY 2014 Request
Oman 11,000 - - - - - 1,000 2,000 8,000 - - - - Saudi Arabia 10 - - - - - - 10 - - - - - Tunisia 61,780 - - - 30,000 8,000 1,480 2,300 20,000 - - - - West Bank and Gaza 440,000 - - - 370,000 70,000 - - - - - - - Yemen 82,520 - 9,500 - 45,000 3,000 3,920 1,100 20,000 - - - - MENA IF Fund 475,000 - - - - - - - - - - - 475,000 Middle East Multilaterals (MEM) 1,000 - - - 1,000 - - - - - - - - Middle East Partnership Initiative (MEPI) 75,000 - - - - - - - - - - - 75,000 Middle East Regional Cooperation (MERC) 4,000 - - - 4,000 - - - - - - - - Multinational Force and Observers (MFO) 28,000 - - - - - - - - 28,000 - - - Near East Regional Democracy 30,000 - - - 30,000 - - - - - - - - Trans-Sahara Counter-Terrorism Partnership (TSCTP) 2,500 - - - - 1,000 1,500 - - - - - - USAID Middle East Regional (OMEP) 30,000 - - - - - - - - - - - 30,000 South and Central Asia 2,144,640 101,900 191,000 18,290 1,185,096 235,260 88,450 13,309 311,335 - - - - Afghanistan 748,950 - - - 535,250 160,000 52,200 1,500 - - - - - Bangladesh 165,650 80,900 75,300 - - 2,600 3,350 1,000 2,500 - - - - India 91,146 12,000 61,500 8,386 3,000 - 5,000 1,260 - - - - - Kazakhstan 12,229 - - - 7,392 1,200 1,430 707 1,500 - - - - Kyrgyz Republic 51,819 - 3,750 - 38,319 6,000 1,250 1,000 1,500 - - - - Maldives 4,416 2,000 - - - 1,200 640 176 400 - - - - Nepal 80,545 - 39,700 - 34,500 3,300 845 900 1,300 - - - - Pakistan 881,370 - - - 513,500 45,000 17,870 5,000 300,000 - - - - Sri Lanka 10,876 6,000 - - - 720 3,080 626 450 - - - - Tajikistan 36,400 - 6,750 - 19,125 7,000 1,485 540 1,500 - - - - Turkmenistan 6,455 - - - 4,640 500 330 300 685 - - - - Uzbekistan 11,592 - 3,000 - 5,512 740 540 300 1,500 - - - - Central Asia Regional 38,762 - 1,000 9,904 20,858 7,000 - - - - - - - State South and Central Asia Regional (SCA) 3,430 - - - 3,000 - 430 - - - - - - USAID South Asia Regional 1,000 1,000 - - - - - - - - - - - Western Hemisphere 1,531,850 306,530 75,791 162,802 432,200 465,431 14,485 14,396 60,215 - - - - Argentina 590 - - - - - 240 350 - - - - - Belize 1,180 - - - - - - 180 1,000 - - - - Bolivia 18,700 6,000 7,500 - - 5,000 - 200 - - - - - Brazil 3,943 2,000 - 1,078 - - 240 625 - - - - - Chile 1,100 - - - - - 290 810 - - - - - Colombia 323,217 - - - 140,000 149,000 4,300 1,417 28,500 - - - - Costa Rica 1,750 - - - - - - 350 1,400 - - - - Cuba 15,000 - - - 15,000 - - - - - - - - Dominican Republic 23,239 9,830 5,750 6,894 - - - 765 - - - - -
16
$ in thousands for all items Total DA GHP-USAID GHP-STATE ESF INCLE NADR IMET FMF PKO IO&P IDA Other**
Table 3b: Country / Account Summary*FY 2014 Request
Ecuador 11,810 11,000 - - - - - 360 450 - - - - El Salvador 41,800 39,000 - - - - - 1,000 1,800 - - - - Guatemala 73,960 57,500 14,000 - - - - 720 1,740 - - - - Guyana 6,245 - - 5,945 - - - 300 - - - - - Haiti 300,916 - 25,200 122,896 139,000 12,000 - 220 1,600 - - - - Honduras 54,476 49,326 - - - - - 650 4,500 - - - - Jamaica 3,700 3,000 - - - - - 700 - - - - - Mexico 205,490 10,000 - - 35,000 148,131 3,910 1,449 7,000 - - - - Nicaragua 10,685 9,600 - - - - - 700 385 - - - - Panama 2,750 - - - - - 190 720 1,840 - - - - Paraguay 8,460 8,000 - - - - - 460 - - - - - Peru 72,635 43,100 - - - 26,300 150 585 2,500 - - - - Suriname 225 - - - - - - 225 - - - - - The Bahamas 180 - - - - - - 180 - - - - - Trinidad and Tobago 180 - - - - - - 180 - - - - - Uruguay 450 - - - - - - 450 - - - - - Venezuela 5,000 - - - 5,000 - - - - - - - - Barbados and Eastern Caribbean 31,858 10,000 6,950 14,108 - - - 800 - - - - - State Western Hemisphere Regional (WHA) 235,865 - - - 98,200 125,000 5,165 - 7,500 - - - - USAID Central America Regional 30,772 10,500 8,391 11,881 - - - - - - - - - USAID Latin America and Caribbean Regional (LAC) 35,174 31,174 4,000 - - - - - - - - - - USAID South America Regional 10,500 6,500 4,000 - - - - - - - - - -USAID Asia Regional 14,673 9,923 4,750 - - - - - - - - - -
AVC - Arms Control, Verification, and Compliance 32,000 - - - - - 32,000 - - - - - -BFS - Bureau for Food Security 357,435 357,435 - - - - - - - - - - -CT - Counterterrorism 110,556 - - - 12,000 - 98,556 - - - - - -DCHA - Democracy, Conflict, and Humanitarian Assistance 2,591,559 360,959 13,000 - - - - - - - - 2,045,000 172,600DRL - Democracy, Human Rights and Labor 64,000 - - - 64,000 - - - - - - - -E3 - Economic Growth, Education, and Environment 177,098 162,298 - - 14,800 - - - - - - - -ENR - Energy Resources 14,000 - - - 14,000 - - - - - - - -GH - Global Health 358,594 - 358,594 - - - - - - - - - -GH - International Partnerships 422,345 - 422,345 - - - - - - - - - -IDEA - Office of Innovation and Development Alliances 62,203 62,203 - - - - - - - - - - -INL - International Narcotics and Law Enforcement Affairs 150,571 - - - - 150,571 - - - - - - -IO - International Organizations 320,645 - - - - - - - - - 320,645 - -
ISN - International Security and Nonproliferation 200,234 - - - - - 200,234 - - - - - -
17

$ in thousands for all items Total DA GHP-USAID GHP-STATE ESF INCLE NADR IMET FMF PKO IO&P IDA Other**
Table 3b: Country / Account Summary*FY 2014 Request
J/TIP - Office to Monitor and Combat Trafficking In Persons 18,720 - - - - 18,720 - - - - - - -OES - Oceans and International Environmental and Scientific Affairs 116,500 - - - 116,500 - - - - - - - -OST - Office of Science and Technology 85,000 85,000 - - - - - - - - - - -Global Security Contingency Fund 25,000 - - - - - - - - - - - 25,000PM - Political-Military Affairs 185,528 - - - - - 29,425 5,003 60,000 91,100 - - -PPL - Policy, Planning and Learning 25,917 25,917 - - - - - - - - - - -PRM - Population, Refugees, and Migration 2,010,960 - - - - - - - - - - - 2,010,960
S/GAC - Office of the Global AIDS Coordinator 2,188,931 - - 2,188,931 - - - - - - - - -
S/GAC, Additional Funding for Country Programs 227,057 - - 227,057 - - - - - - - - - S/GAC, International Partnerships 1,695,000 - - 1,695,000 - - - - - - - - - S/GAC, Oversight/Management 186,874 - - 186,874 - - - - - - - - - S/GAC, Technical Support//Strategic Information/Evaluation 80,000 - - 80,000 - - - - - - - - -Special Representatives 23,400 - - - 23,400 - - - - - - - -
S/CCI - Office of the Coordinator for Cyber Issues 500 - - - 500 - - - - - - - - S/GPI - Special Representative for Global Partnerships 2,000 - - - 2,000 - - - - - - - - S/GWI - Ambassador-at-Large for Global Women’s Issues 20,000 - - - 20,000 - - - - - - - - S/SACSED - Senior Advisor for Civil Society and Emerging Democracies 500 - - - 500 - - - - - - - - S/SRMC - Special Representative to Muslim Communities 400 - - - 400 - - - - - - - -USAID Management 1,508,540 - - - - - - - - - - - 1,508,540 USAID Capital Investment Fund 117,940 - - - - - - - - - - - 117,940 USAID Development Credit Authority Admin 8,200 - - - - - - - - - - - 8,200 USAID Inspector General Operating Expense 54,200 - - - - - - - - - - - 54,200 USAID Operating Expense 1,328,200 - - - - - - - - - - - 1,328,200USAID Program Management Initiatives 1,199 1,199 - - - - - - - - - - -Independent Agencies 462,782 - - - - - - - - - - - 462,782 Peace Corps 378,800 - - - - - - - - - - - 378,800 Millennium Challenge Corporation 898,200 - - - - - - - - - - - 898,200 Inter-American Foundation 18,100 - - - - - - - - - - - 18,100 African Development Foundation 24,000 - - - - - - - - - - - 24,000 Treasury Technical Assistance 23,500 - - - - - - - - - - - 23,500 Debt Restructuring - - - - - - - - - - - - - Export-Import Bank -831,600 - - - - - - - - - - - -831,600
Overseas Private Investment Corporation (OPIC) -198,200 - - - - - - - - - - - -198,200 Trade and Development Agency 62,662 - - - - - - - - - - - 62,662
18

$ in thousands for all items Total DA GHP-USAID GHP-STATE ESF INCLE NADR IMET FMF PKO IO&P IDA Other**
Table 3b: Country / Account Summary*FY 2014 Request
International Trade Commission 85,102 - - - - - - - - - - - 85,102 Foreign Claims Settlement Commission 2,218 - - - - - - - - - - - 2,218International Financial Institutions (IFIs) 2,875,779 - - - - - - - - - - - 2,875,779 International Bank for Reconstruction and Development 186,957 - - - - - - - - - - - 186,957 International Development Association (IDA) 1,358,500 - - - - - - - - - - - 1,358,500 African Development Bank 32,418 - - - - - - - - - - - 32,418 African Development Fund (AfDF) 195,000 - - - - - - - - - - - 195,000 Asian Development Bank 106,586 - - - - - - - - - - - 106,586 Asian Development Fund 115,250 - - - - - - - - - - - 115,250 Inter-American Development Bank 102,020 - - - - - - - - - - - 102,020 Inter-American Investment Corporation - - - - - - - - - - - - - Enterprise for the Americas Multilateral Investment Fund 6,298 - - - - - - - - - - - 6,298 IDA Multilateral Debt Relief Initiative 145,300 - - - - - - - - - - - 145,300 AfDF Multilateral Debt Relief Initiative 30,000 - - - - - - - - - - - 30,000 Global Environment Facility (GEF) 143,750 - - - - - - - - - - - 143,750 Clean Technology Fund 215,700 - - - - - - - - - - - 215,700 Strategic Climate Fund 68,000 - - - - - - - - - - - 68,000 International Fund for Agricultural Development 30,000 - - - - - - - - - - - 30,000 Global Agriculture and Food Security Program 135,000 - - - - - - - - - - - 135,000 Middle East and North Africa Transition Fund 5,000 - - - - - - - - - - - 5,000
19

$ in thousands for all items FY 2012 Actual
FY 2014 Request
TOTAL 6,575,330 2,308,200Complex Crises Fund 40,000 - DCHA - Democracy, Conflict, and Humanitarian Assistance 40,000 - Complex Crises Fund 40,000 -Economic Support Fund 3,151,962 1,382,200 Near East 477,000 - Iraq 178,500 - Jordan 100,000 - Libya 3,000 - Syria 55,500 - Tunisia 30,000 - Yemen 10,000 - Tunisia Cash Transfer 100,000 - South and Central Asia 2,662,962 1,382,200 Afghanistan 1,815,762 1,130,000 Pakistan 847,200 252,200 CT - Counterterrorism 5,000 - State Bureau of Counterterrorism (CT) 5,000 - Reserve 7,000 - Unallocated Earmarks 7,000 -Foreign Military Financing 1,102,000 511,000 Near East 862,000 500,000 Iraq 850,000 500,000 Tunisia 12,000 - South and Central Asia 218,423 - Pakistan 215,853 - Uzbekistan 2,570 - PM - Political-Military Affairs - 11,000 PM - FMF Administrative Expenses - 11,000 Unallocated Earmarks 21,577 -
Table 4: Country / Account SummaryFY 2012 - FY 2014 Overseas Contingency Operations (OCO)
20

$ in thousands for all items FY 2012 Actual
FY 2014 Request
Table 4: Country / Account SummaryFY 2012 - FY 2014 Overseas Contingency Operations (OCO)
Global Security Contingency Fund 23,000 -International Disaster Assistance 270,000 - DCHA - Democracy, Conflict, and Humanitarian Assistance 270,000 -International Narcotics Control and Law Enforcement 574,605 344,000 Near East 175,605 - Iraq 137,000 - Morocco 7,500 - Tunisia 22,500 - Yemen 3,605 - Middle East Response Fund (MERF) 5,000 - South and Central Asia 399,000 344,000 Afghanistan 324,000 315,000 Pakistan 75,000 29,000Migration and Refugee Assistance 329,000 - PRM - Population, Refugees, and Migration 329,000 - PRM, OA - Near East 100,000 - State Population, Refugees and Migration (PRM) 229,000 -
Nonproliferation, Antiterrorism, Demining and Related Programs 121,157 - Africa 7,750 - Kenya 7,750 - Near East 7,500 - Iraq 5,000 - Yemen 2,500 - South and Central Asia 43,000 - Afghanistan 23,000 - Pakistan 20,000 - CT - Counterterrorism 62,407 - CT - RSI, Regional Strategic Initiative 16,711 - State Bureau of Counterterrorism (CT) 45,696 - PM - Political-Military Affairs 500 - PM - Conventional Weapons Destruction 500 -
21

$ in thousands for all items FY 2012 Actual
FY 2014 Request
Table 4: Country / Account SummaryFY 2012 - FY 2014 Overseas Contingency Operations (OCO)
Pakistan Counterinsurgency Capability Fund 452,000 - South and Central Asia 452,000 - Pakistan 452,000 -Peacekeeping Operations 207,000 - Africa 187,000 - Mali 81,000 - Somalia 96,000 - State Africa Regional (AF) 10,000 - PM - Political-Military Affairs 20,000 - PM - TSCTP, Trans-Sahara Counter-Terrorism Partnership 20,000 -Transition Initiatives 43,554 - DCHA - Democracy, Conflict, and Humanitarian Assistance 43,554 -USAID Administrative Expense 259,500 71,000 USAID Management 259,500 71,000 USAID Inspector General Operating Expense 4,500 - USAID Operating Expense 255,000 71,000Department of Treasury 1,552 - Treasury Techinical Assistance 1,552
22

$ in thousands for all items FY 2012 Actual
FY 2014 Request
TOTAL 33,917,586 31,844,1951 Peace and Security 10,021,988 8,403,919 1.1 Counter-Terrorism 524,565 253,241 1.2 Combating Weapons of Mass Destruction (WMD) 330,620 290,134 1.3 Stabilization Operations and Security Sector Reform 7,846,709 6,908,960 1.4 Counter-Narcotics 672,417 611,880 1.5 Transnational Crime 91,523 83,499 1.6 Conflict Mitigation and Reconciliation 556,154 256,2052 Governing Justly and Democratically 2,826,308 2,879,055 2.1 Rule of Law and Human Rights 939,677 912,636 2.2 Good Governance 1,036,838 1,220,396 2.3 Political Competition and Consensus-Building 246,531 212,580 2.4 Civil Society 603,262 533,4433 Investing in People 10,463,768 9,943,512 3.1 Health 8,999,577 8,880,634 3.2 Education 1,062,160 723,261 Populations 402,031 339,6174 Economic Growth 4,720,596 4,076,338 4.1 Macroeconomic Foundation for Growth 688,821 295,133 4.2 Trade and Investment 163,149 171,651 4.3 Financial Sector 143,678 108,604 4.4 Infrastructure 838,000 797,509 4.5 Agriculture 1,413,597 1,286,595 4.6 Private Sector Competitiveness 456,093 571,758 4.7 Economic Opportunity 148,687 169,125 4.8 Environment 868,571 675,9635 Humanitarian Assistance 4,286,803 4,484,094 5.1 Protection, Assistance and Solutions 4,135,704 4,306,831 5.2 Disaster Readiness 104,755 139,763 5.3 Migration Management 46,344 37,5006 Program Support 1,598,123 2,057,277 6.1 Program Design and Learning 58,705 477,737 6.2 Administration and Oversight 1,539,418 1,579,540
Table 5: Objectives, Program Areas: SummaryFY 2012 - FY 2014
23

$ in thousands for all items Total DA GHP-USAID GHP-STATE ESF AEECA INCLE NADR IMET FMF PKO IO&P P.L. 480 IDA Other*
TOTAL 33,917,586 2,519,950 2,629,800 5,542,860 6,146,707 626,718 1,635,705 711,270 105,788 6,312,000 509,818 343,905 1,466,000 1,095,000 4,272,0651 Peace and Security 10,021,988 70,946 - - 556,099 125,419 1,023,072 711,270 105,788 6,312,000 509,818 1,350 - - 606,226 1.1 Counter-Terrorism 524,565 10,425 - - 33,000 - - 270,905 1,585 207,300 - 1,350 - - - 1.2 Combating Weapons of Mass Destruction (WMD) 330,620 - - - - 26,005 - 290,615 - 14,000 - - - - - 1.3 Stabilization Operations and Security Sector Reform 7,846,709 600 - - 19,949 40,534 457,620 149,100 104,203 6,089,885 509,818 - - - 475,000 1.4 Counter-Narcotics 672,417 22,400 - - 151,302 3,948 493,952 - - 815 - - - - - 1.5 Transnational Crime 91,523 7,200 - - 4,591 8,082 71,500 150 - - - - - - - 1.6 Conflict Mitigation and Reconciliation 556,154 30,321 - - 347,257 46,850 - 500 - - - - - - 131,2262 Governing Justly and Democratically 2,826,308 211,981 - - 1,612,789 244,158 607,633 - - - - 21,655 853 - 127,239 2.1 Rule of Law and Human Rights 939,677 30,892 - - 198,762 67,075 581,543 - - - - 21,655 - - 39,750 2.2 Good Governance 1,036,838 88,611 - - 859,828 54,006 26,090 - - - - - 853 - 7,450 2.3 Political Competition and Consensus-Building 246,531 30,710 - - 154,825 23,257 - - - - - - - - 37,739 2.4 Civil Society 603,262 61,768 - - 399,374 99,820 - - - - - - - - 42,3003 Investing in People 10,463,768 607,971 2,629,800 5,542,860 1,319,202 52,918 - - - - - 161,955 149,062 - - 3.1 Health 8,999,577 123,514 2,612,300 5,542,860 397,345 27,947 - - - - - 161,955 133,656 - - 3.2 Education 1,062,160 448,238 - - 592,354 18,408 - - - - - - 3,160 - - 3.3 Social and Economic Services and Protection for Vulnerable Populations 402,031 36,219 17,500 - 329,503 6,563 - - - - - - 12,246 - -4 Economic Growth 4,720,596 1,556,470 - - 2,584,984 192,869 - - - - - 155,945 230,328 - - 4.1 Macroeconomic Foundation for Growth 688,821 14,561 - - 664,253 10,007 - - - - - - - - - 4.2 Trade and Investment 163,149 57,687 - - 85,933 14,279 - - - - - 5,250 - - - 4.3 Financial Sector 143,678 13,264 - - 113,552 15,907 - - - - - 955 - - - 4.4 Infrastructure 838,000 33,272 - - 776,909 25,932 - - - - - - 1,887 - - 4.5 Agriculture 1,413,597 826,700 - - 341,206 30,520 - - - - - - 215,171 - - 4.6 Private Sector Competitiveness 456,093 65,272 - - 225,319 83,502 - - - - - 82,000 - - - 4.7 Economic Opportunity 148,687 54,066 - - 81,745 3,582 - - - - - 7,500 1,794 - - 4.8 Environment 868,571 491,648 - - 296,067 9,140 - - - - - 60,240 11,476 - -5 Humanitarian Assistance 4,286,803 27,880 - - 61,512 11,354 - - - - - 3,000 1,085,757 1,095,000 2,002,300 5.1 Protection, Assistance and Solutions 4,135,704 13,896 - - 54,972 11,154 - - - - - - 1,078,782 1,020,000 1,956,900 5.2 Disaster Readiness 104,755 13,984 - - 6,540 200 - - - - - 3,000 6,031 75,000 - 5.3 Migration Management 46,344 - - - - - - - - - - - 944 - 45,4006 Program Support 1,598,123 44,702 - - 12,121 - 5,000 - - - - - - - 1,536,300 6.1 Program Design and Learning 58,705 41,584 - - 12,121 - 5,000 - - - - - - - - 6.2 Administration and Oversight 1,539,418 3,118 - - - - - - - - - - - - 1,536,300
Table 6: Objectives, Program Areas by AccountFY 2012 Actual
* Other Accounts includes Transition Initiatives, Democracy Fund, Migration and Refugee Assistance, U.S. Emergency Refugee and Migration Assistance Fund, Complex Crises Fund, Pakistan Counterinsurgency Contingency Fund, Global Security Contingency Fund, and USAID Administrative Expenses Accounts.
24

$ in thousands for all items Total DA GHP-USAID GHP-STATE ESF INCLE NADR IMET FMF PKO IO&P IDA Other*
TOTAL 31,844,195 2,837,812 2,645,000 5,670,000 5,458,254 1,473,727 616,125 105,573 5,956,959 347,000 320,645 2,045,000 4,368,1001 Peace and Security 8,403,919 74,047 - - 321,859 871,696 616,125 105,573 5,956,959 347,000 1,210 - 109,450 1.1 Counter-Terrorism 253,241 8,750 - - 20,500 - 222,631 - - - 1,160 - 200 1.2 Combating Weapons of Mass Destruction (WMD) 290,134 - - - 22,640 - 267,494 - - - - - - 1.3 Stabilization Operations and Security Sector Reform 6,908,960 - - - 17,340 331,088 126,000 105,573 5,956,959 347,000 - - 25,000 1.4 Counter-Narcotics 611,880 27,000 - - 111,633 473,247 - - - - - - - 1.5 Transnational Crime 83,499 5,822 - - 10,316 67,361 - - - - - - - 1.6 Conflict Mitigation and Reconciliation 256,205 32,475 - - 139,430 - - - - - 50 - 84,2502 Governing Justly and Democratically 2,879,055 351,833 - - 1,821,041 602,031 - - - - 14,100 - 90,050
2.1 Rule of Law and Human Rights 912,636 63,417 - - 241,832 582,287 - - - - 14,100 - 11,000 2.2 Good Governance 1,220,396 148,738 - - 1,035,234 19,744 - - - - - - 16,680 2.3 Political Competition and Consensus-Building 212,580 45,161 - - 151,919 - - - - - - - 15,500 2.4 Civil Society 533,443 94,517 - - 392,056 - - - - - - - 46,8703 Investing in People 9,943,512 439,319 2,645,000 5,670,000 1,017,913 - - - - - 162,880 - 8,400 3.1 Health 8,880,634 75,557 2,632,000 5,670,000 333,577 - - - - - 162,000 - 7,500 3.2 Education 723,261 314,986 - - 406,495 - - - - - 880 - 900 3.3 Social and Economic Services and Protection for Vulnerable Populations 339,617 48,776 13,000 - 277,841 - - - - - - - -4 Economic Growth 4,076,338 1,683,208 - - 2,233,775 - - - - - 139,655 - 19,700 4.1 Macroeconomic Foundation for Growth 295,133 16,621 - - 278,512 - - - - - - - - 4.2 Trade and Investment 171,651 58,918 - - 103,633 - - - - - 5,000 - 4,100 4.3 Financial Sector 108,604 19,404 - - 87,805 - - - - - 595 - 800 4.4 Infrastructure 797,509 88,536 - - 708,973 - - - - - - - - 4.5 Agriculture 1,286,595 917,035 - - 369,560 - - - - - - - -
4.6 Private Sector Competitiveness 571,758 86,119 - - 411,239 - - - - - 67,000 - 7,400 4.7 Economic Opportunity 169,125 75,505 - - 79,620 - - - - - 7,500 - 6,500 4.8 Environment 675,963 421,070 - - 194,433 - - - - - 59,560 - 9005 Humanitarian Assistance 4,484,094 286,668 - - 63,666 - - - - - 2,800 2,045,000 2,085,960 5.1 Protection, Assistance and Solutions 4,306,831 258,582 - - 54,789 - - - - - - 1,945,000 2,048,460 5.2 Disaster Readiness 139,763 28,086 - - 8,877 - - - - - 2,800 100,000 - 5.3 Migration Management 37,500 - - - - - - - - - - - 37,5006 Program Support 2,057,277 2,737 - - - - - - - - - - 2,054,540
6.1 Program Design and Learning 477,737 2,737 - - - - - - - - - - 475,000 6.2 Administration and Oversight 1,579,540 - - - - - - - - - - - 1,579,540
Table 7: Objectives, Program Areas by AccountFY 2014 Request
* Other Accounts includes Transition Initiatives, Migration and Refugee Assistance, U.S. Emergency Refugee and Migration Assistance Fund, Complex Crises Fund, Global Security Contingency Fund, Middle East and North Africa Incentive Fund, Emergency Food Assistance Contingency Fund, and USAID Administrative Expenses Accounts.
25

($ in thousands) FY 2014 Total DA ESF IO&P
TOTAL 186,000 139,000 40,000 7,000 Africa 42,000 42,000 - - Ethiopia 4,000 4,000 - -
Kenya 3,000 3,000 - -
Malawi 3,000 3,000 - -
Mali 3,000 3,000 - -
Mozambique 4,000 4,000 - -
Rwanda 2,000 2,000 - -
Senegal 2,000 2,000 - -
Tanzania 3,000 3,000 - -
Uganda 3,000 3,000 - -
USAID Africa Regional 3,000 3,000 - -
USAID East Africa Regional 4,000 4,000 - -
USAID Southern Africa Regional 4,000 4,000 - -
USAID West Africa Regional 4,000 4,000 - - East Asia and Pacific 28,500 28,500 - - Cambodia 4,000 4,000 - -
Indonesia 3,000 3,000 - -
Philippines 10,500 10,500 - -
Timor-Leste 2,000 2,000 - -
Vietnam 3,000 3,000 - -
USAID Regional Development Mission-Asia 6,000 6,000 - - South and Central Asia 10,000 8,000 2,000 - Bangladesh 4,000 4,000 - -
India 2,000 2,000 - -
Maldives 2,000 2,000 - -
Nepal 2,000 - 2,000 - Western Hemisphere 25,500 21,500 4,000 - Colombia 3,000 - 3,000 -
Dominican Republic 2,000 2,000 - -
Table 8: Global Climate Change Initiative: Adaptation - FY 2014
26
($ in thousands) FY 2014 Total DA ESF IO&P
Table 8: Global Climate Change Initiative: Adaptation - FY 2014
Guatemala 2,000 2,000 - -
Honduras 3,000 3,000 - -
Jamaica 2,000 2,000 - -
Peru 3,000 3,000 - -
Barbados and Eastern Caribbean 5,500 5,500 - -
State Western Hemisphere Regional 1,000 - 1,000 -
USAID Latin America and Caribbean Regional 2,000 2,000 - -
USAID South America Regional 2,000 2,000 - - USAID Asia Regional 3,000 3,000 - - Democracy, Conflict, and Humanitarian Assistance 11,000 11,000 - - Economic Growth, Education, and Environment 24,000 24,000 - - International Organizations 7,000 - - 7,000 Intergovernmental Panel on Climate Change / UN Framework Convention on Climate Change 7,000 - - 7,000 Oceans and International Environmental and Scientific Affairs 34,000 - 34,000 - Policy, Planning and Learning 1,000 1,000 - -
27

($ in thousands) FY 2014 Total DA ESF IO&P
TOTAL 171,500 72,500 67,500 31,500 Africa 18,000 18,000 - - Kenya 3,000 3,000 - - South Africa 3,000 3,000 - - USAID Africa Regional 3,000 3,000 - - USAID East Africa Regional 3,000 3,000 - - USAID Southern Africa Regional 3,000 3,000 - - USAID West Africa Regional 3,000 3,000 - - East Asia and Pacific 13,000 13,000 - - Indonesia 3,000 3,000 - - Philippines 4,000 4,000 - - Vietnam 2,500 2,500 - - USAID Regional Development Mission-Asia 3,500 3,500 - - Europe and Eurasia 12,500 - 12,500 - Georgia 3,000 - 3,000 - Ukraine 5,000 - 5,000 - Europe and Eurasia Regional 4,500 - 4,500 - South and Central Asia 10,500 8,000 2,500 - Bangladesh 5,000 5,000 - - India 3,000 3,000 - - Kazakhstan 2,500 - 2,500 - Western Hemisphere 16,500 10,500 6,000 - Colombia 4,000 - 4,000 - Mexico 5,000 5,000 - - Peru 2,500 2,500 - - State Western Hemisphere Regional 2,000 - 2,000 - USAID Central America Regional 3,000 3,000 - - Economic Growth, Education, and Environment 23,000 23,000 - -
Table 9: Global Climate Change Initiative: Clean Energy - FY 2014
28

($ in thousands) FY 2014 Total DA ESF IO&P
Table 9: Global Climate Change Initiative: Clean Energy - FY 2014
International Organizations 31,500 - - 31,500 Intergovernmental Panel on Climate Change / UN Framework Convention on Climate Change 6,000 - - 6,000 Montreal Protocol Multilateral Fund 25,500 - - 25,500 Oceans and International Environmental and Scientific Affairs 46,500 - 46,500 -
29

($ in thousands) FY 2014 Total DA ESF
TOTAL 123,500 105,500 18,000 Africa 19,400 19,400 - Malawi 5,000 5,000 - Zambia 5,000 5,000 - USAID Africa Regional 1,000 1,000 - USAID Central Africa Regional 5,400 5,400 - USAID West Africa Regional 3,000 3,000 - East Asia and Pacific 28,000 28,000 - Cambodia 3,500 3,500 - Indonesia 8,000 8,000 - Philippines 3,000 3,000 - Vietnam 2,500 2,500 - USAID Regional Development Mission-Asia 11,000 11,000 - South and Central Asia 9,000 6,000 3,000 Bangladesh 3,000 3,000 - India 3,000 3,000 - Nepal 3,000 - 3,000 Western Hemisphere 34,100 29,100 5,000 Colombia 5,000 - 5,000 Ecuador 3,000 3,000 - Guatemala 3,000 3,000 - Mexico 5,000 5,000 - Peru 6,600 6,600 - USAID Central America Regional 4,000 4,000 - USAID Latin America and Caribbean Regional 3,000 3,000 - USAID South America Regional 4,500 4,500 - Economic Growth, Education, and Environment 23,000 23,000 - Oceans and International Environmental and Scientific Affairs 10,000 - 10,000
Table 10: Global Climate Change Initiative: Sustainable Landscapes - FY 2014
30

($ in thousands) All Accounts DA ESF
TOTAL 1,150,595 917,035 138,560
Nutrition (GHP Account) 95,000 - -
State/USAID - Agriculture and Rural Development 1,055,595 917,035 138,560 Focus Countries 516,000 460,000 56,000 Bangladesh 50,000 50,000 - Cambodia 8,000 8,000 - Ethiopia 50,000 50,000 - Ghana 45,000 45,000 - Guatemala 13,000 13,000 - Haiti 28,000 - 28,000 Honduras 17,000 17,000 - Kenya 50,000 50,000 - Liberia 8,000 - 8,000 Malawi 17,000 17,000 - Mali 12,000 12,000 - Mozambique 35,000 35,000 - Nepal 10,000 - 10,000 Rwanda 37,000 37,000 - Senegal 17,000 17,000 - Tajikistan 10,000 - 10,000 Tanzania 70,000 70,000 - Uganda 37,000 37,000 - Zambia 2,000 2,000 - Strategic Partners 6,000 3,000 3,000 Brazil 2,000 2,000 - India 3,000 - 3,000 South Africa 1,000 1,000 -
Table 11: Feed the Future Initiative: Global Hunger and Food Security Initiative - FY 2014*
31

($ in thousands) All Accounts DA ESF
Table 11: Feed the Future Initiative: Global Hunger and Food Security Initiative - FY 2014*
Regional Programs 97,100 97,100 - USAID Africa Regional (AFR) 2,000 2,000 - USAID Asia Regional 1,000 1,000 - USAID Central America Regional 1,500 1,500 - USAID Country Support (BFS) 30,000 30,000 - USAID East Africa Regional 20,000 20,000 - USAID Latin America and Caribbean Regional (LAC) 900 900 - USAID Regional Development Mission-Asia (RDM/A) 2,700 2,700 - USAID Sahel Regional Program 10,000 10,000 - USAID Southern Africa Regional 7,000 7,000 - USAID West Africa Regional 22,000 22,000 - Research and Development 160,400 160,400 - BFS - Board for International Food and Agricultural Development (BIFAD) 400 400 - BFS - Research and Development 160,000 160,000 - Monitoring and Evaluation 15,000 15,000 - BFS - Monitoring and Evaluation 15,000 15,000 - Markets, Partnerships and Innovation 47,035 47,035 - BFS - Markets, Partnerships and Innovation 47,035 47,035 - Economic Resilience 105,000 105,000 - BFS - Community Development 80,000 80,000 - BFS - Disaster Risk Reduction 5,000 5,000 - BFS - Market Access for Vulnerable Populations 20,000 20,000 - Aligned Agricultural Programs 109,060 29,500 79,560 Burma 8,000 - 8,000 Democratic Republic of the Congo 8,000 - 8,000 Egypt 15,000 - 15,000 Georgia 5,000 - 5,000 Indonesia 3,000 3,000 - Kyrgyz Republic 6,000 - 6,000
32
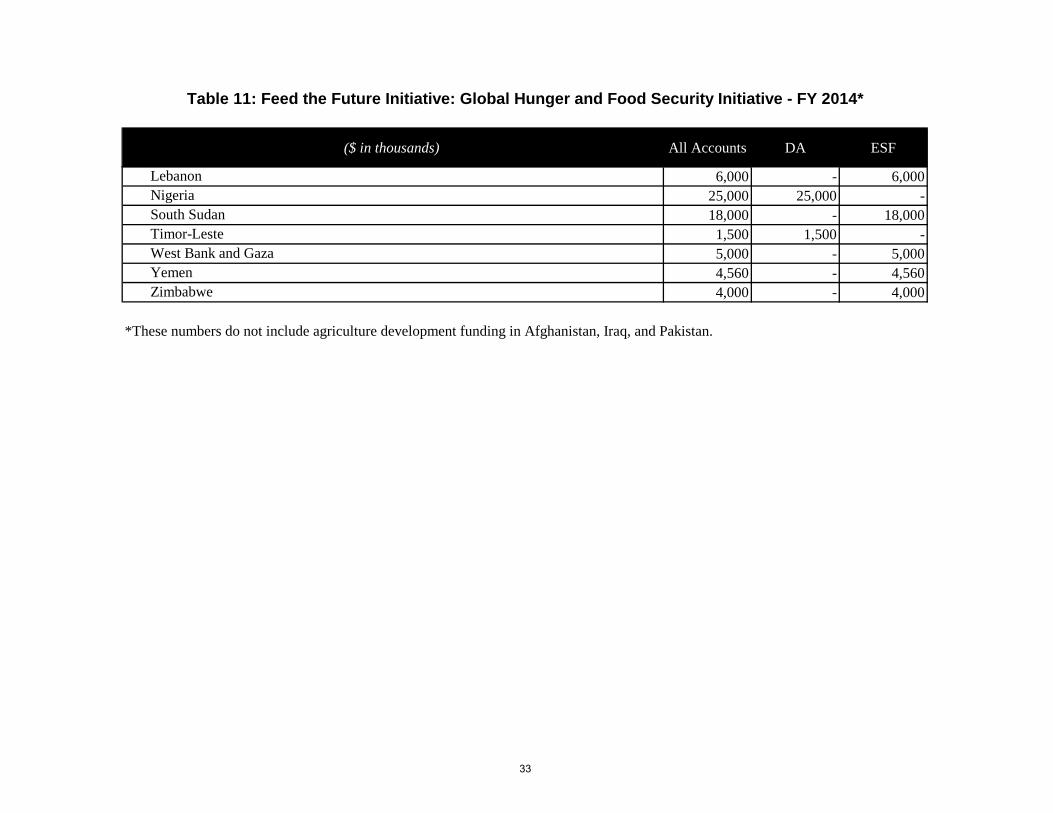
($ in thousands) All Accounts DA ESF
Table 11: Feed the Future Initiative: Global Hunger and Food Security Initiative - FY 2014*
Lebanon 6,000 - 6,000 Nigeria 25,000 25,000 - South Sudan 18,000 - 18,000 Timor-Leste 1,500 1,500 - West Bank and Gaza 5,000 - 5,000 Yemen 4,560 - 4,560 Zimbabwe 4,000 - 4,000
*These numbers do not include agriculture development funding in Afghanistan, Iraq, and Pakistan.
33

GLOBAL HEALTH PROGRAMS (GHP) 8,172,660 8,217,847 8,315,000Saving Lives of Mothers and Children 1,896,800 * 1,992,000Malaria 650,000 * 670,000Maternal & Child Health 605,550 * 680,000Family Planning / Reproductive Health 528,750 * 534,000Nutrition 95,000 * 95,000Social Services (Vulnerable Children) 17,500 * 13,000Creating an AIDS-free Generation 5,892,860 * 6,000,000HIV/AIDS 5,892,860 * 6,000,000
Of which, Global Fund 1,300,000 * 1,650,000Protecting Communities from Infectious Diseases 383,000 * 323,000Tuberculosis 236,000 * 191,000Pandemic Influenza / Other Emerging Threats 58,000 * 47,000Neglected Tropical Diseases 89,000 * 85,000* FY 2012 Actual includes $4.8 million transferred from the International Organizations and Programs account.** FY 2013 CR is based on the annualized continuing resolution calculation for FY 2013 (P.L. 112-175).
Table 12a: Global Health Programs Account
($ in thousands) FY 2012 Actual *
FY 2013 CR **
FY 2014 Request
34

$ in thousands Total HIV/AIDS Malaria Maternal and Child Health
Family Planning and Reproductive
HealthNutrition Tuberculosis Pandemic
Influenza
Neglected Tropical Diseases
Vulnerable Children
TOTAL 8,315,000 6,000,000 670,000 680,000 534,000 95,000 191,000 47,000 85,000 13,000 Africa 4,634,626 3,293,566 588,500 300,360 317,800 58,900 75,500 - - - Angola 49,638 15,338 29,000 1,300 4,000 - - - - - Benin 23,500 - 17,000 3,500 3,000 - - - - - Botswana 49,711 49,711 - - - - - - - - Burkina Faso 9,000 - 9,000 - - - - - - - Burundi 31,399 18,399 8,000 2,000 3,000 - - - - - Cameroon 24,607 24,607 - - - - - - - - Cote d'Ivoire 121,390 121,390 - - - - - - - -
Democratic Republic of the Congo 161,032 47,532 50,000 34,000 17,000 2,000 10,500 - - - Djibouti 1,800 1,800 - - - - - - - - Ethiopia 326,236 190,336 45,000 39,000 32,000 7,900 12,000 - - - Ghana 65,542 9,542 28,000 8,000 13,000 7,000 - - - - Guinea 15,500 - 10,000 2,500 3,000 - - - - - Kenya 463,541 382,141 35,000 12,000 27,400 3,000 4,000 - - - Lesotho 25,558 25,558 - - - - - - - - Liberia 31,500 3,500 12,000 9,000 7,000 - - - - - Madagascar 49,000 - 26,000 9,000 14,000 - - - - - Malawi 128,648 71,748 24,000 14,500 12,700 4,200 1,500 - - - Mali 58,199 4,349 25,000 13,650 11,000 4,200 - - - - Mozambique 317,280 249,180 29,000 16,000 13,000 5,100 5,000 - - - Namibia 60,675 60,675 - - - - - - - - Nigeria 610,425 441,225 75,000 48,000 35,200 - 11,000 - - - Rwanda 117,202 74,202 17,000 10,000 13,000 3,000 - - - - Senegal 56,935 4,535 24,000 8,500 15,400 4,500 - - - - Sierra Leone 500 500 - - - - - - - - South Africa 424,636 414,636 - - - - 10,000 - - - South Sudan 49,414 15,914 6,000 18,000 8,000 - 1,500 - - - Swaziland 41,965 41,965 - - - - - - - - Tanzania 427,173 330,038 46,000 13,135 26,800 7,200 4,000 - - - Uganda 392,295 306,195 33,000 13,000 27,900 7,200 5,000 - - - Zambia 349,050 292,175 24,000 12,275 13,000 3,600 4,000 - - -
Table 12b: Global Health Initiative - FY 2014 RequestBy Strategic Framework
35

$ in thousands Total HIV/AIDS Malaria Maternal and Child Health
Family Planning and Reproductive
HealthNutrition Tuberculosis Pandemic
Influenza
Neglected Tropical Diseases
Vulnerable Children
Table 12b: Global Health Initiative - FY 2014 RequestBy Strategic Framework
Zimbabwe 110,175 86,175 14,000 3,000 2,000 - 5,000 - - - USAID Africa Regional 13,500 - 2,500 8,000 2,000 - 1,000 - - - USAID East Africa Regional 9,600 3,600 - 1,000 4,000 - 1,000 - - - USAID Southern Africa Regional 3,600 3,600 - - - - - - - - USAID West Africa Regional 14,400 3,000 - 1,000 10,400 - - - - - East Asia and Pacific 204,367 98,367 14,000 36,500 24,000 1,000 30,500 - - - Burma 24,245 9,245 6,500 7,000 - - 1,500 - - - Cambodia 35,088 13,588 4,500 6,000 5,000 1,000 5,000 - - - China 2,398 2,398 - - - - - - - - Indonesia 40,000 8,000 - 20,000 - - 12,000 - - - Papua New Guinea 4,780 4,780 - - - - - - - - Philippines 31,500 - - 2,500 18,000 - 11,000 - - - Timor-Leste 2,000 - - 1,000 1,000 - - - - - Vietnam 53,173 53,173 - - - - - - - - USAID Regional Development Mission-Asia (RDM/A) 11,183 7,183 3,000 - - - 1,000 - - - Europe and Eurasia 31,004 23,704 - 900 1,200 - 5,200 - - - Ukraine 28,704 23,704 - - 1,000 - 4,000 - - - Europe and Eurasia Regional 2,300 - - 900 200 - 1,200 - - - Near East 9,500 - - 6,000 3,500 - - - - - Yemen 9,500 - - 6,000 3,500 - - - - - South and Central Asia 209,290 37,290 - 66,000 61,600 12,900 31,500 - - - Bangladesh 75,300 - - 30,000 28,000 5,300 12,000 - - - India 69,886 23,386 - 18,500 19,000 - 9,000 - - - Kyrgyz Republic 3,750 - - - - - 3,750 - - - Nepal 39,700 3,000 - 15,500 14,600 6,600 - - - - Tajikistan 6,750 - - 2,000 - 1,000 3,750 - - - Uzbekistan 3,000 - - - - - 3,000 - - - Central Asia Regional 10,904 10,904 - - - - - - - - Western Hemisphere 238,593 183,893 4,000 23,500 21,500 5,700 - - - - Bolivia 7,500 - - 2,500 5,000 - - - - - Brazil 1,078 1,078 - - - - - - - -
36

$ in thousands Total HIV/AIDS Malaria Maternal and Child Health
Family Planning and Reproductive
HealthNutrition Tuberculosis Pandemic
Influenza
Neglected Tropical Diseases
Vulnerable Children
Table 12b: Global Health Initiative - FY 2014 RequestBy Strategic Framework
Dominican Republic 12,644 12,644 - - - - - - - - Guatemala 14,000 - - 4,000 6,500 3,500 - - - - Guyana 5,945 5,945 - - - - - - - - Haiti 148,096 122,896 - 14,000 9,000 2,200 - - - - Barbados and Eastern Caribbean 21,058 21,058 - - - - - - - - USAID Central America Regional 20,272 20,272 - - - - - - - - USAID Latin America and Caribbean Regional 4,000 - - 3,000 1,000 - - - - - USAID South America Regional 4,000 - 4,000 - - - - - - -USAID Asia Regional 4,750 - - 2,250 2,500 - - - - -DCHA - Democracy, Conflict, and Humanitarian Assistance 13,000 - - - - - - - - 13,000 SPANS, Special Protection and Assistance Needs of Survivors 13,000 - - - - - - - - 13,000GH - Global Health 358,594 80,204 63,500 69,490 99,100 14,500 31,800 - - -GH - International Partnerships 422,345 94,045 - 175,000 2,800 2,000 16,500 47,000 85,000 - Commodity Fund 20,335 20,335 - - - - - - - - Global Alliance (GAVI) 175,000 - - 175,000 - - - - - - Int'l AIDS Vaccine Initiative (IAVI) 28,710 28,710 - - - - - - - - Iodine Deficiency Disorder (IDD) 2,000 - - - - 2,000 - - - - Microbicides 45,000 45,000 - - - - - - - -
Neglected Tropical Diseases (NTD) 85,000 - - - - - - - 85,000 - Pandemic Influenza and Other Emerging Threats 47,000 - - - - - - 47,000 - - TB Drug Facility 13,500 - - - - - 13,500 - - - MDR Financing 3,000 - - - - - 3,000 - - - New Partners Fund 2,800 - - - 2,800 - - - - -S/GAC - Office of the Global AIDS Coordinator 2,188,931 2,188,931 - - - - - - - - Additional Funding for Country Programs 227,057 227,057 - - - - - - - - International Partnerships 1,695,000 1,695,000 - - - - - - - - Oversight/Management 186,874 186,874 - - - - - - - - Technical Support//Strategic Information/Evaluation 80,000 80,000 - - - - - - - -
37

($ in thousands) FY 2014 Total DA ESF
TOTAL 119,369 107,419 11,950 Africa 51,719 42,219 9,500 Ghana 1,000 1,000 - Kenya 5,000 5,000 - Liberia 4,000 - 4,000 Mozambique 3,017 3,017 - Senegal 700 700 - South Sudan 5,500 - 5,500 Tanzania 7,000 7,000 - Uganda 4,000 4,000 - USAID Africa Regional 2,000 2,000 - USAID Central Africa Regional 12,712 12,712 - USAID East Africa Regional 1,000 1,000 - USAID Sahel Regional Program 1,000 1,000 - USAID Southern Africa Regional 2,040 2,040 - USAID West Africa Regional 2,750 2,750 - East Asia and Pacific 14,600 14,600 - Indonesia 14,600 14,600 - South and Central Asia 1,750 - 1,750 Nepal 1,500 - 1,500 State South and Central Asia Regional 250 - 250 Western Hemisphere 24,500 24,500 - Bolivia 3,000 3,000 - Ecuador 5,000 5,000 - Guatemala 3,500 3,500 - Peru 4,000 4,000 - USAID Central America Regional 500 500 - USAID Latin America and Caribbean Regional 2,000 2,000 - USAID South America Regional 6,500 6,500 -E3 - Economic Growth, Education, and Environment 14,100 14,100 -OES - Oceans and International Environmental and Scientific Affairs 700 - 700OST - Office of Science and Technology 12,000 12,000 -
Table 13a: Country/Key Interest: Biodiversity - FY 2014
38

($ in thousands) FY 2014 Total DA ESF IO&P MENA IF
TOTAL 501,355 236,584 263,351 880 540 Africa 227,458 153,054 74,404 - - Cote d'Ivoire 500 - 500 - - Democratic Republic of the Congo 11,904 - 11,904 - - Djibouti 1,384 1,384 - - - Ethiopia 20,900 20,900 - - - Ghana 26,000 26,000 - - - Kenya 11,000 11,000 - - - Liberia 26,000 - 26,000 - - Malawi 8,500 8,500 - - - Mali 15,210 15,210 - - - Mozambique 6,000 6,000 - - - Nigeria 16,000 16,000 - - - Rwanda 5,000 5,000 - - - Senegal 6,000 6,000 - - - Somalia 6,000 - 6,000 - - South Africa 4,000 4,000 - - - South Sudan 30,000 - 30,000 - - Tanzania 15,000 15,000 - - - Uganda 8,000 8,000 - - - Zambia 3,060 3,060 - - - USAID Africa Regional 7,000 7,000 - - - East Asia and Pacific 16,506 14,700 1,806 - - Burma 1,806 - 1,806 - - Indonesia 10,200 10,200 - - - Philippines 4,500 4,500 - - - Europe and Eurasia 2,968 - 2,968 - - Georgia 2,968 - 2,968 - - Near East 80,913 - 80,373 - 540 Egypt 10,486 - 10,486 - - Jordan 45,000 - 45,000 - - Lebanon 9,687 - 9,687 - -
Table 13b: Country/Key Interest: Basic Education - FY 2014
39

($ in thousands) FY 2014 Total DA ESF IO&P MENA IF
Table 13b: Country/Key Interest: Basic Education - FY 2014
Morocco 4,500 - 4,500 - - Tunisia 200 - 200 - - West Bank and Gaza 5,500 - 5,500 - - Yemen 5,000 - 5,000 - - USAID Middle East Regional (OMEP) 540 - - - 540 South and Central Asia 97,800 4,000 93,800 - - Afghanistan 55,000 - 55,000 - - Bangladesh 4,000 4,000 - - - Kyrgyz Republic 3,000 - 3,000 - - Pakistan 32,000 - 32,000 - - Tajikistan 3,800 - 3,800 - - Western Hemisphere 48,700 38,700 10,000 - - El Salvador 5,000 5,000 - - - Guatemala 9,000 9,000 - - - Haiti 10,000 - 10,000 - - Honduras 10,700 10,700 - - - Jamaica 1,000 1,000 - - - Nicaragua 2,500 2,500 - - - Peru 1,500 1,500 - - - Barbados and Eastern Caribbean 2,000 2,000 - - - USAID Latin America and Caribbean Regional 7,000 7,000 - - -USAID Asia Regional 880 880 - - -E3 - Economic Growth, Education, and Environment 25,250 25,250 - - -IO - International Organizations 880 - - 880 - IO - UNESCO/ICSECA International Contributions for Scientific, Educational, and Cultural Activities 880 - - 880 -
40
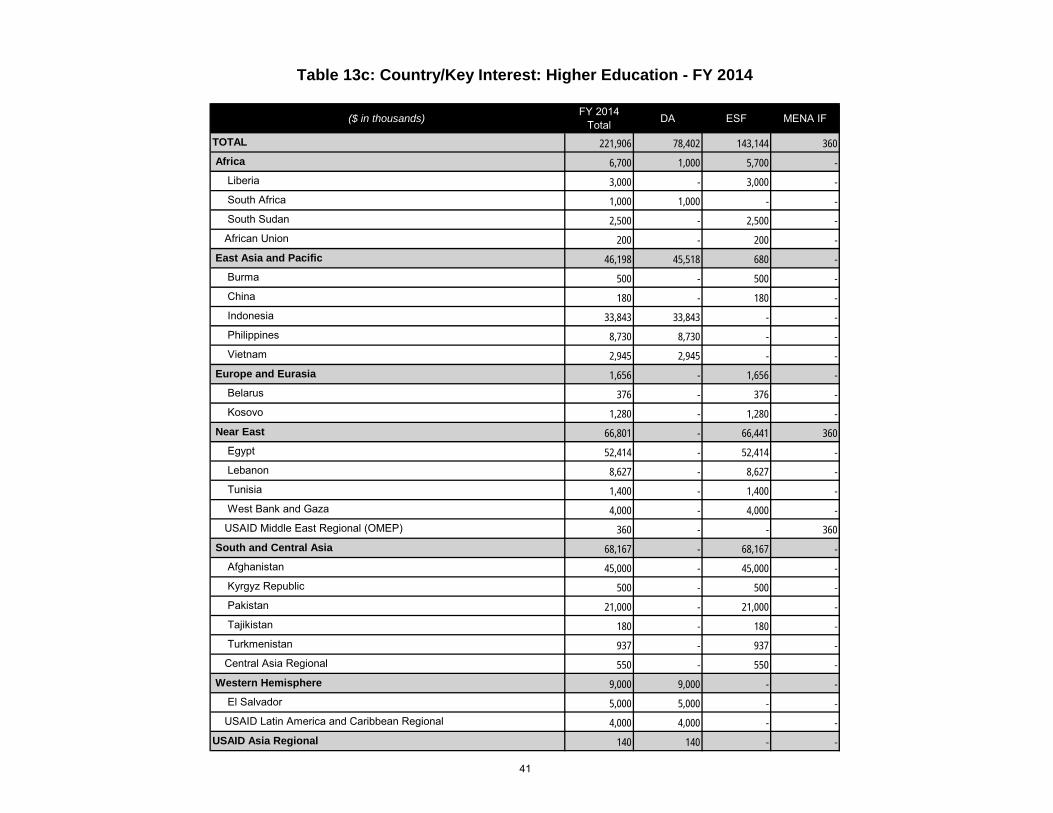
($ in thousands) FY 2014 Total DA ESF MENA IF
TOTAL 221,906 78,402 143,144 360 Africa 6,700 1,000 5,700 - Liberia 3,000 - 3,000 - South Africa 1,000 1,000 - - South Sudan 2,500 - 2,500 - African Union 200 - 200 - East Asia and Pacific 46,198 45,518 680 - Burma 500 - 500 - China 180 - 180 - Indonesia 33,843 33,843 - - Philippines 8,730 8,730 - - Vietnam 2,945 2,945 - - Europe and Eurasia 1,656 - 1,656 - Belarus 376 - 376 - Kosovo 1,280 - 1,280 - Near East 66,801 - 66,441 360 Egypt 52,414 - 52,414 - Lebanon 8,627 - 8,627 - Tunisia 1,400 - 1,400 - West Bank and Gaza 4,000 - 4,000 - USAID Middle East Regional (OMEP) 360 - - 360 South and Central Asia 68,167 - 68,167 - Afghanistan 45,000 - 45,000 - Kyrgyz Republic 500 - 500 - Pakistan 21,000 - 21,000 - Tajikistan 180 - 180 - Turkmenistan 937 - 937 - Central Asia Regional 550 - 550 - Western Hemisphere 9,000 9,000 - - El Salvador 5,000 5,000 - - USAID Latin America and Caribbean Regional 4,000 4,000 - -USAID Asia Regional 140 140 - -
Table 13c: Country/Key Interest: Higher Education - FY 2014
41

($ in thousands) FY 2014 Total DA ESF MENA IF
Table 13c: Country/Key Interest: Higher Education - FY 2014
DCHA - Democracy, Conflict, and Humanitarian Assistance 6,460 6,460 - -E3 - Economic Growth, Education, and Environment 1,384 1,384 - -
OES - Oceans and International Environmental and Scientific Affairs 500 - 500 -OST - Office of Science and Technology 14,900 14,900 - -
42

($ in thousands) FY 2014 Total DA GHP-USAID GHP-STATE ESF ESF - OCO INCLE IMET CCF MENA IF NADR
TOTAL 386,976 63,104 50,031 185,087 48,223 27,944 7,830 1,200 2,000 700 857 Africa 182,443 27,694 22,304 125,826 6,554 - 65 - - - - Angola 2,313 - 2,000 313 - - - - - - - Benin 650 - 650 - - - - - - - - Botswana 2,044 - - 2,044 - - - - - - - Burkina Faso 400 - 400 - - - - - - - - Burundi 598 - 400 198 - - - - - - - Cameroon 226 - - 226 - - - - - - - Cote d'Ivoire 4,917 - - 4,678 239 - - - - - - Democratic Republic of the Congo 4,202 - 1,774 1,441 962 - 25 - - - - Ethiopia 9,778 3,152 700 5,926 - - - - - - - Ghana 9,585 7,880 1,280 425 - - - - - - - Guinea 200 - 200 - - - - - - - - Kenya 15,063 190 - 14,873 - - - - - - - Lesotho 800 - - 800 - - - - - - - Liberia 2,185 - 585 - 1,600 - - - - - - Madagascar 850 - 850 - - - - - - - - Malawi 4,771 1,015 1,705 2,051 - - - - - - - Mali 3,450 1,140 2,310 - - - - - - - - Mozambique 10,124 1,350 600 8,174 - - - - - - - Namibia 2,952 - - 2,952 - - - - - - - Nigeria 16,810 873 500 15,437 - - - - - - - Rwanda 2,734 - - 2,734 - - - - - - - Senegal 1,100 1,100 - - - - - - - - - South Africa 21,960 260 150 21,550 - - - - - - - South Sudan 3,237 - - 397 2,800 - 40 - - - - Sudan 373 - - - 373 - - - - - - Swaziland 1,825 - - 1,825 - - - - - - - Tanzania 18,109 2,897 1,525 13,687 - - - - - - - Uganda 17,740 3,150 3,200 11,390 - - - - - - - Zambia 12,864 850 800 11,214 - - - - - - - Zimbabwe 5,686 - 1,915 3,491 280 - - - - - -
Table 13d: Country/Key Interest: Performance Evaluation - FY 2014
43

($ in thousands) FY 2014 Total DA GHP-USAID GHP-STATE ESF ESF - OCO INCLE IMET CCF MENA IF NADR
Table 13d: Country/Key Interest: Performance Evaluation - FY 2014
African Union 50 - - - 50 - - - - - - State Africa Regional (AF) 250 - - - 250 - - - - - - USAID Central Africa Regional 300 300 - - - - - - - - - USAID East Africa Regional 835 600 235 - - - - - - - - USAID Sahel Regional Program 500 500 - - - - - - - - - USAID Southern Africa Regional 585 560 25 - - - - - - - - USAID West Africa Regional 2,377 1,877 500 - - - - - - - - East Asia and Pacific 11,810 3,221 4,140 2,679 370 - - 1,200 - - 200 Burma 550 - 180 - 370 - - - - - - Cambodia 3,315 771 2,110 434 - - - - - - - China 64 - - 64 - - - - - - - Indonesia 2,408 750 250 8 - - - 1,200 - - 200 Philippines 1,600 100 1,500 - - - - - - - - Thailand 100 100 - - - - - - - - - Timor-Leste 300 300 - - - - - - - - - Vietnam 2,661 500 - 2,161 - - - - - - - USAID Regional Development Mission-Asia (RDM/A) 812 700 100 12 - - - - - - - Europe and Eurasia 6,316 - 250 475 5,572 - 19 - - - - Albania 100 - - - 100 - - - - - - Armenia 380 - - - 380 - - - - - - Azerbaijan 200 - - - 200 - - - - - - Belarus 200 - - - 200 - - - - - - Bosnia and Herzegovina 210 - - - 210 - - - - - - Georgia 1,165 - - - 1,165 - - - - - - Kosovo 300 - - - 300 - - - - - - Macedonia 142 - - - 123 - 19 - - - - Moldova 540 - - - 540 - - - - - - Serbia 500 - - - 500 - - - - - - Ukraine 1,725 - 250 475 1,000 - - - - - - Europe and Eurasia Regional 854 - - - 854 - - - - - - Near East 3,110 - - - 2,410 - - - - 700 - Egypt 1,200 - - - 1,200 - - - - - -
44

($ in thousands) FY 2014 Total DA GHP-USAID GHP-STATE ESF ESF - OCO INCLE IMET CCF MENA IF NADR
Table 13d: Country/Key Interest: Performance Evaluation - FY 2014
Jordan 1,050 - - - 1,050 - - - - - - Lebanon 160 - - - 160 - - - - - - Middle East Partnership Initiative (MEPI) 400 - - - - - - - - 400 - USAID Middle East Regional (OMEP) 300 - - - - - - - - 300 - South and Central Asia 61,307 5,618 3,269 463 24,013 27,944 - - - - - Afghanistan 43,824 - - - 16,480 27,344 - - - - - Bangladesh 6,753 5,053 1,700 - - - - - - - - India 1,866 400 1,150 116 200 - - - - - - Kazakhstan 250 - - - 250 - - - - - - Kyrgyz Republic 200 - - - 200 - - - - - - Maldives 60 60 - - - - - - - - - Nepal 2,102 - 419 - 1,683 - - - - - - Pakistan 5,200 - - - 4,600 600 - - - - - Sri Lanka 105 105 - - - - - - - - - Tajikistan 550 - - - 550 - - - - - - Uzbekistan 50 - - - 50 - - - - - - Central Asia Regional 347 - - 347 - - - - - - - Western Hemisphere 24,209 6,541 1,620 5,844 6,454 - 3,750 - - - - Brazil 300 300 - - - - - - - - - Colombia 4,200 - - - 4,200 - - - - - - Dominican Republic 1,126 500 250 376 - - - - - - - Ecuador 300 300 - - - - - - - - - El Salvador 375 375 - - - - - - - - - Guatemala 873 453 420 - - - - - - - - Guyana 311 - - 311 - - - - - - - Haiti 5,742 - - 4,742 1,000 - - - - - - Honduras 1,385 1,385 - - - - - - - - - Jamaica 250 250 - - - - - - - - - Mexico 3,854 100 - - 754 - 3,000 - - - - Paraguay 150 150 - - - - - - - - - Peru 1,328 1,328 - - - - - - - - -
45

($ in thousands) FY 2014 Total DA GHP-USAID GHP-STATE ESF ESF - OCO INCLE IMET CCF MENA IF NADR
Table 13d: Country/Key Interest: Performance Evaluation - FY 2014
Barbados and Eastern Caribbean 865 - 500 365 - - - - - - - Western Hemisphere Regional 1,250 - - - 500 - 750 - - - - Central America Regional 100 - 50 50 - - - - - - - Latin America and Caribbean Regional 1,250 1,100 150 - - - - - - - - South America Regional 550 300 250 - - - - - - - -DCHA - Democracy, Conflict, and Humanitarian Assistance 5,950 3,700 250 - - - - - 2,000 - -DRL - Democracy, Human Rights and Labor 1,500 - - - 1,500 - - - - - -E3 - Economic Growth, Education, and Environment 4,880 4,880 - - - - - - - - -GH - Global Health 18,198 - 18,198 - - - - - - - -IDEA - Office of Innovation and Development Alliances 1,100 1,100 - - - - - - - - -INL - International Narcotics and Law Enforcement Affairs 3,996 - - - - - 3,996 - - - -ISN - International Security and Nonproliferation 507 - - - - - - - - - 507OES - Oceans and International Environmental and Scientific Affairs 700 - - - 700 - - - - - -OST - Office of Science and Technology 2,850 2,850 - - - - - - - - -PM - Political-Military Affairs 150 - - - - - - - - - 150PPL - Policy, Planning and Learning 7,500 7,500 - - - - - - - - -S/GAC - Office of the Global AIDS Coordinator 49,800 - - 49,800 - - - - - - -Special Representatives 650 - - - 650 - - - - - - S/GPI - Special Representative for Global Partnerships 200 - - - 200 - - - - - - S/GWI - Ambassador-at-Large for Global Women’s Issues 450 - - - 450 - - - - - -
46

($ in thousands) FY 2014 Total DA GHP-USAID GHP-STATE ESF ESF - OCO INCLE NADR CWD IMET IO&P MRA MENA IF
TOTAL 1,909,920 316,575 471,354 371,122 512,139 108,480 49,310 100 90 7,500 15,000 58,250Gender Equality/Women's Empowerment-Primary 307,606 97,270 54,873 12,206 59,404 50,000 3,003 100 - 7,500 - 23,250 Africa 77,652 27,550 35,519 10,422 4,061 - - 100 - - - - Botswana 1,067 - - 1,067 - - - - - - - - Ethiopia 2,100 600 1,500 - - - - - - - - - Ghana 4,964 3,800 - 1,164 - - - - - - - - Lesotho 528 - - 528 - - - - - - - - Liberia 2,000 - - - 2,000 - - - - - - - Malawi 14,889 5,050 9,839 - - - - - - - - - Mali 12,700 - 12,700 - - - - - - - - - Mozambique 100 - - - - - - 100 - - - - Nigeria 7,200 7,200 - - - - - - - - - - Senegal 1,000 - 1,000 - - - - - - - - - South Africa 5,036 - 1,350 3,686 - - - - - - - - South Sudan 1,736 - 500 - 1,236 - - - - - - - Swaziland 2,425 - - 2,425 - - - - - - - - Tanzania 7,980 3,500 4,480 - - - - - - - - - Uganda 9,679 5,400 3,600 679 - - - - - - - - Zimbabwe 873 - - 873 - - - - - - - - State Africa Regional 825 - - - 825 - - - - - - - USAID East Africa Regional 550 - 550 - - - - - - - - - USAID Southern Africa Regional 1,000 1,000 - - - - - - - - - - USAID West Africa Regional 1,000 1,000 - - - - - - - - - - East Asia and Pacific 1,550 50 1,500 - - - - - - - - - Cambodia 50 50 - - - - - - - - - - Timor-Leste 1,500 - 1,500 - - - - - - - - - Europe and Eurasia 2,421 - - - 2,293 - 128 - - - - - Armenia 100 - - - 100 - - - - - - - Bosnia and Herzegovina 1,450 - - - 1,450 - - - - - - - Georgia 95 - - - 95 - - - - - - - Kosovo 528 - - - 400 - 128 - - - - - Montenegro 30 - - - 30 - - - - - - - Europe and Eurasia Regional 218 - - - 218 - - - - - - - Near East 29,900 - - - 6,650 - - - - - - 23,250 Egypt 6,500 - - - 6,500 - - - - - - - Tunisia 150 - - - 150 - - - - - - -
Table 13e: Country/Key Interest: Gender - FY 2014
47

($ in thousands) FY 2014 Total DA GHP-USAID GHP-STATE ESF ESF - OCO INCLE NADR CWD IMET IO&P MRA MENA IF
Table 13e: Country/Key Interest: Gender - FY 2014
Middle East Partnership Initiative (MEPI) 21,750 - - - - - - - - - - 21,750 USAID Middle East Regional (OMEP) 1,500 - - - - - - - - - - 1,500 South and Central Asia 110,736 22,630 7,000 456 29,950 50,000 700 - - - - - Afghanistan 74,000 - - - 25,000 49,000 - - - - - - Bangladesh 29,600 22,600 7,000 - - - - - - - - - India 291 - - 291 - - - - - - - - Maldives 130 30 - - - - 100 - - - - - Nepal 450 - - - 450 - - - - - - - Pakistan 4,500 - - - 3,500 1,000 - - - - - - Tajikistan 600 - - - - - 600 - - - - - Central Asia Regional 665 - - 165 500 - - - - - - - State South and Central Asia Regional 500 - - - 500 - - - - - - - Western Hemisphere 8,964 1,900 4,411 1,328 950 - 375 - - - - - Colombia 1,325 - - - 950 - 375 - - - - - Dominican Republic 1,180 500 - 680 - - - - - - - - Guatemala 4,195 - 4,195 - - - - - - - - - Paraguay 1,200 1,200 - - - - - - - - - - Barbados and Eastern Caribbean 588 200 - 388 - - - - - - - - USAID Central America Regional 476 - 216 260 - - - - - - - - USAID Asia Regional 300 300 - - - - - - - - - - DCHA - Democracy, Conflict, and Humanitarian Assistance 12,440 12,440 - - - - - - - - - -
DRL - Democracy, Human Rights and Labor 2,000 - - - 2,000 - - - - - - - E3 - Economic Growth, Education, and Environment 6,900 6,900 - - - - - - - - - - GH - Global Health 6,443 - 6,443 - - - - - - - - - INL - International Narcotics and Law Enforcement Affairs 1,800 - - - - - 1,800 - - - - - IO - International Organizations 7,500 - - - - - - - - 7,500 - - IO - UN Women (formerly UNIFEM) 7,500 - - - - - - - - 7,500 - -
OST - Office of Science and Technology 25,500 25,500 - - - - - - - - - - Special Representatives 13,500 - - - 13,500 - - - - - - - S/GPI - Special Representative for Global Partnerships 2,000 - - - 2,000 - - - - - - - S/GWI - Ambassador-at-Large for Global Women’s Issues 11,500 - - - 11,500 - - - - - - -
48

($ in thousands) FY 2014 Total DA GHP-USAID GHP-STATE ESF ESF - OCO INCLE NADR CWD IMET IO&P MRA MENA IF
Table 13e: Country/Key Interest: Gender - FY 2014
Gender Equality/Women's Empowerment-Secondary 1,421,022 202,819 399,213 284,856 421,577 58,480 18,987 - 90 - - 35,000 Africa 676,086 112,742 238,107 268,352 55,885 - 1,000 - - - - - Angola 13,974 - 13,489 485 - - - - - - - - Benin 5,850 - 5,850 - - - - - - - - - Botswana 2,677 - - 2,677 - - - - - - - - Burkina Faso 5,600 - 5,600 - - - - - - - - - Burundi 6,301 - 2,300 4,001 - - - - - - - - Cameroon 7,558 - - 7,558 - - - - - - - - Cote d'Ivoire 7,798 - - 7,678 120 - - - - - - - Democratic Republic of the Congo 27,022 - 8,500 9,522 8,000 - 1,000 - - - - - Djibouti 300 300 - - - - - - - - - - Ethiopia 20,499 9,009 980 10,510 - - - - - - - - Ghana 18,501 9,400 8,500 601 - - - - - - - - Guinea 2,800 1,300 1,500 - - - - - - - - - Kenya 81,846 34,100 26,000 21,746 - - - - - - - - Lesotho 4,404 - - 4,404 - - - - - - - - Liberia 42,686 - 16,550 - 26,136 - - - - - - - Madagascar 2,044 - 2,044 - - - - - - - - - Malawi 11,838 1,000 750 10,088 - - - - - - - - Mali 13,070 6,570 6,500 - - - - - - - - - Mozambique 24,988 2,000 - 22,988 - - - - - - - - Namibia 4,626 - - 4,626 - - - - - - - - Niger 200 200 - - - - - - - - - - Nigeria 76,980 6,825 35,500 34,655 - - - - - - - - Rwanda 14,649 4,850 3,750 6,049 - - - - - - - - Senegal 21,900 4,000 17,900 - - - - - - - - - South Africa 31,083 - - 31,083 - - - - - - - - South Sudan 20,893 - 3,000 1,043 16,850 - - - - - - - Sudan 2,579 - - - 2,579 - - - - - - - Swaziland 5,024 - - 5,024 - - - - - - - - Tanzania 70,661 12,780 29,520 28,361 - - - - - - - - Uganda 31,613 3,300 2,400 25,913 - - - - - - - - Zambia 51,305 3,450 25,375 22,480 - - - - - - - - Zimbabwe 26,810 - 17,750 6,860 2,200 - - - - - - - USAID Africa Regional 100 100 - - - - - - - - - - USAID Central Africa Regional 4,528 4,528 - - - - - - - - - -
49

($ in thousands) FY 2014 Total DA GHP-USAID GHP-STATE ESF ESF - OCO INCLE NADR CWD IMET IO&P MRA MENA IF
Table 13e: Country/Key Interest: Gender - FY 2014
USAID East Africa Regional 4,889 2,700 2,189 - - - - - - - - - USAID Sahel Regional Program 4,000 4,000 - - - - - - - - - - USAID West Africa Regional 4,490 2,330 2,160 - - - - - - - - - East Asia and Pacific 79,481 19,200 27,399 2,349 30,533 - - - - - - - Burma 38,400 - 11,500 - 26,900 - - - - - - - Cambodia 10,292 5,775 3,800 717 - - - - - - - - China 75 - - 75 - - - - - - - - Indonesia 14,700 11,700 3,000 - - - - - - - - - Papua New Guinea 500 - - 500 - - - - - - - - Philippines 3,309 - 3,309 - - - - - - - - - Vietnam 1,057 - - 1,057 - - - - - - - - State East Asia and Pacific Regional 1,633 - - - 1,633 - - - - - - - USAID Regional Development Mission-Asia (RDM/A) 9,515 1,725 5,790 - 2,000 - - - - - - - Europe and Eurasia 14,889 - 500 - 14,092 - 297 - - - - - Albania 610 - - - 510 - 100 - - - - - Armenia 608 - - - 500 - 108 - - - - - Azerbaijan 250 - - - 250 - - - - - - - Belarus 1,000 - - - 1,000 - - - - - - - Bosnia and Herzegovina 6,259 - - - 6,170 - 89 - - - - - Georgia 1,595 - - - 1,595 - - - - - - - Kosovo 2,577 - - - 2,577 - - - - - - - Macedonia 30 - - - 30 - - - - - - - Moldova 240 - - - 240 - - - - - - - Montenegro 20 - - - 20 - - - - - - - Serbia 200 - - - 200 - - - - - - - Ukraine 1,500 - 500 - 1,000 - - - - - - - Near East 96,900 - - - 61,900 - - - - - - 35,000 Egypt 24,250 - - - 24,250 - - - - - - - Iraq 9,000 - - - 9,000 - - - - - - - Jordan 26,000 - - - 26,000 - - - - - - - Morocco 2,650 - - - 2,650 - - - - - - - Middle East Partnership Initiative (MEPI) 35,000 - - - - - - - - - - 35,000 South and Central Asia 330,291 5,770 32,392 2,474 228,135 58,480 2,950 - 90 - - - Afghanistan 197,720 - - - 142,070 55,650 - - - - - - Bangladesh 2,270 2,270 - - - - - - - - - - India 24,974 2,500 19,000 2,474 1,000 - - - - - - -
50

($ in thousands) FY 2014 Total DA GHP-USAID GHP-STATE ESF ESF - OCO INCLE NADR CWD IMET IO&P MRA MENA IF
Table 13e: Country/Key Interest: Gender - FY 2014
Kazakhstan 250 - - - 250 - - - - - - - Kyrgyz Republic 2,100 - - - 1,300 - 800 - - - - - Maldives 100 100 - - - - - - - - - - Nepal 29,277 - 13,392 - 15,795 - - - 90 - - - Pakistan 70,350 - - - 67,520 2,830 - - - - - - Sri Lanka 700 700 - - - - - - - - - - Tajikistan 2,150 - - - - - 2,150 - - - - - Uzbekistan 200 - - - 200 - - - - - - - USAID South Asia Regional 200 200 - - - - - - - - - - Western Hemisphere 77,343 24,607 4,233 11,681 24,582 - 12,240 - - - - - Bolivia 2,000 500 1,500 - - - - - - - - - Brazil 200 200 - - - - - - - - - - Colombia 7,675 - - - 7,675 - - - - - - - Dominican Republic 1,133 450 300 383 - - - - - - - - Ecuador 1,125 1,125 - - - - - - - - - - El Salvador 3,872 3,872 - - - - - - - - - - Guatemala 4,310 4,310 - - - - - - - - - - Guyana 597 - - 597 - - - - - - - - Haiti 19,834 - 283 10,701 7,850 - 1,000 - - - - - Honduras 5,100 5,100 - - - - - - - - - - Jamaica 500 500 - - - - - - - - - - Mexico 3,650 400 - - 3,250 - - - - - - - Peru 9,940 3,700 - - - - 6,240 - - - - - Venezuela 200 - - - 200 - - - - - - - Barbados and Eastern Caribbean 950 - 950 - - - - - - - - - State Western Hemisphere Regional 10,607 - - - 5,607 - 5,000 - - - - - USAID Central America Regional 300 300 - - - - - - - - - - USAID Latin America and Caribbean Regional 3,350 2,650 700 - - - - - - - - - USAID South America Regional 2,000 1,500 500 - - - - - - - - - USAID Asia Regional 400 400 - - - - - - - - - - DCHA - Democracy, Conflict, and Humanitarian Assistance 24,500 19,500 5,000 - - - - - - - - - DRL - Democracy, Human Rights and Labor 4,000 - - - 4,000 - - - - - - - E3 - Economic Growth, Education, and Environment 9,900 9,900 - - - - - - - - - - GH - Global Health 91,582 - 91,582 - - - - - - - - - IDEA - Office of Innovation and Development Alliances 1,000 1,000 - - - - - - - - - -
51

($ in thousands) FY 2014 Total DA GHP-USAID GHP-STATE ESF ESF - OCO INCLE NADR CWD IMET IO&P MRA MENA IF
Table 13e: Country/Key Interest: Gender - FY 2014
INL - International Narcotics and Law Enforcement Affairs 2,500 - - - - - 2,500 - - - - - OES - Oceans and International Environmental and Scientific Affairs 2,050 - - - 2,050 - - - - - - - OST - Office of Science and Technology 9,700 9,700 - - - - - - - - - - Special Representatives 400 - - - 400 - - - - - - - S/SRMC - Special Representative to Muslim Communities 400 - - - 400 - - - - - - -
Gender-Based Violence 181,292 16,486 17,268 74,060 31,158 - 27,320 - - - 15,000 - Africa 89,049 1,900 9,276 66,878 10,565 - 430 - - - - - Angola 2,231 - - 2,231 - - - - - - - - Botswana 613 - - 613 - - - - - - - - Burundi 870 - 700 170 - - - - - - - - Cameroon 141 - - 141 - - - - - - - - Cote d'Ivoire 2,285 - - 2,285 - - - - - - - - Democratic Republic of the Congo 11,557 - - 5,074 6,483 - - - - - - - Ethiopia 3,043 400 - 2,643 - - - - - - - - Ghana 1,980 - 1,000 980 - - - - - - - - Guinea 300 - 300 - - - - - - - - - Kenya 4,780 - - 4,780 - - - - - - - - Lesotho 176 - - 176 - - - - - - - - Liberia 1,630 - - - 1,200 - 430 - - - - - Malawi 7,467 - 3,451 4,016 - - - - - - - - Mali 1,000 - 1,000 - - - - - - - - - Mozambique 8,680 - - 8,680 - - - - - - - - Namibia 2,598 - - 2,598 - - - - - - - - Nigeria 796 - - 796 - - - - - - - - Rwanda 2,302 - 1,075 1,227 - - - - - - - - Senegal 1,250 500 750 - - - - - - - - - South Africa 9,248 500 - 8,748 - - - - - - - - South Sudan 1,829 - 500 372 957 - - - - - - - Swaziland 389 - - 389 - - - - - - - - Tanzania 8,961 - - 8,961 - - - - - - - - Uganda 2,777 - - 2,777 - - - - - - - - Zambia 8,663 - - 8,663 - - - - - - - - Zimbabwe 558 - - 558 - - - - - - - - State Africa Regional 1,925 - - - 1,925 - - - - - - -
52

($ in thousands) FY 2014 Total DA GHP-USAID GHP-STATE ESF ESF - OCO INCLE NADR CWD IMET IO&P MRA MENA IF
Table 13e: Country/Key Interest: Gender - FY 2014
USAID Africa Regional 500 500 - - - - - - - - - - USAID East Africa Regional 500 - 500 - - - - - - - - - East Asia and Pacific 938 150 100 524 144 - 20 - - - - - Cambodia 560 50 100 410 - - - - - - - - Papua New Guinea 114 - - 114 - - - - - - - - Timor-Leste 120 100 - - - - 20 - - - - - State East Asia and Pacific Regional 144 - - - 144 - - - - - - - Europe and Eurasia 1,229 - - 513 356 - 360 - - - - - Bosnia and Herzegovina 160 - - - 100 - 60 - - - - - Georgia 500 - - - 200 - 300 - - - - - Montenegro 20 - - - 20 - - - - - - - Ukraine 513 - - 513 - - - - - - - - Europe and Eurasia Regional 36 - - - 36 - - - - - - - Near East 1,900 - - - 1,900 - - - - - - - Egypt 1,000 - - - 1,000 - - - - - - - Jordan 900 - - - 900 - - - - - - - South and Central Asia 28,934 2,950 940 194 250 - 24,600 - - - - - Afghanistan 24,000 - - - - - 24,000 - - - - - Bangladesh 2,500 2,200 - - - - 300 - - - - - India 694 - 500 194 - - - - - - - - Kyrgyz Republic 100 - - - 100 - - - - - - - Nepal 890 - 440 - 150 - 300 - - - - - Sri Lanka 750 750 - - - - - - - - - - Western Hemisphere 21,986 3,140 1,952 5,951 9,443 - 1,500 - - - - - Bolivia 675 300 375 - - - - - - - - - Colombia 1,353 - - - 853 - 500 - - - - - Dominican Republic 1,768 750 1,000 18 - - - - - - - - El Salvador 690 690 - - - - - - - - - - Guatemala 1,100 1,100 - - - - - - - - - - Guyana 1,075 - - 1,075 - - - - - - - - Haiti 5,592 - - 4,122 1,470 - - - - - - - Mexico 4,000 - - - 3,000 - 1,000 - - - - - Barbados and Eastern Caribbean 781 300 200 281 - - - - - - - - State Western Hemisphere Regional 4,120 - - - 4,120 - - - - - - - USAID Central America Regional 832 - 377 455 - - - - - - - - USAID Asia Regional 200 200 - - - - - - - - - -
53

($ in thousands) FY 2014 Total DA GHP-USAID GHP-STATE ESF ESF - OCO INCLE NADR CWD IMET IO&P MRA MENA IF
Table 13e: Country/Key Interest: Gender - FY 2014
DCHA - Democracy, Conflict, and Humanitarian Assistance 5,500 3,000 2,500 - - - - - - - - - E3 - Economic Growth, Education, and Environment 3,146 3,146 - - - - - - - - - - GH - Global Health 2,500 - 2,500 - - - - - - - - - INL - International Narcotics and Law Enforcement Affairs 410 - - - - - 410 - - - - - OST - Office of Science and Technology 2,000 2,000 - - - - - - - - - -
PRM - Population, Refugees, and Migration 15,000 - - - - - - - - - 15,000 - Special Representatives 8,500 - - - 8,500 - - - - - - - S/GWI - Ambassador-at-Large for Global Women’s Issues 8,500 - - - 8,500 - - - - - - -
54

($ in thousands) FY 2014 Total GHP-USAID ESF IO&P MENA IF
TOTAL 635,356 534,000 63,356 37,000 1,000 Africa 317,800 317,800 - - - Angola 4,000 4,000 - - - Benin 3,000 3,000 - - - Burundi 3,000 3,000 - - - Democratic Republic of the Congo 17,000 17,000 - - - Ethiopia 32,000 32,000 - - - Ghana 13,000 13,000 - - - Guinea 3,000 3,000 - - - Kenya 27,400 27,400 - - - Liberia 7,000 7,000 - - - Madagascar 14,000 14,000 - - - Malawi 12,700 12,700 - - - Mali 11,000 11,000 - - - Mozambique 13,000 13,000 - - - Nigeria 35,200 35,200 - - - Rwanda 13,000 13,000 - - - Senegal 15,400 15,400 - - - South Sudan 8,000 8,000 - - - Tanzania 26,800 26,800 - - - Uganda 27,900 27,900 - - - Zambia 13,000 13,000 - - - Zimbabwe 2,000 2,000 - - - USAID Africa Regional 2,000 2,000 - - - USAID East Africa Regional 4,000 4,000 - - - USAID West Africa Regional 10,400 10,400 - - - East Asia and Pacific 24,000 24,000 - - - Cambodia 5,000 5,000 - - - Philippines 18,000 18,000 - - - Timor-Leste 1,000 1,000 - - - Europe and Eurasia 1,200 1,200 - - - Ukraine 1,000 1,000 - - -
Table 13f: Country/Key Interest: Family Planning and Reproductive Health - FY 2014
55

($ in thousands) FY 2014 Total GHP-USAID ESF IO&P MENA IF
Table 13f: Country/Key Interest: Family Planning and Reproductive Health - FY 2014
Europe and Eurasia Regional 200 200 - - - Near East 29,556 3,500 25,056 - 1,000 Egypt 4,056 - 4,056 - - Jordan 21,000 - 21,000 - - Yemen 3,500 3,500 - - - USAID Middle East Regional (OMEP) 1,000 - - - 1,000 South and Central Asia 99,900 61,600 38,300 - - Afghanistan 18,000 - 18,000 - - Bangladesh 28,000 28,000 - - - India 19,000 19,000 - - - Nepal 14,600 14,600 - - - Pakistan 20,300 - 20,300 - - Western Hemisphere 21,500 21,500 - - - Bolivia 5,000 5,000 - - - Guatemala 6,500 6,500 - - - Haiti 9,000 9,000 - - - USAID Latin America and Caribbean Regional 1,000 1,000 - - -USAID Asia Regional 2,500 2,500 - - -GH - Global Health 99,100 99,100 - - -GH - International Partnerships 2,800 2,800 - - - GH/IP – New Partners Fund 2,800 2,800 - - -IO - International Organizations 37,000 - - 37,000 - IO - UNFPA UN Population Fund 37,000 - - 37,000 -
56

($ in thousands) FY 2014 Total GHP-USAID GHP-STATE ESF
TOTAL 6,000,250 330,000 5,670,000 250 Africa 3,293,566 87,910 3,205,656 - Angola 15,338 4,400 10,938 - Botswana 49,711 - 49,711 - Burundi 18,399 3,500 14,899 - Cameroon 24,607 1,500 23,107 - Cote d'Ivoire 121,390 - 121,390 - Democratic Republic of the Congo 47,532 9,200 38,332 - Djibouti 1,800 - 1,800 - Ethiopia 190,336 - 190,336 - Ghana 9,542 5,500 4,042 - Kenya 382,141 - 382,141 - Lesotho 25,558 6,400 19,158 - Liberia 3,500 2,700 800 - Malawi 71,748 15,500 56,248 - Mali 4,349 3,000 1,349 - Mozambique 249,180 - 249,180 - Namibia 60,675 - 60,675 - Nigeria 441,225 - 441,225 - Rwanda 74,202 - 74,202 - Senegal 4,535 3,000 1,535 - Sierra Leone 500 - 500 - South Africa 414,636 - 414,636 - South Sudan 15,914 2,010 13,904 - Swaziland 41,965 6,900 35,065 - Tanzania 330,038 - 330,038 - Uganda 306,195 - 306,195 - Zambia 292,175 - 292,175 - Zimbabwe 86,175 16,500 69,675 - USAID East Africa Regional 3,600 2,800 800 - USAID Southern Africa Regional 3,600 2,000 1,600 - USAID West Africa Regional 3,000 3,000 - -
Table 13g: Country/Key Interest: HIV / AIDS - FY2014
57

($ in thousands) FY 2014 Total GHP-USAID GHP-STATE ESF
Table 13g: Country/Key Interest: HIV / AIDS - FY2014
East Asia and Pacific 98,367 25,250 73,117 - Burma 9,245 1,000 8,245 - Cambodia 13,588 9,000 4,588 - China 2,398 - 2,398 - Indonesia 8,000 7,750 250 - Papua New Guinea 4,780 2,500 2,280 - Vietnam 53,173 - 53,173 - USAID Regional Development Mission-Asia (RDM/A) 7,183 5,000 2,183 - Europe and Eurasia 23,704 2,500 21,204 - Ukraine 23,704 2,500 21,204 - South and Central Asia 37,540 19,000 18,290 250 Afghanistan 250 - - 250 India 23,386 15,000 8,386 - Nepal 3,000 3,000 - - Central Asia Regional 10,904 1,000 9,904 - Western Hemisphere 183,893 21,091 162,802 - Brazil 1,078 - 1,078 - Dominican Republic 12,644 5,750 6,894 - Guyana 5,945 - 5,945 - Haiti 122,896 - 122,896 - Barbados and Eastern Caribbean 21,058 6,950 14,108 - USAID Central America Regional 20,272 8,391 11,881 -GH - Global Health 80,204 80,204 - -GH - International Partnerships 94,045 94,045 - - GH/IP - Commodity Fund 20,335 20,335 - - GH/IP - International AIDS Vaccine Initiative (IAVI) 28,710 28,710 - - GH/IP - Microbicides 45,000 45,000 - -S/GAC - Office of the Global AIDS Coordinator 2,188,931 - 2,188,931 - S/GAC, Additional Funding for Country Programs 227,057 - 227,057 - S/GAC, International Partnerships 1,695,000 - 1,695,000 - S/GAC, Oversight/Management 186,874 - 186,874 - S/GAC, Technical Support//Strategic Information/Evaluation 80,000 - 80,000 -
58

($ in thousands) FY 2014 Total GHP-USAID
TOTAL 670,000 670,000 Africa 588,500 588,500 Angola 29,000 29,000 Benin 17,000 17,000 Burkina Faso 9,000 9,000 Burundi 8,000 8,000 Democratic Republic of the Congo 50,000 50,000 Ethiopia 45,000 45,000 Ghana 28,000 28,000 Guinea 10,000 10,000 Kenya 35,000 35,000 Liberia 12,000 12,000 Madagascar 26,000 26,000 Malawi 24,000 24,000 Mali 25,000 25,000 Mozambique 29,000 29,000 Nigeria 75,000 75,000 Rwanda 17,000 17,000 Senegal 24,000 24,000 South Sudan 6,000 6,000 Tanzania 46,000 46,000 Uganda 33,000 33,000 Zambia 24,000 24,000 Zimbabwe 14,000 14,000 USAID Africa Regional 2,500 2,500 East Asia and Pacific 14,000 14,000 Burma 6,500 6,500 Cambodia 4,500 4,500 USAID Regional Development Mission-Asia (RDM/A) 3,000 3,000 Western Hemisphere 4,000 4,000 USAID South America Regional 4,000 4,000GH - Global Health 63,500 63,500
Table 13h: Country/Key Interest: Malaria - FY 2014
59

($ in thousands) FY 2014 Total GHP-USAID ESF IO&P MENA IF
TOTAL 952,936 680,000 147,436 125,000 500 Africa 300,360 300,360 - - - Angola 1,300 1,300 - - - Benin 3,500 3,500 - - - Burundi 2,000 2,000 - - - Democratic Republic of the Congo 34,000 34,000 - - - Ethiopia 39,000 39,000 - - - Ghana 8,000 8,000 - - - Guinea 2,500 2,500 - - - Kenya 12,000 12,000 - - - Liberia 9,000 9,000 - - - Madagascar 9,000 9,000 - - - Malawi 14,500 14,500 - - - Mali 13,650 13,650 - - - Mozambique 16,000 16,000 - - - Nigeria 48,000 48,000 - - - Rwanda 10,000 10,000 - - - Senegal 8,500 8,500 - - - South Sudan 18,000 18,000 - - - Tanzania 13,135 13,135 - - - Uganda 13,000 13,000 - - - Zambia 12,275 12,275 - - - Zimbabwe 3,000 3,000 - - - USAID Africa Regional (AFR) 8,000 8,000 - - - USAID East Africa Regional 1,000 1,000 - - - USAID West Africa Regional 1,000 1,000 - - - East Asia and Pacific 36,500 36,500 - - - Burma 7,000 7,000 - - - Cambodia 6,000 6,000 - - - Indonesia 20,000 20,000 - - - Philippines 2,500 2,500 - - - Timor-Leste 1,000 1,000 - - -
Table 13i: Country/Key Interest: Maternal and Child Health - FY 2014
60

($ in thousands) FY 2014 Total GHP-USAID ESF IO&P MENA IF
Table 13i: Country/Key Interest: Maternal and Child Health - FY 2014
Europe and Eurasia 900 900 - - - Europe and Eurasia Regional 900 900 - - - Near East 26,486 6,000 19,986 - 500 Egypt 4,986 - 4,986 - - Jordan 15,000 - 15,000 - - Yemen 6,000 6,000 - - - USAID Middle East Regional (OMEP) 500 - - - 500 South and Central Asia 193,450 66,000 127,450 - - Afghanistan 89,750 - 89,750 - - Bangladesh 30,000 30,000 - - - India 18,500 18,500 - - - Nepal 15,500 15,500 - - - Pakistan 37,700 - 37,700 - - Tajikistan 2,000 2,000 - - - Western Hemisphere 23,500 23,500 - - - Bolivia 2,500 2,500 - - - Guatemala 4,000 4,000 - - - Haiti 14,000 14,000 - - - USAID Latin America and Caribbean Regional 3,000 3,000 - - -USAID Asia Regional 2,250 2,250 - - -GH - Global Health 69,490 69,490 - - -GH - International Partnerships 175,000 175,000 - - - GH/IP - Global Alliance for Vaccine Immunization (GAVI) 175,000 175,000 - - -IO - International Organizations 125,000 - - 125,000 - IO - UNICEF UN Children's Fund 125,000 - - 125,000 -
61

($ in thousands) FY 2014 Total DA GHP-USAID ESF
TOTAL 115,364 6,460 85,000 23,904 Near East 16,404 - - 16,404 Egypt 3,404 - - 3,404 West Bank and Gaza 13,000 - - 13,000 South and Central Asia 7,500 - - 7,500 Afghanistan 7,500 - - 7,500
DCHA - Democracy, Conflict, and Humanitarian Assistance 6,460 6,460 - - DCHA/ASHA 6,460 6,460 - -GH - International Partnerships 85,000 - 85,000 - GH/IP - Neglected Tropical Diseases (NTD) 85,000 - 85,000 -
Table 13j: Country/Key Interest: Tropical Diseases & Other Public Health Threats - FY 2014
62

($ in thousands) FY 2014 Total GHP-USAID ESF
TOTAL 99,554 95,000 4,554 Africa 58,900 58,900 - Democratic Republic of the Congo 2,000 2,000 - Ethiopia 7,900 7,900 - Ghana 7,000 7,000 - Kenya 3,000 3,000 - Malawi 4,200 4,200 - Mali 4,200 4,200 - Mozambique 5,100 5,100 - Rwanda 3,000 3,000 - Senegal 4,500 4,500 - Tanzania 7,200 7,200 - Uganda 7,200 7,200 - Zambia 3,600 3,600 - East Asia and Pacific 1,000 1,000 - Cambodia 1,000 1,000 - Near East 2,554 - 2,554 Egypt 2,554 - 2,554 South and Central Asia 14,900 12,900 2,000 Afghanistan 2,000 - 2,000 Bangladesh 5,300 5,300 - Nepal 6,600 6,600 - Tajikistan 1,000 1,000 - Western Hemisphere 5,700 5,700 - Guatemala 3,500 3,500 - Haiti 2,200 2,200 -GH - Global Health 14,500 14,500 -GH - International Partnerships 2,000 2,000 - GH/IP - Iodine Deficiency Disorder (IDD) 2,000 2,000 -
Table 13k: Country/Key Interest: Nutrition - FY2014
63

($ in thousands) FY 2014 Total GHP-USAID ESF
TOTAL 47,150 47,000 150GH - International Partnerships 47,000 47,000 - GH/IP - Pandemic Influenza and Other Emerging Threats 47,000 47,000 -OES - Oceans and International Environmental and Scientific Affairs 150 - 150 OES/OESP OES Partnerships 150 - 150
Table 13l: Country/Key Interest: Pandemic Influenza and Other Emerging Threats - FY 2014
64

($ in thousands) FY 2014 Total GHP-USAID ESF
TOTAL 35,590 32,090 3,500 Africa 14,290 14,290 - Angola 1,300 1,300 - Benin 100 100 - Democratic Republic of the Congo 3,000 3,000 - Ethiopia 1,900 1,900 - Guinea 180 180 - Kenya 80 80 - Liberia 150 150 - Mali 60 60 - Mozambique 100 100 - Nigeria 3,000 3,000 - Rwanda 50 50 - South Sudan 2,000 2,000 - Uganda 70 70 - USAID Africa Regional (AFR) 1,700 1,700 - USAID West Africa Regional 600 600 - East Asia and Pacific 800 800 - Indonesia 800 800 - South and Central Asia 10,500 7,000 3,500 Afghanistan 1,000 - 1,000 India 6,000 6,000 - Nepal 1,000 1,000 - Pakistan 2,500 - 2,500GH - Global Health 10,000 10,000 -
Table 13m: Country/Key Interest: Polio
65

($ in thousands) FY 2014 Total GHP-USAID ESF
TOTAL 198,500 191,000 7,500 Africa 75,500 75,500 - Democratic Republic of the Congo 10,500 10,500 - Ethiopia 12,000 12,000 - Kenya 4,000 4,000 - Malawi 1,500 1,500 - Mozambique 5,000 5,000 - Nigeria 11,000 11,000 - South Africa 10,000 10,000 - South Sudan 1,500 1,500 - Tanzania 4,000 4,000 - Uganda 5,000 5,000 - Zambia 4,000 4,000 - Zimbabwe 5,000 5,000 - USAID Africa Regional (AFR) 1,000 1,000 - USAID East Africa Regional 1,000 1,000 - East Asia and Pacific 30,500 30,500 - Burma 1,500 1,500 - Cambodia 5,000 5,000 - Indonesia 12,000 12,000 - Philippines 11,000 11,000 - USAID Regional Development Mission-Asia (RDM/A) 1,000 1,000 - Europe and Eurasia 5,200 5,200 - Ukraine 4,000 4,000 - Europe and Eurasia Regional 1,200 1,200 - South and Central Asia 39,000 31,500 7,500 Afghanistan 7,500 - 7,500 Bangladesh 12,000 12,000 - India 9,000 9,000 - Kyrgyz Republic 3,750 3,750 - Tajikistan 3,750 3,750 - Uzbekistan 3,000 3,000 -GH - Global Health 31,800 31,800 -
Table 13n: Country/Key Interest: Tuberculosis - FY 2014
66

($ in thousands) FY 2014 Total GHP-USAID ESF
Table 13n: Country/Key Interest: Tuberculosis - FY 2014
GH - International Partnerships 16,500 16,500 - GH/IP - TB Drug Facility 13,500 13,500 - GH/IP – MDR Financing 3,000 3,000 -
67

($ in thousands) FY 2014 Total DA GHP-USAID ESF ESF - OCO
TOTAL 173,025 72,459 1,750 96,716 2,100 Africa 62,625 42,175 1,750 18,700 - Democratic Republic of the Congo 2,500 - - 2,500 - Kenya 5,000 5,000 - - - Liberia 9,200 - - 9,200 - Mali 500 500 - - - Mozambique 12,425 12,425 - - - Rwanda 5,000 5,000 - - - South Sudan 7,000 - - 7,000 - Tanzania 12,000 12,000 - - - Uganda 7,000 5,250 1,750 - - Zambia 2,000 2,000 - - - Europe and Eurasia 6,816 - - 6,816 - Azerbaijan 300 - - 300 - Bosnia and Herzegovina 2,000 - - 2,000 - Georgia 1,000 - - 1,000 - Kosovo 400 - - 400 - Moldova 1,150 - - 1,150 - Ukraine 466 - - 466 - Europe and Eurasia Regional 1,500 - - 1,500 - Near East 2,700 - - 2,700 - Jordan 500 - - 500 - Lebanon 2,000 - - 2,000 - Tunisia 200 - - 200 - South and Central Asia 47,450 - - 45,350 2,100 Afghanistan 25,000 - - 25,000 - Kazakhstan 350 - - 350 - Kyrgyz Republic 5,000 - - 5,000 - Nepal 500 - - 500 - Pakistan 16,600 - - 14,500 2,100 Western Hemisphere 29,550 8,400 - 21,150 - Colombia 12,000 - - 12,000 -
13o: Country/Key Interest: Microenterprise - FY 2014
68

($ in thousands) FY 2014 Total DA GHP-USAID ESF ESF - OCO
13o: Country/Key Interest: Microenterprise - FY 2014
Haiti 8,350 - - 8,350 - Peru 8,000 8,000 - - - Barbados and Eastern Caribbean 400 400 - - - State Western Hemisphere Regional 800 - - 800 -E3 - Economic Growth, Education, and Environment 3,584 3,584 - - -IDEA - Office of Innovation and Development Alliances 1,800 1,800 - - -OST - Office of Science and Technology 16,500 16,500 - - -Special Representatives 2,000 - - 2,000 - S/GPI - Special Representative for Global Partnerships 2,000 - - 2,000 -
69
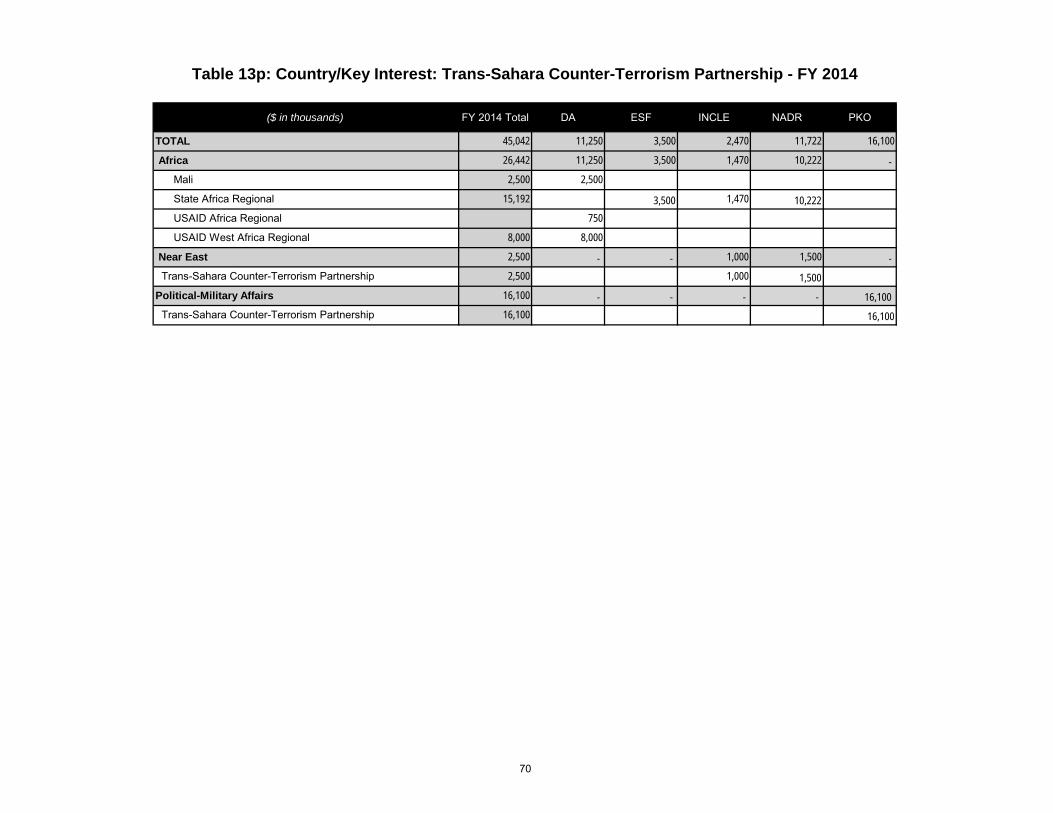
($ in thousands) FY 2014 Total DA ESF INCLE NADR PKO
TOTAL 45,042 11,250 3,500 2,470 11,722 16,100
Africa 26,442 11,250 3,500 1,470 10,222 - Mali 2,500 2,500
State Africa Regional 15,192 3,500 1,470 10,222 USAID Africa Regional 750
USAID West Africa Regional 8,000 8,000
Near East 2,500 - - 1,000 1,500 - Trans-Sahara Counter-Terrorism Partnership 2,500 1,000 1,500Political-Military Affairs 16,100 - - - - 16,100 Trans-Sahara Counter-Terrorism Partnership 16,100 16,100
Table 13p: Country/Key Interest: Trans-Sahara Counter-Terrorism Partnership - FY 2014
70

($ in thousands) FY 2014 Total DA GHP-USAID GHP-STATE ESF ESF - OCO INCLE MENA IF
TOTAL 564,403 288,758 124,552 49,914 89,679 400 10,100 1,000Science, Technology & Innovation - Focused 325,510 169,178 70,084 49,800 36,448 - - - Africa 28,888 17,750 10,138 - 1,000 - - - Ghana 2,600 2,500 100 - - - - - Kenya 5,000 5,000 - - - - - - Liberia 1,000 - - - 1,000 - - - Malawi 8,888 250 8,638 - - - - - Mali 2,000 2,000 - - - - - - Mozambique 4,000 4,000 - - - - - - Senegal 2,900 1,500 1,400 - - - - - Tanzania 1,500 1,500 - - - - - - Zambia 1,000 1,000 - - - - - - East Asia and Pacific 3,098 3,000 - - 98 - - - Philippines 3,000 3,000 - - - - - - State East Asia and Pacific Regional 98 - - - 98 - - - Near East 14,500 - - - 14,500 - - - Egypt 12,500 - - - 12,500 - - - Tunisia 2,000 - - - 2,000 - - - South and Central Asia 51,050 19,400 13,800 - 17,850 - - - Bangladesh 32,200 19,100 13,100 - - - - - Maldives 300 300 - - - - - - Nepal 2,300 - 700 - 1,600 - - - Pakistan 16,000 - - - 16,000 - - - State South and Central Asia Regional 250 - - - 250 - - - Western Hemisphere 9,500 6,500 - - 3,000 - - - Colombia 3,000 - - - 3,000 - - - Ecuador 500 500 - - - - - - Honduras 500 500 - - - - - - Barbados and Eastern Caribbean 5,500 5,500 - - - - - - E3 - Economic Growth, Education, and Environment 6,000 6,000 - - - - - - GH - Global Health 46,146 - 46,146 - - - - - IDEA - Office of Innovation and Development Alliances 31,528 31,528 - - - - - -
Table 13q: Country/Key Interest: Science, Technology, & Innovation - FY 2014
71
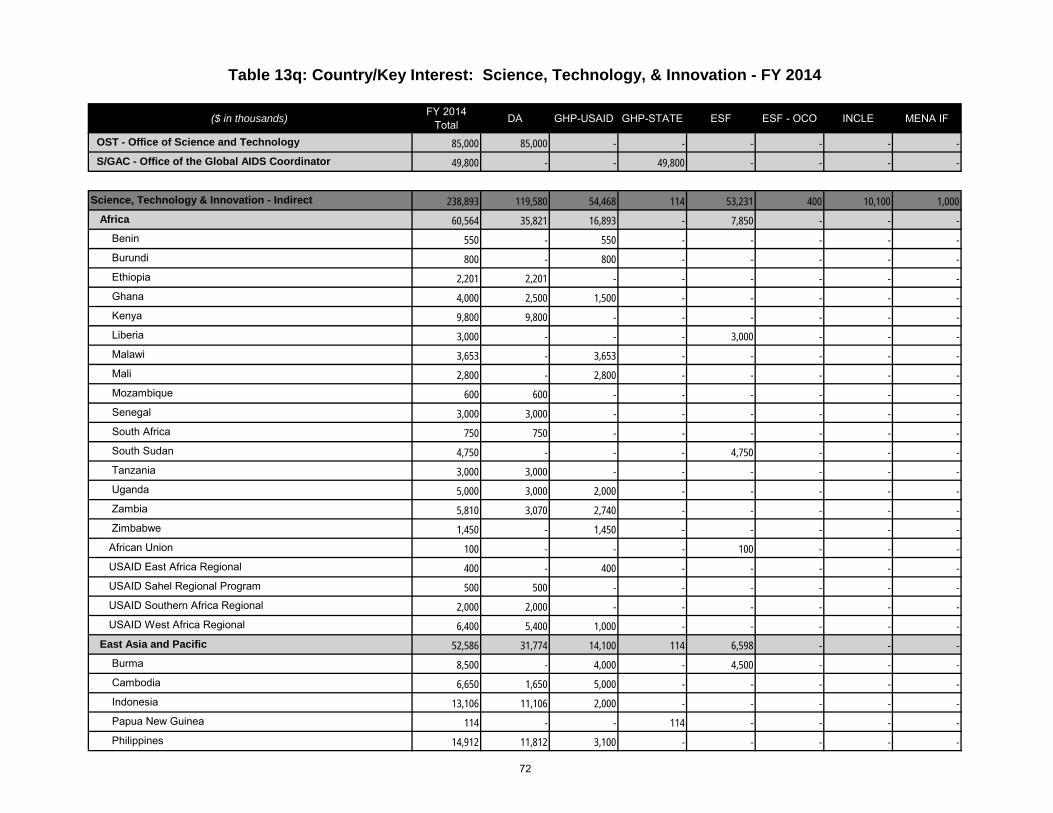
($ in thousands) FY 2014 Total DA GHP-USAID GHP-STATE ESF ESF - OCO INCLE MENA IF
Table 13q: Country/Key Interest: Science, Technology, & Innovation - FY 2014
OST - Office of Science and Technology 85,000 85,000 - - - - - - S/GAC - Office of the Global AIDS Coordinator 49,800 - - 49,800 - - - -
Science, Technology & Innovation - Indirect 238,893 119,580 54,468 114 53,231 400 10,100 1,000 Africa 60,564 35,821 16,893 - 7,850 - - - Benin 550 - 550 - - - - - Burundi 800 - 800 - - - - - Ethiopia 2,201 2,201 - - - - - - Ghana 4,000 2,500 1,500 - - - - - Kenya 9,800 9,800 - - - - - - Liberia 3,000 - - - 3,000 - - - Malawi 3,653 - 3,653 - - - - - Mali 2,800 - 2,800 - - - - - Mozambique 600 600 - - - - - - Senegal 3,000 3,000 - - - - - - South Africa 750 750 - - - - - - South Sudan 4,750 - - - 4,750 - - - Tanzania 3,000 3,000 - - - - - - Uganda 5,000 3,000 2,000 - - - - - Zambia 5,810 3,070 2,740 - - - - - Zimbabwe 1,450 - 1,450 - - - - - African Union 100 - - - 100 - - - USAID East Africa Regional 400 - 400 - - - - - USAID Sahel Regional Program 500 500 - - - - - - USAID Southern Africa Regional 2,000 2,000 - - - - - - USAID West Africa Regional 6,400 5,400 1,000 - - - - - East Asia and Pacific 52,586 31,774 14,100 114 6,598 - - - Burma 8,500 - 4,000 - 4,500 - - - Cambodia 6,650 1,650 5,000 - - - - - Indonesia 13,106 11,106 2,000 - - - - - Papua New Guinea 114 - - 114 - - - - Philippines 14,912 11,812 3,100 - - - - -
72

($ in thousands) FY 2014 Total DA GHP-USAID GHP-STATE ESF ESF - OCO INCLE MENA IF
Table 13q: Country/Key Interest: Science, Technology, & Innovation - FY 2014
State East Asia and Pacific Regional 98 - - - 98 - - - USAID Regional Development Mission-Asia (RDM/A) 9,206 7,206 - - 2,000 - - - Europe and Eurasia 2,225 - - - 2,075 - 150 - Albania 700 - - - 600 - 100 - Armenia 350 - - - 300 - 50 - Bosnia and Herzegovina 750 - - - 750 - - - Georgia 250 - - - 250 - - - Ukraine 175 - - - 175 - - - Near East 16,085 - - - 15,085 - - 1,000 Egypt 7,250 - - - 7,250 - - - Lebanon 5,900 - - - 5,900 - - - Morocco 435 - - - 435 - - - Tunisia 500 - - - 500 - - - Middle East Multilaterals (MEM) 1,000 - - - 1,000 - - - USAID Middle East Regional (OMEP) 1,000 - - - - - - 1,000 South and Central Asia 41,073 11,250 20,200 - 8,723 400 500 - Afghanistan 1,000 - - - 600 400 - - Bangladesh 1,200 1,200 - - - - - - India 33,200 10,000 20,200 - 3,000 - - - Kazakhstan 250 - - - 250 - - - Maldives 50 50 - - - - - - Nepal 3,250 - - - 2,750 - 500 - Tajikistan 1,700 - - - 1,700 - - - Central Asia Regional 423 - - - 423 - - - Western Hemisphere 23,410 9,535 775 - 5,100 - 8,000 - Brazil 500 500 - - - - - - Colombia 400 - - - 400 - - - Dominican Republic 200 200 - - - - - - El Salvador 3,350 3,350 - - - - - - Haiti 4,700 - - - 4,700 - - - Honduras 100 100 - - - - - - Paraguay 600 600 - - - - - -
73

($ in thousands) FY 2014 Total DA GHP-USAID GHP-STATE ESF ESF - OCO INCLE MENA IF
Table 13q: Country/Key Interest: Science, Technology, & Innovation - FY 2014
Peru 2,000 2,000 - - - - - - Barbados and Eastern Caribbean 600 - 600 - - - - - State Western Hemisphere Regional (WHA) 8,000 - - - - - 8,000 - USAID Central America Regional 2,225 2,225 - - - - - - USAID Latin America and Caribbean Regional 560 560 - - - - - - USAID South America Regional 175 - 175 - - - - - DCHA - Democracy, Conflict, and Humanitarian Assistance 10,000 7,500 2,500 - - - - - E3 - Economic Growth, Education, and Environment 23,700 23,700 - - - - - - INL - International Narcotics and Law Enforcement Affairs 1,450 - - - - - 1,450 - OES - Oceans and International Environmental and Scientific Affairs 5,800 - - - 5,800 - - - Special Representatives 2,000 - - - 2,000 - - - S/GPI - Special Representative for Global Partnerships 2,000 - - - 2,000 - - -
74

($ in thousands) FY 2014 Total DA ESF ESF - OCO INCLE
TOTAL 43,679 7,722 7,142 5,000 23,815 Africa 1,100 - 1,100 - - Democratic Republic of the Congo 200 - 200 - - State Africa Regional 900 - 900 - - East Asia and Pacific 5,110 3,872 788 - 450 Burma 500 - 500 - - Cambodia 2,000 2,000 - - - Indonesia 100 - - - 100 Malaysia 50 - - - 50 Philippines 600 600 - - - Thailand 450 450 - - - State East Asia and Pacific Regional 588 - 288 - 300 USAID Regional Development Mission-Asia (RDM/A) 822 822 - - - Europe and Eurasia 3,509 - 1,254 - 2,255 Albania 120 - - - 120 Armenia 300 - - - 300 Azerbaijan 376 - - - 376 Belarus 424 - 424 - - Bosnia and Herzegovina 163 - 80 - 83 Georgia 170 - - - 170 Kosovo 336 - - - 336 Macedonia 415 - - - 415 Moldova 250 - 50 - 200 Montenegro 10 - 10 - - Ukraine 909 - 654 - 255 Europe and Eurasia Regional 36 - 36 - - Near East 1,675 - 1,425 - 250 Egypt 800 - 800 - - Yemen 875 - 625 - 250 South and Central Asia 10,350 1,100 2,575 5,000 1,675 Afghanistan 5,000 - - 5,000 - Bangladesh 1,900 1,100 - - 800
Table 13r: Country/Key Interest: Trafficking in Persons - FY 2014
75

($ in thousands) FY 2014 Total DA ESF ESF - OCO INCLE
Table 13r: Country/Key Interest: Trafficking in Persons - FY 2014
Kazakhstan 370 - 250 - 120 Kyrgyz Republic 350 - 350 - - Maldives 100 - - - 100 Nepal 1,700 - 1,500 - 200 Sri Lanka 100 - - - 100 Tajikistan 235 - - - 235 Turkmenistan 120 - - - 120 Uzbekistan 475 - 475 - - Western Hemisphere 750 750 - - - Guatemala 750 750 - - -
DCHA - Democracy, Conflict, and Humanitarian Assistance 1,500 1,500 - - -
INL - International Narcotics and Law Enforcement Affairs 465 - - - 465
J/TIP - Office to Monitor and Combat Trafficking In Persons 18,720 - - - 18,720OST - Office of Science and Technology 500 500 - - -
76

($ in thousands) FY 2014 Total DA GHP-USAID GHP-STATE ESF MENA IF
TOTAL 230,739 82,297 23,473 3,929 115,040 6,000 Africa 83,827 49,560 13,373 3,894 17,000 - Benin 200 - 200 - - - Burundi 49 - - 49 - - Cameroon 30 - - 30 - - Cote d'Ivoire 454 - - 454 - - Democratic Republic of the Congo 1,500 - 1,500 - - - Ethiopia 8,310 4,590 3,500 220 - - Ghana 6,000 6,000 - - - - Kenya 10,369 6,300 3,973 96 - - Liberia 6,000 - - - 6,000 - Malawi 35 - - 35 - - Mali 2,640 2,640 - - - - Mozambique 2,154 1,660 - 494 - - Namibia 3 - - 3 - - Nigeria 3,420 3,360 - 60 - - Rwanda 2,047 1,000 700 347 - - Senegal 1,000 1,000 - - - - South Africa 660 - - 660 - - South Sudan 11,000 - - - 11,000 - Tanzania 5,126 4,500 - 626 - - Uganda 3,220 1,000 1,500 720 - - Zambia 4,088 2,000 2,000 88 - - Zimbabwe 12 - - 12 - - USAID Africa Regional 4,880 4,880 - - - - USAID East Africa Regional 500 500 - - - - USAID Sahel Regional Program 4,600 4,600 - - - - USAID Southern Africa Regional 1,530 1,530 - - - - USAID West Africa Regional 4,000 4,000 - - - - East Asia and Pacific 12,839 12,238 600 1 - - Cambodia 1,001 400 600 1 - - Indonesia 8,338 8,338 - - - -
Table 13s: Country/Key Interest: Water - FY 2014
77

($ in thousands) FY 2014 Total DA GHP-USAID GHP-STATE ESF MENA IF
Table 13s: Country/Key Interest: Water - FY 2014
Philippines 3,500 3,500 - - - - Near East 79,227 - - - 73,227 6,000 Egypt 1,000 - - - 1,000 - Jordan 19,000 - - - 19,000 - Lebanon 11,427 - - - 11,427 - West Bank and Gaza 40,000 - - - 40,000 - Yemen 1,000 - - - 1,000 - Middle East Multilaterals (MEM) 800 - - - 800 - USAID Middle East Regional (OMEP) 6,000 - - - - 6,000 South and Central Asia 18,250 - 3,000 - 15,250 - Afghanistan 15,000 - - - 15,000 - India 1,000 - 1,000 - - - Nepal 2,000 - 2,000 - - - State South and Central Asia Regional 250 - - - 250 - Western Hemisphere 10,397 800 1,000 34 8,563 - Bolivia 300 300 - - - - Ecuador 500 500 - - - - Guyana 34 - - 34 - - Haiti 9,563 - 1,000 - 8,563 -USAID Asia Regional 500 500 - - - -
78

Table 14: Office of Transition Initiatives (OTI) Transition Initiatives (TI) – FY 2012-2014 ($ in Thousands)
Country Description Dates FY 2012 Actual Obligations FY 2013 CR FY 2014
Request AFRICA
Côte d'Ivoire
Support Côte d'Ivoire's transition to a stable, prosperous, and democratically led country and the establishment of a more equitable, responsive, resilient, and legitimate government.
Start: 9/2011 Exit: 8/2014 TI: 3,545 * -
Kenya Mobilize the public, youth and key change agents, to demand accountability and reform, support critical constitutional reforms to end systematic impunity, and mitigate risks for political violence.
Start: 6/2008 Exit: 5/2013 TI: 4,292 * -
Mali Support public inclusion and participation in the democratic process and improving access to reliable information during the lead up to national elections
Start: 01/2013 Exit: TBD *
Zimbabwe Support increased citizen participation in advancing principles in the Global Political Agreement.
Start: 6/2008 Exit: 4/2012 TI: 450 - -
ASIA and MIDDLE EAST
Afghanistan
Increase resilience in areas vulnerable to insurgent control by (1) strengthening ties between local actors, customary governance structures, and the Government of the Islamic Republic of Afghanistan (GIRoA) and (2) increasing cohesion among and between communities.
Start: 7/2009 Exit: 2/2015
TI: 253 TI-OCO: 478 * -
Burma Ensure the trajectory and durability of Burma’s transition to democracy, USAID/OTI is working with civil society, the GoB and other stakeholders to foster more participatory and inclusive reform and peace processes.
Start: 9/2012 Exit: 8/2016 TI: 6,000 * -
Kyrgyzstan Mitigate short-term threats to inclusive, accountability, and transparency in governance that could roll-back democratic gains since 2010.
Start: 5/2010 Exit: 12/2013 TI: 2,587 * -
Lebanon Provide youth with civic engagement opportunities and mitigate tensions in conflict-prone areas.
Start: 10/2007 Exit: 7/2014 TI: 3,583 * -
Libya Support Libyan efforts to build an inclusive and accountable democratic government that is responsive to community needs.
Start: 7/2011 Exit: 9/2013
TI: 2,278 TI-OCO: 2,344 * -
Pakistan
Support conditions for stability and development in conflict-prone and other priority areas in the Federally Administered Tribal Areas (FATA) and the Khyber Pakhtunkhwa (KP) region. Counter violent extremism in targeted neighborhoods of Karachi, and select districts of Southern Punjab, that have been identified as Mission priorities.
Start: 10/2007 Exit: 3/2015
TI: 392 TI-OCO: 216 * -
Sri Lanka
The Sri Lanka Reintegration and Stabilization in the East and North (RISEN) program advances recovery in conflict-affected parts of the country by promoting increased social cohesion, economic security, and community resiliency in the East and North provinces, including Jaffna.
Start: 4/2010 Exit: 8/2013 TI: 3,055 * -
Syria Support efforts to enable an inclusive, peaceful, and participatory political transition in Syria.
Start: 10/2012 Exit: TBD - TI-OCO: 37,000*
-
79

Table 14: Office of Transition Initiatives (OTI) Transition Initiatives (TI) – FY 2012-2014 ($ in Thousands)
Country Description Dates FY 2012 Actual Obligations FY 2013 CR FY 2014
Request
Tunisia Supports Tunisians in their pursuit of a democratic society and more equitable, responsive, and legitimate governance.
Start: 5/2010 Exit: 5/2013 TI: 7,933 * -
Yemen Supporting an inclusive and participatory political transition through targeted assistance to government, civil society, and other stakeholders in select rural and urban areas.
Start: 3/2010 Exit: 4/2013
TI: 1,011 TI-OCO: 3,516 * -
LATIN AMERICA / CARIBBEAN Cuba Connect non-traditional groups with other democratic actors in the
region and support youth-led independent media initiatives. Start: 9/2007 Exit: 8/2012 TI: 108 * -
Haiti Provide the Government of Haiti with support to enhance its crisis management capacity and to help restore core government functions.
Start: 1/2010 Exit: 9/2013 TI: 1,313 * -
Honduras The program is focused on bringing security to high-violence communities and increasing citizen confidence in government institutions.
Start: 7/2012 Exit: 7/2015 TI: 4,000 * -
New Countries / Planning and Preparedness * TI: 42,399 Multi-Country Program Support
Multi-Country Program Support costs are operations costs that include non-country specific programs
TI: 5,430 * TI: 6,719
Washington, DC Program Support for Worldwide Programs TI: 7,435 * TI: 8,482
No Year funds adjustment* (3,524) * -
TOTAL TI FUNDS TI: 50,141 TI-OCO: 6,554
TI: 50,448 TI-OCO: 43,554 TI: 57,600
*This adjustment includes: 1) funds from the prior fiscal year; 2) funds used in the next fiscal year; and 3) collections, recoveries, and reimbursements.
FY2012: Non-TI FY2012 funding: Côte d'Ivoire: $9 million ESF; Kenya: $4.9 million ESF, $7 million CCF, $750,000 DA; Afghanistan: $85.4 million ESF; Kyrgyzstan: $4.5 million AEECA, $5 million CCF; Lebanon: $3 million ESF; Libya: $5 million ESF; Pakistan: $57.4 million ESF, $62,420 DA; Sri Lanka: $1.9 million DA; Tunisia: $900,000 ESF, $1.2 million DF; Yemen: $6 million ESF, $2 million ESF; Haiti: $26.3 million ESF; Honduras: $3 million 1207.
FY2013: The FY 2013 CR is based on the annualized continuing resolution calculation for FY 2013 (P.L. 112-175). Includes $37 million of transferred from FY 2012 International Narcotics Control and Law Enforcement – OCO.
80

OE TF OE TF OE TFOffice of the Administrator 6,629 - 7,235 13,864 6,466 - 10,439 16,905 4,429 - 9,601 14,030 Office of Faith-Based Initiatives 270 - - 270 304 - - 304 302 - 302 Office of Civil Rights and Diversity 382 - 860 1,242 382 - 1,402 1,784 379 - 1,431 1,810 Office of Small and Disadvantaged Business Utilization 105 - 1,413 1,518 138 - 1,555 1,693 237 - 1,771 2,008 Office of Security 16,909 - 7,735 24,644 16,906 - 9,277 26,183 16,804 - 9,465 26,269 Office of General Counsel 179 - 7,701 7,880 296 - 8,266 8,562 493 - 8,586 9,079 Office of Legislative and Public Affairs 1,434 - 5,840 7,273 1,398 - 6,175 7,573 1,191 - 6,112 7,303 Office of Innovation Development Alliances (formerly Office of Development Partners) 1,096 - 3,983 5,079 1,476 - 3,665 5,141 2,899 - 6,259 9,159 Office of Science and Technology - - - - - - - - 327 - 3,219 3,546 Office of Human Resources 457 - 13,668 14,125 1,341 - 15,094 16,435 1,333 - 15,394 16,727 Office of Afghanistan and Pakistan Affairs 6,868 - 4,299 11,167 6,157 - 8,948 15,105 5,304 - 10,467 15,771 Office of Budget and Resource Management - - 1,852 1,852 240 - 1,654 1,894 239 - 2,228 2,467 Bureau for Management 21,903 - 54,812 76,715 17,235 - 56,614 73,849 18,066 - 57,095 75,161 Bureau for Policy, Planning, and Learning 6,201 - 9,531 15,732 7,287 - 9,186 16,473 7,076 - 8,868 15,944 Bureau of Foreign Assistance 661 - 5,744 6,404 691 - 6,952 7,643 1,532 - 7,084 8,616 Bureau for Food Security 441 - 5,470 5,911 691 - 7,594 8,285 677 - 8,778 9,455 Bureau for Democracy, Conflict and Humanitarian Assistance 517 - 23,797 24,315 2,369 - 24,272 26,641 2,951 - 25,006 27,957 Bureau for Economic Growth, Education, and Environment 879 - 13,666 14,545 488 - 14,401 14,889 873 - 15,194 16,067 Bureau for Global Health 946 - 14,584 15,530 1,456 - 14,530 15,986 955 - 15,389 16,345 Bureau for Africa 854 - 13,624 14,479 682 - 13,255 13,937 678 - 14,155 14,833 Bureau for Asia 677 - 6,495 7,173 449 - 7,092 7,541 446 - 7,392 7,838 Bureau for Middle East 108 - 4,604 4,712 146 - 5,111 5,257 294 - 5,499 5,793 Bureau for Europe and Eurasia 361 - 7,481 7,842 514 - 8,036 8,550 501 - 8,189 8,690 Bureau for Latin America and Caribbean 540 - 7,741 8,281 223 - 7,719 7,942 222 - 7,842 8,063 Complement - - 23,744 23,744 - - 40,801 40,801 - 30,674 30,674 Subtotal Washington 68,416 - 245,877 314,294 67,335 - 282,038 349,373 68,209 - 285,697 353,906 Africa Overseas 90,200 801 47,477 138,478 181,555 1,100 86,314 268,969 206,850 1,100 109,494 317,444 Asia Overseas 31,643 1,549 25,196 58,388 51,552 1,569 46,122 99,243 54,404 1,569 52,738 108,711 Office of Afghanistan and Pakistan Affairs Overseas 137,399 - 80,727 218,126 162,577 - 102,516 265,093 132,368 - 77,659 210,027 Middle East Overseas 47,155 13,094 18,634 78,882 89,276 13,244 32,737 135,257 60,452 12,918 26,639 100,009 Europe and Eurasia Overseas 26,141 - 13,758 39,899 32,958 - 15,614 48,572 34,756 - 16,227 50,983 Latin America and Caribbean Overseas 41,513 1,567 20,829 63,909 48,818 1,767 31,002 81,586 42,727 1,362 31,153 75,242 Policy, Planning, and Learning Overseas 2,593 - 585 3,178 3,323 - 969 4,292 2,514 - 1,170 3,684 Democracy, Conflict and Humanitarian Assistance 465 - 436 901 464 - 470 934 464 - 436 900 Reimbursement of Sales Proceeds 1,753 - - 1,753 1,951 - - 1,951 1,951 - - 1,951 FS Pay Modernization - - - - - - - - - - 21,541 21,541 Subtotal Overseas 378,862 17,012 207,641 603,515 572,473 17,680 315,744 905,897 536,486 16,949 337,057 890,492 Information Technology Support 85,928 - - 85,928 88,154 - - 88,154 79,145 - - 79,145 Rent and Other General Support 58,854 - - 58,854 84,471 - - 84,471 98,971 - - 98,971 Staff Training 9,679 - - 9,679 20,114 - - 20,114 22,475 - - 22,475 Personnel Support 6,146 - - 6,146 8,600 - - 8,600 8,640 - - 8,640 ICASS 8,761 - - 8,761 10,100 - - 10,100 10,100 - - 10,100 Employee Compensation Claims 4,712 - - 4,712 4,712 - - 4,712 4,712 - - 4,712 U.S. Dispatch Agent Fees 100 - - 100 100 - - 100 100 - - 100 Medical-Property-Tort Claims 610 - - 610 1,266 - - 1,266 1,266 - - 1,266 All Other Centrally Funded 1,099 - - 1,099 684 - - 684 741 - - 741 Subtotal Centrally Funded 175,890 - - 175,890 218,200 - - 218,200 226,149 - - 226,149 Talent Management - Development Leadership Initiative 160,033 - 92,001 252,033 17,485 - 16,246 33,731 21,775 - 11,059 32,834 Talent Management - Civil Service Expansion - - - - - - - - - 4,000 4,000 Local Solutions (formerly Implementation and Procurement Reform Initiative) - - - - 2,084 - 3,000 5,084 - - Subtotal USAID Forward Agency Reforms 160,033 - 92,001 252,033 19,569 - 19,246 38,815 21,775 - 15,059 36,834 Overseas Capital Space Expansion 17,076 - - 17,076 - - - - - - - - Conflict Stabilization Operations 454 - - 454 - - - - - - - - TOTAL Requirements 800,731 17,012 545,519 1,363,262 877,577 17,680 617,028 1,512,285 852,618 16,949 637,813 1,507,381
Direct Obligations USDH Sal & Ben Total TotalDirect Obligations USDH
Sal & BenDirect Obligations USDH
Sal & BenTotal
Table 15a: USAID Operating Expenses - Summary($ in thousands)
FY 2013 CR Estimate FY 2014 Request FY 2012 Actuals
81

Africa Overseas OE TF OE TF OE TFAngola 2,408 - 394 2,802 6,472 - 2,258 8,730 3,814 - 462 4,276 Benin 1,650 - 470 2,120 2,059 - 370 2,429 2,059 - 616 2,675 Botswana - - - - - - - - 1,172 - 308 1,480 Burkina Faso - - - - - - - - 2,023 - 616 2,639 Burundi - - - - - - - - 983 - 616 1,599 Cote D'ivoire - - - - - - - - 2,023 - 616 2,639 Democratic Republic of the Congo 4,479 - 956 5,435 8,916 - 4,329 13,245 9,852 - 5,544 15,396 Djibouti 814 - - 814 1,537 - 313 1,850 1,020 - 154 1,174 East Africa 4,918 - 3,841 8,760 8,048 - 3,541 11,589 18,769 - 10,010 28,779 Ethiopia 4,486 - 3,190 7,677 13,011 - 5,626 18,637 10,134 - 6,314 16,448 Ghana 1,587 - 1,873 3,460 6,771 - 3,947 10,718 5,478 - 4,312 9,790 Guinea and Sierra Leone 2,147 - 426 2,573 3,926 - 1,158 5,084 3,408 - 1,694 5,102 Kenya 3,511 - 2,945 6,456 6,622 - 5,461 12,083 8,664 - 4,774 13,438 Liberia 3,253 - 1,569 4,821 8,326 - 3,901 12,227 9,163 - 4,928 14,091 Madagascar 1,985 - 672 2,656 5,006 - 1,841 6,847 3,452 - 616 4,068 Malawi 4,060 - 1,752 5,812 8,682 - 3,426 12,108 5,498 - 3,850 9,348 Mali 4,140 - 1,814 5,954 8,618 - 3,473 12,091 9,854 - 3,850 13,704 Mozambique 5,497 - 2,711 8,208 7,858 - 3,495 11,353 8,688 - 5,082 13,770 Namibia 749 - 638 1,387 783 - 798 1,581 1,593 - 616 2,209 Niger - - - - - - - - 1,397 - 616 2,013 Nigeria 6,679 - 2,614 9,293 9,379 - 3,645 13,024 13,172 - 5,852 19,024 Rwanda 1,962 - 1,240 3,202 4,199 - 3,067 7,266 3,672 - 3,234 6,906 Senegal 3,690 - 2,419 6,109 9,162 - 5,867 15,029 13,130 - 7,546 20,676 South Africa 6,066 - 3,710 9,776 13,437 - 9,360 22,797 12,017 - 8,932 20,949 Sudan 2,850 - 2,764 5,614 3,850 - 1,111 4,961 4,600 - 1,386 5,986 South Sudan 5,100 - 1,661 6,761 8,411 - 2,326 10,737 10,885 - 4,620 15,505 Tanzania 3,321 - 2,344 5,666 6,328 - 3,541 9,869 9,864 - 5,236 15,100 Uganda 3,441 700 2,822 6,963 5,995 1,000 4,131 11,126 7,795 1,000 5,236 14,031 West African Regional Program (WARP) 4,660 - 2,030 6,690 9,235 - 3,218 12,453 10,596 - 6,006 16,602 Zambia 2,778 101 1,427 4,306 5,831 100 3,171 9,102 5,572 100 3,080 8,752 Zimbabwe 3,969 - 1,192 5,161 9,093 - 2,941 12,034 6,503 - 2,772 9,275 Total Africa Overseas 90,200 801 47,477 138,478 181,555 1,100 86,314 268,969 206,850 1,100 109,494 317,444
Direct Obligations USDH Sal & Ben Total Direct Obligations USDH
Sal & Ben Total Direct Obligations USDH Sal & Ben Total
Table 15b: USAID Operating Expenses - Africa($ in thousands)
FY 2012 Actuals FY 2013 CR Estimate FY 2014 Request
82

Asia Overseas OE TF OE TF OE TFBangladesh 3,624 62 2,252 5,938 5,135 69 3,656 8,860 8,200 69 7,372 15,641 Burma 654 - - 654 1,065 - 700 1,765 4,280 - 2,079 6,359 Cambodia 2,450 - 2,071 4,521 3,334 - 2,492 5,826 4,464 - 3,402 7,866 Central Asian Republics Regional 5,014 - 2,993 8,007 12,585 - 9,901 22,486 5,436 - 6,805 12,241 East Timor 1,158 - 484 1,642 1,834 - 1,660 3,494 324 - 567 891 India 2,783 - 2,815 5,598 4,266 - 3,192 7,458 5,088 - 4,537 9,625 Indonesia 3,382 1,108 3,992 8,482 4,437 1,100 5,606 11,143 4,440 1,100 3,781 9,321 Kyrgyzstan - - - - - - - - 906 - 1,134 2,040 Mongolia 558 - 227 785 836 - 675 1,511 - - - - Nepal 2,432 - 1,782 4,213 3,585 - 2,853 6,438 5,060 - 4,348 9,408 Philippines 2,490 379 2,200 5,069 3,635 400 4,256 8,291 4,424 400 5,293 10,117 (RDM-Asia) 4,863 - 4,344 9,206 6,875 - 6,799 13,674 9,392 - 9,829 19,221 Sri Lanka 1,228 - 735 1,963 1,765 - 1,946 3,711 456 - 756 1,212 Vietnam 1,008 - 1,302 2,311 2,200 - 2,385 4,585 1,934 - 2,835 4,769 Total Asia Overseas 31,643 1,549 25,196 58,388 51,552 1,569 46,122 99,243 54,404 1,569 52,738 108,711
Office of Afghanistan and Pakistan Affairs Overseas OE TF OE TF OE TF
Afghanistan 117,882 - 73,172 191,054 133,125 - 87,268 220,393 109,545 - 66,656 176,201 Pakistan 19,517 - 7,555 27,072 29,452 - 15,248 44,700 22,823 - 11,003 33,826 Total OAPA Overseas 137,399 - 80,727 218,126 162,577 - 102,516 265,093 132,368 - 77,659 210,027
USDH Sal & Ben Total
Direct Obligations USDH Sal & BenTotal
Table 15d: USAID Operating Expenses - Office of Afghanistan and Pakistan Affairs($ in thousands)
FY 2012 Actuals FY 2013 CR Estimate FY 2014 Request Direct Obligations USDH
Sal & Ben TotalDirect Obligations
Direct Obligations USDH Sal & Ben Total Direct Obligations USDH
Sal & Ben Total Direct Obligations USDH Sal & Ben Total
Table 15c: USAID Operating Expenses - Asia($ in thousands)
FY 2012 Actuals FY 2013 CR Estimate FY 2014 Request
83

Europe and Eurasia Overseas OE TF OE TF OE TFAlbania 825 - 433 1,258 1,200 - 661 1,861 1,400 - 580 1,980 Armenia 1,498 - 817 2,316 2,316 - 1,417 3,733 3,000 - 966 3,966 Azerbaijan 902 - 893 1,795 1,200 - 440 1,640 1,700 - 773 2,473 Bosnia and Herzegovina 2,000 - 949 2,949 2,731 - 1,072 3,803 4,456 - 1,352 5,808 Cyprus 159 - 217 376 100 - 220 320 - - - - Georgia 3,280 - 1,729 5,009 3,916 - 2,643 6,559 4,000 - 2,898 6,898 Hungary 2,520 - 1,008 3,528 3,631 - 1,512 5,144 - - - - Kosovo 5,221 - 1,456 6,676 4,847 - 1,167 6,014 6,500 - 2,318 8,818 Macedonia 992 - 701 1,693 1,600 - 661 2,261 1,700 - 580 2,280 Russia 3,036 - 1,670 4,706 3,116 - 1,637 4,753 - - - - Serbia and Montenegro 3,113 - 1,254 4,367 3,400 - 1,542 4,942 4,500 - 966 5,466 Ukraine, Moldova and Belarus 2,594 - 2,632 5,226 4,900 - 2,643 7,543 7,500 - 5,795 13,295 Total Europe and Eurasia Overseas 26,141 - 13,758 39,899 32,958 - 15,614 48,572 34,756 - 16,227 50,983
Latin America and Caribbean Overseas OE TF OE TF OE TFBolivia 3,026 - 680 3,705 3,272 - 1,605 4,877 2,925 - 927 3,852 Brazil 1,301 - 219 1,520 1,180 - 590 1,770 1,185 - 371 1,556 Caribbean Regional Program 863 - 301 1,164 1,595 - 879 2,474 1,460 - 927 2,387 Central America Regional Program - - - - 5,370 - 1,734 7,104 2,900 - - 2,900 Colombia 3,700 - 2,365 6,066 3,762 - 2,524 6,286 3,400 - 3,152 6,552 Dominican Republic 3,531 - 1,799 5,330 3,158 - 2,071 5,229 4,100 - 1,854 5,954 Ecuador 1,521 - 536 2,057 1,647 - 425 2,073 1,500 - 927 2,427 El Salvador 3,961 565 2,054 6,580 2,005 565 2,456 5,026 1,500 160 3,152 4,812 Guatemala 2,894 2 1,149 4,045 3,808 2 2,059 5,869 2,894 15 3,338 6,247 Guyana 101 - 16 117 - - - - - - - - Haiti 7,543 - 4,324 11,867 8,859 - 6,124 14,983 8,100 - 6,490 14,590 Honduras 2,042 1,000 1,095 4,137 2,195 1,000 1,934 5,129 2,042 1,000 2,040 5,082 Jamaica 1,279 - 391 1,670 1,279 100 494 1,873 1,289 90 742 2,121 Mexico 1,115 - 988 2,103 1,756 - 1,702 3,458 1,300 - 2,782 4,082 Nicaragua 2,031 - 1,142 3,173 2,140 100 1,481 3,721 1,932 97 742 2,771 Panama 711 - 213 924 - - - - - - - - Paraguay 1,219 - 747 1,966 1,181 - 494 1,675 1,100 - 371 1,471 Peru 4,675 - 2,812 7,486 5,609 - 4,430 10,039 5,100 - 3,338 8,438 Total Latin America and Caribbean Over 41,513 1,567 20,829 63,909 48,818 1,767 31,002 81,586 42,727 1,362 31,153 75,242
Direct Obligations USDH Sal & Ben Total
FY 2014 Request Direct Obligations USDH
Sal & Ben Total Direct Obligations USDH Sal & Ben Total
FY 2012 Actuals FY 2013 CR Estimate
Table 15f: USAID Operating Expenses - Latin America and Caribbean($ in thousands)
Direct Obligations USDH Sal & Ben Total Direct Obligations USDH
Sal & Ben Total Direct Obligations USDH Sal & Ben Total
Table 15e: USAID Operating Expenses - Europe and Eurasia($ in thousands)
FY 2012 Actuals FY 2013 CR Estimate FY 2014 Request
84

Middle East Overseas OE TF OE TF OE TFEgypt 3,929 11,368 4,179 19,477 6,640 11,918 7,032 25,590 8,639 10,418 9,224 28,281 Iraq 27,052 - 5,731 32,784 56,882 - 9,364 66,246 27,530 - 3,145 30,675 Jordan 2,882 1,726 2,810 7,418 5,691 1,326 4,167 11,184 6,750 2,500 5,221 14,471 Lebanon 1,707 - 686 2,393 3,574 - 2,074 5,648 1,685 - 870 2,555 Libya 412 - - 412 - - - - 1,446 - 348 1,794 Morocco 2,128 - 753 2,881 3,400 - 1,110 4,511 3,195 - 1,566 4,761 Tunisia - - - - - - - - 1,329 - 522 1,851 West Bank and Gaza 7,567 - 3,916 11,483 10,927 - 7,166 18,093 7,810 - 3,829 11,639 Yemen 1,477 - 557 2,034 2,162 - 1,825 3,986 2,068 - 1,914 3,982 Total Middle East Overseas 47,155 13,094 18,634 78,882 89,276 13,244 32,737 135,257 60,452 12,918 26,639 100,009
Policy, Planning and Learning Overse OE TF OE TF OE TFBelgium 335 - 301 636 565 - 161 726 468 - 195 663 China 435 - 234 669 610 - 161 771 456 - 195 651 France 1,078 - - 1,078 1,053 - 323 1,376 909 - 390 1,299 Japan 533 - 46 579 660 - 161 821 469 - 195 664 Switzerland 212 - 4 216 435 - 161 596 212 - 195 407 Total Policy, Planning and Learning 2,593 - 585 3,178 3,323 - 969 4,292 2,514 - 1,170 3,684
Democracy, Conflict, and Humanitaria OE TF OE TF OE TFDCHA OHA-Rome 465 - 436 901 464 - 470 934 464 - 436 900 Total DCHA Overseas 465 - 436 901 464 - 470 934 464 - 436 900
Direct Obligations USDH Sal & Ben Total
FY 2014 Request Direct Obligations USDH
Sal & Ben Total Direct Obligations USDH Sal & Ben Total
FY 2012 Actuals FY 2013 CR Estimate
Direct Obligations USDH Sal & Ben Total
Table 15i: USAID Operating Expenses - Democracy, Conflict, and Humanitarian Assistance($ in thousands)
FY 2014 Request Direct Obligations USDH
Sal & Ben Total Direct Obligations USDH Sal & Ben Total
FY 2012 Actuals FY 2013 CR Estimate
Table 15h: USAID Operating Expenses - Policy, Planning and Learning($ in thousands)
Direct Obligations USDH Sal & Ben Total Direct Obligations USDH
Sal & Ben Total Direct Obligations USDH Sal & Ben Total
Table 15g: USAID Operating Expenses - Middle East($ in thousands)
FY 2012 Actuals FY 2013 CR Estimate FY 2014 Request
85

USDH Other US FSN Total OE USDH Other US FSN Total OE USDH Other US FSN Total OEWashington Workforce
Office of the Administrator 58 - - 58 - 58 66 - - 66 - 66 57 - - 57 - 57 Office of Civil Rights and Diversity 8 - - 8 - 8 9 - - 9 - 9 8 - - 8 - 8 Office of Small and Disadvantaged Business Utilization 11 - - 11 - 11 10 - - 10 - 10 11 - - 11 - 11 Office of Security 68 - 68 - 68 67 - - 67 - 67 68 - - 68 - 68 Office of General Counsel 49 - - 49 - 49 51 - - 51 - 51 49 - - 49 - 49 Office of Legislative and Public Affairs 45 - - 45 1 46 43 - - 43 - 43 45 - - 45 - 45 Office of Innovation Development Alliances (formerly ODP) 33 3 - 36 9 45 21 2 - 23 7 30 33 2 - 35 7 42 Office of Science and Technology - - - - - - - - - - - - 16 - - 16 6 22 Office of Human Resources 157 1 - 158 1 159 168 1 - 169 2 171 157 1 - 158 2 160 Office of Afghanistan and Pakistan Affairs 62 - - 62 19 81 43 - - 43 2 45 62 - - 62 2 64 Office of Budget and Resource Management 13 - - 13 - 13 13 - - 13 - 13 13 - - 13 - 13 Bureau for Management 438 3 - 441 7 448 418 3 - 421 4 425 437 3 - 440 4 444 Bureau for Policy, Planning, and Learning 65 - - 65 7 72 54 - - 54 5 59 55 - - 55 1 56 Bureau of Foreign Assistance 42 1 - 43 - 43 43 2 - 45 - 45 42 2 - 44 - 44 Bureau for Food Security 36 25 - 61 24 85 32 16 - 48 16 64 35 16 - 51 16 67 Bureau for Democracy, Conflict and Humanitarian Assistance 192 3 - 195 280 475 222 4 - 226 224 450 192 4 - 196 224 420 Bureau for Economic Growth, Agriculture and Trade 100 - - 100 112 212 107 - - 107 87 194 99 - - 99 87 186 Bureau for Global Health 110 - - 110 146 256 107 - - 107 145 252 109 - - 109 145 254 Bureau for Africa 100 - - 100 50 150 94 - - 94 46 140 100 - - 100 46 146 Bureau for Asia 44 - - 44 5 49 43 - - 43 2 45 44 - - 44 2 46 Bureau for Middle East 34 - - 34 21 55 28 - - 28 14 42 34 - - 34 14 48 Bureau for Europe and Eurasia 54 - - 54 20 74 55 - - 55 18 73 53 - - 53 18 71 Bureau for Latin America and Caribbean 54 1 - 55 19 74 56 - - 56 21 77 54 - - 54 21 75 Civil Service Expansion - - - 16 - - 16 - 16 - - - - - - Complement 86 - - 86 6 92 47 - - 47 2 49 43 - - 43 - 43 Subtotal Washington 1,859 37 - 1,896 727 2,623 1,813 28 - 1,841 595 2,436 1,816 28 - 1,844 595 2,439
Overseas Workforce - - - Africa Overseas 204 31 728 963 1,160 2,123 517 28 740 1,285 1,243 2,528 711 29 756 1,496 1,295 2,791 Asia Overseas 97 7 412 516 515 1,031 259 7 563 829 528 1,357 279 6 551 836 570 1,406 Office of Afghanistan and Pakistan Affairs Overseas 258 13 144 415 324 739 392 41 177 610 271 881 319 41 177 537 271 808 Middle East Overseas 67 20 285 372 163 535 174 15 498 687 134 821 156 23 400 579 134 713 Europe and Eurasia Overseas 65 7 250 322 278 600 76 8 275 359 281 640 84 6 240 330 241 571 Latin America and Caribbean Overseas 92 17 318 427 496 923 222 12 440 674 522 1,196 168 10 430 608 486 1,094 Policy, Planning, and Learning Overseas 2 - 2 4 1 5 6 - 3 9 - 9 6 - 3 9 - 9 Democracy, Conflict and Humanitarian Assistance Overseas 2 3 8 13 60 73 2 - - 2 49 51 2 - - 2 49 51
Subtotal Overseas 787 98 2,147 3,032 2,997 6,029 1,648 111 2,696 4,455 3,026 7,481 1,725 115 2,557 4,397 3,045 7,442 Lapse (90) (11) (79) (180) (29) (209) (206) (10) (140) (356) (139) (495) (216) (10) (140) (366) (139) (505)Total Washington and Overseas 2,646 135 2,147 4,928 3,724 8,652 3,461 139 2,696 6,296 3,621 9,917 3,541 143 2,557 6,241 3,640 9,881 Talent Management - Development Leadership Initiative 820 - 300 1,120 - 1,120 100 - 100 200 50 250 100 - 100 200 - 200 Acquisition Workforce Initiative - - - - - - Civil Service Capacity - - - - 22 22 22 Implementation and Procurement Reform Initiative - - 16 - - 16 - 16 - - Subtotal USAID Forward Agency Reforms 820 - 300 1,120 - 1,120 116 - 100 216 50 266 122 - 100 222 - 222 GRAND TOTAL 3,466 135 2,447 6,048 3,724 9,772 3,577 139 2,796 6,512 3,671 10,183 3,663 143 2,657 6,463 3,640 10,103 Of which Limited Term Appointments (268) - - (268) (137) (405) (202) - - (202) (175) (377) (268) - - (268) (137) (405)
Memo Items:(1) Development Leadership Initiative FY 2012 Actuals assume that 820 FSO's are on-board at year-end.(2) Limited Term Appointment data is based off of OHR Year-End count of Program and OE Funded Staff.
Grand Total
OE Funded Prog Grand Total
Table 16a: USAID Workforce
OrganizationSeptember 30, 2012 Actual September 30, 2013 Estimate September 30, 2014 Request
OE Funded Prog Grand Total
OE Funded Prog
86
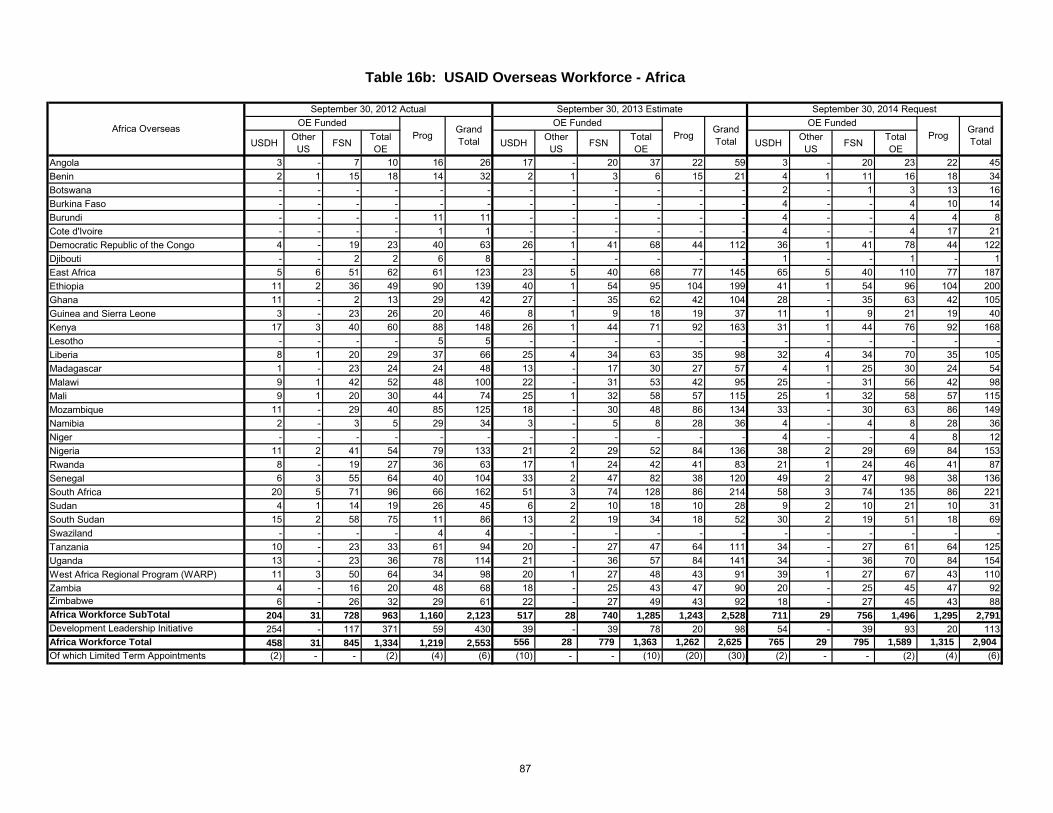
USDH Other US FSN Total
OE USDH Other US FSN Total
OE USDH Other US FSN Total
OEAngola 3 - 7 10 16 26 17 - 20 37 22 59 3 - 20 23 22 45 Benin 2 1 15 18 14 32 2 1 3 6 15 21 4 1 11 16 18 34 Botswana - - - - - - - - - - - - 2 - 1 3 13 16 Burkina Faso - - - - - - - - - - - - 4 - - 4 10 14 Burundi - - - - 11 11 - - - - - - 4 - - 4 4 8 Cote d'Ivoire - - - - 1 1 - - - - - - 4 - - 4 17 21 Democratic Republic of the Congo 4 - 19 23 40 63 26 1 41 68 44 112 36 1 41 78 44 122 Djibouti - - 2 2 6 8 - - - - - - 1 - - 1 - 1 East Africa 5 6 51 62 61 123 23 5 40 68 77 145 65 5 40 110 77 187 Ethiopia 11 2 36 49 90 139 40 1 54 95 104 199 41 1 54 96 104 200 Ghana 11 - 2 13 29 42 27 - 35 62 42 104 28 - 35 63 42 105 Guinea and Sierra Leone 3 - 23 26 20 46 8 1 9 18 19 37 11 1 9 21 19 40 Kenya 17 3 40 60 88 148 26 1 44 71 92 163 31 1 44 76 92 168 Lesotho - - - - 5 5 - - - - - - - - - - - - Liberia 8 1 20 29 37 66 25 4 34 63 35 98 32 4 34 70 35 105 Madagascar 1 - 23 24 24 48 13 - 17 30 27 57 4 1 25 30 24 54 Malawi 9 1 42 52 48 100 22 - 31 53 42 95 25 - 31 56 42 98 Mali 9 1 20 30 44 74 25 1 32 58 57 115 25 1 32 58 57 115 Mozambique 11 - 29 40 85 125 18 - 30 48 86 134 33 - 30 63 86 149 Namibia 2 - 3 5 29 34 3 - 5 8 28 36 4 - 4 8 28 36 Niger - - - - - - - - - - - - 4 - - 4 8 12 Nigeria 11 2 41 54 79 133 21 2 29 52 84 136 38 2 29 69 84 153 Rwanda 8 - 19 27 36 63 17 1 24 42 41 83 21 1 24 46 41 87 Senegal 6 3 55 64 40 104 33 2 47 82 38 120 49 2 47 98 38 136 South Africa 20 5 71 96 66 162 51 3 74 128 86 214 58 3 74 135 86 221 Sudan 4 1 14 19 26 45 6 2 10 18 10 28 9 2 10 21 10 31 South Sudan 15 2 58 75 11 86 13 2 19 34 18 52 30 2 19 51 18 69 Swaziland - - - - 4 4 - - - - - - - - - - - - Tanzania 10 - 23 33 61 94 20 - 27 47 64 111 34 - 27 61 64 125 Uganda 13 - 23 36 78 114 21 - 36 57 84 141 34 - 36 70 84 154 West Africa Regional Program (WARP) 11 3 50 64 34 98 20 1 27 48 43 91 39 1 27 67 43 110 Zambia 4 - 16 20 48 68 18 - 25 43 47 90 20 - 25 45 47 92 Zimbabwe 6 - 26 32 29 61 22 - 27 49 43 92 18 - 27 45 43 88 Africa Workforce SubTotal 204 31 728 963 1,160 2,123 517 28 740 1,285 1,243 2,528 711 29 756 1,496 1,295 2,791 Development Leadership Initiative 254 - 117 371 59 430 39 - 39 78 20 98 54 - 39 93 20 113 Africa Workforce Total 458 31 845 1,334 1,219 2,553 556 28 779 1,363 1,262 2,625 765 29 795 1,589 1,315 2,904 Of which Limited Term Appointments (2) - - (2) (4) (6) (10) - - (10) (20) (30) (2) - - (2) (4) (6)
Grand Total
OE FundedProg Grand
Total
Table 16b: USAID Overseas Workforce - Africa
Africa Overseas
September 30, 2012 Actual September 30, 2013 Estimate September 30, 2014 RequestOE Funded
Prog Grand Total
OE FundedProg
87

USDH Other US FSN Total
OE USDH Other US FSN Total
OE USDH Other US FSN Total
OEBangladesh 6 1 28 35 68 103 23 1 40 64 60 124 39 1 40 80 60 140 Burma - - 1 1 4 5 5 - 5 10 2 12 11 - 1 12 22 34 Cambodia 9 - 18 27 27 54 10 - 19 29 22 51 18 - 19 37 22 59 Central Asian Republics 4 2 124 130 80 210 71 1 180 252 103 355 36 1 180 217 103 320 East Timor 1 - 11 12 9 21 9 - 14 23 14 37 3 - 14 17 14 31 India 13 - 36 49 53 102 15 1 45 61 55 116 24 1 45 70 55 125 Indonesia 17 1 47 65 63 128 26 1 65 92 70 162 20 1 65 86 70 156 Kyrgyzstan - - - - - - - - - - - - 6 - 3 9 19 28 Mongolia 3 - 2 5 6 11 3 - 3 6 6 12 - - - - 5 5 Nepal 9 - 20 29 48 77 17 - 32 49 50 99 23 - 32 55 50 105 Philippines 7 - 62 69 48 117 20 - 63 83 42 125 28 - 63 91 42 133 Regional Development Mission for Asia (RDMA) 16 3 43 62 54 116 34 2 57 93 53 146 52 2 59 113 53 166 Sri Lanka 5 - 14 19 19 38 10 1 21 32 16 48 4 - 11 15 19 34 Vietnam 7 - 6 13 36 49 16 - 19 35 37 72 15 - 19 34 37 71 Asia SubTotal 97 7 412 516 515 1,031 259 7 563 829 528 1,357 279 6 551 836 570 1,406 Development Leadership Initiative 150 - 84 234 42 276 8 - 21 30 11 40 21 - 21 42 11 53 Asia Workforce Total 247 7 496 750 557 1,307 267 7 584 859 538 1,397 300 6 572 878 580 1,459 Of which Limited Term Appointments - - - - (2) (2) - - - - (35) (35) - - - - (2) (2)
Grand Total
OE FundedProg Grand
Total
Table 16c: USAID Overseas Workforce - Asia
Asia Overseas
September 30, 2012 Actual September 30, 2013 Estimate September 30, 2014 RequestOE Funded
Prog Grand Total
OE FundedProg
88

USDH Other US FSN Total
OE USDH Other US FSN Total
OE USDH Other US FSN Total
OEAfghanistan 230 11 86 327 201 528 334 25 115 474 169 643 267 25 115 407 169 576 Pakistan 28 2 58 88 123 211 58 16 62 136 102 238 52 16 62 130 102 232 OAPA SubTotal 258 13 144 415 324 739 392 41 177 610 271 881 319 41 177 537 271 808 Development Leadership Initiative 58 - 18 76 9 85 13 - 8 21 4 25 8 - 8 16 4 20 OAPA Workforce Total 316 13 162 491 333 824 405 41 185 631 275 906 327 41 185 553 275 828 Of which Limited Term Appointments (233) - - (233) - (233) (182) - - (182) (48) (230) (233) - - (233) - (233)
USDH Other FSN Total USDH Other FSN Total USDH Other FSN Total Albania 3 1 8 12 10 22 3 1 8 12 10 22 3 1 5 9 13 22 Armenia 4 - 14 18 21 39 7 - 16 23 22 45 5 - 16 21 22 43 Azerbaijan 5 - 6 11 12 23 2 - 5 7 14 21 4 - 5 9 14 23 Bosnia and Herzegovina 4 - 17 21 18 39 6 - 19 25 20 45 7 - 19 26 20 46 Cyprus 1 - - 1 2 3 1 1 - 2 2 4 - - - - 3 3 Georgia 10 1 31 42 36 78 12 2 32 46 33 79 15 2 32 49 33 82 Hungary 6 1 25 32 6 38 8 1 31 40 11 51 - 1 31 32 11 43 Kosovo 2 3 48 53 38 91 7 1 54 62 29 91 12 1 54 67 29 96 Macedonia 4 - 5 9 18 27 3 - 6 9 18 27 3 - 6 9 16 25 Russia 11 - 27 38 36 74 8 1 32 41 42 83 - - - - - - Serbia & Montenegro 4 - 26 30 24 54 7 1 26 34 25 59 5 1 26 32 25 57 Ukraine, Moldova and Belarus 11 1 43 55 57 112 12 - 46 58 56 114 30 - 46 76 56 132 Europe and Eurasia SubTotal 65 7 250 322 278 600 76 8 275 359 281 640 84 6 240 330 241 571 Development Leadership Initiative 49 - 23 72 12 84 9 - 9 17 4 21 3 - 9 12 4 16 Europe and Eurasia Workforce Total 114 7 273 394 290 684 85 8 284 376 285 661 87 6 249 342 245 587 Of which Limited Term Appointments - - - - (1) (1) (2) - - (2) (17) (19) - - - - (1) (1)
Table 16e: USAID Overseas Workforce - Europe and Eurasia
Europe and Eurasia Overseas September 30, 2012 Actual September 30, 2013 Estimate September 30, 2014 Request
OE FundedProg Grand
TotalOE Funded
Prog Grand Total
OE FundedProg Grand
Total
Grand Total
OE FundedProg Grand
Total
Table 16d: USAID Overseas Workforce - Office of Afghanistan and Pakistan Affairs (OAPA)
Office of Afghanistan and Pakistan Affairs Overseas
September 30, 2012 Actual September 30, 2013 Estimate September 30, 2014 RequestOE Funded
Prog Grand Total
OE FundedProg
89

USDH Other US FSN Total
OE USDH Other US FSN Total
OE USDH Other US FSN Total
OEBolivia 3 1 38 42 28 70 11 - 54 65 35 100 5 - 54 59 35 94 Brazil 1 - 6 7 10 17 4 - 7 11 12 23 2 - 2 4 4 8 Caribbean Regional Program - Barbados 3 2 3 8 6 14 3 1 2 6 5 11 5 1 2 8 5 13 Colombia 8 1 21 30 45 75 17 1 32 50 41 91 17 1 32 50 41 91 Dominican Republic 12 3 34 49 22 71 17 2 50 69 26 95 10 2 50 62 26 88 Ecuador 5 - 12 17 18 35 3 - 14 17 20 37 5 - 14 19 20 39 El Salvador 8 5 51 64 24 88 35 2 74 111 28 139 17 2 74 93 28 121 Guatemala 4 1 29 34 52 86 15 1 34 50 53 103 18 1 34 53 53 106 Guyana - - - - 2 2 - - 3 3 7 10 - - - - - - Haiti 15 3 26 44 136 180 48 2 55 105 123 228 35 2 55 92 123 215 Honduras 5 - 25 30 38 68 13 - 30 43 41 84 11 - 30 41 41 82 Jamaica 2 1 8 11 17 28 3 1 7 11 16 27 4 - 6 10 12 22 Mexico 3 - 7 10 16 26 12 - 11 23 17 40 15 - 11 26 17 43 Nicaragua 6 - 15 21 21 42 9 - 16 25 26 51 4 - 16 20 26 46 Panama - - - - - - - 1 - 1 6 7 - - - - - - Paraguay 3 - 7 10 7 17 3 - 8 11 17 28 2 - 7 9 6 15 Peru 14 - 36 50 54 104 29 1 43 73 52 125 18 1 43 62 52 114 Latin America and Caribbean Workforce SubTotal 92 17 318 427 496 923 222 12 440 674 522 1,196 168 10 430 608 486 1,094 Development Leadership Initiative 106 - 36 142 10 152 13 - 13 142 6 148 4 - 13 142 6 148 Latin America and Caribbean Workforce Total 198 17 354 569 506 1,075 235 12 453 816 528 1,344 172 10 443 750 492 1,242 Of which Limited Term Appointments - - - - (4) (4) (5) - - (5) (30) (35) - - - - (4) (4)
Grand Total
OE FundedProg Grand
Total
Table 16f: USAID Overseas Workforce - Latin America and Caribbean
Latin America and Caribbean Overseas
September 30, 2012 Actual September 30, 2013 Estimate September 30, 2014 RequestOE Funded
Prog Grand Total
OE FundedProg
90

USDH Other US FSN Total
OE USDH Other US FSN Total
OE USDH Other US FSN Total
OEEgypt 13 6 119 138 41 179 43 2 182 227 12 239 53 2 182 237 12 249 Iraq 14 7 56 77 5 82 27 6 138 171 3 174 11 11 36 58 3 61 Jordan 10 1 33 44 25 69 25 1 54 80 25 105 30 1 54 85 25 110 Lebanon 2 - 14 16 4 20 16 2 24 42 4 46 5 2 24 31 4 35 Libya - - - - - - - - - - - - 2 1 3 6 - 6 Morocco 6 1 18 25 11 36 8 1 23 32 12 44 9 1 23 33 12 45 Tunisia - - - - - - - - - - - - 3 2 1 6 - 6 West Bank and Gaza 21 5 40 66 68 134 40 3 57 100 73 173 32 3 57 92 73 165 Yemen 1 - 5 6 9 15 15 - 20 35 5 40 11 - 20 31 5 36 Middle East SubTotal 67 20 285 372 163 535 174 15 498 687 134 821 156 23 400 579 134 713 Development Leadership Initiative 52 - 27 79 4 83 11 - 11 21 5 26 10 - 11 21 - 21 Middle East Workforce Total 119 20 312 451 167 618 185 15 509 708 139 847 166 23 411 600 134 733 Of which Limited Term Appointments (2) - - (2) - (2) (3) - - (3) (25) (28) (2) - - (2) - (2)
USDH Other FSN Total USDH Other FSN Total USDH Other FSN Total Belgium 1 - - 1 - 1 1 - - 1 - 1 1 - - 1 - 1 China 1 - - 1 - 1 1 - 1 2 - 2 1 - 1 2 - 2 France - - 1 1 - 1 2 - 1 3 - 3 2 - 1 3 - 3 Japan - - 1 1 1 2 1 - 1 2 - 2 1 - 1 2 - 2 Switzerland - - - - - - 1 - - 1 - 1 1 - - 1 - 1 Workforce Total 2 - 2 4 1 5 6 - 3 9 - 9 6 - 3 9 - 9 Of which Limited Term Appointments - - - - - - - - - - - - - - - - - -
Table 16h: USAID Overseas Workforce - Policy, Planning & Learning
Policy, Planning, and Learning September 30, 2012 Actual September 30, 2013 Estimate September 30, 2014 Request
OE FundedProg Grand
TotalOE Funded
Prog Grand Total
OE FundedProg Grand
Total
Grand Total
OE FundedProg Grand
Total
Table 16g: USAID Overseas Workforce - Middle East
Middle East
September 30, 2012 Actual September 30, 2013 Estimate September 30, 2014 RequestOE Funded
Prog Grand Total
OE FundedProg
91

USDH Other US
FSN Total OE
USDH Other US
FSN Total OE
USDH Other US
FSN Total OE
Afghanistan - - - - 7 7 - - - - 10 10 - - - - 10 10 Congo, Dem Rep - - - - 4 4 - - - - - - - - - - - - East Africa - - - - 1 1 - - - - 1 1 - - - - 1 1 Egypt - - - - - - - - - - 1 1 - - - - 1 1 Ethiopia - - - - 5 5 - - - - 1 1 - - - - 1 1 Hungary - - - - 1 1 - - - - 1 1 - - - - 1 1 Honduras - - - - 1 1 - - - - - - - - - - - - Italy 2 3 1 6 - 6 2 - - 2 - 2 2 - - 2 - 2 Indonesia - - - - 2 2 - - - - - - - - - - - - Kazakhstan - - - - 1 1 - - - - 1 1 - - - - 1 1 Kyrgyzstan - - - - 1 1 - - - - 2 2 - - - - 2 2 Malawi - - - - 1 1 - - - - - - - - - - - - Marshall Islands - - - - 1 1 - - - - - - - - - - - - Pakistan - - - - 5 5 - - - - 5 5 - - - - 5 5
RDMA - - - - 12 12 - - - - 8 8 - - - - 8 8
Senegal - - - - 1 1 - - - - - - - - - - - - South Africa - - - - 1 1 - - - - 1 1 - - - - 1 1 Sri Lanka - - 2 2 2 2 Sudan - - 7 7 14 21 - - - - 16 16 - - - - 16 16 Venezuela - - - - 1 1 - - - - - - - - - - - - Yemen - - - - 1 1 - - - - - - - - - - - - DCHA Workforce Total 2 3 8 13 60 73 2 - - 2 49 51 2 - - 2 49 51 Of which Limited Term Appointments (1) - - (1) (1) (2) - - - - - - (1) - - (1) (1) (2)
OE FundedProg Grand
Total
OE FundedProg Grand
Total
OE FundedProg Grand
Total
Table 16i: USAID Workforce - Democracy, Conflict, and Humanitarian Assistance - Overseas
Democracy, Conflict and Humanitarian Assistance Overseas Staff
September 30, 2012 Actual September 30, 2013 Estimate September 30, 2014 Request
92

Trust Funds Exchange Rate Trust Funds Exchange Rate Trust Funds Exchange Rate
Africa (AFR)Uganda 700 2,623 1,000 2,372 1,000 2,586 Zambia 101 5,176 100 4,800 100 5,377 Total AFR 801 1,100 1,100
Asia Bangladesh 62 77 69 79 69 80 Indonesia 1,108 9,662 1,100 9,031 1,100 9,625 Philippines 379 41 400 44 400 41 Total Asia 1,549 1,569 1,569
Latin America and Caribbean (LAC)El Salvador 565 9 565 1 160 1 Guatemala 2 8 2 8 15 8 Honduras 1,000 19 1,000 19 1,000 20 Jamaica 100 86 90 96 Nicaragua 100 22 97 24 Total LAC 1,567 1,767 1,362
Middle East (ME)Egypt 11,368 7 11,918 6 10,418 7 Jordan 1,726 1 1,326 1 2,500 1 Total ME 13,094 13,244 12,918
Worldwide Overseas Summary 17,012 17,680 16,949
Table 17: USAID Overseas Administrative Support Trust Fund Obligations($ in thousands)
FY 2012 Actuals FY 2013 CR Estimate FY 2014 Request
93

Category FY 2012 Actual
FY 2013 CR Estimate
FY 2014 Request
11.1 Personnel compensation, full-time permanent
U.S. Direct Hire 358,045 432,235 418,622
Foreign National Direct Hire 1,787 4,242 1,700
Subtotal 11.1 359,832 436,477 420,322
11.3 Personnel compensation, other than full-time permanent
U.S. Direct Hire 5,623 9,050 6,574
FSN/TCN/PSC 71,250 51,752 75,766
U.S. PSC 19,968 23,923 21,233
Subtotal 11.3 96,841 84,724 103,573
11.5 Other personnel compensation
USDH Compensation 56,039 44,205 65,520
FNDH Compensation 5,775 8,662 6,141
US/FN PSC Compensation 1,764 4,584 1,875
Subtotal 11.5 63,577 57,450 73,536
11.8 Special personal services payments
U.S. Citizens 1,830 852 2,140
Personnel Details/Interns 3,846 42 4,497
Subtotal 11.8 5,676 894 6,636
12.1 Personnel benefits
US Direct Hire
Retirement 80,892 90,015 94,578
Health and Life 23,638 26,851 27,637
Educational Allowances 12,398 9,184 13,184
All Other USDH Benefits 15,606 14,593 18,246
FN Direct Hire 5,733 5,453 5,700
USPSC Benefits 1,550 1,258 1,648
Subtotal 12.1 139,817 147,354 160,993
13.0 Benefits for former personnel
Foreign Service Nationals 546 623 581
Subtotal 13.0 546 623 581
Table 18: Use of Operating Expenses by Object Class Code($000)
94

Category FY 2012 Actual
FY 2013 CR Estimate
FY 2014 Request
Table 18: Use of Operating Expenses by Object Class Code($000)
21.0 Travel and transportation of persons
Mandatory/Statutory Travel
Training Travel 14,015 14,476 12,614
Post Assignment 5,185 18,878 5,514
Assignment to Washington Travel 465 3,566 495
Home Leave Travel 4,089 3,590 4,348
R & R Travel 10,474 9,582 11,137
All Other 3,252 3,747 3,458
Operational Travel 35,161 22,156 31,645
Subtotal 21.0 72,642 75,995 69,211
22.0 Transportation of things
Post Assignment Freight 22,487 24,397 23,912
Home Leave Freight 3,791 3,371 4,031
Shipment of Furniture and Equipment 2,757 4,993 2,932
Other Transportation of Things 506 2,961 538
Subtotal 22.0 29,541 35,722 31,413
23.1 Rental payments to GSA
Rental Payments to GSA 41,850 60,551 62,500
Subtotal 23.1 41,850 60,551 62,500
23.2 Rental payments to others
Rental Payments to Others 58,787 53,336 62,512
Subtotal 23.2 58,787 53,336 62,512
23.3 Communications, utilities, and miscellaneous charges
Office/Residential Utilities 8,835 25,046 9,395
Communications Cost 12,935 5,270 13,755
Other Miscellaneous Communications Costs 1,318 1,455 1,401
Subtotal 23.3 23,087 31,771 24,550
24.0 Printing and reproduction
Printing and reproduction 1,772 1,314 1,884
Subtotal 24.0 1,772 1,314 1,884
95

Category FY 2012 Actual
FY 2013 CR Estimate
FY 2014 Request
Table 18: Use of Operating Expenses by Object Class Code($000)
25.1 Advisory and assistance services
Advisory and assistance services 92,618 109,010 98,488
Subtotal 25.1 92,618 109,010 98,488
25.2 Other Services
Training 2,028 696 2,157
IT Systems Design/Analysis/Maintenance - -
Other IT Support Costs 142 - -
Office/Residential Security Guards 32,294 38,541 34,340
Other Miscellaneous Services 42,716 47,035 45,423
Subtotal 25.2 77,181 86,271 81,920
25.3 Purchase of goods and services from Government accounts
All Other 180,468 184,123 191,906
Subtotal 25.3 180,468 184,123 191,906
25.4 Operation and maintenance of facilities
Operation and maintenance of facilities 6,193 8,799 6,585
Subtotal 25.4 6,193 8,799 6,585
25.5 Research and development contracts
Research and development contracts 55 -
Subtotal 25.5 - 55 -
25.6 Medical Care
Medical care 708 592 753
Subtotal 25.6 708 592 753
25.7 Operation/maintenance of equipment & storage of goods
Information Technology (IT) Systems 13,190 17,743 11,871
Storage of Effects 1,669 1,364 1,775
Office/Residential Furniture/Equip. 3,451 2,118 3,670
Other Miscellaneous 274 598 291
Subtotal 25.7 18,583 21,823 17,606
25.8 Subsistance & spt. of persons (by contract or Gov't.)
Subsistance /Support of Persons - 28 -
96

Category FY 2012 Actual
FY 2013 CR Estimate
FY 2014 Request
Table 18: Use of Operating Expenses by Object Class Code($000)
Subtotal 25.8 - 28 -
26.0 Supplies and materials
Supplies and materials 9,374 15,044 9,968
Subtotal 26.0 9,374 15,044 9,968
31.0 Equipment
Office/Residential Furniture & Equipment 15,220 36,111 16,184
Vehicles 5,806 3,972 6,174
IT Hardware and Software 30,002 36,354 27,002
Subtotal 31.0 51,028 76,437 49,361
32.0 Lands and structures
Lands and structures 10,309 10,000 22,500
Subtotal 32.0 10,309 10,000 22,500
41.0 Grants, subsidies and contributions
Grants, subsidies and contributions 22,061 13,213 9,763
Subtotal 41.0 22,061 13,213 9,763
42.0 Claims and indemnities
Claims and indemnities 738 646 785
Subtotal 42.0 738 646 785
43.0 Interest and Dividends
Interest and Dividends - 1 -
Subtotal 43.0 - 1 -
44.0 Refunds
Refunds 33 33 33
Subtotal 44.0 33 33 33
Total Costs 1,363,262 1,512,285 1,507,381
97

($ in Thousands) Total Actual Emergency Non-Emergency
Total Estimate Emergency Non-
EmergencyTotal
Request Emergency Non-Emergency
TOTAL 1,466,000 1,038,617 427,383 1,474,972 1,129,972 345,000 - - - Africa 1,305,288 951,711 353,577 - - - - - - Burkina Faso 25,809 10,060 15,749 * * * - - - Burundi 19,405 8,161 11,244 * * * - - - Cameroon 952 952 - * * * - - - Central African Republic 10,028 10,028 - * * * - - - Chad 84,427 74,840 9,587 * * * - - - Cote d'Ivorie 17,302 17,302 - * * * - - - Democratic Republic of the Congo 68,346 29,537 38,809 * * * - - - Djibouti 2,350 2,350 - * * * - - - Ethiopia 306,636 180,401 126,235 * * * - - - Kenya 77,453 77,453 - * * * - - - Liberia 25,006 9,347 15,659 * * * - - - Madagascar 18,872 18,872 * * * - - - Malawi 29,972 8,554 21,418 * * * - - - Mali 26,268 21,302 4,966 * * * - - - Mauritania 11,683 6,600 5,083 * * * - - - Mozambique 17,786 - 17,786 * * * - - - Niger 57,482 37,497 19,985 * * * - - - Rwanda 1,890 1,890 - * * * - - - Senegal 2,857 2,857 - * * * - - - Sierra Leone 12,204 - 12,204 * * * - - - Somalia 79,943 79,943 - * * * - - - South Sudan 175,513 155,523 19,990 * * * - - - Sudan 164,924 164,924 - * * * - - - Tanzania 7,786 7,786 - * * * - - - Uganda 28,378 12,388 15,990 * * * - - - Zimbabwe 32,016 32,016 - * * * - - - Near East 78,040 78,040 - - - - - - - Algeria 8,680 8,680 - * * * - - - Yemen 54,803 54,803 - * * * - - -
FY 2012 Actual FY 2013 FY 2014
Table 19: P.L. 480 Title II
98

($ in Thousands) Total Actual Emergency Non-Emergency
Total Estimate Emergency Non-
EmergencyTotal
Request Emergency Non-Emergency
FY 2012 Actual FY 2013 FY 2014
Table 19: P.L. 480 Title II
West Bank Gaza 14,557 14,557 - * * * - - - South and Central Asia 176,749 134,816 41,933 - - - - - - Afghanistan 59,199 58,648 551 * * * - - - Bangladesh 42,841 1,459 41,382 * * * - - - Nepal 6,641 6,641 - * * * - - - Pakistan 68,068 68,068 - * * * - - - Western Hemisphere 38,173 6,300 31,873 - - - - - Colombia 5,282 5,282 - * * * - - - Ecuador 1,018 1,018 - * * * - - - Guatemala 14,209 - 14,209 * * * - - - Haiti 17,664 - 17,664 * * * - - - Projected New Non-Emergency Programs * * * - - - Democracy, Conflict, and Humanitarian Assistance (132,250) (132,250) - - - - - - DCHA/FFP - Contingency 1/ - * * * - - - International Food Relief Partnership 8,200 * * * - - - Farmer-to-Farmer 10,000 * * * - - - Program Operations, Monitoring, and Support 87,500 * * * - - - Funding adjustments 2/ (237,950) * * * - - -
2/ This adjusts for funding available outside current year appropriations (e.g., reimbursements for use of U.S. flagged carriers, prior year deobligations, unobligated prior year balances).
8,20010,00087,500
(237,950)
1/ To meet the sub-minimum mandate, sufficient funds will be used for non-emergency programs unless they are required for emergencies, in which case the USAID Administrator would waive the mandate after the beginning of the applicable fiscal year.
Note: All individual country programs include administrative and management costs paid through 202(e) authority.
99