Embed Size (px)
Citation preview
FORECLOSURE COUNSELINGOutcome Study: Final ReportHousing Counseling Outcome Evaluation
U.S. Department of Housing and Urban Development | Office of Policy Development and Research

Visit PD&R’s website
www.huduser.orgto find this report and others sponsored by HUD’s Office of Policy Development and Research (PD&R). Other services of
HUD USER, PD&R’s research information service, include listservs, special interest reports, bimonthly publications (best
practices, significant studies from other sources), access to public use databases, and a hotline (800-245-2691) for help
accessing the information you need.
FORECLOSURE COUNSELINGOutcome Study: Final ReportHousing Counseling Outcome Evaluation
May 2012
Prepared for U.S. Department of Housing and Urban Development Washington, D.C.
Submitted by Abt Associates Inc. 55 Wheeler Street Cambridge, MA 02138
Anna Jefferson Jonathan Spader Jennifer Turnham Shawn Moulton
In Partnership with IMPAQ International LLC
ACKNOWLEDGMENTSThe authors thank the many U.S. Department of Housing and Urban Development (HUD) staff who supported the project and provided critical input along the way. Marina Myhre of HUD’s Office of Policy Development and Research (PD&R) served as Government Technical Representative, assisting the Abt team at all stages of the project. In addition, Kevin Neary, Mark Shroder, Carol Star, and Pam Blumenthal from HUD PD&R provided critical review of study deliverables. Sarah Gerecke, Ruth Roman, and Brian Siebenlist from HUD’s Office of Housing also played a key role in supporting the project and provided input for this report.
The authors also acknowledge the many individuals on the Abt Associates project team who contributed to this report and the research on which it was based. Within Abt Associates, Jill Khadduri provided expert technical review, Nancy McGarry and David Bell-Feins supported the analysis with programming and data documentation, and Missy Robinson provided desktop publishing and production support. Nichole Fiore, Louise Rothschild, and Christopher Blaine supported the data collection effort.
IMPAQ International, under subcontract to Abt Associates, was responsible for the survey data collection for the study, including designing the counseling services data system (CSDS) that collected information on the services received by study participants and fielding the follow-up telephone survey. The IMPAQ team was led by Ted Shen, with support from Lisa Lin, Stephanie Naber, Goska Grodsky, and a team of skilled telephone and field interviewers.
The authors also especially thank Christopher Herbert of the Joint Center for Housing Studies at Harvard University, who led the first phase of the study while at Abt Associates and served as a consultant to the project for the remainder of the study. Dr. Herbert provided key input in the development of this report.
The study would not have been possible without the cooperation of the 24 housing counseling agencies whose counselors filled out surveys, recruited their clients to participate, and collected data on the services they provided over a 6-month period. The agencies are Auriton Solutions; Catholic Charities Housing Resource Center; Chicanos Por La Causa, Inc.; Consumer Credit Counseling Service (CCCS) of Fort Worth, a Division of Money Management International (MMI); CCCS of Kern and Tulare Counties; CCCS of Lutheran Social Services of South Dakota; CCCS of the Gulf Coast Area; CCCS of the Midwest; CCCS South West Phone Center; CCCS of Greater Dallas; CredAbility; DuPage Homeownership Center; Family Services, Inc.; GreenPath Debt Solutions; Houston Area Urban League, Inc.; Mission of Peace Community Development Corporation; National Council on Agricultural Life and Labor (NCALL) Research, Inc.; Neighborhood Assistance
FORECLOSURE COUNSELING OUTCOME STUDY: FINAL REPORT HOUSING COUNSELING OUTCOME EVALUATION
ACKNOWLEDGEMENTS
Corporation of America (NACA) Buffalo; NACA Charleston; Neighborhood Housing Services (NHS) of Chicago, Inc.; NHS of Greater Berks; Novadebt™; Springboard Nonprofit Consumer Credit Management, Inc.; and St. Petersburg Neighborhood Housing Services, Inc. We are very grateful for their participation.
In addition, we appreciate the willingness of NeighborWorks® America to provide administrative data collected through the National Foreclosure Mitigation Counseling (NFMC) program to assist with nonresponse bias analysis.
Finally, the authors thank the 824 homeowners who shared their time to explain their experiences with foreclosure mitigation counseling. Their willingness to participate in the study at a very difficult time in their lives made possible the findings of this report.
DISCLAIMERThe contents of this report are the views of the authors and do not necessarily reflect the views or policies of the U.S. Department of Housing and Urban Development or the U.S. Government.
FORECLOSURE COUNSELING OUTCOME STUDY: FINAL REPORT HOUSING COUNSELING OUTCOME EVALUATION
ACKNOWLEDGEMENTS/DISCLAIMER
FOREWORDThe Department of Housing and Urban Development (HUD) has supported housing counseling programs through grants since 1968, which provide funding for programs that counsel consumers on, among other issues, seeking, financing, maintaining, renting, or owning a home. To better understand the counseling services consumers receive, their outcomes, and the effectiveness of counseling, HUD initiated a series of studies on HUD’s housing counseling program in 2006. The first report, “The State of the Housing Counseling Industry,” published in 2008, presented the first systematic overview of the housing counseling industry and HUD-approved housing counseling agencies and the clients they serve.
We are pleased to add to the limited literature on housing counseling programs with the publication of two separate reports from the Housing Counseling Outcome Evaluation, the second study in this series. This evaluation is designed to document the circumstances of housing counseling clients enrolled in foreclosure and pre-purchase counseling in the fall of 2009 at a broad sample of HUD-funded housing counseling agencies across the country. The study findings are being published as two separate reports, Foreclosure Counseling Outcome Study and Pre-Purchase Counseling Outcome Study.
The Foreclosure Counseling Outcome Study provides information on who accesses counseling services when facing challenges in paying their mortgage loan, what services those clients obtain, and identifies the outcomes the clients experienced in the following 18 months (though it cannot assert that the counseling caused the outcomes). A few of the interesting findings from the report are:
•Most study participants had tried to contact their servicer when they first fell behind but had not been successful in negotiating with their lenders.
•With a counselor’s help, 69 percent of counselees obtained a mortgage remedy, and 56 percent were able to become current on their mortgages.
•Nearly 70 percent of clients who sought counseling before becoming delinquent were in their home and current on their mortgage payments at the 18-month follow-up period, whereas only 30 percent of clients who were 6 or more months behind at the time they entered counseling were in their home and current at follow-up.
•Telephone counseling clients tended to have higher incomes, higher savings, were less percentage minority, and more geographically dispersed than in-person counseling clients. Telephone counseling clients also achieved stronger housing outcomes (more mortgage modifications, more balance reductions, and more likely to be in their home and current at follow-up) than in-person counseling clients. This does not constitute proof that telephone counseling is as effective as in-person counseling for any individual client. Nevertheless, it
FORECLOSURE COUNSELING OUTCOME STUDY: FINAL REPORT HOUSING COUNSELING OUTCOME EVALUATION
FOREWORD
suggests that the expansion of telephone counseling during the foreclosure crisis provided an important alternative resource for individuals and communities—particularly those living in areas without an in-person counseling provider.
The Foreclosure Counseling Outcome Study is one of the few studies that documents housing outcomes in relation to specific counseling services received. The findings of the Foreclosure Counseling Outcome study suggest that counseling helped motivated but vulnerable homeowners in the study to understand their options and navigate the loss mitigation process. Because early contact with an agency may be the most important factor in determining the options available to a distressed homeowner, dedicating resources to ensuring broad coverage of counseling services and to intensive outreach activities is likely to be valuable—even as experimental research such as HUD’s new study of the impact of different kinds of pre-purchase counseling on sustainable homeownership continues to try to identify the most effective counseling models.
Raphael W. Bostic, Ph.D.Assistant Secretary for Policy Development and Research
FORECLOSURE COUNSELING OUTCOME STUDY: FINAL REPORT HOUSING COUNSELING OUTCOME EVALUATION
FOREWORD
FORECLOSURE COUNSELING OUTCOME STUDY: FINAL REPORT
TABLE OF CONTENTSExecutive Summary ����������������������������������������������������������������������������������������������������������������������xi
Introduction ����������������������������������������������������������������������������������������������������������������������������11.1 Study Background ...................................................................................................................21.2 Study Research Questions .....................................................................................................131.3 Organization of the Report ................................................................................................... 15
Sampling and Data Collection ����������������������������������������������������������������������������������������������172.1 Sample Selection and Recruitment ........................................................................................ 172.2 Data Sources and Data Collection Methods .........................................................................23
3� Characteristics of Counseling Clients �����������������������������������������������������������������������������������293.1 Demographic Characteristics.................................................................................................293.2 Housing Characteristics ........................................................................................................323.3 Financial Characteristics .......................................................................................................343.4 Chapter Summary .................................................................................................................40
4� Mortgage Characteristics, Reasons for Delinquency, and Lender Interactions Before Seeking Counseling��������������������������������������������������������������������������������������������������� 424.1 Length of Tenure, Incidence of Refinancing, and Use of Refinance Cash .............................424.2 Home Mortgage Loan Search Process ...................................................................................454.3 Mortgage Characteristics .......................................................................................................484.4 Extent of and Reasons for Getting Behind on Mortgage .......................................................554.5 Contact With Lenders Before Seeking Counseling................................................................604.6 Chapter Summary .................................................................................................................63
5� Counseling Services �������������������������������������������������������������������������������������������������������������� 665.1 Entry Into Housing Counseling ............................................................................................665.2 Characteristics of Foreclosure Mitigation Counselors ............................................................695.3 Housing Counseling Services Received ................................................................................. 745.4 Housing Remedies Used by Foreclosure Mitigation Clients ..................................................805.5 Satisfaction With Counseling Services ..................................................................................855.6 Chapter Summary .................................................................................................................86
6� Counseling Outcomes and Factors That Affect Outcomes ��������������������������������������������������� 886.1 Outcomes 18 Months After the Initial Counseling Session ...................................................886.2 Housing Outcomes and Homeowner Characteristics ............................................................936.3 Characteristics of In-Person and Telephone Counseling Clients ............................................99
viFORECLOSURE COUNSELING OUTCOME STUDY: FINAL REPORT HOUSING COUNSELING OUTCOME EVALUATION
TABLE OF CONTENTS
1.
2.
6.4 Counseling Services and Outcomes for In-Person and Telephone Counselees .....................1026.5 Chapter Summary ............................................................................................................... 1196.6 Overall Study Conclusions ..................................................................................................120
Appendix A� Statistical Weighting to Account for Sampling and Nonresponse Bias �����������122
Appendix B� Baseline Survey ����������������������������������������������������������������������������������������������� 125
Appendix C� Service Tracking Survey ���������������������������������������������������������������������������������� 137
Appendix D� Mortgage Characteristics Survey ���������������������������������������������������������������������141
Appendix E� Counselor Survey ���������������������������������������������������������������������������������������������143
Appendix F� Follow-up Telephone Survey ����������������������������������������������������������������������������146
Appendix G� Foreclosure Proceedings and Legal Stays ���������������������������������������������������������166
References ����������������������������������������������������������������������������������������������������������������������������������171
viiFORECLOSURE COUNSELING OUTCOME STUDY: FINAL REPORT HOUSING COUNSELING OUTCOME EVALUATION
TABLE OF CONTENTS
LIST OF EXHIBITSExhibit 1-1. Options for Avoiding Foreclosure and Staying in the Home .........................................5
Exhibit 1-2. Options for Avoiding Foreclosure and Leaving the Home .............................................7
Exhibit 1-3. Making Home Affordable Program Components .......................................................10
Exhibit 2-1. Agencies Participating in the Housing Counseling Outcome Evaluation, Foreclosure Mitigation Counseling Study ................................................................... 19
Exhibit 3-1. Select Characteristics of Study Participants, National Foreclosure Mitigation Counseling Counselees, and All U.S. Homeowners ....................................................31
Exhibit 3-2. Race and Ethnicity of Study Participants Compared With All Recipients of HUD-Funded Counseling and Education ..................................................................32
Exhibit 3-3. Location and Housing Characteristics of Study Participants .......................................33
Exhibit 3-4. Study Participants’ Annual Income at Study Enrollment, Self-Reported .....................35
Exhibit 3-5. Study Participants’ Sources of Income at Study Enrollment, Self-Reported ................35
Exhibit 3-6. Study Participants’ Nonretirement Savings, Retirement Savings, and Total Retirement and Nonretirement Savings at Study Enrollment ......................................36
Exhibit 3-7. Distribution of FICO Scores and VantageScores at Baseline .......................................37
Exhibit 3-8. Study Participants’ Gross Monthly Income and Monthly Scheduled Debt Payments ............................................................................................................38
Exhibit 3-9. Study Participants’ Prior Mortgage Delinquency and Foreclosure as Reported in Baseline Survey ........................................................................................39
Exhibit 4-1. Percent of Counselees by Year of Purchase ..................................................................43
Exhibit 4-2. Study Participants’ Incidence of Refinancing at Time of Seeking Counseling .............43
Exhibit 4-3. Study Participants’ Incidence of Refinancing by Counselee Age .................................44
Exhibit 4-4. Most Common Uses of Cash From Refinancing .........................................................45
Exhibit 4-5. Lender Type, Source of Lender, and Number of Lenders Contacted ...........................46
Exhibit 4-6. Lender Type by Number of Lenders Contacted ...........................................................47
Exhibit 4-7. Study Participants’ Perceptions of Lender Treatment at Loan Origination ..................48
Exhibit 4-8. Study Participants’ Loan Type at Time of Seeking Counseling ...................................49
Exhibit 4-9. October 2009 FICO Score by Mortgage Type ............................................................50
Exhibit 4-10. Number of Lenders Contacted by Loan Type .............................................................50
Exhibit 4-11. Mortgage Interest Rates at Loan Origination .............................................................. 51
Exhibit 4-12. Interest Rate on Fixed-rate Mortgages for Study Participants Compared With National Average, by Year of Loan Origination, 1994–2009 ..............................52
Exhibit 4-13. Interest Rate on Adjustable-rate Mortgages for Study Participants Compared With National Average, by Year of Loan Origination, 2002–2007 .............................53
Exhibit 4-14. Mortgage Loan Amount and Estimated Home Value at Time of Seeking Counseling .....................................................................................................54
viiiFORECLOSURE COUNSELING OUTCOME STUDY: FINAL REPORT HOUSING COUNSELING OUTCOME EVALUATION
LIST OF EXHIBITS
Exhibit 4-15. Loan-to-Value Ratio at the Study Participants’ Time of Seeking Counseling Based on Counselor-Provided Information ..................................................................54
Exhibit 4-16. Percent of Study Participants by Number of Months Behind on Mortgage at Time of Seeking Foreclosure Counseling ....................................................................56
Exhibit 4-17. Distribution of Number of Months Behind on Mortgage Among Study Participants Reporting Being Behind ..........................................................................56
Exhibit 4-18. Reasons for Getting Behind on Mortgage, Among Counselees Who Were Behind at Time of Seeking Assistance .........................................................................58
Exhibit 4-19. Groupings of Reasons for Falling Behind ....................................................................59
Exhibit 4-20. Percent of Study Participants Behind on Mortgage by Reason Grouping ....................60
Exhibit 4-21. Lender/Servicer Advice to Homeowner ....................................................................... 61
Exhibit 4-22. Reasons Study Participants Did Not Contact a Lender When Realized Behind on Payments ....................................................................................................62
Exhibit 4-23. What Study Participants Would Do Differently Given the Opportunity ....................63
Exhibit 5-1. Study Participants’ Main Reasons for Seeking Counseling..........................................67
Exhibit 5-2. Top Sources of Referral to HUD Housing Counseling Agency ..................................68
Exhibit 5-3. Housing Counseling or Financial Education for Study Participants in 3 Previous Years .......................................................................................................69
Exhibit 5-4. Demographic Characteristics of Counselors ................................................................70
Exhibit 5-5. Counselors’ Years of Experience in 2009 .....................................................................71
Exhibit 5-6. Year Counselors Entered the Housing Counseling Field .............................................72
Exhibit 5-7. Counselor Training and Certifications ........................................................................73
Exhibit 5-8. Type of Counseling Services Received (percent of clients) ...........................................75
Exhibit 5-9. Mode of Counseling Service Delivery .........................................................................76
Exhibit 5-10. Time in Counseling by Mode of Counseling ..............................................................76
Exhibit 5-11. Total Hours of Counseling or Education.....................................................................77
Exhibit 5-12. Percent of Service Engagements by Session Type .........................................................78
Exhibit 5-13. Key Activities Undertaken With Study Participants in Individual Sessions .................79
Exhibit 5-14. Topics Covered In Counseling Study Participants on Delinquency Options ...............80
Exhibit 5-15. Strategies for Avoiding Foreclosure ..............................................................................80
Exhibit 5-16. Next Steps to be Taken by Counselor or Client ...........................................................81
Exhibit 5-17. Housing Remedies Obtained by Counselees ...............................................................84
Exhibit 5-18. Homeowner Satisfaction With Housing Counseling Received ....................................85
Exhibit 6-1. Housing and Mortgage Status at the 18-Month Follow-up .........................................89
Exhibit 6-2. Outcomes for Study Participants No Longer in the Home at Follow-up .....................90
Exhibit 6-3. Comparison of Homeowner Incomes at Baseline and Follow-up ................................91
ixFORECLOSURE COUNSELING OUTCOME STUDY: FINAL REPORT HOUSING COUNSELING OUTCOME EVALUATION
LIST OF EXHIBITS
Exhibit 6-4. Underwriting Characteristics at Baseline and Follow-up .............................................92
Exhibit 6-5. Test for Whether Clients With Different Housing Outcomes Have Different Mean Characteristics, Underwriting Characteristics, Months Behind on Mortgage, Loan Characteristics, and Reasons for Being Behind ..................................................95
Exhibit 6-6. Test for Whether Clients With Different Housing Outcomes Have Different Mean Characteristics, Client Financial, and Demographic Characteristics .................96
Exhibit 6-7. Housing Outcomes by Client Characteristics: Underwriting Characteristics, Months Behind on Mortgage, Loan Characteristics, and Reasons for Being Behind ................97
Exhibit 6-8. Housing Outcomes by Client Characteristics, Client Financial, and Demographic Characteristics ................................................................................98
Exhibit 6-9. Housing Outcomes at Follow-up by Months Behind on Mortgage at Baseline ...........99
Exhibit 6-10. Client and Neighborhood Characteristics of In-Person and Telephone Counseling Clients .................................................................................................... 101
Exhibit 6-11. Mortgage Delinquency, Underwriting Characteristics, Loan Features, and Reason for Being Behind, Among In-Person and Telephone Clients .........................102
Exhibit 6-12. Counseling Duration and Counselor Intervention With Lender, by Counseling Type ................................................................................................... 103
Exhibit 6-13. Specification and Definition of Covariate Measures ..................................................105
Exhibit 6-14. Telephone Counseling and Factors Associated With Counseling Duration and Intervention With Lender ..........................................................................................108
Exhibit 6-15. Receipt of Mortgage Remedies Among In-Person and Telephone Clients ................. 110
Exhibit 6-16. Telephone Counseling and Factors Associated With Mortgage Remedies Received .. 114
Exhibit 6-17. Housing Outcome by Counseling Type .................................................................... 115
Exhibit 6-18. Housing Outcomes by Mortgage Remedy Categories ............................................... 116
Exhibit 6-19. Telephone Counseling and Factors Associated With Housing Outcomes .................. 118
xFORECLOSURE COUNSELING OUTCOME STUDY: FINAL REPORT HOUSING COUNSELING OUTCOME EVALUATION
LIST OF EXHIBITS
EXECUTIVE SUMMARY
INTRODUCTION TO STUDYThe Foreclosure Counseling Outcome Study enrolled 824 homeowners seeking foreclosure mitigation services in the fall of 2009 from 24 HUD-funded counseling agencies across the country. The study collected information on counselees’ personal and financial characteristics, the circumstances that led them to seek housing counseling services, the services they received over a 6-month period, and select housing outcomes approximately 18 months later.
This report describes in detail the characteristics of homeowners struggling to keep their homes and the counseling services that they received. The study does not include a control group or causal design and therefore cannot say what would have happened to this group of homeowners had they not received foreclosure counseling through a HUD-funded agency. Instead, the objective of the study is to document the extent and nature of the counseling services, mortgage remedies, and housing outcomes among a broad sample of foreclosure counseling clients—as well as the characteristics of those clients.
The results of the study are consistent with counseling helping distressed homeowners who want to stay in their homes. In particular, the study finds that home retention was much more common among homeowners in the study who were able to secure some type of mortgage remedy and that a large share of counseled homeowners were able to obtain such a remedy within the 18-month follow-up period.
Given the increasing use of telephone-based counseling to deliver counseling services, the study also examines client characteristics and study outcomes separately for in-person clients and for telephone clients. The results do not provide any evidence that the use of telephone-based services was any less effective than in-person counseling for the study participants. Instead, the study finds substantial differences in the characteristics of the clients who sought counseling through each channel that likely affected their housing outcomes.
STUDY CONTEXTThe fall of 2009, when counseling clients enrolled in the study, presented homeowners with both the worst housing market since the Great Depression and an expanded, evolving range of resources to help them keep their homes. Whereas earlier defaults in the national foreclosure crisis were largely caused by risky loans, serious mortgage delinquencies continued to rise in 2009 because of unemployment,
xiFORECLOSURE COUNSELING OUTCOME STUDY: FINAL REPORT HOUSING COUNSELING OUTCOME EVALUATION
EXECUTIVE SUMMARY
underemployment, and lost wages. Unemployment poses a more difficult problem for home retention than loans with excessive or adjusting interest rates that might simply be frozen to help resolve the mortgage delinquency. Homeowners also saw their homes lose value. As a result, many homeowners could not afford to make their mortgage payments and also could not refinance their mortgages or sell their homes.
Faced with these challenges, millions of homeowners sought free housing counseling provided by HUD-approved counseling agencies. Those agencies had access to increased federal funding, both through HUD appropriations and through the National Foreclosure Mitigation Counseling (NFMC) program—a tremendous expansion of funding for foreclosure prevention channeled through NeighborWorks® America. The increased federal funds allowed agencies to hire new counselors, many with prior experience in real estate or lending, and to train existing housing counselors in foreclosure mitigation.
At the time counselees enrolled in this study, the federal Home Affordable Modification Program (HAMP) and lender-specific mortgage modification programs were newly available and offered more options for homeowners at risk of foreclosure.1 Prior to HAMP, modifications were less likely to reduce borrowers’ monthly payments, with less than one-half of modifications in 2008 resulting in a reduction in borrowers’ monthly payments.2 Since the advent of HAMP in 2009 and the lender programs, the vast majority of loan modifications now reduce monthly payments to increase the chance that borrowers will be able to stay in their homes.
Most counselees in this study were also affected by one of two types of foreclosure stays, which is an important contextual factor to bear in mind in assessing their housing outcomes. A foreclosure stay places foreclosure proceedings temporarily on hold and extends the overall timeline to complete the foreclosure. The types of stays were those enacted by state governments (some applied only in certain cities, counties, or court jurisdictions), and those enacted in the wake of the robo-signing scandal. Legal stays on foreclosures were in effect in 20 states where counselees participating in this study lived. As a result, up to 61 percent of study participants may have gained more time before foreclosure to negotiate an alternate solution or begin saving money for new housing. During the period of this study, five of the largest mortgage servicers in the nation temporarily halted foreclosure proceedings when it was revealed that these companies had not performed due diligence reviews before foreclosing on homeowners. These delays in the foreclosure process may be evident in continued unresolved delinquencies among study participants who might otherwise have lost their home to foreclosure during the 18-month follow-up period.
1. Although HAMP was available at the time of study enrollment, the study design largely took place in 2008, before the creation of HAMP. As a result, the study did not collect detailed information on HAMP.
2. OCC and OTS Mortgage Metric Report, Fourth Quarter 2008: http://mortgage.ocregister.com/files/2009/04/mortgage-metrics-4q-20081.pdf.
xiiFORECLOSURE COUNSELING OUTCOME STUDY: FINAL REPORT HOUSING COUNSELING OUTCOME EVALUATION
EXECUTIVE SUMMARY
STUDY METHODOLOGYIn the fall of 2009, the research team worked with a sample of 24 HUD-funded counseling agencies dispersed throughout the United States to identify and enroll homeowners newly seeking foreclosure counseling. The 24 agencies included 6 agencies that provide only telephone counseling and are associated with the Homeowners HOPE Hotline, 4 agencies that enrolled some clients in person and others by telephone, and 14 agencies that enrolled only clients served in person. The counseling agencies enrolled a total of 824 homeowners into the study. About one-half of the study participants received counseling services by telephone and one-half received counseling services in person.
At the time of enrollment, study participants completed baseline surveys that collected information on their demographic, financial, and housing characteristics, mortgage delinquency status, and reasons for seeking counseling. For the next 6 months, housing counselors recorded details about the counseling services provided to the study participants, using an online data entry system designed for the study. At the end of the 6-month tracking period, counselors provided any known information about the client’s housing situation and resolution of the delinquency.
About a year later, or approximately 18 months after the first participants enrolled in the study, the counselees were invited to complete a follow-up survey by telephone. The survey documented their current housing situations and the foreclosure mitigation strategies pursued during and after housing counseling. Of the study sample, 65 percent (539 of 824 counselees) completed the follow-up telephone survey.
To supplement the information collected through the surveys and from counselors, the study team obtained credit report data for all study participants at two points in time: October 2009 (approximately the time of study enrollment) and March 2011 (approximately the time of the follow-up survey). The credit report data provided information on counselees’ credit standing, debt levels, and prior mortgage delinquencies, foreclosures, and bankruptcy.
CHARACTERISTICS OF STUDY PARTICIPANTSThe homeowners who sought foreclosure counseling in the fall of 2009 and enrolled in the study tended to be younger than homeowners overall but also included a substantial share of middle-aged homeowners. The majority of study participants (59 percent) were women, compared with 43 percent of U.S. homeowners overall. Study participants were more likely to be non-White or Hispanic than U.S. homeowners overall, which is consistent with the disproportionate rate of foreclosures among racial and ethnic minorities in recent years. In particular, 30 percent of study counselees were African American, while only 8 percent of U.S. homeowners are African American.
The study participants had lower incomes than most homeowners. The median income of foreclosure counselees at the time of seeking counseling was approximately $36,000, which is only 56 percent of the median household income for all U.S. homeowners at the time. About 70 percent of counselees had at least some household income from current employment.
xiiiFORECLOSURE COUNSELING OUTCOME STUDY: FINAL REPORT HOUSING COUNSELING OUTCOME EVALUATION
EXECUTIVE SUMMARY
Most counselees in the study had little in savings by the time they sought counseling and thus little money to tap into to pay their mortgages. Overall, 36 percent of counselees had no savings at all, and 61 percent had total savings (nonretirement or retirement savings) of $1,000 or less.
The homeowners in the study also often had high monthly debt burdens when they first sought help. The median front-end ratio (total mortgage payments as a percentage of gross income) upon entering counseling was 42.5 percent, and the median back-end debt burden (total debts as a percentage of gross income) was 55.5 percent. These debt burdens are lower than the average for people who received HAMP modifications in recent years, but nevertheless illustrate the depths of counselees’ financial difficulties.
Finally, a substantial number of the homeowners in the study had experienced financial strain in the past. Among homeowners who reported being behind on their mortgages at the time they sought counseling, 38 percent said this was not their first time getting behind. Among all counselees, 7 percent reported having lost a home to foreclosure in the past—with most of these experiences before 2000. Based on credit report data, about 14 percent of counselees had a major derogatory rating (over 120 days past due) on a first mortgage at some point in the past, mostly in the previous 2 years.
MORTGAGE CHARACTERISTICS, REASONS FOR DELINQUENCY, AND LENDER INTERACTIONSMost counselees in the study (65 percent) had owned their homes for less than 10 years. About one-third purchased between 2005 and 2007, a risky period for loan originations. At the time of seeking counseling, less than one-half of the counselees (45 percent) still had the original loan they obtained to purchase the home; the others had refinanced one or more times. Counselees over the age of 35 were more likely to have refinanced than younger owners, as were owners who had purchased before 2001. About three-fourths of study participants reported taking cash out from their refinance, most often for home improvements or repairs or for bill or debt consolidation.
About two-thirds of counselees in the study obtained their most recent loan from a mortgage broker or mortgage company. The next most common lender type was the counselee’s regular bank, used by 18 percent of counselees. Other types of lenders were much less common. Most counselees did not meet or speak with any other lenders beyond the lender from which they obtained their mortgages.
About one-half of the counselees in the study (52 percent) reported on the baseline survey that they thought they were treated fairly by the lender from which they obtained their most recent home loan. Similar numbers said they were not treated fairly (23 percent) as did not know whether or not they had been treated fairly (25 percent). We did not find any significant difference in the interest rate at origination between people who said the lender treated them fairly and people who said the lender did not treat them fairly. The study did not collect any information that would allow us to assess the extent of fraud in the loan originations.
xivFORECLOSURE COUNSELING OUTCOME STUDY: FINAL REPORT HOUSING COUNSELING OUTCOME EVALUATION
EXECUTIVE SUMMARY
We obtained mortgage data for 52 percent of the counselees in the study. The mortgage data were recorded by counselors using the information available to the counselor at the time, which could be loan documents or verbal reporting by the client. Of the counselees for whom we obtained mortgage data, 78 percent had fixed-rate mortgages, 13 percent had adjustable-rate mortgages (ARMs), 8 percent had interest-only mortgages, and 1 percent had some other type of mortgage. Most counselees with fixed-rate mortgages obtained loans at interest rates that were in line with prime market rates. Although the sample size is very small, counselees with ARMs appear generally to have obtained ARMs at interest rates that were higher than the national average for prime mortgages in those years.
Based on the information reported by housing counselors, we estimate that slightly less than one-half of the counselees for whom we collected mortgage data had mortgages in negative equity at the time they sought counseling (that is, the total amount of the mortgage exceeded the estimated value of the house).3 This share is higher than the estimated 23 percent of mortgages nationwide that were in negative equity in 2009.4 This comparison suggests that homeowners seeking foreclosure counseling in the fall of 2009 may have been more likely than homeowners in general to have a mortgage that was underwater. The estimate of negative equity for this study is limited, however, by its reliance on self-reported data and the high level of missing information.
More than one-half (54 percent) of study participants were more than 1 month behind on their mortgage payments at the time they sought counseling, but 46 percent initiated counseling before missing a payment. Most counselees who were behind were between 1 and 6 months behind, and most had experienced an income reduction that caused them to fall behind. Some of these counselees also experienced an increase in housing expenses or said that they had never been able to afford their mortgage payments. However, only a modest share of counselees (14 percent) fell behind on their payments because of increased payments or a chronically unaffordable mortgage without also experiencing an income reduction. Furthermore, less than 10 percent of clients fell behind on their mortgages only because of an increase in non-housing expenses such as credit card debt, although about one-third of counselees reported credit card debt as a factor in their mortgage delinquency.
A large majority (82 percent) of the counselees who were behind on their mortgages tried to contact their servicers before seeking counseling. This rate of servicer contact is high—evidence that the people who seek counseling may be more proactive than other delinquent homeowners. Among the 18 percent of delinquent counselees who did not contact their servicer before seeking counseling, the most common reasons were that they thought they would be able to make up the missed payment, they did not think the lender would be able to help, they were reluctant to discuss their financial problems, or they were afraid the lender would foreclose on them more quickly.
3. The source of the information on house values in most cases was the client’s estimate. In some cases the counselor estimated the value or used an online valuation tool (for example, Zillow.com).
4. Data from 2009 presented in CoreLogic, U.S. Housing and Market Trends—October 2011, accessed at http://www.corelogic.com/about-us/researchtrends/asset_upload_file815_13416.pdf.
xvFORECLOSURE COUNSELING OUTCOME STUDY: FINAL REPORT HOUSING COUNSELING OUTCOME EVALUATION
EXECUTIVE SUMMARY
COUNSELING SERVICES AND REMEDIES PURSUEDENTRY INTO HOUSING COUNSELINGThe homeowners in the study reported that they sought counseling because they wanted to avoid foreclosure and considered lower monthly payments their best option for doing so. About one in four counselees had received credit or debt counseling in the prior 3 years, suggesting that a substantial share of counselees had financial challenges that predated their entry into foreclosure counseling and further suggesting that these counselees were proactive in seeking assistance.
About one-third of counselees reported being referred to counseling by their lender or mortgage servicer. These referrals likely took place through letters from the servicer, because only 15 percent of counselees said they were advised to contact a counseling agency when they initially contacted their servicers by telephone to discuss their difficulty making payments. Counselees also learned about counseling agencies from family members or friends (27 percent) or Internet searches (23 percent).
COUNSELING SERVICES RECEIVEDOne-half of the counselees in this study received counseling in person (49 percent), while the other one-half (51 percent) received counseling over the telephone, mainly from large call centers affiliated with the HOPE Hotline. The increasing use of telephone counseling is consistent with trends in the counseling industry. In particular, it reflects the use of foreclosure hotlines to respond to the dramatic increase in demand for counseling services during the foreclosure crisis, including demand from homeowners who do not live near a housing counseling agency.
Counselees most often received between 1 and 2 hours of counseling, during which counselors helped them prepare household budgets and loss mitigation packets and explained the range of available home retention options. For one-third of the counselees (33 percent), the counselor intervened directly with the lender on the client’s behalf.
Homeowners counseled in person were more likely to have more than one session with a counselor than homeowners counseled by telephone. On average, homeowners counseled in person also spent nearly an hour more with their counselors in total than those counseled by telephone (129 versus 75 minutes). These differences in the length of services likely result in part from differences inherent in the modes of counseling. As discussed in the following section, however, we also found that clients served by in-person agencies on average faced significantly greater financial challenges than those counseled by telephone, meaning that they likely required more time to resolve their mortgage delinquencies.
COUNSELOR CHARACTERISTICSMost counselors working with study participants had entered the counseling industry as it expanded in response to the foreclosure crisis. As the industry has expanded, agencies have continued to hire counselors with high levels of education and training. Of counselors in the study, 87 percent had at
xviFORECLOSURE COUNSELING OUTCOME STUDY: FINAL REPORT HOUSING COUNSELING OUTCOME EVALUATION
EXECUTIVE SUMMARY
least some college education and 53 percent had a bachelor’s degree or higher. Of the counselors in the study, 42 percent had prior experience in lending, real estate, or financial planning, giving them valuable perspectives to understand mortgages and loss mitigation options. As a whole, counselors serving clients in this study exceeded minimum training requirements established by HUD. About two-thirds of counselors had received more than 2 weeks of training in the previous 3 years, and one-third had received more than 4 weeks of training. Nearly all counselors in the study held multiple certifications, the most common being the National Foundation for Credit Counseling certification in consumer credit counseling and the NeighborWorks® Center for Homeownership Education and Counseling Foreclosure Intervention Specialty.
HOUSING REMEDIES OBTAINEDWithin 18 months of seeking counseling, most homeowners in the study (69 percent) had pursued one of seven home retention options about which they were surveyed: loan modification, refinance, repayment or forbearance plan, partial claim or partial release, balance reduction, a loan or grant from another lender, or bankruptcy.
Study participants most often received temporary or permanent loan modifications (39 percent of clients), meaning that the lender agreed to change the original terms of the mortgage—such as the payment amount, length of loan, or interest rate. Counselees were also likely to have accepted a repayment or forbearance plan (32 percent of clients), in which the lender agreed to spread out the past due amount—added on to the current mortgage payments—over several months to bring the mortgage current (repayment plan) or the lender agrees to suspend or reduce the monthly mortgage payments for a specific period of time (forbearance agreement). The prevalence of loan modifications is likely related to the introduction of HAMP several months before counseling clients enrolled in this study, which required institutions receiving Troubled Asset Relief Program (TARP) money to participate as well as offering monetary incentives to participating servicers.
A substantial share of study participants (41 percent) pursued more than one home retention option. Clients’ pursuit of multiple remedies likely reflected both the complementary nature of some remedies, as well as uncertainty on the part of counselors and clients about which remedy was likely to succeed. For example, a client facing a temporary loss of income may require forbearance during the period with reduced income, followed by a modification once the client reestablishes a stable income stream.
The least common remedies for study participants were mortgage refinance (5 percent) and receipt of loans or grants from another institution to pay back the delinquency (3 percent). The infrequent use of refinancing may reflect counselees being underwater on their mortgages—and not qualifying for a refinance that would pay off the outstanding balance. It may also reflect the difficulty of qualifying for a new loan for clients with a delinquency in their recent credit history or clients whose income or debt ratio does not meet the tighter underwriting standards adopted by many lenders during this period.
Counselors very rarely reported suggesting that homeowners file for bankruptcy (3 percent of clients). A much larger share of counselees (21 percent), however, self-reported that they filed bankruptcy in
xviiFORECLOSURE COUNSELING OUTCOME STUDY: FINAL REPORT HOUSING COUNSELING OUTCOME EVALUATION
EXECUTIVE SUMMARY
the 18 months after entering counseling. These homeowners may have filed bankruptcy to delay foreclosure proceedings or to reduce other debts to help them devote more resources to their mortgages.
SATISFACTION WITH COUNSELINGOverall, 68 percent of study participants reported that they were satisfied with the counseling services they received. As might be expected, levels of satisfaction were higher among those clients who were able to achieve their goal of retaining their homes. Nonetheless, one-third of counselees who no longer lived in their homes reported being very satisfied with the counseling received. About 40 percent of counseling clients said they wanted a higher level of involvement by the counselor.
HOMEOWNER OUTCOMESThis study examined several housing outcomes for participants approximately 18 months after they sought foreclosure counseling services. The main outcome analyzed was the counselee’s homeownership status, using three categories: in the same home and current on the mortgage (in home and current), in the same home and behind on the mortgage (in home and behind), and no longer in the same home (out of home). Retaining a home is not an unambiguously positive outcome, especially if ownership is no longer affordable or desirable for the homeowner. Similarly, giving up a home may be a positive outcome for some homeowners. The report uses in the home and current on the mortgage as the reference category since most study participants indicated that was their goal upon entering counseling. We also examined changes in participants’ credit scores and debt burden levels between baseline and follow up.
These outcomes reflect key homeowner outcomes that are closely related to the purpose and content of foreclosure counseling. The outcomes should be interpreted, however, within the context of homeowners’ broader housing needs and financial health. The ultimate effects of foreclosure counseling might include increased long-term wealth, improved health through reduced stress, and other outcomes that relate to individual and family well-being. In this way, the study outcomes are designed to provide a snapshot of the outcomes most closely tied to foreclosure counseling at one point in time—approximately 18 months after seeking counseling.
OVERVIEW OF OUTCOMESAfter 18 months from when clients initiated foreclosure counseling, 56 percent of clients were in the home and current on their payments, 28 percent were in the home and behind on their payments, and 16 percent were out of the home. Homeowners who were current at follow up include 43 percent of those who were behind when they sought counseling, which represents an improvement from baseline for this group of clients. At the time clients sought counseling, 54 percent were at least 1 month behind on their mortgage.
The credit scores of study participants improved modestly between baseline and follow up, with improvements concentrated among those who were in the home and current. Those in the home
xviiiFORECLOSURE COUNSELING OUTCOME STUDY: FINAL REPORT HOUSING COUNSELING OUTCOME EVALUATION
EXECUTIVE SUMMARY
and current improved their scores from 616 at baseline to 626 at follow up. Credit scores remained unchanged, at 571, for those in the home and behind on their mortgages; and decreased slightly, from 563 to 557, for those no longer in the home. In all cases, median credit scores remained below current standards for Federal Housing Administration and conventional mortgage loans. These low credit scores are an indication of the severity of counselees’ financial troubles and the long horizon over which they may require housing or financial counseling services.
Counselees’ monthly mortgage payments and front-end debt ratios decreased between baseline and follow up. These decreases reflect the presence of mortgage modifications, decreasing interest rates on ARM loans, and homeownership exit. The decrease was most pronounced among study participants who were out of the home at follow up, as these clients no longer had a mortgage payment. The median monthly payment for counselees who were current at follow up decreased from $1,404 to $1,089—a decrease of 22 percent.
Back-end debt ratios showed further decreases, suggesting that many counselees reduced both their monthly mortgage payments and their other consumer debt obligations. Among counseling clients who were in the home and current, the back-end ratio decreased by nearly 14 percentage points between baseline and follow up. Among clients who were in the home and behind, the back-end ratio decreased by about 10 percentage points. These decreases suggest that many clients may have successfully paid down debts or taken other steps to reduce in their monthly debt obligations.
COUNSELING OUTCOMES AND CLIENT CHARACTERISTICSFour findings emerged from the descriptive analysis of the relationship between client characteristics and housing outcomes. First, housing outcomes for foreclosure counseling clients were closely related to whether the client was delinquent at the time he or she sought counseling. Among clients who sought counseling before becoming delinquent, nearly 70 percent were in the home and current at follow up. In contrast, only 30 percent of clients who were 6 or more months behind at the time they entered counseling were in the home and current at follow up. Homeowners who seek counseling before becoming delinquent may be more organized or motivated in general, so the better outcomes for those who entered counseling early may reflect these types of differences as much as the benefits of earlier counseling. Nonetheless, it is suggestive that early counseling intervention may improve client outcomes by providing more opportunities to identify remedies before the borrower has accumulated a substantial amount of missed payments.
The second finding is that counselees’ underwriting characteristics at baseline were associated with different housing outcomes. On average, counselees who were in the home and current at follow up had higher credit scores at the time of seeking counseling than counselees who at follow up were either in the home and behind or out of the home. Higher baseline credit scores may mean that counselees had more options for refinancing or modifying the loan; alternatively, the higher baseline credit scores may simply reflect the lower levels of baseline delinquency among those counselees who were in the home and current at follow up.
xixFORECLOSURE COUNSELING OUTCOME STUDY: FINAL REPORT HOUSING COUNSELING OUTCOME EVALUATION
EXECUTIVE SUMMARY
Third, we did not find large differences in the reasons for delinquency among counselees with different housing outcomes. Overall, approximately three-fourths of the delinquent clients in each outcome category reported a reason related to income loss. We also found that counselees who reported becoming delinquent because of housing expenses—rather than a loss of income or increase in other expenses—were most likely to be in the home and current at follow up, suggesting that counseling and mortgage remedies may be most able to assist clients with issues related to housing expenses.
The fourth finding from the descriptive analysis of the relationship between client characteristics and housing outcomes is that study participants’ demographic and financial characteristics were not strongly associated with housing outcomes. The differences in client characteristics observed were generally small and not consistent with systematic differences in housing outcomes across demographic groups. For example, there are not strong patterns in housing outcomes by income, age, gender, marital status, race, or ethnicity.
COUNSELING OUTCOMES AND MODE OF COUNSELING DELIVERYThe dramatic increase in demand for foreclosure counseling services led to the establishment of foreclosure hotlines and to reliance on telephone counseling to reach clients in areas without a local counseling agency. Although many counseling agencies previously offered telephone-based services, this expansion of telephone counseling was accompanied by questions about the relative effectiveness of telephone-based services—as the evaluation literature does not yet provide conclusive evidence about the relative effectiveness of alternative delivery channels. In response to these concerns, the report analyzed separately the outcomes of telephone clients and in-person clients.
The findings show stronger housing outcomes among telephone clients than among in-person clients, but also suggest that in-person counseling providers served clients with more intensive needs. The in-person clients in the study, on average, had lower incomes, were more likely to live in urban areas, and included a much higher share of minority clients. In contrast, the telephone clients in the study had higher levels of income and savings, on average, than the in-person clients, and were more geographically dispersed. The housing outcomes of telephone and in-person clients may therefore reflect these differences in client characteristics. In-person clients received longer counseling sessions and were more likely to return for additional services. In contrast, a significantly higher share of telephone clients received mortgage modifications and balance reductions, and a significantly lower share of telephone clients were out of the home 18 months after counseling.
These differences in the counseling services, mortgage remedies, and housing outcomes of telephone clients and in-person clients remain in regression analyses that control for observed delinquency, underwriting, demographic, and neighborhood characteristics. The differences in the client populations and housing markets served by in-person and telephone counseling providers, however, likely mean that the available measures are not able to fully capture the differences between in-person and telephone clients. As a result, the regression analyses are unlikely to isolate the causal impact of in-person versus telephone-based delivery of counseling services. Instead, the results document the
xxFORECLOSURE COUNSELING OUTCOME STUDY: FINAL REPORT HOUSING COUNSELING OUTCOME EVALUATION
EXECUTIVE SUMMARY
outcomes achieved by telephone and in-person clients and identify the factors associated with positive housing outcomes.
The study findings suggest that telephone clients are at least as likely as in-person clients to receive mortgage remedies and to remain in their homes. This does not constitute proof that telephone counseling is as effective as in-person counseling for any individual client. Nevertheless, it suggests that the expansion of telephone counseling during the foreclosure crisis provided an important alternative resource for individuals and communities—particularly those living in areas without an in-person counseling provider.
OVERALL CONCLUSIONSThe findings of the Foreclosure Counseling Outcome study suggest that counseling helped the motivated but vulnerable homeowners in the study to understand their options and navigate the loss mitigation process. The homeowners in this study had lower incomes than the average U.S. homeowner and were more likely to be members of racial and ethnic minority groups. About three-fourths of the homeowners who had fallen behind on their payments did so because of a loss of income, and very few had any savings to draw upon to repay missed mortgage payments. Most study participants had tried to contact their servicer when they first fell behind but had not been successful in negotiating with their lenders.
With a counselor’s help, 69 percent of counselees obtained a mortgage remedy, and 56 percent were able to become current on their mortgages. Without a controlled experiment, this study cannot say what would have happened to this group of homeowners had they not received foreclosure counseling through a HUD-funded agency. Until this study, however, little research documented housing outcomes in relation to specific type of counseling services received. This study may therefore be useful for establishing benchmarks for the outcomes of foreclosure counseling clients. It also provides encouraging evidence that a high number of foreclosure counselees were able to avoid foreclosure and meet their stated goal of retaining homeownership by becoming current on their mortgages.
These conclusions can be applied to both clients counseled in person and clients who received telephone-based counseling services. The study separately documents the client characteristics and housing outcomes of in-person and telephone clients, describing differences in the types of clients and neighborhoods served through each channel. Although telephone clients often received less counseling time than in-person clients, they were more likely to report receiving a mortgage remedy and to remain in the home 18 months after counseling. Statistical analysis found that in large part the higher home retention rates of telephone clients were related to higher incomes and savings and lower levels of income delinquency than in-person clients; however, the analysis found no evidence that telephone counseling was less effective than in-person counseling. The comparison of in-person and telephone counseling highlights differences in the client populations and neighborhoods served by each channel and the potential for these approaches to play complementary roles in the provision of counseling services.
xxiFORECLOSURE COUNSELING OUTCOME STUDY: FINAL REPORT HOUSING COUNSELING OUTCOME EVALUATION
EXECUTIVE SUMMARY
These study findings suggest that broad access and intensive outreach may be more important than variations in the provision of services across counseling agencies. Because early contact with an agency may be the most important factor in determining the options available to a distressed homeowner, dedicating resources to ensuring broad coverage of counseling services and to intensive outreach activities is likely to be valuable—even as experimental research such as HUD’s new study of the impact of different kinds of pre-purchase counseling on sustainable homeownership continues to try to identify the most effective counseling models.
xxiiFORECLOSURE COUNSELING OUTCOME STUDY: FINAL REPORT HOUSING COUNSELING OUTCOME EVALUATION
EXECUTIVE SUMMARY
1� INTRODUCTIONSeveral million homes have already been repossessed as part of the foreclosure crisis that has been gripping American communities for nearly 5 years. And the tide of foreclosures has not yet begun to ebb. As of June 2011, about 1 in 8 American homeowners was delinquent on his or her mortgage.5 Some analysts predict that total foreclosures could reach 13 million before the housing market stabilizes (Li and Garrison, 2011), meaning that the country may not even be halfway through the foreclosure crisis (Bocian et al., 2011). Yet, even in the face of significant financial strain and substantial declines in home values, millions of troubled American homeowners remain committed to retaining their homes as evidenced by the extent to which they have taken advantage of free counseling funded by the federal government and provided through a broad spectrum of organizations throughout the country.
Since 2007 the federal government has committed more than $830 million to housing counseling, with special emphasis on delinquency counseling and foreclosure prevention, providing assistance to more than 5 million homeowners.6 Foreclosure mitigation counseling was a small portion of housing counseling agencies’ work before 2006 but in response to the national foreclosure crisis, housing counseling agencies have undergone a swift, massive transformation to reorient their services to delinquency and foreclosure mitigation counseling. HUD grants to housing counseling agencies from fiscal year 2007 through 2012 appropriations total approximately $323 million.7 In addition to funding through HUD, Congress has appropriated $508 million to NeighborWorks® America for National Foreclosure Mitigation Counseling (NFMC).8 This funding has allowed counseling agencies to hire many new staff members to serve a vastly increased pool of clients.
Yet little research describes in detail the circumstances of homeowners facing default, their avenues of help-seeking, and the housing counseling process itself. The purpose of the Foreclosure Counseling Outcome Study is to fill those gaps, based on data collection with a broad sample of foreclosure
5. Both the Mortgage Bankers’ Association National Delinquency Survey (http://www.mbaa.org) and Office of the Comptroller of the Currency OCC Mortgage Metrics Report (http://www.occ.treas.gov/publications) find about 12 percent of loans delinquent in the second quarter of 2011. Although foreclosures and serious delinquencies were declining, new delinquencies were rising because of the overall economic situation.
6. HUD-approved counseling agencies have served 4,784,662 delinquency and foreclosure clients from October 1, 2006 through June 30, 2011. Client volumes at HUD-funded counseling agencies are available in 9902 forms. See: NFMC has served 1,168,062 clients from December 2007 through June 30, 2011. See: http://www.nw.org/network/nfmcp/ documents/2011CongressionalReport.pdf. NFMC clients may also be reported on a HUD agency’s 9902 report.
7. Although this funds all types of counseling activities, in practice agencies devote the bulk of their resources to foreclosure mitigation counseling in response to demand for those services.
8. An additional $80 million of NFMC funding will be distributed in spring 2012. See: http://www.nw.org/network/foreclosure/nfmcp/documents/Round_6_Funding_Announcement_FINAL-1.pdf.
1FORECLOSURE COUNSELING OUTCOME STUDY: FINAL REPORT HOUSING COUNSELING OUTCOME EVALUATION
1. INTRODUCTION
mitigation clients at HUD-approved housing counseling agencies. This study examines the steps that homeowners took to address their mortgage delinquencies, the outcomes they had achieved approximately 18 months later, and the individual and neighborhood characteristics associated with different counseling outcomes.
This chapter provides an introduction to HUD housing counseling, the timing of the study relative to the national foreclosure crisis, and the foreclosure mitigation programs that were available to clients during the study period. The chapter then presents the research questions guiding the study and describes the organization of the report.
1�1 STUDY BACKGROUND1�1�1 HUD HOUSING COUNSELINGCongress first authorized HUD to provide for housing counseling services as part of the Housing and Urban Development Act of 1968. Counseling was authorized for mortgagors under the new Section 235 and 237 programs of the National Housing Act. Over time, Congress extended this authorization to include counseling for other types of households. HUD funds housing counseling for homebuyers, homeowners delinquent on their mortgages, homeowners seeking to refinance their mortgages, renters, and homeless individuals and families through HUD Approved Housing Counseling Agencies. To become HUD-approved, an agency must be a nonprofit, have successfully administered a housing counseling program for at least 1 year, have had an independent financial audit in the past 12 months, maintain records on housing counseling activities, and have sufficient resources and staff to implement its proposed counseling plan. As of 2011, approximately 2,300 housing counseling agencies approved by HUD provide services for counselees throughout the United States.
Housing counseling agencies may either apply for funding directly to HUD or obtain funding through national or regional intermediaries or state housing finance agencies that receive housing counseling grants from HUD. In FY 2010, HUD awarded $68 million in housing counseling grants to support provision of counseling services through 24 national and regional organizations, 5 multi-state organizations, and 484 state and local housing counseling agencies.9 These funds were used to provide more than 3 million units of counseling services—either group workshops or individual counseling—for people seeking assistance with purchasing a home, improving their credit and financial literacy, avoiding foreclosure, home repairs and maintenance, finding rental housing, or accessing homeless services.
This study comes at a critical time for policy discussions about federal support for housing counseling and the value of counseling for family, neighborhood, and community stability. Questions about the effectiveness of counseling and the need to support it contributed to Congress eliminating HUD funding for housing counseling in April 2011 for FY 2011 before reinstating it in November 2011 with $45 million for FY 2012—substantially less than FY 2010’s $68 million.
9. Another $5 million in grants were awarded to support counselor training and certification. See http://portal.hud.gov/hudportal/HUD?src=/press/press_releases_media_advisories/2010/HUDNo.10-269.
2FORECLOSURE COUNSELING OUTCOME STUDY: FINAL REPORT HOUSING COUNSELING OUTCOME EVALUATION
1. INTRODUCTION
This study is part of a multiyear investment in housing counseling research by HUD. The overall research agenda has three components:
1. An overall study of the housing counseling industry (Herbert, Turnham, and Rodger, 2008).2. An outcome evaluation of housing counseling, which was broken into two reports:
• Foreclosure Counseling Outcome Study (the current report).• Pre-purchase Counseling Outcome Study (Turnham and Jefferson forthcoming).
3. A Pre-purchase Homeownership Counseling Demonstration and Impact Study, expected to be completed in 2015.
The current Foreclosure Counseling Outcome Study was designed to document the circumstances of housing counseling clients, the nature of the assistance they received, and the outcomes realized with the support of housing counseling. The study was largely designed in 2008, at a time when the seriousness of the foreclosure crisis was well-recognized and had led to large-scale investment in housing counseling for foreclosure mitigation, but before the introduction of the federal Home Affordable Modification Program (HAMP), described in detail in the following section.
The study is based on a sample of 824 homeowners who sought foreclosure counseling services from one of 24 HUD-approved counseling agencies in the fall of 2009. The homeowners enrolled in the study at the time of seeking counseling and completed a baseline survey that captured their demographic characteristics and reasons for seeking counseling. For the next 6 months, housing counselors at the 24 agencies tracked the services provided to the study participants using a web-based system designed specifically for the study.
In the early spring of 2011, study participants were asked to participate in a telephone survey about the counseling they received and their current housing and financial situations. About 65 percent of the study sample (539 of 824 counselees) completed this follow-up survey. The study team also obtained credit reports for all study participants from two points in time: October 2009, approximately the time of study enrollment, and March 2011, approximately the time of the follow-up telephone survey. The credit report data, available for 95 percent of the study sample, include credit scores and information on mortgage amounts, monthly payments, and foreclosure status.
This report describes the characteristics of the sample foreclosure mitigation clients at the time they sought counseling, explains the type of assistance they were seeking and the counseling services they received over a 6-month period, and examines their housing and mortgage situations approximately 18 months after starting counseling. The report also analyzes the individual and neighborhood characteristics associated with different housing outcomes, focusing on the relationship between these characteristics and the likelihood that, 18 months after seeking counseling, a study participant would be in the home and current on the mortgage.
The remainder of this chapter reviews the national foreclosure crisis that existed at the time homeowners were enrolling into the study and the options for foreclosure mitigation that were available to them. We then present the research questions guiding the study and describe the contents of the report.
3FORECLOSURE COUNSELING OUTCOME STUDY: FINAL REPORT HOUSING COUNSELING OUTCOME EVALUATION
1. INTRODUCTION
1�1�2 THE NATIONAL FORECLOSURE CRISIS AND ECONOMIC RECESSIONHomeowners who sought counseling in the fall of 2009, the time enrollment into this study was conducted, faced the worst housing and labor markets since the Great Depression. The foreclosure crisis had begun several years earlier, in 2006, sparked to a great extent by investors strategically defaulting on mortgages when house prices started to drop and they found themselves owing more than the properties were worth. These early defaults exerted further downward pressure on house prices and created the environment for a massive wave of defaults on subprime mortgages starting in late 2006 (HUD, 2010). Many of the borrowers in this early wave of defaults obtained their loans during a surge in risky lending beginning in 2003 that included borrowers with marginal ability to pay, low documentation of income and assets, and adjustable-rate or hybrid mortgage products. Whereas in the past many borrowers had been able to refinance when they found themselves on the margin of affordability or when the interest rate on an adjustable-rate mortgage (ARM) reset upward, the decrease in house prices in 2006 meant borrowers increasingly had negative equity and could not refinance (HUD, 2010). Finally, as the housing and financial market collapse spread into nationwide recession in 2007, homeowners with prime mortgage terms also began to default in large numbers because of job losses and reduced income, as well as the effects of negative home equity in markets across the country (Quercia and Ding, 2009).
Serious mortgage delinquencies—especially for borrowers with prime mortgage terms—rose throughout 2009 because of unemployment, underemployment, and lost wages. The official unemployment rate in the fall of 2009, at the time foreclosure mitigation clients were enrolled into this study, was about 10 percent.10 The last quarter of 2009 was the seventh straight quarter of declines in the housing market: 13.6 percent of all mortgages were delinquent or nonperforming at the time, 7.1 percent were seriously delinquent, and 3.2 percent were in the foreclosure process. In sum, nearly 3.5 million mortgagors were seriously delinquent or in foreclosure proceedings on their primary lien at the time this study began.11
1�1�3 HOME RETENTION STRATEGIESHome retention options vary in terms of how the remedy alters the amount or terms of the mortgage, as well as the level of involvement by the lender or servicer.12 Exhibits 1-1 and 1-2 summarize the options that homeowners have to avoid foreclosure and stay in the home (exhibit 1-1) and to avoid foreclosure and leave the home (exhibit 1-2). Some of these options fall under lenders’ loss
10. Source: http://data.bls.gov/timeseries/LNS14000000. 11. OCC and OTS Mortgage Metrics Report: Disclosure of National Bank and Federal Thrift Mortgage Loan Data. Fourth
Quarter 2009. Office of the Comptroller of the Currency and Office of Thrift Supervision: Washington, D.C. http://www.ots.treas.gov/_files/482126.pdf.
12. In this report we use the terms “mortgage” and “loan” interchangeably, even though mortgages are security interests that give the lender a right to the property and loans are the notes where people promise to pay money back to the lender. Also, in some parts of the report we use the term “lender” to represent the interests of the lender, servicer, and/or investor. The study’s surveys generally refer to “lenders or servicers” because most homeowners do not recognize the distinction between the lender, which is the entity that makes the funds available to the borrower, and the servicer, which collects payment from the borrower.
4FORECLOSURE COUNSELING OUTCOME STUDY: FINAL REPORT HOUSING COUNSELING OUTCOME EVALUATION
1. INTRODUCTION
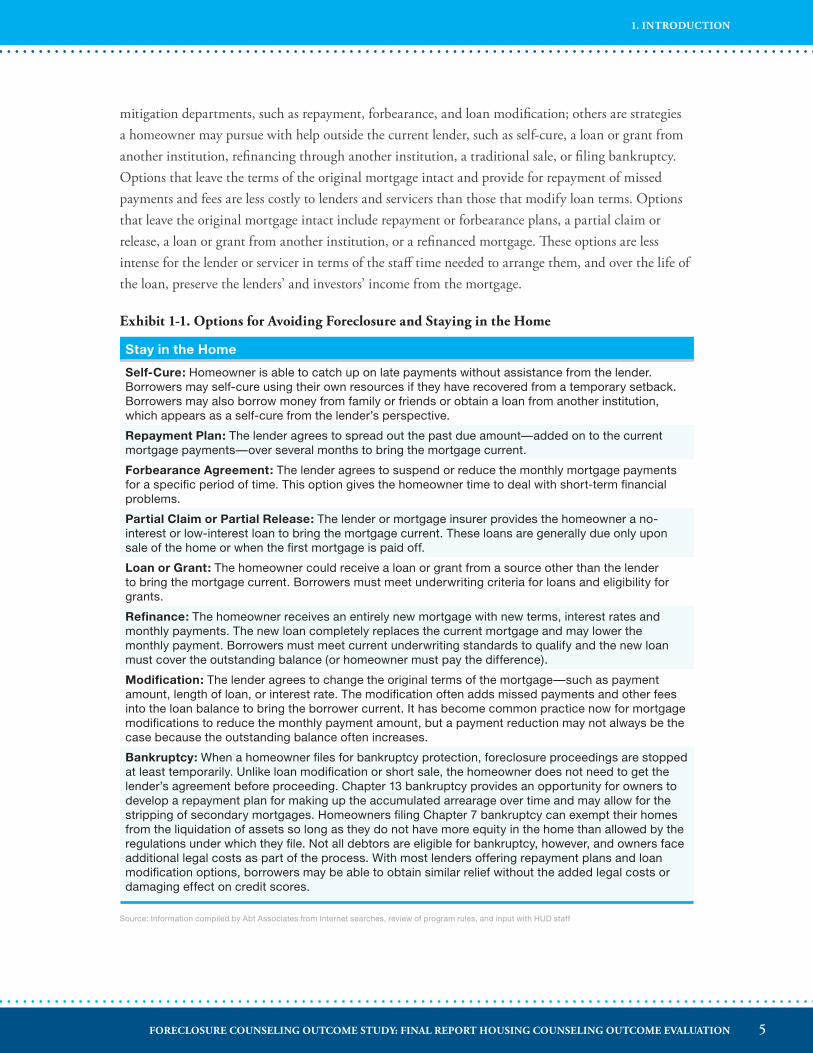
mitigation departments, such as repayment, forbearance, and loan modification; others are strategies a homeowner may pursue with help outside the current lender, such as self-cure, a loan or grant from another institution, refinancing through another institution, a traditional sale, or filing bankruptcy. Options that leave the terms of the original mortgage intact and provide for repayment of missed payments and fees are less costly to lenders and servicers than those that modify loan terms. Options that leave the original mortgage intact include repayment or forbearance plans, a partial claim or release, a loan or grant from another institution, or a refinanced mortgage. These options are less intense for the lender or servicer in terms of the staff time needed to arrange them, and over the life of the loan, preserve the lenders’ and investors’ income from the mortgage.
Exhibit 1-1� Options for Avoiding Foreclosure and Staying in the Home
Stay in the Home
Self-Cure: Homeowner is able to catch up on late payments without assistance from the lender. Borrowers may self-cure using their own resources if they have recovered from a temporary setback. Borrowers may also borrow money from family or friends or obtain a loan from another institution, which appears as a self-cure from the lender’s perspective.
Repayment Plan: The lender agrees to spread out the past due amount—added on to the current mortgage payments—over several months to bring the mortgage current.
Forbearance Agreement: The lender agrees to suspend or reduce the monthly mortgage payments for a specific period of time. This option gives the homeowner time to deal with short-term financial problems.
Partial Claim or Partial Release: The lender or mortgage insurer provides the homeowner a no-interest or low-interest loan to bring the mortgage current. These loans are generally due only upon sale of the home or when the first mortgage is paid off.
Loan or Grant: The homeowner could receive a loan or grant from a source other than the lender to bring the mortgage current. Borrowers must meet underwriting criteria for loans and eligibility for grants.
Refinance: The homeowner receives an entirely new mortgage with new terms, interest rates and monthly payments. The new loan completely replaces the current mortgage and may lower the monthly payment. Borrowers must meet current underwriting standards to qualify and the new loan must cover the outstanding balance (or homeowner must pay the difference).
Modification: The lender agrees to change the original terms of the mortgage—such as payment amount, length of loan, or interest rate. The modification often adds missed payments and other fees into the loan balance to bring the borrower current. It has become common practice now for mortgage modifications to reduce the monthly payment amount, but a payment reduction may not always be the case because the outstanding balance often increases.
Bankruptcy: When a homeowner files for bankruptcy protection, foreclosure proceedings are stopped at least temporarily. Unlike loan modification or short sale, the homeowner does not need to get the lender’s agreement before proceeding. Chapter 13 bankruptcy provides an opportunity for owners to develop a repayment plan for making up the accumulated arrearage over time and may allow for the stripping of secondary mortgages. Homeowners filing Chapter 7 bankruptcy can exempt their homes from the liquidation of assets so long as they do not have more equity in the home than allowed by the regulations under which they file. Not all debtors are eligible for bankruptcy, however, and owners face additional legal costs as part of the process. With most lenders offering repayment plans and loan modification options, borrowers may be able to obtain similar relief without the added legal costs or damaging effect on credit scores.
Source: Information compiled by Abt Associates from Internet searches, review of program rules, and input with HUD staff
5FORECLOSURE COUNSELING OUTCOME STUDY: FINAL REPORT HOUSING COUNSELING OUTCOME EVALUATION
1. INTRODUCTION
Repayment plans are straightforward agreements that a homeowner will repay arrearages and late fees over some number of months. Forbearance agreements allow a homeowner to miss payments while undergoing a temporary hardship (such as job loss, illness, divorce). Although the length of a forbearance agreement varies based on a homeowner’s financial situation, the process is relatively simple for a lender’s staff. Homeowners will repay the forbearance amount through a lump sum, repayment plan, or by adding the amount to the back end of the mortgage term. A refinance, which may be contracted with the same or a different lender, pays off the outstanding mortgage balance entirely. In the wake of the foreclosure crisis, however, refinances are unattainable for many homeowners. Some no longer meet underwriting standards because their credit score has dropped as a result of mortgage delinquency, because of lost income, or because of a higher debt burden than is allowed under tightened underwriting guidelines. In other cases, a house’s value has declined so much that no lender will offer a refinance that pays off the existing mortgage.
The owner of a loan should agree to alter the loan terms, or accept less than a full payoff in a short sale, when the owner is likely to recoup more money through these means than by completing a fore-closure process. In practice, this decision is complicated by the presence of multiple actors—lenders, servicers, and/or investors; however, this calculation reflects the basic incentive to complete a modifica-tion or short sale. Loan modifications that reduce a homeowner’s monthly payment—either through an interest rate, principal reduction, or both—lower the lender and/or investors’ income from a loan. Before consenting to a short sale or loan modification, servicers rely on formulas to calculate the net present value (NPV) of the modification relative to leaving the existing loan intact. In the case of a modification, loss mitigation staff analyze a homeowner’s documented income and expenses (to as-sess affordability) and compare the lender’s income stream from a modified loan to its income stream without modifying the loan, including potential costs incurred through foreclosing (Li and Garri-son, 2011). From the servicer’s perspective, many unknown factors exist when determining the NPV, including the current market value of a house, its potential resale value, and the likelihood a house would actually go to foreclosure without a loan modification. Furthermore, some number of home-owners who receive modifications will redefault, meaning that despite a lender’s outlay of resources to create the modification, the mortgage is still nonperforming. In a study of loans originated in 2005 or 2006 that were modified, Quercia and Ding (2009) show that the more a modification reduces monthly payments, the less likely homeowners are to redefault.13
The effect of bankruptcy on a mortgage depends on the chapter and specific terms of a bankruptcy filing. Homeowners who file Chapter 7 bankruptcy may keep their homes if they can continue to make payments and any equity they have in their homes does not exceed their state’s personal prop-erty exemption limit.14 Alternately, Chapter 7 filers may surrender the home to pay off debts. Filers of Chapter 13 bankruptcy undertake repayment plans to catch up on mortgage and other types of
13. They estimate that overall, about 56 percent of modified loans from a sample of 1.3 million private-label loans originated in 2005 or 2006, redefaulted within 6 months. Loans with payments that were 5 to 10 percent lower are estimated to redefault to 45 percent; the largest payment reductions (30.1 to 40 percent) lower redefault estimates to 38 percent.
14. Federal bankruptcy law suggests a personal property exemption of $15,000; however, federal law permits states to set their own exemptions. Bankruptcy filers can choose if to follow federal or state exemptions.
6FORECLOSURE COUNSELING OUTCOME STUDY: FINAL REPORT HOUSING COUNSELING OUTCOME EVALUATION
1. INTRODUCTION
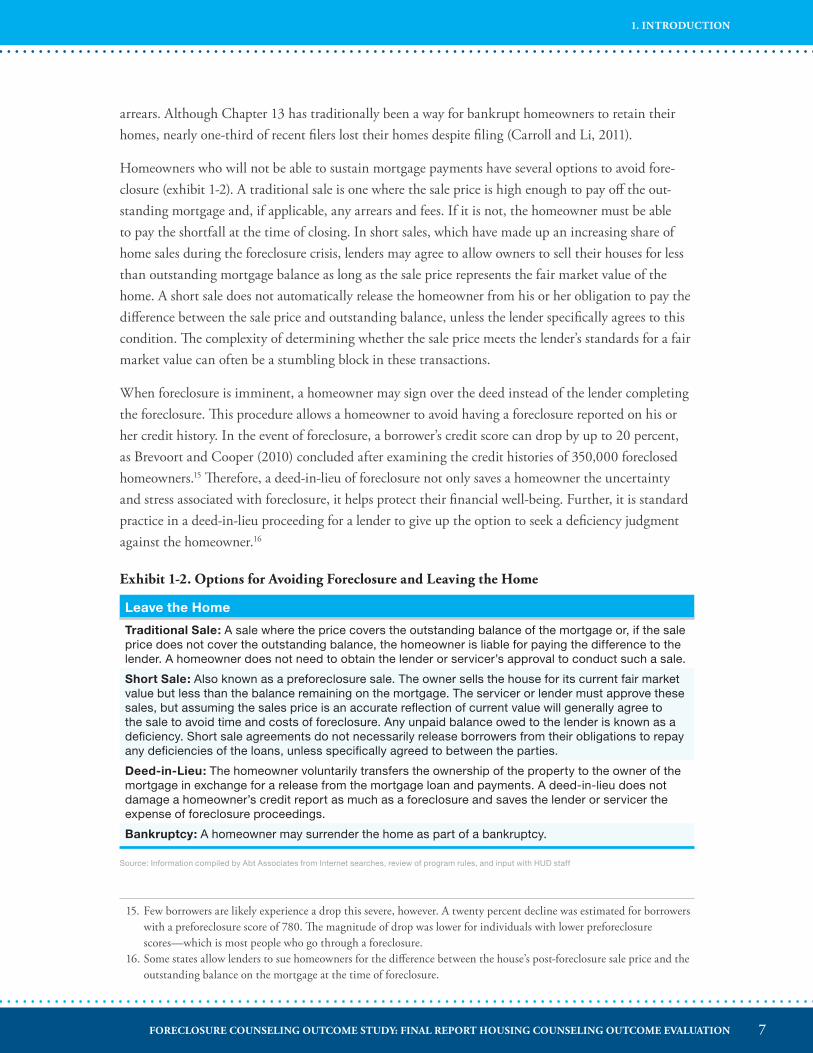
arrears. Although Chapter 13 has traditionally been a way for bankrupt homeowners to retain their homes, nearly one-third of recent filers lost their homes despite filing (Carroll and Li, 2011).
Homeowners who will not be able to sustain mortgage payments have several options to avoid fore-closure (exhibit 1-2). A traditional sale is one where the sale price is high enough to pay off the out-standing mortgage and, if applicable, any arrears and fees. If it is not, the homeowner must be able to pay the shortfall at the time of closing. In short sales, which have made up an increasing share of home sales during the foreclosure crisis, lenders may agree to allow owners to sell their houses for less than outstanding mortgage balance as long as the sale price represents the fair market value of the home. A short sale does not automatically release the homeowner from his or her obligation to pay the difference between the sale price and outstanding balance, unless the lender specifically agrees to this condition. The complexity of determining whether the sale price meets the lender’s standards for a fair market value can often be a stumbling block in these transactions.
When foreclosure is imminent, a homeowner may sign over the deed instead of the lender completing the foreclosure. This procedure allows a homeowner to avoid having a foreclosure reported on his or her credit history. In the event of foreclosure, a borrower’s credit score can drop by up to 20 percent, as Brevoort and Cooper (2010) concluded after examining the credit histories of 350,000 foreclosed homeowners.15 Therefore, a deed-in-lieu of foreclosure not only saves a homeowner the uncertainty and stress associated with foreclosure, it helps protect their financial well-being. Further, it is standard practice in a deed-in-lieu proceeding for a lender to give up the option to seek a deficiency judgment against the homeowner.16
Exhibit 1-2� Options for Avoiding Foreclosure and Leaving the Home
Leave the Home
Traditional Sale: A sale where the price covers the outstanding balance of the mortgage or, if the sale price does not cover the outstanding balance, the homeowner is liable for paying the difference to the lender. A homeowner does not need to obtain the lender or servicer’s approval to conduct such a sale.
Short Sale: Also known as a preforeclosure sale. The owner sells the house for its current fair market value but less than the balance remaining on the mortgage. The servicer or lender must approve these sales, but assuming the sales price is an accurate reflection of current value will generally agree to the sale to avoid time and costs of foreclosure. Any unpaid balance owed to the lender is known as a deficiency. Short sale agreements do not necessarily release borrowers from their obligations to repay any deficiencies of the loans, unless specifically agreed to between the parties.
Deed-in-Lieu: The homeowner voluntarily transfers the ownership of the property to the owner of the mortgage in exchange for a release from the mortgage loan and payments. A deed-in-lieu does not damage a homeowner’s credit report as much as a foreclosure and saves the lender or servicer the expense of foreclosure proceedings.
Bankruptcy: A homeowner may surrender the home as part of a bankruptcy.
Source: Information compiled by Abt Associates from Internet searches, review of program rules, and input with HUD staff
15. Few borrowers are likely experience a drop this severe, however. A twenty percent decline was estimated for borrowers with a preforeclosure score of 780. The magnitude of drop was lower for individuals with lower preforeclosure scores—which is most people who go through a foreclosure.
16. Some states allow lenders to sue homeowners for the difference between the house’s post-foreclosure sale price and the outstanding balance on the mortgage at the time of foreclosure.
7FORECLOSURE COUNSELING OUTCOME STUDY: FINAL REPORT HOUSING COUNSELING OUTCOME EVALUATION
1. INTRODUCTION
Foreclosure Proceedings and Enhanced ProtectionsThe home retention strategies discussed above provide important context for understanding the options available to homeowners seeking foreclosure counseling in the fall of 2009. It is also important to note that the preforeclosure process varies for homeowners in the study depending on where they live. Of the 46 states (plus District of Columbia) where study participants lived in the fall of 2009, 17 primarily used judicial foreclosure proceedings, meaning that foreclosures are processed through the courts, which slows down the process and gives the homeowner the opportunity to be heard by the court. The other 30 states use a nonjudicial foreclosure process, which means that foreclosures are processed without court intervention, with the requirements for the foreclosure established by state statutes.
Furthermore, 20 states where counselees in this study lived had some enhanced preforeclosure options available to homeowners (see Appendix G for a state-by-state overview). These new processes place foreclosure proceedings temporarily on hold while additional steps of review are completed. These programs existed in states using both judicial and nonjudicial procedures; the jurisdictions for the new procedures varied from municipalities to entire states. A few programs called for either mandatory stays or mediation proceedings; most, however, were programs that lenders were required to offer to homeowners, who could opt into negotiation or mediation.17
Two examples—one nonjudicial and one judicial—may clarify the scope of state laws and programs that give borrowers opportunities to avoid foreclosure. In Michigan, foreclosures follow a nonjudicial process. When a homeowner defaults on the mortgage, the foreclosing entity sends a notice of foreclosure to the homeowner, places a notice on the home that it will be sold at a sheriff sale, and advertises the sale in the local newspaper for 4 weeks before the sale. A package of Michigan laws passed in 2009 requires lenders’ representatives inform homeowners they have the right to an additional 90 days before foreclosure, during which time they are to work with a housing counselor and their lender to find some alternative solution. Homeowners who opt into negotiation receive help from a HUD- or state-certified housing counselor to submit loss mitigation paperwork. The counselor arranges a meeting with the homeowner, servicer’s representative (usually an attorney), and the counselor, where the servicer’s agent is supposed to offer or decline to offer a homeowner loss mitigation options. The 90-day law was set to expire July 1, 2011 but has been extended through December 31, 2012.18 In Connecticut, a judicial foreclosure state, foreclosing lenders must notify borrowers that they can choose to participate in mediation before the foreclosure judgment. Some organizations offer pro bono legal services for this program. Without mediation, Connecticut foreclosures generally take 60 days to complete. Mediation extends the process an additional 60 days, with the option for a judge to extend 30 more (for a total of 150 days).
Another important contextual factor for interpreting the findings of the current study is that between the time when clients enrolled in the study in the fall of 2009 and when they completed the
17. Up to 61 percent of counselees in this study lived in a jurisdiction with enhanced options for foreclosure prevention.18. Full text of the extension bills (HB 4543, 4544, and 4545 of the 2011 session) are available at http://www.legislature.
mi.gov/documents/2011-2012/publicact/pdf/2011-PA-0302.pdf.
8FORECLOSURE COUNSELING OUTCOME STUDY: FINAL REPORT HOUSING COUNSELING OUTCOME EVALUATION
1. INTRODUCTION
telephone follow-up survey in the spring of 2011, five of the largest mortgage servicers had declared temporary moratoria on foreclosures in the wake of the robo-signing scandal of the fall of 2010. In light of revelations that servicers had not completed due diligence reviews before sending homes through foreclosure proceedings, servicers declared temporary stays on all foreclosures while legal and internal investigations were conducted. This process may have stalled foreclosure processes for some homeowners in our study who ultimately will not retain ownership and may have given others the additional time they needed to negotiate a sustainable solution. In late 2011, major lenders resumed processing delinquent loans from 2010, causing a new surge in foreclosure initiations. Delinquency rates also continue to be high. From the combination of the backlog of foreclosures in process and new delinquencies, foreclosure rates are likely to remain elevated for several years to come (Brennan, 2011).
Home Affordable Modification ProgramHousing counseling clients in the fall of 2009—when enrollment to the current study was conducted—had access to home retention strategies through HAMP, launched by the Treasury Department in early 2009 as part of the Making Home Affordable (MHA) program, as well as lenders’ proprietary modification programs that were not available to those in the initial wave of the foreclosure crisis. HAMP built on the success of the Federal Deposit Insurance Corporation’s (FDIC’s) loan mod in a box program introduced in 2008. The loan mod in a box program introduced two crucial innovations to improve homeowner experience with loan modifications. First, it established a streamlined process for loan modifications that could be applied by any servicer. Second, the FDIC program prioritized creating lower monthly payments and long-term stability for borrowers. In contrast, traditional modifications tended to raise overall mortgage burden and monthly payments because lenders capitalize arrearages and late fees into the loan principal. In the early stages of the foreclosure crisis, lenders apparently continued this practice, since the first waves of modified loans were found to increase average payments (HUD, 2010; Collins and Herbert, 2009). Following the FDIC model, HAMP and new lender modification programs were more likely to reduce monthly payments to increase the likelihood that homeowners would be able to meet their ongoing mortgage obligations.
The MHA program was announced in March 2009 and implemented by late May 2009, meaning the program had been in effect for several months when homeowners enrolled in this study. The program was established for homeowners whose payments are too high because of a specific hardship such as job loss, reduced income, divorce, injury, or illness. Since 2009, the MHA’s scope has been revised and extended to reach more types of homeowners, as shown in exhibit 1-3.
Homeowners are eligible for HAMP if they are delinquent or can document being in imminent danger of default, if their mortgage payments are more than 31 percent of gross monthly income, and comply with other eligibility requirements. Participation is required for servicers of mortgages owned or insured by Fannie Mae or Freddie Mac, the government-sponsored enterprises (GSEs).19
19. The Making Home Affordable Program Handbook for Servicers of Non-GSE Mortgages is available at https://www.hmpadmin.com//portal/programs/docs/hamp_servicer/mhahandbook_30.pdf.
9FORECLOSURE COUNSELING OUTCOME STUDY: FINAL REPORT HOUSING COUNSELING OUTCOME EVALUATION
1. INTRODUCTION
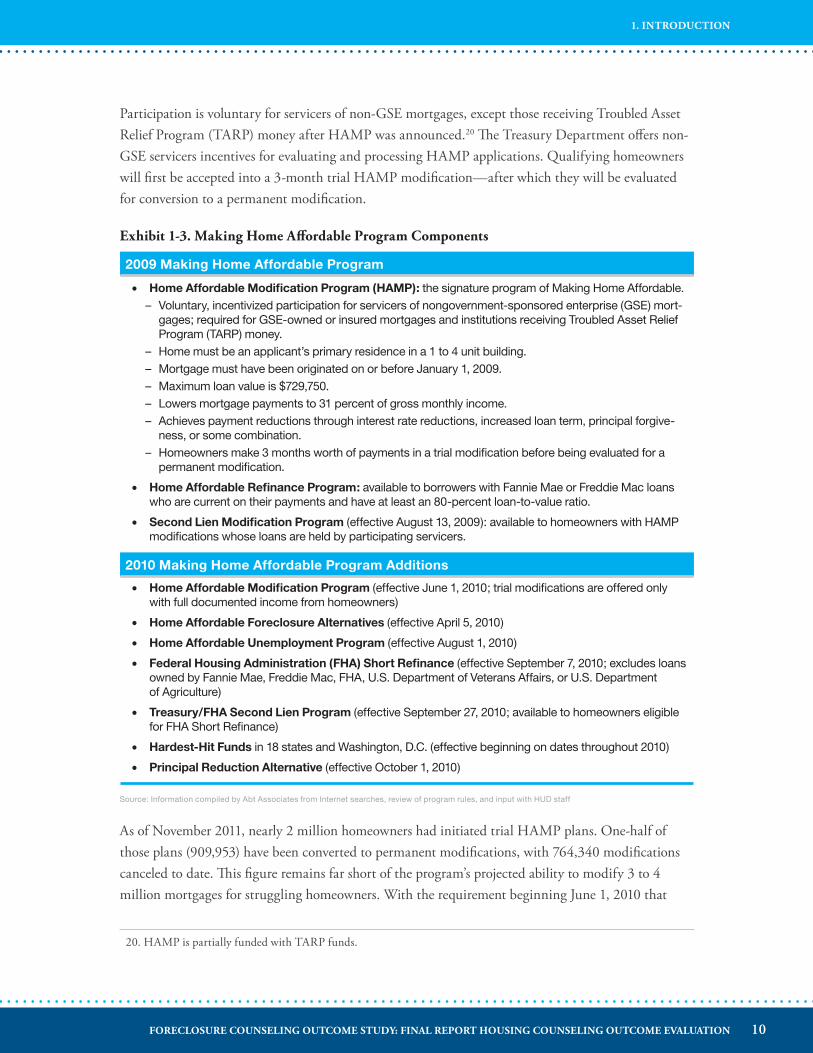
Participation is voluntary for servicers of non-GSE mortgages, except those receiving Troubled Asset Relief Program (TARP) money after HAMP was announced.20 The Treasury Department offers non-GSE servicers incentives for evaluating and processing HAMP applications. Qualifying homeowners will first be accepted into a 3-month trial HAMP modification—after which they will be evaluated for conversion to a permanent modification.
Exhibit 1-3� Making Home Affordable Program Components
2009 Making Home Affordable Program
• Home Affordable Modification Program (HAMP): the signature program of Making Home Affordable.– Voluntary, incentivized participation for servicers of nongovernment-sponsored enterprise (GSE) mort-
gages; required for GSE-owned or insured mortgages and institutions receiving Troubled Asset Relief Program (TARP) money.
– Home must be an applicant’s primary residence in a 1 to 4 unit building.– Mortgage must have been originated on or before January 1, 2009.– Maximum loan value is $729,750.– Lowers mortgage payments to 31 percent of gross monthly income.– Achieves payment reductions through interest rate reductions, increased loan term, principal forgive-
ness, or some combination.– Homeowners make 3 months worth of payments in a trial modification before being evaluated for a
permanent modification.
• Home Affordable Refinance Program: available to borrowers with Fannie Mae or Freddie Mac loans who are current on their payments and have at least an 80-percent loan-to-value ratio.
• Second Lien Modification Program (effective August 13, 2009): available to homeowners with HAMP modifications whose loans are held by participating servicers.
2010 Making Home Affordable Program Additions
• Home Affordable Modification Program (effective June 1, 2010; trial modifications are offered only with full documented income from homeowners)
• Home Affordable Foreclosure Alternatives (effective April 5, 2010)
• Home Affordable Unemployment Program (effective August 1, 2010)
• Federal Housing Administration (FHA) Short Refinance (effective September 7, 2010; excludes loans owned by Fannie Mae, Freddie Mac, FHA, U.S. Department of Veterans Affairs, or U.S. Department of Agriculture)
• Treasury/FHA Second Lien Program (effective September 27, 2010; available to homeowners eligible for FHA Short Refinance)
• Hardest-Hit Funds in 18 states and Washington, D.C. (effective beginning on dates throughout 2010)
• Principal Reduction Alternative (effective October 1, 2010)
Source: Information compiled by Abt Associates from Internet searches, review of program rules, and input with HUD staff
As of November 2011, nearly 2 million homeowners had initiated trial HAMP plans. One-half of those plans (909,953) have been converted to permanent modifications, with 764,340 modifications canceled to date. This figure remains far short of the program’s projected ability to modify 3 to 4 million mortgages for struggling homeowners. With the requirement beginning June 1, 2010 that
20. HAMP is partially funded with TARP funds.
10FORECLOSURE COUNSELING OUTCOME STUDY: FINAL REPORT HOUSING COUNSELING OUTCOME EVALUATION
1. INTRODUCTION
all new trial modifications have fully documented income, the program’s conversion rate—trial modifications accepted for permanent modification—has improved dramatically, from 43 to 83 percent (as of November 2011).21
Perhaps more important than the specific volume of HAMP modifications is that the program set industry-wide guidelines for modifications, with an emphasis on payment reduction compared with traditional modifications that raised borrowers’ monthly payments. These parameters have altered the structure and quality of all modifications since HAMP began, even those offered outside of the pro-gram (Li and Garrison, 2011; Collins and Herbert, 2009; Mayer et al., 2011). The spillover effects of HAMP are particularly important to note since proprietary and other non-HAMP modifications have outnumbered HAMP modifications in every quarter.
1�1�4 FORECLOSURE MITIGATION COUNSELINGHomeowners should be able to access any of a lender’s home retention or loss mitigation strategies without the intervention of a housing counselor; however, research conducted during the foreclosure crisis has found that homeowners are unaware of loss mitigation options (Freddie Mac and Roper Public Affairs, 2007). Many homeowners have difficulty even learning that a loss mitigation department exists (Fields, Libman, and Saegert, 2010) or navigating its complexities on their own (Herbert and Turnham, 2010). In a series of focus groups conducted with foreclosed homeowners in 2006, researchers found that even when participants sought help from their lenders early in their distress, most of them were not connected with the loss mitigation department until after formal foreclosure proceedings began (Fields, Libman, and Saegert, 2010).
The goal of foreclosure mitigation counseling is to provide homeowners at risk of default or foreclosure with assistance from trained professionals that helps them either maintain homeownership or reach an alternative solution that preserves their housing and financial stability. The best outcome will vary from person to person depending on the homeowner’s personal, financial, and work circumstances; the characteristics of the mortgage; and the local housing market and economy. Outcomes will also vary based on the stage at which homeowners seek help and the willingness of lenders to negotiate a solution. A crucial role played by housing counselors, therefore, is to explain the range of home retention strategies that homeowners have available to them and help them assess which option best suits their particular situation.
Although foreclosure intervention had long been a component of HUD housing counseling, and servicers had long operated loss mitigation departments, both types of intervention have necessarily become larger and more systematic during the national foreclosure crisis. Community organizations in cities where subprime lending proliferated developed programs to help local residents stay in
21. Making Home Affordable Program Performance Report Through November 2011. http://www.treasury.gov/initiatives/financial-stability/results/MHA-Reports/Documents/FINAL_Nov%202011%20MHA%20Report.pdf.
11FORECLOSURE COUNSELING OUTCOME STUDY: FINAL REPORT HOUSING COUNSELING OUTCOME EVALUATION
1. INTRODUCTION
their homes.22 At the same time, NeighborWorks® America began looking for foreclosure prevention models that could be widely applied. This effort resulted, in 2007, in National Industry Standards for Homeownership Education and Counseling, including for mortgage delinquency and foreclosure prevention.23 Specifically, foreclosure intervention counseling adhering to the national standards must cover the following range of topics in ways that are relevant for a particular client’s circumstances:
•Gather information on the client’s circumstances and goals for counseling.• Evaluate the client’s mortgage loan, payment, and delinquency status.•Develop a homeowner’s home retention or exit strategy.•Communicate with the servicer (as applicable).•Help the client submit loss mitigation paperwork (as applicable).•Refer the client to other applicable resources.• Follow up with the client.
In 2007, the White House, the Treasury Department, HUD, and a coalition of banks and mortgage servicers formed the HOPE NOW Alliance with the aim of helping homeowners access housing counseling and alternatives to foreclosure. The HOPE NOW Alliance raises awareness of alternatives to foreclosure through public service announcements, gathers data on foreclosures and mortgage modifications, and provides funding for the Homeowners HOPE Hotline staffed by HUD-approved housing counselors. The HOPE Hotline, launched in 2007, was a significant change for the counseling industry because, although agencies had long offered services via telephone, this opportunity was the first time HUD-approved agencies could operate in communities where they did not have a physical presence.24 By providing opportunities for counseling at home and around the clock, telephone counseling agencies, including six agencies that participated in this study, can serve a much higher volume of clients than traditional counseling agencies where clients meet with a counselor face-to-face during regular working hours.
Millions of homeowners sought help both in-person and over the telephone from HUD-approved nonprofit housing counseling agencies funded by HUD during the national foreclosure crisis. In fiscal 2010 (October 2009 to September 2010)—the last full year for which data are available—HUD-funded agencies provided one-on-one foreclosure counseling to 1.4 million people and group foreclosure education to about 55,000 people.25
22. These organizations include Neighborhood Housing Services of Chicago’s Home Ownership Preservation Initiative launched in 2003 (Fields, Libman, and Saegert, 2010) and the Baltimore Homeownership Preservation Collaborative founded in 2005 (Herbert and Turnham, 2010).
23. Representatives of lenders, housing counseling and consumer advocacy agencies, and the government sponsored enterprises (GSEs) contributed to The National Industry Standards for Homeownership Education and Counseling, which can be found at http://www.homeownershipstandards.org/standards.
24. Housing Counseling Program; Final Rule, Federal Register Vol. 72, No. 188, September 28, 2007, pp. 55638-55654.25. HUD-9902 data, Fiscal Year 2010 4th Quarter Report, accessed at http://www.portal.hud.gov/hudportal/HUD?src=/
program_offices/housing/sfh/hcc/hcc_home. Through the third quarter of 2011, HUD-approved agencies had counseled 695,222 individual clients and offered group mortgage delinquency workshops to 162,067 people, for a total of 857,289 clients.
12FORECLOSURE COUNSELING OUTCOME STUDY: FINAL REPORT HOUSING COUNSELING OUTCOME EVALUATION
1. INTRODUCTION
Much of the foreclosure mitigation counseling provided through HUD-approved and HUD-funded agencies has been funded in part through the NFMC program. A major evaluation of the impact of the NFMC program is ongoing and is the largest study to date on the effectiveness of foreclosure counseling. The most recent evaluation report (Mayer et al., 2011) found that homeowners who received counseling through NFMC between January 2008 and December 2009 were about twice as likely to cure their delinquency and to remain current for a year afterward compared with a nonrandom control group of homeowners who did not receive counseling.26
1�2 STUDY RESEARCH QUESTIONSThis study contributes to the literature on the effects of housing counseling for delinquent homeowners by examining who received foreclosure mitigation counseling, what specific services they received, what the short- and medium-term outcomes of the counseling were, and the circumstances under which counseling was likely to produce more favorable outcomes. In this section, we discuss each of the principal research questions and the data sources used to answer them.
1�2�1 WHAT WERE THE CHARACTERISTICS OF FORECLOSURE MITIGATION CLIENTS IN THE FALL OF 2009?The study collected information on study participants’ financial, credit, and demographic characteristics and housing situation at the time they first sought counseling services. This information is not available from the HUD administrative dataset, which collects information on characteristics of counseling clients across all types of housing counseling; it does not differentiate among foreclosure, pre-purchase, rental, and homeless services. Several recent studies (Li and Garrison, 2011; Mayer et al., 2011; Collins and Herbert, 2009) have analyzed loan performance to assess the effects of foreclosure mitigation programs. Little of that research has linked housing outcomes to variations in the client’s financial circumstances and reasons for falling behind. The information collected for this study provides a more detailed description than is currently available about the characteristics of clients seeking foreclosure mitigation counseling and allows us to analyze the extent to which counseling outcomes vary by client characteristics.
1�2�2 WHY, AND AT WHAT STAGE, DID CLIENTS SEEK FORECLOSURE MITIGATION COUNSELING?Through a survey administered to a sample of foreclosure mitigation clients at the time they first sought counseling services, we collected information on how clients learned about the counseling services, at what stage they began counseling, and what they expected to gain from the counseling. Understanding the channels through which clients hear about counseling services—such as word of mouth, referrals, flyers—may be useful for the industry in developing more effective outreach and marketing strategies to reach larger numbers of clients and reach them at an earlier stage in the delin-quency process.
26. The authors control for observed differences in loan and borrower characteristics between NFMC program counselees and the control group, but cannot rule out the possibility that unobserved differences between these two groups are biasing estimates of counseling’s effect.
13FORECLOSURE COUNSELING OUTCOME STUDY: FINAL REPORT HOUSING COUNSELING OUTCOME EVALUATION
1. INTRODUCTION
We also sought to find out at what stage clients were in the delinquency or foreclosure process when they first sought counseling. Our hypothesis, based on standard practice in the industry, was that the earlier in the delinquency process the client begins counseling, the more options for addressing the delinquency there would be. Whether the client had contacted the lender is also of interest, to identify whether a key role of counseling is to help forge these contacts with servicers or whether counseling helped clients follow through on the steps already identified by the servicer.
Finally, we collected information on why the study participants were seeking foreclosure mitigation counseling, to provide context for analyzing their outcomes after completing counseling and to help evaluate the extent to which they were able to achieve the results they hoped for when they first sought counseling.
1�2�3 WHAT SPECIFIC SERVICES DID FORECLOSURE MITIGATION CLIENTS RECEIVE OVER TIME?One of the most important contributions of this study is to present information on the types of counseling services that clients receive. For each study participant and each counseling session, counselors filled out a service tracking survey and entered answers into the counseling services data system (CSDS) created for the study; they recorded the length of the session, the type of session (group or one-on-one), and the method of counseling (in person or on the telephone). Counselors also recorded if clients had completed counseling. The hypothesis was that client outcomes would vary by the type and duration of counseling, as well as the extent to which the client was willing or able to complete the action steps recommended to him or her by the counselor.
We also collected information on the characteristics of the counselors providing services—their demographic characteristics, education level, years of experience as counselors, professional training obtained in past 3 years, and certifications held.
1�2�4 WHAT OUTCOMES DID CLIENTS REALIZE AFTER RECEIVING COUNSELING SERVICES?The crux of the study is to understand what happens to foreclosure mitigation clients after they receive counseling, specifically if they retained homeownership or not, and other observable financial changes. It is important to note that outcomes measured by this study are not the only outcomes of foreclosure counseling, which could also include long term wealth building, improved health through reduced stress, and other outcomes that relate to individual and family well-being. Also, the study documents outcomes at one point in time—approximately 18 months after seeking counseling—but clients’ housing and mortgage situations may still be fluid at this stage and could evolve further over time.
The study asked counselors to record known outcomes for study participants at the end of the 6-month tracking period. In most cases, counselors either did not know what had happened or the homeowner’s case was still unresolved. Thus, the follow-up telephone survey provides the primary information on client outcomes and the factors associated with different outcomes.
14FORECLOSURE COUNSELING OUTCOME STUDY: FINAL REPORT HOUSING COUNSELING OUTCOME EVALUATION
1. INTRODUCTION
The identification of positive and negative outcomes from foreclosure counseling is not clear cut. If homeownership has become unsustainable, for example, giving up a home may be a positive outcome. Completing this process through a short sale or deed-in-lieu of foreclosure may be more positive than an outright foreclosure. In addition to providing information on outcomes, the follow-up survey provides information on how homeowners tried to resolve a mortgage delinquency, barriers they encountered in doing so, as well as what outcome they ultimately achieved.
Credit report data obtained for clients in the study from March 2011, approximately 18 months after most clients began counseling, supplements the follow-up survey. Credit report data were obtained for all study participants, whether or not they completed the follow-up survey. The credit report data show whether the client has a foreclosure or bankruptcy on record since entering counseling. The data also show if the client continued to have an open mortgage account and its balance. These items show whether the homeowner has been able to retain ownership and if he or she has refinanced or gotten a principal-reducing loan modification.
1�2�5 WHAT DO THE FINDINGS SUGGEST ABOUT THE CIRCUMSTANCES UNDER WHICH COUNSELING IS LIKELY TO HELP DELINQUENT HOMEOWNERS RETAIN THEIR HOMES AND AVOID FORECLOSURE?Using the data collected on the demographic and financial characteristics of counselees, counselees’ reasons for falling behind on the mortgage and for seeking counseling, the type and amount of counseling services they received, the housing market characteristics of the neighborhoods in which they lived, and the legal environment for foreclosure in their states, the study attempts to identify the most important factors affecting counseling outcomes for study participants. Controlling for observable counselee and housing market characteristics, which we presume from the outset will have a strong influence on outcomes, we examine how the length of time spent in counseling, the type of services received (individual counseling versus group education), and the mode of delivery (primarily in-person or by telephone) are associated with the likelihood that counselees will remain in their homes 18 months later and be current on their mortgages.
1�3 ORGANIZATION OF THE REPORTThe next chapter of this report describes the study design, sampling of agencies and clients, and data sources. Chapters 3 and 4 then present detailed information about the homeowners who sought foreclosure mitigation counseling in the fall of 2009 and enrolled in the study. Chapter 3 discusses study participants’ demographic characteristics and finances at the time they sought counseling; chapter 4 provides information on their loan characteristics and the loan search process, reasons for getting behind, and actions taken with the lender before seeking counseling. Chapter 5 then documents the counseling services that study participants received from HUD-approved counseling agencies, including the number of counseling engagements, the mode of counseling (in-person or by telephone, individual, or group), and the topics covered. Chapter 5 also describes housing counselors’
15FORECLOSURE COUNSELING OUTCOME STUDY: FINAL REPORT HOUSING COUNSELING OUTCOME EVALUATION
1. INTRODUCTION

characteristics and clients’ satisfaction with the services they received. Finally, chapter 6 presents the study’s findings on counselees’ housing outcomes a year and a half after seeking counseling and the factors associated with those outcomes and with the foreclosure mitigation strategies pursued.
16FORECLOSURE COUNSELING OUTCOME STUDY: FINAL REPORT HOUSING COUNSELING OUTCOME EVALUATION
1. INTRODUCTION
2� SAMPLING AND DATA COLLECTIONThis chapter provides an overview of the study methodology, including how agencies and clients were selected and recruited for participation and which types of data were collected.
2�1 SAMPLE SELECTION AND RECRUITMENTThe objective of the overall study was to provide HUD with information on client outcomes for a national probability sample of foreclosure mitigation counseling clients and pre-purchase counseling clients.27 Because there is no national list of housing counseling clients from which to select and enroll the panel, we used a sampling technique called two-stage cluster sampling. The first stage was to select a sample of counseling agencies and the second stage was to select a sample of clients within those agencies (referred to as the outcome panel).
The outcome panel consisted of a sample of clients from each of the two counseling groups (foreclosure mitigation and pre-purchase), selected from a national sample of agencies that were both HUD-approved and HUD-funded. We sampled counseling clients over an intake period that was customized to each sample agency and was expected to last up to 8 weeks. The goal was to sample enough counselees to have a sample size of about 2,000 counselees who completed the baseline survey, equally divided between the foreclosure mitigation and pre-purchase groups.
2�1�1 SAMPLING AGENCIESThe universe of counseling agencies from which we drew the sample was all HUD-approved agencies that received HUD funding in fiscal year (FY) 2007. Focusing on HUD-approved agencies allowed us to use HUD 9902 data on the distribution of clients served and the size of the agency to help define strata for sampling. We restricted the study to HUD-approved agencies that also received HUD funding because HUD-funded agencies are required to participate in evaluative studies as a condition of receiving funding.
We used 9902 data from FY 2007 to develop the sample design. At that time, pre-purchase clients outnumbered foreclosure mitigation clients. Anticipating that the volume of foreclosure mitigation clients would increase substantially—due both to increased demand in the wake of the national foreclosure crisis and National Foreclosure Mitigation Counseling program (NFMC)—we inflated the FY 2007 number of foreclosure mitigation clients by 50 percent. In all, 1,183 HUD-funded agencies reported at least one pre-purchase or foreclosure mitigation client in FY 2007.
27. This report focuses on foreclosure counseling. Findings on pre-purchase counseling are covered in a separate report (Turnham and Jefferson, forthcoming).
17FORECLOSURE COUNSELING OUTCOME STUDY: FINAL REPORT HOUSING COUNSELING OUTCOME EVALUATION
2. SAMPLING AND DATA COLLECTION
In two-stage cluster sampling, a probability-proportional-to-size (PPS) sample of agencies is drawn at the first stage of sampling. The measure of size for the PPS sample was the average weekly count of clients. We selected the sample with the expectation that client enrollment would take place over an 8-week period. In total, 526 agencies had a sufficient weekly volume of clients to provide the minimum number of clients for the study over 8 weeks. Although these 526 agencies are not necessarily representative of all 1,183 HUD-funded counseling agencies, these agencies accounted for 89 percent of the total count of clients of HUD-approved agencies at that time.
The target sample size of agencies for the first-stage sample was 30. Because we anticipated that some agencies would choose not to participate, we drew a larger sample of agencies and randomly designated a portion as a reserve sample. Before randomly selecting the sample of agencies we stratified all eligible agencies in the 50 states and the District of Columbia on the basis of the nine Census Divisions and the number of foreclosure counseling clients served by the agency.
Agency recruitment took place in May and June 2009. We began recruiting agencies by sending a letter from HUD to the selected agencies explaining the benefits and purposes of the study, describing what would be required of the agency, and encouraging the agency to participate. Project staff then contacted each agency by telephone to explain the study in more detail, answer questions, and secure their participation. Recruitment culminated in a memorandum of understanding between Abt Associates and the agency, in which the agency agreed to do the following:
1. Obtain clients’ consent to participate in the study.2. Administer the study’s baseline survey to clients upon intake (in paper-and-pencil format).3. Enter detailed information on the services received by clients over time into the web-based
counseling services data system (CSDS) developed for this study.4. Enter information into the CSDS about the terms of the client’s mortgage at or near the time
of study enrollment.5. Enter information into the CSDS on the demographic characteristics and qualifications of the
counselors and educators providing services to study participants.
We expected that agencies would have to spend approximately 1 hour per enrolled client for 67 clients on average to meet the study’s data collection needs. For nonprofit agencies with limited staff resources, the data collection requirements of this study represented a nontrivial burden. Therefore, we provided agencies with a $1,000 payment in partial compensation for the effort they were asked to undertake. The payment was provided in two parts—half when the agency agreed to participate and the other half when the agency completed client recruitment.
The research team approached a total of 34 agencies during the recruitment phase. One agency was found to be no longer eligible for the study, because it had ceased offering housing counseling, and two agencies declined to participate. We were able to obtain the agreement of backup agencies to replace these three agencies. A fourth agency that declined to participate did not have a substitute agency, because it was large enough to have only one backup agency and the backup was no longer
18FORECLOSURE COUNSELING OUTCOME STUDY: FINAL REPORT HOUSING COUNSELING OUTCOME EVALUATION
2. SAMPLING AND DATA COLLECTION
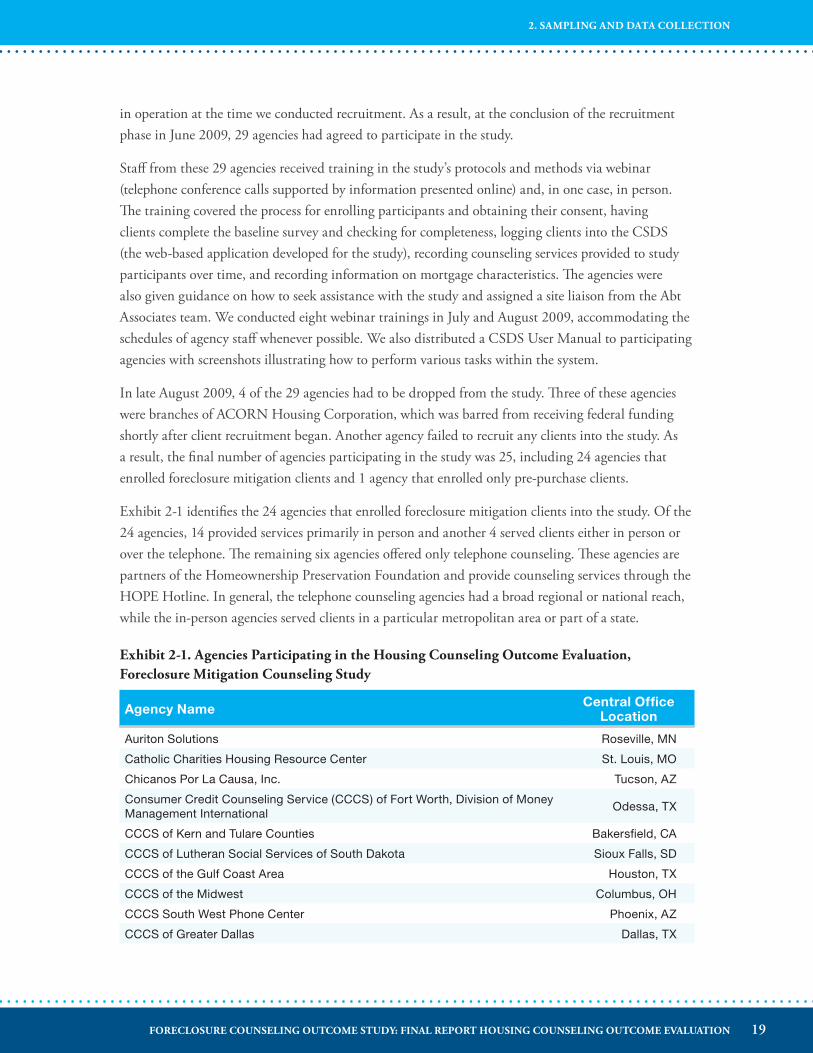
in operation at the time we conducted recruitment. As a result, at the conclusion of the recruitment phase in June 2009, 29 agencies had agreed to participate in the study.
Staff from these 29 agencies received training in the study’s protocols and methods via webinar (telephone conference calls supported by information presented online) and, in one case, in person. The training covered the process for enrolling participants and obtaining their consent, having clients complete the baseline survey and checking for completeness, logging clients into the CSDS (the web-based application developed for the study), recording counseling services provided to study participants over time, and recording information on mortgage characteristics. The agencies were also given guidance on how to seek assistance with the study and assigned a site liaison from the Abt Associates team. We conducted eight webinar trainings in July and August 2009, accommodating the schedules of agency staff whenever possible. We also distributed a CSDS User Manual to participating agencies with screenshots illustrating how to perform various tasks within the system.
In late August 2009, 4 of the 29 agencies had to be dropped from the study. Three of these agencies were branches of ACORN Housing Corporation, which was barred from receiving federal funding shortly after client recruitment began. Another agency failed to recruit any clients into the study. As a result, the final number of agencies participating in the study was 25, including 24 agencies that enrolled foreclosure mitigation clients and 1 agency that enrolled only pre-purchase clients.
Exhibit 2-1 identifies the 24 agencies that enrolled foreclosure mitigation clients into the study. Of the 24 agencies, 14 provided services primarily in person and another 4 served clients either in person or over the telephone. The remaining six agencies offered only telephone counseling. These agencies are partners of the Homeownership Preservation Foundation and provide counseling services through the HOPE Hotline. In general, the telephone counseling agencies had a broad regional or national reach, while the in-person agencies served clients in a particular metropolitan area or part of a state.
Exhibit 2-1� Agencies Participating in the Housing Counseling Outcome Evaluation, Foreclosure Mitigation Counseling Study
Agency Name Central Office Location
Auriton Solutions Roseville, MN
Catholic Charities Housing Resource Center St. Louis, MO
Chicanos Por La Causa, Inc. Tucson, AZ
Consumer Credit Counseling Service (CCCS) of Fort Worth, Division of Money Management International
Odessa, TX
CCCS of Kern and Tulare Counties Bakersfield, CA
CCCS of Lutheran Social Services of South Dakota Sioux Falls, SD
CCCS of the Gulf Coast Area Houston, TX
CCCS of the Midwest Columbus, OH
CCCS South West Phone Center Phoenix, AZ
CCCS of Greater Dallas Dallas, TX
19FORECLOSURE COUNSELING OUTCOME STUDY: FINAL REPORT HOUSING COUNSELING OUTCOME EVALUATION
2. SAMPLING AND DATA COLLECTION
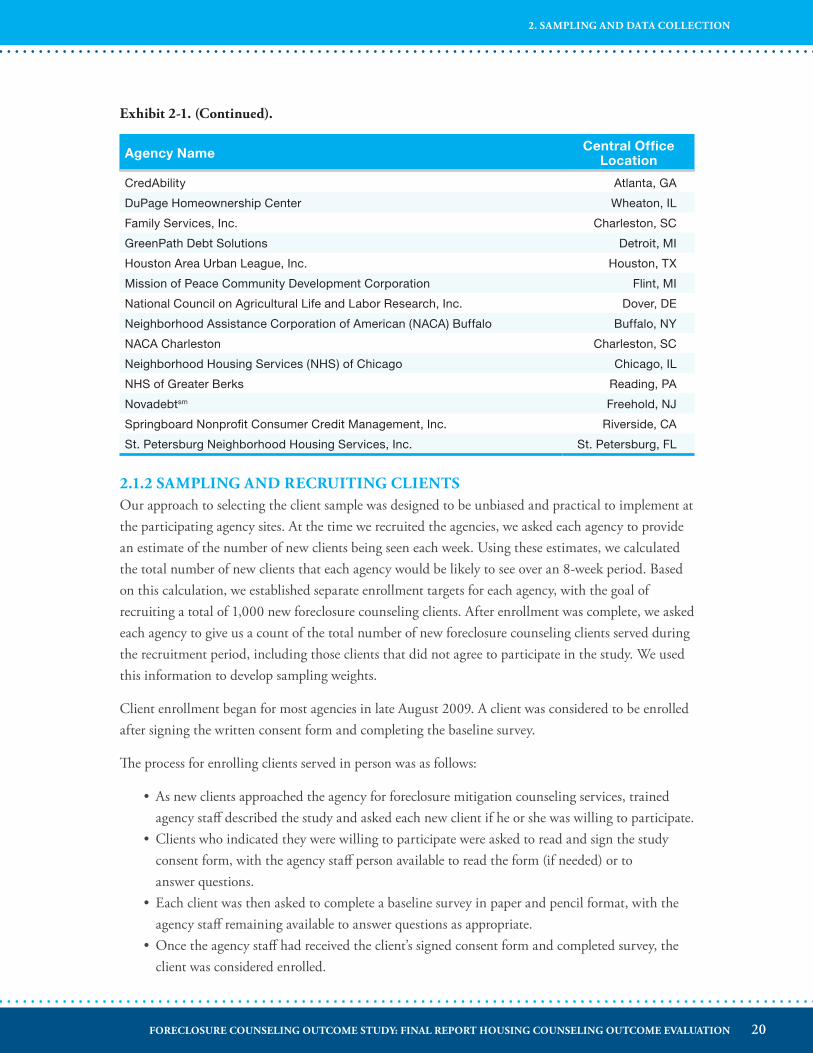
Agency Name Central Office Location
CredAbility Atlanta, GA
DuPage Homeownership Center Wheaton, IL
Family Services, Inc. Charleston, SC
GreenPath Debt Solutions Detroit, MI
Houston Area Urban League, Inc. Houston, TX
Mission of Peace Community Development Corporation Flint, MI
National Council on Agricultural Life and Labor Research, Inc. Dover, DE
Neighborhood Assistance Corporation of American (NACA) Buffalo Buffalo, NY
NACA Charleston Charleston, SC
Neighborhood Housing Services (NHS) of Chicago Chicago, IL
NHS of Greater Berks Reading, PA
Novadebtsm Freehold, NJ
Springboard Nonprofit Consumer Credit Management, Inc. Riverside, CA
St. Petersburg Neighborhood Housing Services, Inc. St. Petersburg, FL
2�1�2 SAMPLING AND RECRUITING CLIENTSOur approach to selecting the client sample was designed to be unbiased and practical to implement at the participating agency sites. At the time we recruited the agencies, we asked each agency to provide an estimate of the number of new clients being seen each week. Using these estimates, we calculated the total number of new clients that each agency would be likely to see over an 8-week period. Based on this calculation, we established separate enrollment targets for each agency, with the goal of recruiting a total of 1,000 new foreclosure counseling clients. After enrollment was complete, we asked each agency to give us a count of the total number of new foreclosure counseling clients served during the recruitment period, including those clients that did not agree to participate in the study. We used this information to develop sampling weights.
Client enrollment began for most agencies in late August 2009. A client was considered to be enrolled after signing the written consent form and completing the baseline survey.
The process for enrolling clients served in person was as follows:
•As new clients approached the agency for foreclosure mitigation counseling services, trained agency staff described the study and asked each new client if he or she was willing to participate.
•Clients who indicated they were willing to participate were asked to read and sign the study consent form, with the agency staff person available to read the form (if needed) or to answer questions.
• Each client was then asked to complete a baseline survey in paper and pencil format, with the agency staff remaining available to answer questions as appropriate.
•Once the agency staff had received the client’s signed consent form and completed survey, the client was considered enrolled.
Exhibit 2-1� (Continued)�
20FORECLOSURE COUNSELING OUTCOME STUDY: FINAL REPORT HOUSING COUNSELING OUTCOME EVALUATION
2. SAMPLING AND DATA COLLECTION
Clients served by telephone provided oral consent over the telephone and were mailed consent forms and surveys to return by mail. They were not considered enrolled until the study team received the signed consent form and completed survey.
Clients were offered two kinds of monetary incentives for enrolling in the study. First, all clients enrolled in the study were told they would receive a copy of their tri-merged credit report free of charge. We intended to obtain individual credit reports for each client as a soft pull (that is, not affecting the client’s credit score) at two points in time via a partnership between Abt Associates and a nonprofit housing counseling provider. After client enrollment was already underway, however, we determined that we could not obtain the individual credit reports as a soft pull. Not wanting to jeopardize clients’ credit ratings, we found an alternative way to obtain credit report data that preserved the anonymity of participants’ credit report data (by purchasing de-identified credit report data from Equifax, as described in Section 2.2 that follows). We sent a letter to all study participants explaining the situation and providing them with $7.95 to cover the cost of obtaining their own credit report including their credit score.28 The second type of monetary incentive for participating in the study was $20 for all clients who completed the follow-up telephone survey.
Across all agencies, we expected that about 80 percent of clients approached to participate in the study would agree to do so, yielding a study sample of approximately 1,000 enrolled clients. Although some agencies were able to meet their recruitment targets within the 8-week period, the overall recruitment period lasted for 16 weeks, because other agencies needed more time to recruit clients, and it took some time for clients served by telephone to return the written consent forms and baseline surveys.
At the conclusion of the enrollment period in December 2009, a total of 824 foreclosure mitigation clients were enrolled in the study.29 The overall sample fell short of the anticipated 1,000 clients because of the smaller number of agencies participating in the study (24 rather than 30) and because several agencies were unable to achieve their client enrollment targets, even with the extended enrollment period. Taken together, the 24 agencies in the study served about 11,000 new foreclosure mitigation clients over the 16-week study enrollment period. Our study enrolled approximately 8 percent of those clients. We do not know with certainty why study enrollment was lower than anticipated. Limited field tests before the study did not find reluctance on the part of clients to agree to participate in the study and agency staff did not report that clients were commonly refusing to participate.30 Low enrollment may reflect a lack of investment on the part of agency staff in the enrollment process, perhaps due to high demands on staff time during a period of very high counseling volumes.31
28. Credit reports without a score are available free of charge once per year by federal law, so the payment provided was to allow clients to purchase their credit score.
29. A total of 825 clients were initially enrolled but one client was dropped from the analysis because his or her survey answers showed that he sought pre-purchase rather than foreclosure mitigation counseling.
30. We do not know what percentage of clients who were approached refused to participate because we do not know for sure whether all the clients served by a particular agency were in fact approached. We did not require participating agencies to provide information on the number of clients approached.
31. According HUD 9902 data, the volume of clients seeking help with resolving or preventing mortgage delinquency nearly doubled between FY 2008 and FY 2009, increasing from 702,232 to 1,402,192. Data accessed from http://portal.hud.gov/hudportal/HUD?src=/program_offices/housing/sfh/hcc/hcc_home.
21FORECLOSURE COUNSELING OUTCOME STUDY: FINAL REPORT HOUSING COUNSELING OUTCOME EVALUATION
2. SAMPLING AND DATA COLLECTION
We conducted nonresponse bias analysis on the enrolled clients to assess how the study sample compared with the broader population of clients served across the sampled agencies and developed statistical weights to correct for biases observed in the sample. To conduct the nonresponse bias analysis, we collected administrative data from the 24 participating agencies on the ethnicity (Hispanic origin), race, age, and income of all new foreclosure mitigation clients served during the client enrollment period. Hispanic origin, race, age, and income were the four variables that were consistently collected by agencies for the purposes of reporting to HUD and other funders and that were also captured for study participants through the baseline survey. Neither the baseline survey nor the available administrative data sources captured detailed information on mortgage and other pertinent characteristics across all clients served by the participating counseling agencies.
Based on the comparison of the administrative data to the information on study participants, we weighted the baseline survey data on the four variables (Hispanic origin, race, income, and age) so that the information collected on study participants represented the population of foreclosure counseling clients served by the participating agencies along these four dimensions (further details on weighting procedures can be found in Appendix A). Even after weighting, however, we cannot conclude that the data collected through the study are representative of a broader population of homeowners seeking foreclosure counseling in the fall of 2009, because we were not able to compare the study sample to all of the foreclosure mitigation clients served during the client enrollment period on critical loan, debt, and credit history data. Administrative data on variables such as house price, amount of loan, loan-to-value ratio, debt-to-income ratio, number of days delinquent, employment status, and neighborhood or housing market characteristics would be needed to do a true nonresponse bias analysis to ascertain the representativeness of our sample. Unfortunately, we did not have the ability or resources to collect these data on the entire population of foreclosure mitigation clients served at the 24 participating agencies.
For the follow-up telephone survey, conducted in early 2011, about 18 months after the first counselees enrolled in the study, we achieved a 65-percent response rate. That is, 539 of the 824 clients that enrolled in the study completed a follow-up telephone survey. To account for nonresponse bias in the follow-up survey, we examined the difference in the distribution of the 824 baseline clients and the 539 survey respondents by three variables: (1) the percentage of clients served by HOPE Hotline telephone counseling agencies, (2) the percentage who were more than 1 month behind on their mortgage payment at the time of counseling intake, and (3) the percentage who experienced a foreclosure within the 24 months before the follow-up survey. These three variables were chosen because we had information on them for all clients from baseline surveys and credit reports and because they were expected to affect client outcomes.
The analysis found that clients who had been served by a HOPE Hotline telephone counselor made up 7 percentage points more of the follow-up sample than the baseline sample. The differences between clients who experienced a foreclosure or were more than 1 month late on their mortgage were insignificant (1 percentage point). The final follow-up weights were thus adjusted using the initial
22FORECLOSURE COUNSELING OUTCOME STUDY: FINAL REPORT HOUSING COUNSELING OUTCOME EVALUATION
2. SAMPLING AND DATA COLLECTION
four variables used for the baseline nonresponse weighting adjustment (Hispanic origin, race, income, and age) as well as the method of service provision (telephone-only or in-person counseling). Further details on the weighting methodology can be found in Appendix A.
2�2 DATA SOURCES AND DATA COLLECTION METHODSThe analysis presented in this report draws on seven data sources.
1. Baseline survey completed by clients.2. Service tracking survey completed by counselor.3. Mortgage characteristics survey completed by counselor.4. Counselor survey.5. Follow-up telephone survey of clients.6. Credit report data.7. Housing market data.
Each data source is described in the following section.
2�2�1 BASELINE SURVEYAll study participants completed a baseline survey in paper and pencil form at the time they enrolled in the study. A copy of the baseline survey is provided in Appendix B. The baseline survey covered the following topics:
•Counseling Experiences: Reasons for seeking foreclosure mitigation counseling services, sources of referral for counseling services, prior experience(s) with housing counseling.
•Mortgage: Type, terms, and amount of mortgage loan, mortgage loan search process, and self-reported housing costs. Mortgage status and, if behind, how many months. Steps taken to date to address delinquency, including self-assessment of likelihood of retaining the home.
• Income, Savings, and Credit: Gross monthly income and income components, amount of savings and retirement accounts.
•Demographics: Gender, age, race, ethnicity, foreign-born status, language spoken in home, educational attainment, marital status, and number of dependents in the home.
Clients enrolled in the study and completed the baseline survey on a rolling basis between August 2009 and December 2009, as described previously.
The total number of respondents to the baseline survey is 824, the number of clients enrolled in the study. For most survey questions, the response rate was more than 95 percent. The lowest response rate for any given question was 81 percent.
23FORECLOSURE COUNSELING OUTCOME STUDY: FINAL REPORT HOUSING COUNSELING OUTCOME EVALUATION
2. SAMPLING AND DATA COLLECTION
2�2�2 SERVICE TRACKING SURVEYHousing counselors were instructed to complete a service tracking survey each time a client enrolled in the study received a counseling service. The service tracking survey consisted of 14 questions about the nature of the services provided. A copy of the service tracking survey is provided in Appendix C. The service tracking survey captured the following information:
•Type of session (foreclosure mitigation workshop, foreclosure mitigation counseling, financial literacy workshop, and so on).
• Length of session.• Session format (face to face, telephone, Internet, and so on).•Topics covered.•Who led the session.• Fee for the session.•Action steps to address mortgage delinquency.•Counselor’s assessment of client’s likelihood of retaining homeownership.•Whether session marked the completion of counseling or whether additional sessions are
planned or recommended.
Counselors completed the service tracking surveys using the counseling services data system (CSDS) created for this study. The CSDS was a web-based data system that allowed real-time data entry on individual clients by counseling agency staff. The most important function of the CSDS was to collect and store information on study participants and the services that they received throughout the project.
Abt Associates project staff worked closely with the participating agencies to ensure that each service provided to participating clients was entered into the CSDS. Project staff used reports generated by the CSDS to identify cases in which enrolled clients had not had any services entered and followed up with individual counselors and their supervisors on a weekly basis to discuss.
Service tracking information was collected for 792 of the 824 clients enrolled in the study (96 percent). For those 792 clients, the service tracking data are complete, because it was not possible for a counselor to close out the record without answering all 14 service tracking questions. Based on our interactions with the counseling agencies during the data collection period, we believe that a service tracking survey was completed each time the client received a service, with most clients assisted in a single session but some 15 percent having multiple sessions. It is possible, however, that some services went unrecorded. For example, for 32 of the 824 enrolled clients counselors did not enter any service information at all. Because clients generally enrolled in the study at the time they first came in for services, we have assumed that these clients received at least one service engagement, but we have no information on the type(s) of services they received.
In addition to reporting on each service provided, the study design also asked counselors to report separately on any known outcomes for clients whenever those outcomes became known or at the end of the 6-month service tracking period. In most cases, counselors did report any outcome information
24FORECLOSURE COUNSELING OUTCOME STUDY: FINAL REPORT HOUSING COUNSELING OUTCOME EVALUATION
2. SAMPLING AND DATA COLLECTION
or reported that the outcome was unknown. This result is not surprising, given that counseling agencies generally do not have resources to track clients after they complete or drop out of counseling (Herbert and Turnham, 2010), and is why we conducted an independent follow-up survey and obtained client-level credit report data to document and analyze client outcomes.
2�2�3 MORTGAGE CHARACTERISTICS SURVEYHousing counselors were instructed to complete a mortgage characteristics survey once for each client enrolled in the study, at or near the time of study enrollment. The mortgage survey consisted of 15 questions about the characteristics of the client’s primary mortgage at the time of seeking counseling. A copy of the mortgage survey is provided in Appendix D. Topics covered by the mortgage survey include the following:
•Type of mortgage loan (standard adjustable-rate mortgage [ARM], fixed-rate, option ARM, interest-only, and so on).
•Date of origination and loan term.• Interest rate at origination and current interest rate (as applicable).•Original and current loan amounts.• Estimated current value of the home.•Total amount of subordinate mortgages.•Current monthly mortgage payment, taxes, and insurance.•Current monthly cost of utilities.
Counselors completed the mortgage survey using the CSDS, the web-based data system designed for this study. The mortgage characteristics survey was set up as a separate component from the service tracking survey because the mortgage information had to be entered only once per client and every time the client received a service.
Perhaps because of the way the CSDS was set up, counselors had more trouble completing the mortgage characteristics survey than the service tracking survey. At the end of study’s service tracking period, we found that 12 of the 24 agencies did not complete the mortgage survey for any clients. These agencies primarily served clients in person (the six agencies that provided counseling only by telephone all provided mortgage survey data on most clients). Across all agencies, counselors had entered information into the mortgage survey for only about one-half of the enrolled clients (431 of 824) and that the completeness of the data entered varied by data item. Unfortunately, the tracking and monitoring systems employed by the research team did not allow us to identify missing data in the mortgage survey (or agencies failing to report mortgage data on any clients) in real time. These data quality issues limit the usefulness of the mortgage characteristics survey data for the analysis of counseling outcomes.
25FORECLOSURE COUNSELING OUTCOME STUDY: FINAL REPORT HOUSING COUNSELING OUTCOME EVALUATION
2. SAMPLING AND DATA COLLECTION
2�2�4 COUNSELOR SURVEYAll counselors and educators who provided foreclosure mitigation services to enrolled clients were asked to complete a paper and pencil survey providing demographic information and information on their education, experience in housing counseling, related prior experience, and specific trainings or certifications they had completed on counseling components. The purpose of the counselor survey was to understand the personal and professional characteristics of counselors at a time of rapid growth in the industry. A copy of the counselor survey is provided in Appendix E.
A total of 145 counselors and educators worked with study participants, of whom 132 (91 percent) completed a counselor survey. Response rates to individual questions on the counselor survey ranged from 98 percent to 100 percent.
2�2�5 FOLLOW-UP TELEPHONE SURVEYIn January 2011, approximately 16 months after most clients enrolled in the study, we launched a telephone survey to follow up with clients on their housing situation and the mortgage remedies pursued. A complete copy of the survey is provided in Appendix F. The survey covered the following topics:
• Satisfaction with counseling services received.• Steps taken to address mortgage concerns.•Current housing situation.•Housing payments.• Employment and income.•Change in household circumstances since study enrollment.
The follow-up survey took approximately 30 minutes, and clients who completed the survey received $20 in appreciation for their time. The follow-up survey was managed by IMPAQ International, LLC, a subcontractor to Abt Associates for this project, and was conducted by trained and experienced interviewers.
The survey field period was January 2011 through May 2011. Of the study participants (539 individuals), 65 percent completed the telephone follow-up survey. As described previously, we conducted a nonresponse bias analysis to measure and correct for differences between survey respondents and the overall population of clients enrolled in the study.
2�2�6 CREDIT REPORT DATAWe obtained credit report information for all enrolled clients at approximately the time of enrollment (October 2009) and 18 months later (March 2011). We obtained the credit report data from Equifax, one of the three largest credit reporting bureaus in the country (the other two are TransUnion and Experian).
To obtain client-level credit report data for the clients in the study, Abt Associates provided Equifax with identifying information for clients enrolled in the study, all of whom had consented to grant us
26FORECLOSURE COUNSELING OUTCOME STUDY: FINAL REPORT HOUSING COUNSELING OUTCOME EVALUATION
2. SAMPLING AND DATA COLLECTION
access to their credit histories. In most cases, clients provided their name, Social Security number, and date of birth, as well as an address where they could be contacted. Equifax was able to identify 96 percent of study participants in its database for the October 2009 data extract (791 of 824) and 95 percent of study participants for the March 2011 data extract (783 of 824). Among the study participants Equifax was able to identify in its database, approximately 98 percent had sufficient credit information for Equifax to calculate the variables requested (see list that follows).
Once clients were identified, Equifax retrieved the credit report for each client and provided it to the research team using a scrambled client identification code that the research team could use to append the data to client-level dataset with all the information collected through the client surveys and service tracking data (excepting any personally identifying information). The scrambled identification code preserved the anonymity of the credit report data while allowing the research team to link credit data obtained for each client to the other information collected on that client.
Equifax provided a large number of variables developed using the client’s Equifax credit report. Key variables include the following:
• Beacon 09 score (Equifax’s version of the Fair Isaacs Corporation [FICO] score).•VantageScore (alternative to FICO developed by Equifax, TransUnion, and Experian).•Number of first mortgage, home equity, and other loan accounts.• Estimated monthly payments on first mortgage, home equity, and other loan accounts.• Balance on mortgage accounts and all accounts.•Total monthly scheduled payments on all debts.• Bankruptcy within 24 months.• Foreclosure within 24 months.
As described previously, these variables generally were available for all clients. For most variables, data are missing for less than 5 percent of clients in the sample, either because the client could not be identified in the Equifax data or because Equifax did not have sufficient data to calculate the variable. Of the Equifax variables used in our analysis, the least complete is total monthly payments on first mortgage accounts, which is available for 73 percent of enrolled clients at baseline (October 2009).32
Another issue with the credit report data is that, because credit reporting of foreclosures depends on when a lender says a foreclosure process started, foreclosure data may be over or under reported in certain cases. On the one hand, a person could have a foreclosure flag on the credit report if he or she ever entered the foreclosure process, whether or not the foreclosure was completed. This situation would be a case of over reporting. On the other hand, foreclosure could be under reported for a person because of lags in reporting. Equifax receives information about different loan attributes at different intervals; some are subject to reporting lags while others—such as inquiries made directly to Equifax—are not. Lenders report mortgage data at different intervals; typically, large lenders report
32. For Equifax to calculate a value for this variable, mortgage accounts must be present and open in the client’s file and a monthly payment amount must be attached to each account.
27FORECLOSURE COUNSELING OUTCOME STUDY: FINAL REPORT HOUSING COUNSELING OUTCOME EVALUATION
2. SAMPLING AND DATA COLLECTION
more frequently. Lags also depend on account type. Often, changes in mortgage status can take 2 to 3 months to change the credit data, during which time the credit report would not reflect the recent changes. For example, in the March 2011 data, a foreclosure in February 2011 would likely not be reflected, although the client could have indicated on the telephone survey in March that he or she lost the house due to a foreclosure.
2�2�7 HOUSING MARKET DATAWe collected data on median home values from the American Community Survey for the Census tracts and Metropolitan Statistical Areas in which the foreclosure mitigation clients participating in the study lived at the time of study enrollment.
We also purchased data from DataQuick (a private vendor) on sales and home price trends to assess the severity of negative equity in areas where study participants lived. The main purpose was to explore whether associations among the market characteristics were present at baseline and what remedies were pursued or housing outcomes. The houses about which study participants sought counseling were located in 752 Census tracts. DataQuick was able to provide sales data for the third quarter of 2007 and for the fourth quarter of 2009 (the two time periods requested) for 87 percent of the tracts.33 We used these data to create a measure of house price change discussed in chapter 4.
33. Some tracts did not have enough sales activity at one or both points in time to create measure of home sales price change.
28FORECLOSURE COUNSELING OUTCOME STUDY: FINAL REPORT HOUSING COUNSELING OUTCOME EVALUATION
2. SAMPLING AND DATA COLLECTION
3� CHARACTERISTICS OF COUNSELING CLIENTSThis chapter describes the demographic, housing, and financial characteristics of foreclosure mitigation clients at the time of study enrollment. The information comes primarily from the baseline survey that study participants completed in the fall of 2009, at the time they first sought foreclosure mitigation counseling. The chapter also draws on the credit report data obtained for the study sample from approximately the same time period (October 2009).
3�1 DEMOGRAPHIC CHARACTERISTICSExhibit 3-1 presents the demographic characteristics of foreclosure mitigation counselees who participated in this study compared with the characteristics of clients served through the National Foreclosure Mitigation Counseling program (NFMC) program and all homeowners nationwide. Column 1 shows the characteristics of the HUD foreclosure mitigation counseling clients participating in this study (Study Participants). The data presented in columns 2 and 3 come from reports on the NFMC program (NFMC Counselees) and tabulations of the American Community Survey (All U.S. Homeowners). Since many HUD-funded agencies also provide counseling funded by NFMC, substantial overlap in the populations of HUD foreclosure counselees and NFMC counselees existed, and study participants may have received foreclosure counseling funded by HUD or the NFMC program.
Most study participants were women (59 percent), over the age of 35 (86 percent), and married (56 percent). More than one-half (55 percent) had dependents under age 18 living in the home with them (not shown in exhibit), but less than one in five households (18 percent) was headed by a single parent. Nearly two-thirds of the counselees in the study had at least some college education, including 24 percent with a college degree or greater. Study participants were fairly similar to NFMC counselees and to all U.S. homeowners overall on these measures, except that study participants tended to be younger than homeowners overall and were more likely to be women. About 26 percent of study participants were over the age of 55 at the time of seeking counseling compared with 44 percent of all homeowners.
Of the study participants, 60 percent were White, and 40 percent were members of minority groups, mostly African American. By comparison, 84 percent of all U.S. homeowners are White, and only 16 percent are members of minority groups. Only 8 percent of American homeowners are African American compared with 30 percent of study participants. Although direct comparison is difficult
29FORECLOSURE COUNSELING OUTCOME STUDY: FINAL REPORT HOUSING COUNSELING OUTCOME EVALUATION
3. CHARACTERISTICS OF COUSELING CLIENTS
because of differences in how the data were collected, the racial and ethnic profile of counselees in this study is similar to that of NFMC clients, with Whites representing more than 40 percent of the NFMC population and African Americans representing slightly more than one-fourth of the NFMC population.
Overall, 14 percent of study participants identified as Hispanic compared with 21 percent of NFMC counselees and 8 percent of all U.S. homeowners.
30FORECLOSURE COUNSELING OUTCOME STUDY: FINAL REPORT HOUSING COUNSELING OUTCOME EVALUATION
3. CHARACTERISTICS OF COUSELING CLIENTS
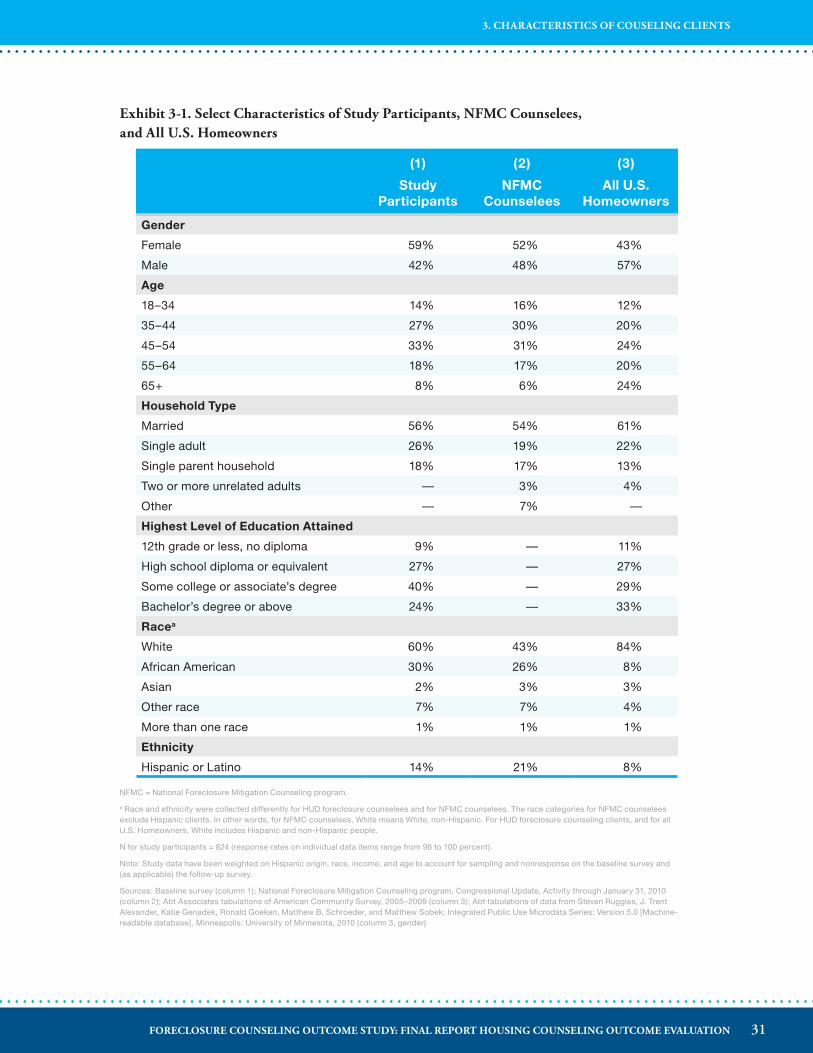
Exhibit 3-1� Select Characteristics of Study Participants, NFMC Counselees, and All U�S� Homeowners
(1)
Study Participants
(2)
NFMC Counselees
(3)
All U.S. Homeowners
Gender
Female 59% 52% 43%
Male 42% 48% 57%
Age
18–34 14% 16% 12%
35–44 27% 30% 20%
45–54 33% 31% 24%
55–64 18% 17% 20%
65+ 8% 6% 24%
Household Type
Married 56% 54% 61%
Single adult 26% 19% 22%
Single parent household 18% 17% 13%
Two or more unrelated adults — 3% 4%
Other — 7% —
Highest Level of Education Attained
12th grade or less, no diploma 9% — 11%
High school diploma or equivalent 27% — 27%
Some college or associate’s degree 40% — 29%
Bachelor’s degree or above 24% — 33%
Racea
White 60% 43% 84%
African American 30% 26% 8%
Asian 2% 3% 3%
Other race 7% 7% 4%
More than one race 1% 1% 1%
Ethnicity
Hispanic or Latino 14% 21% 8%
NFMC = National Foreclosure Mitigation Counseling program.
a Race and ethnicity were collected differently for HUD foreclosure counselees and for NFMC counselees. The race categories for NFMC counselees exclude Hispanic clients. In other words, for NFMC counselees, White means White, non-Hispanic. For HUD foreclosure counseling clients, and for all U.S. Homeowners, White includes Hispanic and non-Hispanic people.
N for study participants = 824 (response rates on individual data items range from 96 to 100 percent).
Note: Study data have been weighted on Hispanic origin, race, income, and age to account for sampling and nonresponse on the baseline survey and (as applicable) the follow-up survey.
Sources: Baseline survey (column 1); National Foreclosure Mitigation Counseling program, Congressional Update, Activity through January 31, 2010 (column 2); Abt Associates tabulations of American Community Survey, 2005–2009 (column 3); Abt tabulations of data from Steven Ruggles, J. Trent Alexander, Katie Genadek, Ronald Goeken, Matthew B. Schroeder, and Matthew Sobek; Integrated Public Use Microdata Series: Version 5.0 [Machine-readable database], Minneapolis: University of Minnesota, 2010 (column 3, gender)
31FORECLOSURE COUNSELING OUTCOME STUDY: FINAL REPORT HOUSING COUNSELING OUTCOME EVALUATION
3. CHARACTERISTICS OF COUSELING CLIENTS
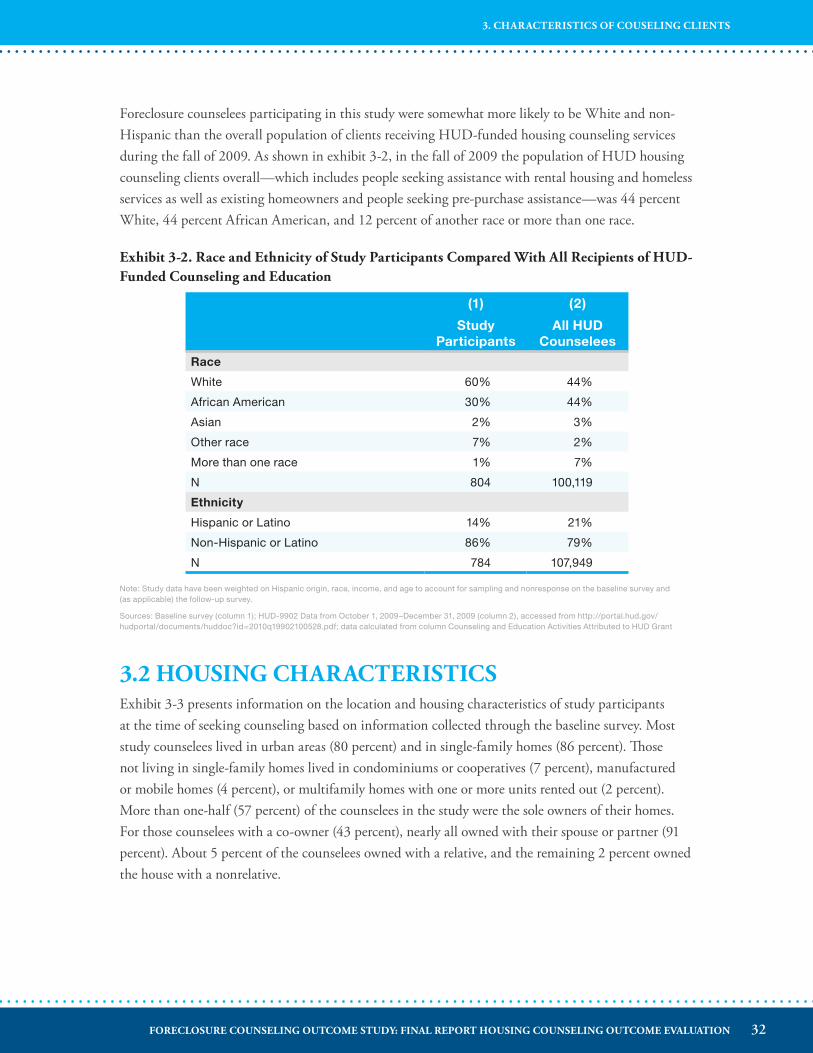
Foreclosure counselees participating in this study were somewhat more likely to be White and non-Hispanic than the overall population of clients receiving HUD-funded housing counseling services during the fall of 2009. As shown in exhibit 3-2, in the fall of 2009 the population of HUD housing counseling clients overall—which includes people seeking assistance with rental housing and homeless services as well as existing homeowners and people seeking pre-purchase assistance—was 44 percent White, 44 percent African American, and 12 percent of another race or more than one race.
Exhibit 3-2� Race and Ethnicity of Study Participants Compared With All Recipients of HUD-Funded Counseling and Education
(1)
Study Participants
(2)
All HUD Counselees
Race
White 60% 44%
African American 30% 44%
Asian 2% 3%
Other race 7% 2%
More than one race 1% 7%
N 804 100,119
Ethnicity
Hispanic or Latino 14% 21%
Non-Hispanic or Latino 86% 79%
N 784 107,949
Note: Study data have been weighted on Hispanic origin, race, income, and age to account for sampling and nonresponse on the baseline survey and (as applicable) the follow-up survey.
Sources: Baseline survey (column 1); HUD-9902 Data from October 1, 2009–December 31, 2009 (column 2), accessed from http://portal.hud.gov/hudportal/documents/huddoc?id=2010q19902100528.pdf; data calculated from column Counseling and Education Activities Attributed to HUD Grant
3�2 HOUSING CHARACTERISTICSExhibit 3-3 presents information on the location and housing characteristics of study participants at the time of seeking counseling based on information collected through the baseline survey. Most study counselees lived in urban areas (80 percent) and in single-family homes (86 percent). Those not living in single-family homes lived in condominiums or cooperatives (7 percent), manufactured or mobile homes (4 percent), or multifamily homes with one or more units rented out (2 percent). More than one-half (57 percent) of the counselees in the study were the sole owners of their homes. For those counselees with a co-owner (43 percent), nearly all owned with their spouse or partner (91 percent). About 5 percent of the counselees owned with a relative, and the remaining 2 percent owned the house with a nonrelative.
32FORECLOSURE COUNSELING OUTCOME STUDY: FINAL REPORT HOUSING COUNSELING OUTCOME EVALUATION
3. CHARACTERISTICS OF COUSELING CLIENTS
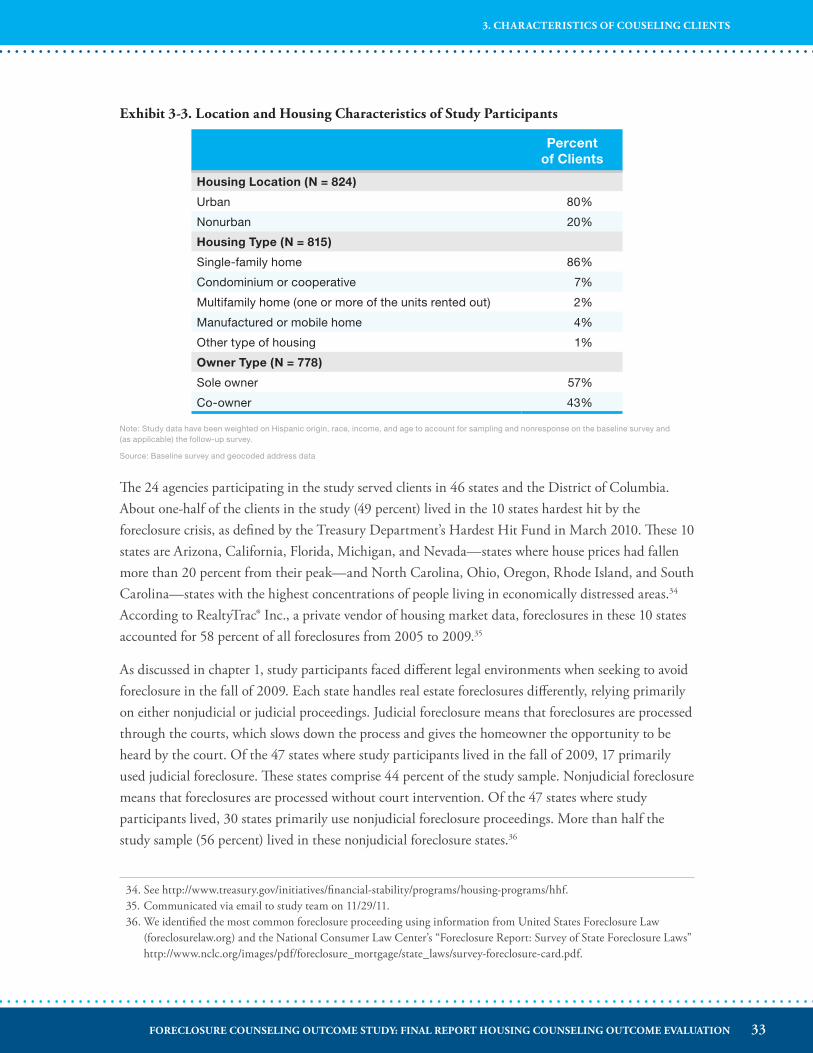
Exhibit 3-3� Location and Housing Characteristics of Study Participants
Percent of Clients
Housing Location (N = 824)
Urban 80%
Nonurban 20%
Housing Type (N = 815)
Single-family home 86%
Condominium or cooperative 7%
Multifamily home (one or more of the units rented out) 2%
Manufactured or mobile home 4%
Other type of housing 1%
Owner Type (N = 778)
Sole owner 57%
Co-owner 43%
Note: Study data have been weighted on Hispanic origin, race, income, and age to account for sampling and nonresponse on the baseline survey and (as applicable) the follow-up survey.
Source: Baseline survey and geocoded address data
The 24 agencies participating in the study served clients in 46 states and the District of Columbia. About one-half of the clients in the study (49 percent) lived in the 10 states hardest hit by the foreclosure crisis, as defined by the Treasury Department’s Hardest Hit Fund in March 2010. These 10 states are Arizona, California, Florida, Michigan, and Nevada—states where house prices had fallen more than 20 percent from their peak—and North Carolina, Ohio, Oregon, Rhode Island, and South Carolina—states with the highest concentrations of people living in economically distressed areas.34 According to RealtyTrac® Inc., a private vendor of housing market data, foreclosures in these 10 states accounted for 58 percent of all foreclosures from 2005 to 2009.35
As discussed in chapter 1, study participants faced different legal environments when seeking to avoid foreclosure in the fall of 2009. Each state handles real estate foreclosures differently, relying primarily on either nonjudicial or judicial proceedings. Judicial foreclosure means that foreclosures are processed through the courts, which slows down the process and gives the homeowner the opportunity to be heard by the court. Of the 47 states where study participants lived in the fall of 2009, 17 primarily used judicial foreclosure. These states comprise 44 percent of the study sample. Nonjudicial foreclosure means that foreclosures are processed without court intervention. Of the 47 states where study participants lived, 30 states primarily use nonjudicial foreclosure proceedings. More than half the study sample (56 percent) lived in these nonjudicial foreclosure states.36
34. See http://www.treasury.gov/initiatives/financial-stability/programs/housing-programs/hhf.35. Communicated via email to study team on 11/29/11.36. We identified the most common foreclosure proceeding using information from United States Foreclosure Law
(foreclosurelaw.org) and the National Consumer Law Center’s “Foreclosure Report: Survey of State Foreclosure Laws” http://www.nclc.org/images/pdf/foreclosure_mortgage/state_laws/survey-foreclosure-card.pdf.
33FORECLOSURE COUNSELING OUTCOME STUDY: FINAL REPORT HOUSING COUNSELING OUTCOME EVALUATION
3. CHARACTERISTICS OF COUSELING CLIENTS
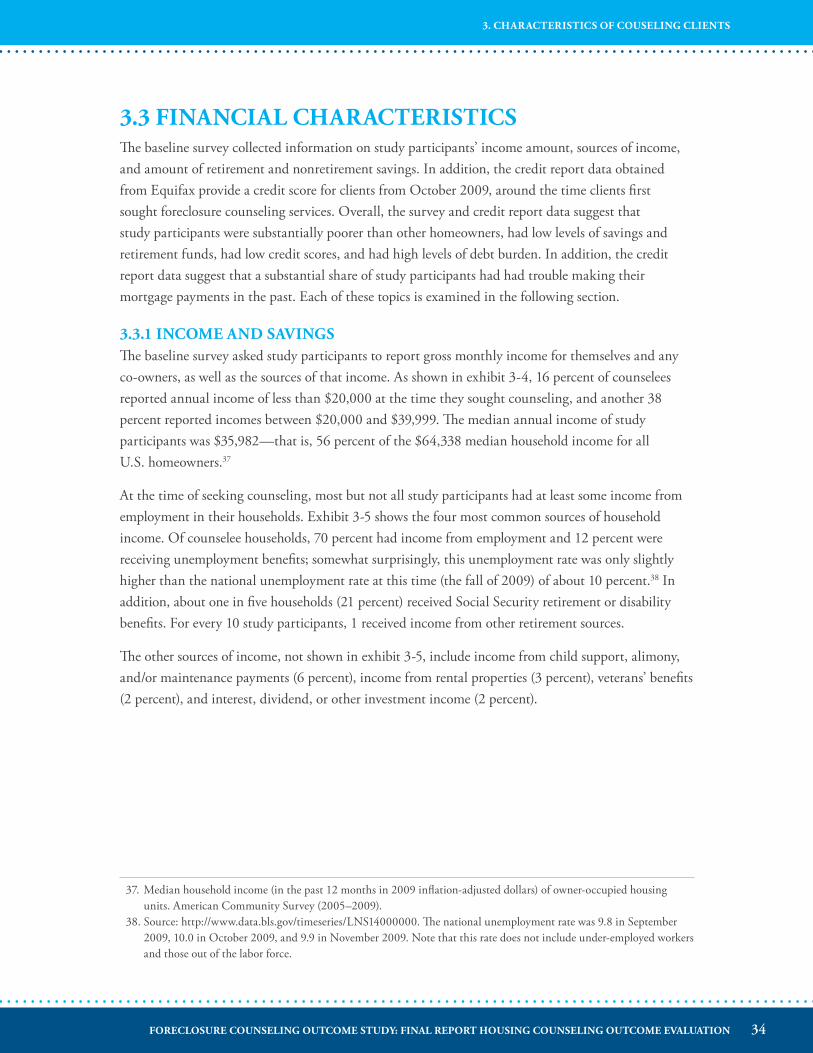
3�3 FINANCIAL CHARACTERISTICSThe baseline survey collected information on study participants’ income amount, sources of income, and amount of retirement and nonretirement savings. In addition, the credit report data obtained from Equifax provide a credit score for clients from October 2009, around the time clients first sought foreclosure counseling services. Overall, the survey and credit report data suggest that study participants were substantially poorer than other homeowners, had low levels of savings and retirement funds, had low credit scores, and had high levels of debt burden. In addition, the credit report data suggest that a substantial share of study participants had had trouble making their mortgage payments in the past. Each of these topics is examined in the following section.
3�3�1 INCOME AND SAVINGSThe baseline survey asked study participants to report gross monthly income for themselves and any co-owners, as well as the sources of that income. As shown in exhibit 3-4, 16 percent of counselees reported annual income of less than $20,000 at the time they sought counseling, and another 38 percent reported incomes between $20,000 and $39,999. The median annual income of study participants was $35,982—that is, 56 percent of the $64,338 median household income for all U.S. homeowners.37
At the time of seeking counseling, most but not all study participants had at least some income from employment in their households. Exhibit 3-5 shows the four most common sources of household income. Of counselee households, 70 percent had income from employment and 12 percent were receiving unemployment benefits; somewhat surprisingly, this unemployment rate was only slightly higher than the national unemployment rate at this time (the fall of 2009) of about 10 percent.38 In addition, about one in five households (21 percent) received Social Security retirement or disability benefits. For every 10 study participants, 1 received income from other retirement sources.
The other sources of income, not shown in exhibit 3-5, include income from child support, alimony, and/or maintenance payments (6 percent), income from rental properties (3 percent), veterans’ benefits (2 percent), and interest, dividend, or other investment income (2 percent).
37. Median household income (in the past 12 months in 2009 inflation-adjusted dollars) of owner-occupied housing units. American Community Survey (2005–2009).
38. Source: http://www.data.bls.gov/timeseries/LNS14000000. The national unemployment rate was 9.8 in September 2009, 10.0 in October 2009, and 9.9 in November 2009. Note that this rate does not include under-employed workers and those out of the labor force.
34FORECLOSURE COUNSELING OUTCOME STUDY: FINAL REPORT HOUSING COUNSELING OUTCOME EVALUATION
3. CHARACTERISTICS OF COUSELING CLIENTS
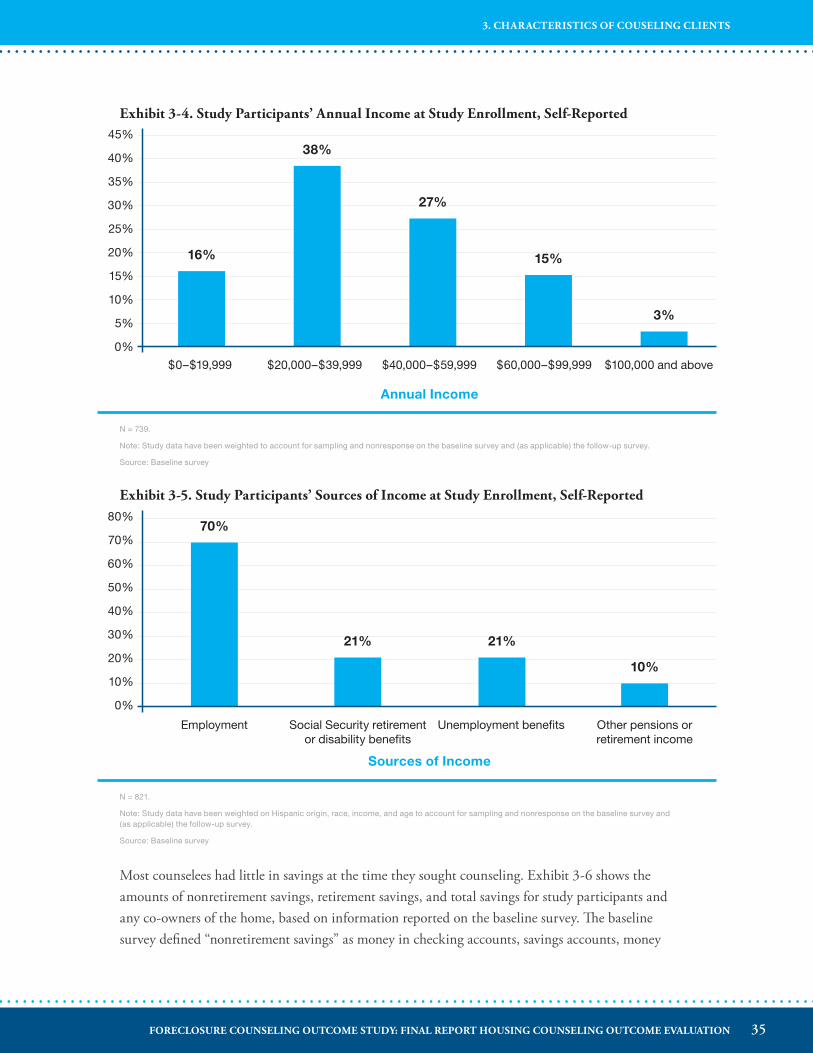
Exhibit 3-4� Study Participants’ Annual Income at Study Enrollment, Self-Reported
$0–$19,999 $20,000–$39,999 $40,000–$59,999 $60,000–$99,999 $100,000 and above
45%
40%
35%
30%
25%
20%
15%
10%
5%
0%
Annual Income
16%
38%
27%
15%
3%
Exhibit 3-5� Study Participants’ Sources of Income at Study Enrollment, Self-Reported
Most counselees had little in savings at the time they sought counseling. Exhibit 3-6 shows the amounts of nonretirement savings, retirement savings, and total savings for study participants and any co-owners of the home, based on information reported on the baseline survey. The baseline survey defined “nonretirement savings” as money in checking accounts, savings accounts, money
Employment Social Security retirement or disability benefits
Unemployment benefits Other pensions or retirement income
80%
70%
60%
50%
40%
30%
20%
10%
0%
Sources of Income
70%
21% 21%
10%
N = 739.
Note: Study data have been weighted to account for sampling and nonresponse on the baseline survey and (as applicable) the follow-up survey.
Source: Baseline survey
N = 821.
Note: Study data have been weighted on Hispanic origin, race, income, and age to account for sampling and nonresponse on the baseline survey and (as applicable) the follow-up survey.
Source: Baseline survey
35FORECLOSURE COUNSELING OUTCOME STUDY: FINAL REPORT HOUSING COUNSELING OUTCOME EVALUATION
3. CHARACTERISTICS OF COUSELING CLIENTS
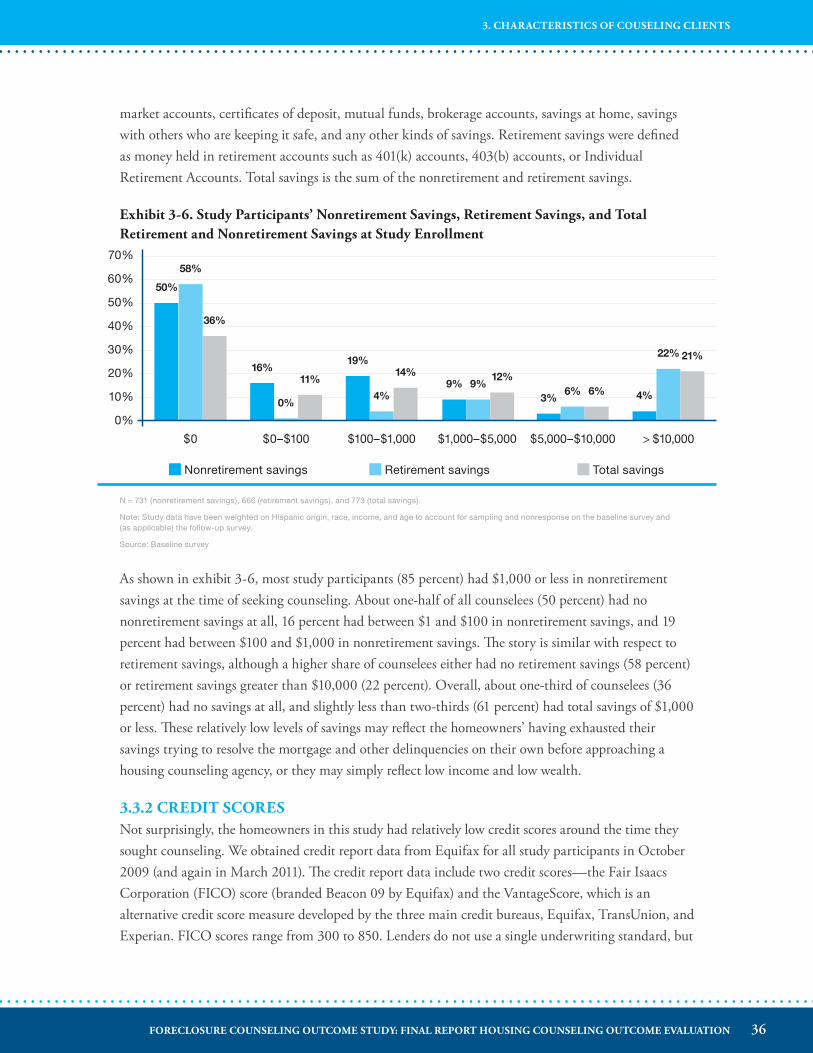
market accounts, certificates of deposit, mutual funds, brokerage accounts, savings at home, savings with others who are keeping it safe, and any other kinds of savings. Retirement savings were defined as money held in retirement accounts such as 401(k) accounts, 403(b) accounts, or Individual Retirement Accounts. Total savings is the sum of the nonretirement and retirement savings.
Exhibit 3-6� Study Participants’ Nonretirement Savings, Retirement Savings, and Total Retirement and Nonretirement Savings at Study Enrollment
N = 731 (nonretirement savings), 666 (retirement savings), and 773 (total savings).
Note: Study data have been weighted on Hispanic origin, race, income, and age to account for sampling and nonresponse on the baseline survey and (as applicable) the follow-up survey.
Source: Baseline survey
As shown in exhibit 3-6, most study participants (85 percent) had $1,000 or less in nonretirement savings at the time of seeking counseling. About one-half of all counselees (50 percent) had no nonretirement savings at all, 16 percent had between $1 and $100 in nonretirement savings, and 19 percent had between $100 and $1,000 in nonretirement savings. The story is similar with respect to retirement savings, although a higher share of counselees either had no retirement savings (58 percent) or retirement savings greater than $10,000 (22 percent). Overall, about one-third of counselees (36 percent) had no savings at all, and slightly less than two-thirds (61 percent) had total savings of $1,000 or less. These relatively low levels of savings may reflect the homeowners’ having exhausted their savings trying to resolve the mortgage and other delinquencies on their own before approaching a housing counseling agency, or they may simply reflect low income and low wealth.
3�3�2 CREDIT SCORESNot surprisingly, the homeowners in this study had relatively low credit scores around the time they sought counseling. We obtained credit report data from Equifax for all study participants in October 2009 (and again in March 2011). The credit report data include two credit scores—the Fair Isaacs Corporation (FICO) score (branded Beacon 09 by Equifax) and the VantageScore, which is an alternative credit score measure developed by the three main credit bureaus, Equifax, TransUnion, and Experian. FICO scores range from 300 to 850. Lenders do not use a single underwriting standard, but
$0 $0–$100 $100–$1,000 $1,000–$5,000 $5,000–$10,000 > $10,000
70%
60%
50%
40%
30%
20%
10%
0%
Nonretirement savings Retirement savings Total savings
58%
50%
36%
16%
0%
11%
19%
4%
14%9% 9%
12%
3%6% 6% 4%
22% 21%
36FORECLOSURE COUNSELING OUTCOME STUDY: FINAL REPORT HOUSING COUNSELING OUTCOME EVALUATION
3. CHARACTERISTICS OF COUSELING CLIENTS
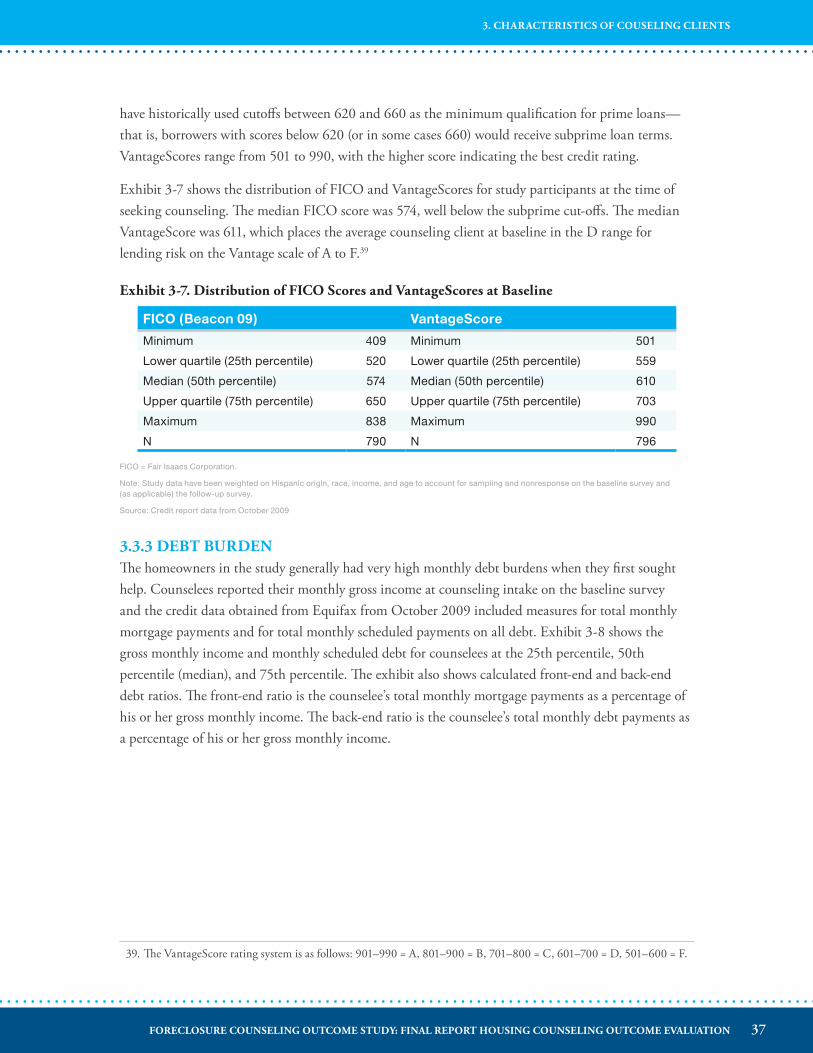
have historically used cutoffs between 620 and 660 as the minimum qualification for prime loans—that is, borrowers with scores below 620 (or in some cases 660) would receive subprime loan terms. VantageScores range from 501 to 990, with the higher score indicating the best credit rating.
Exhibit 3-7 shows the distribution of FICO and VantageScores for study participants at the time of seeking counseling. The median FICO score was 574, well below the subprime cut-offs. The median VantageScore was 611, which places the average counseling client at baseline in the D range for lending risk on the Vantage scale of A to F.39
Exhibit 3-7� Distribution of FICO Scores and VantageScores at Baseline
FICO (Beacon 09) VantageScore
Minimum 409 Minimum 501
Lower quartile (25th percentile) 520 Lower quartile (25th percentile) 559
Median (50th percentile) 574 Median (50th percentile) 610
Upper quartile (75th percentile) 650 Upper quartile (75th percentile) 703
Maximum 838 Maximum 990
N 790 N 796
FICO = Fair Isaacs Corporation.
Note: Study data have been weighted on Hispanic origin, race, income, and age to account for sampling and nonresponse on the baseline survey and (as applicable) the follow-up survey.
Source: Credit report data from October 2009
3�3�3 DEBT BURDENThe homeowners in the study generally had very high monthly debt burdens when they first sought help. Counselees reported their monthly gross income at counseling intake on the baseline survey and the credit data obtained from Equifax from October 2009 included measures for total monthly mortgage payments and for total monthly scheduled payments on all debt. Exhibit 3-8 shows the gross monthly income and monthly scheduled debt for counselees at the 25th percentile, 50th percentile (median), and 75th percentile. The exhibit also shows calculated front-end and back-end debt ratios. The front-end ratio is the counselee’s total monthly mortgage payments as a percentage of his or her gross monthly income. The back-end ratio is the counselee’s total monthly debt payments as a percentage of his or her gross monthly income.
39. The VantageScore rating system is as follows: 901–990 = A, 801–900 = B, 701–800 = C, 601–700 = D, 501–600 = F.
37FORECLOSURE COUNSELING OUTCOME STUDY: FINAL REPORT HOUSING COUNSELING OUTCOME EVALUATION
3. CHARACTERISTICS OF COUSELING CLIENTS
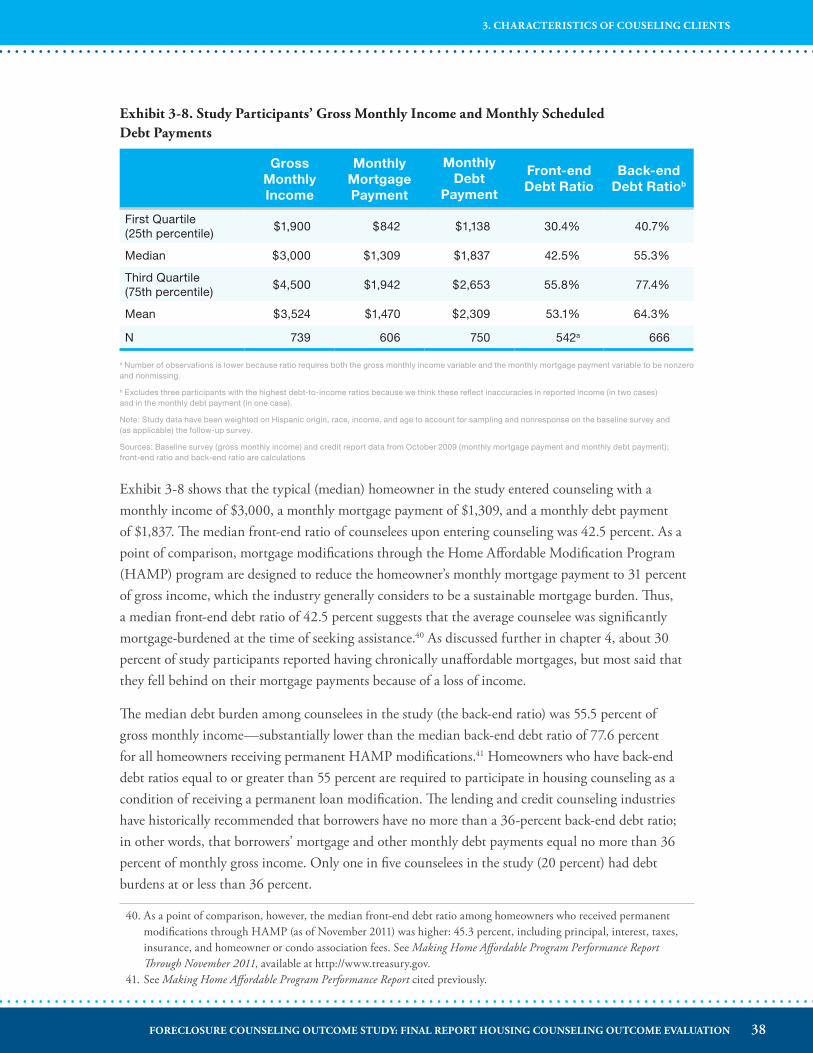
Exhibit 3-8� Study Participants’ Gross Monthly Income and Monthly Scheduled Debt Payments
Gross Monthly Income
Monthly Mortgage Payment
Monthly Debt
Payment
Front-end Debt Ratio
Back-end Debt Ratiob
First Quartile (25th percentile)
$1,900 $842 $1,138 30.4% 40.7%
Median $3,000 $1,309 $1,837 42.5% 55.3%
Third Quartile (75th percentile)
$4,500 $1,942 $2,653 55.8% 77.4%
Mean $3,524 $1,470 $2,309 53.1% 64.3%
N 739 606 750 542a 666
a Number of observations is lower because ratio requires both the gross monthly income variable and the monthly mortgage payment variable to be nonzero and nonmissing.
b Excludes three participants with the highest debt-to-income ratios because we think these reflect inaccuracies in reported income (in two cases) and in the monthly debt payment (in one case).
Note: Study data have been weighted on Hispanic origin, race, income, and age to account for sampling and nonresponse on the baseline survey and (as applicable) the follow-up survey.
Sources: Baseline survey (gross monthly income) and credit report data from October 2009 (monthly mortgage payment and monthly debt payment); front-end ratio and back-end ratio are calculations
Exhibit 3-8 shows that the typical (median) homeowner in the study entered counseling with a monthly income of $3,000, a monthly mortgage payment of $1,309, and a monthly debt payment of $1,837. The median front-end ratio of counselees upon entering counseling was 42.5 percent. As a point of comparison, mortgage modifications through the Home Affordable Modification Program (HAMP) program are designed to reduce the homeowner’s monthly mortgage payment to 31 percent of gross income, which the industry generally considers to be a sustainable mortgage burden. Thus, a median front-end debt ratio of 42.5 percent suggests that the average counselee was significantly mortgage-burdened at the time of seeking assistance.40 As discussed further in chapter 4, about 30 percent of study participants reported having chronically unaffordable mortgages, but most said that they fell behind on their mortgage payments because of a loss of income.
The median debt burden among counselees in the study (the back-end ratio) was 55.5 percent of gross monthly income—substantially lower than the median back-end debt ratio of 77.6 percent for all homeowners receiving permanent HAMP modifications.41 Homeowners who have back-end debt ratios equal to or greater than 55 percent are required to participate in housing counseling as a condition of receiving a permanent loan modification. The lending and credit counseling industries have historically recommended that borrowers have no more than a 36-percent back-end debt ratio; in other words, that borrowers’ mortgage and other monthly debt payments equal no more than 36 percent of monthly gross income. Only one in five counselees in the study (20 percent) had debt burdens at or less than 36 percent.
40. As a point of comparison, however, the median front-end debt ratio among homeowners who received permanent modifications through HAMP (as of November 2011) was higher: 45.3 percent, including principal, interest, taxes, insurance, and homeowner or condo association fees. See Making Home Affordable Program Performance Report Through November 2011, available at http://www.treasury.gov.
41. See Making Home Affordable Program Performance Report cited previously.
38FORECLOSURE COUNSELING OUTCOME STUDY: FINAL REPORT HOUSING COUNSELING OUTCOME EVALUATION
3. CHARACTERISTICS OF COUSELING CLIENTS
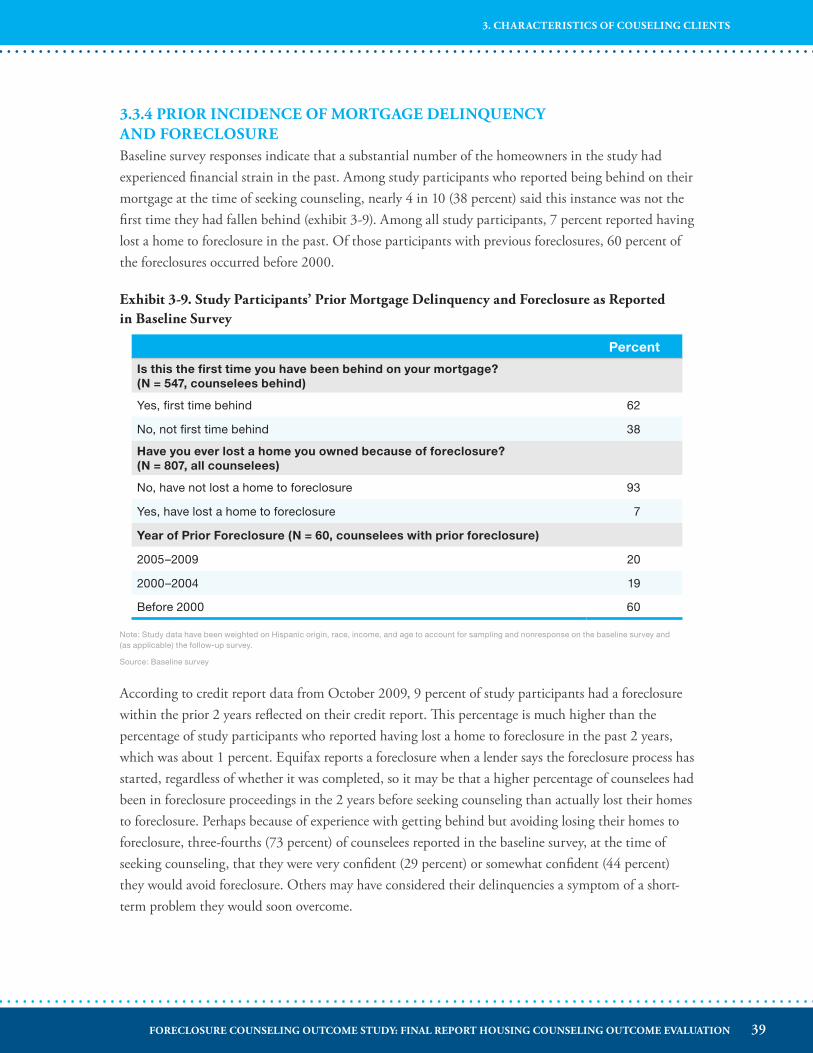
3�3�4 PRIOR INCIDENCE OF MORTGAGE DELINQUENCY AND FORECLOSUREBaseline survey responses indicate that a substantial number of the homeowners in the study had experienced financial strain in the past. Among study participants who reported being behind on their mortgage at the time of seeking counseling, nearly 4 in 10 (38 percent) said this instance was not the first time they had fallen behind (exhibit 3-9). Among all study participants, 7 percent reported having lost a home to foreclosure in the past. Of those participants with previous foreclosures, 60 percent of the foreclosures occurred before 2000.
Exhibit 3-9� Study Participants’ Prior Mortgage Delinquency and Foreclosure as Reported in Baseline Survey
Percent
Is this the first time you have been behind on your mortgage? (N = 547, counselees behind)
Yes, first time behind 62
No, not first time behind 38
Have you ever lost a home you owned because of foreclosure? (N = 807, all counselees)
No, have not lost a home to foreclosure 93
Yes, have lost a home to foreclosure 7
Year of Prior Foreclosure (N = 60, counselees with prior foreclosure)
2005–2009 20
2000–2004 19
Before 2000 60
Note: Study data have been weighted on Hispanic origin, race, income, and age to account for sampling and nonresponse on the baseline survey and (as applicable) the follow-up survey.
Source: Baseline survey
According to credit report data from October 2009, 9 percent of study participants had a foreclosure within the prior 2 years reflected on their credit report. This percentage is much higher than the percentage of study participants who reported having lost a home to foreclosure in the past 2 years, which was about 1 percent. Equifax reports a foreclosure when a lender says the foreclosure process has started, regardless of whether it was completed, so it may be that a higher percentage of counselees had been in foreclosure proceedings in the 2 years before seeking counseling than actually lost their homes to foreclosure. Perhaps because of experience with getting behind but avoiding losing their homes to foreclosure, three-fourths (73 percent) of counselees reported in the baseline survey, at the time of seeking counseling, that they were very confident (29 percent) or somewhat confident (44 percent) they would avoid foreclosure. Others may have considered their delinquencies a symptom of a short-term problem they would soon overcome.
39FORECLOSURE COUNSELING OUTCOME STUDY: FINAL REPORT HOUSING COUNSELING OUTCOME EVALUATION
3. CHARACTERISTICS OF COUSELING CLIENTS
Credit data further show that about one in seven study participants (14 percent) had a major derogatory rating (more than 120 days overdue) on a first mortgage at some point in the past. Most of those derogatory incidents (79 percent) had occurred in the previous 2 years. Among study counselees, 23 percent had had a major derogatory rating on a nonhome equity revolving account such as a credit card in the prior 2 years. Presumably, many of the foreclosure starts and major derogatory ratings observed in the credit data capture the financial distress that prompted the study participants to seek housing counseling.
The credit data contain only limited information related to bankruptcies, obtained from public records and account information. Where sufficient data are available, the credit dataset includes information on whether the individual has filed for bankruptcy in the past 24 months or ever. For more than 75 percent of the sample, however, Equifax determined that it did not have sufficient information to state whether or not the individual had filed for bankruptcy. If we assume that people for whom the data are missing have not filed for bankruptcy, we estimate that about 6 percent of study counselees had filed for bankruptcy in the 24 months before seeking counseling and that about 21 percent had ever filed for bankruptcy. As a point of comparison, in 2009 about 1 percent of the total U.S. population over the age of 25 filed for bankruptcy.42 The much higher rate of filing among study participants, along with other financial data, suggests that these homeowners were more economically distressed than most Americans.
3�4 CHAPTER SUMMARYThis chapter described the demographic, housing, and financial characteristics of the 824 foreclosure counseling clients in the study sample at the time they first sought counseling services. Most of the information presented in the chapter came from the baseline survey that study participants completed at study enrollment. The chapter also drew on the credit report data obtained for the study sample from October 2009.
The homeowners who sought foreclosure counseling in the fall of 2009 and enrolled in the study tended to be younger than homeowners overall but also included a substantial share of middle-aged homeowners. Most study participants (59 percent) were women compared with 43 percent of U.S. homeowners overall. Study participants were also more likely to be non-White or Hispanic than homeowners overall, which is consistent with the disproportionate rate of foreclosures among racial and ethnic minorities in recent years. In particular, 30 percent of the counselees in the study were African American compared with 8 percent of homeowners nationally.
Study participants tended to have lower incomes than other homeowners. The median income of study participants at the time of seeking counseling was about $36,000, 56 percent of the median household income for all U.S. homeowners at the time. At the same time, about 70 percent of counselee households had at least some income from employment.
42. Information on bankruptcy filings from http://www.uscourts.gov/Statistics/BankruptcyStatistics.aspx.
40FORECLOSURE COUNSELING OUTCOME STUDY: FINAL REPORT HOUSING COUNSELING OUTCOME EVALUATION
3. CHARACTERISTICS OF COUSELING CLIENTS
Most counselees in the study had little in savings by the time they sought counseling, so little money to tap into to pay their mortgages. Overall, 36 percent of study participants reported having no savings at all, and 61 percent reported total savings (nonretirement or retirement savings) of $1,000 or less. The homeowners in the study also generally had high monthly debt burdens when they first sought help. The median front-end ratio (total mortgage payments as a percentage of gross income) upon entering counseling was 42.5 percent and the median debt burden (total debts as a percentage of gross income) was 55.5 percent. These debt burdens are lower than the average for people receiving HAMP modifications in recent years, but nevertheless illustrate the severity of counselees’ financial difficulties.
A substantial number of the homeowners in the study had experienced financial strain in the past. Among study participants who reported being behind on their mortgages at the time of seeking counseling, 38 percent said this instance was not their first time getting behind. Among all study participants, 7 percent reported having lost a home to foreclosure in the past, most before 2000. About 14 percent of counselees had had a major derogatory rating on a first mortgage at some point in the past, mostly in the previous 2 years, and we estimate that about 6 percent of counselees had filed for bankruptcy in the 2 years before seeking counseling.
41FORECLOSURE COUNSELING OUTCOME STUDY: FINAL REPORT HOUSING COUNSELING OUTCOME EVALUATION
3. CHARACTERISTICS OF COUSELING CLIENTS
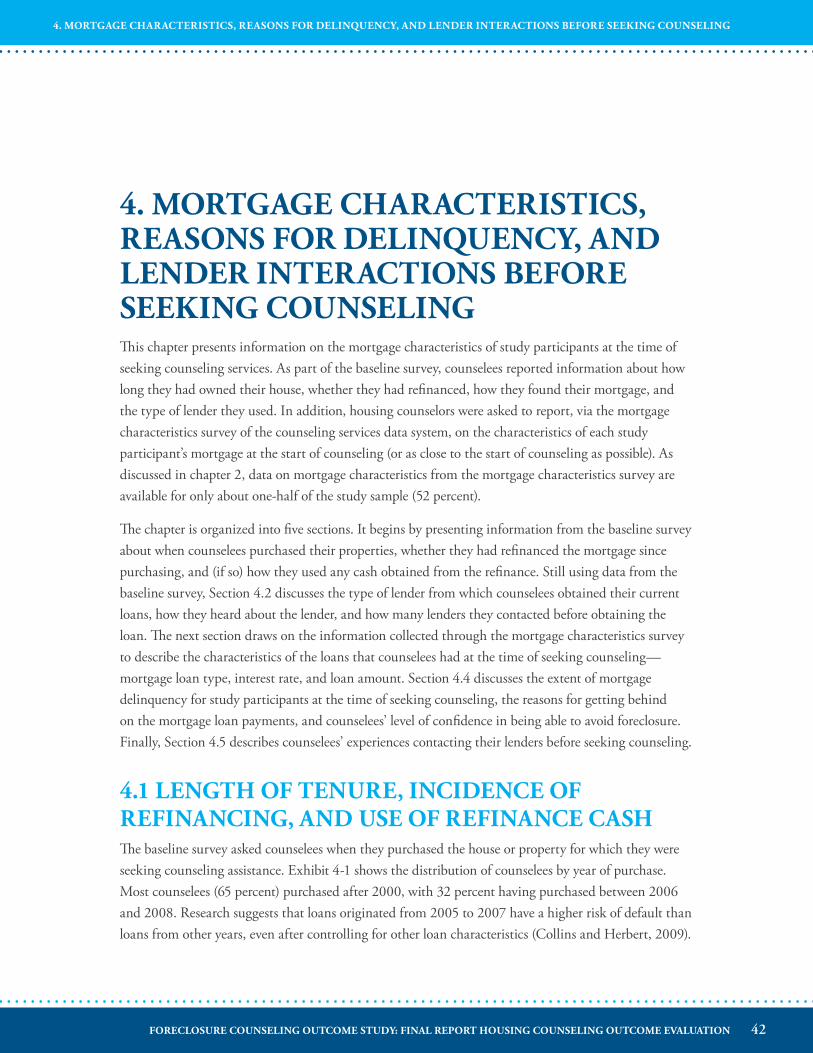
4� MORTGAGE CHARACTERISTICS, REASONS FOR DELINQUENCY, AND LENDER INTERACTIONS BEFORE SEEKING COUNSELINGThis chapter presents information on the mortgage characteristics of study participants at the time of seeking counseling services. As part of the baseline survey, counselees reported information about how long they had owned their house, whether they had refinanced, how they found their mortgage, and the type of lender they used. In addition, housing counselors were asked to report, via the mortgage characteristics survey of the counseling services data system, on the characteristics of each study participant’s mortgage at the start of counseling (or as close to the start of counseling as possible). As discussed in chapter 2, data on mortgage characteristics from the mortgage characteristics survey are available for only about one-half of the study sample (52 percent).
The chapter is organized into five sections. It begins by presenting information from the baseline survey about when counselees purchased their properties, whether they had refinanced the mortgage since purchasing, and (if so) how they used any cash obtained from the refinance. Still using data from the baseline survey, Section 4.2 discusses the type of lender from which counselees obtained their current loans, how they heard about the lender, and how many lenders they contacted before obtaining the loan. The next section draws on the information collected through the mortgage characteristics survey to describe the characteristics of the loans that counselees had at the time of seeking counseling—mortgage loan type, interest rate, and loan amount. Section 4.4 discusses the extent of mortgage delinquency for study participants at the time of seeking counseling, the reasons for getting behind on the mortgage loan payments, and counselees’ level of confidence in being able to avoid foreclosure. Finally, Section 4.5 describes counselees’ experiences contacting their lenders before seeking counseling.
4�1 LENGTH OF TENURE, INCIDENCE OF REFINANCING, AND USE OF REFINANCE CASHThe baseline survey asked counselees when they purchased the house or property for which they were seeking counseling assistance. Exhibit 4-1 shows the distribution of counselees by year of purchase. Most counselees (65 percent) purchased after 2000, with 32 percent having purchased between 2006 and 2008. Research suggests that loans originated from 2005 to 2007 have a higher risk of default than loans from other years, even after controlling for other loan characteristics (Collins and Herbert, 2009).
42FORECLOSURE COUNSELING OUTCOME STUDY: FINAL REPORT HOUSING COUNSELING OUTCOME EVALUATION
4. MORTGAGE CHARACTERISTICS, REASONS FOR DELINQUENCY, AND LENDER INTERACTIONS BEFORE SEEKING COUNSELING
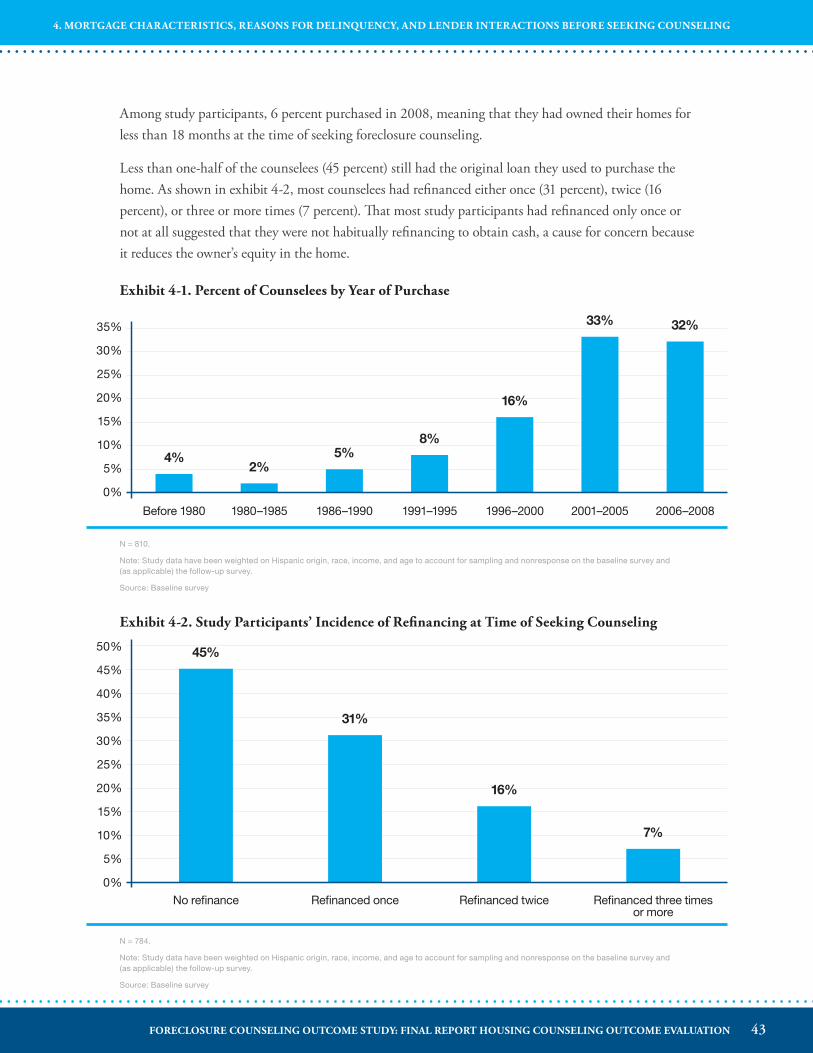
Among study participants, 6 percent purchased in 2008, meaning that they had owned their homes for less than 18 months at the time of seeking foreclosure counseling.
Less than one-half of the counselees (45 percent) still had the original loan they used to purchase the home. As shown in exhibit 4-2, most counselees had refinanced either once (31 percent), twice (16 percent), or three or more times (7 percent). That most study participants had refinanced only once or not at all suggested that they were not habitually refinancing to obtain cash, a cause for concern because it reduces the owner’s equity in the home.
Exhibit 4-1� Percent of Counselees by Year of Purchase
Before 1980 1980–1985 1986–1990 1991–1995 1996–2000 2001–2005 2006–2008
35%
30%
25%
20%
15%
10%
5%
0%
5%2%
8%
16%
32%33%
4%
N = 810.
Note: Study data have been weighted on Hispanic origin, race, income, and age to account for sampling and nonresponse on the baseline survey and (as applicable) the follow-up survey.
Source: Baseline survey
N = 784.
Note: Study data have been weighted on Hispanic origin, race, income, and age to account for sampling and nonresponse on the baseline survey and (as applicable) the follow-up survey.
Source: Baseline survey
Exhibit 4-2� Study Participants’ Incidence of Refinancing at Time of Seeking Counseling
No refinance Refinanced once Refinanced twice Refinanced three times or more
50%
45%
40%
35%
30%
25%
20%
15%
10%
5%
0%
31%
7%
16%
45%
43FORECLOSURE COUNSELING OUTCOME STUDY: FINAL REPORT HOUSING COUNSELING OUTCOME EVALUATION
4. MORTGAGE CHARACTERISTICS, REASONS FOR DELINQUENCY, AND LENDER INTERACTIONS BEFORE SEEKING COUNSELING
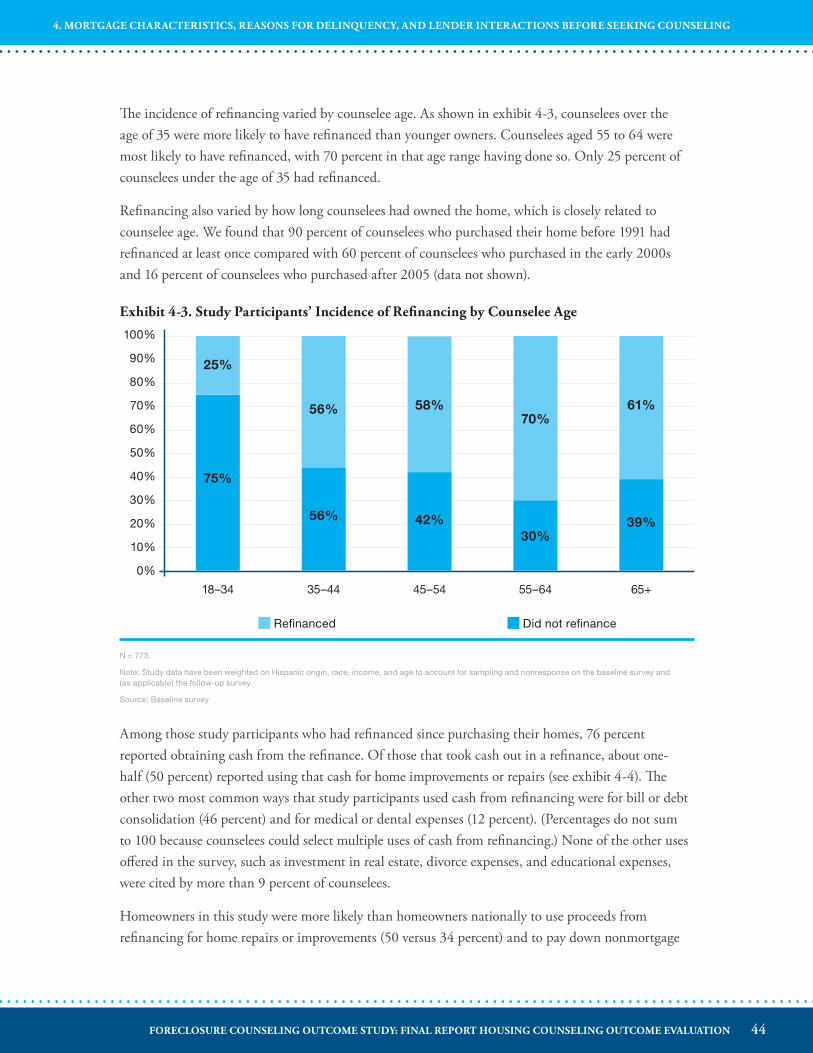
The incidence of refinancing varied by counselee age. As shown in exhibit 4-3, counselees over the age of 35 were more likely to have refinanced than younger owners. Counselees aged 55 to 64 were most likely to have refinanced, with 70 percent in that age range having done so. Only 25 percent of counselees under the age of 35 had refinanced.
Refinancing also varied by how long counselees had owned the home, which is closely related to counselee age. We found that 90 percent of counselees who purchased their home before 1991 had refinanced at least once compared with 60 percent of counselees who purchased in the early 2000s and 16 percent of counselees who purchased after 2005 (data not shown).
Exhibit 4-3� Study Participants’ Incidence of Refinancing by Counselee Age
N = 773.
Note: Study data have been weighted on Hispanic origin, race, income, and age to account for sampling and nonresponse on the baseline survey and (as applicable) the follow-up survey.
Source: Baseline survey
Among those study participants who had refinanced since purchasing their homes, 76 percent reported obtaining cash from the refinance. Of those that took cash out in a refinance, about one-half (50 percent) reported using that cash for home improvements or repairs (see exhibit 4-4). The other two most common ways that study participants used cash from refinancing were for bill or debt consolidation (46 percent) and for medical or dental expenses (12 percent). (Percentages do not sum to 100 because counselees could select multiple uses of cash from refinancing.) None of the other uses offered in the survey, such as investment in real estate, divorce expenses, and educational expenses, were cited by more than 9 percent of counselees.
Homeowners in this study were more likely than homeowners nationally to use proceeds from refinancing for home repairs or improvements (50 versus 34 percent) and to pay down nonmortgage
100%
90%
80%
70%
60%
50%
40%
30%
20%
10%
0%
75%
25%
56% 58%70%
61%
56% 42%30%
39%
18–34 35–44 45–54 55–64 65+
Refinanced Did not refinance
44FORECLOSURE COUNSELING OUTCOME STUDY: FINAL REPORT HOUSING COUNSELING OUTCOME EVALUATION
4. MORTGAGE CHARACTERISTICS, REASONS FOR DELINQUENCY, AND LENDER INTERACTIONS BEFORE SEEKING COUNSELING
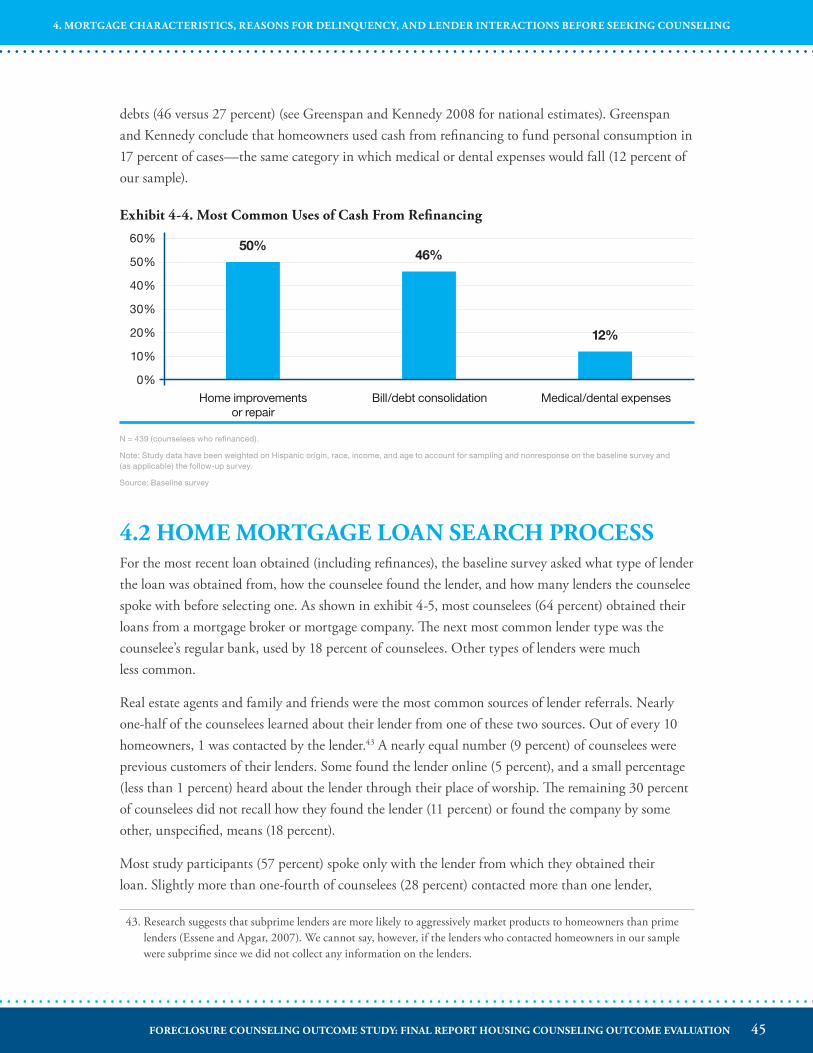
debts (46 versus 27 percent) (see Greenspan and Kennedy 2008 for national estimates). Greenspan and Kennedy conclude that homeowners used cash from refinancing to fund personal consumption in 17 percent of cases—the same category in which medical or dental expenses would fall (12 percent of our sample).
Exhibit 4-4� Most Common Uses of Cash From Refinancing
Home improvements or repair
Bill/debt consolidation Medical/dental expenses
60%
50%
40%
30%
20%
10%
0%
46%
12%
50%
N = 439 (counselees who refinanced).
Note: Study data have been weighted on Hispanic origin, race, income, and age to account for sampling and nonresponse on the baseline survey and (as applicable) the follow-up survey.
Source: Baseline survey
4�2 HOME MORTGAGE LOAN SEARCH PROCESSFor the most recent loan obtained (including refinances), the baseline survey asked what type of lender the loan was obtained from, how the counselee found the lender, and how many lenders the counselee spoke with before selecting one. As shown in exhibit 4-5, most counselees (64 percent) obtained their loans from a mortgage broker or mortgage company. The next most common lender type was the counselee’s regular bank, used by 18 percent of counselees. Other types of lenders were much less common.
Real estate agents and family and friends were the most common sources of lender referrals. Nearly one-half of the counselees learned about their lender from one of these two sources. Out of every 10 homeowners, 1 was contacted by the lender.43 A nearly equal number (9 percent) of counselees were previous customers of their lenders. Some found the lender online (5 percent), and a small percentage (less than 1 percent) heard about the lender through their place of worship. The remaining 30 percent of counselees did not recall how they found the lender (11 percent) or found the company by some other, unspecified, means (18 percent).
Most study participants (57 percent) spoke only with the lender from which they obtained their loan. Slightly more than one-fourth of counselees (28 percent) contacted more than one lender,
43. Research suggests that subprime lenders are more likely to aggressively market products to homeowners than prime lenders (Essene and Apgar, 2007). We cannot say, however, if the lenders who contacted homeowners in our sample were subprime since we did not collect any information on the lenders.
45FORECLOSURE COUNSELING OUTCOME STUDY: FINAL REPORT HOUSING COUNSELING OUTCOME EVALUATION
4. MORTGAGE CHARACTERISTICS, REASONS FOR DELINQUENCY, AND LENDER INTERACTIONS BEFORE SEEKING COUNSELING
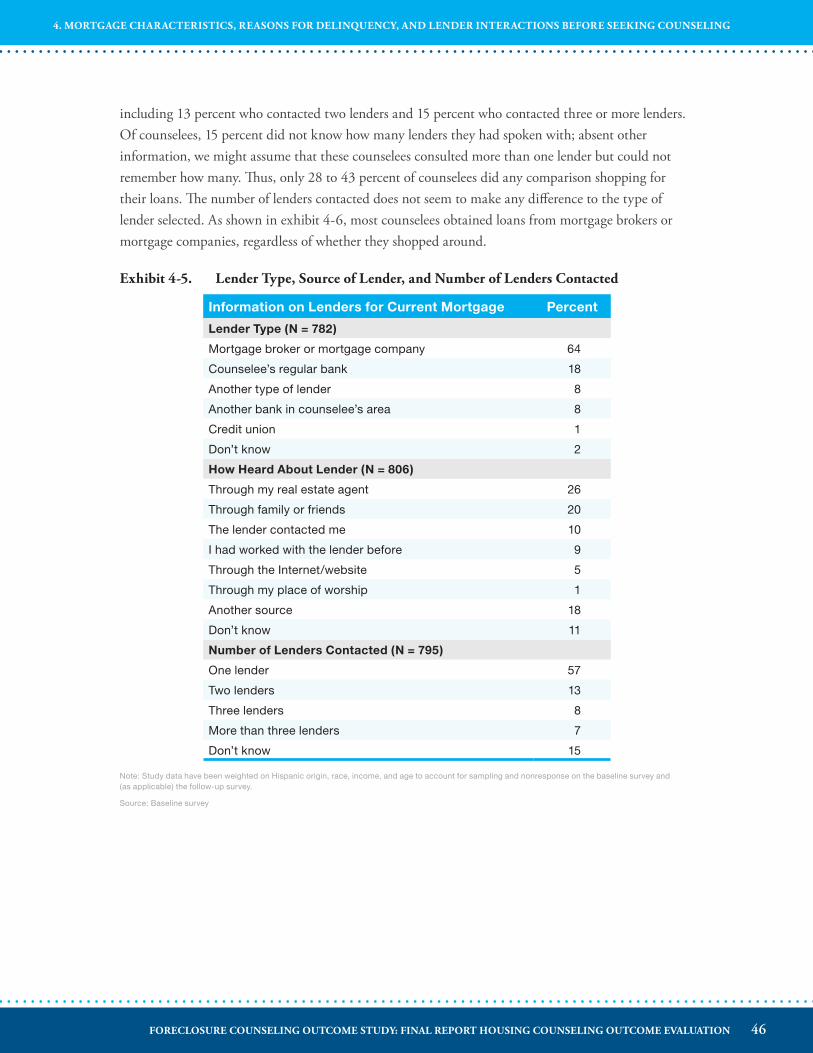
including 13 percent who contacted two lenders and 15 percent who contacted three or more lenders. Of counselees, 15 percent did not know how many lenders they had spoken with; absent other information, we might assume that these counselees consulted more than one lender but could not remember how many. Thus, only 28 to 43 percent of counselees did any comparison shopping for their loans. The number of lenders contacted does not seem to make any difference to the type of lender selected. As shown in exhibit 4-6, most counselees obtained loans from mortgage brokers or mortgage companies, regardless of whether they shopped around.
Exhibit 4-5� Lender Type, Source of Lender, and Number of Lenders Contacted
Information on Lenders for Current Mortgage Percent
Lender Type (N = 782)
Mortgage broker or mortgage company 64
Counselee’s regular bank 18
Another type of lender 8
Another bank in counselee’s area 8
Credit union 1
Don’t know 2
How Heard About Lender (N = 806)
Through my real estate agent 26
Through family or friends 20
The lender contacted me 10
I had worked with the lender before 9
Through the Internet/website 5
Through my place of worship 1
Another source 18
Don’t know 11
Number of Lenders Contacted (N = 795)
One lender 57
Two lenders 13
Three lenders 8
More than three lenders 7
Don’t know 15
Note: Study data have been weighted on Hispanic origin, race, income, and age to account for sampling and nonresponse on the baseline survey and (as applicable) the follow-up survey.
Source: Baseline survey
46FORECLOSURE COUNSELING OUTCOME STUDY: FINAL REPORT HOUSING COUNSELING OUTCOME EVALUATION
4. MORTGAGE CHARACTERISTICS, REASONS FOR DELINQUENCY, AND LENDER INTERACTIONS BEFORE SEEKING COUNSELING
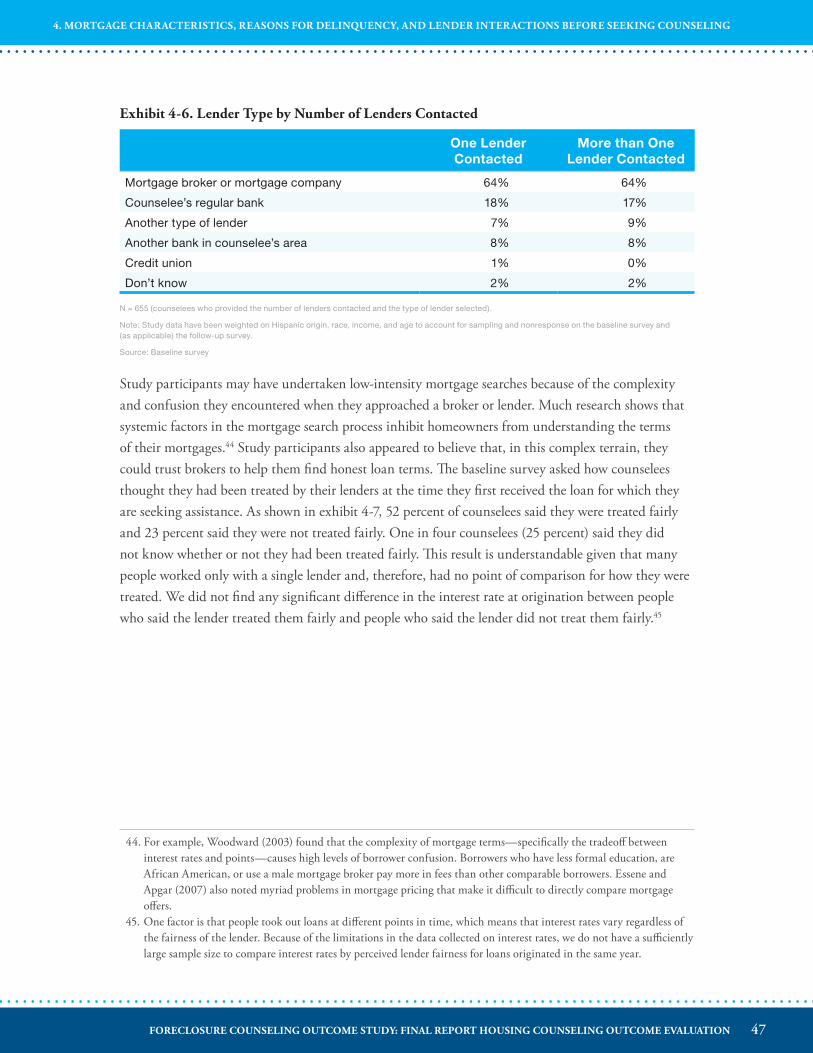
Exhibit 4-6� Lender Type by Number of Lenders Contacted
One Lender Contacted
More than One Lender Contacted
Mortgage broker or mortgage company 64% 64%
Counselee’s regular bank 18% 17%
Another type of lender 7% 9%
Another bank in counselee’s area 8% 8%
Credit union 1% 0%
Don’t know 2% 2%
N = 655 (counselees who provided the number of lenders contacted and the type of lender selected).
Note: Study data have been weighted on Hispanic origin, race, income, and age to account for sampling and nonresponse on the baseline survey and (as applicable) the follow-up survey.
Source: Baseline survey
Study participants may have undertaken low-intensity mortgage searches because of the complexity and confusion they encountered when they approached a broker or lender. Much research shows that systemic factors in the mortgage search process inhibit homeowners from understanding the terms of their mortgages.44 Study participants also appeared to believe that, in this complex terrain, they could trust brokers to help them find honest loan terms. The baseline survey asked how counselees thought they had been treated by their lenders at the time they first received the loan for which they are seeking assistance. As shown in exhibit 4-7, 52 percent of counselees said they were treated fairly and 23 percent said they were not treated fairly. One in four counselees (25 percent) said they did not know whether or not they had been treated fairly. This result is understandable given that many people worked only with a single lender and, therefore, had no point of comparison for how they were treated. We did not find any significant difference in the interest rate at origination between people who said the lender treated them fairly and people who said the lender did not treat them fairly.45
44. For example, Woodward (2003) found that the complexity of mortgage terms—specifically the tradeoff between interest rates and points—causes high levels of borrower confusion. Borrowers who have less formal education, are African American, or use a male mortgage broker pay more in fees than other comparable borrowers. Essene and Apgar (2007) also noted myriad problems in mortgage pricing that make it difficult to directly compare mortgage offers.
45. One factor is that people took out loans at different points in time, which means that interest rates vary regardless of the fairness of the lender. Because of the limitations in the data collected on interest rates, we do not have a sufficiently large sample size to compare interest rates by perceived lender fairness for loans originated in the same year.
47FORECLOSURE COUNSELING OUTCOME STUDY: FINAL REPORT HOUSING COUNSELING OUTCOME EVALUATION
4. MORTGAGE CHARACTERISTICS, REASONS FOR DELINQUENCY, AND LENDER INTERACTIONS BEFORE SEEKING COUNSELING
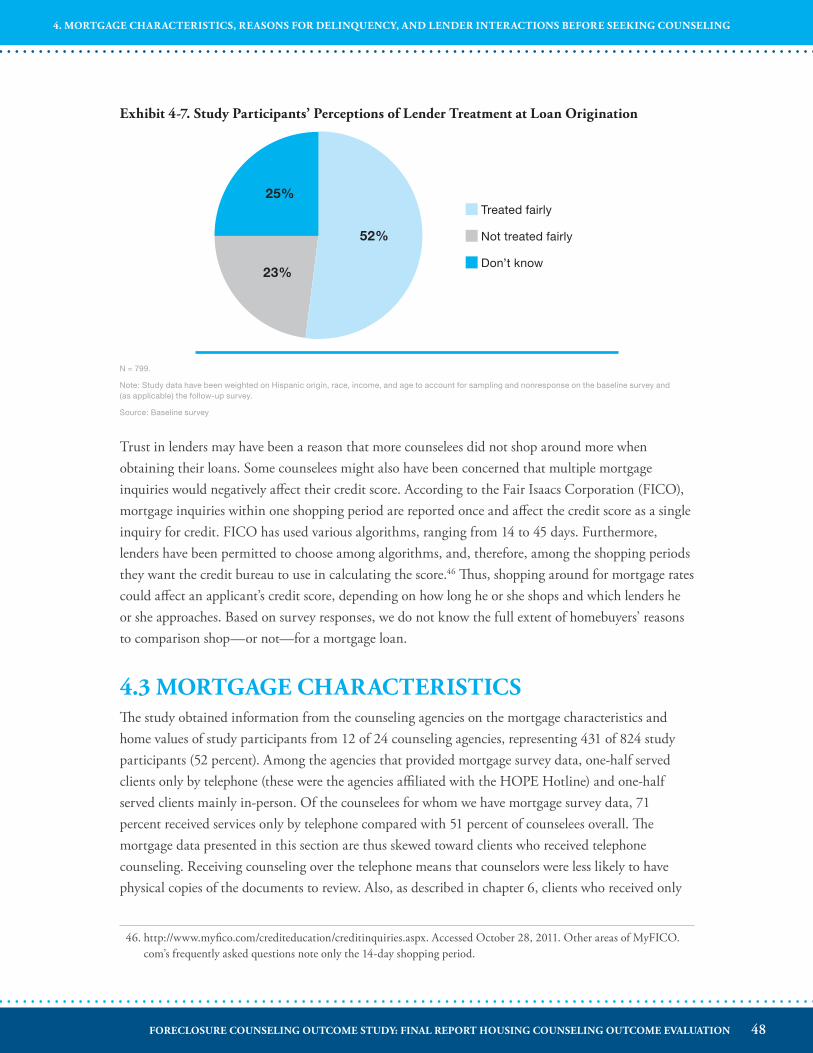
Exhibit 4-7� Study Participants’ Perceptions of Lender Treatment at Loan Origination
52%
25%
23%
Treated fairly
Not treated fairly
Don’t know
Trust in lenders may have been a reason that more counselees did not shop around more when obtaining their loans. Some counselees might also have been concerned that multiple mortgage inquiries would negatively affect their credit score. According to the Fair Isaacs Corporation (FICO), mortgage inquiries within one shopping period are reported once and affect the credit score as a single inquiry for credit. FICO has used various algorithms, ranging from 14 to 45 days. Furthermore, lenders have been permitted to choose among algorithms, and, therefore, among the shopping periods they want the credit bureau to use in calculating the score.46 Thus, shopping around for mortgage rates could affect an applicant’s credit score, depending on how long he or she shops and which lenders he or she approaches. Based on survey responses, we do not know the full extent of homebuyers’ reasons to comparison shop—or not—for a mortgage loan.
4�3 MORTGAGE CHARACTERISTICSThe study obtained information from the counseling agencies on the mortgage characteristics and home values of study participants from 12 of 24 counseling agencies, representing 431 of 824 study participants (52 percent). Among the agencies that provided mortgage survey data, one-half served clients only by telephone (these were the agencies affiliated with the HOPE Hotline) and one-half served clients mainly in-person. Of the counselees for whom we have mortgage survey data, 71 percent received services only by telephone compared with 51 percent of counselees overall. The mortgage data presented in this section are thus skewed toward clients who received telephone counseling. Receiving counseling over the telephone means that counselors were less likely to have physical copies of the documents to review. Also, as described in chapter 6, clients who received only
46. http://www.myfico.com/crediteducation/creditinquiries.aspx. Accessed October 28, 2011. Other areas of MyFICO.com’s frequently asked questions note only the 14-day shopping period.
N = 799.
Note: Study data have been weighted on Hispanic origin, race, income, and age to account for sampling and nonresponse on the baseline survey and (as applicable) the follow-up survey.
Source: Baseline survey
48FORECLOSURE COUNSELING OUTCOME STUDY: FINAL REPORT HOUSING COUNSELING OUTCOME EVALUATION
4. MORTGAGE CHARACTERISTICS, REASONS FOR DELINQUENCY, AND LENDER INTERACTIONS BEFORE SEEKING COUNSELING
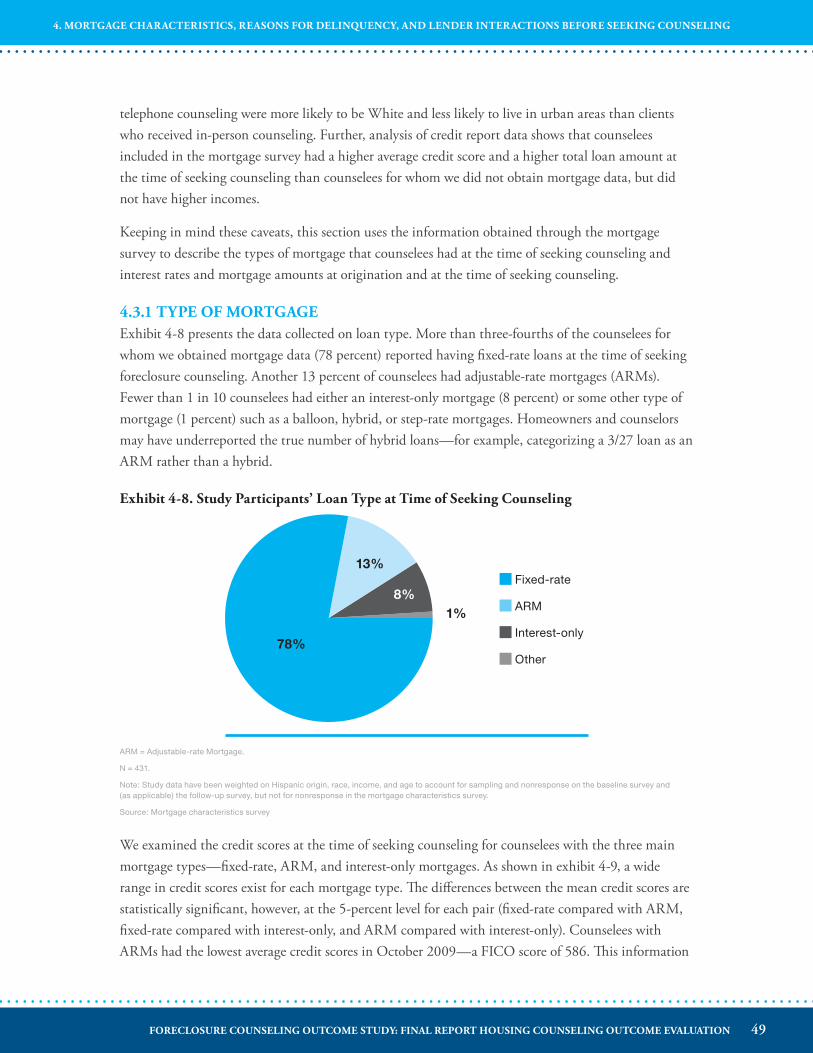
telephone counseling were more likely to be White and less likely to live in urban areas than clients who received in-person counseling. Further, analysis of credit report data shows that counselees included in the mortgage survey had a higher average credit score and a higher total loan amount at the time of seeking counseling than counselees for whom we did not obtain mortgage data, but did not have higher incomes.
Keeping in mind these caveats, this section uses the information obtained through the mortgage survey to describe the types of mortgage that counselees had at the time of seeking counseling and interest rates and mortgage amounts at origination and at the time of seeking counseling.
4�3�1 TYPE OF MORTGAGEExhibit 4-8 presents the data collected on loan type. More than three-fourths of the counselees for whom we obtained mortgage data (78 percent) reported having fixed-rate loans at the time of seeking foreclosure counseling. Another 13 percent of counselees had adjustable-rate mortgages (ARMs). Fewer than 1 in 10 counselees had either an interest-only mortgage (8 percent) or some other type of mortgage (1 percent) such as a balloon, hybrid, or step-rate mortgages. Homeowners and counselors may have underreported the true number of hybrid loans—for example, categorizing a 3/27 loan as an ARM rather than a hybrid.
Exhibit 4-8� Study Participants’ Loan Type at Time of Seeking Counseling
78%
8%
13%
1%
Fixed-rate
ARM
Interest-only
Other
ARM = Adjustable-rate Mortgage.
N = 431.
Note: Study data have been weighted on Hispanic origin, race, income, and age to account for sampling and nonresponse on the baseline survey and (as applicable) the follow-up survey, but not for nonresponse in the mortgage characteristics survey.
Source: Mortgage characteristics survey
We examined the credit scores at the time of seeking counseling for counselees with the three main mortgage types—fixed-rate, ARM, and interest-only mortgages. As shown in exhibit 4-9, a wide range in credit scores exist for each mortgage type. The differences between the mean credit scores are statistically significant, however, at the 5-percent level for each pair (fixed-rate compared with ARM, fixed-rate compared with interest-only, and ARM compared with interest-only). Counselees with ARMs had the lowest average credit scores in October 2009—a FICO score of 586. This information
49FORECLOSURE COUNSELING OUTCOME STUDY: FINAL REPORT HOUSING COUNSELING OUTCOME EVALUATION
4. MORTGAGE CHARACTERISTICS, REASONS FOR DELINQUENCY, AND LENDER INTERACTIONS BEFORE SEEKING COUNSELING
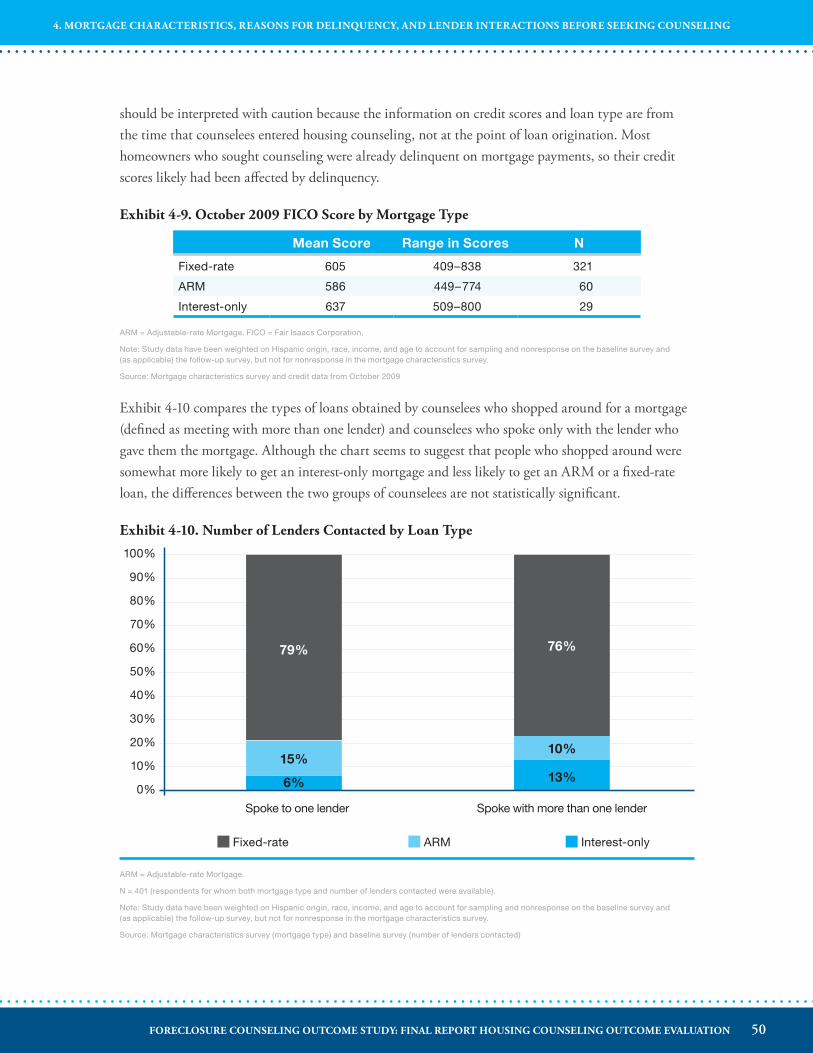
should be interpreted with caution because the information on credit scores and loan type are from the time that counselees entered housing counseling, not at the point of loan origination. Most homeowners who sought counseling were already delinquent on mortgage payments, so their credit scores likely had been affected by delinquency.
Exhibit 4-9� October 2009 FICO Score by Mortgage Type
Mean Score Range in Scores N
Fixed-rate 605 409–838 321
ARM 586 449–774 60
Interest-only 637 509–800 29
ARM = Adjustable-rate Mortgage. FICO = Fair Isaacs Corporation.
Note: Study data have been weighted on Hispanic origin, race, income, and age to account for sampling and nonresponse on the baseline survey and (as applicable) the follow-up survey, but not for nonresponse in the mortgage characteristics survey.
Source: Mortgage characteristics survey and credit data from October 2009
Exhibit 4-10 compares the types of loans obtained by counselees who shopped around for a mortgage (defined as meeting with more than one lender) and counselees who spoke only with the lender who gave them the mortgage. Although the chart seems to suggest that people who shopped around were somewhat more likely to get an interest-only mortgage and less likely to get an ARM or a fixed-rate loan, the differences between the two groups of counselees are not statistically significant.
Exhibit 4-10� Number of Lenders Contacted by Loan Type
ARM = Adjustable-rate Mortgage.
N = 401 (respondents for whom both mortgage type and number of lenders contacted were available).
Note: Study data have been weighted on Hispanic origin, race, income, and age to account for sampling and nonresponse on the baseline survey and (as applicable) the follow-up survey, but not for nonresponse in the mortgage characteristics survey.
Source: Mortgage characteristics survey (mortgage type) and baseline survey (number of lenders contacted)
100%
90%
80%
70%
60%
50%
40%
30%
20%
10%
0% 6% 13%
10%15%
79% 76%
Spoke to one lender Spoke with more than one lender
Fixed-rate ARM Interest-only
50FORECLOSURE COUNSELING OUTCOME STUDY: FINAL REPORT HOUSING COUNSELING OUTCOME EVALUATION
4. MORTGAGE CHARACTERISTICS, REASONS FOR DELINQUENCY, AND LENDER INTERACTIONS BEFORE SEEKING COUNSELING
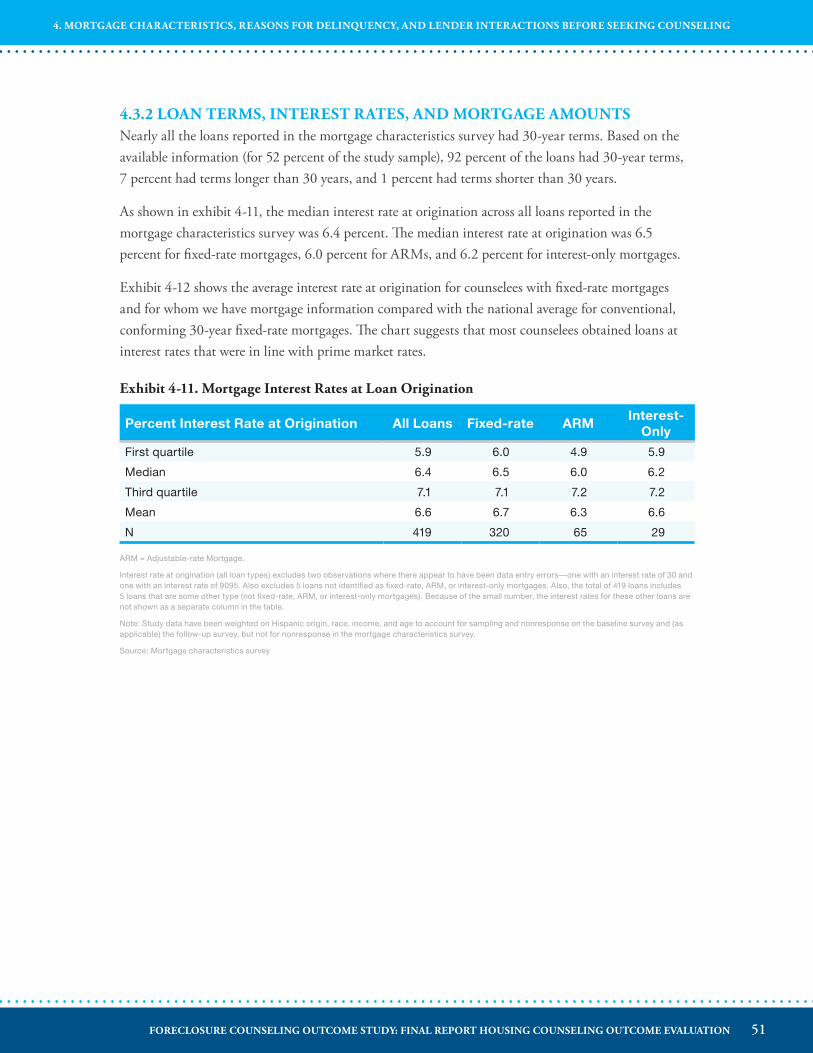
4�3�2 LOAN TERMS, INTEREST RATES, AND MORTGAGE AMOUNTSNearly all the loans reported in the mortgage characteristics survey had 30-year terms. Based on the available information (for 52 percent of the study sample), 92 percent of the loans had 30-year terms, 7 percent had terms longer than 30 years, and 1 percent had terms shorter than 30 years.
As shown in exhibit 4-11, the median interest rate at origination across all loans reported in the mortgage characteristics survey was 6.4 percent. The median interest rate at origination was 6.5 percent for fixed-rate mortgages, 6.0 percent for ARMs, and 6.2 percent for interest-only mortgages.
Exhibit 4-12 shows the average interest rate at origination for counselees with fixed-rate mortgages and for whom we have mortgage information compared with the national average for conventional, conforming 30-year fixed-rate mortgages. The chart suggests that most counselees obtained loans at interest rates that were in line with prime market rates.
Exhibit 4-11� Mortgage Interest Rates at Loan Origination
Percent Interest Rate at Origination All Loans Fixed-rate ARMInterest-
Only
First quartile 5.9 6.0 4.9 5.9
Median 6.4 6.5 6.0 6.2
Third quartile 7.1 7.1 7.2 7.2
Mean 6.6 6.7 6.3 6.6
N 419 320 65 29
ARM = Adjustable-rate Mortgage.
Interest rate at origination (all loan types) excludes two observations where there appear to have been data entry errors—one with an interest rate of 30 and one with an interest rate of 9095. Also excludes 5 loans not identified as fixed-rate, ARM, or interest-only mortgages. Also, the total of 419 loans includes 5 loans that are some other type (not fixed-rate, ARM, or interest-only mortgages). Because of the small number, the interest rates for these other loans are not shown as a separate column in the table.
Note: Study data have been weighted on Hispanic origin, race, income, and age to account for sampling and nonresponse on the baseline survey and (as applicable) the follow-up survey, but not for nonresponse in the mortgage characteristics survey.
Source: Mortgage characteristics survey
51FORECLOSURE COUNSELING OUTCOME STUDY: FINAL REPORT HOUSING COUNSELING OUTCOME EVALUATION
4. MORTGAGE CHARACTERISTICS, REASONS FOR DELINQUENCY, AND LENDER INTERACTIONS BEFORE SEEKING COUNSELING
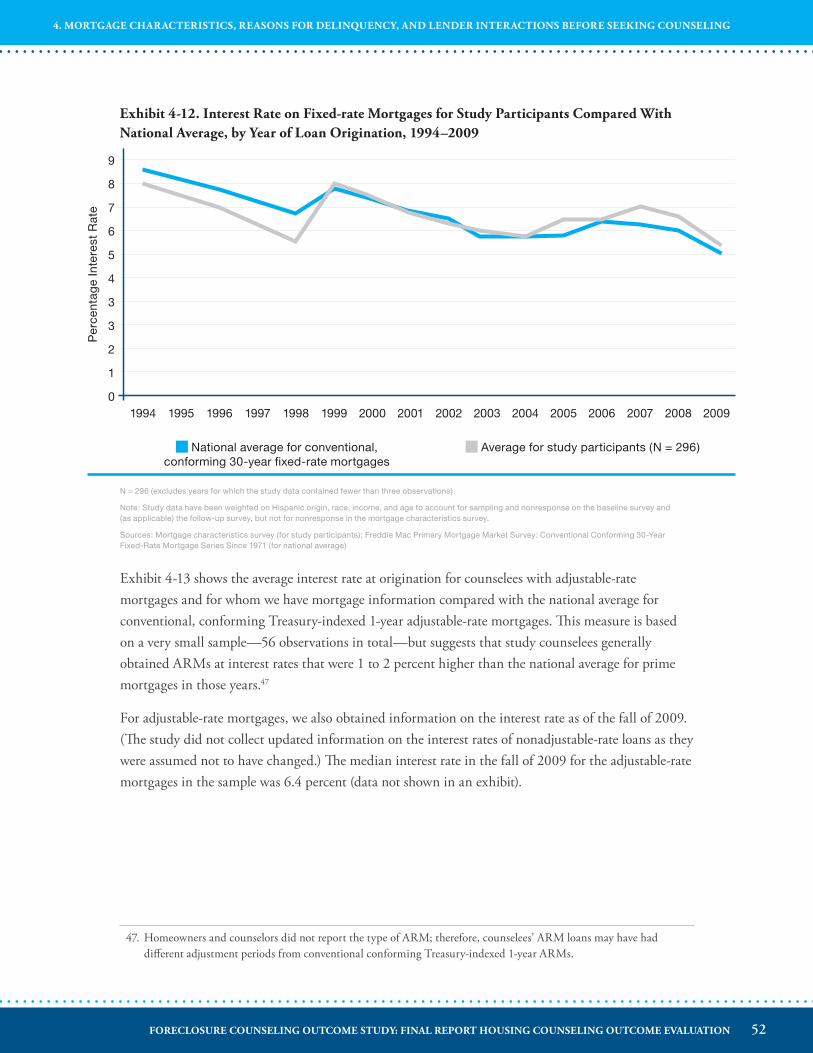
Exhibit 4-12� Interest Rate on Fixed-rate Mortgages for Study Participants Compared With National Average, by Year of Loan Origination, 1994–2009
1994 1995 1996 1997 1998 1999 2000 2001 2002 2003 2004 2005 2006 2007 2008 2009
9
8
7
6
5
4
3
3
2
1
0
National average for conventional, conforming 30-year fixed-rate mortgages
Average for study participants (N = 296)
N = 296 (excludes years for which the study data contained fewer than three observations).
Note: Study data have been weighted on Hispanic origin, race, income, and age to account for sampling and nonresponse on the baseline survey and (as applicable) the follow-up survey, but not for nonresponse in the mortgage characteristics survey.
Sources: Mortgage characteristics survey (for study participants); Freddie Mac Primary Mortgage Market Survey: Conventional Conforming 30-Year Fixed-Rate Mortgage Series Since 1971 (for national average)
Exhibit 4-13 shows the average interest rate at origination for counselees with adjustable-rate mortgages and for whom we have mortgage information compared with the national average for conventional, conforming Treasury-indexed 1-year adjustable-rate mortgages. This measure is based on a very small sample—56 observations in total—but suggests that study counselees generally obtained ARMs at interest rates that were 1 to 2 percent higher than the national average for prime mortgages in those years.47
For adjustable-rate mortgages, we also obtained information on the interest rate as of the fall of 2009. (The study did not collect updated information on the interest rates of nonadjustable-rate loans as they were assumed not to have changed.) The median interest rate in the fall of 2009 for the adjustable-rate mortgages in the sample was 6.4 percent (data not shown in an exhibit).
47. Homeowners and counselors did not report the type of ARM; therefore, counselees’ ARM loans may have had different adjustment periods from conventional conforming Treasury-indexed 1-year ARMs.
Per
cent
age
Inte
rest
Rat
e
52FORECLOSURE COUNSELING OUTCOME STUDY: FINAL REPORT HOUSING COUNSELING OUTCOME EVALUATION
4. MORTGAGE CHARACTERISTICS, REASONS FOR DELINQUENCY, AND LENDER INTERACTIONS BEFORE SEEKING COUNSELING
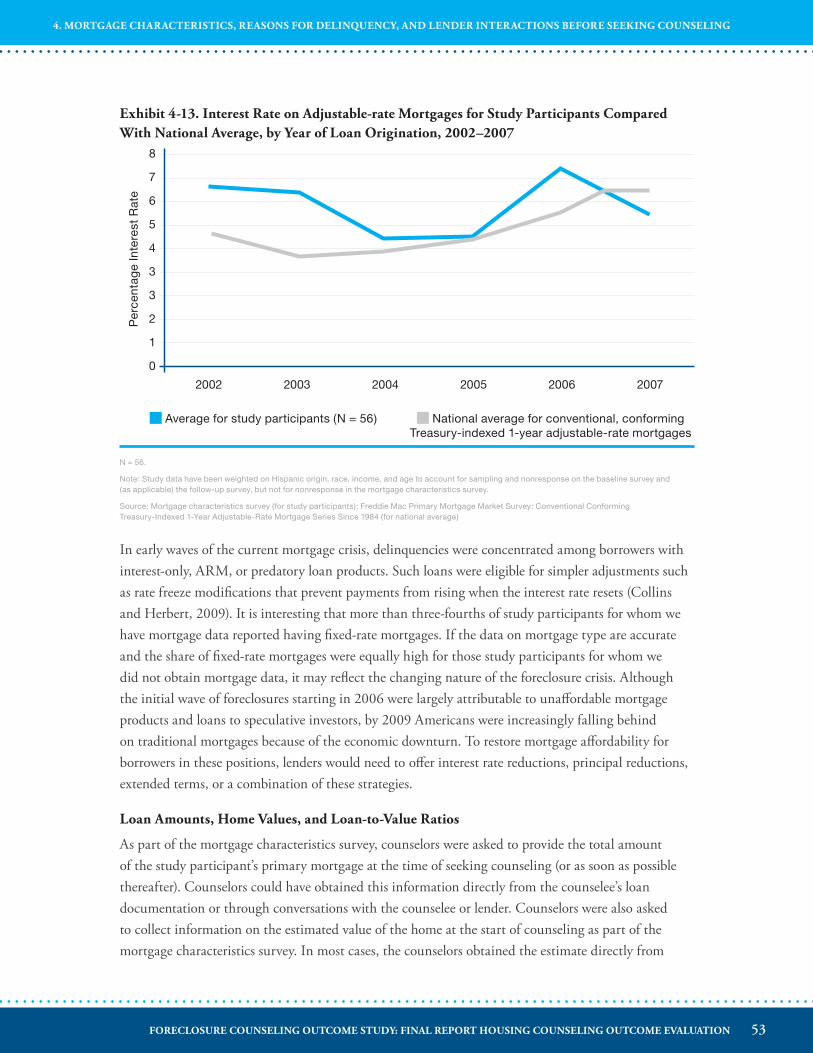
Exhibit 4-13� Interest Rate on Adjustable-rate Mortgages for Study Participants Compared With National Average, by Year of Loan Origination, 2002–2007
2002 2003 2004 2005 2006 2007
8
7
6
5
4
3
3
2
1
0
Average for study participants (N = 56) National average for conventional, conforming Treasury-indexed 1-year adjustable-rate mortgages
Per
cent
age
Inte
rest
Rat
e
N = 56.
Note: Study data have been weighted on Hispanic origin, race, income, and age to account for sampling and nonresponse on the baseline survey and (as applicable) the follow-up survey, but not for nonresponse in the mortgage characteristics survey.
Source: Mortgage characteristics survey (for study participants); Freddie Mac Primary Mortgage Market Survey: Conventional Conforming Treasury-Indexed 1-Year Adjustable-Rate Mortgage Series Since 1984 (for national average)
In early waves of the current mortgage crisis, delinquencies were concentrated among borrowers with interest-only, ARM, or predatory loan products. Such loans were eligible for simpler adjustments such as rate freeze modifications that prevent payments from rising when the interest rate resets (Collins and Herbert, 2009). It is interesting that more than three-fourths of study participants for whom we have mortgage data reported having fixed-rate mortgages. If the data on mortgage type are accurate and the share of fixed-rate mortgages were equally high for those study participants for whom we did not obtain mortgage data, it may reflect the changing nature of the foreclosure crisis. Although the initial wave of foreclosures starting in 2006 were largely attributable to unaffordable mortgage products and loans to speculative investors, by 2009 Americans were increasingly falling behind on traditional mortgages because of the economic downturn. To restore mortgage affordability for borrowers in these positions, lenders would need to offer interest rate reductions, principal reductions, extended terms, or a combination of these strategies.
Loan Amounts, Home Values, and Loan-to-Value Ratios
As part of the mortgage characteristics survey, counselors were asked to provide the total amount of the study participant’s primary mortgage at the time of seeking counseling (or as soon as possible thereafter). Counselors could have obtained this information directly from the counselee’s loan documentation or through conversations with the counselee or lender. Counselors were also asked to collect information on the estimated value of the home at the start of counseling as part of the mortgage characteristics survey. In most cases, the counselors obtained the estimate directly from
53FORECLOSURE COUNSELING OUTCOME STUDY: FINAL REPORT HOUSING COUNSELING OUTCOME EVALUATION
4. MORTGAGE CHARACTERISTICS, REASONS FOR DELINQUENCY, AND LENDER INTERACTIONS BEFORE SEEKING COUNSELING
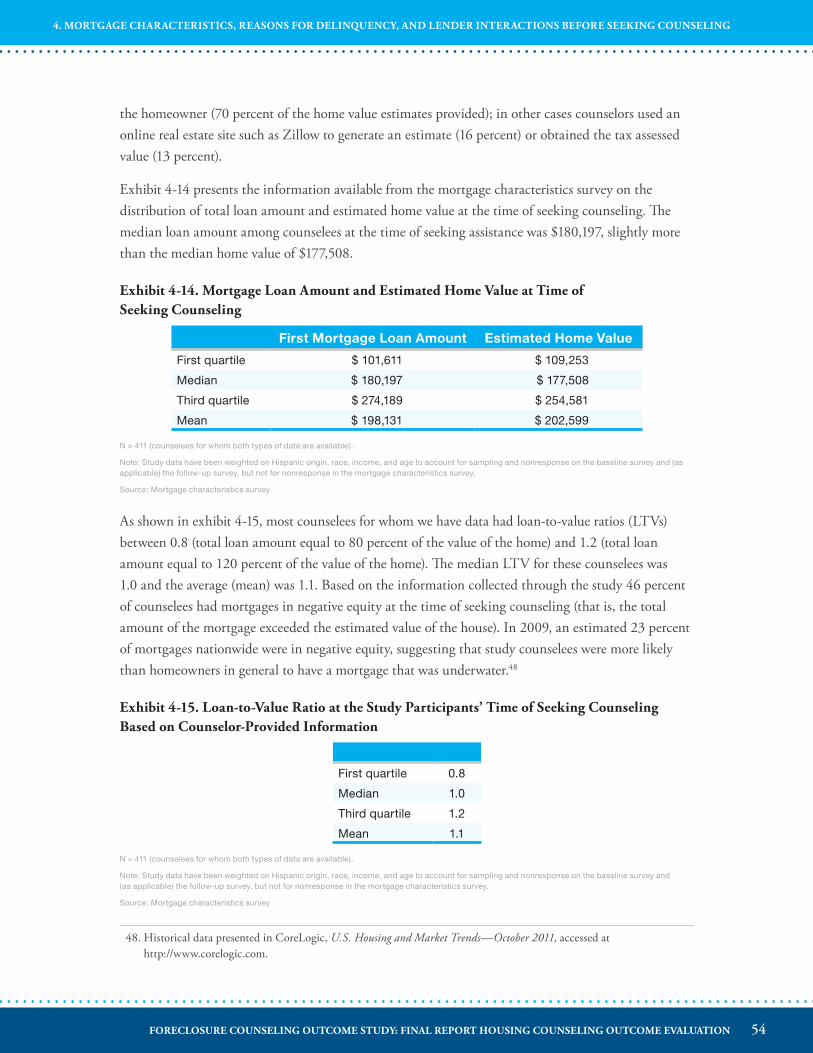
the homeowner (70 percent of the home value estimates provided); in other cases counselors used an online real estate site such as Zillow to generate an estimate (16 percent) or obtained the tax assessed value (13 percent).
Exhibit 4-14 presents the information available from the mortgage characteristics survey on the distribution of total loan amount and estimated home value at the time of seeking counseling. The median loan amount among counselees at the time of seeking assistance was $180,197, slightly more than the median home value of $177,508.
Exhibit 4-14� Mortgage Loan Amount and Estimated Home Value at Time of Seeking Counseling
First Mortgage Loan Amount Estimated Home Value
First quartile $ 101,611 $ 109,253
Median $ 180,197 $ 177,508
Third quartile $ 274,189 $ 254,581
Mean $ 198,131 $ 202,599
N = 411 (counselees for whom both types of data are available).
Note: Study data have been weighted on Hispanic origin, race, income, and age to account for sampling and nonresponse on the baseline survey and (as applicable) the follow-up survey, but not for nonresponse in the mortgage characteristics survey.
Source: Mortgage characteristics survey
As shown in exhibit 4-15, most counselees for whom we have data had loan-to-value ratios (LTVs) between 0.8 (total loan amount equal to 80 percent of the value of the home) and 1.2 (total loan amount equal to 120 percent of the value of the home). The median LTV for these counselees was 1.0 and the average (mean) was 1.1. Based on the information collected through the study 46 percent of counselees had mortgages in negative equity at the time of seeking counseling (that is, the total amount of the mortgage exceeded the estimated value of the house). In 2009, an estimated 23 percent of mortgages nationwide were in negative equity, suggesting that study counselees were more likely than homeowners in general to have a mortgage that was underwater.48
Exhibit 4-15� Loan-to-Value Ratio at the Study Participants’ Time of Seeking Counseling Based on Counselor-Provided Information
First quartile 0.8
Median 1.0
Third quartile 1.2
Mean 1.1
N = 411 (counselees for whom both types of data are available).
Note: Study data have been weighted on Hispanic origin, race, income, and age to account for sampling and nonresponse on the baseline survey and (as applicable) the follow-up survey, but not for nonresponse in the mortgage characteristics survey.
Source: Mortgage characteristics survey
48. Historical data presented in CoreLogic, U.S. Housing and Market Trends—October 2011, accessed at http://www.corelogic.com.
54FORECLOSURE COUNSELING OUTCOME STUDY: FINAL REPORT HOUSING COUNSELING OUTCOME EVALUATION
4. MORTGAGE CHARACTERISTICS, REASONS FOR DELINQUENCY, AND LENDER INTERACTIONS BEFORE SEEKING COUNSELING
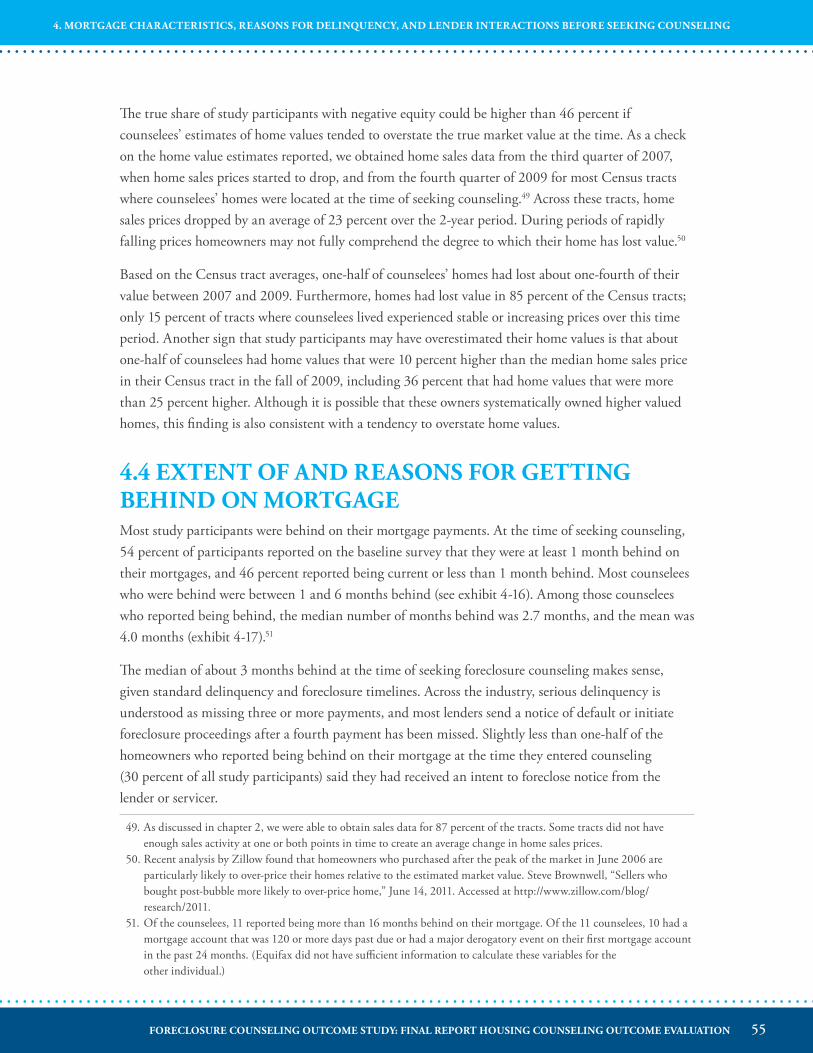
The true share of study participants with negative equity could be higher than 46 percent if counselees’ estimates of home values tended to overstate the true market value at the time. As a check on the home value estimates reported, we obtained home sales data from the third quarter of 2007, when home sales prices started to drop, and from the fourth quarter of 2009 for most Census tracts where counselees’ homes were located at the time of seeking counseling.49 Across these tracts, home sales prices dropped by an average of 23 percent over the 2-year period. During periods of rapidly falling prices homeowners may not fully comprehend the degree to which their home has lost value.50
Based on the Census tract averages, one-half of counselees’ homes had lost about one-fourth of their value between 2007 and 2009. Furthermore, homes had lost value in 85 percent of the Census tracts; only 15 percent of tracts where counselees lived experienced stable or increasing prices over this time period. Another sign that study participants may have overestimated their home values is that about one-half of counselees had home values that were 10 percent higher than the median home sales price in their Census tract in the fall of 2009, including 36 percent that had home values that were more than 25 percent higher. Although it is possible that these owners systematically owned higher valued homes, this finding is also consistent with a tendency to overstate home values.
4�4 EXTENT OF AND REASONS FOR GETTING BEHIND ON MORTGAGEMost study participants were behind on their mortgage payments. At the time of seeking counseling, 54 percent of participants reported on the baseline survey that they were at least 1 month behind on their mortgages, and 46 percent reported being current or less than 1 month behind. Most counselees who were behind were between 1 and 6 months behind (see exhibit 4-16). Among those counselees who reported being behind, the median number of months behind was 2.7 months, and the mean was 4.0 months (exhibit 4-17).51
The median of about 3 months behind at the time of seeking foreclosure counseling makes sense, given standard delinquency and foreclosure timelines. Across the industry, serious delinquency is understood as missing three or more payments, and most lenders send a notice of default or initiate foreclosure proceedings after a fourth payment has been missed. Slightly less than one-half of the homeowners who reported being behind on their mortgage at the time they entered counseling (30 percent of all study participants) said they had received an intent to foreclose notice from the lender or servicer.
49. As discussed in chapter 2, we were able to obtain sales data for 87 percent of the tracts. Some tracts did not have enough sales activity at one or both points in time to create an average change in home sales prices.
50. Recent analysis by Zillow found that homeowners who purchased after the peak of the market in June 2006 are particularly likely to over-price their homes relative to the estimated market value. Steve Brownwell, “Sellers who bought post-bubble more likely to over-price home,” June 14, 2011. Accessed at http://www.zillow.com/blog/research/2011.
51. Of the counselees, 11 reported being more than 16 months behind on their mortgage. Of the 11 counselees, 10 had a mortgage account that was 120 or more days past due or had a major derogatory event on their first mortgage account in the past 24 months. (Equifax did not have sufficient information to calculate these variables for the other individual.)
55FORECLOSURE COUNSELING OUTCOME STUDY: FINAL REPORT HOUSING COUNSELING OUTCOME EVALUATION
4. MORTGAGE CHARACTERISTICS, REASONS FOR DELINQUENCY, AND LENDER INTERACTIONS BEFORE SEEKING COUNSELING
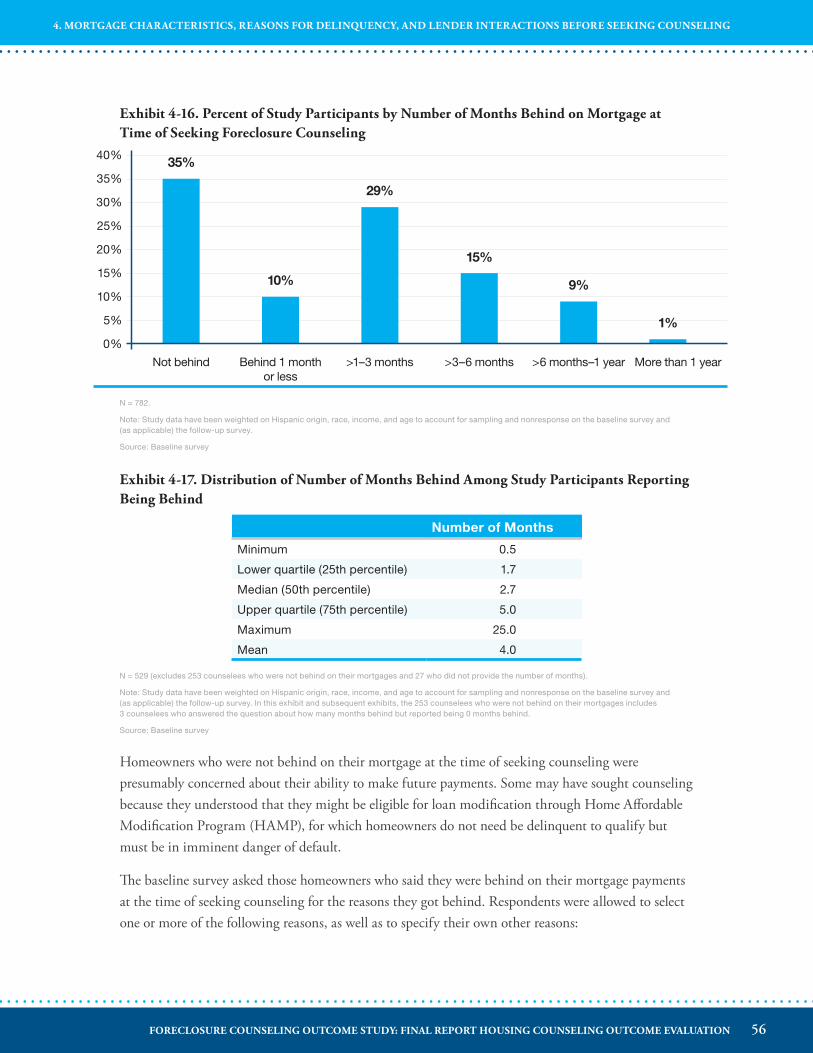
Exhibit 4-16� Percent of Study Participants by Number of Months Behind on Mortgage at Time of Seeking Foreclosure Counseling
Not behind Behind 1 month or less
>1–3 months >3–6 months >6 months–1 year More than 1 year
40%
35%
30%
25%
20%
15%
10%
5%
0%
10%
29%
15%
9%
1%
35%
Exhibit 4-17� Distribution of Number of Months Behind Among Study Participants Reporting Being Behind
Number of Months
Minimum 0.5
Lower quartile (25th percentile) 1.7
Median (50th percentile) 2.7
Upper quartile (75th percentile) 5.0
Maximum 25.0
Mean 4.0
N = 529 (excludes 253 counselees who were not behind on their mortgages and 27 who did not provide the number of months).
Note: Study data have been weighted on Hispanic origin, race, income, and age to account for sampling and nonresponse on the baseline survey and (as applicable) the follow-up survey. In this exhibit and subsequent exhibits, the 253 counselees who were not behind on their mortgages includes 3 counselees who answered the question about how many months behind but reported being 0 months behind.
Source: Baseline survey
Homeowners who were not behind on their mortgage at the time of seeking counseling were presumably concerned about their ability to make future payments. Some may have sought counseling because they understood that they might be eligible for loan modification through Home Affordable Modification Program (HAMP), for which homeowners do not need be delinquent to qualify but must be in imminent danger of default.
The baseline survey asked those homeowners who said they were behind on their mortgage payments at the time of seeking counseling for the reasons they got behind. Respondents were allowed to select one or more of the following reasons, as well as to specify their own other reasons:
N = 782.
Note: Study data have been weighted on Hispanic origin, race, income, and age to account for sampling and nonresponse on the baseline survey and (as applicable) the follow-up survey.
Source: Baseline survey
56FORECLOSURE COUNSELING OUTCOME STUDY: FINAL REPORT HOUSING COUNSELING OUTCOME EVALUATION
4. MORTGAGE CHARACTERISTICS, REASONS FOR DELINQUENCY, AND LENDER INTERACTIONS BEFORE SEEKING COUNSELING
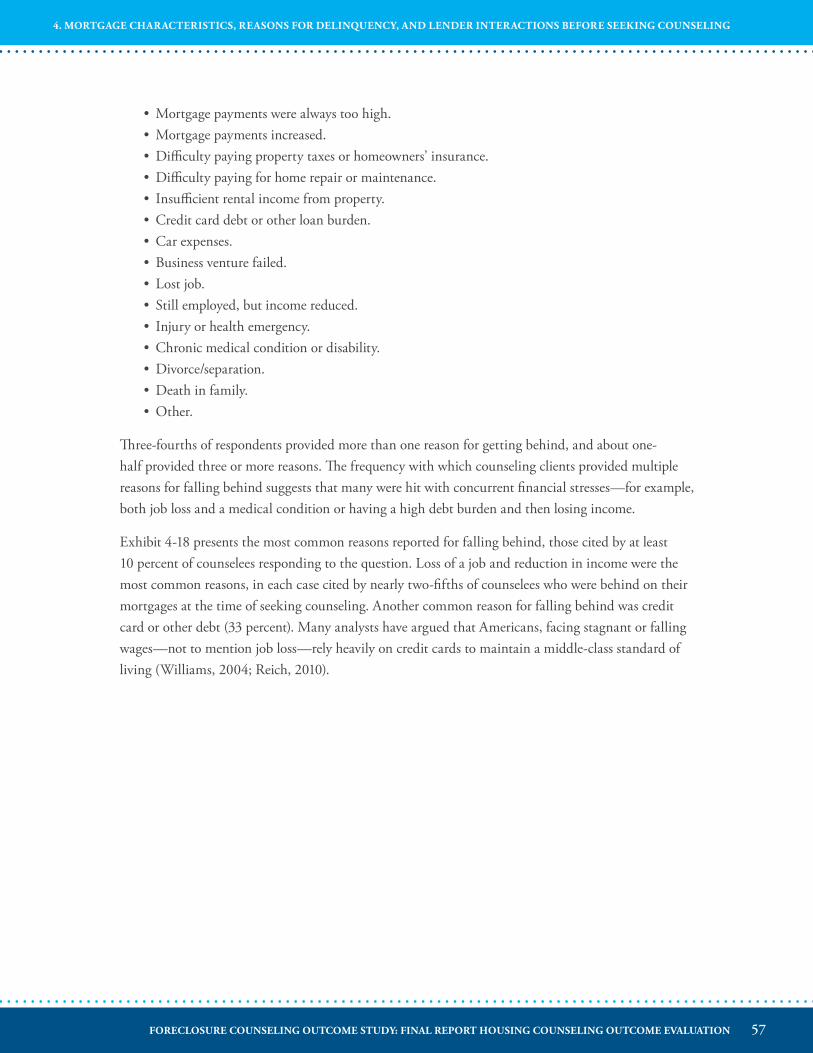
•Mortgage payments were always too high.•Mortgage payments increased.•Difficulty paying property taxes or homeowners’ insurance.•Difficulty paying for home repair or maintenance.• Insufficient rental income from property.•Credit card debt or other loan burden.•Car expenses.• Business venture failed.• Lost job.• Still employed, but income reduced.• Injury or health emergency.•Chronic medical condition or disability.•Divorce/separation.•Death in family.•Other.
Three-fourths of respondents provided more than one reason for getting behind, and about one-half provided three or more reasons. The frequency with which counseling clients provided multiple reasons for falling behind suggests that many were hit with concurrent financial stresses—for example, both job loss and a medical condition or having a high debt burden and then losing income.
Exhibit 4-18 presents the most common reasons reported for falling behind, those cited by at least 10 percent of counselees responding to the question. Loss of a job and reduction in income were the most common reasons, in each case cited by nearly two-fifths of counselees who were behind on their mortgages at the time of seeking counseling. Another common reason for falling behind was credit card or other debt (33 percent). Many analysts have argued that Americans, facing stagnant or falling wages—not to mention job loss—rely heavily on credit cards to maintain a middle-class standard of living (Williams, 2004; Reich, 2010).
57FORECLOSURE COUNSELING OUTCOME STUDY: FINAL REPORT HOUSING COUNSELING OUTCOME EVALUATION
4. MORTGAGE CHARACTERISTICS, REASONS FOR DELINQUENCY, AND LENDER INTERACTIONS BEFORE SEEKING COUNSELING
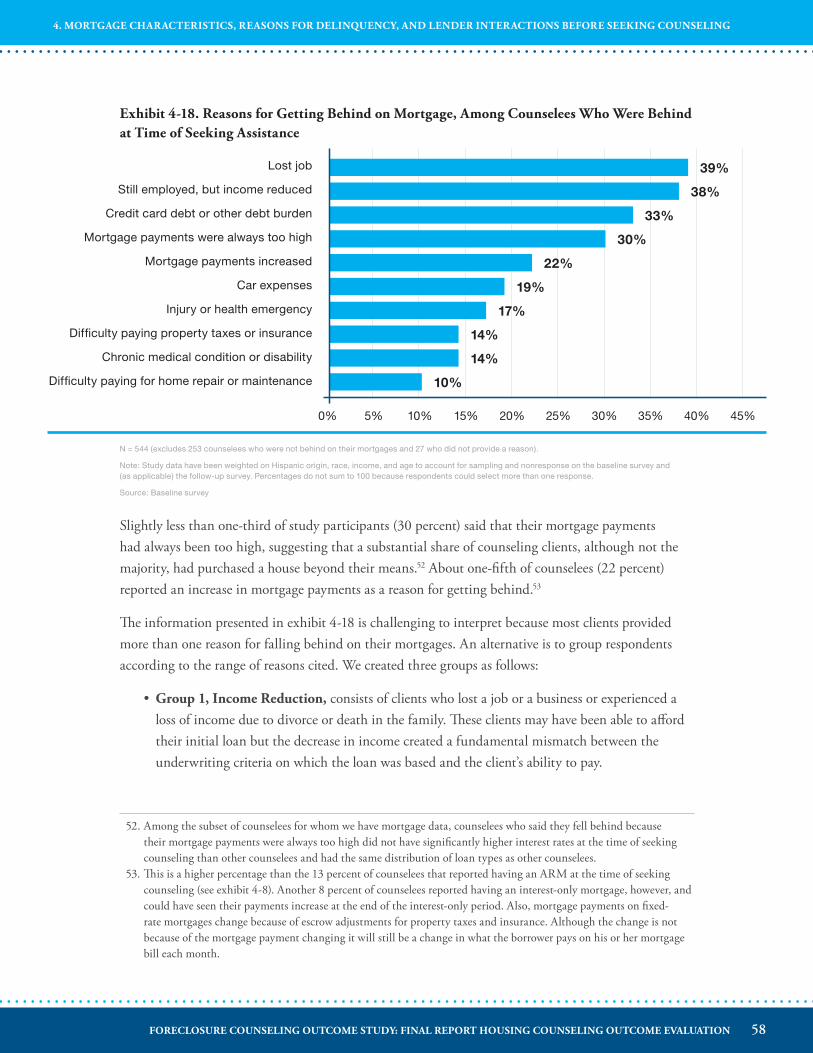
Exhibit 4-18� Reasons for Getting Behind on Mortgage, Among Counselees Who Were Behind at Time of Seeking Assistance
0% 5% 10% 15% 20% 25% 30% 35% 40% 45%
Lost job
Still employed, but income reduced
Credit card debt or other debt burden
Mortgage payments were always too high
Mortgage payments increased
Car expenses
Injury or health emergency
Difficulty paying property taxes or insurance
Chronic medical condition or disability
Difficulty paying for home repair or maintenance 10%
17%
30%
14%
19%
33%
14%
22%
38%
39%
Slightly less than one-third of study participants (30 percent) said that their mortgage payments had always been too high, suggesting that a substantial share of counseling clients, although not the majority, had purchased a house beyond their means.52 About one-fifth of counselees (22 percent) reported an increase in mortgage payments as a reason for getting behind.53
The information presented in exhibit 4-18 is challenging to interpret because most clients provided more than one reason for falling behind on their mortgages. An alternative is to group respondents according to the range of reasons cited. We created three groups as follows:
•Group 1, Income Reduction, consists of clients who lost a job or a business or experienced a loss of income due to divorce or death in the family. These clients may have been able to afford their initial loan but the decrease in income created a fundamental mismatch between the underwriting criteria on which the loan was based and the client’s ability to pay.
52. Among the subset of counselees for whom we have mortgage data, counselees who said they fell behind because their mortgage payments were always too high did not have significantly higher interest rates at the time of seeking counseling than other counselees and had the same distribution of loan types as other counselees.
53. This is a higher percentage than the 13 percent of counselees that reported having an ARM at the time of seeking counseling (see exhibit 4-8). Another 8 percent of counselees reported having an interest-only mortgage, however, and could have seen their payments increase at the end of the interest-only period. Also, mortgage payments on fixed-rate mortgages change because of escrow adjustments for property taxes and insurance. Although the change is not because of the mortgage payment changing it will still be a change in what the borrower pays on his or her mortgage bill each month.
N = 544 (excludes 253 counselees who were not behind on their mortgages and 27 who did not provide a reason).
Note: Study data have been weighted on Hispanic origin, race, income, and age to account for sampling and nonresponse on the baseline survey and (as applicable) the follow-up survey. Percentages do not sum to 100 because respondents could select more than one response.
Source: Baseline survey
58FORECLOSURE COUNSELING OUTCOME STUDY: FINAL REPORT HOUSING COUNSELING OUTCOME EVALUATION
4. MORTGAGE CHARACTERISTICS, REASONS FOR DELINQUENCY, AND LENDER INTERACTIONS BEFORE SEEKING COUNSELING
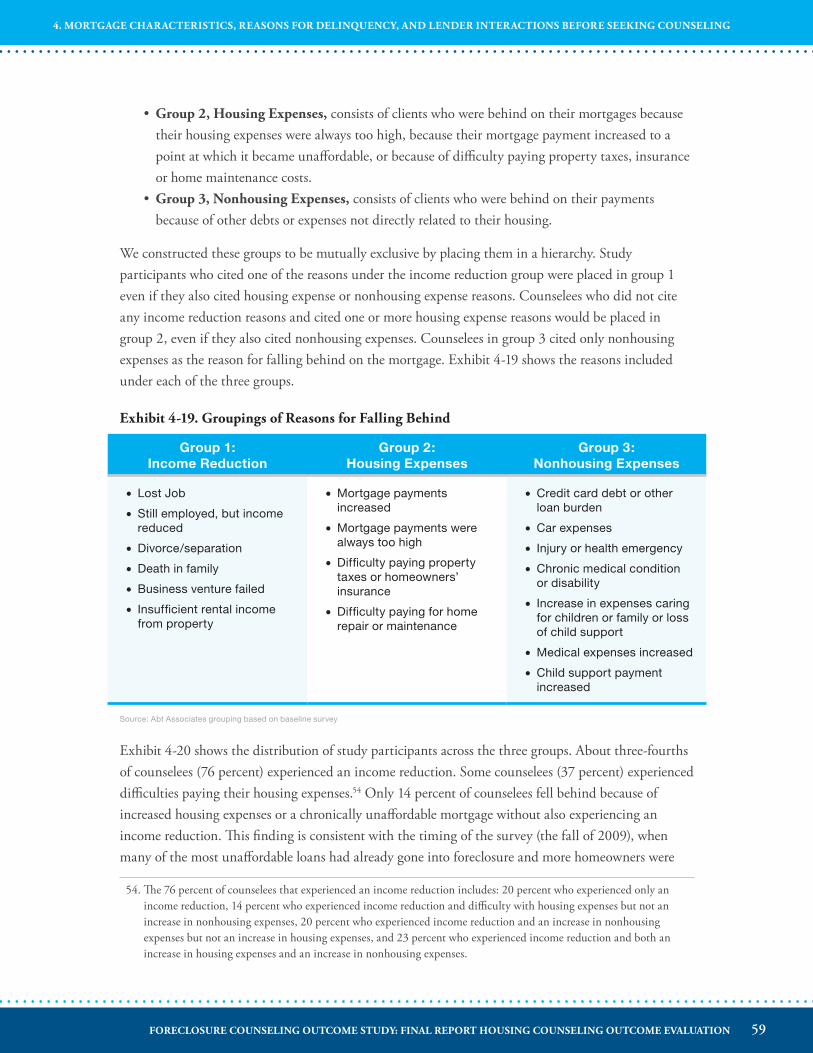
• Group 2, Housing Expenses, consists of clients who were behind on their mortgages because their housing expenses were always too high, because their mortgage payment increased to a point at which it became unaffordable, or because of difficulty paying property taxes, insurance or home maintenance costs.
•Group 3, Nonhousing Expenses, consists of clients who were behind on their payments because of other debts or expenses not directly related to their housing.
We constructed these groups to be mutually exclusive by placing them in a hierarchy. Study participants who cited one of the reasons under the income reduction group were placed in group 1 even if they also cited housing expense or nonhousing expense reasons. Counselees who did not cite any income reduction reasons and cited one or more housing expense reasons would be placed in group 2, even if they also cited nonhousing expenses. Counselees in group 3 cited only nonhousing expenses as the reason for falling behind on the mortgage. Exhibit 4-19 shows the reasons included under each of the three groups.
Exhibit 4-19� Groupings of Reasons for Falling Behind
Group 1: Income Reduction
Group 2: Housing Expenses
Group 3: Nonhousing Expenses
• Lost Job
•Still employed, but income reduced
•Divorce/separation
•Death in family
•Business venture failed
• Insufficient rental income from property
•Mortgage payments increased
•Mortgage payments were always too high
•Difficulty paying property taxes or homeowners’ insurance
•Difficulty paying for home repair or maintenance
•Credit card debt or other loan burden
•Car expenses
• Injury or health emergency
•Chronic medical condition or disability
• Increase in expenses caring for children or family or loss of child support
•Medical expenses increased
•Child support payment increased
Source: Abt Associates grouping based on baseline survey
Exhibit 4-20 shows the distribution of study participants across the three groups. About three-fourths of counselees (76 percent) experienced an income reduction. Some counselees (37 percent) experienced difficulties paying their housing expenses.54 Only 14 percent of counselees fell behind because of increased housing expenses or a chronically unaffordable mortgage without also experiencing an income reduction. This finding is consistent with the timing of the survey (the fall of 2009), when many of the most unaffordable loans had already gone into foreclosure and more homeowners were
54. The 76 percent of counselees that experienced an income reduction includes: 20 percent who experienced only an income reduction, 14 percent who experienced income reduction and difficulty with housing expenses but not an increase in nonhousing expenses, 20 percent who experienced income reduction and an increase in nonhousing expenses but not an increase in housing expenses, and 23 percent who experienced income reduction and both an increase in housing expenses and an increase in nonhousing expenses.
59FORECLOSURE COUNSELING OUTCOME STUDY: FINAL REPORT HOUSING COUNSELING OUTCOME EVALUATION
4. MORTGAGE CHARACTERISTICS, REASONS FOR DELINQUENCY, AND LENDER INTERACTIONS BEFORE SEEKING COUNSELING
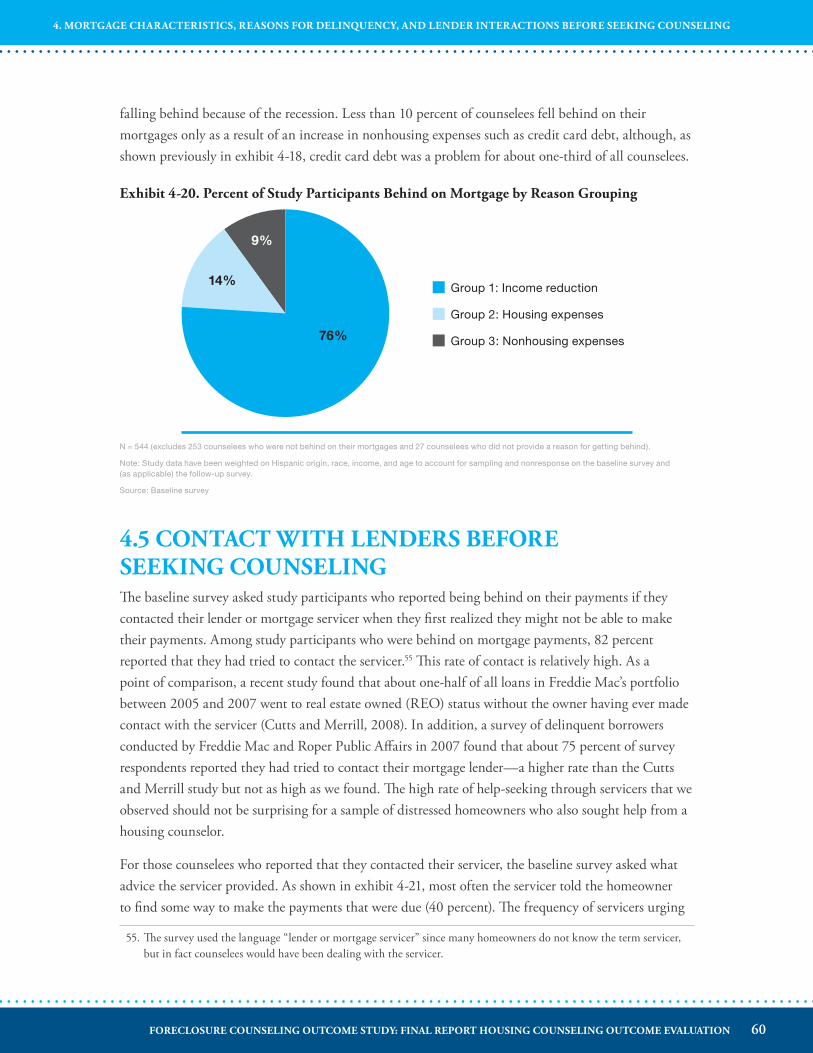
falling behind because of the recession. Less than 10 percent of counselees fell behind on their mortgages only as a result of an increase in nonhousing expenses such as credit card debt, although, as shown previously in exhibit 4-18, credit card debt was a problem for about one-third of all counselees.
Exhibit 4-20� Percent of Study Participants Behind on Mortgage by Reason Grouping
4�5 CONTACT WITH LENDERS BEFORE SEEKING COUNSELINGThe baseline survey asked study participants who reported being behind on their payments if they contacted their lender or mortgage servicer when they first realized they might not be able to make their payments. Among study participants who were behind on mortgage payments, 82 percent reported that they had tried to contact the servicer.55 This rate of contact is relatively high. As a point of comparison, a recent study found that about one-half of all loans in Freddie Mac’s portfolio between 2005 and 2007 went to real estate owned (REO) status without the owner having ever made contact with the servicer (Cutts and Merrill, 2008). In addition, a survey of delinquent borrowers conducted by Freddie Mac and Roper Public Affairs in 2007 found that about 75 percent of survey respondents reported they had tried to contact their mortgage lender—a higher rate than the Cutts and Merrill study but not as high as we found. The high rate of help-seeking through servicers that we observed should not be surprising for a sample of distressed homeowners who also sought help from a housing counselor.
For those counselees who reported that they contacted their servicer, the baseline survey asked what advice the servicer provided. As shown in exhibit 4-21, most often the servicer told the homeowner to find some way to make the payments that were due (40 percent). The frequency of servicers urging
55. The survey used the language “lender or mortgage servicer” since many homeowners do not know the term servicer, but in fact counselees would have been dealing with the servicer.
76%
14%
9%
Group 1: Income reduction
Group 2: Housing expenses
Group 3: Nonhousing expenses
N = 544 (excludes 253 counselees who were not behind on their mortgages and 27 counselees who did not provide a reason for getting behind).
Note: Study data have been weighted on Hispanic origin, race, income, and age to account for sampling and nonresponse on the baseline survey and (as applicable) the follow-up survey.
Source: Baseline survey
60FORECLOSURE COUNSELING OUTCOME STUDY: FINAL REPORT HOUSING COUNSELING OUTCOME EVALUATION
4. MORTGAGE CHARACTERISTICS, REASONS FOR DELINQUENCY, AND LENDER INTERACTIONS BEFORE SEEKING COUNSELING
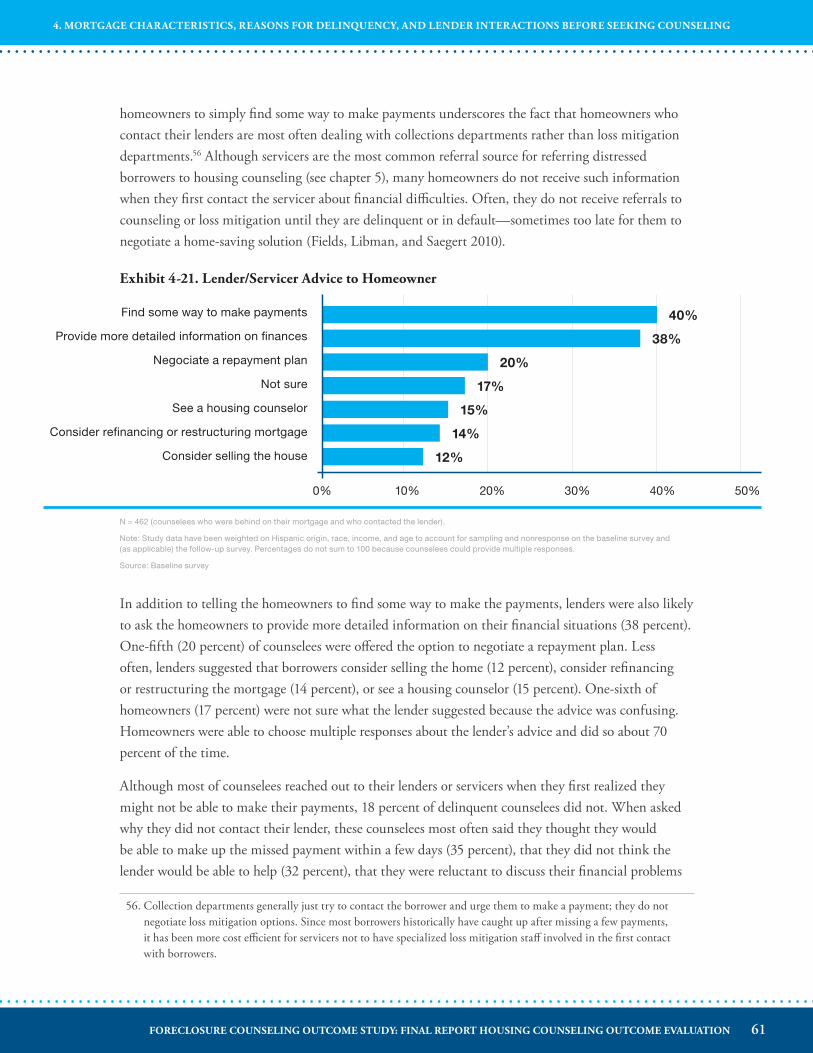
homeowners to simply find some way to make payments underscores the fact that homeowners who contact their lenders are most often dealing with collections departments rather than loss mitigation departments.56 Although servicers are the most common referral source for referring distressed borrowers to housing counseling (see chapter 5), many homeowners do not receive such information when they first contact the servicer about financial difficulties. Often, they do not receive referrals to counseling or loss mitigation until they are delinquent or in default—sometimes too late for them to negotiate a home-saving solution (Fields, Libman, and Saegert 2010).
Exhibit 4-21� Lender/Servicer Advice to Homeowner
In addition to telling the homeowners to find some way to make the payments, lenders were also likely to ask the homeowners to provide more detailed information on their financial situations (38 percent). One-fifth (20 percent) of counselees were offered the option to negotiate a repayment plan. Less often, lenders suggested that borrowers consider selling the home (12 percent), consider refinancing or restructuring the mortgage (14 percent), or see a housing counselor (15 percent). One-sixth of homeowners (17 percent) were not sure what the lender suggested because the advice was confusing. Homeowners were able to choose multiple responses about the lender’s advice and did so about 70 percent of the time.
Although most of counselees reached out to their lenders or servicers when they first realized they might not be able to make their payments, 18 percent of delinquent counselees did not. When asked why they did not contact their lender, these counselees most often said they thought they would be able to make up the missed payment within a few days (35 percent), that they did not think the lender would be able to help (32 percent), that they were reluctant to discuss their financial problems
56. Collection departments generally just try to contact the borrower and urge them to make a payment; they do not negotiate loss mitigation options. Since most borrowers historically have caught up after missing a few payments, it has been more cost efficient for servicers not to have specialized loss mitigation staff involved in the first contact with borrowers.
Find some way to make payments
Provide more detailed information on finances
Negociate a repayment plan
Not sure
See a housing counselor
Consider refinancing or restructuring mortgage
Consider selling the house 12%
14%
15%
17%
20%
38%
40%
0% 10% 20% 30% 40% 50%
N = 462 (counselees who were behind on their mortgage and who contacted the lender).
Note: Study data have been weighted on Hispanic origin, race, income, and age to account for sampling and nonresponse on the baseline survey and (as applicable) the follow-up survey. Percentages do not sum to 100 because counselees could provide multiple responses.
Source: Baseline survey
61FORECLOSURE COUNSELING OUTCOME STUDY: FINAL REPORT HOUSING COUNSELING OUTCOME EVALUATION
4. MORTGAGE CHARACTERISTICS, REASONS FOR DELINQUENCY, AND LENDER INTERACTIONS BEFORE SEEKING COUNSELING
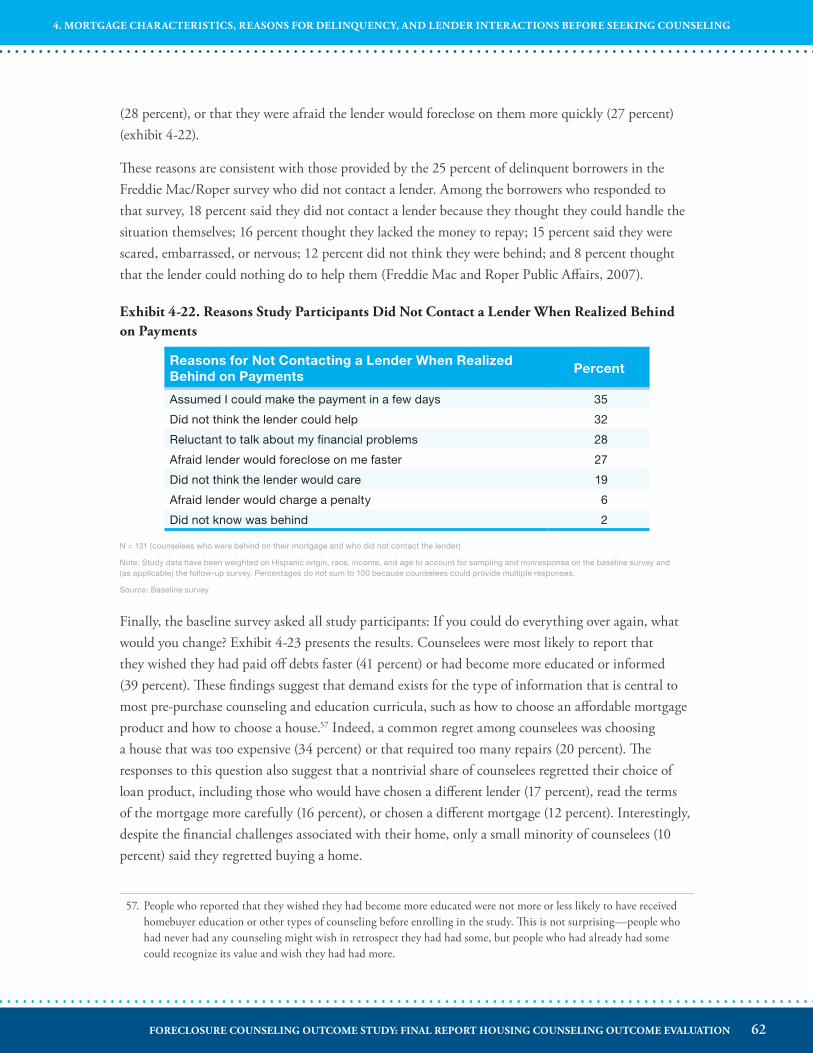
(28 percent), or that they were afraid the lender would foreclose on them more quickly (27 percent) (exhibit 4-22).
These reasons are consistent with those provided by the 25 percent of delinquent borrowers in the Freddie Mac/Roper survey who did not contact a lender. Among the borrowers who responded to that survey, 18 percent said they did not contact a lender because they thought they could handle the situation themselves; 16 percent thought they lacked the money to repay; 15 percent said they were scared, embarrassed, or nervous; 12 percent did not think they were behind; and 8 percent thought that the lender could nothing do to help them (Freddie Mac and Roper Public Affairs, 2007).
Exhibit 4-22� Reasons Study Participants Did Not Contact a Lender When Realized Behind on Payments
Reasons for Not Contacting a Lender When Realized Behind on Payments
Percent
Assumed I could make the payment in a few days 35
Did not think the lender could help 32
Reluctant to talk about my financial problems 28
Afraid lender would foreclose on me faster 27
Did not think the lender would care 19
Afraid lender would charge a penalty 6
Did not know was behind 2
N = 131 (counselees who were behind on their mortgage and who did not contact the lender).
Note: Study data have been weighted on Hispanic origin, race, income, and age to account for sampling and nonresponse on the baseline survey and (as applicable) the follow-up survey. Percentages do not sum to 100 because counselees could provide multiple responses.
Source: Baseline survey
Finally, the baseline survey asked all study participants: If you could do everything over again, what would you change? Exhibit 4-23 presents the results. Counselees were most likely to report that they wished they had paid off debts faster (41 percent) or had become more educated or informed (39 percent). These findings suggest that demand exists for the type of information that is central to most pre-purchase counseling and education curricula, such as how to choose an affordable mortgage product and how to choose a house.57 Indeed, a common regret among counselees was choosing a house that was too expensive (34 percent) or that required too many repairs (20 percent). The responses to this question also suggest that a nontrivial share of counselees regretted their choice of loan product, including those who would have chosen a different lender (17 percent), read the terms of the mortgage more carefully (16 percent), or chosen a different mortgage (12 percent). Interestingly, despite the financial challenges associated with their home, only a small minority of counselees (10 percent) said they regretted buying a home.
57. People who reported that they wished they had become more educated were not more or less likely to have received homebuyer education or other types of counseling before enrolling in the study. This is not surprising—people who had never had any counseling might wish in retrospect they had had some, but people who had already had some could recognize its value and wish they had had more.
62FORECLOSURE COUNSELING OUTCOME STUDY: FINAL REPORT HOUSING COUNSELING OUTCOME EVALUATION
4. MORTGAGE CHARACTERISTICS, REASONS FOR DELINQUENCY, AND LENDER INTERACTIONS BEFORE SEEKING COUNSELING
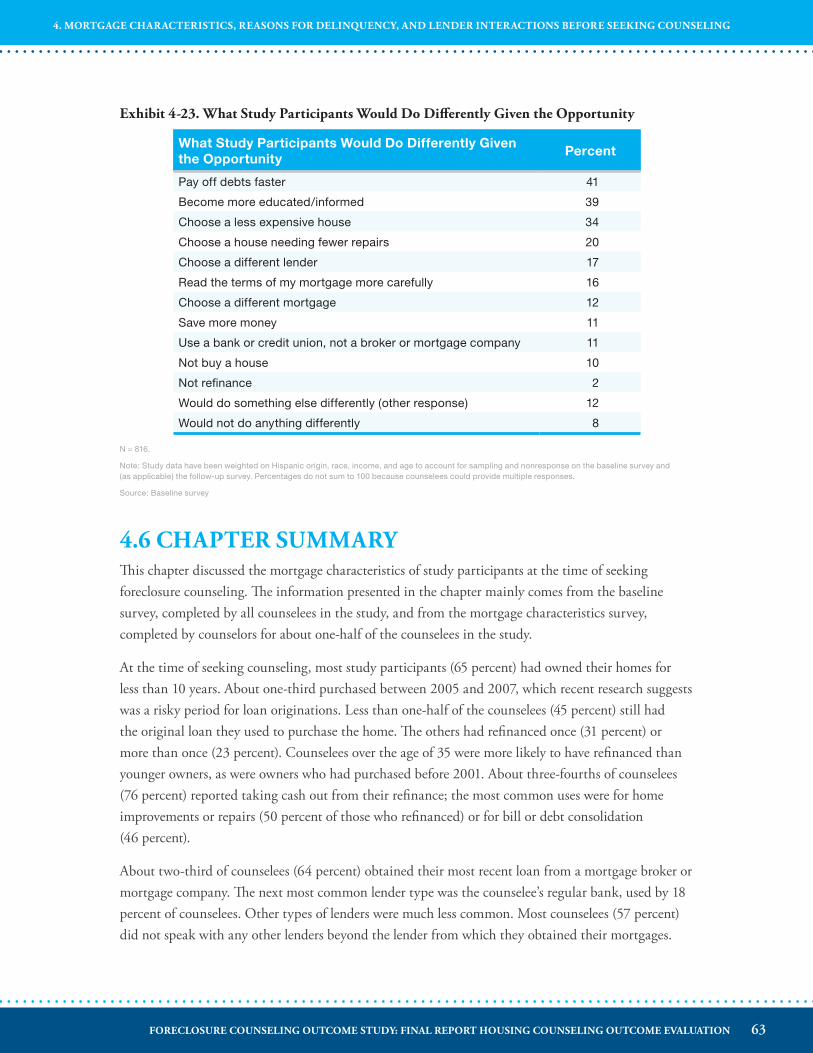
Exhibit 4-23� What Study Participants Would Do Differently Given the Opportunity
What Study Participants Would Do Differently Given the Opportunity
Percent
Pay off debts faster 41
Become more educated/informed 39
Choose a less expensive house 34
Choose a house needing fewer repairs 20
Choose a different lender 17
Read the terms of my mortgage more carefully 16
Choose a different mortgage 12
Save more money 11
Use a bank or credit union, not a broker or mortgage company 11
Not buy a house 10
Not refinance 2
Would do something else differently (other response) 12
Would not do anything differently 8
N = 816.
Note: Study data have been weighted on Hispanic origin, race, income, and age to account for sampling and nonresponse on the baseline survey and (as applicable) the follow-up survey. Percentages do not sum to 100 because counselees could provide multiple responses.
Source: Baseline survey
4�6 CHAPTER SUMMARYThis chapter discussed the mortgage characteristics of study participants at the time of seeking foreclosure counseling. The information presented in the chapter mainly comes from the baseline survey, completed by all counselees in the study, and from the mortgage characteristics survey, completed by counselors for about one-half of the counselees in the study.
At the time of seeking counseling, most study participants (65 percent) had owned their homes for less than 10 years. About one-third purchased between 2005 and 2007, which recent research suggests was a risky period for loan originations. Less than one-half of the counselees (45 percent) still had the original loan they used to purchase the home. The others had refinanced once (31 percent) or more than once (23 percent). Counselees over the age of 35 were more likely to have refinanced than younger owners, as were owners who had purchased before 2001. About three-fourths of counselees (76 percent) reported taking cash out from their refinance; the most common uses were for home improvements or repairs (50 percent of those who refinanced) or for bill or debt consolidation (46 percent).
About two-third of counselees (64 percent) obtained their most recent loan from a mortgage broker or mortgage company. The next most common lender type was the counselee’s regular bank, used by 18 percent of counselees. Other types of lenders were much less common. Most counselees (57 percent) did not speak with any other lenders beyond the lender from which they obtained their mortgages.
63FORECLOSURE COUNSELING OUTCOME STUDY: FINAL REPORT HOUSING COUNSELING OUTCOME EVALUATION
4. MORTGAGE CHARACTERISTICS, REASONS FOR DELINQUENCY, AND LENDER INTERACTIONS BEFORE SEEKING COUNSELING
Most counselees obtained loans from mortgage brokers or mortgage companies, regardless of whether they shopped around.
We obtained mortgage data for 52 percent of the study participants. Of these participants, 78 percent had fixed-rate loans at the time of seeking foreclosure counseling, 13 percent of counselees had ARMs, and 8 percent had interest-only mortgages. The high share of fixed-rate mortgages among study participants for whom we obtained mortgage data could reflect the changing nature of the foreclosure crisis. Although the initial wave of foreclosures starting in 2007 were largely attributable to unaffordable mortgage products and loans to speculative investors, by 2009 Americans increasingly fell behind on traditional mortgages because of the economic downturn.
Nearly all the loans reported in the mortgage characteristics survey had 30-year terms. Most counselees with fixed-rate mortgages obtained loans at interest rates that were in line with prime market rates. Although the sample size is very small, counselees with ARMs appear generally to have obtained ARMs at interest rates that were higher than the national average for prime mortgages in those years.
Of the counselees for whom we obtained mortgage data, 46 percent had mortgages in negative equity at the time of seeking counseling (that is, the total amount of the mortgage exceeded the estimated value of the house). This share is higher than the estimated 23 percent of mortgages nationwide that were in negative equity in 2009, suggesting that study participants were more likely than homeowners in general to have a mortgage underwater.
More than one-half of all counselees were a month or more behind on their mortgage payments at the time of seeking counseling, but 46 percent were less than a month behind or not behind at all, suggesting that they were proactively reaching out for help. Most counselees who were behind were between 1 and 6 months behind. About three-fourths of counselees had experienced an income reduction that caused them to get behind. Some of these counselees also experienced an increase in housing expenses or said that they had never been able to afford their mortgage payments. Only a modest share of counselees (14 percent) fell behind because of increased payments or a chronically unaffordable mortgage without also experiencing an income reduction. Furthermore, less than 10 percent of clients fell behind on their mortgages only because of an increase in nonhousing expenses such as credit card debt, although about one-third reported credit card debt as a factor in their mortgage delinquency.
Of delinquent counselees in the study, 82 percent had tried to contact their servicer before seeking counseling. This rate of servicer contact is high and is further evidence that the people who seek counseling may be more proactive than other delinquent homeowners. According to study participants, most often servicers told them simply to “find some way to make payments” (40 percent). Servicers were also likely to ask the homeowners to provide more detailed information on their financial situations (38 percent). One-fifth (20 percent) of counselees were offered the option to negotiate a repayment plan. Less often, servicers suggested that study participants consider selling the
64FORECLOSURE COUNSELING OUTCOME STUDY: FINAL REPORT HOUSING COUNSELING OUTCOME EVALUATION
4. MORTGAGE CHARACTERISTICS, REASONS FOR DELINQUENCY, AND LENDER INTERACTIONS BEFORE SEEKING COUNSELING

home (12 percent), consider refinancing or restructuring the mortgage (14 percent), or see a housing counselor (15 percent).
A minority of delinquent counselees in the study (18 percent) did not contact their servicer or lender before seeking counseling. When asked why, they most often said they thought they would be able to make up the missed payment within a few days (35 percent), that they did not think the lender would be able to help (32 percent), that they were reluctant to discuss their financial problems (28 percent), or that they were afraid the lender would foreclose on them more quickly (27 percent).
When asked what they would do differently, most counselees were most likely to report that they wished they had paid off debts faster (41 percent) or had become more educated or informed (39 percent), suggesting that demand for the type of information exists—such as how to choose an affordable mortgage product and how to choose a house—that is a staple of most pre-purchase counseling and education curricula.
65FORECLOSURE COUNSELING OUTCOME STUDY: FINAL REPORT HOUSING COUNSELING OUTCOME EVALUATION
4. MORTGAGE CHARACTERISTICS, REASONS FOR DELINQUENCY, AND LENDER INTERACTIONS BEFORE SEEKING COUNSELING
5� COUNSELING SERVICESThis chapter describes in detail the counseling and education services that homeowners received in the 6 months after enrolling in the study. The chapter begins by presenting information collected through the baseline survey about why the study participants were seeking counseling, how they heard about their counseling agencies, and what housing or financial literacy counseling they had received in the past.
Next, the chapter presents information on counselors’ demographics and professional backgrounds, as self-reported by 132 of the 145 counselors who provided services to foreclosure mitigation clients in this study. This information gives an updated view of the backgrounds of housing counselors since the industry’s recent tremendous growth.
The chapter then describes the counseling services that clients received. This information was collected through the service tracking survey, available for 792 of the 824 clients (96 percent). The service tracking survey provides information on the format of counseling (group education or individual counseling), the mode of counseling (in person or over the telephone), the topics covered in counseling sessions, and the total minutes (or hours) of counseling services that study participants received. We compare the duration of services for study participants counseled in person with those who were counseled over the telephone. Finally, the chapter concludes with a discussion of counselee satisfaction with the housing counseling they received.
5�1 ENTRY INTO HOUSING COUNSELINGWhen asked why they were seeking housing counseling, four-fifths of the homeowners in the study (79 percent) reported that they wanted to lower their mortgage payments, as shown in exhibit 5-1. This trend indicates that study participants were aware that housing counseling could help them obtain lower payments. They may also have been aware of the Home Affordable Modification Program (HAMP).58 Most study participants also said they wanted to avoid foreclosure (68 percent) or bring their mortgage current (52 percent). Nearly one-half of all study participants said they wanted help negotiating with their lenders (44 percent). Although most homeowners in the study had been proactive in contacting their lenders before seeking counseling (as discussed in chapter 4), the fact that they were looking for additional help negotiating with the lender suggests that they had not been successful at getting a satisfactory resolution on their own.
58. For qualifying homeowners delinquent or in imminent danger of default but with some ability to pay a mortgage, HAMP offers the possibility of a mortgage modification that lowers monthly mortgage payments to no more than 31 percent of gross monthly income.
66FORECLOSURE COUNSELING OUTCOME STUDY: FINAL REPORT HOUSING COUNSELING OUTCOME EVALUATION
5. COUNSELING SERVICES
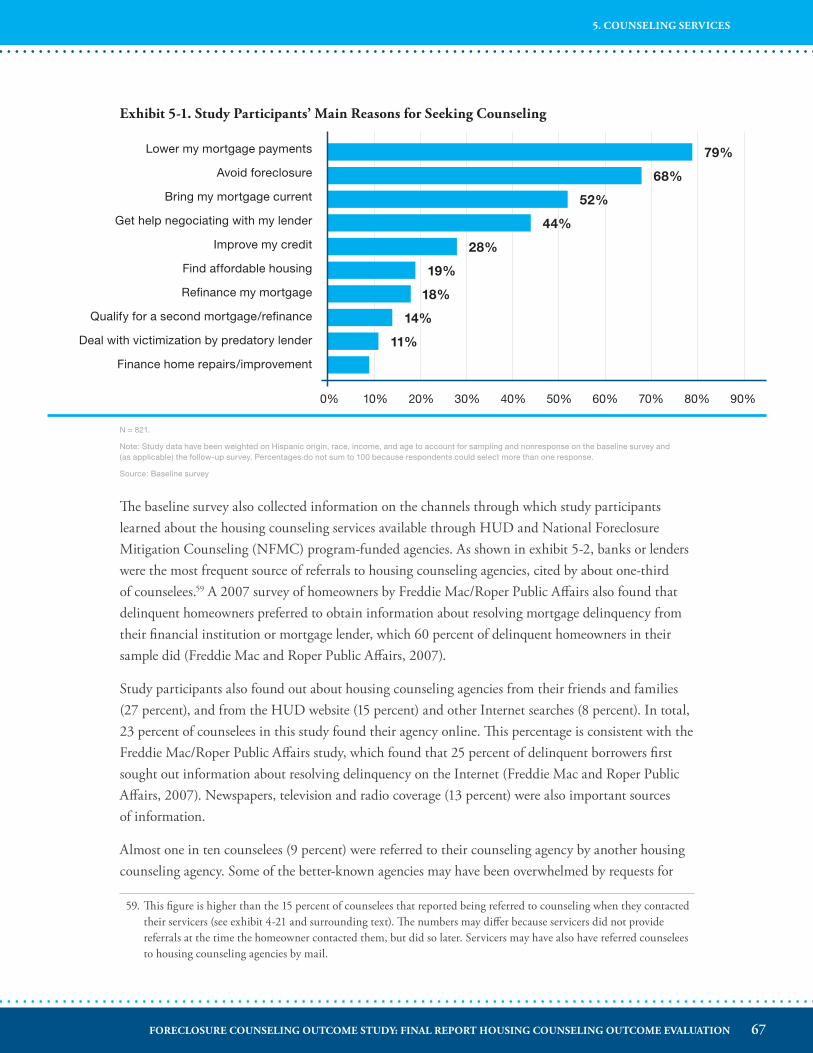
Exhibit 5-1� Study Participants’ Main Reasons for Seeking Counseling
Lower my mortgage payments
Avoid foreclosure
Bring my mortgage current
Get help negociating with my lender
Improve my credit
Find affordable housing
Refinance my mortgage
Qualify for a second mortgage/refinance
Deal with victimization by predatory lender
Finance home repairs/improvement
11%
14%
18%
19%
28%
44%
52%
68%
79%
0% 10% 20% 30% 40% 50% 60% 70% 80% 90%
The baseline survey also collected information on the channels through which study participants learned about the housing counseling services available through HUD and National Foreclosure Mitigation Counseling (NFMC) program-funded agencies. As shown in exhibit 5-2, banks or lenders were the most frequent source of referrals to housing counseling agencies, cited by about one-third of counselees.59 A 2007 survey of homeowners by Freddie Mac/Roper Public Affairs also found that delinquent homeowners preferred to obtain information about resolving mortgage delinquency from their financial institution or mortgage lender, which 60 percent of delinquent homeowners in their sample did (Freddie Mac and Roper Public Affairs, 2007).
Study participants also found out about housing counseling agencies from their friends and families (27 percent), and from the HUD website (15 percent) and other Internet searches (8 percent). In total, 23 percent of counselees in this study found their agency online. This percentage is consistent with the Freddie Mac/Roper Public Affairs study, which found that 25 percent of delinquent borrowers first sought out information about resolving delinquency on the Internet (Freddie Mac and Roper Public Affairs, 2007). Newspapers, television and radio coverage (13 percent) were also important sources of information.
Almost one in ten counselees (9 percent) were referred to their counseling agency by another housing counseling agency. Some of the better-known agencies may have been overwhelmed by requests for
59. This figure is higher than the 15 percent of counselees that reported being referred to counseling when they contacted their servicers (see exhibit 4-21 and surrounding text). The numbers may differ because servicers did not provide referrals at the time the homeowner contacted them, but did so later. Servicers may have also have referred counselees to housing counseling agencies by mail.
N = 821.
Note: Study data have been weighted on Hispanic origin, race, income, and age to account for sampling and nonresponse on the baseline survey and (as applicable) the follow-up survey. Percentages do not sum to 100 because respondents could select more than one response.
Source: Baseline survey
67FORECLOSURE COUNSELING OUTCOME STUDY: FINAL REPORT HOUSING COUNSELING OUTCOME EVALUATION
5. COUNSELING SERVICES
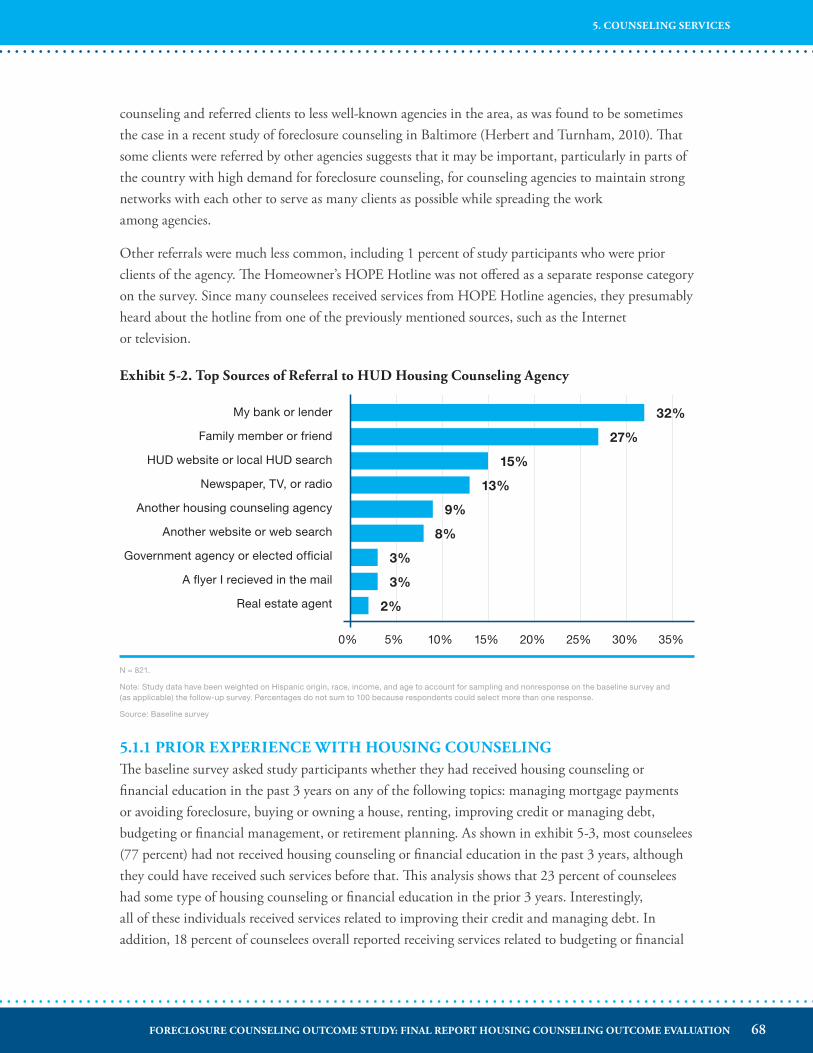
counseling and referred clients to less well-known agencies in the area, as was found to be sometimes the case in a recent study of foreclosure counseling in Baltimore (Herbert and Turnham, 2010). That some clients were referred by other agencies suggests that it may be important, particularly in parts of the country with high demand for foreclosure counseling, for counseling agencies to maintain strong networks with each other to serve as many clients as possible while spreading the work among agencies.
Other referrals were much less common, including 1 percent of study participants who were prior clients of the agency. The Homeowner’s HOPE Hotline was not offered as a separate response category on the survey. Since many counselees received services from HOPE Hotline agencies, they presumably heard about the hotline from one of the previously mentioned sources, such as the Internet or television.
Exhibit 5-2� Top Sources of Referral to HUD Housing Counseling Agency
N = 821.
Note: Study data have been weighted on Hispanic origin, race, income, and age to account for sampling and nonresponse on the baseline survey and (as applicable) the follow-up survey. Percentages do not sum to 100 because respondents could select more than one response.
Source: Baseline survey
0% 5% 10% 15% 20% 25% 30% 35%
My bank or lender
Family member or friend
HUD website or local HUD search
Newspaper, TV, or radio
Another housing counseling agency
Another website or web search
Government agency or elected official
A flyer I recieved in the mail
Real estate agent 2%
3%
3%
8%
9%
13%
15%
27%
32%
5�1�1 PRIOR EXPERIENCE WITH HOUSING COUNSELINGThe baseline survey asked study participants whether they had received housing counseling or financial education in the past 3 years on any of the following topics: managing mortgage payments or avoiding foreclosure, buying or owning a house, renting, improving credit or managing debt, budgeting or financial management, or retirement planning. As shown in exhibit 5-3, most counselees (77 percent) had not received housing counseling or financial education in the past 3 years, although they could have received such services before that. This analysis shows that 23 percent of counselees had some type of housing counseling or financial education in the prior 3 years. Interestingly, all of these individuals received services related to improving their credit and managing debt. In addition, 18 percent of counselees overall reported receiving services related to budgeting or financial
68FORECLOSURE COUNSELING OUTCOME STUDY: FINAL REPORT HOUSING COUNSELING OUTCOME EVALUATION
5. COUNSELING SERVICES
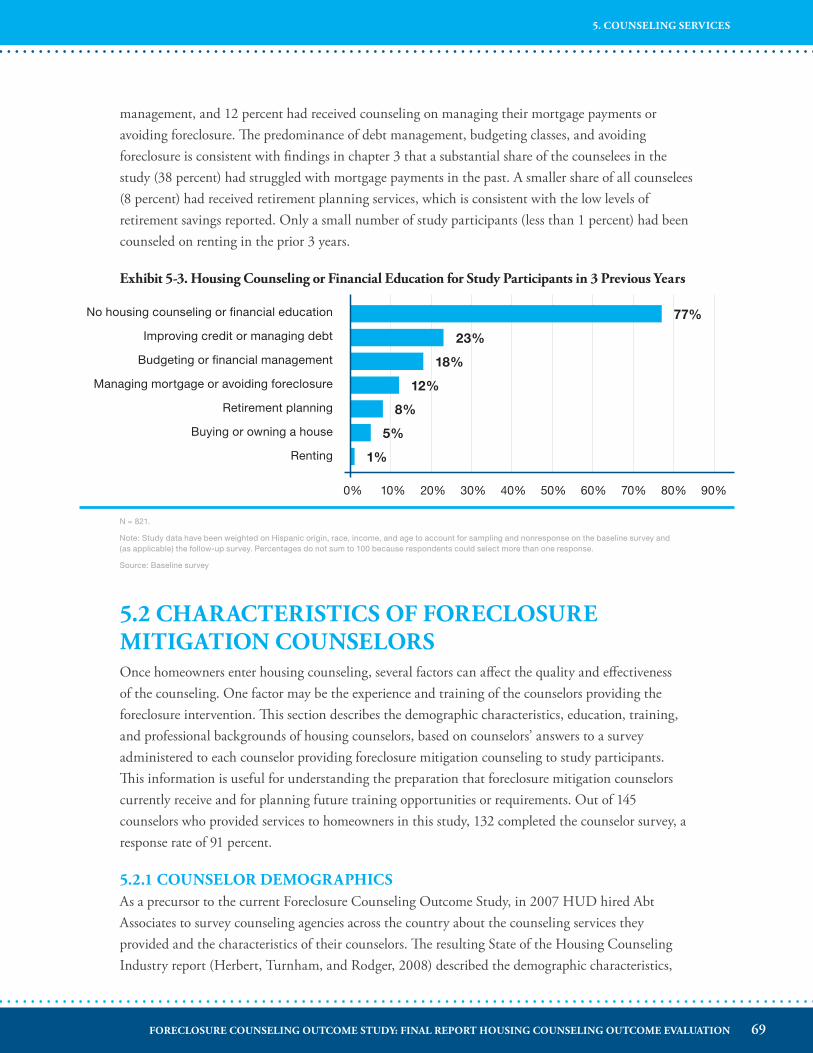
management, and 12 percent had received counseling on managing their mortgage payments or avoiding foreclosure. The predominance of debt management, budgeting classes, and avoiding foreclosure is consistent with findings in chapter 3 that a substantial share of the counselees in the study (38 percent) had struggled with mortgage payments in the past. A smaller share of all counselees (8 percent) had received retirement planning services, which is consistent with the low levels of retirement savings reported. Only a small number of study participants (less than 1 percent) had been counseled on renting in the prior 3 years.
Exhibit 5-3� Housing Counseling or Financial Education for Study Participants in 3 Previous Years
5�2 CHARACTERISTICS OF FORECLOSURE MITIGATION COUNSELORSOnce homeowners enter housing counseling, several factors can affect the quality and effectiveness of the counseling. One factor may be the experience and training of the counselors providing the foreclosure intervention. This section describes the demographic characteristics, education, training, and professional backgrounds of housing counselors, based on counselors’ answers to a survey administered to each counselor providing foreclosure mitigation counseling to study participants. This information is useful for understanding the preparation that foreclosure mitigation counselors currently receive and for planning future training opportunities or requirements. Out of 145 counselors who provided services to homeowners in this study, 132 completed the counselor survey, a response rate of 91 percent.
5�2�1 COUNSELOR DEMOGRAPHICSAs a precursor to the current Foreclosure Counseling Outcome Study, in 2007 HUD hired Abt Associates to survey counseling agencies across the country about the counseling services they provided and the characteristics of their counselors. The resulting State of the Housing Counseling Industry report (Herbert, Turnham, and Rodger, 2008) described the demographic characteristics,
0% 10% 20% 30% 40% 50% 60% 70% 80% 90%
No housing counseling or financial education
Improving credit or managing debt
Budgeting or financial management
Managing mortgage or avoiding foreclosure
Retirement planning
Buying or owning a house
Renting 1%
5%
8%
12%
18%
23%
77%
N = 821.
Note: Study data have been weighted on Hispanic origin, race, income, and age to account for sampling and nonresponse on the baseline survey and (as applicable) the follow-up survey. Percentages do not sum to 100 because respondents could select more than one response.
Source: Baseline survey
69FORECLOSURE COUNSELING OUTCOME STUDY: FINAL REPORT HOUSING COUNSELING OUTCOME EVALUATION
5. COUNSELING SERVICES
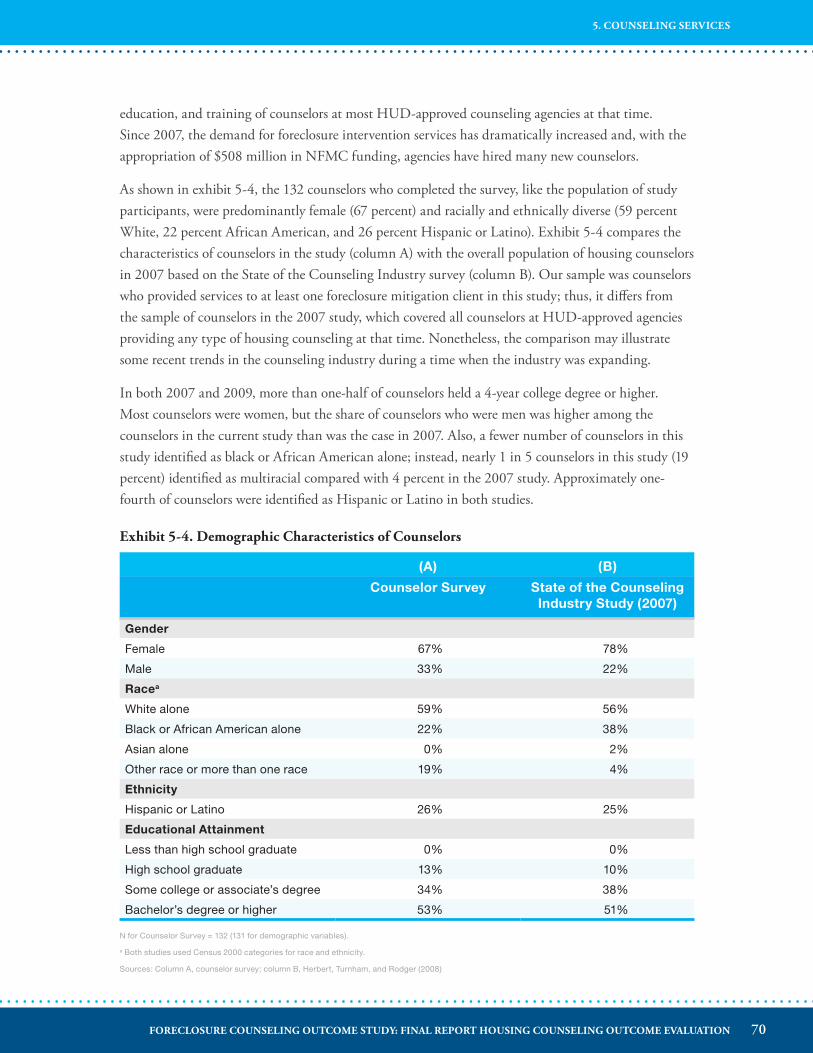
education, and training of counselors at most HUD-approved counseling agencies at that time. Since 2007, the demand for foreclosure intervention services has dramatically increased and, with the appropriation of $508 million in NFMC funding, agencies have hired many new counselors.
As shown in exhibit 5-4, the 132 counselors who completed the survey, like the population of study participants, were predominantly female (67 percent) and racially and ethnically diverse (59 percent White, 22 percent African American, and 26 percent Hispanic or Latino). Exhibit 5-4 compares the characteristics of counselors in the study (column A) with the overall population of housing counselors in 2007 based on the State of the Counseling Industry survey (column B). Our sample was counselors who provided services to at least one foreclosure mitigation client in this study; thus, it differs from the sample of counselors in the 2007 study, which covered all counselors at HUD-approved agencies providing any type of housing counseling at that time. Nonetheless, the comparison may illustrate some recent trends in the counseling industry during a time when the industry was expanding.
In both 2007 and 2009, more than one-half of counselors held a 4-year college degree or higher. Most counselors were women, but the share of counselors who were men was higher among the counselors in the current study than was the case in 2007. Also, a fewer number of counselors in this study identified as black or African American alone; instead, nearly 1 in 5 counselors in this study (19 percent) identified as multiracial compared with 4 percent in the 2007 study. Approximately one-fourth of counselors were identified as Hispanic or Latino in both studies.
Exhibit 5-4� Demographic Characteristics of Counselors
(A) (B)
Counselor Survey State of the Counseling Industry Study (2007)
Gender
Female 67% 78%
Male 33% 22%
Racea
White alone 59% 56%
Black or African American alone 22% 38%
Asian alone 0% 2%
Other race or more than one race 19% 4%
Ethnicity
Hispanic or Latino 26% 25%
Educational Attainment
Less than high school graduate 0% 0%
High school graduate 13% 10%
Some college or associate’s degree 34% 38%
Bachelor’s degree or higher 53% 51%
N for Counselor Survey = 132 (131 for demographic variables).
a Both studies used Census 2000 categories for race and ethnicity.
Sources: Column A, counselor survey; column B, Herbert, Turnham, and Rodger (2008)
70FORECLOSURE COUNSELING OUTCOME STUDY: FINAL REPORT HOUSING COUNSELING OUTCOME EVALUATION
5. COUNSELING SERVICES
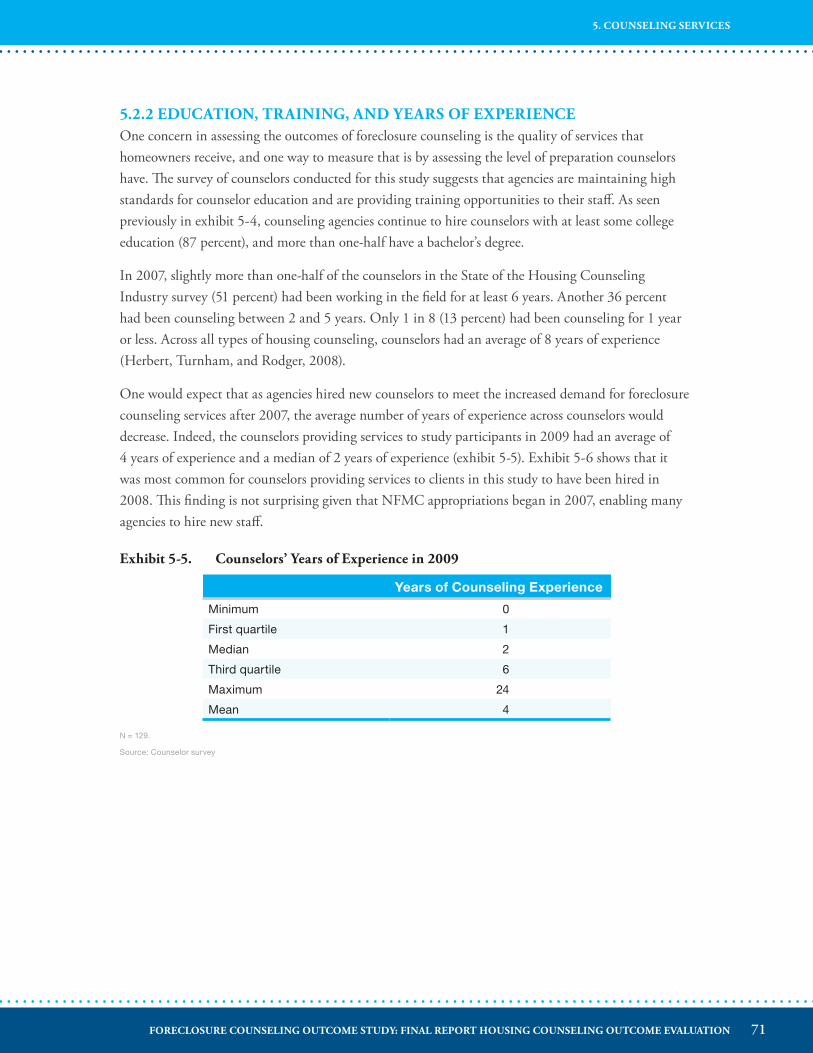
5�2�2 EDUCATION, TRAINING, AND YEARS OF EXPERIENCEOne concern in assessing the outcomes of foreclosure counseling is the quality of services that homeowners receive, and one way to measure that is by assessing the level of preparation counselors have. The survey of counselors conducted for this study suggests that agencies are maintaining high standards for counselor education and are providing training opportunities to their staff. As seen previously in exhibit 5-4, counseling agencies continue to hire counselors with at least some college education (87 percent), and more than one-half have a bachelor’s degree.
In 2007, slightly more than one-half of the counselors in the State of the Housing Counseling Industry survey (51 percent) had been working in the field for at least 6 years. Another 36 percent had been counseling between 2 and 5 years. Only 1 in 8 (13 percent) had been counseling for 1 year or less. Across all types of housing counseling, counselors had an average of 8 years of experience (Herbert, Turnham, and Rodger, 2008).
One would expect that as agencies hired new counselors to meet the increased demand for foreclosure counseling services after 2007, the average number of years of experience across counselors would decrease. Indeed, the counselors providing services to study participants in 2009 had an average of 4 years of experience and a median of 2 years of experience (exhibit 5-5). Exhibit 5-6 shows that it was most common for counselors providing services to clients in this study to have been hired in 2008. This finding is not surprising given that NFMC appropriations began in 2007, enabling many agencies to hire new staff.
Exhibit 5-5� Counselors’ Years of Experience in 2009
Years of Counseling Experience
Minimum 0
First quartile 1
Median 2
Third quartile 6
Maximum 24
Mean 4
N = 129.
Source: Counselor survey
71FORECLOSURE COUNSELING OUTCOME STUDY: FINAL REPORT HOUSING COUNSELING OUTCOME EVALUATION
5. COUNSELING SERVICES
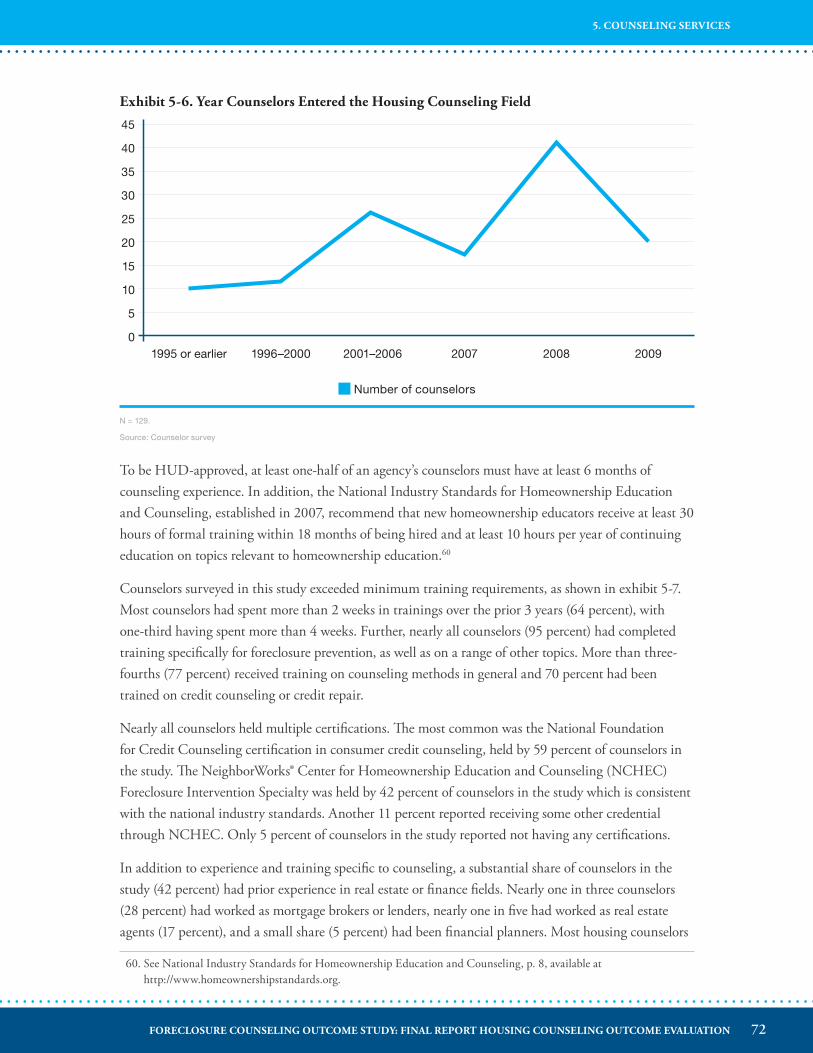
Exhibit 5-6� Year Counselors Entered the Housing Counseling Field
1995 or earlier 1996–2000 2001–2006 2007 2008 2009
45
40
35
30
25
20
15
10
5
0
Number of counselors
To be HUD-approved, at least one-half of an agency’s counselors must have at least 6 months of counseling experience. In addition, the National Industry Standards for Homeownership Education and Counseling, established in 2007, recommend that new homeownership educators receive at least 30 hours of formal training within 18 months of being hired and at least 10 hours per year of continuing education on topics relevant to homeownership education.60
Counselors surveyed in this study exceeded minimum training requirements, as shown in exhibit 5-7. Most counselors had spent more than 2 weeks in trainings over the prior 3 years (64 percent), with one-third having spent more than 4 weeks. Further, nearly all counselors (95 percent) had completed training specifically for foreclosure prevention, as well as on a range of other topics. More than three-fourths (77 percent) received training on counseling methods in general and 70 percent had been trained on credit counseling or credit repair.
Nearly all counselors held multiple certifications. The most common was the National Foundation for Credit Counseling certification in consumer credit counseling, held by 59 percent of counselors in the study. The NeighborWorks® Center for Homeownership Education and Counseling (NCHEC) Foreclosure Intervention Specialty was held by 42 percent of counselors in the study which is consistent with the national industry standards. Another 11 percent reported receiving some other credential through NCHEC. Only 5 percent of counselors in the study reported not having any certifications.
In addition to experience and training specific to counseling, a substantial share of counselors in the study (42 percent) had prior experience in real estate or finance fields. Nearly one in three counselors (28 percent) had worked as mortgage brokers or lenders, nearly one in five had worked as real estate agents (17 percent), and a small share (5 percent) had been financial planners. Most housing counselors
60. See National Industry Standards for Homeownership Education and Counseling, p. 8, available at http://www.homeownershipstandards.org.
N = 129.
Source: Counselor survey
72FORECLOSURE COUNSELING OUTCOME STUDY: FINAL REPORT HOUSING COUNSELING OUTCOME EVALUATION
5. COUNSELING SERVICES
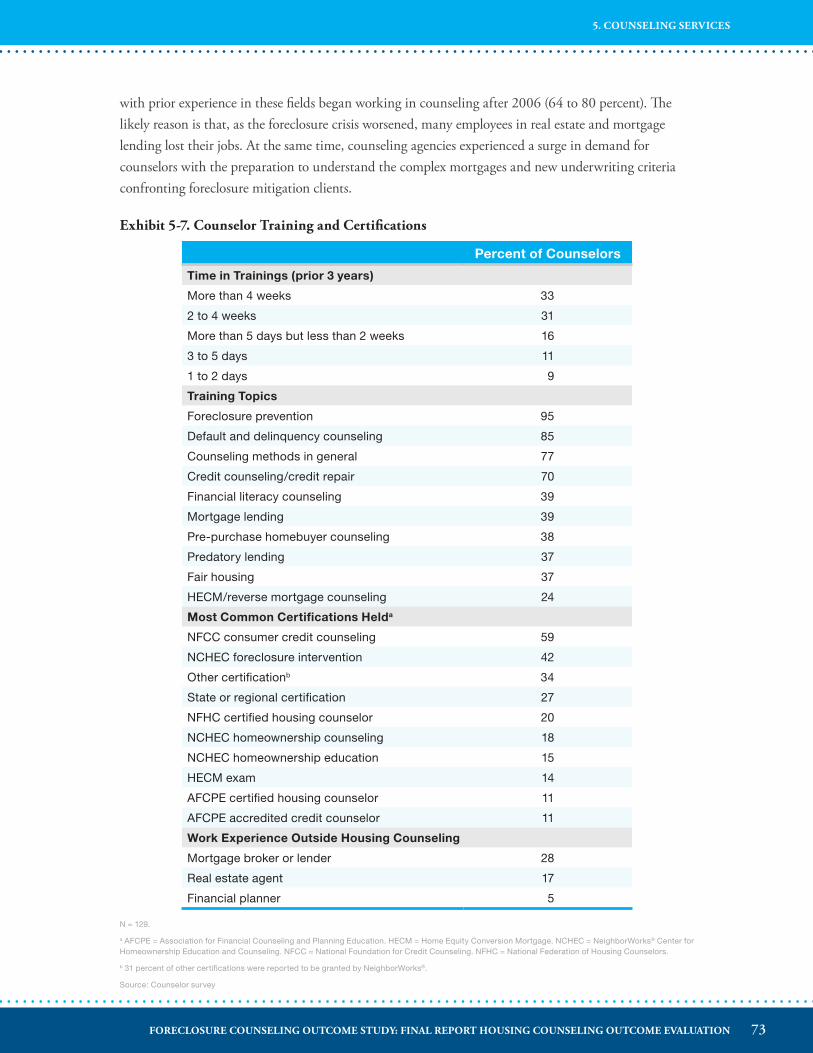
with prior experience in these fields began working in counseling after 2006 (64 to 80 percent). The likely reason is that, as the foreclosure crisis worsened, many employees in real estate and mortgage lending lost their jobs. At the same time, counseling agencies experienced a surge in demand for counselors with the preparation to understand the complex mortgages and new underwriting criteria confronting foreclosure mitigation clients.
Exhibit 5-7� Counselor Training and Certifications
Percent of Counselors
Time in Trainings (prior 3 years)
More than 4 weeks 33
2 to 4 weeks 31
More than 5 days but less than 2 weeks 16
3 to 5 days 11
1 to 2 days 9
Training Topics
Foreclosure prevention 95
Default and delinquency counseling 85
Counseling methods in general 77
Credit counseling/credit repair 70
Financial literacy counseling 39
Mortgage lending 39
Pre-purchase homebuyer counseling 38
Predatory lending 37
Fair housing 37
HECM/reverse mortgage counseling 24
Most Common Certifications Helda
NFCC consumer credit counseling 59
NCHEC foreclosure intervention 42
Other certificationb 34
State or regional certification 27
NFHC certified housing counselor 20
NCHEC homeownership counseling 18
NCHEC homeownership education 15
HECM exam 14
AFCPE certified housing counselor 11
AFCPE accredited credit counselor 11
Work Experience Outside Housing Counseling
Mortgage broker or lender 28
Real estate agent 17
Financial planner 5
N = 129.
a AFCPE = Association for Financial Counseling and Planning Education. HECM = Home Equity Conversion Mortgage. NCHEC = NeighborWorks® Center for Homeownership Education and Counseling. NFCC = National Foundation for Credit Counseling. NFHC = National Federation of Housing Counselors.
b 31 percent of other certifications were reported to be granted by NeighborWorks®.
Source: Counselor survey
73FORECLOSURE COUNSELING OUTCOME STUDY: FINAL REPORT HOUSING COUNSELING OUTCOME EVALUATION
5. COUNSELING SERVICES
5�3 HOUSING COUNSELING SERVICES RECEIVEDHousing counseling services may be provided as group education or individual counseling. Counseling, narrowly defined, is only those sessions that occur one-on-one with the client, in which the counselor works with a client on the specifics of his or her situation—going into detail on budgeting, potential remedies, and referrals to legal and other services as necessary. Group education sessions provide more general information and referrals but are not tailored to an individual client’s circumstances or budget. Because of the complex variety of factors affecting mortgage delinquency and foreclosure intervention—including the local economy, various lenders and investors, and different modification programs that may be available—there is a strong preference in the industry to provide one-on-one counseling to delinquent homeowners rather than group education. In this study, we refer to these two types of counseling as group or individual.
Counseling also varies by mode (or delivery channel), meaning delivery either in person or remotely, usually over the telephone. The long-standing practice in housing counseling was to prefer in-person counseling over telephone counseling. Some evidence suggests that in-person counseling is more effective than telephone counseling for pre-purchase counseling (Hirad and Zorn, 2001). Yet, with agencies increasingly using technology to reach more clients and with surging demand for foreclosure mitigation services, HUD published a Final Rule for the Housing Counseling Program in 2007 to allow HUD-funded counseling to be provided in alternative settings (including by telephone) as well as in person.61 The most prominent example of telephone counseling’s expansion is the large call centers affiliated with the HOPE Hotline, six of which participated in this study. Given the expansion of telephone counseling for foreclosure mitigation, a key policy question is whether this mode of counseling can be effective for distressed homeowners.
Agencies also may make use of some Internet-based component. Most frequently, this is communicating with clients via email, but it also may take the form of webinars or an online education module. In-person counseling may include some remote formats such as follow-up telephone calls or emails. We found little use of online education in our study. As a result, for our analysis, we separate clients into two groups: clients who were counseled only over the telephone and clients who received any in-person counseling, even if they also used remote modes.
This study required participating agencies to document each time a study participant received a service related to foreclosure mitigation and to record the type of service and its duration. This information, which we refer to as the service tracking survey, documents the type and range of services received by study participants. We have service tracking data on 792 out of 824 foreclosure mitigation clients in the study (96 percent). The web-based system that stored the service tracking information would not allow counselors to move forward to the next question until they answered the previous one; therefore, for each appointment with service tracking data, the data are complete. The service tracking period lasted for 6 months after an individual enrolled in the study, although most clients did not continue to receive services for the full 6 months.
61. Housing Counseling Program; Final Rule, Federal Register Vol. 72, No. 188, September 28, 2007, pp. 55638-55654.
74FORECLOSURE COUNSELING OUTCOME STUDY: FINAL REPORT HOUSING COUNSELING OUTCOME EVALUATION
5. COUNSELING SERVICES
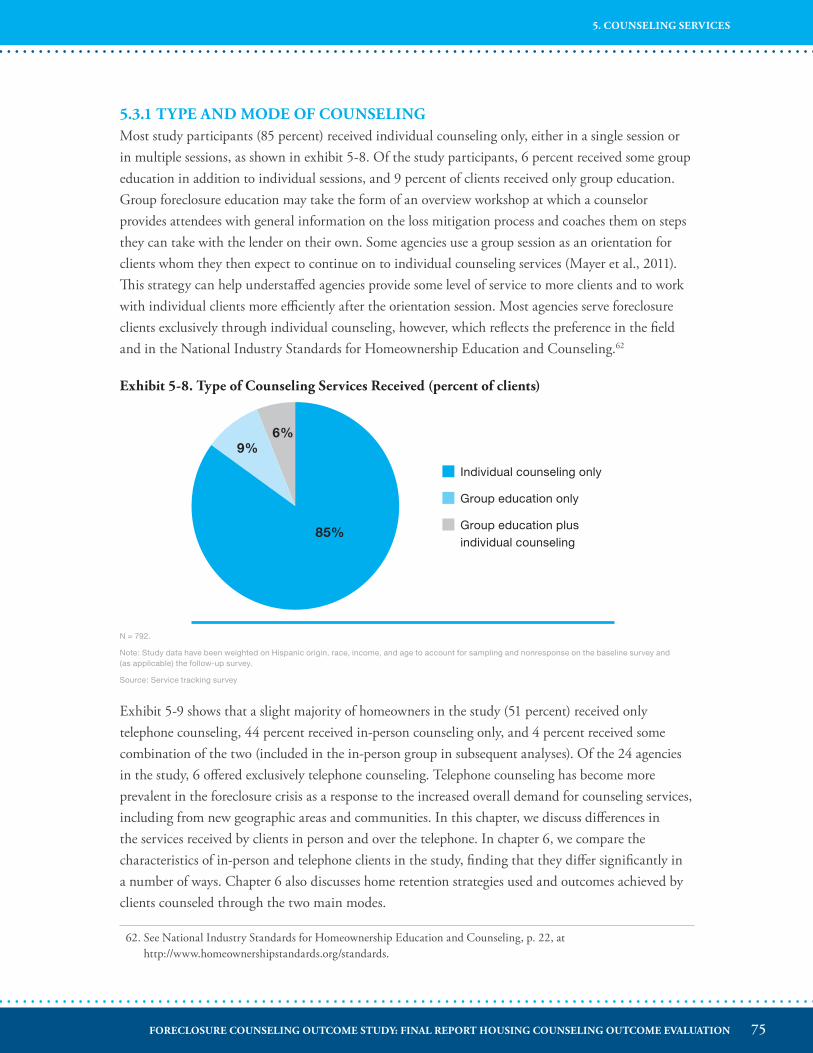
5�3�1 TYPE AND MODE OF COUNSELINGMost study participants (85 percent) received individual counseling only, either in a single session or in multiple sessions, as shown in exhibit 5-8. Of the study participants, 6 percent received some group education in addition to individual sessions, and 9 percent of clients received only group education. Group foreclosure education may take the form of an overview workshop at which a counselor provides attendees with general information on the loss mitigation process and coaches them on steps they can take with the lender on their own. Some agencies use a group session as an orientation for clients whom they then expect to continue on to individual counseling services (Mayer et al., 2011). This strategy can help understaffed agencies provide some level of service to more clients and to work with individual clients more efficiently after the orientation session. Most agencies serve foreclosure clients exclusively through individual counseling, however, which reflects the preference in the field and in the National Industry Standards for Homeownership Education and Counseling.62
Exhibit 5-8� Type of Counseling Services Received (percent of clients)
Exhibit 5-9 shows that a slight majority of homeowners in the study (51 percent) received only telephone counseling, 44 percent received in-person counseling only, and 4 percent received some combination of the two (included in the in-person group in subsequent analyses). Of the 24 agencies in the study, 6 offered exclusively telephone counseling. Telephone counseling has become more prevalent in the foreclosure crisis as a response to the increased overall demand for counseling services, including from new geographic areas and communities. In this chapter, we discuss differences in the services received by clients in person and over the telephone. In chapter 6, we compare the characteristics of in-person and telephone clients in the study, finding that they differ significantly in a number of ways. Chapter 6 also discusses home retention strategies used and outcomes achieved by clients counseled through the two main modes.
62. See National Industry Standards for Homeownership Education and Counseling, p. 22, at http://www.homeownershipstandards.org/standards.
85%
9%6%
Individual counseling only
Group education only
Group education plus individual counseling
N = 792.
Note: Study data have been weighted on Hispanic origin, race, income, and age to account for sampling and nonresponse on the baseline survey and (as applicable) the follow-up survey.
Source: Service tracking survey
75FORECLOSURE COUNSELING OUTCOME STUDY: FINAL REPORT HOUSING COUNSELING OUTCOME EVALUATION
5. COUNSELING SERVICES
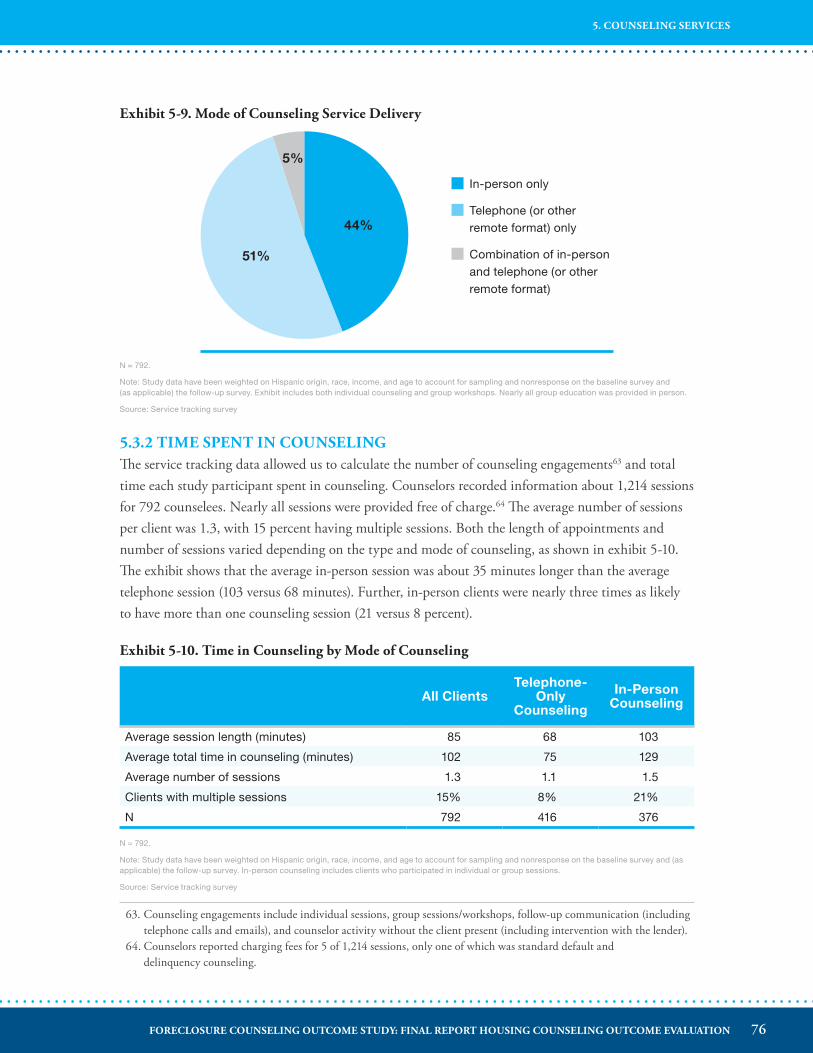
Exhibit 5-9� Mode of Counseling Service Delivery
44%
51%
5%
In-person only
Telephone (or other remote format) only
Combination of in-person and telephone (or other remote format)
N = 792.
Note: Study data have been weighted on Hispanic origin, race, income, and age to account for sampling and nonresponse on the baseline survey and (as applicable) the follow-up survey. Exhibit includes both individual counseling and group workshops. Nearly all group education was provided in person.
Source: Service tracking survey
5�3�2 TIME SPENT IN COUNSELINGThe service tracking data allowed us to calculate the number of counseling engagements63 and total time each study participant spent in counseling. Counselors recorded information about 1,214 sessions for 792 counselees. Nearly all sessions were provided free of charge.64 The average number of sessions per client was 1.3, with 15 percent having multiple sessions. Both the length of appointments and number of sessions varied depending on the type and mode of counseling, as shown in exhibit 5-10. The exhibit shows that the average in-person session was about 35 minutes longer than the average telephone session (103 versus 68 minutes). Further, in-person clients were nearly three times as likely to have more than one counseling session (21 versus 8 percent).
Exhibit 5-10� Time in Counseling by Mode of Counseling
All ClientsTelephone-
Only Counseling
In-Person Counseling
Average session length (minutes) 85 68 103
Average total time in counseling (minutes) 102 75 129
Average number of sessions 1.3 1.1 1.5
Clients with multiple sessions 15% 8% 21%
N 792 416 376
N = 792.
Note: Study data have been weighted on Hispanic origin, race, income, and age to account for sampling and nonresponse on the baseline survey and (as applicable) the follow-up survey. In-person counseling includes clients who participated in individual or group sessions.
Source: Service tracking survey
63. Counseling engagements include individual sessions, group sessions/workshops, follow-up communication (including telephone calls and emails), and counselor activity without the client present (including intervention with the lender).
64. Counselors reported charging fees for 5 of 1,214 sessions, only one of which was standard default and delinquency counseling.
76FORECLOSURE COUNSELING OUTCOME STUDY: FINAL REPORT HOUSING COUNSELING OUTCOME EVALUATION
5. COUNSELING SERVICES
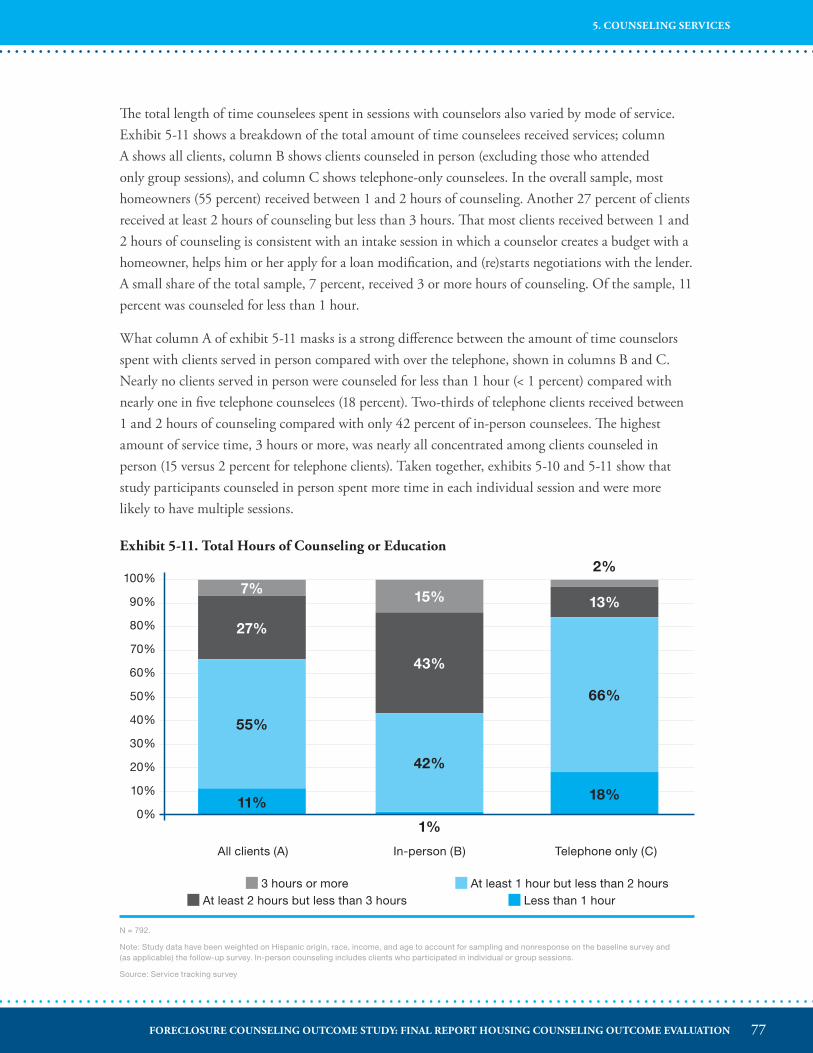
The total length of time counselees spent in sessions with counselors also varied by mode of service. Exhibit 5-11 shows a breakdown of the total amount of time counselees received services; column A shows all clients, column B shows clients counseled in person (excluding those who attended only group sessions), and column C shows telephone-only counselees. In the overall sample, most homeowners (55 percent) received between 1 and 2 hours of counseling. Another 27 percent of clients received at least 2 hours of counseling but less than 3 hours. That most clients received between 1 and 2 hours of counseling is consistent with an intake session in which a counselor creates a budget with a homeowner, helps him or her apply for a loan modification, and (re)starts negotiations with the lender. A small share of the total sample, 7 percent, received 3 or more hours of counseling. Of the sample, 11 percent was counseled for less than 1 hour.
What column A of exhibit 5-11 masks is a strong difference between the amount of time counselors spent with clients served in person compared with over the telephone, shown in columns B and C. Nearly no clients served in person were counseled for less than 1 hour (< 1 percent) compared with nearly one in five telephone counselees (18 percent). Two-thirds of telephone clients received between 1 and 2 hours of counseling compared with only 42 percent of in-person counselees. The highest amount of service time, 3 hours or more, was nearly all concentrated among clients counseled in person (15 versus 2 percent for telephone clients). Taken together, exhibits 5-10 and 5-11 show that study participants counseled in person spent more time in each individual session and were more likely to have multiple sessions.
Exhibit 5-11� Total Hours of Counseling or Education
All clients (A) In-person (B) Telephone only (C)
100%
90%
80%
70%
60%
50%
40%
30%
20%
10%
0%11% 18%
1%
2%
55%
66%
42%
27%
13%
43%
7% 15%
3 hours or more At least 2 hours but less than 3 hours
At least 1 hour but less than 2 hours Less than 1 hour
N = 792.
Note: Study data have been weighted on Hispanic origin, race, income, and age to account for sampling and nonresponse on the baseline survey and (as applicable) the follow-up survey. In-person counseling includes clients who participated in individual or group sessions.
Source: Service tracking survey
77FORECLOSURE COUNSELING OUTCOME STUDY: FINAL REPORT HOUSING COUNSELING OUTCOME EVALUATION
5. COUNSELING SERVICES
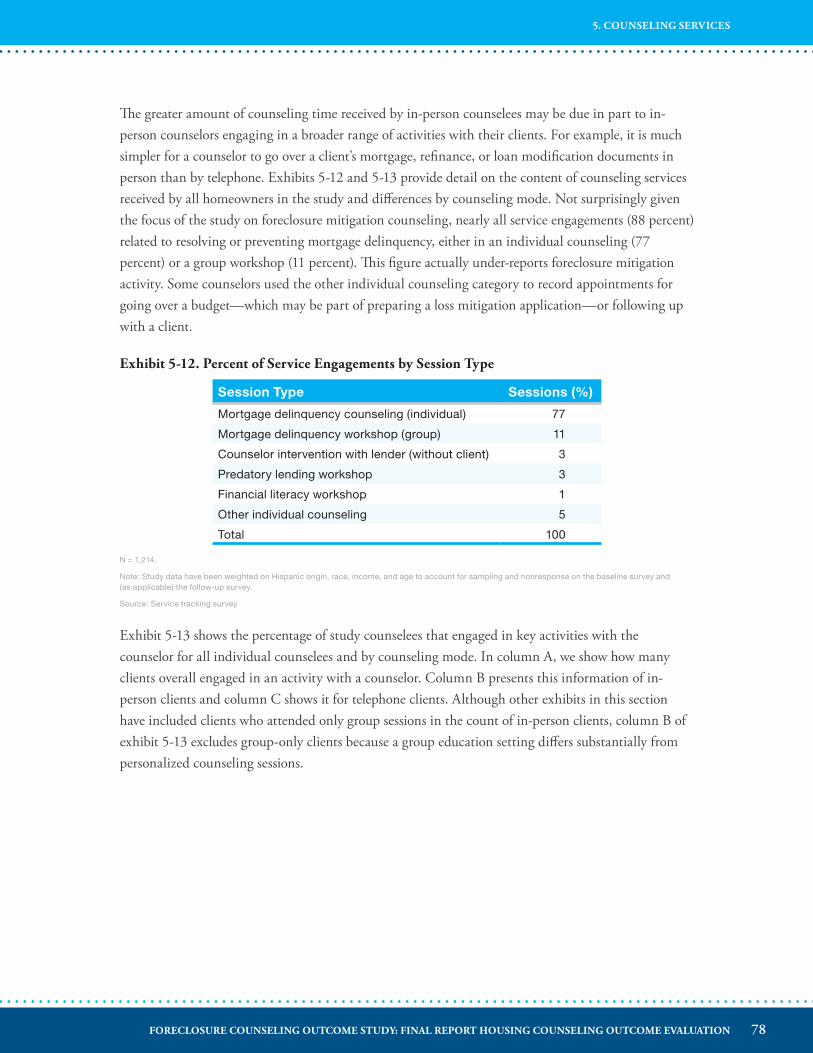
The greater amount of counseling time received by in-person counselees may be due in part to in-person counselors engaging in a broader range of activities with their clients. For example, it is much simpler for a counselor to go over a client’s mortgage, refinance, or loan modification documents in person than by telephone. Exhibits 5-12 and 5-13 provide detail on the content of counseling services received by all homeowners in the study and differences by counseling mode. Not surprisingly given the focus of the study on foreclosure mitigation counseling, nearly all service engagements (88 percent) related to resolving or preventing mortgage delinquency, either in an individual counseling (77 percent) or a group workshop (11 percent). This figure actually under-reports foreclosure mitigation activity. Some counselors used the other individual counseling category to record appointments for going over a budget—which may be part of preparing a loss mitigation application—or following up with a client.
Exhibit 5-12� Percent of Service Engagements by Session Type
Session Type Sessions (%)
Mortgage delinquency counseling (individual) 77
Mortgage delinquency workshop (group) 11
Counselor intervention with lender (without client) 3
Predatory lending workshop 3
Financial literacy workshop 1
Other individual counseling 5
Total 100
N = 1,214.
Note: Study data have been weighted on Hispanic origin, race, income, and age to account for sampling and nonresponse on the baseline survey and (as applicable) the follow-up survey.
Source: Service tracking survey
Exhibit 5-13 shows the percentage of study counselees that engaged in key activities with the counselor for all individual counselees and by counseling mode. In column A, we show how many clients overall engaged in an activity with a counselor. Column B presents this information of in-person clients and column C shows it for telephone clients. Although other exhibits in this section have included clients who attended only group sessions in the count of in-person clients, column B of exhibit 5-13 excludes group-only clients because a group education setting differs substantially from personalized counseling sessions.
78FORECLOSURE COUNSELING OUTCOME STUDY: FINAL REPORT HOUSING COUNSELING OUTCOME EVALUATION
5. COUNSELING SERVICES

Exhibit 5-13� Key Activities Undertaken With Study Participants in Individual Sessions
Activity (A) All Counselees
(B) In-person Clientsa
(C) Telephone-only Clients
Review household income, credit, debts, assets, and affordability
93% 95% 96%
Review options for resolving delinquency 84% 92% 76%
Review client’s mortgage documents 35% 70% 14%
Other 13% 25% 6%
N = 792.
Note: Study data have been weighted on Hispanic origin, race, income, and age to account for sampling and nonresponse on the baseline survey and (as applicable) the follow-up survey.
a Excludes clients who participated only in group sessions.
Source: Service tracking survey
As shown in exhibit 5-13, nearly all study participants (93 percent) reviewed their household finances and mortgage affordability with a counselor.65 Most homeowners in the study (84 percent) were also counseled about their options for resolving delinquency: 92 percent of in-person clients and 76 percent of telephone clients. These activities are consistent with both the National Industry Standards for Homeownership Education and Counseling and requirements for reimbursement through the NFMC program. We found that clients served in person were much more likely to review their mortgage documents with the counselor than telephone clients (70 versus 14 percent), which is not surprising since in-person counselors can look at copies of documents the client has brought to the session.
Exhibit 5-14 shows the distribution of the specific topics that counselors discussed with study participants under the category of review of options for resolving mortgage delinquency. The percentages shown in the exhibit are percentages of the 667 homeowners in the study (84 percent) whose sessions included this topic. Most of these clients (69 percent) received a general overview of the options lenders have available to them. This general overview could include describing the role of the loss mitigation department and definitions of loss mitigation terms such as deed-in-lieu of foreclosure. One-third of the clients (32 percent) received educational information about how to shop for a mortgage refinance, how to avoid predatory lenders, housing alternatives, or household budgeting advice.
Counselors intervened directly with lenders on the behalf of one-third (33 percent) of all clients. Intervention varied by mode of counseling. Of the telephone-only clients, 25 percent had a counselor intervene directly with their lender compared with 40 percent of all in-person clients and 52 percent of in-person clients, excluding those who participated only in group sessions (data not shown).
65. Group education settings do not accommodate this individual level of review, which lowers the overall percent of clients covering this topic.
79FORECLOSURE COUNSELING OUTCOME STUDY: FINAL REPORT HOUSING COUNSELING OUTCOME EVALUATION
5. COUNSELING SERVICES
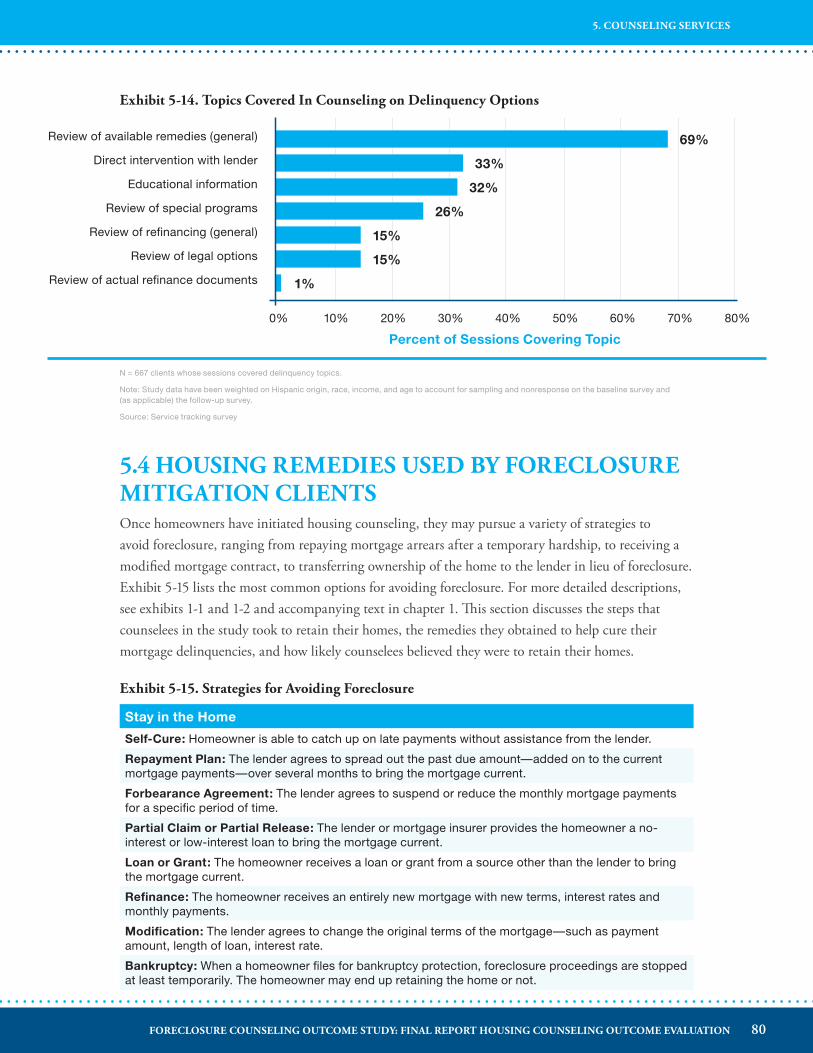
Exhibit 5-14� Topics Covered In Counseling on Delinquency Options
0% 10% 20% 30% 40% 50% 60% 70% 80%
Review of available remedies (general)
Direct intervention with lender
Educational information
Review of special programs
Review of refinancing (general)
Review of legal options
Review of actual refinance documents
69%
33%
32%
26%
15%
15%
1%
Percent of Sessions Covering Topic
N = 667 clients whose sessions covered delinquency topics.
Note: Study data have been weighted on Hispanic origin, race, income, and age to account for sampling and nonresponse on the baseline survey and (as applicable) the follow-up survey.
Source: Service tracking survey
5�4 HOUSING REMEDIES USED BY FORECLOSURE MITIGATION CLIENTSOnce homeowners have initiated housing counseling, they may pursue a variety of strategies to avoid foreclosure, ranging from repaying mortgage arrears after a temporary hardship, to receiving a modified mortgage contract, to transferring ownership of the home to the lender in lieu of foreclosure. Exhibit 5-15 lists the most common options for avoiding foreclosure. For more detailed descriptions, see exhibits 1-1 and 1-2 and accompanying text in chapter 1. This section discusses the steps that counselees in the study took to retain their homes, the remedies they obtained to help cure their mortgage delinquencies, and how likely counselees believed they were to retain their homes.
Exhibit 5-15� Strategies for Avoiding Foreclosure
Stay in the Home
Self-Cure: Homeowner is able to catch up on late payments without assistance from the lender.
Repayment Plan: The lender agrees to spread out the past due amount—added on to the current mortgage payments—over several months to bring the mortgage current.
Forbearance Agreement: The lender agrees to suspend or reduce the monthly mortgage payments for a specific period of time.
Partial Claim or Partial Release: The lender or mortgage insurer provides the homeowner a no-interest or low-interest loan to bring the mortgage current.
Loan or Grant: The homeowner receives a loan or grant from a source other than the lender to bring the mortgage current.
Refinance: The homeowner receives an entirely new mortgage with new terms, interest rates and monthly payments.
Modification: The lender agrees to change the original terms of the mortgage—such as payment amount, length of loan, interest rate.
Bankruptcy: When a homeowner files for bankruptcy protection, foreclosure proceedings are stopped at least temporarily. The homeowner may end up retaining the home or not.
80FORECLOSURE COUNSELING OUTCOME STUDY: FINAL REPORT HOUSING COUNSELING OUTCOME EVALUATION
5. COUNSELING SERVICES
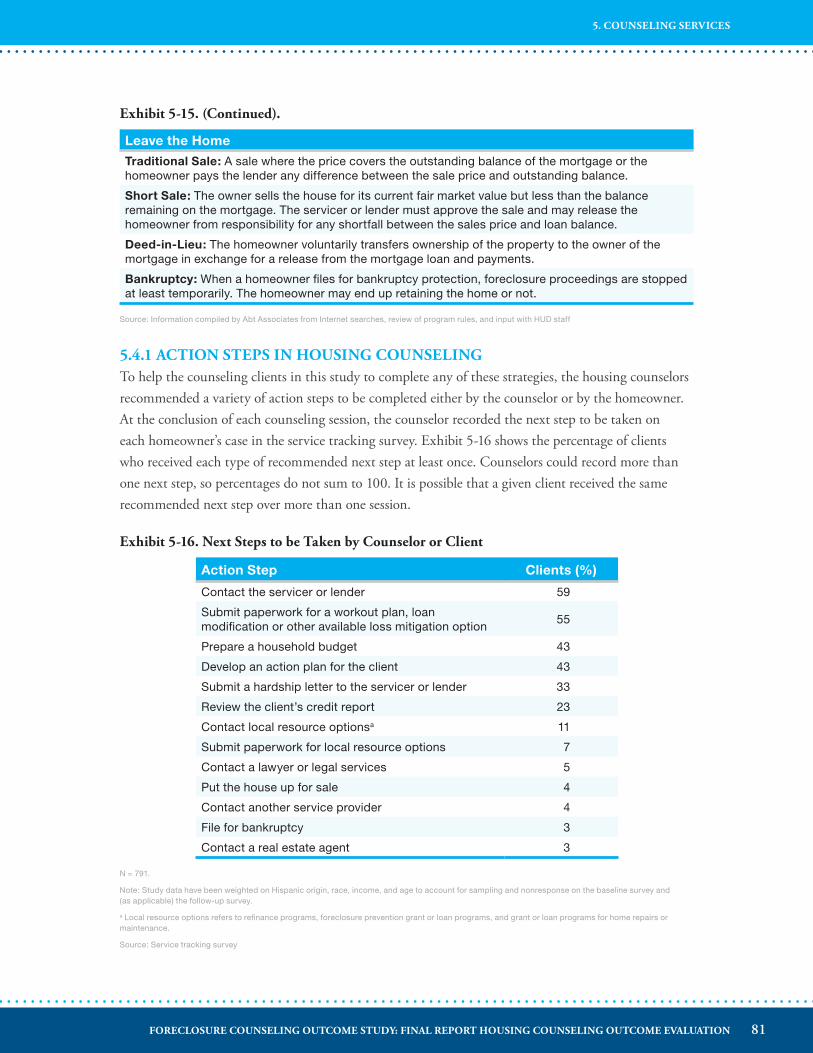
Leave the Home
Traditional Sale: A sale where the price covers the outstanding balance of the mortgage or the homeowner pays the lender any difference between the sale price and outstanding balance.
Short Sale: The owner sells the house for its current fair market value but less than the balance remaining on the mortgage. The servicer or lender must approve the sale and may release the homeowner from responsibility for any shortfall between the sales price and loan balance.
Deed-in-Lieu: The homeowner voluntarily transfers ownership of the property to the owner of the mortgage in exchange for a release from the mortgage loan and payments.
Bankruptcy: When a homeowner files for bankruptcy protection, foreclosure proceedings are stopped at least temporarily. The homeowner may end up retaining the home or not.
Source: Information compiled by Abt Associates from Internet searches, review of program rules, and input with HUD staff
5�4�1 ACTION STEPS IN HOUSING COUNSELINGTo help the counseling clients in this study to complete any of these strategies, the housing counselors recommended a variety of action steps to be completed either by the counselor or by the homeowner. At the conclusion of each counseling session, the counselor recorded the next step to be taken on each homeowner’s case in the service tracking survey. Exhibit 5-16 shows the percentage of clients who received each type of recommended next step at least once. Counselors could record more than one next step, so percentages do not sum to 100. It is possible that a given client received the same recommended next step over more than one session.
Exhibit 5-16� Next Steps to be Taken by Counselor or Client
Action Step Clients (%)
Contact the servicer or lender 59
Submit paperwork for a workout plan, loan modification or other available loss mitigation option
55
Prepare a household budget 43
Develop an action plan for the client 43
Submit a hardship letter to the servicer or lender 33
Review the client’s credit report 23
Contact local resource optionsa 11
Submit paperwork for local resource options 7
Contact a lawyer or legal services 5
Put the house up for sale 4
Contact another service provider 4
File for bankruptcy 3
Contact a real estate agent 3
N = 791.
Note: Study data have been weighted on Hispanic origin, race, income, and age to account for sampling and nonresponse on the baseline survey and (as applicable) the follow-up survey.
a Local resource options refers to refinance programs, foreclosure prevention grant or loan programs, and grant or loan programs for home repairs or maintenance.
Source: Service tracking survey
Exhibit 5-15� (Continued)�
81FORECLOSURE COUNSELING OUTCOME STUDY: FINAL REPORT HOUSING COUNSELING OUTCOME EVALUATION
5. COUNSELING SERVICES
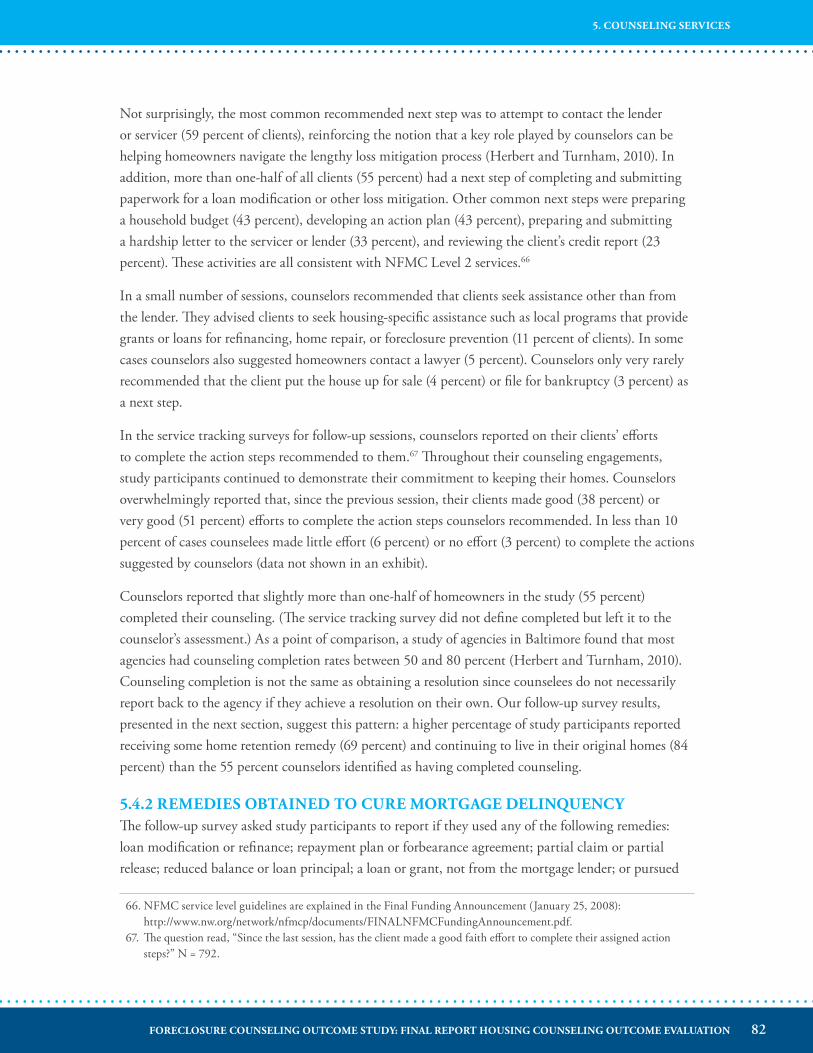
Not surprisingly, the most common recommended next step was to attempt to contact the lender or servicer (59 percent of clients), reinforcing the notion that a key role played by counselors can be helping homeowners navigate the lengthy loss mitigation process (Herbert and Turnham, 2010). In addition, more than one-half of all clients (55 percent) had a next step of completing and submitting paperwork for a loan modification or other loss mitigation. Other common next steps were preparing a household budget (43 percent), developing an action plan (43 percent), preparing and submitting a hardship letter to the servicer or lender (33 percent), and reviewing the client’s credit report (23 percent). These activities are all consistent with NFMC Level 2 services.66
In a small number of sessions, counselors recommended that clients seek assistance other than from the lender. They advised clients to seek housing-specific assistance such as local programs that provide grants or loans for refinancing, home repair, or foreclosure prevention (11 percent of clients). In some cases counselors also suggested homeowners contact a lawyer (5 percent). Counselors only very rarely recommended that the client put the house up for sale (4 percent) or file for bankruptcy (3 percent) as a next step.
In the service tracking surveys for follow-up sessions, counselors reported on their clients’ efforts to complete the action steps recommended to them.67 Throughout their counseling engagements, study participants continued to demonstrate their commitment to keeping their homes. Counselors overwhelmingly reported that, since the previous session, their clients made good (38 percent) or very good (51 percent) efforts to complete the action steps counselors recommended. In less than 10 percent of cases counselees made little effort (6 percent) or no effort (3 percent) to complete the actions suggested by counselors (data not shown in an exhibit).
Counselors reported that slightly more than one-half of homeowners in the study (55 percent) completed their counseling. (The service tracking survey did not define completed but left it to the counselor’s assessment.) As a point of comparison, a study of agencies in Baltimore found that most agencies had counseling completion rates between 50 and 80 percent (Herbert and Turnham, 2010). Counseling completion is not the same as obtaining a resolution since counselees do not necessarily report back to the agency if they achieve a resolution on their own. Our follow-up survey results, presented in the next section, suggest this pattern: a higher percentage of study participants reported receiving some home retention remedy (69 percent) and continuing to live in their original homes (84 percent) than the 55 percent counselors identified as having completed counseling.
5�4�2 REMEDIES OBTAINED TO CURE MORTGAGE DELINQUENCYThe follow-up survey asked study participants to report if they used any of the following remedies: loan modification or refinance; repayment plan or forbearance agreement; partial claim or partial release; reduced balance or loan principal; a loan or grant, not from the mortgage lender; or pursued
66. NFMC service level guidelines are explained in the Final Funding Announcement (January 25, 2008): http://www.nw.org/network/nfmcp/documents/FINALNFMCFundingAnnouncement.pdf.
67. The question read, “Since the last session, has the client made a good faith effort to complete their assigned action steps?” N = 792.
82FORECLOSURE COUNSELING OUTCOME STUDY: FINAL REPORT HOUSING COUNSELING OUTCOME EVALUATION
5. COUNSELING SERVICES
bankruptcy.68 Nearly one in three counselees (31 percent) did not receive any of these remedies. These homeowners may have obtained some other solution, been in ongoing negotiation with the lender, or have been moving to foreclosure at the time of the survey.69 As we discuss more fully in chapter 6, these homeowners were more often out of their homes at follow up than everyone except bankruptcy filers. Most homeowners in the study, however, did obtain at least one of the six remedies included in the follow-up survey (69 percent of clients).
Exhibit 5-17 shows how many homeowners obtained each remedy from the time of entering into housing counseling through the 18-month follow-up survey. The numbers in exhibit 5-17 sum to more than 100 percent because borrowers could obtain more than one remedy, which 41 percent of homeowners in the study did. For example, many pursued both bankruptcy as well as an approach directly related to the mortgage, and many pursued more than one mortgage-specific strategy. Clients’ pursuit of multiple remedies likely reflected both the complementary nature of some remedies, as well as uncertainty on the part of counselors and clients about which remedy was likely to succeed. For example, a client facing a temporary loss of income may require forbearance during the period with reduced income, followed by a modification once the client reestablishes a stable income stream. Chapter 6 discusses more fully the combination of remedies that counselees obtained.
Loan modification was the most common remedy that study participants obtained, reflecting the emphasis on modifications through both HAMP and lenders’ own loss mitigation programs: 39 percent of study participants received loan modifications. The follow-up survey asked homeowners what the term of the modified mortgage was; if it was fixed-rate, adjustable, interest-only, or another type of loan; and its interest rate. The survey did not ask specifically about HAMP because the survey was largely designed before HAMP; also, the study team thought that few respondents would know whether they had received a HAMP modification or a proprietary modification. At least some respondents described an “other type” of mortgage that seems to conform to the HAMP model: “Interest rate will adjust over 1 to 8 years, then go to permanent interest amount;” “for 5 years at 2 percent and keeps going up until balloon payment;” and “fixed rate for several years, then goes up gradually.” It is not clear how counselees in general would have categorized a HAMP modification when responding to the survey. Evidence suggests that modifications offered under different programs would respond to HAMP’s mandates to reduce payments (Mayer et al., 2011; Collins and Herbert, 2009).
68. Homeowners reported only on remedies they actually obtained; we do not, therefore, have information on denial rates for loan modifications, refinances, or other remedies they may have unsuccessfully pursued.
69. Those who received no remedy did not spend more time in counseling, however. Any ongoing negotiation would therefore be without the help of a counselor.
83FORECLOSURE COUNSELING OUTCOME STUDY: FINAL REPORT HOUSING COUNSELING OUTCOME EVALUATION
5. COUNSELING SERVICES
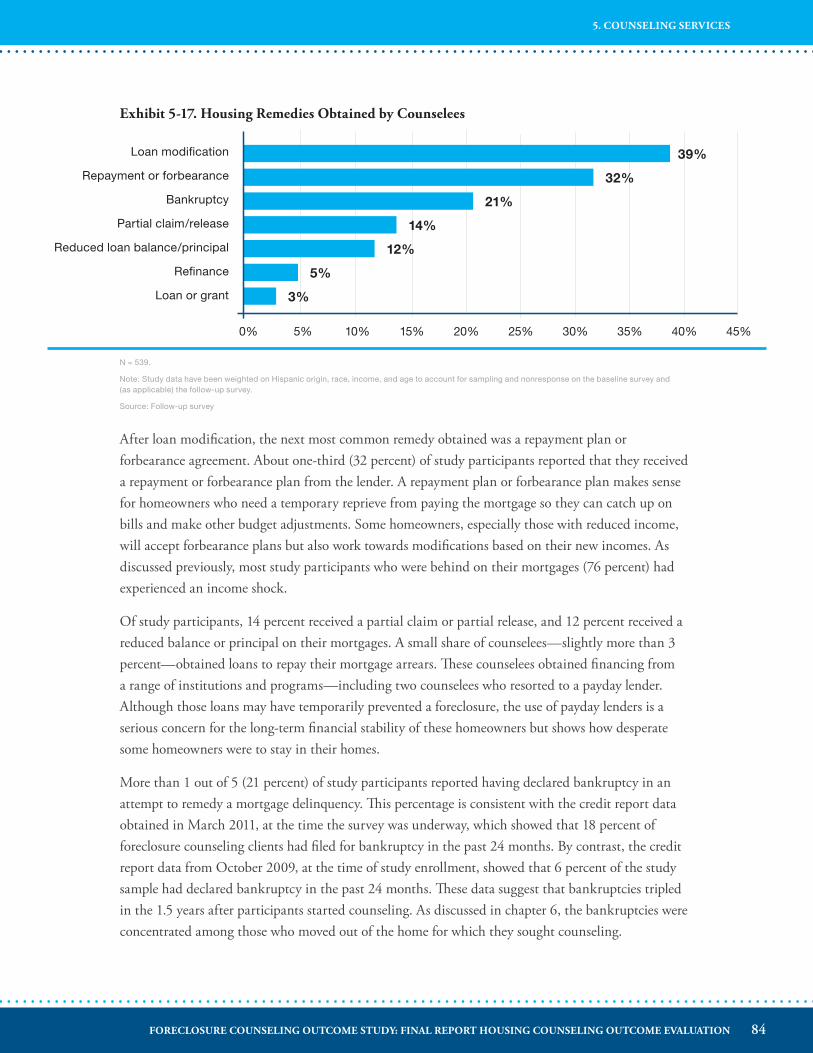
Exhibit 5-17� Housing Remedies Obtained by Counselees
After loan modification, the next most common remedy obtained was a repayment plan or forbearance agreement. About one-third (32 percent) of study participants reported that they received a repayment or forbearance plan from the lender. A repayment plan or forbearance plan makes sense for homeowners who need a temporary reprieve from paying the mortgage so they can catch up on bills and make other budget adjustments. Some homeowners, especially those with reduced income, will accept forbearance plans but also work towards modifications based on their new incomes. As discussed previously, most study participants who were behind on their mortgages (76 percent) had experienced an income shock.
Of study participants, 14 percent received a partial claim or partial release, and 12 percent received a reduced balance or principal on their mortgages. A small share of counselees—slightly more than 3 percent—obtained loans to repay their mortgage arrears. These counselees obtained financing from a range of institutions and programs—including two counselees who resorted to a payday lender. Although those loans may have temporarily prevented a foreclosure, the use of payday lenders is a serious concern for the long-term financial stability of these homeowners but shows how desperate some homeowners were to stay in their homes.
More than 1 out of 5 (21 percent) of study participants reported having declared bankruptcy in an attempt to remedy a mortgage delinquency. This percentage is consistent with the credit report data obtained in March 2011, at the time the survey was underway, which showed that 18 percent of foreclosure counseling clients had filed for bankruptcy in the past 24 months. By contrast, the credit report data from October 2009, at the time of study enrollment, showed that 6 percent of the study sample had declared bankruptcy in the past 24 months. These data suggest that bankruptcies tripled in the 1.5 years after participants started counseling. As discussed in chapter 6, the bankruptcies were concentrated among those who moved out of the home for which they sought counseling.
0% 5% 10% 15% 20% 25% 30% 35% 40% 45%
Loan modification
Repayment or forbearance
Bankruptcy
Partial claim/release
Reduced loan balance/principal
Refinance
Loan or grant
39%
32%
21%
14%
12%
5%
3%
N = 539.
Note: Study data have been weighted on Hispanic origin, race, income, and age to account for sampling and nonresponse on the baseline survey and (as applicable) the follow-up survey.
Source: Follow-up survey
84FORECLOSURE COUNSELING OUTCOME STUDY: FINAL REPORT HOUSING COUNSELING OUTCOME EVALUATION
5. COUNSELING SERVICES
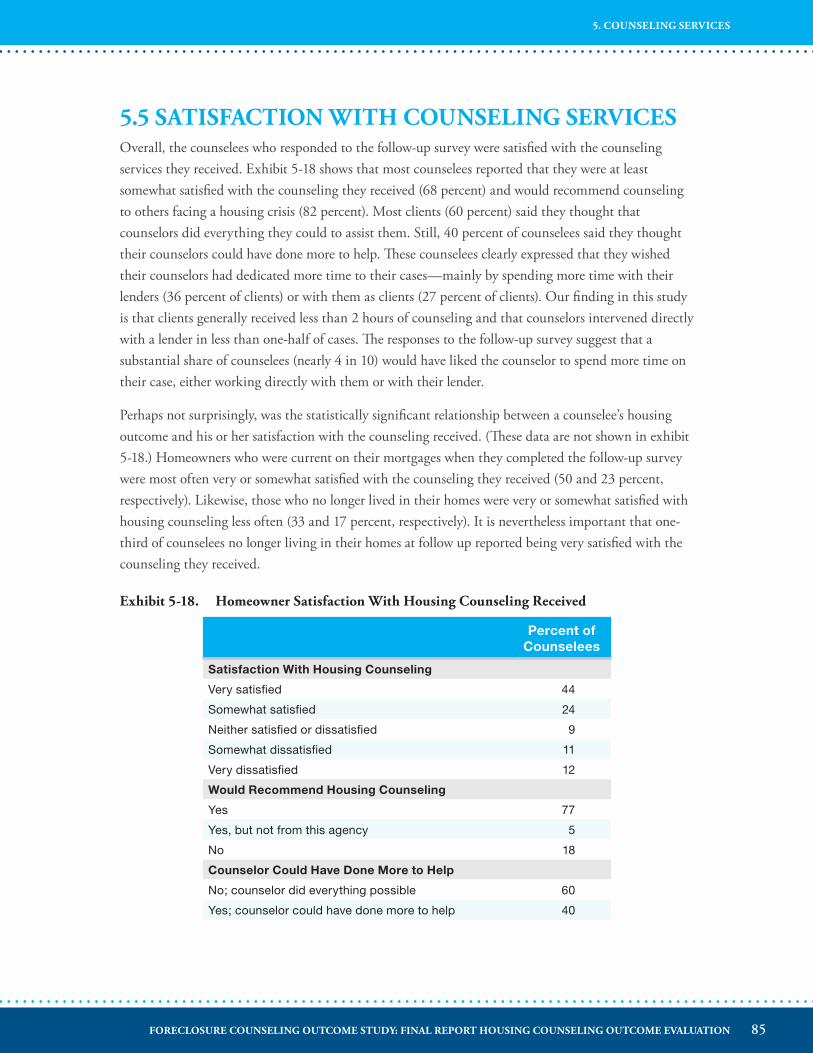
5�5 SATISFACTION WITH COUNSELING SERVICESOverall, the counselees who responded to the follow-up survey were satisfied with the counseling services they received. Exhibit 5-18 shows that most counselees reported that they were at least somewhat satisfied with the counseling they received (68 percent) and would recommend counseling to others facing a housing crisis (82 percent). Most clients (60 percent) said they thought that counselors did everything they could to assist them. Still, 40 percent of counselees said they thought their counselors could have done more to help. These counselees clearly expressed that they wished their counselors had dedicated more time to their cases—mainly by spending more time with their lenders (36 percent of clients) or with them as clients (27 percent of clients). Our finding in this study is that clients generally received less than 2 hours of counseling and that counselors intervened directly with a lender in less than one-half of cases. The responses to the follow-up survey suggest that a substantial share of counselees (nearly 4 in 10) would have liked the counselor to spend more time on their case, either working directly with them or with their lender.
Perhaps not surprisingly, was the statistically significant relationship between a counselee’s housing outcome and his or her satisfaction with the counseling received. (These data are not shown in exhibit 5-18.) Homeowners who were current on their mortgages when they completed the follow-up survey were most often very or somewhat satisfied with the counseling they received (50 and 23 percent, respectively). Likewise, those who no longer lived in their homes were very or somewhat satisfied with housing counseling less often (33 and 17 percent, respectively). It is nevertheless important that one-third of counselees no longer living in their homes at follow up reported being very satisfied with the counseling they received.
Exhibit 5-18� Homeowner Satisfaction With Housing Counseling Received
Percent of Counselees
Satisfaction With Housing Counseling
Very satisfied 44
Somewhat satisfied 24
Neither satisfied or dissatisfied 9
Somewhat dissatisfied 11
Very dissatisfied 12
Would Recommend Housing Counseling
Yes 77
Yes, but not from this agency 5
No 18
Counselor Could Have Done More to Help
No; counselor did everything possible 60
Yes; counselor could have done more to help 40
85FORECLOSURE COUNSELING OUTCOME STUDY: FINAL REPORT HOUSING COUNSELING OUTCOME EVALUATION
5. COUNSELING SERVICES
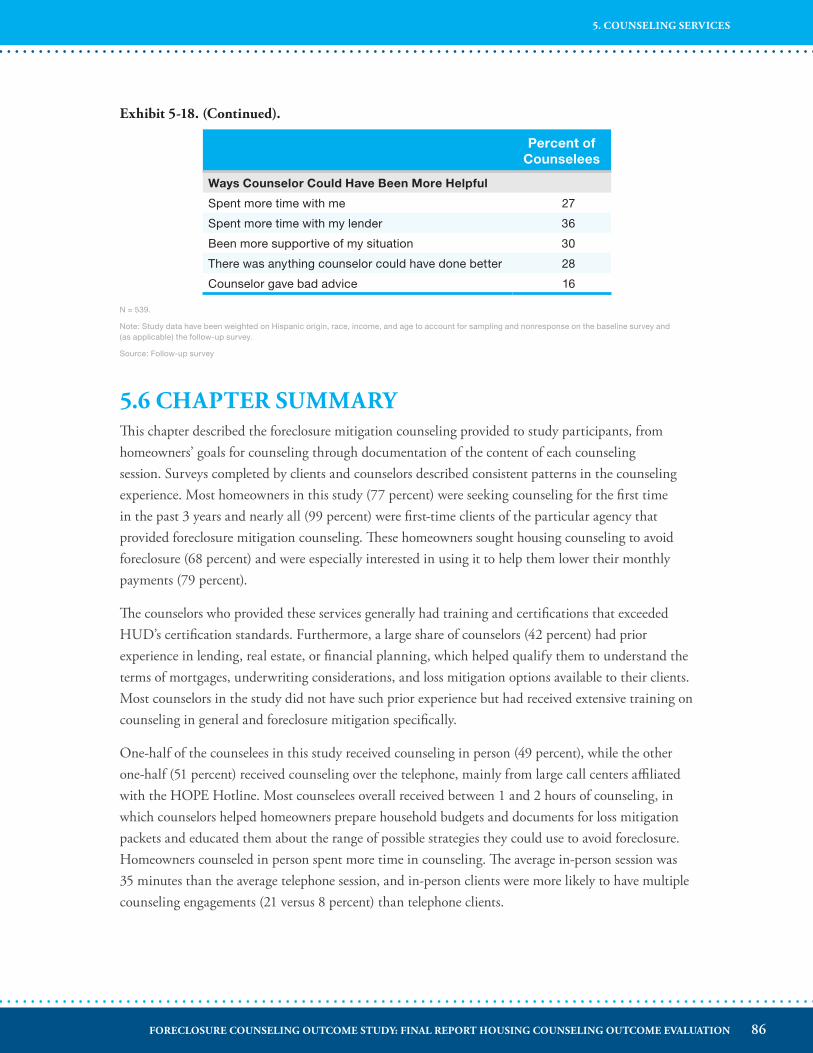
Percent of Counselees
Ways Counselor Could Have Been More Helpful
Spent more time with me 27
Spent more time with my lender 36
Been more supportive of my situation 30
There was anything counselor could have done better 28
Counselor gave bad advice 16
N = 539.
Note: Study data have been weighted on Hispanic origin, race, income, and age to account for sampling and nonresponse on the baseline survey and (as applicable) the follow-up survey.
Source: Follow-up survey
5�6 CHAPTER SUMMARYThis chapter described the foreclosure mitigation counseling provided to study participants, from homeowners’ goals for counseling through documentation of the content of each counseling session. Surveys completed by clients and counselors described consistent patterns in the counseling experience. Most homeowners in this study (77 percent) were seeking counseling for the first time in the past 3 years and nearly all (99 percent) were first-time clients of the particular agency that provided foreclosure mitigation counseling. These homeowners sought housing counseling to avoid foreclosure (68 percent) and were especially interested in using it to help them lower their monthly payments (79 percent).
The counselors who provided these services generally had training and certifications that exceeded HUD’s certification standards. Furthermore, a large share of counselors (42 percent) had prior experience in lending, real estate, or financial planning, which helped qualify them to understand the terms of mortgages, underwriting considerations, and loss mitigation options available to their clients. Most counselors in the study did not have such prior experience but had received extensive training on counseling in general and foreclosure mitigation specifically.
One-half of the counselees in this study received counseling in person (49 percent), while the other one-half (51 percent) received counseling over the telephone, mainly from large call centers affiliated with the HOPE Hotline. Most counselees overall received between 1 and 2 hours of counseling, in which counselors helped homeowners prepare household budgets and documents for loss mitigation packets and educated them about the range of possible strategies they could use to avoid foreclosure. Homeowners counseled in person spent more time in counseling. The average in-person session was 35 minutes than the average telephone session, and in-person clients were more likely to have multiple counseling engagements (21 versus 8 percent) than telephone clients.
Exhibit 5-18� (Continued)�
86FORECLOSURE COUNSELING OUTCOME STUDY: FINAL REPORT HOUSING COUNSELING OUTCOME EVALUATION
5. COUNSELING SERVICES
Within 18 months of seeking counseling, homeowners in the study had most often received temporary or permanent loan modifications (39 percent) and were also likely to have accepted a repayment or forbearance plan (32 percent). About 4 out of 10 clients (41 percent) pursued multiple home retention options. It is likely that clients did so because of uncertainty about the chance that any given remedy will succeed or because of the complementary nature of remedies. More than one in three study participants (31 percent) did not receive any of the six home retention options about which they were surveyed.
Overall, 68 percent of study participants reported being satisfied with the counseling received, although levels of satisfaction varied depending on a client’s ability to retain his or her home. About 40 percent of counselees said they wanted a higher level of involvement than their counselor provided.
87FORECLOSURE COUNSELING OUTCOME STUDY: FINAL REPORT HOUSING COUNSELING OUTCOME EVALUATION
5. COUNSELING SERVICES
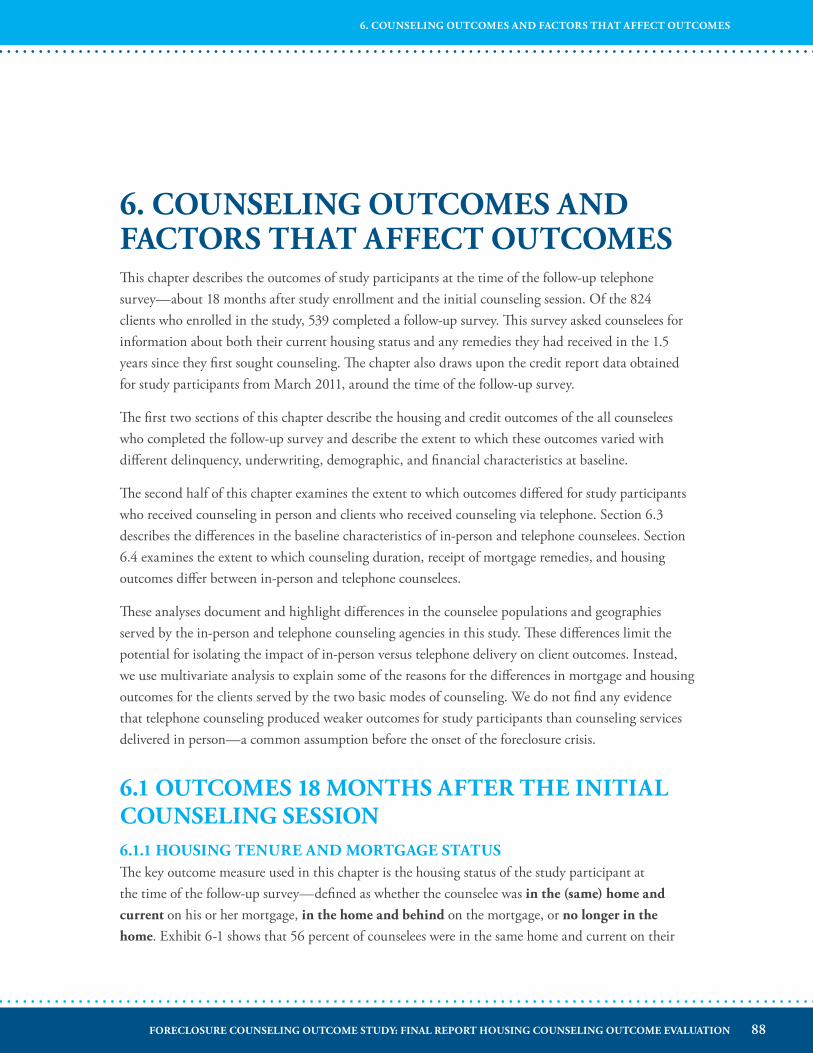
6� COUNSELING OUTCOMES AND FACTORS THAT AFFECT OUTCOMESThis chapter describes the outcomes of study participants at the time of the follow-up telephone survey—about 18 months after study enrollment and the initial counseling session. Of the 824 clients who enrolled in the study, 539 completed a follow-up survey. This survey asked counselees for information about both their current housing status and any remedies they had received in the 1.5 years since they first sought counseling. The chapter also draws upon the credit report data obtained for study participants from March 2011, around the time of the follow-up survey.
The first two sections of this chapter describe the housing and credit outcomes of the all counselees who completed the follow-up survey and describe the extent to which these outcomes varied with different delinquency, underwriting, demographic, and financial characteristics at baseline.
The second half of this chapter examines the extent to which outcomes differed for study participants who received counseling in person and clients who received counseling via telephone. Section 6.3 describes the differences in the baseline characteristics of in-person and telephone counselees. Section 6.4 examines the extent to which counseling duration, receipt of mortgage remedies, and housing outcomes differ between in-person and telephone counselees.
These analyses document and highlight differences in the counselee populations and geographies served by the in-person and telephone counseling agencies in this study. These differences limit the potential for isolating the impact of in-person versus telephone delivery on client outcomes. Instead, we use multivariate analysis to explain some of the reasons for the differences in mortgage and housing outcomes for the clients served by the two basic modes of counseling. We do not find any evidence that telephone counseling produced weaker outcomes for study participants than counseling services delivered in person—a common assumption before the onset of the foreclosure crisis.
6�1 OUTCOMES 18 MONTHS AFTER THE INITIAL COUNSELING SESSION6�1�1 HOUSING TENURE AND MORTGAGE STATUSThe key outcome measure used in this chapter is the housing status of the study participant at the time of the follow-up survey—defined as whether the counselee was in the (same) home and current on his or her mortgage, in the home and behind on the mortgage, or no longer in the home. Exhibit 6-1 shows that 56 percent of counselees were in the same home and current on their
88FORECLOSURE COUNSELING OUTCOME STUDY: FINAL REPORT HOUSING COUNSELING OUTCOME EVALUATION
6. COUNSELING OUTCOMES AND FACTORS THAT AFFECT OUTCOMES
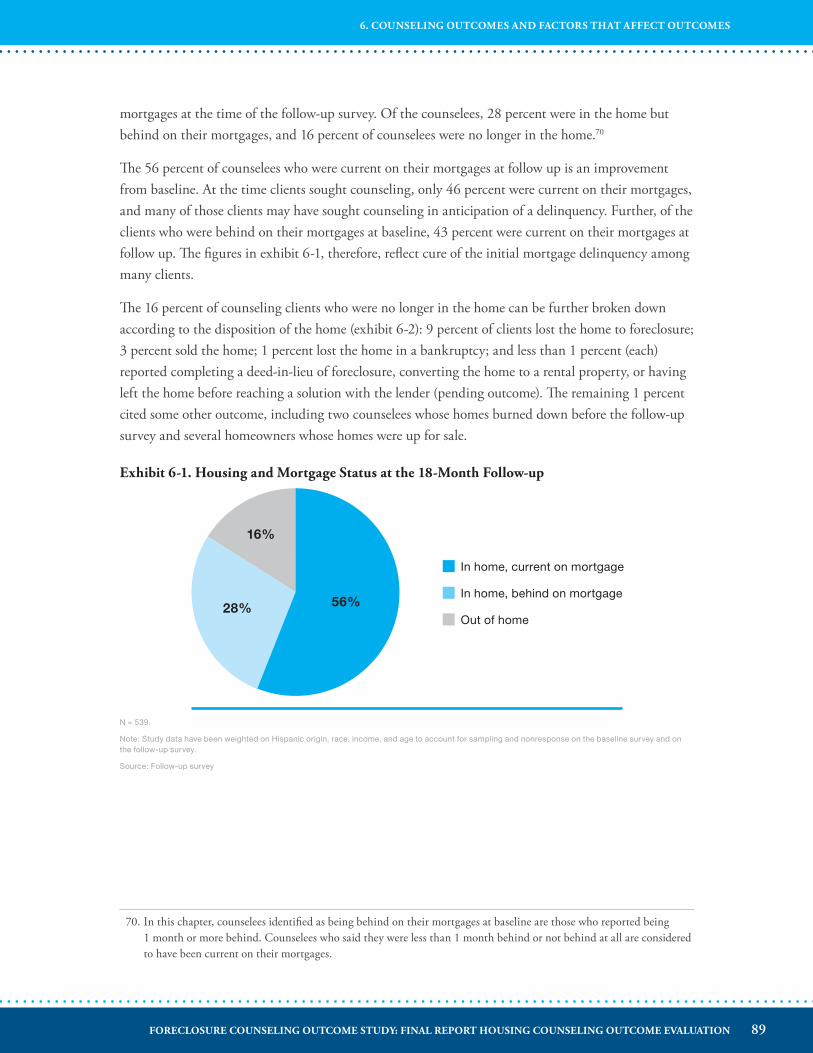
mortgages at the time of the follow-up survey. Of the counselees, 28 percent were in the home but behind on their mortgages, and 16 percent of counselees were no longer in the home.70
The 56 percent of counselees who were current on their mortgages at follow up is an improvement from baseline. At the time clients sought counseling, only 46 percent were current on their mortgages, and many of those clients may have sought counseling in anticipation of a delinquency. Further, of the clients who were behind on their mortgages at baseline, 43 percent were current on their mortgages at follow up. The figures in exhibit 6-1, therefore, reflect cure of the initial mortgage delinquency among many clients.
The 16 percent of counseling clients who were no longer in the home can be further broken down according to the disposition of the home (exhibit 6-2): 9 percent of clients lost the home to foreclosure; 3 percent sold the home; 1 percent lost the home in a bankruptcy; and less than 1 percent (each) reported completing a deed-in-lieu of foreclosure, converting the home to a rental property, or having left the home before reaching a solution with the lender (pending outcome). The remaining 1 percent cited some other outcome, including two counselees whose homes burned down before the follow-up survey and several homeowners whose homes were up for sale.
Exhibit 6-1� Housing and Mortgage Status at the 18-Month Follow-up
70. In this chapter, counselees identified as being behind on their mortgages at baseline are those who reported being 1 month or more behind. Counselees who said they were less than 1 month behind or not behind at all are considered to have been current on their mortgages.
56%28%
16%
In home, current on mortgage
In home, behind on mortgage
Out of home
N = 539.
Note: Study data have been weighted on Hispanic origin, race, income, and age to account for sampling and nonresponse on the baseline survey and on the follow-up survey.
Source: Follow-up survey
89FORECLOSURE COUNSELING OUTCOME STUDY: FINAL REPORT HOUSING COUNSELING OUTCOME EVALUATION
6. COUNSELING OUTCOMES AND FACTORS THAT AFFECT OUTCOMES
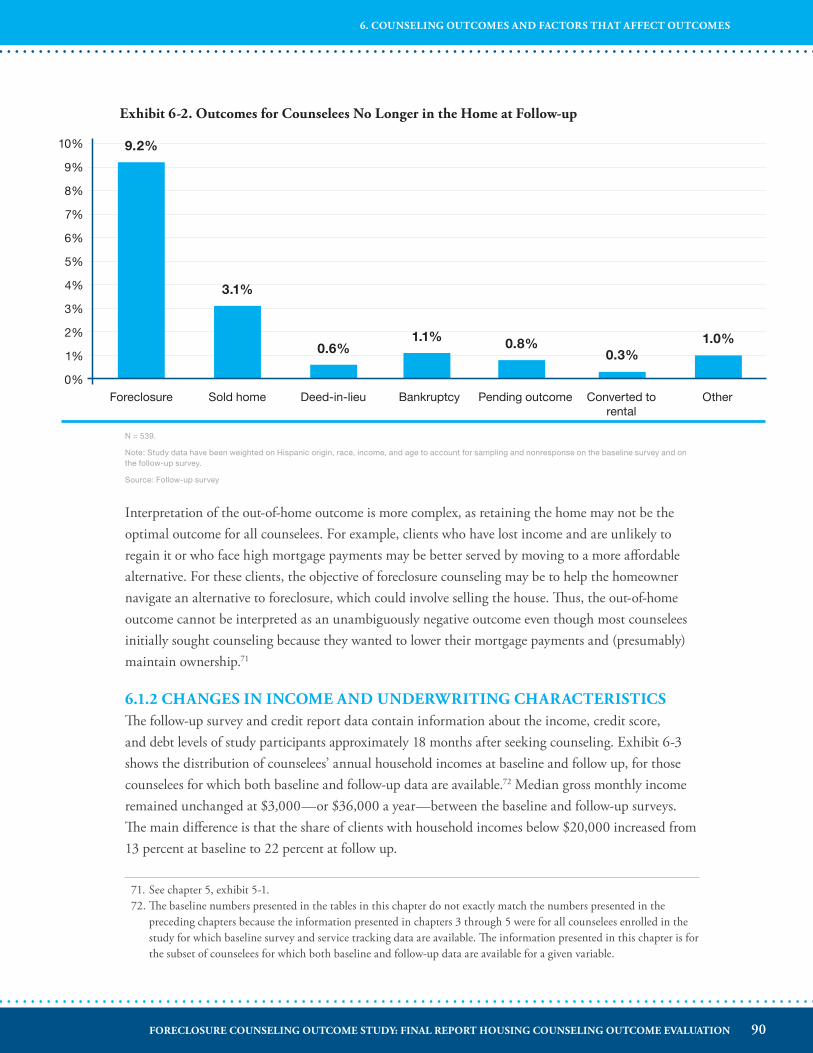
Exhibit 6-2� Outcomes for Counselees No Longer in the Home at Follow-up
Foreclosure Sold home Deed-in-lieu Bankruptcy Pending outcome Converted to rental
Other
10%
9%
8%
7%
6%
5%
4%
3%
2%
1%
0%
9.2%
3.1%
0.6%1.1% 0.8%
0.3%1.0%
Interpretation of the out-of-home outcome is more complex, as retaining the home may not be the optimal outcome for all counselees. For example, clients who have lost income and are unlikely to regain it or who face high mortgage payments may be better served by moving to a more affordable alternative. For these clients, the objective of foreclosure counseling may be to help the homeowner navigate an alternative to foreclosure, which could involve selling the house. Thus, the out-of-home outcome cannot be interpreted as an unambiguously negative outcome even though most counselees initially sought counseling because they wanted to lower their mortgage payments and (presumably) maintain ownership.71
6�1�2 CHANGES IN INCOME AND UNDERWRITING CHARACTERISTICSThe follow-up survey and credit report data contain information about the income, credit score, and debt levels of study participants approximately 18 months after seeking counseling. Exhibit 6-3 shows the distribution of counselees’ annual household incomes at baseline and follow up, for those counselees for which both baseline and follow-up data are available.72 Median gross monthly income remained unchanged at $3,000—or $36,000 a year—between the baseline and follow-up surveys. The main difference is that the share of clients with household incomes below $20,000 increased from 13 percent at baseline to 22 percent at follow up.
71. See chapter 5, exhibit 5-1.72. The baseline numbers presented in the tables in this chapter do not exactly match the numbers presented in the
preceding chapters because the information presented in chapters 3 through 5 were for all counselees enrolled in the study for which baseline survey and service tracking data are available. The information presented in this chapter is for the subset of counselees for which both baseline and follow-up data are available for a given variable.
N = 539.
Note: Study data have been weighted on Hispanic origin, race, income, and age to account for sampling and nonresponse on the baseline survey and on the follow-up survey.
Source: Follow-up survey
90FORECLOSURE COUNSELING OUTCOME STUDY: FINAL REPORT HOUSING COUNSELING OUTCOME EVALUATION
6. COUNSELING OUTCOMES AND FACTORS THAT AFFECT OUTCOMES
Exhibit 6-3� Comparison of Homeowner Incomes at Baseline and Follow-up
$0–19,999 $20,000–$39,999 $40,000–$59,999 $60,000–$99,999 $100,000 and above
45%
40%
35%
30%
25%
20%
15%
10%
5%
0%
Baseline income Follow-up income
22%
33%
38%
29%
16%
3%5%
14%
25%
13%
Exhibit 6-4 shows counselees’ median credit scores, mortgage payment amounts, and debt-to-income ratios at baseline and follow up. Median Fair Isaacs Corporation (FICO) scores for the overall sample improved modestly during this period, from 575 to 582. The increase occurred entirely among clients who remained in the home and cured their mortgage delinquencies, from 616 to 626. The median credit score of clients who stayed in the home but remained behind on the mortgage did not show any improvement, and the median credit score of clients who were out of the home decreased modestly from 563 to 557. In all cases, the median credit scores remained below the levels currently required to qualify for prime or Federal Housing Administration credit on a new purchase mortgage.
Counselees’ monthly mortgage payments and front-end debt ratios decreased between baseline and follow up. These decreases likely reflect the presence of mortgage modifications, decreasing interest rates on adjustable-rate mortgage (ARM) loans, and homeownership exit. The decrease was most pronounced among clients who were out of the home at follow up, because these clients no longer had a mortgage payment. Counselees who remained in their homes also saw their mortgage payments decrease, however. The median monthly payment for counselees who were current at follow up decreased from $1,404 to $1,089—a decrease of 22 percent. The median monthly payment for clients who were in the home but behind on their mortgage decreased from $1,436 to $1,354—a decrease of 6 percent.
Back-end debt ratios showed further decreases, suggesting that many counselees reduced both their monthly mortgage payment and their other consumer debt obligations.73 Among counseling clients
73. In their analysis of NFMC, Mayer et al. (2011) find that the budgeting and money management aspects of housing counseling are responsible for most of the success that counselees have with sustaining mortgage cures.
N = 465.
Note: Study data have been weighted on Hispanic origin, race, income, and age to account for sampling and nonresponse on the baseline survey and on the follow-up survey.
Source: Baseline survey and follow-up survey
91FORECLOSURE COUNSELING OUTCOME STUDY: FINAL REPORT HOUSING COUNSELING OUTCOME EVALUATION
6. COUNSELING OUTCOMES AND FACTORS THAT AFFECT OUTCOMES
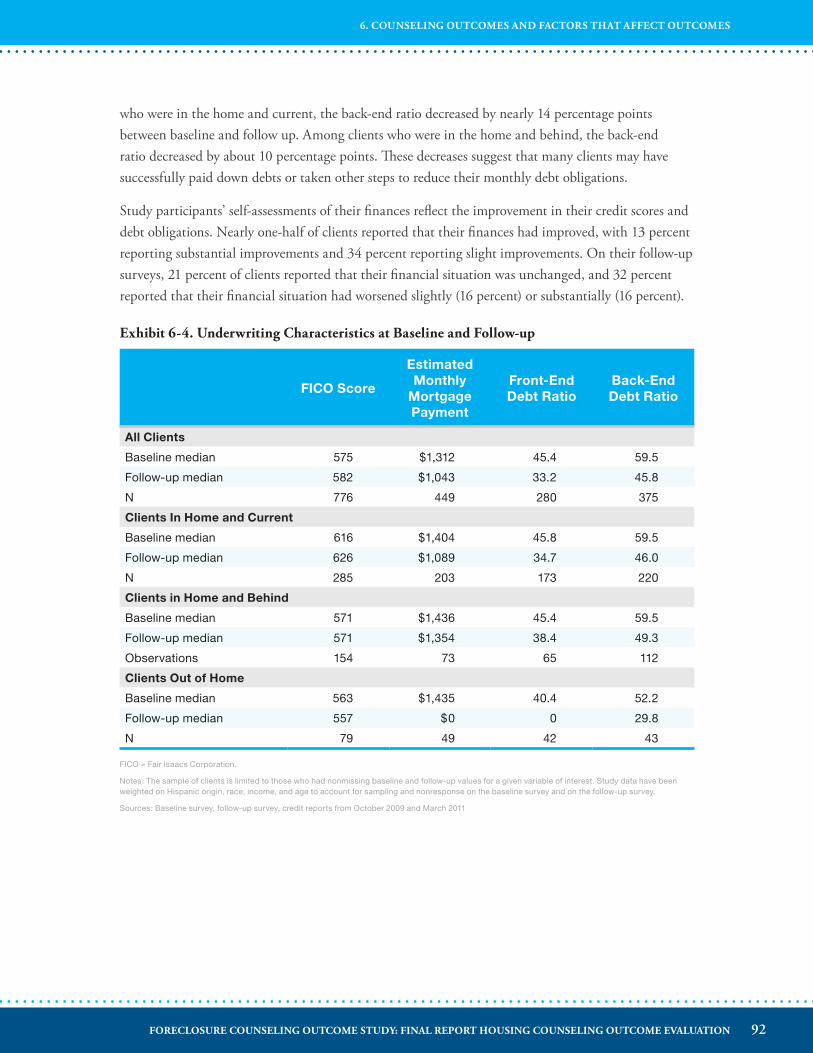
who were in the home and current, the back-end ratio decreased by nearly 14 percentage points between baseline and follow up. Among clients who were in the home and behind, the back-end ratio decreased by about 10 percentage points. These decreases suggest that many clients may have successfully paid down debts or taken other steps to reduce their monthly debt obligations.
Study participants’ self-assessments of their finances reflect the improvement in their credit scores and debt obligations. Nearly one-half of clients reported that their finances had improved, with 13 percent reporting substantial improvements and 34 percent reporting slight improvements. On their follow-up surveys, 21 percent of clients reported that their financial situation was unchanged, and 32 percent reported that their financial situation had worsened slightly (16 percent) or substantially (16 percent).
Exhibit 6-4� Underwriting Characteristics at Baseline and Follow-up
FICO Score
Estimated Monthly
Mortgage Payment
Front-End Debt Ratio
Back-End Debt Ratio
All Clients
Baseline median 575 $1,312 45.4 59.5
Follow-up median 582 $1,043 33.2 45.8
N 776 449 280 375
Clients In Home and Current
Baseline median 616 $1,404 45.8 59.5
Follow-up median 626 $1,089 34.7 46.0
N 285 203 173 220
Clients in Home and Behind
Baseline median 571 $1,436 45.4 59.5
Follow-up median 571 $1,354 38.4 49.3
Observations 154 73 65 112
Clients Out of Home
Baseline median 563 $1,435 40.4 52.2
Follow-up median 557 $0 0 29.8
N 79 49 42 43
FICO = Fair Isaacs Corporation.
Notes: The sample of clients is limited to those who had nonmissing baseline and follow-up values for a given variable of interest. Study data have been weighted on Hispanic origin, race, income, and age to account for sampling and nonresponse on the baseline survey and on the follow-up survey.
Sources: Baseline survey, follow-up survey, credit reports from October 2009 and March 2011
92FORECLOSURE COUNSELING OUTCOME STUDY: FINAL REPORT HOUSING COUNSELING OUTCOME EVALUATION
6. COUNSELING OUTCOMES AND FACTORS THAT AFFECT OUTCOMES
6�2 HOUSING OUTCOMES AND HOMEOWNER CHARACTERISTICSThis section provides detailed descriptive information about the characteristics of study participants in each housing outcome category. Exhibits 6-5 and 6-6 present the characteristics of clients who at follow up were in the home and current on their mortgages, in the home and behind on their mortgages, and no longer in the same home. Exhibit 6-5 shows the extent to which clients with different housing outcomes at follow up were delinquent at baseline, their reasons for delinquency, and their underwriting and loan characteristics. Exhibit 6-6 then shows the baseline demographic and financial characteristics of clients with different housing outcomes. Exhibits 6-7 and 6-8 supplement this information by documenting the housing outcomes exhibited by subsamples of counselees defined by their baseline characteristics.
Four key findings emerge from these four exhibits. First, housing outcomes for study participants were closely related to whether the client was delinquent at the time he or she sought counseling� Exhibit 6-7 shows that, of clients who sought counseling before becoming delinquent, nearly 70 percent were in the home and current at follow up, and only 8 percent were not in the same home. In contrast, 30 percent of clients who were 6 or more months behind at the time they entered counseling were in the home and current at follow up—and 32 percent were out of the home. Exhibit 6-9 presents this information visually.
Homeowners who seek counseling before becoming delinquent may be more organized or motivated in general, so the better outcome observed for study participants who entered counseling early must be interpreted as an association not a causal relationship. Nonetheless, it is suggestive that early counseling intervention may improve client outcomes.
A second finding from the descriptive tables is that study participants’ underwriting characteristics at baseline were also associated with different housing outcomes� Among counselees who were in the home and current at follow up, the average baseline credit score was 622 compared with 582 for counselees who were in the home and behind and 570 for counselees who were not in the same home (exhibit 6-5). Although higher baseline credit scores may mean that counselees had more options for refinancing or modifying the loan, the higher baseline credit scores may simply reflect the lower levels of baseline delinquency among counselees who were in the home and current.
We did not find large differences in the reasons for delinquency among study participants with different housing outcomes� Although exhibit 6-5 shows small differences in the reasons for delinquency, the differences are not statistically significant. Instead, approximately three-fourths of the delinquent clients in each outcome category reported a reason for delinquency related to income loss.
Exhibit 6-7 shows the housing outcomes for the set of delinquent clients who cited each type of reason for becoming delinquent. Approximately 55 percent of clients who cited housing expenses as a reason for delinquency, and 53 percent of clients who did not provide a reason for the delinquency, were in
93FORECLOSURE COUNSELING OUTCOME STUDY: FINAL REPORT HOUSING COUNSELING OUTCOME EVALUATION
6. COUNSELING OUTCOMES AND FACTORS THAT AFFECT OUTCOMES
the home and current at follow up. By contrast, only 44 percent of clients who cited reasons related to income loss or nonhousing expenses were in the home and current, and more than 20 percent were not in the same home at follow up. This pattern in housing outcomes may suggest that counseling and mortgage remedies are more able to assist clients with issues related to housing expenses. Unemployment and nonhousing debt may be more difficult to address through housing counseling.
A surprising finding in exhibit 6-7 is that study participants with lower baseline front-end and back-end debt ratios were less likely to cure their mortgages. Whereas lower debt-to-income ratios imply lower risk of default, this finding suggests that clients with lower debt burdens may be less able to recover once a delinquency has occurred. Only 52 percent of clients with baseline front-end ratios below 31 percent were in the home and current at follow up, whereas 62 percent of clients with higher front-end ratios were in the home and current. Similarly, only 45 percent of clients with baseline back-end ratios below 36 percent were in the home and current at follow up compared with 58 percent among clients with higher back-end ratios. In the regression analysis presented later in this chapter, however, we find no statistically significant relationship between debt ratios and housing outcomes while controlling for other observable client characteristics.
Counselees’ demographic and financial characteristics were not strongly associated with housing outcomes� The figures in exhibit 6-6 and 6-8 show a few significant differences in client characteristics. The differences are not consistent with systematic differences in housing outcomes across demographic groups. For example, strong patterns do not exist in housing outcomes by income, age, gender, marital status, race, or ethnicity. The differences shown in exhibit 6-6 and exhibit 6-8 tend to be small and affect groups that represent a small share of the overall sample. First, we found that counselees with 4-year college degrees were more likely to stay in the home than counselees with less formal education. Only 8 percent of counselees with a 4-year college degree were not in the same home at follow up compared with 16 percent for the sample as a whole. Widowed clients may be more vulnerable to losing their homes than other clients, and this is not associated with age, because older clients are more likely to still be in the home at follow up. At follow up, 29 percent of widowed clients were no longer in the home compared with 16 percent of married clients. Finally, counselees with more than $5,000 in savings at baseline were more frequently in the home and current at baseline.
94FORECLOSURE COUNSELING OUTCOME STUDY: FINAL REPORT HOUSING COUNSELING OUTCOME EVALUATION
6. COUNSELING OUTCOMES AND FACTORS THAT AFFECT OUTCOMES
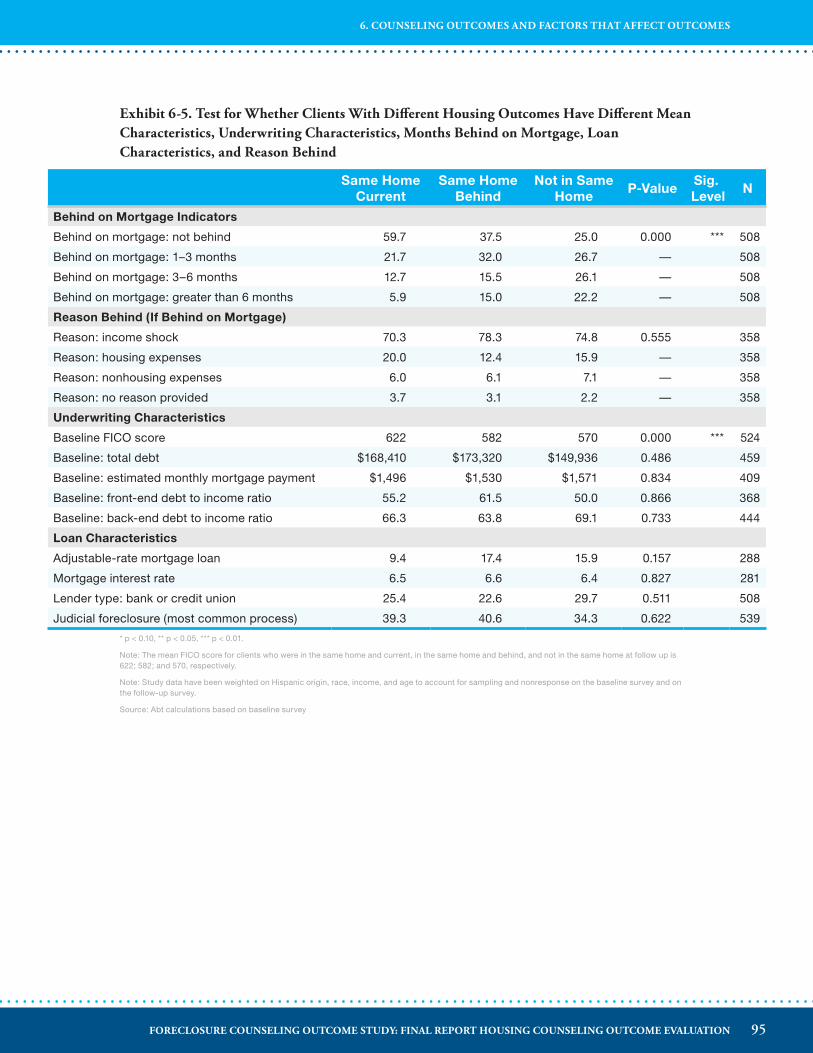
Same Home Current
Same Home Behind
Not in Same Home
P-ValueSig.
LevelN
Behind on Mortgage Indicators
Behind on mortgage: not behind 59.7 37.5 25.0 0.000 *** 508
Behind on mortgage: 1–3 months 21.7 32.0 26.7 — 508
Behind on mortgage: 3–6 months 12.7 15.5 26.1 — 508
Behind on mortgage: greater than 6 months 5.9 15.0 22.2 — 508
Reason Behind (If Behind on Mortgage)
Reason: income shock 70.3 78.3 74.8 0.555 358
Reason: housing expenses 20.0 12.4 15.9 — 358
Reason: nonhousing expenses 6.0 6.1 7.1 — 358
Reason: no reason provided 3.7 3.1 2.2 — 358
Underwriting Characteristics
Baseline FICO score 622 582 570 0.000 *** 524
Baseline: total debt $168,410 $173,320 $149,936 0.486 459
Baseline: estimated monthly mortgage payment $1,496 $1,530 $1,571 0.834 409
Baseline: front-end debt to income ratio 55.2 61.5 50.0 0.866 368
Baseline: back-end debt to income ratio 66.3 63.8 69.1 0.733 444
Loan Characteristics
Adjustable-rate mortgage loan 9.4 17.4 15.9 0.157 288
Mortgage interest rate 6.5 6.6 6.4 0.827 281
Lender type: bank or credit union 25.4 22.6 29.7 0.511 508
Judicial foreclosure (most common process) 39.3 40.6 34.3 0.622 539
* p < 0.10, ** p < 0.05, *** p < 0.01.
Note: The mean FICO score for clients who were in the same home and current, in the same home and behind, and not in the same home at follow up is 622; 582; and 570, respectively.
Note: Study data have been weighted on Hispanic origin, race, income, and age to account for sampling and nonresponse on the baseline survey and on the follow-up survey.
Source: Abt calculations based on baseline survey
Exhibit 6-5� Test for Whether Clients With Different Housing Outcomes Have Different Mean Characteristics, Underwriting Characteristics, Months Behind on Mortgage, Loan Characteristics, and Reason Behind
95FORECLOSURE COUNSELING OUTCOME STUDY: FINAL REPORT HOUSING COUNSELING OUTCOME EVALUATION
6. COUNSELING OUTCOMES AND FACTORS THAT AFFECT OUTCOMES
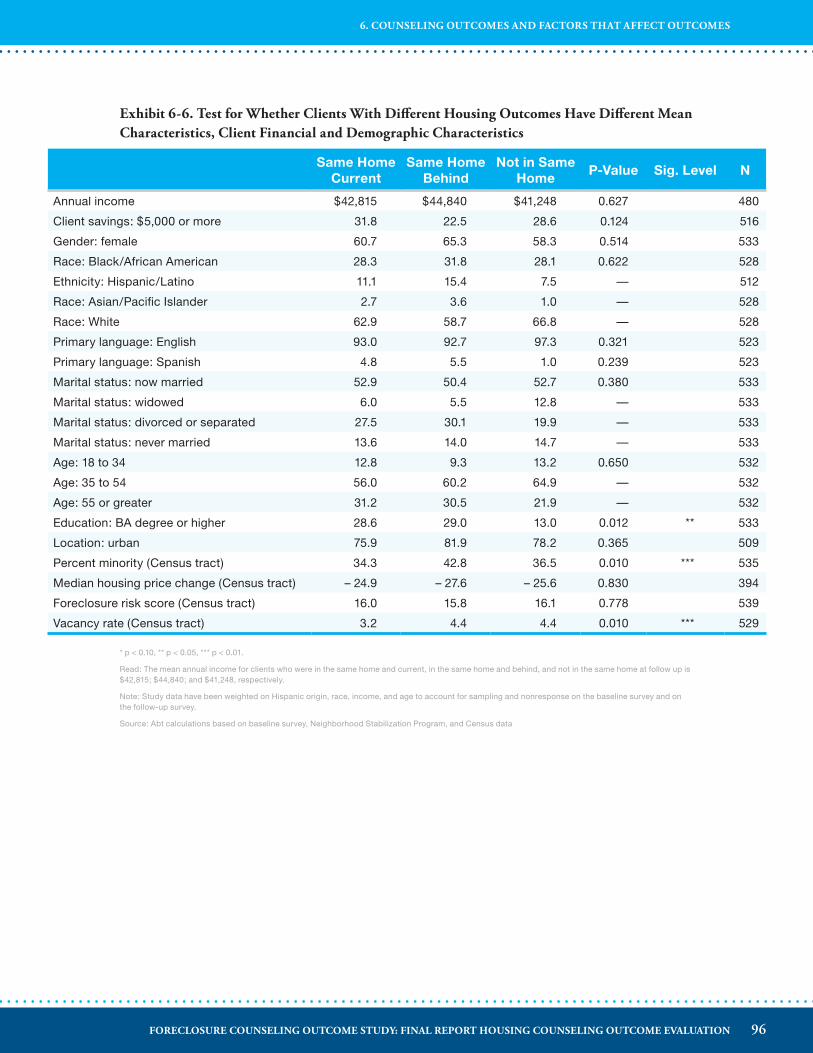
Exhibit 6-6� Test for Whether Clients With Different Housing Outcomes Have Different Mean Characteristics, Client Financial and Demographic Characteristics
Same Home Current
Same Home Behind
Not in Same Home
P-Value Sig. Level N
Annual income $42,815 $44,840 $41,248 0.627 480
Client savings: $5,000 or more 31.8 22.5 28.6 0.124 516
Gender: female 60.7 65.3 58.3 0.514 533
Race: Black/African American 28.3 31.8 28.1 0.622 528
Ethnicity: Hispanic/Latino 11.1 15.4 7.5 — 512
Race: Asian/Pacific Islander 2.7 3.6 1.0 — 528
Race: White 62.9 58.7 66.8 — 528
Primary language: English 93.0 92.7 97.3 0.321 523
Primary language: Spanish 4.8 5.5 1.0 0.239 523
Marital status: now married 52.9 50.4 52.7 0.380 533
Marital status: widowed 6.0 5.5 12.8 — 533
Marital status: divorced or separated 27.5 30.1 19.9 — 533
Marital status: never married 13.6 14.0 14.7 — 533
Age: 18 to 34 12.8 9.3 13.2 0.650 532
Age: 35 to 54 56.0 60.2 64.9 — 532
Age: 55 or greater 31.2 30.5 21.9 — 532
Education: BA degree or higher 28.6 29.0 13.0 0.012 ** 533
Location: urban 75.9 81.9 78.2 0.365 509
Percent minority (Census tract) 34.3 42.8 36.5 0.010 *** 535
Median housing price change (Census tract) – 24.9 – 27.6 – 25.6 0.830 394
Foreclosure risk score (Census tract) 16.0 15.8 16.1 0.778 539
Vacancy rate (Census tract) 3.2 4.4 4.4 0.010 *** 529
* p < 0.10, ** p < 0.05, *** p < 0.01.
Read: The mean annual income for clients who were in the same home and current, in the same home and behind, and not in the same home at follow up is $42,815; $44,840; and $41,248, respectively.
Note: Study data have been weighted on Hispanic origin, race, income, and age to account for sampling and nonresponse on the baseline survey and on the follow-up survey.
Source: Abt calculations based on baseline survey, Neighborhood Stabilization Program, and Census data
96FORECLOSURE COUNSELING OUTCOME STUDY: FINAL REPORT HOUSING COUNSELING OUTCOME EVALUATION
6. COUNSELING OUTCOMES AND FACTORS THAT AFFECT OUTCOMES
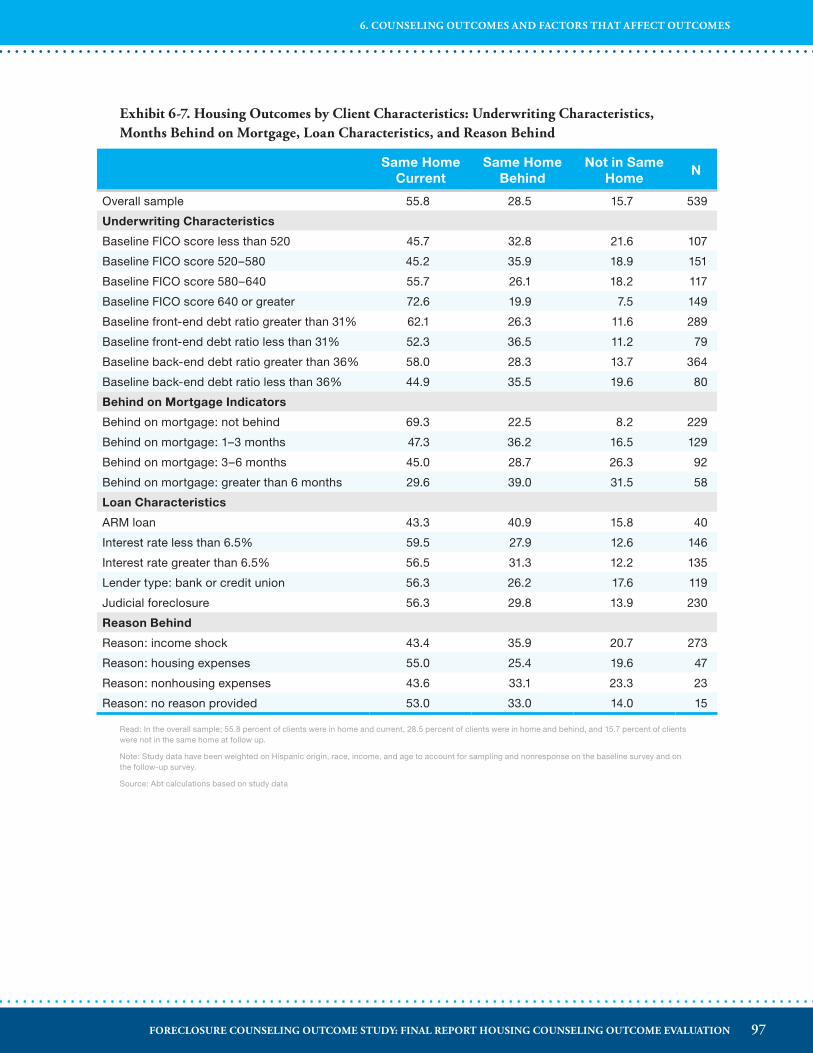
Exhibit 6-7� Housing Outcomes by Client Characteristics: Underwriting Characteristics, Months Behind on Mortgage, Loan Characteristics, and Reason Behind
Same Home Current
Same Home Behind
Not in Same Home
N
Overall sample 55.8 28.5 15.7 539
Underwriting Characteristics
Baseline FICO score less than 520 45.7 32.8 21.6 107
Baseline FICO score 520–580 45.2 35.9 18.9 151
Baseline FICO score 580–640 55.7 26.1 18.2 117
Baseline FICO score 640 or greater 72.6 19.9 7.5 149
Baseline front-end debt ratio greater than 31% 62.1 26.3 11.6 289
Baseline front-end debt ratio less than 31% 52.3 36.5 11.2 79
Baseline back-end debt ratio greater than 36% 58.0 28.3 13.7 364
Baseline back-end debt ratio less than 36% 44.9 35.5 19.6 80
Behind on Mortgage Indicators
Behind on mortgage: not behind 69.3 22.5 8.2 229
Behind on mortgage: 1–3 months 47.3 36.2 16.5 129
Behind on mortgage: 3–6 months 45.0 28.7 26.3 92
Behind on mortgage: greater than 6 months 29.6 39.0 31.5 58
Loan Characteristics
ARM loan 43.3 40.9 15.8 40
Interest rate less than 6.5% 59.5 27.9 12.6 146
Interest rate greater than 6.5% 56.5 31.3 12.2 135
Lender type: bank or credit union 56.3 26.2 17.6 119
Judicial foreclosure 56.3 29.8 13.9 230
Reason Behind
Reason: income shock 43.4 35.9 20.7 273
Reason: housing expenses 55.0 25.4 19.6 47
Reason: nonhousing expenses 43.6 33.1 23.3 23
Reason: no reason provided 53.0 33.0 14.0 15
Read: In the overall sample; 55.8 percent of clients were in home and current, 28.5 percent of clients were in home and behind, and 15.7 percent of clients were not in the same home at follow up.
Note: Study data have been weighted on Hispanic origin, race, income, and age to account for sampling and nonresponse on the baseline survey and on the follow-up survey.
Source: Abt calculations based on study data
97FORECLOSURE COUNSELING OUTCOME STUDY: FINAL REPORT HOUSING COUNSELING OUTCOME EVALUATION
6. COUNSELING OUTCOMES AND FACTORS THAT AFFECT OUTCOMES
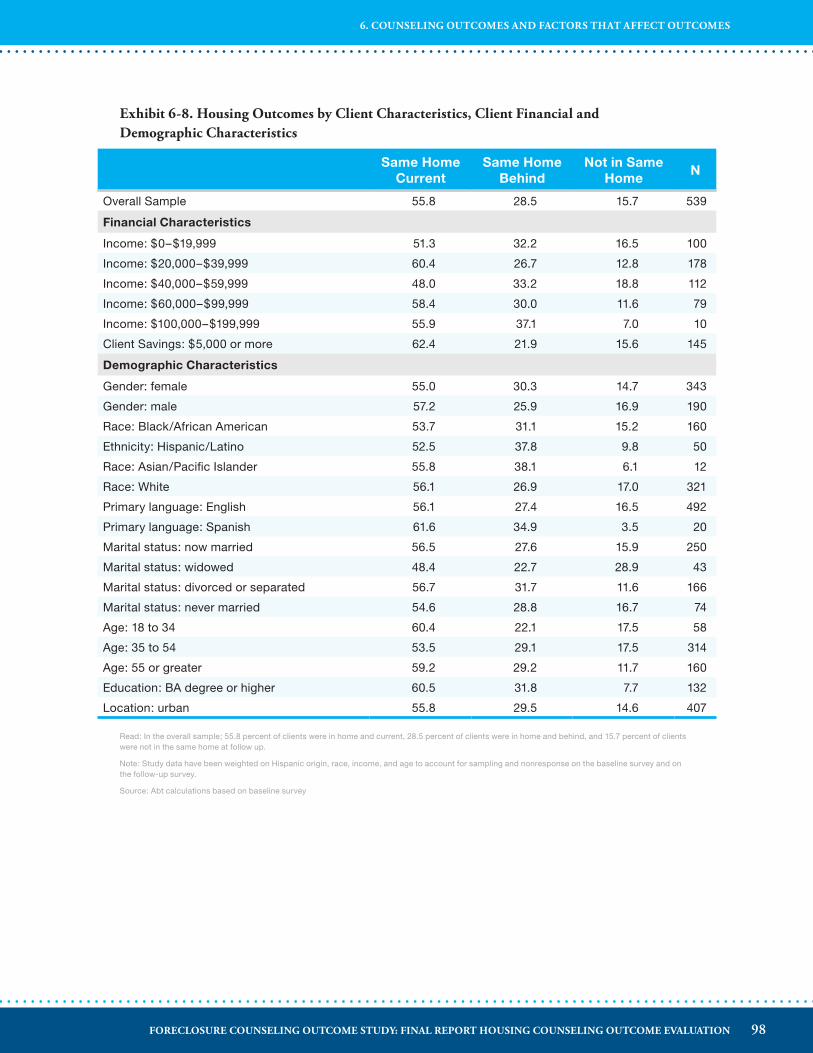
Exhibit 6-8� Housing Outcomes by Client Characteristics, Client Financial and Demographic Characteristics
Same Home Current
Same Home Behind
Not in Same Home
N
Overall Sample 55.8 28.5 15.7 539
Financial Characteristics
Income: $0–$19,999 51.3 32.2 16.5 100
Income: $20,000–$39,999 60.4 26.7 12.8 178
Income: $40,000–$59,999 48.0 33.2 18.8 112
Income: $60,000–$99,999 58.4 30.0 11.6 79
Income: $100,000–$199,999 55.9 37.1 7.0 10
Client Savings: $5,000 or more 62.4 21.9 15.6 145
Demographic Characteristics
Gender: female 55.0 30.3 14.7 343
Gender: male 57.2 25.9 16.9 190
Race: Black/African American 53.7 31.1 15.2 160
Ethnicity: Hispanic/Latino 52.5 37.8 9.8 50
Race: Asian/Pacific Islander 55.8 38.1 6.1 12
Race: White 56.1 26.9 17.0 321
Primary language: English 56.1 27.4 16.5 492
Primary language: Spanish 61.6 34.9 3.5 20
Marital status: now married 56.5 27.6 15.9 250
Marital status: widowed 48.4 22.7 28.9 43
Marital status: divorced or separated 56.7 31.7 11.6 166
Marital status: never married 54.6 28.8 16.7 74
Age: 18 to 34 60.4 22.1 17.5 58
Age: 35 to 54 53.5 29.1 17.5 314
Age: 55 or greater 59.2 29.2 11.7 160
Education: BA degree or higher 60.5 31.8 7.7 132
Location: urban 55.8 29.5 14.6 407
Read: In the overall sample; 55.8 percent of clients were in home and current, 28.5 percent of clients were in home and behind, and 15.7 percent of clients were not in the same home at follow up.
Note: Study data have been weighted on Hispanic origin, race, income, and age to account for sampling and nonresponse on the baseline survey and on the follow-up survey.
Source: Abt calculations based on baseline survey
98FORECLOSURE COUNSELING OUTCOME STUDY: FINAL REPORT HOUSING COUNSELING OUTCOME EVALUATION
6. COUNSELING OUTCOMES AND FACTORS THAT AFFECT OUTCOMES
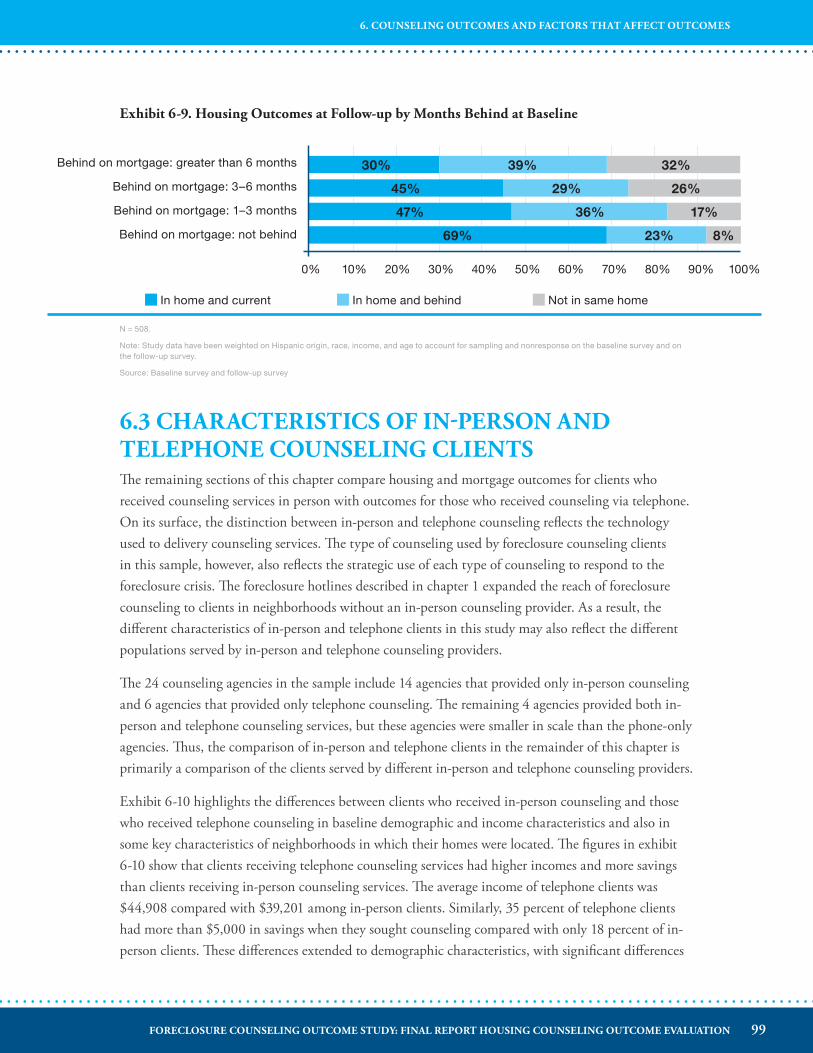
Exhibit 6-9� Housing Outcomes at Follow-up by Months Behind at Baseline
0% 10% 20% 30% 40% 50% 60% 70% 80% 90% 100%
Behind on mortgage: greater than 6 months
Behind on mortgage: 3–6 months
Behind on mortgage: 1–3 months
Behind on mortgage: not behind
30% 39% 32%
45% 29% 26%
47% 36% 17%
69% 23% 8%
In home and current In home and behind Not in same home
N = 508.
Note: Study data have been weighted on Hispanic origin, race, income, and age to account for sampling and nonresponse on the baseline survey and on the follow-up survey.
Source: Baseline survey and follow-up survey
6�3 CHARACTERISTICS OF IN-PERSON AND TELEPHONE COUNSELING CLIENTSThe remaining sections of this chapter compare housing and mortgage outcomes for clients who received counseling services in person with outcomes for those who received counseling via telephone. On its surface, the distinction between in-person and telephone counseling reflects the technology used to delivery counseling services. The type of counseling used by foreclosure counseling clients in this sample, however, also reflects the strategic use of each type of counseling to respond to the foreclosure crisis. The foreclosure hotlines described in chapter 1 expanded the reach of foreclosure counseling to clients in neighborhoods without an in-person counseling provider. As a result, the different characteristics of in-person and telephone clients in this study may also reflect the different populations served by in-person and telephone counseling providers.
The 24 counseling agencies in the sample include 14 agencies that provided only in-person counseling and 6 agencies that provided only telephone counseling. The remaining 4 agencies provided both in-person and telephone counseling services, but these agencies were smaller in scale than the phone-only agencies. Thus, the comparison of in-person and telephone clients in the remainder of this chapter is primarily a comparison of the clients served by different in-person and telephone counseling providers.
Exhibit 6-10 highlights the differences between clients who received in-person counseling and those who received telephone counseling in baseline demographic and income characteristics and also in some key characteristics of neighborhoods in which their homes were located. The figures in exhibit 6-10 show that clients receiving telephone counseling services had higher incomes and more savings than clients receiving in-person counseling services. The average income of telephone clients was $44,908 compared with $39,201 among in-person clients. Similarly, 35 percent of telephone clients had more than $5,000 in savings when they sought counseling compared with only 18 percent of in-person clients. These differences extended to demographic characteristics, with significant differences
99FORECLOSURE COUNSELING OUTCOME STUDY: FINAL REPORT HOUSING COUNSELING OUTCOME EVALUATION
6. COUNSELING OUTCOMES AND FACTORS THAT AFFECT OUTCOMES
in clients’ age, marital status, race, and ethnicity. Telephone clients were somewhat older and more likely to be married. Whereas in-person clients included a roughly the same proportion of African American clients (42 percent) and White clients (47 percent), telephone counseling clients were disproportionately White (73 percent).
The differences between in-person and telephone clients also included differences in neighborhood characteristics and local housing markets. Telephone clients were somewhat less likely to be in urban locations, and the average percent minority in their Census tracts was lower, 33 versus 43 percent. These attributes may reflect differences in the geographies served by in-person and telephone counseling agencies. For example, 23 percent of in-person clients are in Michigan and Ohio compared with 10 percent of telephone clients. In contrast, 31 percent of telephone clients are in Arizona, California, Florida, and Nevada compared with 14 percent of in-person clients.
Exhibit 6-11 compares telephone and in-person clients’ underwriting, loan, and delinquency characteristics at the time of the baseline survey. These attributes provide insight into the risk posed to lenders considering refinances, modifications, or other remedy options. The differences show that, on average, in-person clients had lower credit scores and were more likely to be delinquent at the time they reached out to a counseling agency. In-person clients also had less total debt, lower estimated monthly payments, and lower debt-to-income ratios. Given other information about study participants counseled in person, these lower debt levels likely reflect the concentration of in-person clients in areas with lower home prices.
A comparison of client credit scores across agencies further demonstrates that in-person and telephone counseling clients had different underwriting profiles. Fifteen of the 24 counseling agencies in the sample served a large enough number of clients (more than 20) to permit comparison of the mean credit score information across agencies. Of the six counseling agencies that provided only telephone counseling services to clients in our sample, the lowest average credit score was 589. In contrast, the average client credit score was below 589 for 8 of the 10 in-person counseling agencies.
Overall, the profile of in-person clients reflects the presence of in-person counseling agencies in lower-income neighborhoods and urban areas. Although the profile of telephone clients includes clients with similar characteristics, it also reflects the use of telephone counseling to reach clients in suburban and exurban neighborhoods—including a higher share of clients in the states with the most dramatic housing price bubbles.
With this context in mind, the remaining sections of this chapter compare the amount of time spent in counseling, the mortgage remedies, and the housing outcomes for clients that received in-person and telephone counseling.
100FORECLOSURE COUNSELING OUTCOME STUDY: FINAL REPORT HOUSING COUNSELING OUTCOME EVALUATION
6. COUNSELING OUTCOMES AND FACTORS THAT AFFECT OUTCOMES
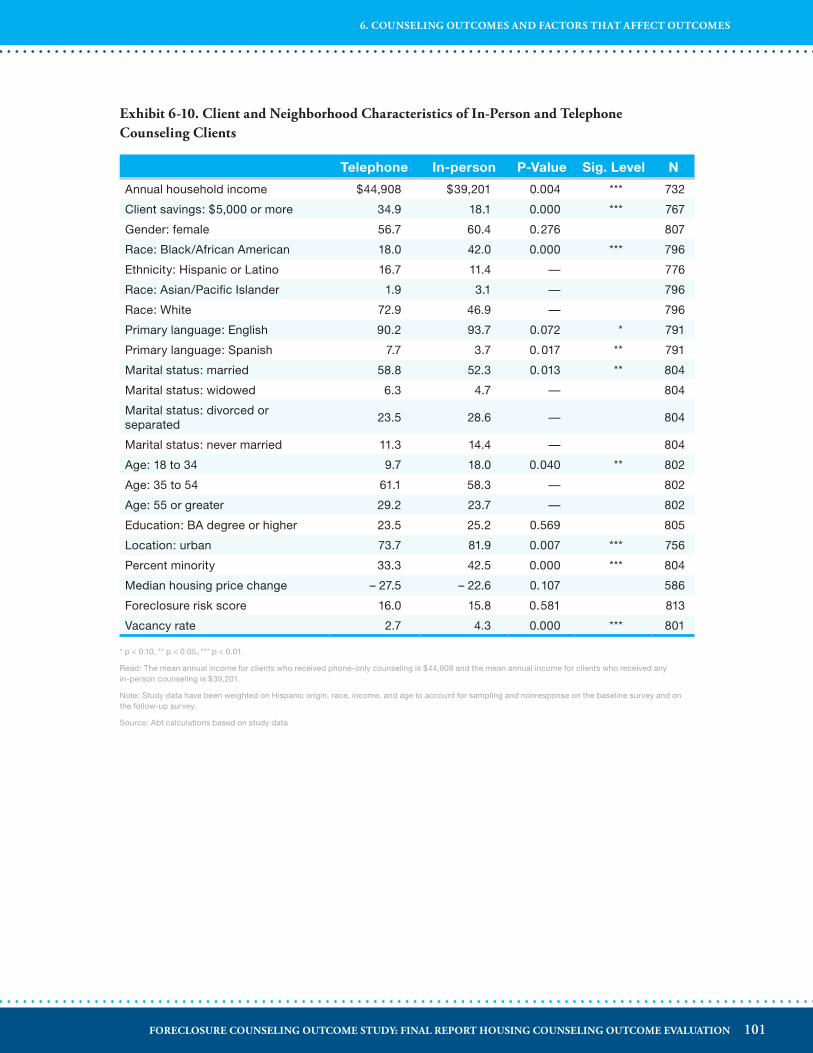
Exhibit 6-10� Client and Neighborhood Characteristics of In-Person and Telephone Counseling Clients
Telephone In-person P-Value Sig. Level N
Annual household income $44,908 $39,201 0.004 *** 732
Client savings: $5,000 or more 34.9 18.1 0.000 *** 767
Gender: female 56.7 60.4 0.276 807
Race: Black/African American 18.0 42.0 0.000 *** 796
Ethnicity: Hispanic or Latino 16.7 11.4 — 776
Race: Asian/Pacific Islander 1.9 3.1 — 796
Race: White 72.9 46.9 — 796
Primary language: English 90.2 93.7 0.072 * 791
Primary language: Spanish 7.7 3.7 0. 017 ** 791
Marital status: married 58.8 52.3 0.013 ** 804
Marital status: widowed 6.3 4.7 — 804
Marital status: divorced or separated
23.5 28.6 — 804
Marital status: never married 11.3 14.4 — 804
Age: 18 to 34 9.7 18.0 0.040 ** 802
Age: 35 to 54 61.1 58.3 — 802
Age: 55 or greater 29.2 23.7 — 802
Education: BA degree or higher 23.5 25.2 0.569 805
Location: urban 73.7 81.9 0.007 *** 756
Percent minority 33.3 42.5 0.000 *** 804
Median housing price change – 27.5 – 22.6 0.107 586
Foreclosure risk score 16.0 15.8 0.581 813
Vacancy rate 2.7 4.3 0.000 *** 801
* p < 0.10, ** p < 0.05, *** p < 0.01.
Read: The mean annual income for clients who received phone-only counseling is $44,908 and the mean annual income for clients who received any in-person counseling is $39,201.
Note: Study data have been weighted on Hispanic origin, race, income, and age to account for sampling and nonresponse on the baseline survey and on the follow-up survey.
Source: Abt calculations based on study data
101FORECLOSURE COUNSELING OUTCOME STUDY: FINAL REPORT HOUSING COUNSELING OUTCOME EVALUATION
6. COUNSELING OUTCOMES AND FACTORS THAT AFFECT OUTCOMES
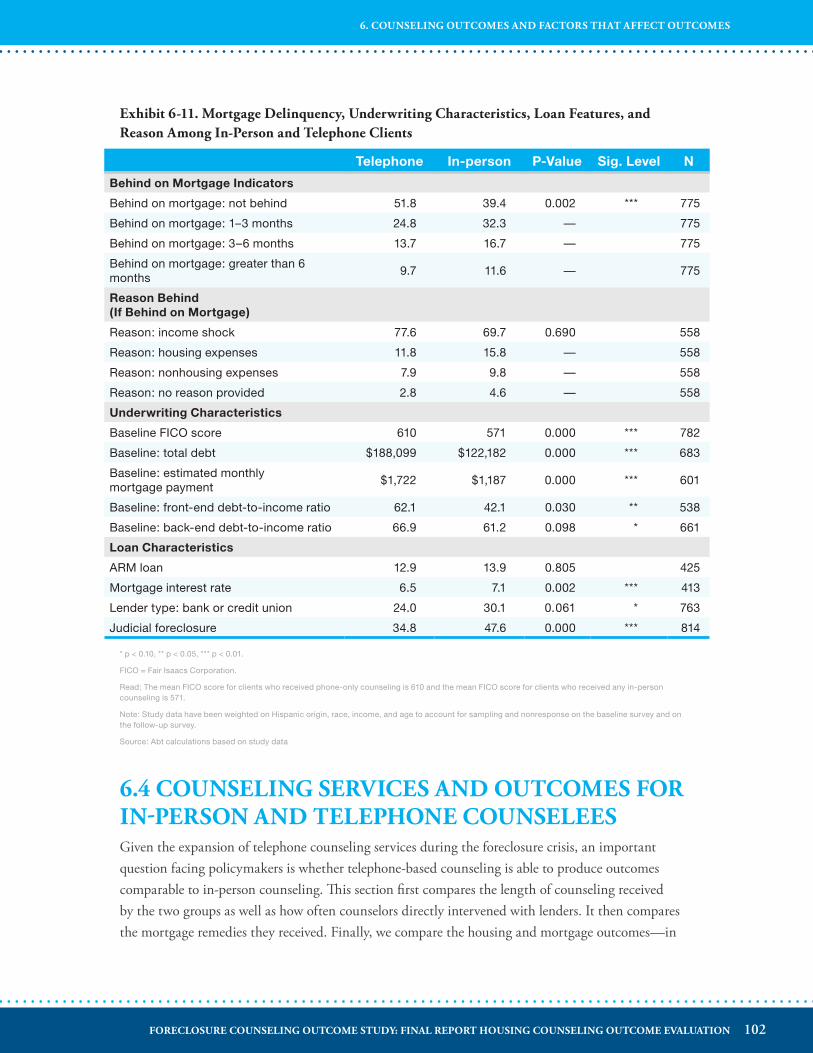
Exhibit 6-11� Mortgage Delinquency, Underwriting Characteristics, Loan Features, and Reason Among In-Person and Telephone Clients
Telephone In-person P-Value Sig. Level N
Behind on Mortgage Indicators
Behind on mortgage: not behind 51.8 39.4 0.002 *** 775
Behind on mortgage: 1–3 months 24.8 32.3 — 775
Behind on mortgage: 3–6 months 13.7 16.7 — 775
Behind on mortgage: greater than 6 months
9.7 11.6 — 775
Reason Behind (If Behind on Mortgage)
Reason: income shock 77.6 69.7 0.690 558
Reason: housing expenses 11.8 15.8 — 558
Reason: nonhousing expenses 7.9 9.8 — 558
Reason: no reason provided 2.8 4.6 — 558
Underwriting Characteristics
Baseline FICO score 610 571 0.000 *** 782
Baseline: total debt $188,099 $122,182 0.000 *** 683
Baseline: estimated monthly mortgage payment
$1,722 $1,187 0.000 *** 601
Baseline: front-end debt-to-income ratio 62.1 42.1 0.030 ** 538
Baseline: back-end debt-to-income ratio 66.9 61.2 0.098 * 661
Loan Characteristics
ARM loan 12.9 13.9 0.805 425
Mortgage interest rate 6.5 7.1 0.002 *** 413
Lender type: bank or credit union 24.0 30.1 0.061 * 763
Judicial foreclosure 34.8 47.6 0.000 *** 814
* p < 0.10, ** p < 0.05, *** p < 0.01.
FICO = Fair Isaacs Corporation.
Read: The mean FICO score for clients who received phone-only counseling is 610 and the mean FICO score for clients who received any in-person counseling is 571.
Note: Study data have been weighted on Hispanic origin, race, income, and age to account for sampling and nonresponse on the baseline survey and on the follow-up survey.
Source: Abt calculations based on study data
6�4 COUNSELING SERVICES AND OUTCOMES FOR IN-PERSON AND TELEPHONE COUNSELEESGiven the expansion of telephone counseling services during the foreclosure crisis, an important question facing policymakers is whether telephone-based counseling is able to produce outcomes comparable to in-person counseling. This section first compares the length of counseling received by the two groups as well as how often counselors directly intervened with lenders. It then compares the mortgage remedies they received. Finally, we compare the housing and mortgage outcomes—in
102FORECLOSURE COUNSELING OUTCOME STUDY: FINAL REPORT HOUSING COUNSELING OUTCOME EVALUATION
6. COUNSELING OUTCOMES AND FACTORS THAT AFFECT OUTCOMES
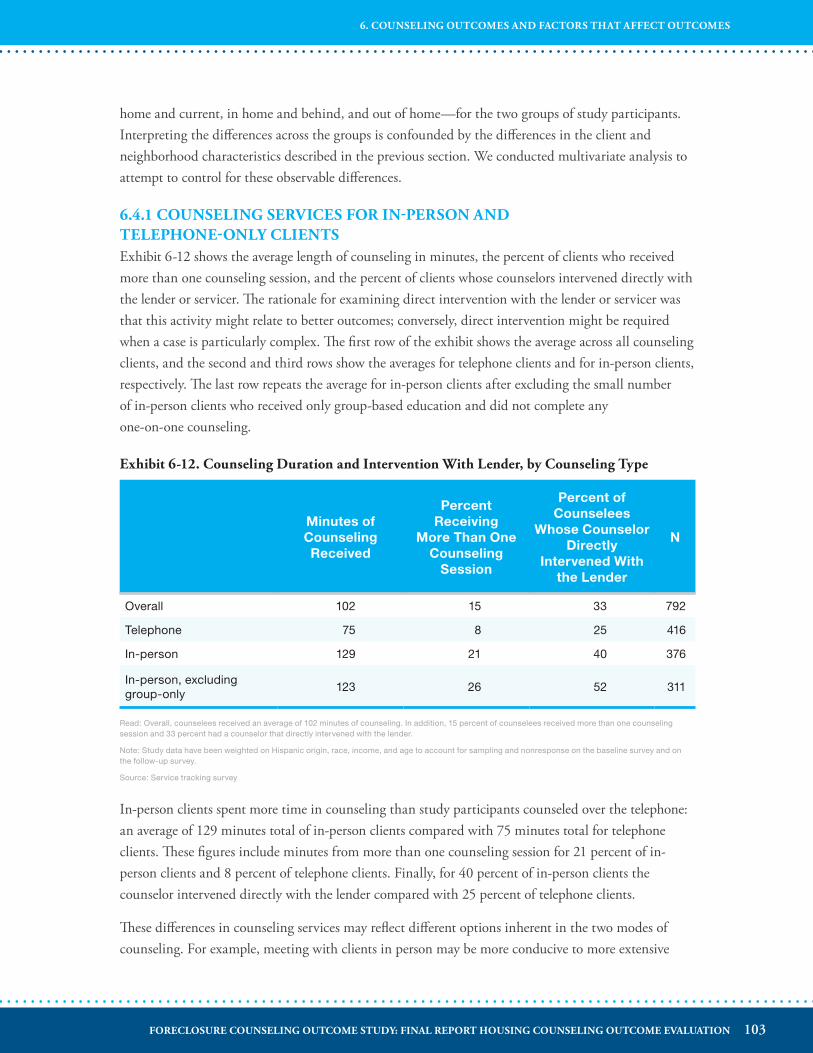
home and current, in home and behind, and out of home—for the two groups of study participants. Interpreting the differences across the groups is confounded by the differences in the client and neighborhood characteristics described in the previous section. We conducted multivariate analysis to attempt to control for these observable differences.
6�4�1 COUNSELING SERVICES FOR IN-PERSON AND TELEPHONE-ONLY CLIENTSExhibit 6-12 shows the average length of counseling in minutes, the percent of clients who received more than one counseling session, and the percent of clients whose counselors intervened directly with the lender or servicer. The rationale for examining direct intervention with the lender or servicer was that this activity might relate to better outcomes; conversely, direct intervention might be required when a case is particularly complex. The first row of the exhibit shows the average across all counseling clients, and the second and third rows show the averages for telephone clients and for in-person clients, respectively. The last row repeats the average for in-person clients after excluding the small number of in-person clients who received only group-based education and did not complete any one-on-one counseling.
Exhibit 6-12� Counseling Duration and Intervention With Lender, by Counseling Type
Minutes of Counseling Received
Percent Receiving
More Than One Counseling
Session
Percent of Counselees
Whose Counselor Directly
Intervened With the Lender
N
Overall 102 15 33 792
Telephone 75 8 25 416
In-person 129 21 40 376
In-person, excluding group-only
123 26 52 311
Read: Overall, counselees received an average of 102 minutes of counseling. In addition, 15 percent of counselees received more than one counseling session and 33 percent had a counselor that directly intervened with the lender.
Note: Study data have been weighted on Hispanic origin, race, income, and age to account for sampling and nonresponse on the baseline survey and on the follow-up survey.
Source: Service tracking survey
In-person clients spent more time in counseling than study participants counseled over the telephone: an average of 129 minutes total of in-person clients compared with 75 minutes total for telephone clients. These figures include minutes from more than one counseling session for 21 percent of in-person clients and 8 percent of telephone clients. Finally, for 40 percent of in-person clients the counselor intervened directly with the lender compared with 25 percent of telephone clients.
These differences in counseling services may reflect different options inherent in the two modes of counseling. For example, meeting with clients in person may be more conducive to more extensive
103FORECLOSURE COUNSELING OUTCOME STUDY: FINAL REPORT HOUSING COUNSELING OUTCOME EVALUATION
6. COUNSELING OUTCOMES AND FACTORS THAT AFFECT OUTCOMES
discussion of potential remedies or to calling the lender with the client present. The differences may also reflect differences in the clients served by telephone and in-person counseling. Because study participants who were served in person had lower credit scores and were more likely to be delinquent at baseline than those served by telephone, the additional counseling services may have been needed to help the in-person counselees identify and evaluate their options. Similarly, the stage of delinquency and the type of lender may have affected the remedies available and, therefore, the amount of time the counselor spent with the client and whether it made sense to intervene with the lender.
We conducted multivariate analyses to try to control for some of the observable factors other than the mode of counseling that could have influenced the amount of counseling received by study participants. Exhibit 6-13 defines the covariates for the multivariate analyses and identifies the data sources used to construct each measure. This specification draws on the available information to define covariates that capture the key factors that affect the amount of counseling. For each client, a foreclosure counselor assesses the client’s needs and helps the client to identify and evaluate options. The initial covariates, therefore, capture the client’s delinquency status and underwriting characteristics at the time the client sought counseling.
The measure of delinquency status is the number of months the client was delinquent when he or she entered counseling. The omitted category is the set of clients who sought counseling before becoming behind on their mortgage payment. The immediate rationale for these covariates is that the client’s options for mortgage remedies would likely differ based on the stage of delinquency, with more options available before the client became delinquent and fewer options available as the severity of the delinquency increased. A less direct rationale is that these measures may capture unobserved differences in the motivation or self-efficacy of clients who reached out to a counselor immediately and those who waited to reach out until several months into the delinquency.
The next set of measures reflects clients’ underwriting characteristics at the time they sought counseling. Because these characteristics are central to lenders’ consideration of mortgage remedies and refinances, they likely influence the options available to the client and counselor. The baseline FICO score is separated into four buckets, with clients with FICO scores below 520 used as the omitted category. The front-end and back-end ratios are also key measures of underwriting risk. These ratios are highly correlated with each other within the analysis sample, so the specification includes only the back-end debt ratio.
104FORECLOSURE COUNSELING OUTCOME STUDY: FINAL REPORT HOUSING COUNSELING OUTCOME EVALUATION
6. COUNSELING OUTCOMES AND FACTORS THAT AFFECT OUTCOMES
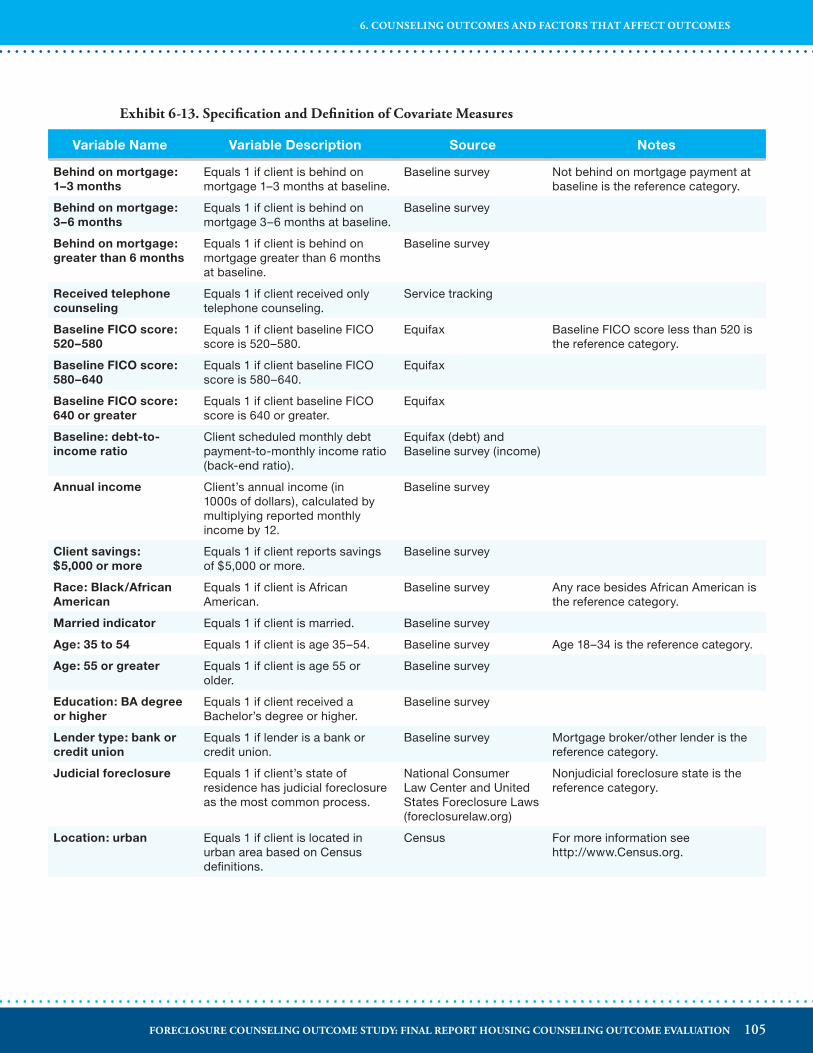
Exhibit 6-13� Specification and Definition of Covariate Measures
Variable Name Variable Description Source Notes
Behind on mortgage: 1–3 months
Equals 1 if client is behind on mortgage 1–3 months at baseline.
Baseline survey Not behind on mortgage payment at baseline is the reference category.
Behind on mortgage: 3–6 months
Equals 1 if client is behind on mortgage 3–6 months at baseline.
Baseline survey
Behind on mortgage: greater than 6 months
Equals 1 if client is behind on mortgage greater than 6 months at baseline.
Baseline survey
Received telephone counseling
Equals 1 if client received only telephone counseling.
Service tracking
Baseline FICO score: 520–580
Equals 1 if client baseline FICO score is 520–580.
Equifax Baseline FICO score less than 520 is the reference category.
Baseline FICO score: 580–640
Equals 1 if client baseline FICO score is 580–640.
Equifax
Baseline FICO score: 640 or greater
Equals 1 if client baseline FICO score is 640 or greater.
Equifax
Baseline: debt-to-income ratio
Client scheduled monthly debt payment-to-monthly income ratio (back-end ratio).
Equifax (debt) and Baseline survey (income)
Annual income Client’s annual income (in 1000s of dollars), calculated by multiplying reported monthly income by 12.
Baseline survey
Client savings: $5,000 or more
Equals 1 if client reports savings of $5,000 or more.
Baseline survey
Race: Black/African American
Equals 1 if client is African American.
Baseline survey Any race besides African American is the reference category.
Married indicator Equals 1 if client is married. Baseline survey
Age: 35 to 54 Equals 1 if client is age 35–54. Baseline survey Age 18–34 is the reference category.
Age: 55 or greater Equals 1 if client is age 55 or older.
Baseline survey
Education: BA degree or higher
Equals 1 if client received a Bachelor’s degree or higher.
Baseline survey
Lender type: bank or credit union
Equals 1 if lender is a bank or credit union.
Baseline survey Mortgage broker/other lender is the reference category.
Judicial foreclosure Equals 1 if client’s state of residence has judicial foreclosure as the most common process.
National Consumer Law Center and United States Foreclosure Laws (foreclosurelaw.org)
Nonjudicial foreclosure state is the reference category.
Location: urban Equals 1 if client is located in urban area based on Census definitions.
Census For more information see http://www.Census.org.
105FORECLOSURE COUNSELING OUTCOME STUDY: FINAL REPORT HOUSING COUNSELING OUTCOME EVALUATION
6. COUNSELING OUTCOMES AND FACTORS THAT AFFECT OUTCOMES
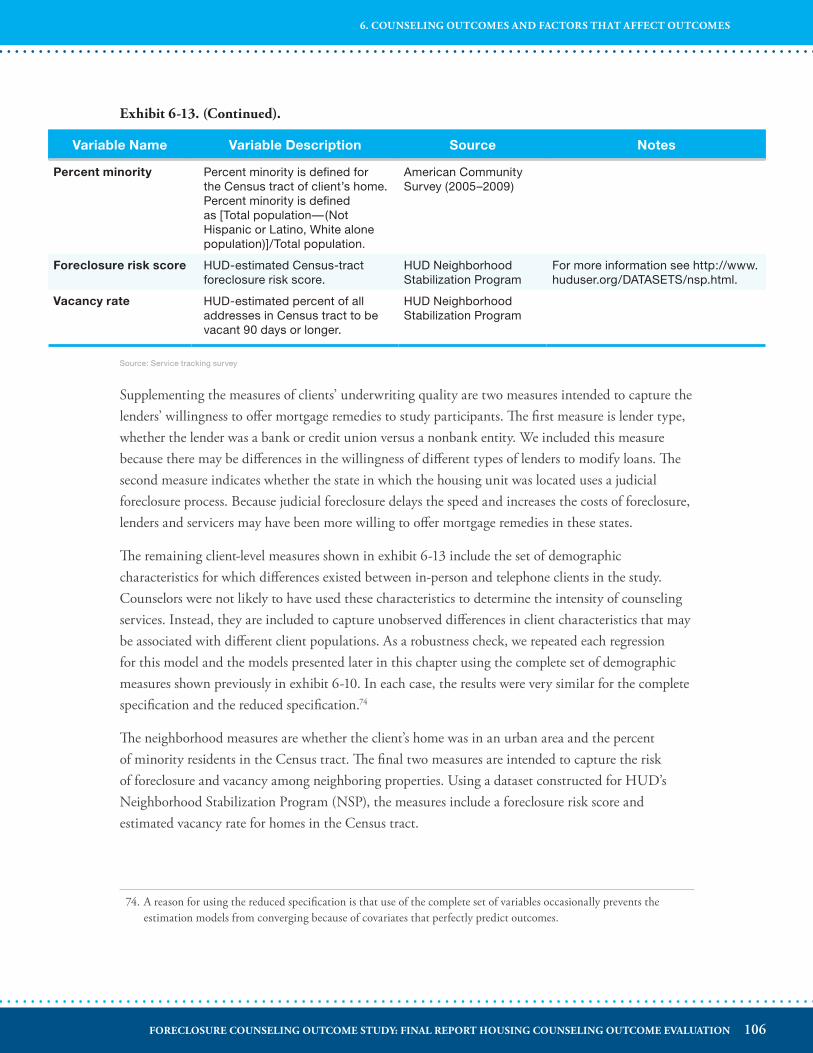
Variable Name Variable Description Source Notes
Percent minority Percent minority is defined for the Census tract of client’s home. Percent minority is defined as [Total population—(Not Hispanic or Latino, White alone population)]/Total population.
American Community Survey (2005–2009)
Foreclosure risk score HUD-estimated Census-tract foreclosure risk score.
HUD Neighborhood Stabilization Program
For more information see http://www.huduser.org/DATASETS/nsp.html.
Vacancy rate HUD-estimated percent of all addresses in Census tract to be vacant 90 days or longer.
HUD Neighborhood Stabilization Program
Exhibit 6-13� (Continued)�
Source: Service tracking survey
Supplementing the measures of clients’ underwriting quality are two measures intended to capture the lenders’ willingness to offer mortgage remedies to study participants. The first measure is lender type, whether the lender was a bank or credit union versus a nonbank entity. We included this measure because there may be differences in the willingness of different types of lenders to modify loans. The second measure indicates whether the state in which the housing unit was located uses a judicial foreclosure process. Because judicial foreclosure delays the speed and increases the costs of foreclosure, lenders and servicers may have been more willing to offer mortgage remedies in these states.
The remaining client-level measures shown in exhibit 6-13 include the set of demographic characteristics for which differences existed between in-person and telephone clients in the study. Counselors were not likely to have used these characteristics to determine the intensity of counseling services. Instead, they are included to capture unobserved differences in client characteristics that may be associated with different client populations. As a robustness check, we repeated each regression for this model and the models presented later in this chapter using the complete set of demographic measures shown previously in exhibit 6-10. In each case, the results were very similar for the complete specification and the reduced specification.74
The neighborhood measures are whether the client’s home was in an urban area and the percent of minority residents in the Census tract. The final two measures are intended to capture the risk of foreclosure and vacancy among neighboring properties. Using a dataset constructed for HUD’s Neighborhood Stabilization Program (NSP), the measures include a foreclosure risk score and estimated vacancy rate for homes in the Census tract.
74. A reason for using the reduced specification is that use of the complete set of variables occasionally prevents the estimation models from converging because of covariates that perfectly predict outcomes.
106FORECLOSURE COUNSELING OUTCOME STUDY: FINAL REPORT HOUSING COUNSELING OUTCOME EVALUATION
6. COUNSELING OUTCOMES AND FACTORS THAT AFFECT OUTCOMES
Exhibit 6-14 presents the results of regression analyses that analyze the minutes of counseling received, the number of sessions received, and whether the counselor intervened directly with the lender with respect to the set of covariates described above. The regression predicting the length of counseling uses ordinary least squares (OLS) regression, because this outcome is defined in minutes—a continuous measure. As a result, the estimates reported in exhibit 6-14 should be interpreted as OLS coefficients. For example, the first coefficient shows that telephone clients receive, on average, 53 fewer minutes of counseling than in-person clients, after controlling for observable characteristics that might affect the duration of counseling.
The second and third regressions presented in exhibit 6-14 predict dichotomous outcome measures, so each is estimated using logistic regression techniques. The estimates reported in exhibit 6-14 are odds ratios. For example, the first coefficient for the second model shows that telephone clients in the sample were only 36 percent as likely as in-person clients to receive more than one counseling session. Similarly, the first coefficient for the third model shows that telephone clients were 42 percent as likely as in-person clients to have their counselor intervene directly with the lender. These regression results suggest that the differences in counseling between in-person and telephone clients are not fully explained by the observed differences in client or neighborhood characteristics. Instead, the regression-adjusted differences between telephone and counseling clients are very similar to the raw differences shown previously in exhibit 6-12.
107FORECLOSURE COUNSELING OUTCOME STUDY: FINAL REPORT HOUSING COUNSELING OUTCOME EVALUATION
6. COUNSELING OUTCOMES AND FACTORS THAT AFFECT OUTCOMES
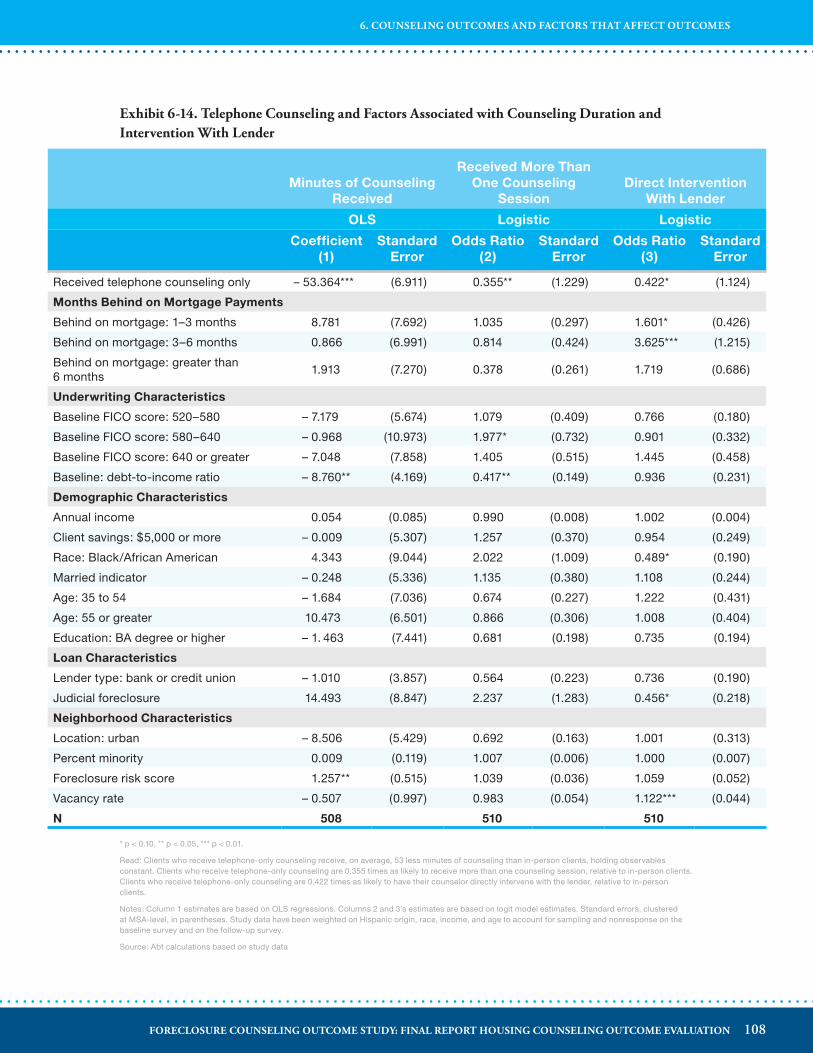
Exhibit 6-14� Telephone Counseling and Factors Associated with Counseling Duration and Intervention With Lender
Minutes of Counseling Received
Received More Than One Counseling
SessionDirect Intervention
With Lender
OLS Logistic Logistic
Coefficient (1)
Standard Error
Odds Ratio (2)
Standard Error
Odds Ratio (3)
Standard Error
Received telephone counseling only – 53.364*** (6.911) 0.355** (1.229) 0.422* (1.124)
Months Behind on Mortgage Payments
Behind on mortgage: 1–3 months 8.781 (7.692) 1.035 (0.297) 1.601* (0.426)
Behind on mortgage: 3–6 months 0.866 (6.991) 0.814 (0.424) 3.625*** (1.215)
Behind on mortgage: greater than 6 months
1.913 (7.270) 0.378 (0.261) 1.719 (0.686)
Underwriting Characteristics
Baseline FICO score: 520–580 – 7.179 (5.674) 1.079 (0.409) 0.766 (0.180)
Baseline FICO score: 580–640 – 0.968 (10.973) 1.977* (0.732) 0.901 (0.332)
Baseline FICO score: 640 or greater – 7.048 (7.858) 1.405 (0.515) 1.445 (0.458)
Baseline: debt-to-income ratio – 8.760** (4.169) 0.417** (0.149) 0.936 (0.231)
Demographic Characteristics
Annual income 0.054 (0.085) 0.990 (0.008) 1.002 (0.004)
Client savings: $5,000 or more – 0.009 (5.307) 1.257 (0.370) 0.954 (0.249)
Race: Black/African American 4.343 (9.044) 2.022 (1.009) 0.489* (0.190)
Married indicator – 0.248 (5.336) 1.135 (0.380) 1.108 (0.244)
Age: 35 to 54 – 1.684 (7.036) 0.674 (0.227) 1.222 (0.431)
Age: 55 or greater 10.473 (6.501) 0.866 (0.306) 1.008 (0.404)
Education: BA degree or higher – 1. 463 (7.441) 0.681 (0.198) 0.735 (0.194)
Loan Characteristics
Lender type: bank or credit union – 1.010 (3.857) 0.564 (0.223) 0.736 (0.190)
Judicial foreclosure 14.493 (8.847) 2.237 (1.283) 0.456* (0.218)
Neighborhood Characteristics
Location: urban – 8.506 (5.429) 0.692 (0.163) 1.001 (0.313)
Percent minority 0.009 (0.119) 1.007 (0.006) 1.000 (0.007)
Foreclosure risk score 1.257** (0.515) 1.039 (0.036) 1.059 (0.052)
Vacancy rate – 0.507 (0.997) 0.983 (0.054) 1.122*** (0.044)
N 508 510 510
* p < 0.10, ** p < 0.05, *** p < 0.01.
Read: Clients who receive telephone-only counseling receive, on average, 53 less minutes of counseling than in-person clients, holding observables constant. Clients who receive telephone-only counseling are 0.355 times as likely to receive more than one counseling session, relative to in-person clients. Clients who receive telephone-only counseling are 0.422 times as likely to have their counselor directly intervene with the lender, relative to in-person clients.
Notes: Column 1 estimates are based on OLS regressions. Columns 2 and 3’s estimates are based on logit model estimates. Standard errors, clustered at MSA-level, in parentheses. Study data have been weighted on Hispanic origin, race, income, and age to account for sampling and nonresponse on the baseline survey and on the follow-up survey.
Source: Abt calculations based on study data
108FORECLOSURE COUNSELING OUTCOME STUDY: FINAL REPORT HOUSING COUNSELING OUTCOME EVALUATION
6. COUNSELING OUTCOMES AND FACTORS THAT AFFECT OUTCOMES
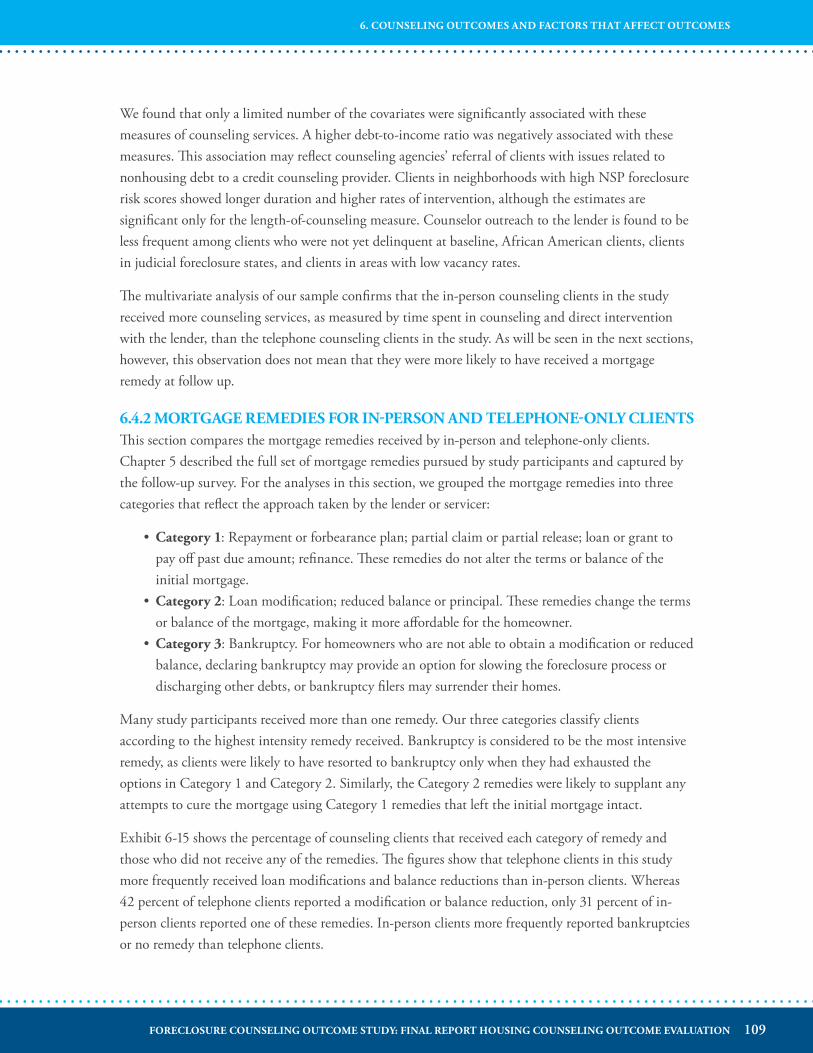
We found that only a limited number of the covariates were significantly associated with these measures of counseling services. A higher debt-to-income ratio was negatively associated with these measures. This association may reflect counseling agencies’ referral of clients with issues related to nonhousing debt to a credit counseling provider. Clients in neighborhoods with high NSP foreclosure risk scores showed longer duration and higher rates of intervention, although the estimates are significant only for the length-of-counseling measure. Counselor outreach to the lender is found to be less frequent among clients who were not yet delinquent at baseline, African American clients, clients in judicial foreclosure states, and clients in areas with low vacancy rates.
The multivariate analysis of our sample confirms that the in-person counseling clients in the study received more counseling services, as measured by time spent in counseling and direct intervention with the lender, than the telephone counseling clients in the study. As will be seen in the next sections, however, this observation does not mean that they were more likely to have received a mortgage remedy at follow up.
6�4�2 MORTGAGE REMEDIES FOR IN-PERSON AND TELEPHONE-ONLY CLIENTSThis section compares the mortgage remedies received by in-person and telephone-only clients. Chapter 5 described the full set of mortgage remedies pursued by study participants and captured by the follow-up survey. For the analyses in this section, we grouped the mortgage remedies into three categories that reflect the approach taken by the lender or servicer:
•Category 1: Repayment or forbearance plan; partial claim or partial release; loan or grant to pay off past due amount; refinance. These remedies do not alter the terms or balance of the initial mortgage.
•Category 2: Loan modification; reduced balance or principal. These remedies change the terms or balance of the mortgage, making it more affordable for the homeowner.
•Category 3: Bankruptcy. For homeowners who are not able to obtain a modification or reduced balance, declaring bankruptcy may provide an option for slowing the foreclosure process or discharging other debts, or bankruptcy filers may surrender their homes.
Many study participants received more than one remedy. Our three categories classify clients according to the highest intensity remedy received. Bankruptcy is considered to be the most intensive remedy, as clients were likely to have resorted to bankruptcy only when they had exhausted the options in Category 1 and Category 2. Similarly, the Category 2 remedies were likely to supplant any attempts to cure the mortgage using Category 1 remedies that left the initial mortgage intact.
Exhibit 6-15 shows the percentage of counseling clients that received each category of remedy and those who did not receive any of the remedies. The figures show that telephone clients in this study more frequently received loan modifications and balance reductions than in-person clients. Whereas 42 percent of telephone clients reported a modification or balance reduction, only 31 percent of in-person clients reported one of these remedies. In-person clients more frequently reported bankruptcies or no remedy than telephone clients.
109FORECLOSURE COUNSELING OUTCOME STUDY: FINAL REPORT HOUSING COUNSELING OUTCOME EVALUATION
6. COUNSELING OUTCOMES AND FACTORS THAT AFFECT OUTCOMES
Exhibit 6-15� Receipt of Mortgage Remedies Among In-Person and Telephone Clients
Category 1: Repayment Plan,
and so on (%)
Category 2: Modification, and so on (%)
Category 3: Bankruptcy (%)
No Remedy Reported (%)
N
Overall 12 37 20 31 539
Telephone 12 42 19 28 317
In-person 12 31 23 35 222
In-person, excluding group-only
14 28 22 37 185
Read: Overall, 12 percent of counselees received a repayment/forbearance, partial claim/release, loan/grant, or refinance; 37 percent of clients received a loan modification, reduced balance, or reduced principal; 20 percent of clients declared bankruptcy; and 31 percent of clients did not report receiving a remedy.
Note: Study data have been weighted on Hispanic origin, race, income, and age to account for sampling and nonresponse on the baseline survey and on the follow-up survey.
Source: Follow-up survey
We used regression analyses, shown in exhibit 6-16, to examine further the differences between the mortgage remedies received by telephone and in-person clients. Because mortgage remedies are a central element of the counseling process, the covariates for these models mirror those used in the analyses of counseling duration above. For example, the client’s delinquency status may limit the mortgage remedies available, particularly for clients who are several months delinquent and nearing foreclosure. Clients who are not yet delinquent may also have fewer mortgage remedies, as some clients may be able to avoid serious delinquency and not require a remedy.
Clients’ underwriting characteristics are central to lenders’ decisions about whether to offer mortgage remedies. Clients’ credit scores and debt-to-income ratios at the time of counseling reflect the underwriting risk posed to a lender considering whether to offer a refinance, modification, or other remedy. Ideally, the specification would also account for clients’ current loan-to-value ratio at baseline. The presence and extent of negative equity are likely to influence clients’ evaluation of options for curing the mortgage or proceeding with foreclosure. Lenders will use the current loan-to-value ratio to evaluate the potential for a client to cure the mortgage, as well as the redefault risk following any mortgage remedy. As discussed in chapters 2 and 4, however, we did not have sufficient information on the value of counselees’ homes at baseline to include loan-to-value in the models.
Lenders’ considerations of alternative mortgage remedies weigh the expected revenue stream for each alternative against the expected losses if the client reaches foreclosure. For example, the net present value calculation required by the Home Affordable Modification Program (HAMP) formalizes lenders’ consideration of these factors. Lenders considering other remedies are also likely to consider the tradeoffs among expected revenue, default risk, and foreclosure losses—although their evaluation of these factors may not be as structured as the net present value calculation in HAMP. These factors increase the incentive for lenders to pursue remedies that create the greatest reductions in default risk. They also create incentives for lenders to pursue remedies when a foreclosure imposes the highest costs—for example, in neighborhoods with large declines in home values and little sales activity.
110FORECLOSURE COUNSELING OUTCOME STUDY: FINAL REPORT HOUSING COUNSELING OUTCOME EVALUATION
6. COUNSELING OUTCOMES AND FACTORS THAT AFFECT OUTCOMES
The observed attributes of counseling clients and their mortgages do not capture the full set of underwriting characteristics and other factors used in the net present value calculations. The demographic characteristics of clients and the attributes of their neighborhoods that we are able to use as covariates may capture some of the differences in these calculations between in-person and telephone counselees, but are not likely to capture all of them. Similarly, the indicators for lender type and the presence of judicial foreclosure laws may not fully capture differences in the policies of individual lenders and servicers. Unobserved differences in servicers’ willingness to offer mortgage remedies may explain some of the differences between in-person and telephone clients’ receipt of mortgage remedies.
Exhibit 6-16 presents the results of the regression analyses of the likelihood that study participants received mortgage remedies in the three categories or no remedy. Because the outcome is defined with respect to several categorical remedy outcomes, the analysis uses multinomial logistic regression.75 Receipt of no remedy is the base or reference category. The estimates should be read as relative risk ratios for each of the covariates. For example, the first coefficient in the Category 1 column shows that telephone clients, on average, reported receiving more than twice as many Category 1 remedies as in-person clients—after controlling for the other covariates.
The estimates shown in exhibit 6-16 confirm the importance of several factors affecting the likelihood that a study participant would receive a mortgage remedy. First, study participants who were 1 to 3 months behind at baseline were the most likely to receive mortgage remedies. These clients received seven to eight times more Category 1 and Category 2 remedies than clients who were not behind at baseline. They were also more than four times more likely to pursue bankruptcy than clients who were not behind at baseline.
Second, clients in neighborhoods with higher vacancy rates received fewer mortgage remedies. This finding is strongest with respect to Category 2 remedies, but is also significant at the 10-percent level for bankruptcy.
Finally, lower income and African American clients were more likely to receive mortgage remedies. In particular, African American clients received more than four times as many Category 2 remedies as White clients.
Some of the underwriting, demographic, and lender measures are associated with individual remedy categories but do not show consistent effects across the outcome categories. Study participants in judicial foreclosure states were less likely to declare bankruptcy than study participants in nonjudicial foreclosure states. This finding is consistent with clients using bankruptcy to slow the foreclosure process, although it may also reflect differences in local housing markets across judicial and nonjudicial foreclosure states. Study participants with higher back-end ratios received fewer Category
75. The remedies pursued outcome comprises four categories: (1) repayment/forbearance, partial claim/release, loan/grant, or refinance (repayment/forbearance); (2) loan modification or reduced balance/principal (modification); (3) bankruptcy; and (4) no remedy reported. The reference category for the dependent variable is no remedy reported (Evans, 2011).
111FORECLOSURE COUNSELING OUTCOME STUDY: FINAL REPORT HOUSING COUNSELING OUTCOME EVALUATION
6. COUNSELING OUTCOMES AND FACTORS THAT AFFECT OUTCOMES
2 remedies than those participants with lower debt-to-income ratios. Clients younger than age 35 received fewer Category 1 remedies than older clients.
The final finding from exhibit 6-16 is that these covariates do not fully explain the differences in receipt of mortgage remedies between in-person and telephone clients. In fact, the difference in the likelihood of receiving mortgage remedies increases when observed underwriting, demographic, and neighborhood characteristics are controlled for. The estimates in exhibit 6-16 imply that receipt of Category 1 and Category 2 remedies occurred more than twice as often among telephone clients than in-person clients.
These estimates may reflect stronger effects of counseling for telephone-based providers of counseling than for in-person providers. For example, it is possible that the foreclosure hotlines that serve a large number of clients are more consistent in their provision of high-quality counseling services. The observed covariates are not likely, however, to account fully for differences in clients’ underwriting characteristics (in particular, negative equity), lenders’ expectations about local housing markets, and differences in lender/servicer policies.
An additional consideration is that study participants may have self-selected into telephone and in-person counseling on the basis of unobserved factors like self-efficacy, time constraints, or proximity to an in-person counseling agency. Telephone counseling may be more attractive to homeowners with limited time or who are more willing to compile their documents without hands-on assistance. Alternatively, in-person counseling may be less available in exurban and rural areas.
Although the influence of lenders, servicers, and client motivation cannot be explored, we were able to conduct limited robustness analyses with respect to the importance of negative equity. These analyses use two measures that approximate changes in the value of the home. These analyses are not able to account for the principal balance on clients’ loans at baseline. Instead, they provide a limited test of the importance of local home price changes.
First, the change in tract median home prices was observed for a subset of clients. Second, the regional price appreciation trends was approximated using state/region fixed effects.76 For each of the regressions shown in exhibit 6-16, the findings were essentially the same when we controlled for these measures of home price appreciation. Both measures were omitted from the final specification. The measure of tract median price change was omitted because of the extent of missing values. The state/region fixed effects were omitted because in several states all clients were served by only one or two counseling agencies—which raises the potential for the state fixed effects to introduce bias into the measure of telephone versus in-person counseling.
76. State fixed effects were created where the sample size in the state is sufficient for analysis. Other states are combined to create regional categories. The state/region fixed effects are as follows: CA; AZ/NV; CO/UT/WY/MT/NM/ID/OR/WA; DC/MD/VA; DE; FL; GA; IL/IN; MA/CT/RI/VT/NH/ME; MI; MO; MS/AR/AL/LA/TN/WV/KY; NY/NJ/PA; OH; SC; SD/IA/MN/WI/NE; TX/OK.
112FORECLOSURE COUNSELING OUTCOME STUDY: FINAL REPORT HOUSING COUNSELING OUTCOME EVALUATION
6. COUNSELING OUTCOMES AND FACTORS THAT AFFECT OUTCOMES

Taken together, these robustness checks suggest that differences between telephone and in-person clients are not sensitive to differences in local price trends. Although this result offers some evidence to ease concerns about unobserved differences in negative equity, the variables used in these checks do not fully account for differences between local housing markets or the relative value of alternative remedies to the lender. As a result, the estimates in exhibit 6-16 are not likely to isolate the causal effect of the counseling mode on clients’ receipt of mortgage remedies.
113FORECLOSURE COUNSELING OUTCOME STUDY: FINAL REPORT HOUSING COUNSELING OUTCOME EVALUATION
6. COUNSELING OUTCOMES AND FACTORS THAT AFFECT OUTCOMES
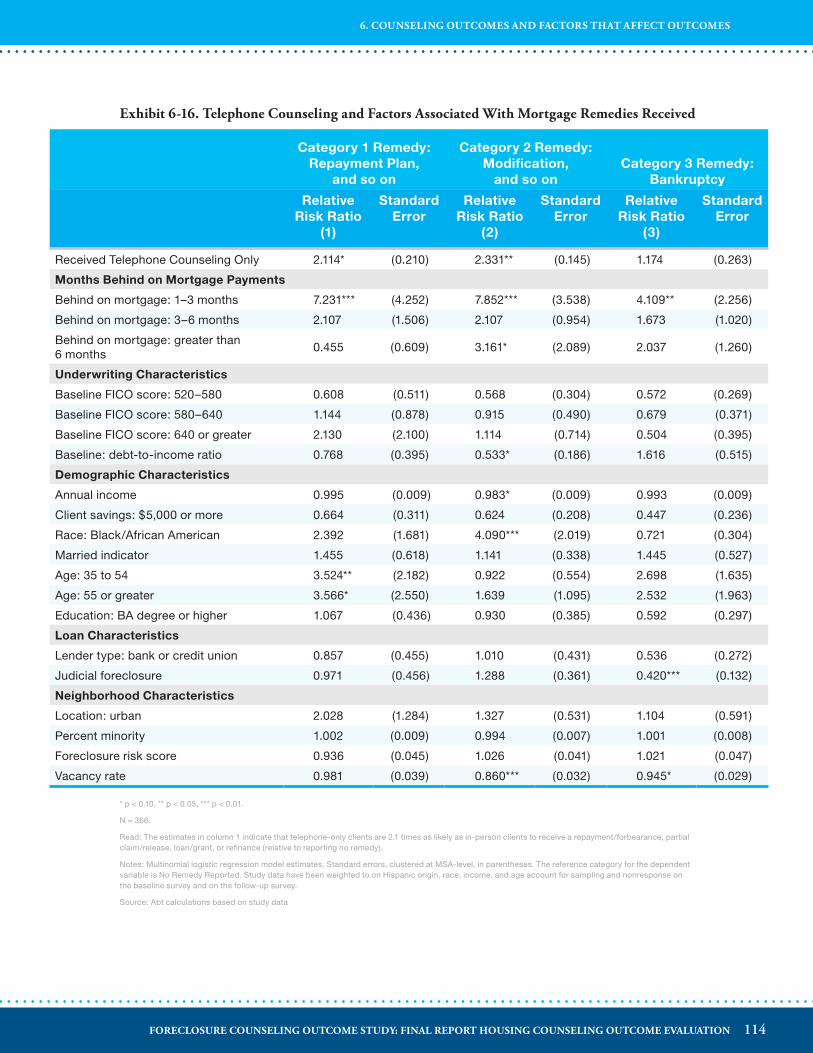
Exhibit 6-16� Telephone Counseling and Factors Associated With Mortgage Remedies Received
Category 1 Remedy: Repayment Plan,
and so on
Category 2 Remedy: Modification,
and so onCategory 3 Remedy:
Bankruptcy
Relative Risk Ratio
(1)
Standard Error
Relative Risk Ratio
(2)
Standard Error
Relative Risk Ratio
(3)
Standard Error
Received Telephone Counseling Only 2.114* (0.210) 2.331** (0.145) 1.174 (0.263)
Months Behind on Mortgage Payments
Behind on mortgage: 1–3 months 7.231*** (4.252) 7.852*** (3.538) 4.109** (2.256)
Behind on mortgage: 3–6 months 2.107 (1.506) 2.107 (0.954) 1.673 (1.020)
Behind on mortgage: greater than 6 months
0.455 (0.609) 3.161* (2.089) 2.037 (1.260)
Underwriting Characteristics
Baseline FICO score: 520–580 0.608 (0.511) 0.568 (0.304) 0.572 (0.269)
Baseline FICO score: 580–640 1.144 (0.878) 0.915 (0.490) 0.679 (0.371)
Baseline FICO score: 640 or greater 2.130 (2.100) 1.114 (0.714) 0.504 (0.395)
Baseline: debt-to-income ratio 0.768 (0.395) 0.533* (0.186) 1.616 (0.515)
Demographic Characteristics
Annual income 0.995 (0.009) 0.983* (0.009) 0.993 (0.009)
Client savings: $5,000 or more 0.664 (0.311) 0.624 (0.208) 0.447 (0.236)
Race: Black/African American 2.392 (1.681) 4.090*** (2.019) 0.721 (0.304)
Married indicator 1.455 (0.618) 1.141 (0.338) 1.445 (0.527)
Age: 35 to 54 3.524** (2.182) 0.922 (0.554) 2.698 (1.635)
Age: 55 or greater 3.566* (2.550) 1.639 (1.095) 2.532 (1.963)
Education: BA degree or higher 1.067 (0.436) 0.930 (0.385) 0.592 (0.297)
Loan Characteristics
Lender type: bank or credit union 0.857 (0.455) 1.010 (0.431) 0.536 (0.272)
Judicial foreclosure 0.971 (0.456) 1.288 (0.361) 0.420*** (0.132)
Neighborhood Characteristics
Location: urban 2.028 (1.284) 1.327 (0.531) 1.104 (0.591)
Percent minority 1.002 (0.009) 0.994 (0.007) 1.001 (0.008)
Foreclosure risk score 0.936 (0.045) 1.026 (0.041) 1.021 (0.047)
Vacancy rate 0.981 (0.039) 0.860*** (0.032) 0.945* (0.029)
* p < 0.10, ** p < 0.05, *** p < 0.01.
N = 366.
Read: The estimates in column 1 indicate that telephone-only clients are 2.1 times as likely as in-person clients to receive a repayment/forbearance, partial claim/release, loan/grant, or refinance (relative to reporting no remedy).
Notes: Multinomial logistic regression model estimates. Standard errors, clustered at MSA-level, in parentheses. The reference category for the dependent variable is No Remedy Reported. Study data have been weighted to on Hispanic origin, race, income, and age account for sampling and nonresponse on the baseline survey and on the follow-up survey.
Source: Abt calculations based on study data
114FORECLOSURE COUNSELING OUTCOME STUDY: FINAL REPORT HOUSING COUNSELING OUTCOME EVALUATION
6. COUNSELING OUTCOMES AND FACTORS THAT AFFECT OUTCOMES
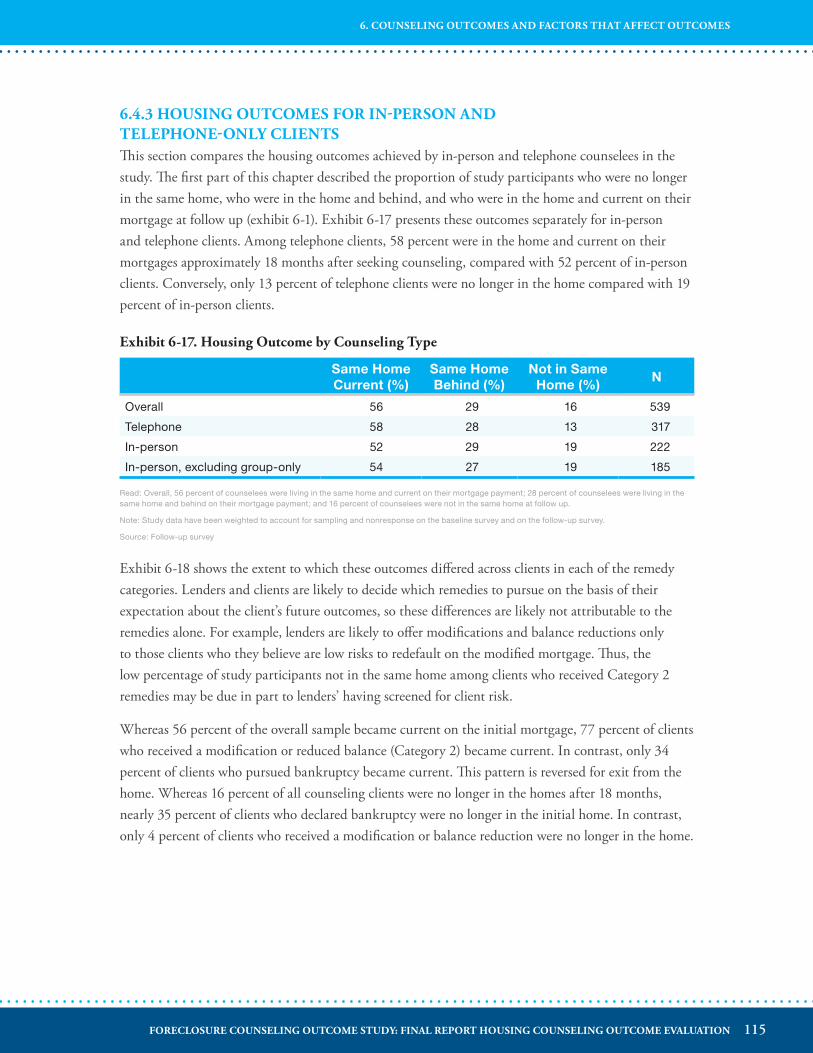
6�4�3 HOUSING OUTCOMES FOR IN-PERSON AND TELEPHONE-ONLY CLIENTSThis section compares the housing outcomes achieved by in-person and telephone counselees in the study. The first part of this chapter described the proportion of study participants who were no longer in the same home, who were in the home and behind, and who were in the home and current on their mortgage at follow up (exhibit 6-1). Exhibit 6-17 presents these outcomes separately for in-person and telephone clients. Among telephone clients, 58 percent were in the home and current on their mortgages approximately 18 months after seeking counseling, compared with 52 percent of in-person clients. Conversely, only 13 percent of telephone clients were no longer in the home compared with 19 percent of in-person clients.
Exhibit 6-17� Housing Outcome by Counseling Type
Same Home Current (%)
Same Home Behind (%)
Not in Same Home (%)
N
Overall 56 29 16 539
Telephone 58 28 13 317
In-person 52 29 19 222
In-person, excluding group-only 54 27 19 185
Read: Overall, 56 percent of counselees were living in the same home and current on their mortgage payment; 28 percent of counselees were living in the same home and behind on their mortgage payment; and 16 percent of counselees were not in the same home at follow up.
Note: Study data have been weighted to account for sampling and nonresponse on the baseline survey and on the follow-up survey.
Source: Follow-up survey
Exhibit 6-18 shows the extent to which these outcomes differed across clients in each of the remedy categories. Lenders and clients are likely to decide which remedies to pursue on the basis of their expectation about the client’s future outcomes, so these differences are likely not attributable to the remedies alone. For example, lenders are likely to offer modifications and balance reductions only to those clients who they believe are low risks to redefault on the modified mortgage. Thus, the low percentage of study participants not in the same home among clients who received Category 2 remedies may be due in part to lenders’ having screened for client risk.
Whereas 56 percent of the overall sample became current on the initial mortgage, 77 percent of clients who received a modification or reduced balance (Category 2) became current. In contrast, only 34 percent of clients who pursued bankruptcy became current. This pattern is reversed for exit from the home. Whereas 16 percent of all counseling clients were no longer in the homes after 18 months, nearly 35 percent of clients who declared bankruptcy were no longer in the initial home. In contrast, only 4 percent of clients who received a modification or balance reduction were no longer in the home.
115FORECLOSURE COUNSELING OUTCOME STUDY: FINAL REPORT HOUSING COUNSELING OUTCOME EVALUATION
6. COUNSELING OUTCOMES AND FACTORS THAT AFFECT OUTCOMES
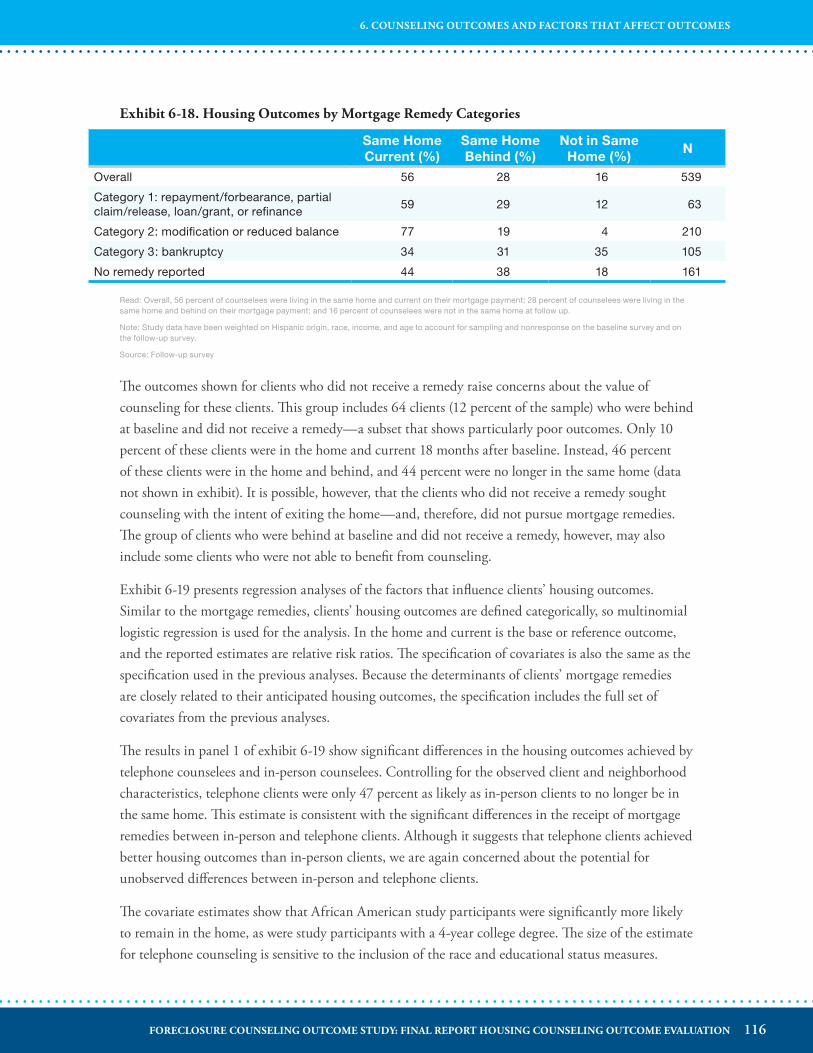
Exhibit 6-18� Housing Outcomes by Mortgage Remedy Categories
Same Home Current (%)
Same Home Behind (%)
Not in Same Home (%)
N
Overall 56 28 16 539
Category 1: repayment/forbearance, partial claim/release, loan/grant, or refinance
59 29 12 63
Category 2: modification or reduced balance 77 19 4 210
Category 3: bankruptcy 34 31 35 105
No remedy reported 44 38 18 161
Read: Overall, 56 percent of counselees were living in the same home and current on their mortgage payment; 28 percent of counselees were living in the same home and behind on their mortgage payment; and 16 percent of counselees were not in the same home at follow up.
Note: Study data have been weighted on Hispanic origin, race, income, and age to account for sampling and nonresponse on the baseline survey and on the follow-up survey.
Source: Follow-up survey
The outcomes shown for clients who did not receive a remedy raise concerns about the value of counseling for these clients. This group includes 64 clients (12 percent of the sample) who were behind at baseline and did not receive a remedy—a subset that shows particularly poor outcomes. Only 10 percent of these clients were in the home and current 18 months after baseline. Instead, 46 percent of these clients were in the home and behind, and 44 percent were no longer in the same home (data not shown in exhibit). It is possible, however, that the clients who did not receive a remedy sought counseling with the intent of exiting the home—and, therefore, did not pursue mortgage remedies. The group of clients who were behind at baseline and did not receive a remedy, however, may also include some clients who were not able to benefit from counseling.
Exhibit 6-19 presents regression analyses of the factors that influence clients’ housing outcomes. Similar to the mortgage remedies, clients’ housing outcomes are defined categorically, so multinomial logistic regression is used for the analysis. In the home and current is the base or reference outcome, and the reported estimates are relative risk ratios. The specification of covariates is also the same as the specification used in the previous analyses. Because the determinants of clients’ mortgage remedies are closely related to their anticipated housing outcomes, the specification includes the full set of covariates from the previous analyses.
The results in panel 1 of exhibit 6-19 show significant differences in the housing outcomes achieved by telephone counselees and in-person counselees. Controlling for the observed client and neighborhood characteristics, telephone clients were only 47 percent as likely as in-person clients to no longer be in the same home. This estimate is consistent with the significant differences in the receipt of mortgage remedies between in-person and telephone clients. Although it suggests that telephone clients achieved better housing outcomes than in-person clients, we are again concerned about the potential for unobserved differences between in-person and telephone clients.
The covariate estimates show that African American study participants were significantly more likely to remain in the home, as were study participants with a 4-year college degree. The size of the estimate for telephone counseling is sensitive to the inclusion of the race and educational status measures.
116FORECLOSURE COUNSELING OUTCOME STUDY: FINAL REPORT HOUSING COUNSELING OUTCOME EVALUATION
6. COUNSELING OUTCOMES AND FACTORS THAT AFFECT OUTCOMES
If both measures are omitted, the estimated relative risk ratio for telephone counseling is reduced substantially and is no longer significant. Because race and educational status reflect broad constructs, these measures may be capturing fundamental differences in the client populations served by the in-person and telephone counseling agencies in the study. Although the finding for clients with a college degree is consistent with previous studies of default, the reduced risk of home loss among African American clients is contrary to our expectations and probably reflects the higher rates of mortgage modifications among African American clients (see Section 6.4.2).
Panel 2 of exhibit 6-19 repeats the regression in panel 1, adding controls for the mortgage remedies received by clients. The estimates suggest that the difference in housing outcomes between in-person and telephone clients is largely accounted for by the differential receipt of mortgage remedies across client populations. Although the estimated difference between in-person and telephone clients does not completely disappear, the size of the difference is reduced substantially and is no longer significant. This result shows that the difference in outcomes is closely associated with the differences in receipt of mortgage remedies between telephone and in-person clients.
The covariate estimates in panel 1 of exhibit 6-19 suggest that early intervention is critical to the success of counseling. Study participants who were more than 6 months delinquent when they initiated counseling were nearly 6 times as likely to be out of the home 18 months later. Moreover, the size of the estimated risk of exit increased incrementally for clients who were 1 to 3 months behind, 3 to 6 months behind, and more than 6 months behind at baseline.
The estimates for neighborhood characteristics suggest that the percentage of minority residents and the vacancy rate of neighborhood housing units both are associated with clients’ housing outcomes. A 1-percentage point increase in the Census tract vacancy rate is associated with a 10-percent increase in the likelihood that a client was no longer in the home and a 9-percent increase in the likelihood that a client was in the home and behind on the mortgage. Similarly, a 1-percentage point increase in the percent of minority residents in the Census tract is associated with a 2-percent increase in the likelihood that a client was in the home and behind.
Taken together, these findings suggest that the estimates comparing telephone and in-person counseling may reflect unobserved differences in the individual and housing market characteristics of in-person and telephone clients. As a result, the analyses of mortgage remedies and housing outcomes are not likely to identify the causal impact of telephone versus in-person delivery of counseling. Instead, these estimates present regression-adjusted means that must be interpreted within the context of the analysis sample. Unobserved differences between telephone and in-person clients, as well as clients’ self-selection into telephone and in-person counseling, may contribute to the differences in outcomes.
117FORECLOSURE COUNSELING OUTCOME STUDY: FINAL REPORT HOUSING COUNSELING OUTCOME EVALUATION
6. COUNSELING OUTCOMES AND FACTORS THAT AFFECT OUTCOMES
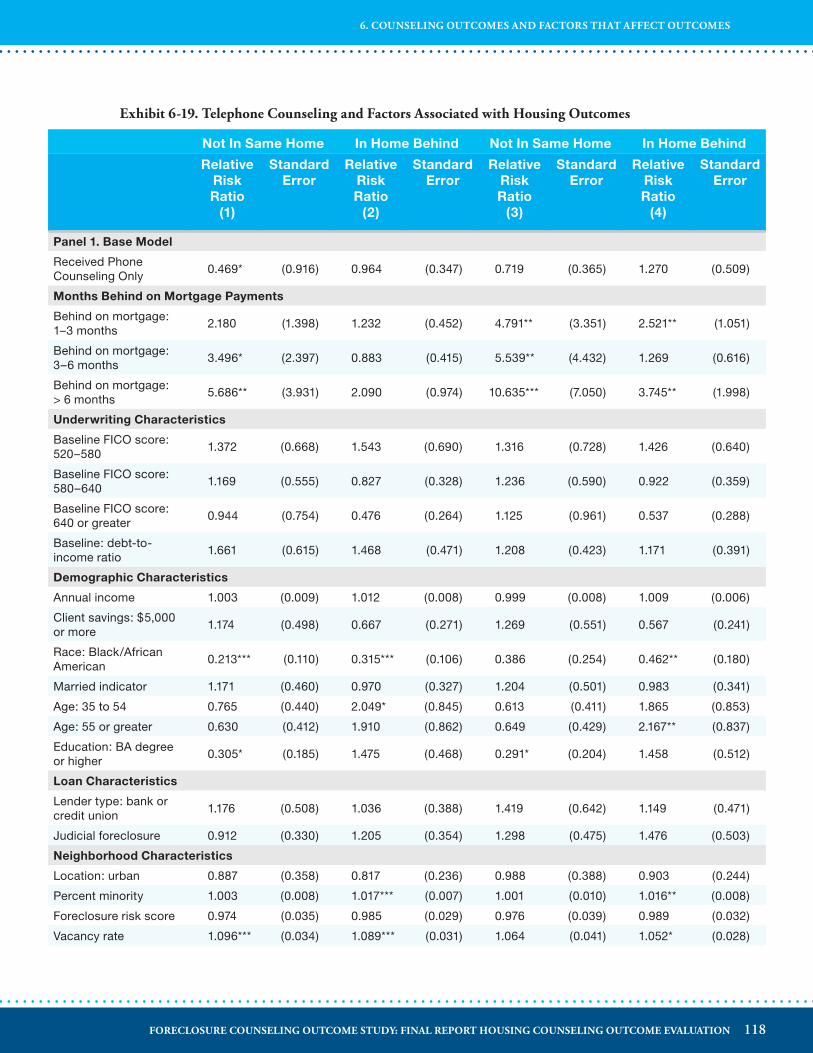
Exhibit 6-19� Telephone Counseling and Factors Associated with Housing Outcomes
Not In Same Home In Home Behind Not In Same Home In Home Behind
Relative Risk Ratio
(1)
Standard Error
Relative Risk Ratio
(2)
Standard Error
Relative Risk Ratio
(3)
Standard Error
Relative Risk Ratio
(4)
Standard Error
Panel 1. Base Model
Received Phone Counseling Only
0.469* (0.916) 0.964 (0.347) 0.719 (0.365) 1.270 (0.509)
Months Behind on Mortgage Payments
Behind on mortgage: 1–3 months
2.180 (1.398) 1.232 (0.452) 4.791** (3.351) 2.521** (1.051)
Behind on mortgage: 3–6 months
3.496* (2.397) 0.883 (0.415) 5.539** (4.432) 1.269 (0.616)
Behind on mortgage: > 6 months
5.686** (3.931) 2.090 (0.974) 10.635*** (7.050) 3.745** (1.998)
Underwriting Characteristics
Baseline FICO score: 520–580
1.372 (0.668) 1.543 (0.690) 1.316 (0.728) 1.426 (0.640)
Baseline FICO score: 580–640
1.169 (0.555) 0.827 (0.328) 1.236 (0.590) 0.922 (0.359)
Baseline FICO score: 640 or greater
0.944 (0.754) 0.476 (0.264) 1.125 (0.961) 0.537 (0.288)
Baseline: debt-to-income ratio
1.661 (0.615) 1.468 (0.471) 1.208 (0.423) 1.171 (0.391)
Demographic Characteristics
Annual income 1.003 (0.009) 1.012 (0.008) 0.999 (0.008) 1.009 (0.006)
Client savings: $5,000 or more
1.174 (0.498) 0.667 (0.271) 1.269 (0.551) 0.567 (0.241)
Race: Black/African American
0.213*** (0.110) 0.315*** (0.106) 0.386 (0.254) 0.462** (0.180)
Married indicator 1.171 (0.460) 0.970 (0.327) 1.204 (0.501) 0.983 (0.341)
Age: 35 to 54 0.765 (0.440) 2.049* (0.845) 0.613 (0.411) 1.865 (0.853)
Age: 55 or greater 0.630 (0.412) 1.910 (0.862) 0.649 (0.429) 2.167** (0.837)
Education: BA degree or higher
0.305* (0.185) 1.475 (0.468) 0.291* (0.204) 1.458 (0.512)
Loan Characteristics
Lender type: bank or credit union
1.176 (0.508) 1.036 (0.388) 1.419 (0.642) 1.149 (0.471)
Judicial foreclosure 0.912 (0.330) 1.205 (0.354) 1.298 (0.475) 1.476 (0.503)
Neighborhood Characteristics
Location: urban 0.887 (0.358) 0.817 (0.236) 0.988 (0.388) 0.903 (0.244)
Percent minority 1.003 (0.008) 1.017*** (0.007) 1.001 (0.010) 1.016** (0.008)
Foreclosure risk score 0.974 (0.035) 0.985 (0.029) 0.976 (0.039) 0.989 (0.032)
Vacancy rate 1.096*** (0.034) 1.089*** (0.031) 1.064 (0.041) 1.052* (0.028)
118FORECLOSURE COUNSELING OUTCOME STUDY: FINAL REPORT HOUSING COUNSELING OUTCOME EVALUATION
6. COUNSELING OUTCOMES AND FACTORS THAT AFFECT OUTCOMES
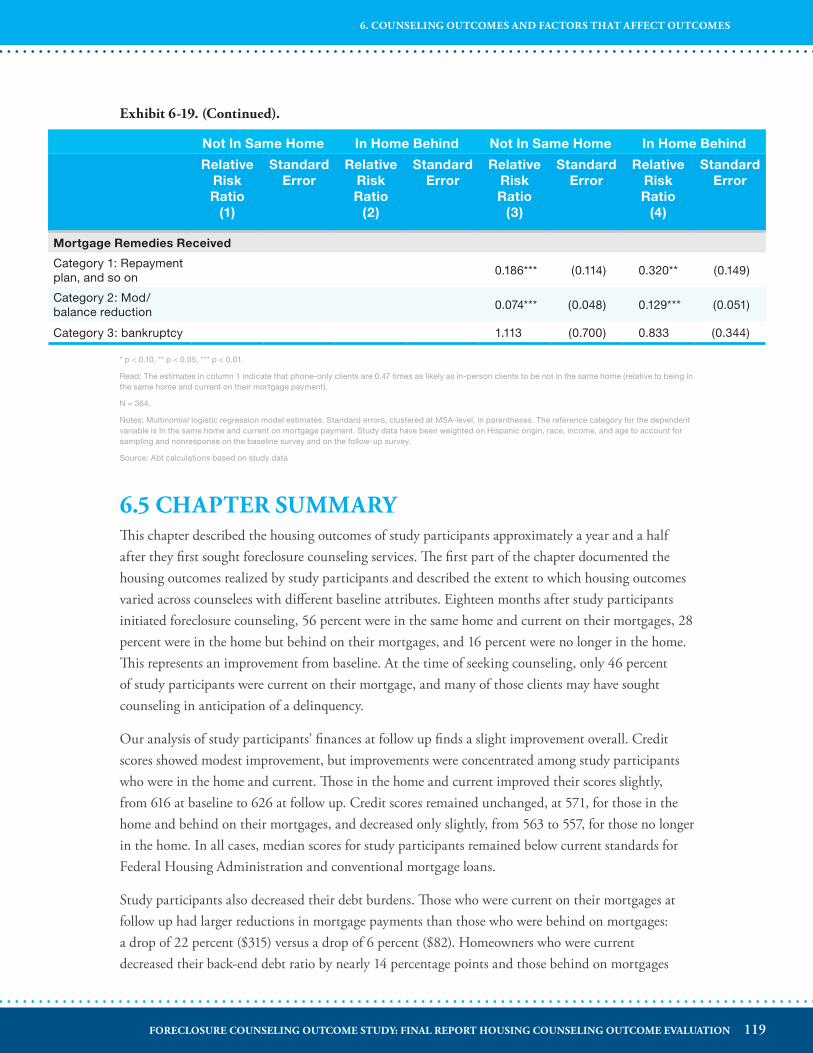
Not In Same Home In Home Behind Not In Same Home In Home Behind
Relative Risk Ratio
(1)
Standard Error
Relative Risk Ratio
(2)
Standard Error
Relative Risk Ratio
(3)
Standard Error
Relative Risk Ratio
(4)
Standard Error
Mortgage Remedies Received
Category 1: Repayment plan, and so on
0.186*** (0.114) 0.320** (0.149)
Category 2: Mod/balance reduction
0.074*** (0.048) 0.129*** (0.051)
Category 3: bankruptcy 1.113 (0.700) 0.833 (0.344)
* p < 0.10, ** p < 0.05, *** p < 0.01.
Read: The estimates in column 1 indicate that phone-only clients are 0.47 times as likely as in-person clients to be not in the same home (relative to being in the same home and current on their mortgage payment).
N = 364.
Notes: Multinomial logistic regression model estimates. Standard errors, clustered at MSA-level, in parentheses. The reference category for the dependent variable is In the same home and current on mortgage payment. Study data have been weighted on Hispanic origin, race, income, and age to account for sampling and nonresponse on the baseline survey and on the follow-up survey.
Source: Abt calculations based on study data
6�5 CHAPTER SUMMARYThis chapter described the housing outcomes of study participants approximately a year and a half after they first sought foreclosure counseling services. The first part of the chapter documented the housing outcomes realized by study participants and described the extent to which housing outcomes varied across counselees with different baseline attributes. Eighteen months after study participants initiated foreclosure counseling, 56 percent were in the same home and current on their mortgages, 28 percent were in the home but behind on their mortgages, and 16 percent were no longer in the home. This represents an improvement from baseline. At the time of seeking counseling, only 46 percent of study participants were current on their mortgage, and many of those clients may have sought counseling in anticipation of a delinquency.
Our analysis of study participants’ finances at follow up finds a slight improvement overall. Credit scores showed modest improvement, but improvements were concentrated among study participants who were in the home and current. Those in the home and current improved their scores slightly, from 616 at baseline to 626 at follow up. Credit scores remained unchanged, at 571, for those in the home and behind on their mortgages, and decreased only slightly, from 563 to 557, for those no longer in the home. In all cases, median scores for study participants remained below current standards for Federal Housing Administration and conventional mortgage loans.
Study participants also decreased their debt burdens. Those who were current on their mortgages at follow up had larger reductions in mortgage payments than those who were behind on mortgages: a drop of 22 percent ($315) versus a drop of 6 percent ($82). Homeowners who were current decreased their back-end debt ratio by nearly 14 percentage points and those behind on mortgages
Exhibit 6-19� (Continued)�
119FORECLOSURE COUNSELING OUTCOME STUDY: FINAL REPORT HOUSING COUNSELING OUTCOME EVALUATION
6. COUNSELING OUTCOMES AND FACTORS THAT AFFECT OUTCOMES
decreased debt burden by about 10 percentage points. Counselees no longer in their homes decreased their overall debt levels from 52 to 30 percent—largely reflecting the fact that they no longer had mortgages.
The second one-half of the chapter compared the mortgage remedies and housing outcomes of study participants who received in-person counseling with those who received counseling by telephone only. Of the 24 counseling agencies who participated in this study, 14 agencies provided only in-person counseling services, 6 agencies provided only telephone counseling services, and 4 agencies provided services both in-person and by telephone. Given the use of telephone counseling to expand the reach of counseling services during the foreclosure crisis and concerns that the greater use of telephone counseling would lead to worse results, the analysis examined the extent to which the telephone counselees in the study showed outcomes comparable to the outcomes for those study participants who received all or part of their counseling in person.
The results of the analysis do not provide any evidence that the outcomes of telephone clients lagged behind the outcomes of clients receiving in-person services. In-person clients in the study received, on average, longer counseling sessions and were more likely to return for an additional consultation. A higher share of telephone clients, however, received mortgage modifications and balance reductions and a higher share of telephone clients remained in their homes 18 months after counseling. These differences remain present in multivariate analyses that control for observed client and neighborhood attributes, but cannot be interpreted as causal effects of telephone versus in-person counseling.
The comparison may reflect unobserved differences between the clients of in-person and telephone counseling providers. In particular, with the data collected through the study, we could not measure differences in mortgage servicing practices, the extent of negative equity, and clients’ preferences for telephone versus in-person counseling. These unobserved factors may contribute to the differences observed between telephone and in-person clients. Our analysis suggests that study participants who received in-person services had greater needs at the time of seeking counseling than study participants who received services by telephone. For example, the average FICO score of in-person clients at baseline was 571 compared with 610 among telephone clients. Similarly, 61 percent of in-person clients were at least 1 month behind on their mortgage at baseline compared with 48 percent of telephone clients. The outcomes presented for in-person and telephone clients must therefore be considered in the context of the differences between the two client populations in the analysis sample.
6�6 OVERALL STUDY CONCLUSIONSThe findings of the Foreclosure Counseling Outcome study suggest that counseling can help homeowners at risk of foreclosure to understand their options and navigate the loss mitigation process. The homeowners in this study generally had lower incomes than the average U.S. homeowner and were more likely to be members of racial and ethnic minority groups. Most study participants had never been behind on their mortgages before and had tried to contact their servicers when they first fell behind and before seeking counseling. About three-fourths of study participants who were behind
120FORECLOSURE COUNSELING OUTCOME STUDY: FINAL REPORT HOUSING COUNSELING OUTCOME EVALUATION
6. COUNSELING OUTCOMES AND FACTORS THAT AFFECT OUTCOMES
on their mortgage payments had fallen behind because of a loss of income and very few had any savings to draw upon to repay mortgage arrears.
Despite their commitments to retaining homeownership, these homeowners had not been successful in negotiating with their lenders on their own. Housing counseling offered them outside assistance to address the financial challenges they were facing and additional help with home retention options. Their goals in housing counseling were to reduce their mortgage payments and to avoid foreclosure. With a counselor’s help, 69 percent of study participants obtained a mortgage remedy and 56 percent were able to become current on their mortgages. This example indicates that housing counseling is able to help economically vulnerable and minority homeowners sustain homeownership. The high levels of satisfaction with counseling observed at the 18-month follow up point suggest that the homeowners in the study saw value in the assistance they received.
Without a controlled experiment, this study cannot say what would have happened to this group of homeowners had they not received foreclosure counseling through a HUD-funded agency. Also, the study findings do not necessarily represent the experiences of the broader population of homeowners receiving foreclosure counseling at the time. The study does document, however, that home retention was more likely for homeowners in the study who were able to secure some mortgage remedy. Further, the study shows that a large share of study participants were able to obtain such a remedy. The results of the study are therefore consistent with counseling helping distressed homeowners who want to stay in their homes.
Since 2007, telephone counseling has expanded the reach of housing counseling to serve a much higher volume of clients. Results from this study give no indication that telephone-based assistance is less effective than in-person counseling, although the study is not able to fully account for differences between clients served by in-person and telephone counseling. Instead, analysis of client characteristics and outcomes is consistent with the use of the two delivery channels to offer alternatives for homeowners in distress to access counseling services.
Put differently, the study findings suggest that securing a broad geographic reach of counseling may be a more important consideration than the relative impact of the delivery channel. The impact evaluation of the National Foreclosure Mitigation Counseling program (NFMC) has found a positive impact of counseling, suggesting that provision of counseling is able to improve client outcomes. The recommendation to expand the reach of counseling services is consistent with the on-demand nature of foreclosure counseling—where clients must initiate the counseling process by seeking assistance. Because of this process, promoting the use of counseling services may be the may be the most critical factor to the success of foreclosure counseling programs. For example, outreach efforts might target homeowners who are faced with a job loss to promote awareness of counseling services and early contact with a counseling agency. Given the positive findings of this study and those of the NFMC evaluation, dedicating resources to expanding the coverage and outreach activities of the counseling industry overall is likely to be valuable, even while experimental research—such as HUD’s new study of the impact of different kinds of pre-purchase counseling on sustainable homeownership—continues to try to identify and encourage the most effective counseling models.
121FORECLOSURE COUNSELING OUTCOME STUDY: FINAL REPORT HOUSING COUNSELING OUTCOME EVALUATION
6. COUNSELING OUTCOMES AND FACTORS THAT AFFECT OUTCOMES
APPENDIX A� STATISTICAL WEIGHTING TO ACCOUNT FOR SAMPLING AND NONRESPONSE BIAS
BASELINE SURVEYThe Foreclosure Mitigation Counseling Study was designed to produce a sample of counseling agencies and clients that was geographically dispersed and as representative as possible of the overall population of homeowners who received foreclosure counseling services from HUD-approved and HUD-funded counseling agencies in the fall of 2009. Based on how the agencies were sampled, we developed initial foreclosure counseling client weights so that the expected sample of clients would reflect all counseling clients nationally. During baseline recruitment, 24 counseling agencies recruited 824 clients into the sample. Following recruitment, we used raking ratio estimation to adjust the initial counseling client weights to account for nonresponse bias so that the weighted sample matched the actual distributions of clients by Hispanic origin, race, income, and age that were served by the agencies during the recruitment period.
Raking ratio estimation is also known as raking. Raking usually proceeds one variable at a time, applying a proportional adjustment to the weights of the cases that belong to the same category of the control variable. The initial design weights in the raking process are often equal to the inverse of the selection probabilities and may have undergone some adjustments for unit nonresponse and noncoverage. The weights from the raking process are used in estimation and analysis. The adjustment to control totals is sometimes achieved by creating a cross-classification of the categorical control variables (for example, age categories by gender by race by household-income categories) and then matching the total of the weights in each cell to the control total. This approach, however, can spread the sample thinly over a large number of adjustment cells. It also requires control totals for all cells of the cross-classification. Often this approach is not feasible (for example, control totals may be available for age by gender by race but not when those cells are subdivided by household income).
The use of raking with marginal control totals for single variables (that is, each margin involves only one control variable) often avoids many of these difficulties. The procedure known as raking adjusts a set of data so that its marginal totals match control totals on a specified set of variables. The term raking suggests an analogy with the process of smoothing the soil in a garden plot by alternately working it back and forth with a rake in two perpendicular directions. In a simple two-variable example the marginal totals in various categories for the two control variables are known from the
122FORECLOSURE COUNSELING OUTCOME STUDY: FINAL REPORT HOUSING COUNSELING OUTCOME EVALUATION
APPENDIX A. STATISTICAL WEIGHTING TO ACCOUNT FOR SAMPLING AND NONRESPONSE BIAS
entire population, but the joint distribution of the two variables is known only from a sample. In the cross-classification of the sample, arranged in rows and columns, one might begin with the rows, taking each row in turn and multiplying each entry in the row by the ratio of the population total to the weighted sample total for that category, so that the row totals of the adjusted data agree with the population totals for that variable.
The weighted column totals of the adjusted data, however, may not yet agree with the population totals for the column variable. Thus the next step, taking each column in turn, multiplies each entry in the column by the ratio of the population total to the current total for that category. Now the weighted column totals of the adjusted data agree with the population totals for that variable, but the new weighted row totals may no longer match the corresponding population totals. This process continues, alternating between the rows and the columns, and close agreement on both rows and columns is usually achieved after a small number of iterations. The result is a tabulation for the population that reflects the relation of the two control variables in the sample. Raking can also adjust a set of data to control totals on three or more variables. In such situations the control totals often involve single variables, but they may involve two or more variables. We used the IGCV SAS raking macro (Izrael, Battaglia, and Frankel, 2009) to conduct the raking to control totals for this study. The raking procedure resulted in a baseline weight being assigned to each of the 824 baseline client interviews.
The data used in the raking procedure were primarily administrative data collected by housing counseling agencies for all clients who received foreclosure prevention counseling services during the enrollment period for this study (between mid-August and early December 2009). The administrative data were collected from the housing counseling agencies by Abt Associates Inc. and HUD staff between September and November 2010. The data collected from each agency included aggregated information about all foreclosure prevention clients’ ethnicity, race, age, and income.
National Foreclosure Mitigation Counseling (NFMC) program administrative data were used where administrative data could not be obtained directly from the housing counseling agency. The NFMC database includes a large subset of the total universe of foreclosure prevention counseling clients and is representative of the total foreclosure prevention client population. NFMC data were used in place of all administrative data for 4 of the 24 housing counseling agencies that collected data on foreclosure clients. NFMC data were used to supplement administrative data with information on client income for an additional 6 agencies. For one of the agencies, Consumer Credit Counseling Services of Dallas, we relied on NFMC data that included information on clients from two other Texas cities in addition to Dallas.
Where agencies were unable to provide accurate counts of the total number of non-Hispanic clients served (17 of the 24 agencies), the value of non-Hispanic was imputed by taking the total number of valid responses for race and subtracting the total number of Hispanic clients. For all questions, missing responses were excluded from the analysis.
123FORECLOSURE COUNSELING OUTCOME STUDY: FINAL REPORT HOUSING COUNSELING OUTCOME EVALUATION
APPENDIX A. STATISTICAL WEIGHTING TO ACCOUNT FOR SAMPLING AND NONRESPONSE BIAS
To ensure that the agency weights would equal the correct universe, the administrative data client totals for each category were adjusted by the ratio of the total number of clients the agency reported serving during the enrollment period, divided by the total valid responses in the administrative (or NFMC) data, by question.
FOLLOW-UP TELEPHONE SURVEYBetween March and May of 2011, we conducted a follow-up survey by telephone of 539 baseline clients.77 As discussed above, weights had previously been calculated for the 824 baseline client interviews. The baseline weights of the 539 follow-up survey respondents were inflated so that, when weighted, the 539 clients equaled the same client total as the weighted 824 client baseline survey sample. In addition, as discussed previously we adjusted the initial follow-up weights using raking ratio estimation to force the weighted follow-up distribution of Hispanic origin, race, income, and age to match the distributions of the weighted baseline sample.
Following these adjustments to the initial follow-up survey weights, we examined the difference in the distribution of the weighted totals of all 824 baseline clients (using the baseline weights) and the 539 follow-up clients (using the initial follow-up client weights). The three variables examined were (1) the percent of clients served by HOPE telephone counseling agencies, (2) the percent who were more than one month behind on their mortgage payment at the time of counseling intake, and (3) the percent who experienced a foreclosure within the 24 months prior to the follow-up survey. Clients who had been served by a HOPE Hotline agency made up 7 percentage points more of the weighted follow-up sample than the weighted baseline sample (49 percent in the baseline, 56 percent in the follow-up). The differences between clients who experienced a foreclosure or were greater than one month late on their mortgage were insignificant (1 percentage point). We added a variable to the raking ratio estimation which identified clients who were served in at least one in-person counseling session to correct for the 7-percentage point difference seen between the baseline and follow-up HOPE and non-HOPE telephone counseling distribution. The final follow-up weights were adjusted using the initial four variables used for the baseline nonresponse weighting adjustment (Hispanic origin, race, income, and age) as well as the method of service provision (telephone-only or in-person counseling).
77. The telephone survey was conducted on 540 of the 825 baseline sample clients. One of the 540 clients was excluded from the follow-up survey and retroactively removed from the 825 client baseline analysis sample because he or she did not receive foreclosure mitigation counseling. This leaves an effective follow-up telephone survey sample size of 539 clients and an effective baseline survey analysis sample size of 824 clients.
124FORECLOSURE COUNSELING OUTCOME STUDY: FINAL REPORT HOUSING COUNSELING OUTCOME EVALUATION
APPENDIX A. STATISTICAL WEIGHTING TO ACCOUNT FOR SAMPLING AND NONRESPONSE BIAS
APPENDIX B� BASELINE SURVEYINSTRUCTIONSThe U.S. Department of Housing and Urban Development with Abt Associates is conducting a study of how well your housing counseling needs will be met and how to improve services provided to you. We’d like to ask you some questions about yourself and, if applicable, the people you own your house with. Your answers to all questions will be confidential and will not affect any counseling or other services you receive. Answering the questions will take about 30 minutes. If you have any questions as you complete the questionnaire, please ask the counseling agency staff overseeing this survey.
In this survey, most of the questions provide a list of possible answers to choose from. For example, if there was a question that asked about the day of the week, it might read:
Yes
No
Please use a pencil or dark-colored pen (black or blue ink) to fill in the circle next to your answer� Please fill in the entire circle� For example:
Sample Question. Is today Sunday? (Select only one.)
Yes
No
Some questions allow you to “select one or more” responses. For these questions, mark all the answers that apply. For example:
Sample Question. What color eyes do your friends have? (Select one or more.)
Hazel
Brown
Black
Green
Blue
125FORECLOSURE COUNSELING OUTCOME STUDY: FINAL REPORT HOUSING COUNSELING OUTCOME EVALUATION
APPENDIX B. BASELINE SURVEY
If you mistakenly fill in the wrong response, please put a large “X” through the incorrect response and write a note next to the question telling us which response is correct� If you are using pencil, erasing the pencil mark will also work well�
Some questions ask you to write your answer� For these, please print neatly�
Thank you for your assistance.
SURVEY QUESTIONS1. What are the main reasons you are seeking housing counseling services at this time?
(Select one or more.)
I want to bring my mortgage current
I want to avoid foreclosure
I want to lower my monthly mortgage payments
I want to refinance my mortgage
I want help negotiating with my lender
I believe I am a victim of predatory lending
I want to improve my credit
I want to sell my house
I need counseling to qualify for financial assistance/second mortgage/refinancing
I want advice about possibly filing for bankruptcy
I want help with home repairs or home improvement financing
I want help finding an affordable housing solution
Other reason (specify):
126FORECLOSURE COUNSELING OUTCOME STUDY: FINAL REPORT HOUSING COUNSELING OUTCOME EVALUATION
APPENDIX B. BASELINE SURVEY
2. How did you hear about the housing counseling services at this agency? (Select one or more.)
Through a family member or friend
Through my bank or lender
Through another housing counseling agency
Through my landlord or housing authority
Through my employer
Through a real estate agent
Through the HUD website or local HUD office
Through another website or web search
Through the newspaper, TV, or radio
Through a poster or billboard
Through a flyer I received in the mail
I just walked in
Other reason (specify):
3. In the past 3 years, have you received any counseling or education on the following topics? Include any counseling/education received from this agency and other agencies. (Select one or more.)
Improving your credit or managing your debt
Budgeting or financial management
Buying/owning a house
Managing your mortgage payments or avoiding foreclosure
Renting
Retirement planning
127FORECLOSURE COUNSELING OUTCOME STUDY: FINAL REPORT HOUSING COUNSELING OUTCOME EVALUATION
APPENDIX B. BASELINE SURVEY
4. Are you the sole owner of your house?
Yes è Skip to #5
No è Who owns your house with you? (Select one or more.)
My legal spouse
My common law spouse
My domestic partner
My son or daughter
A parent or other relative
A nonrelative
The following questions ask about your income and assets� Answer the questions for your-self plus anyone who owns your house with you (your co-owners)�
5. What is your gross monthly income? (Please provide your best estimate. Include all sources of income and the income of any co-owners as well as your own income.)
$ ______________________
a. Does this include…? (Select one or more.)
Income from employment
Interest, dividend, or other investment income
Child support payments, alimony, or maintenance payments
Social Security retirement or disability benefits
Other pensions or retirement income
Unemployment benefits
Veterans’ benefits
Income from rental properties
Other income
128FORECLOSURE COUNSELING OUTCOME STUDY: FINAL REPORT HOUSING COUNSELING OUTCOME EVALUATION
APPENDIX B. BASELINE SURVEY
6. How much money do you have in savings? (“Savings” includes money in checking accounts, savings accounts, money market accounts, certificates of deposit, mutual funds, brokerage accounts, savings at home, savings with others who are keeping it safe, and any other kinds of savings. Include your savings as well as the savings of any co-owners. Enter 0 if you have no savings of any kind.)
$ ______________________
Don’t know
7. How much money do you have in retirement accounts, such as 401(k) accounts, 403(b) accounts, or IRAs? (Include your retirement accounts as well as those of any co-owners. Enter 0 if you do not have a retirement account of any kind.)
$ ______________________
Don’t know
The following questions are about the house or property that you are seeking assistance with� If you are seeking help for more than one house or property, answer the question for the house/property that is your primary residence if applicable; otherwise reply for the property you have owned the longest�
8. What type of housing is the house/apartment that you own? (Select only one.)
Single family home
Condominium or cooperative
Multifamily home (where you rent out one or more units)
Manufactured or mobile home
Other (specify):
129FORECLOSURE COUNSELING OUTCOME STUDY: FINAL REPORT HOUSING COUNSELING OUTCOME EVALUATION
APPENDIX B. BASELINE SURVEY
9. When did you purchase this house? (Select only one.)
Before 1980 2001 2006
1980–1985 2002 2007
1986–1990 2003 2008
1991–1995 2004
1996–2000 2005
10. Are you currently living in the house? (Select only one.)
Yes
No, I previously lived there but have moved out
No, it was purchased as an investment property
11. Do you still have the original mortgage you used to buy this home, or have you refinanced that loan?
I still have the original loan è Skip to #12
I refinanced è a. How many times have you refinanced in the last 5 years? (Select only one.)
Once
Twice
Three times
More than three timesb. If you obtained cash when you refinanced, what did you spend the money on?
(Select one or more.)
Home improvements or repairs Educational expenses
Invest in a business Appliances or furniture
Divorce/separation expenses Investment in real estate
Medical/dental expenses Travel/vacation expenses
Tax and insurance expenses Wedding or funeral expenses
Vacation property Car or boat expenses
Bill/debt consolidation I did not obtain cash
Other (specify):
130FORECLOSURE COUNSELING OUTCOME STUDY: FINAL REPORT HOUSING COUNSELING OUTCOME EVALUATION
APPENDIX B. BASELINE SURVEY
12. What type of lender did you get your current mortgage from? (Select only one.)
From my regular bank
From my credit union
From another bank in my area
From a mortgage broker or mortgage company
From another type of lender (specify):
Don’t know
13. How did you find the lender? (Select only one.)
Through family or friends
Through my place of worship
Through the Internet/website
Through my real estate agent
The lender contacted me
I had worked with the lender before
I don’t recall
Other
14. How many lenders did you meet or speak with before choosing one? (Select only one.)
I met/spoke only with the lender that gave me the mortgage
I met/spoke with one other lender
I met/spoke with two other lenders
I met/spoke with more than two other lenders
I don’t recall
131FORECLOSURE COUNSELING OUTCOME STUDY: FINAL REPORT HOUSING COUNSELING OUTCOME EVALUATION
APPENDIX B. BASELINE SURVEY
15. Do you think your lender treated you fairly? (Select only one.)
Yes
No
Don’t know
16. Are you behind on your mortgage payments at this time? (Select only one.)
Yes
No è Skip to #22
17. How many months behind are you? _______________ months
18. Have you received a notice of intent to foreclose from your bank or lender? (Select only one.)
Yes
No
19. What caused you to get behind on your mortgage? (Select one or more.)
Mortgage payments were always too high
Mortgage payments increased
Difficulty paying property taxes or homeowners’ insurance
Difficulty paying for home repair or maintenance
Insufficient rental income from property
Credit card debt or other loan burden
Car expenses
Business venture failed
Lost job
Still employed, but income reduced
Injury or health emergency
Chronic medical condition or disability
Divorce/separation
Death in family
Other (specify):
132FORECLOSURE COUNSELING OUTCOME STUDY: FINAL REPORT HOUSING COUNSELING OUTCOME EVALUATION
APPENDIX B. BASELINE SURVEY
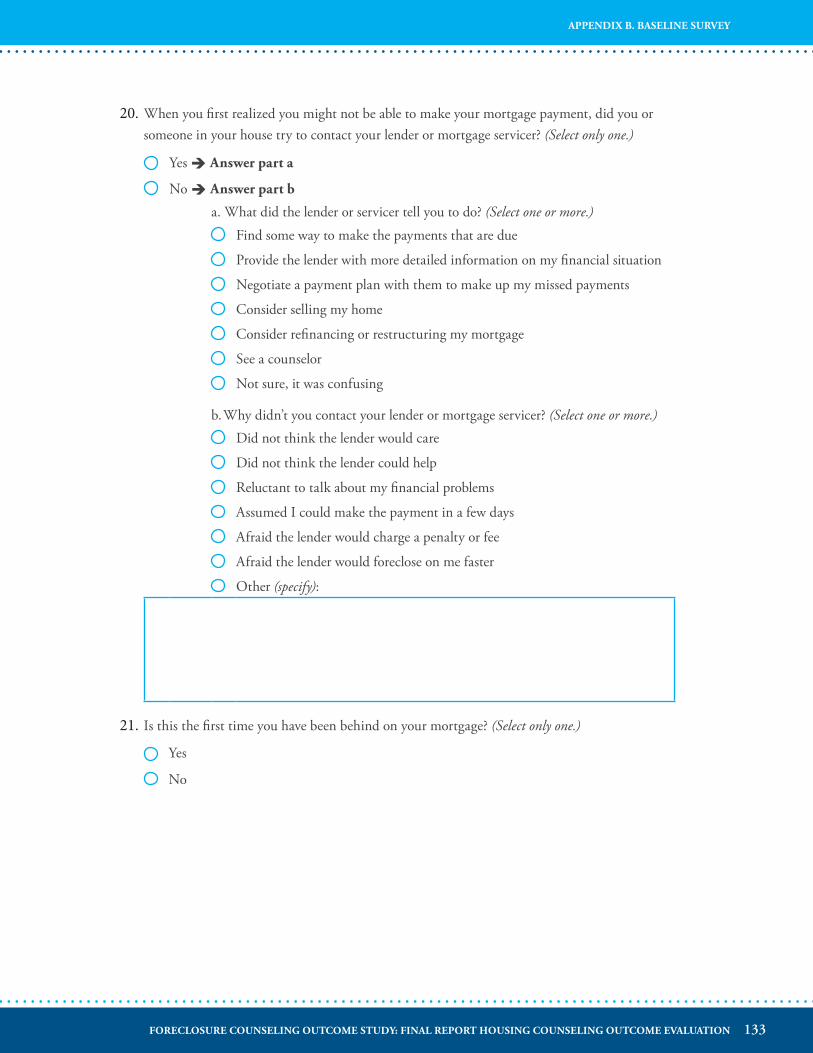
20. When you first realized you might not be able to make your mortgage payment, did you or someone in your house try to contact your lender or mortgage servicer? (Select only one.)
Yes è Answer part a
No è Answer part b
a. What did the lender or servicer tell you to do? (Select one or more.)
Find some way to make the payments that are due
Provide the lender with more detailed information on my financial situation
Negotiate a payment plan with them to make up my missed payments
Consider selling my home
Consider refinancing or restructuring my mortgage
See a counselor
Not sure, it was confusing
b. Why didn’t you contact your lender or mortgage servicer? (Select one or more.)
Did not think the lender would care
Did not think the lender could help
Reluctant to talk about my financial problems
Assumed I could make the payment in a few days
Afraid the lender would charge a penalty or fee
Afraid the lender would foreclose on me faster
Other (specify):
21. Is this the first time you have been behind on your mortgage? (Select only one.)
Yes
No
133FORECLOSURE COUNSELING OUTCOME STUDY: FINAL REPORT HOUSING COUNSELING OUTCOME EVALUATION
APPENDIX B. BASELINE SURVEY
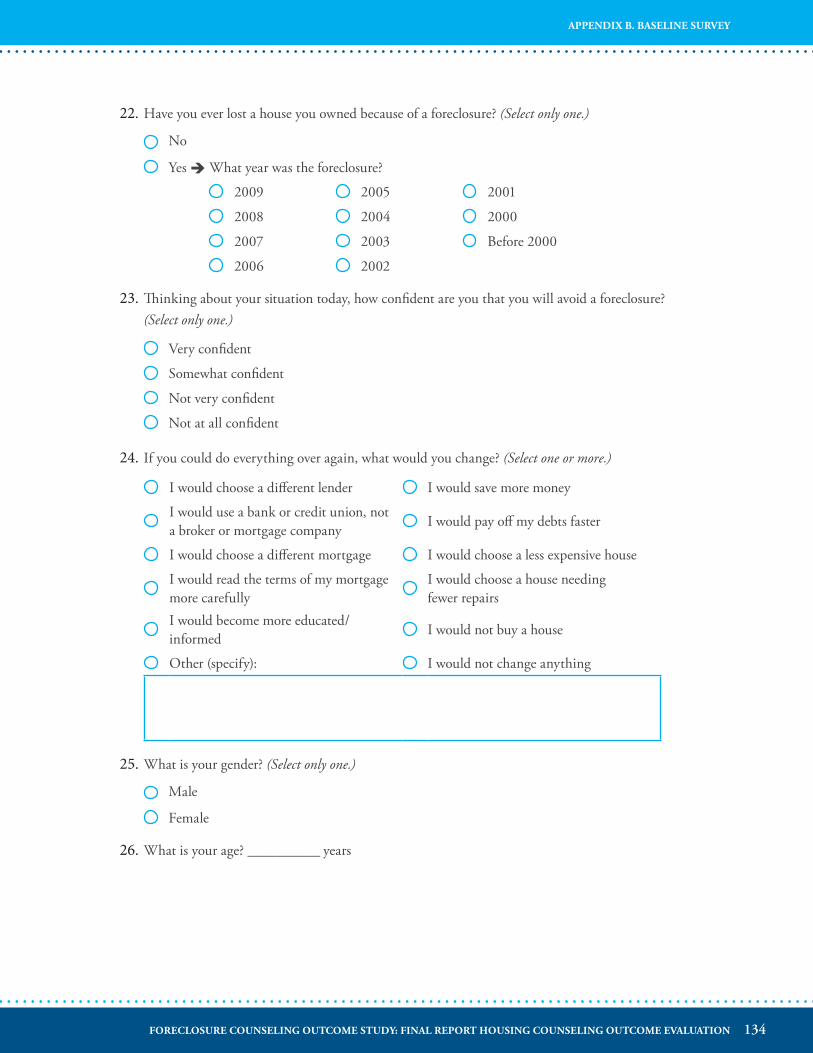
22. Have you ever lost a house you owned because of a foreclosure? (Select only one.)
No
Yes è What year was the foreclosure?
2009 2005 2001
2008 2004 2000
2007 2003 Before 2000
2006 2002
23. Thinking about your situation today, how confident are you that you will avoid a foreclosure? (Select only one.)
Very confident
Somewhat confident
Not very confident
Not at all confident
24. If you could do everything over again, what would you change? (Select one or more.)
I would choose a different lender I would save more money
I would use a bank or credit union, not a broker or mortgage company
I would pay off my debts faster
I would choose a different mortgage I would choose a less expensive house
I would read the terms of my mortgage more carefully
I would choose a house needing fewer repairs
I would become more educated/informed
I would not buy a house
Other (specify): I would not change anything
25. What is your gender? (Select only one.)
Male
Female
26. What is your age? __________ years
134FORECLOSURE COUNSELING OUTCOME STUDY: FINAL REPORT HOUSING COUNSELING OUTCOME EVALUATION
APPENDIX B. BASELINE SURVEY
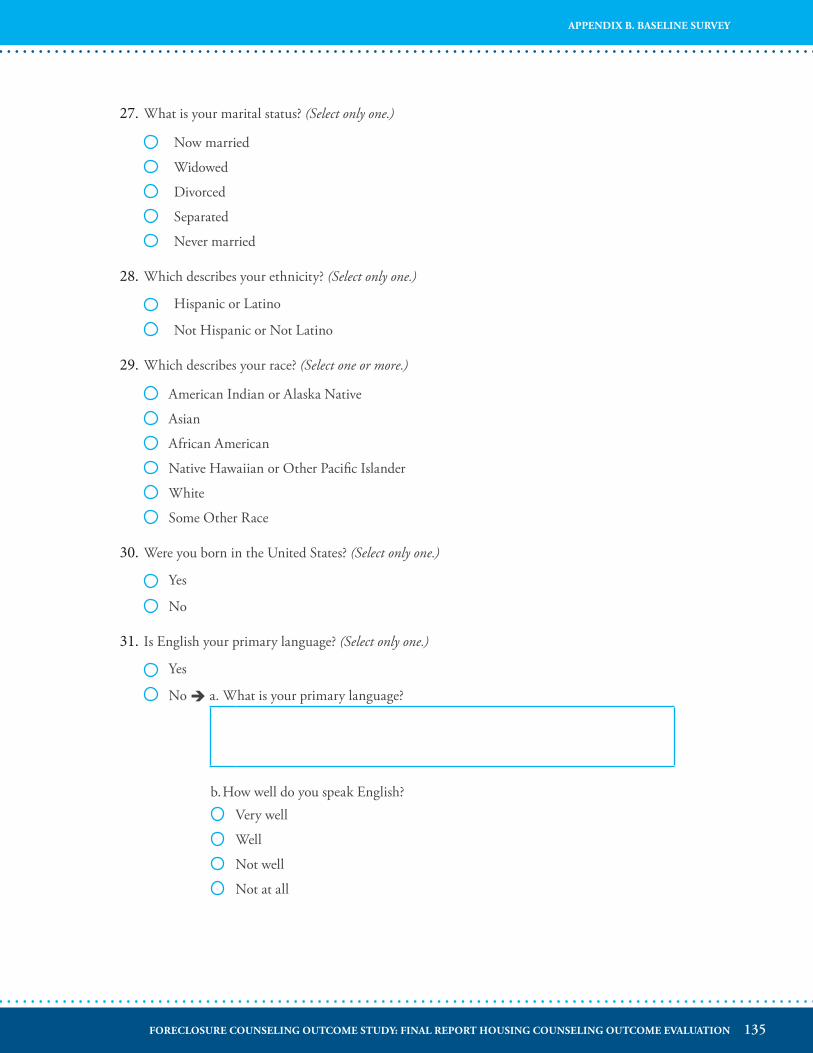
27. What is your marital status? (Select only one.)
Now married
Widowed
Divorced
Separated
Never married
28. Which describes your ethnicity? (Select only one.)
Hispanic or Latino
Not Hispanic or Not Latino
29. Which describes your race? (Select one or more.)
American Indian or Alaska Native
Asian
African American
Native Hawaiian or Other Pacific Islander
White
Some Other Race
30. Were you born in the United States? (Select only one.)
Yes
No
31. Is English your primary language? (Select only one.)
Yes
No è a. What is your primary language?
b. How well do you speak English?Very well
Well
Not well
Not at all
135FORECLOSURE COUNSELING OUTCOME STUDY: FINAL REPORT HOUSING COUNSELING OUTCOME EVALUATION
APPENDIX B. BASELINE SURVEY
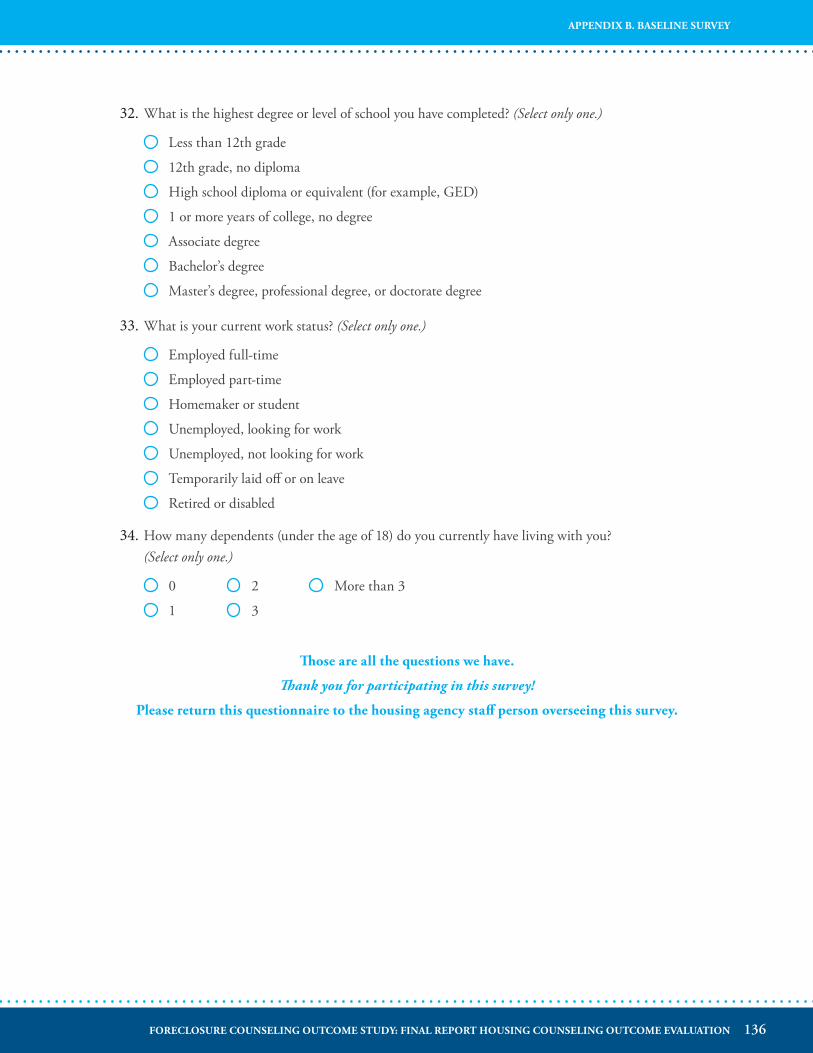
32. What is the highest degree or level of school you have completed? (Select only one.)
Less than 12th grade
12th grade, no diploma
High school diploma or equivalent (for example, GED)
1 or more years of college, no degree
Associate degree
Bachelor’s degree
Master’s degree, professional degree, or doctorate degree
33. What is your current work status? (Select only one.)
Employed full-time
Employed part-time
Homemaker or student
Unemployed, looking for work
Unemployed, not looking for work
Temporarily laid off or on leave
Retired or disabled
34. How many dependents (under the age of 18) do you currently have living with you? (Select only one.)
0 2 More than 3
1 3
Those are all the questions we have�
Thank you for participating in this survey!
Please return this questionnaire to the housing agency staff person overseeing this survey�
136FORECLOSURE COUNSELING OUTCOME STUDY: FINAL REPORT HOUSING COUNSELING OUTCOME EVALUATION
APPENDIX B. BASELINE SURVEY
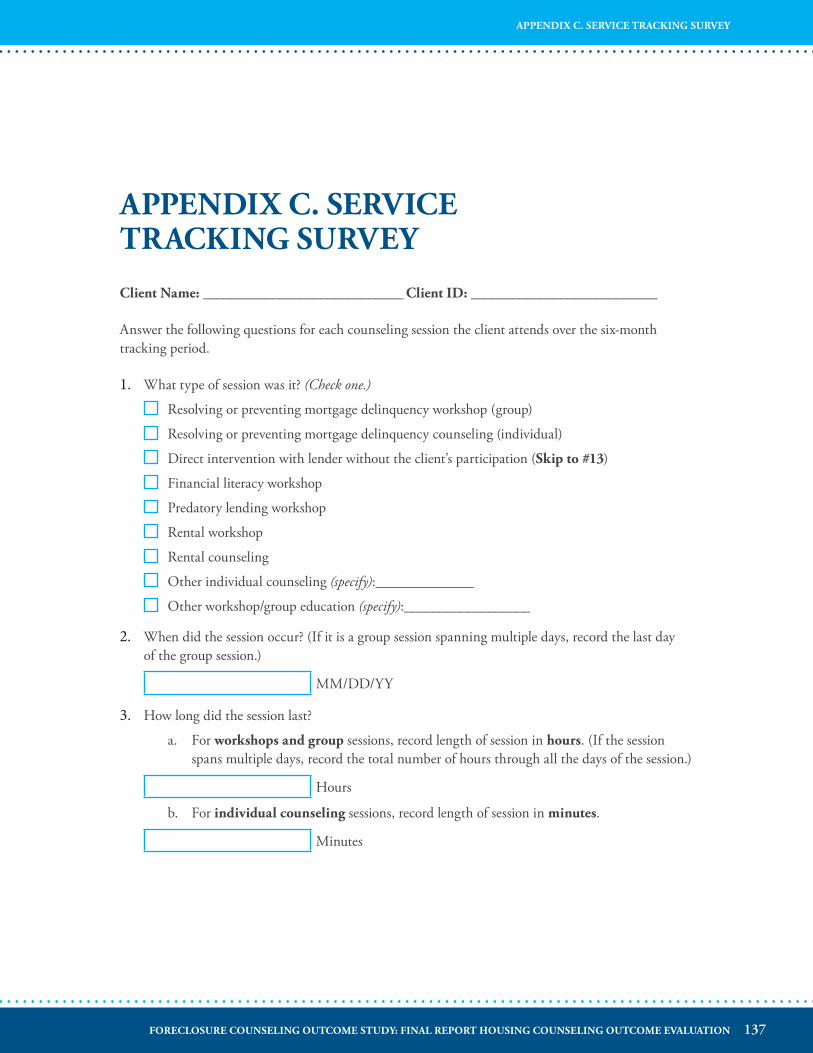
APPENDIX C� SERVICE TRACKING SURVEY
Client Name: _____________________________ Client ID: ___________________________
Answer the following questions for each counseling session the client attends over the six-month tracking period.
1. What type of session was it? (Check one.)
Resolving or preventing mortgage delinquency workshop (group)
Resolving or preventing mortgage delinquency counseling (individual)
Direct intervention with lender without the client’s participation (Skip to #13)
Financial literacy workshop
Predatory lending workshop
Rental workshop
Rental counseling
Other individual counseling (specify):______________
Other workshop/group education (specify):__________________
2. When did the session occur? (If it is a group session spanning multiple days, record the last day of the group session.)
MM/DD/YY
3. How long did the session last?
a. For workshops and group sessions, record length of session in hours. (If the session spans multiple days, record the total number of hours through all the days of the session.)
Hours
b. For individual counseling sessions, record length of session in minutes.
Minutes
137FORECLOSURE COUNSELING OUTCOME STUDY: FINAL REPORT HOUSING COUNSELING OUTCOME EVALUATION
APPENDIX C. SERVICE TRACKING SURVEY
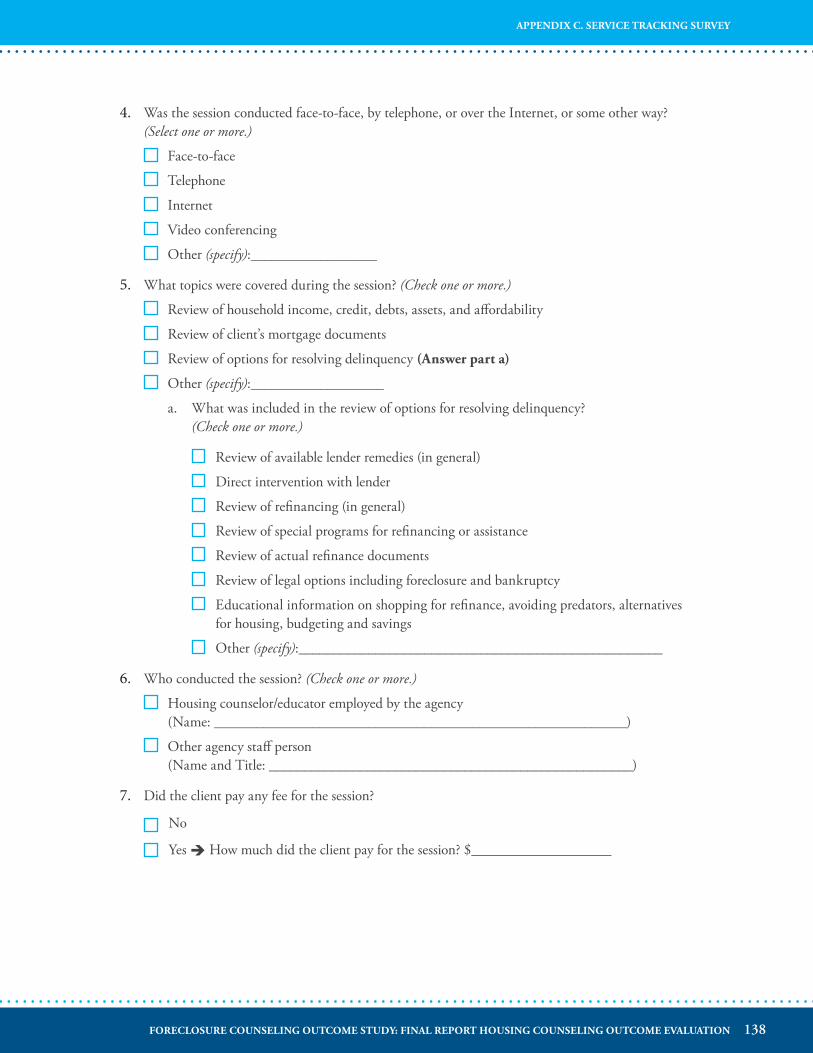
4. Was the session conducted face-to-face, by telephone, or over the Internet, or some other way? (Select one or more.)
Face-to-face
Telephone
Internet
Video conferencing
Other (specify):__________________
5. What topics were covered during the session? (Check one or more.)
Review of household income, credit, debts, assets, and affordability
Review of client’s mortgage documents
Review of options for resolving delinquency (Answer part a)
Other (specify):___________________
a. What was included in the review of options for resolving delinquency? (Check one or more.)
Review of available lender remedies (in general)
Direct intervention with lender
Review of refinancing (in general)
Review of special programs for refinancing or assistance
Review of actual refinance documents
Review of legal options including foreclosure and bankruptcy
Educational information on shopping for refinance, avoiding predators, alternatives for housing, budgeting and savings
Other (specify):____________________________________________________
6. Who conducted the session? (Check one or more.)
Housing counselor/educator employed by the agency (Name: ___________________________________________________________)
Other agency staff person (Name and Title: ____________________________________________________)
7. Did the client pay any fee for the session?
No
Yes è How much did the client pay for the session? $____________________
138FORECLOSURE COUNSELING OUTCOME STUDY: FINAL REPORT HOUSING COUNSELING OUTCOME EVALUATION
APPENDIX C. SERVICE TRACKING SURVEY
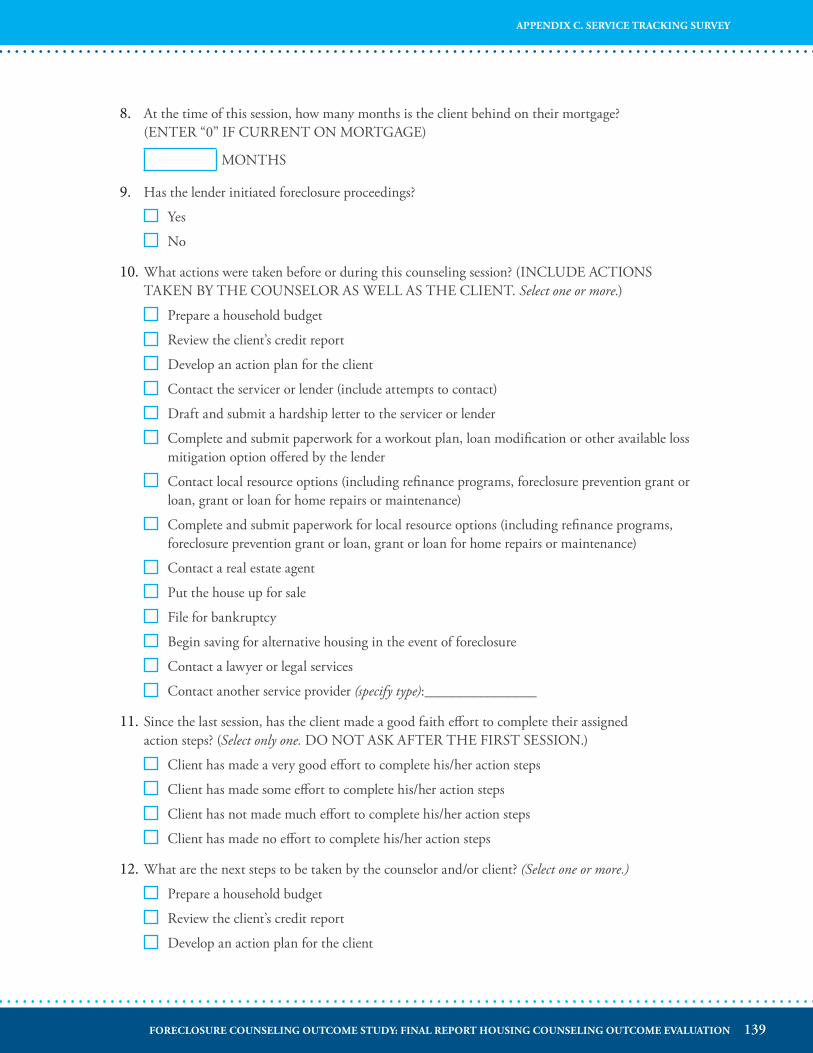
8. At the time of this session, how many months is the client behind on their mortgage? (ENTER “0” IF CURRENT ON MORTGAGE)
MONTHS
9. Has the lender initiated foreclosure proceedings?
Yes
No
10. What actions were taken before or during this counseling session? (INCLUDE ACTIONS TAKEN BY THE COUNSELOR AS WELL AS THE CLIENT. Select one or more.)
Prepare a household budget
Review the client’s credit report
Develop an action plan for the client
Contact the servicer or lender (include attempts to contact)
Draft and submit a hardship letter to the servicer or lender
Complete and submit paperwork for a workout plan, loan modification or other available loss mitigation option offered by the lender
Contact local resource options (including refinance programs, foreclosure prevention grant or loan, grant or loan for home repairs or maintenance)
Complete and submit paperwork for local resource options (including refinance programs, foreclosure prevention grant or loan, grant or loan for home repairs or maintenance)
Contact a real estate agent
Put the house up for sale
File for bankruptcy
Begin saving for alternative housing in the event of foreclosure
Contact a lawyer or legal services
Contact another service provider (specify type):________________
11. Since the last session, has the client made a good faith effort to complete their assigned action steps? (Select only one. DO NOT ASK AFTER THE FIRST SESSION.)
Client has made a very good effort to complete his/her action steps
Client has made some effort to complete his/her action steps
Client has not made much effort to complete his/her action steps
Client has made no effort to complete his/her action steps
12. What are the next steps to be taken by the counselor and/or client? (Select one or more.)
Prepare a household budget
Review the client’s credit report
Develop an action plan for the client
139FORECLOSURE COUNSELING OUTCOME STUDY: FINAL REPORT HOUSING COUNSELING OUTCOME EVALUATION
APPENDIX C. SERVICE TRACKING SURVEY
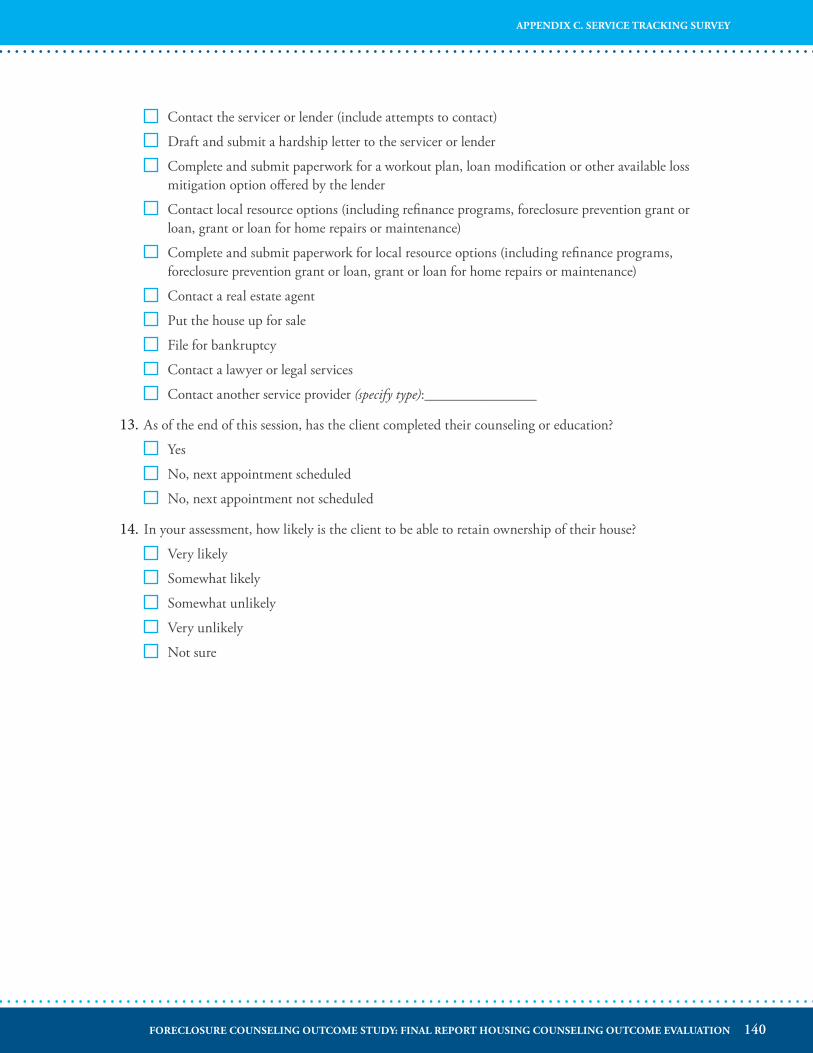
Contact the servicer or lender (include attempts to contact)
Draft and submit a hardship letter to the servicer or lender
Complete and submit paperwork for a workout plan, loan modification or other available loss mitigation option offered by the lender
Contact local resource options (including refinance programs, foreclosure prevention grant or loan, grant or loan for home repairs or maintenance)
Complete and submit paperwork for local resource options (including refinance programs, foreclosure prevention grant or loan, grant or loan for home repairs or maintenance)
Contact a real estate agent
Put the house up for sale
File for bankruptcy
Contact a lawyer or legal services
Contact another service provider (specify type):________________
13. As of the end of this session, has the client completed their counseling or education?
Yes
No, next appointment scheduled
No, next appointment not scheduled
14. In your assessment, how likely is the client to be able to retain ownership of their house?
Very likely
Somewhat likely
Somewhat unlikely
Very unlikely
Not sure
140FORECLOSURE COUNSELING OUTCOME STUDY: FINAL REPORT HOUSING COUNSELING OUTCOME EVALUATION
APPENDIX C. SERVICE TRACKING SURVEY
APPENDIX D� MORTGAGE CHARACTERISTICS SURVEY
Client Name: _____________________________ Client ID: ___________________________
Complete this module once per client at or near the time of enrollment into the study.
1. What type is the primary mortgage?
Standard ARM Fixed Rate
Option ARM Other (specify):
Interest only
2. When was the primary mortgage originated? ________________ MM/YYYY
3. What is the full term of the loan? ____________________ years
4. What was the interest rate at origination? _______________percent
5. For adjustable-rate loans:
a. What is the current interest rate? _________________percent
b. What is the maximum annual interest rate adjustment? _________________percent
6. What was the original loan amount? $_____________________
7. What is the current loan amount? $________________________
8. What is the estimated current value of the home? $_____________________
a. What is the source of this estimate?
Client estimateCounselor estimate based on discussion with client
Tax assessed value Other (specify):
Zillow or other online home valuation tool
9. What is the total amount of any subordinate mortgages? (WRITE 0 if none) $____________________
141FORECLOSURE COUNSELING OUTCOME STUDY: FINAL REPORT HOUSING COUNSELING OUTCOME EVALUATION
APPENDIX D. MORTGAGE CHARACTERISTICS SURVEY
10. Did the client purchase the home with assistance from a government program or nonprofit organization in the form of a loan or grant?
Yes
No
Don’t know
11. What is the current monthly mortgage payment? $____________________
12. Does the monthly mortgage payment include property taxes?
Yes
No è What is the annual property tax payment? $__________________________
13. Does the monthly mortgage payment include homeowners insurance?
Yes
No è What is the annual homeowners’ insurance payment? $__________________
14. Does the monthly mortgage payment include private mortgage insurance or FHA insurance?
Yes
No
15. What is the total monthly utility cost for the property (electricity, heat, gas, and water)? $______________________
142FORECLOSURE COUNSELING OUTCOME STUDY: FINAL REPORT HOUSING COUNSELING OUTCOME EVALUATION
APPENDIX D. MORTGAGE CHARACTERISTICS SURVEY
APPENDIX E� COUNSELOR SURVEYThis survey is intended to gather basic information on the educators and counselors providing assistance to clients included in the study to be able to link this information to the services received by each client. This survey asks a few basic demographic questions and seeks information on your background and experience as a housing counselor or educator. Your answers to all questions will be confidential to the extent provided for by law. Answering the questions will take about 10 minutes.
1. Counselor Name:________________________________________________________________ First Name Last Name
2. What is your gender?
Male
Female
3. What is the highest degree or level of school you have completed? (Select only one.)
Less than 12th grade Associate degree
12th grade, no diploma Bachelor’s degree
High school diploma or equivalent (for example, GED)
Master’s degree, professional degree, or doctorate degree
1 or more years of college, no degree
4. Which describes your ethnicity? (Select only one.)
Hispanic or Latino
Not Hispanic or Not Latino
5. Which describes your race? (Select one or more.)
American Indian or Alaska NativeNative Hawaiian or Other Pacific Islander
Asian White
African American Some Other Race
143FORECLOSURE COUNSELING OUTCOME STUDY: FINAL REPORT HOUSING COUNSELING OUTCOME EVALUATION
APPENDIX E. COUNSELOR SURVEY
6. Were you born in the United States?
Yes
No
7. In what year did you start working as a housing counselor/trainer? _______________ (YYYY)
8. In what year did you start working for [counseling agency name]? _______________ (YYYY)
9. Have you ever worked as a…? (Select one or more.)
Lender/mortgage broker
Realtor
Financial planner
None of the above
10. Have you received training on any of the following topics in the past 3 years? (Select one or more.)
Pre-purchase homebuyer education Default and delinquency counseling
Pre-purchase homebuyer counseling Foreclosure prevention
Credit counseling/credit repair HECM or reverse mortgage
Financial literacy counseling Fair housing
Mortgage lending Training or counseling methods in general
Predatory lending
11. In total, about how many days of housing counseling-related training have you received in the past 3 years? (If you have attended several training sessions over this period, estimate the length of each and add them together. Do not count on-the-job training.)
1–2 days More than 2 weeks but less than 4 weeks
3–5 days More than 4 weeks
More than 5 days but less than 2 weeks
12. Have you received any of the following certifications? (Select one or more.)
NeighborWorks® Center for Homeownership Education and Counseling (NCHEC):
Certification in Homeownership Education
Certificate in Homeownership Counseling
Certificate in Post-purchase Homeownership Education
Certificate in Foreclosure Intervention Counseling
144FORECLOSURE COUNSELING OUTCOME STUDY: FINAL REPORT HOUSING COUNSELING OUTCOME EVALUATION
APPENDIX E. COUNSELOR SURVEY
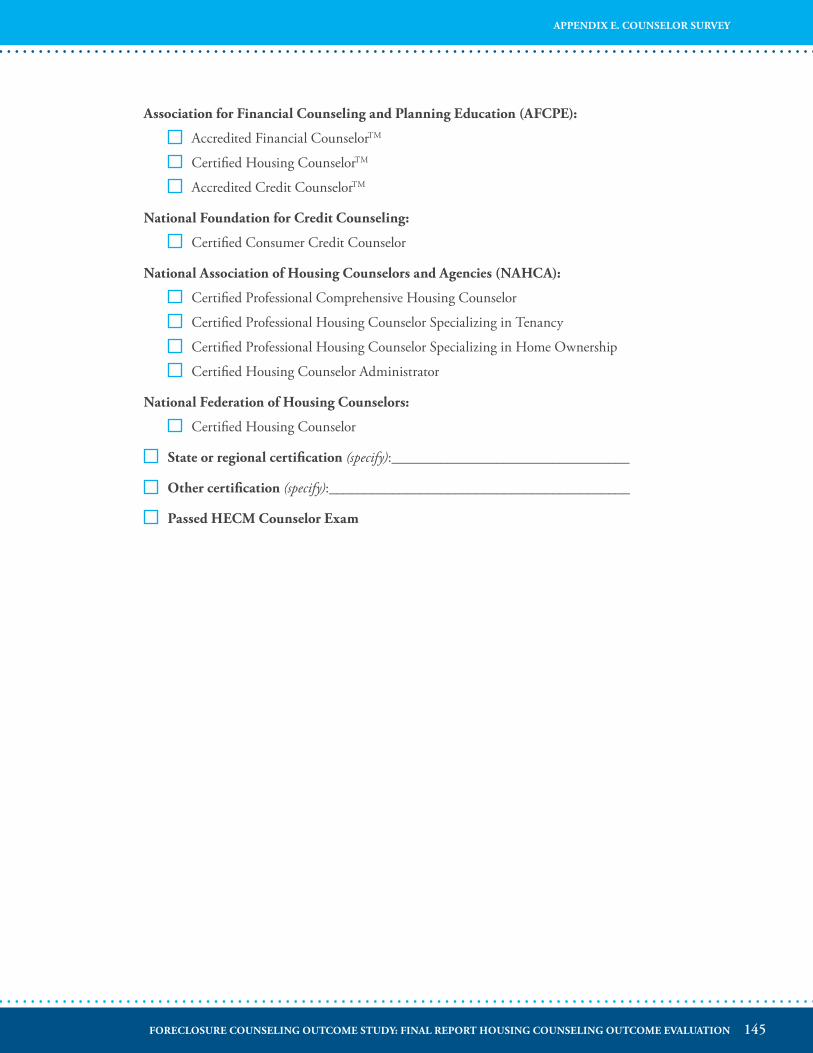
Association for Financial Counseling and Planning Education (AFCPE):
Accredited Financial CounselorTM
Certified Housing CounselorTM
Accredited Credit CounselorTM
National Foundation for Credit Counseling:
Certified Consumer Credit Counselor
National Association of Housing Counselors and Agencies (NAHCA):
Certified Professional Comprehensive Housing Counselor
Certified Professional Housing Counselor Specializing in Tenancy
Certified Professional Housing Counselor Specializing in Home Ownership
Certified Housing Counselor Administrator
National Federation of Housing Counselors:
Certified Housing Counselor
State or regional certification (specify):__________________________________
Other certification (specify):___________________________________________
Passed HECM Counselor Exam
145FORECLOSURE COUNSELING OUTCOME STUDY: FINAL REPORT HOUSING COUNSELING OUTCOME EVALUATION
APPENDIX E. COUNSELOR SURVEY
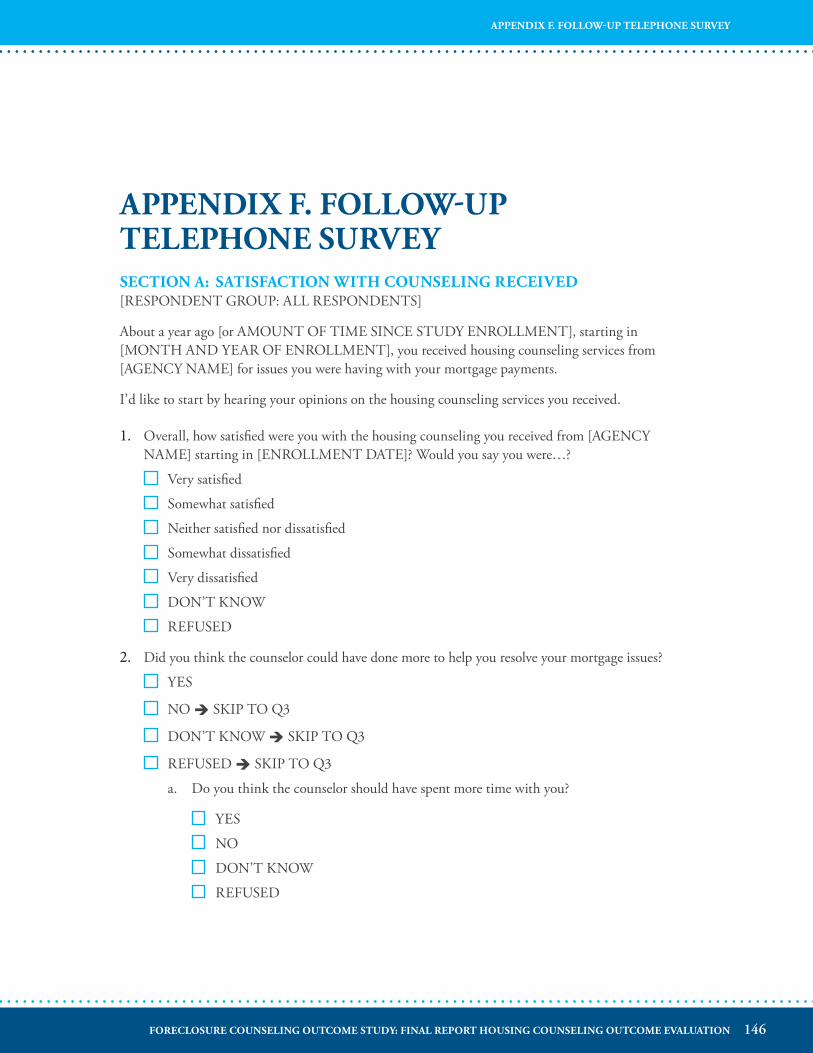
APPENDIX F� FOLLOW-UP TELEPHONE SURVEYSECTION A: SATISFACTION WITH COUNSELING RECEIVED[RESPONDENT GROUP: ALL RESPONDENTS]
About a year ago [or AMOUNT OF TIME SINCE STUDY ENROLLMENT], starting in [MONTH AND YEAR OF ENROLLMENT], you received housing counseling services from [AGENCY NAME] for issues you were having with your mortgage payments.
I’d like to start by hearing your opinions on the housing counseling services you received.
1. Overall, how satisfied were you with the housing counseling you received from [AGENCY NAME] starting in [ENROLLMENT DATE]? Would you say you were…?
Very satisfied
Somewhat satisfied
Neither satisfied nor dissatisfied
Somewhat dissatisfied
Very dissatisfied
DON’T KNOW
REFUSED
2. Did you think the counselor could have done more to help you resolve your mortgage issues?
YES
NO è SKIP TO Q3
DON’T KNOW è SKIP TO Q3
REFUSED è SKIP TO Q3
a. Do you think the counselor should have spent more time with you?
YES
NO
DON’T KNOW
REFUSED
146FORECLOSURE COUNSELING OUTCOME STUDY: FINAL REPORT HOUSING COUNSELING OUTCOME EVALUATION
APPENDIX F. FOLLOW-UP TELEPHONE SURVEY
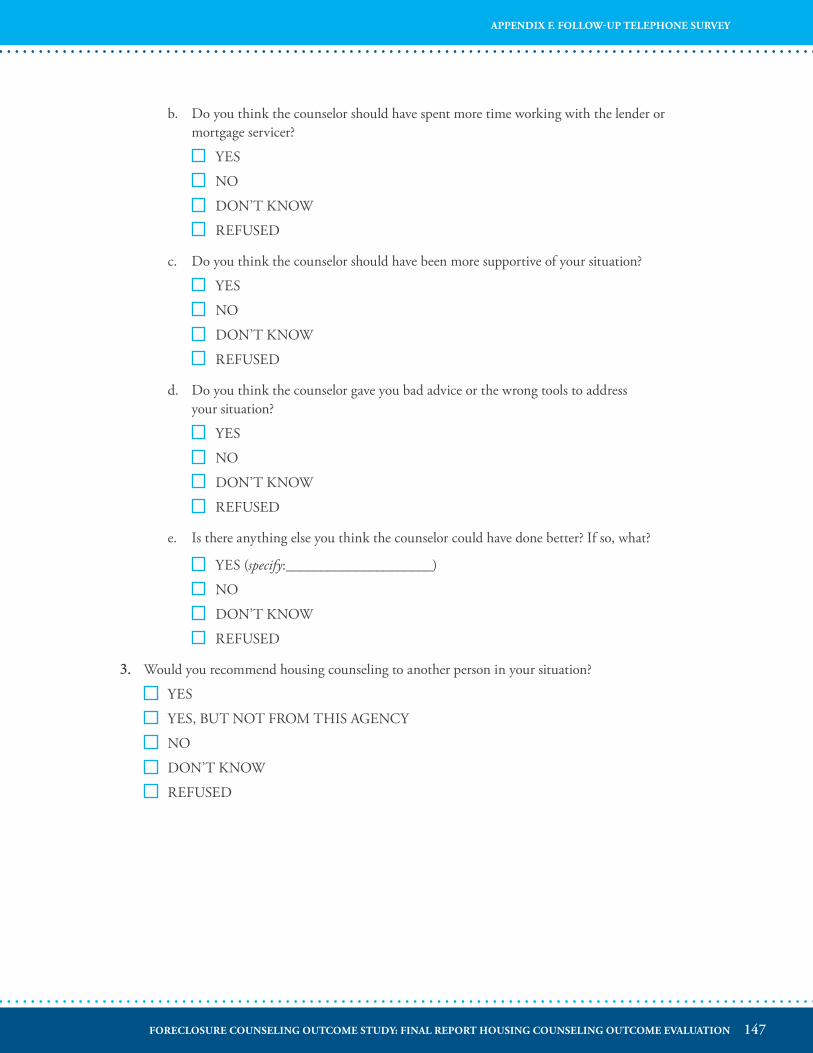
b. Do you think the counselor should have spent more time working with the lender or mortgage servicer?
YES
NO
DON’T KNOW
REFUSED
c. Do you think the counselor should have been more supportive of your situation?
YES
NO
DON’T KNOW
REFUSED
d. Do you think the counselor gave you bad advice or the wrong tools to address your situation?
YES
NO
DON’T KNOW
REFUSED
e. Is there anything else you think the counselor could have done better? If so, what?
YES (specify:_____________________)
NO
DON’T KNOW
REFUSED
3. Would you recommend housing counseling to another person in your situation?
YES
YES, BUT NOT FROM THIS AGENCY
NO
DON’T KNOW
REFUSED
147FORECLOSURE COUNSELING OUTCOME STUDY: FINAL REPORT HOUSING COUNSELING OUTCOME EVALUATION
APPENDIX F. FOLLOW-UP TELEPHONE SURVEY
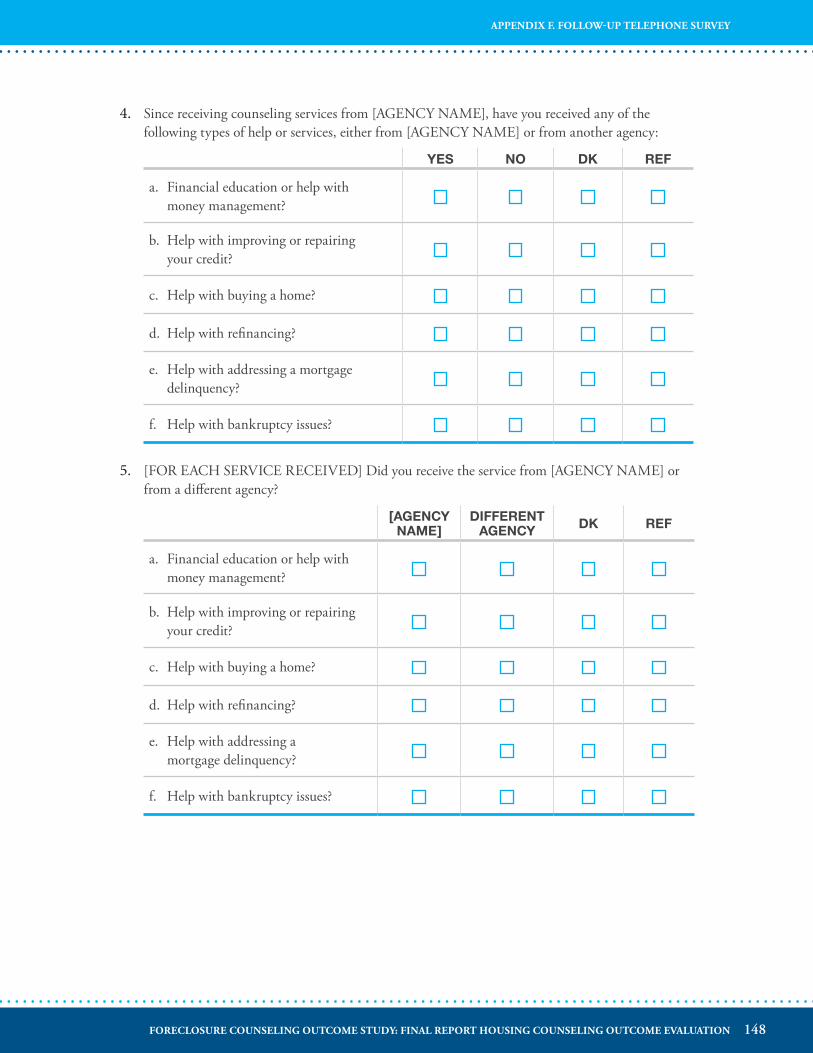
4. Since receiving counseling services from [AGENCY NAME], have you received any of the following types of help or services, either from [AGENCY NAME] or from another agency:
YES NO DK REF
a. Financial education or help with money management?
b. Help with improving or repairing your credit?
c. Help with buying a home?
d. Help with refinancing?
e. Help with addressing a mortgage delinquency?
f. Help with bankruptcy issues?
5. [FOR EACH SERVICE RECEIVED] Did you receive the service from [AGENCY NAME] or from a different agency?
[AGENCY NAME]
DIFFERENT AGENCY DK REF
a. Financial education or help with money management?
b. Help with improving or repairing your credit?
c. Help with buying a home?
d. Help with refinancing?
e. Help with addressing a mortgage delinquency?
f. Help with bankruptcy issues?
148FORECLOSURE COUNSELING OUTCOME STUDY: FINAL REPORT HOUSING COUNSELING OUTCOME EVALUATION
APPENDIX F. FOLLOW-UP TELEPHONE SURVEY
SECTION B: STEPS TAKEN TO ADDRESS MORTGAGE CONCERNS[RESPONDENT GROUP: ALL RESPONDENTS]
Now I’d like to ask you a few more questions about the counseling services you received from [AGENCY NAME] in [MONTH AND YEAR OF STUDY ENROLLMENT] to help address problems that you were having with your mortgage. I am going to ask about some steps that you or your counselor may have taken to resolve your mortgage issues.
1. As part of the efforts to address your mortgage problems, did you enter into a repayment plan or forbearance agreement with your lender? [IF NEEDED: A repayment plan is when you make your regular monthly payments plus some extra to catch up over several months. A forbearance agreement is when the lender allows you to temporarily reduce or suspend your payments.]
YES
NO è SKIP TO Q4
DON’T KNOW è SKIP TO Q4
REFUSED è SKIP TO Q4
2. Were you able to complete the repayment or forbearance agreement?
YES è SKIP TO Q4
NO
DON’T KNOW è SKIP TO Q4
REFUSED è SKIP TO Q4
3. I am interested in the reasons you were not able to complete the repayment or forbearance agreement. I am going to read you a list of common reasons. Please let me know which ones apply to your situation.
YES NO DK REF
a. The payments were too high for what I could afford.
b. My financial circumstances changed.
c. I decided it was not in my best interest to continue making payments.
d. Was there some other reason you were unable to complete the repayment or forbearance plan? If so, what was the reason?
YES (specify:________________________)
NO
DON’T KNOW
REFUSED
149FORECLOSURE COUNSELING OUTCOME STUDY: FINAL REPORT HOUSING COUNSELING OUTCOME EVALUATION
APPENDIX F. FOLLOW-UP TELEPHONE SURVEY
4. Did you obtain a partial claim or partial release from your lender or mortgage insurer? A partial claim or partial release means that you receive a no-interest or low-interest loan through your lender or mortgage insurer to bring your mortgage current.
YES
NO è SKIP TO Q5
DON’T KNOW è SKIP TO Q5
REFUSED è SKIP TO Q5
a. What was the amount of the partial claim?
$______________________
DON’T KNOW
REFUSED
5. Did the lender reduce the amount of your loan balance or principal?
YES
NO è SKIP TO Q6
DON’T KNOW è SKIP TO Q6
REFUSED è SKIP TO Q6
a. What was the amount by which the principal was reduced?
$______________________
DON’T KNOW
REFUSED
6. Did you obtain a loan or grant from a source other than your lender or mortgage insurer to help make up or pay for missed mortgage payments or other costs related to your overdue mortgage payments?
YES
NO è SKIP TO Q7
DON’T KNOW è SKIP TO Q7
REFUSED è SKIP TO Q7
a. What was the amount of the loan or grant?
$______________________
DON’T KNOW
REFUSED
150FORECLOSURE COUNSELING OUTCOME STUDY: FINAL REPORT HOUSING COUNSELING OUTCOME EVALUATION
APPENDIX F. FOLLOW-UP TELEPHONE SURVEY
b. What organization provided the loan or grant?
NAME OF ORGANIZATION:___________________________________
DON’T KNOW
REFUSED
7. Did you declare bankruptcy?
YES
NO
DON’T KNOW
REFUSED
8. Did you get a loan modification or refinance your mortgage?
YES, I GOT A LOAN MODIFICATION
YES, I GOT A REFINANCE
NO è SKIP TO SECTION C: CURRENT HOUSING SITUATION
DON’T KNOW è SKIP TO SECTION C: CURRENT HOUSING SITUATION
REFUSED è SKIP TO SECTION C: CURRENT HOUSING SITUATION
a. When did you modify or refinance your mortgage, that is, in what month and year? [INTERVIEWER: ENTER MONTH HERE AND YEAR IN THE NEXT FIELD]
MONTH:______________ YEAR:______________
DON’T KNOW
REFUSED
b. What is the term of your modified mortgage, that is, what is the total number of years over which mortgage payments are to be made? Is it:
30 years
15 years
40 years
Some other amount of time (specify:___________________)
DON’T KNOW
REFUSED
c. What type of mortgage is it? Is it a:
Fixed-rate mortgage
Adjustable-rate mortgage or ARM
Interest-only mortgage
Other type of mortgage (specify:___________________)
DON’T KNOW
REFUSED
151FORECLOSURE COUNSELING OUTCOME STUDY: FINAL REPORT HOUSING COUNSELING OUTCOME EVALUATION
APPENDIX F. FOLLOW-UP TELEPHONE SURVEY
d. What is the interest rate on the new mortgage?
_____.____percent ANNUAL INTEREST RATE
DON’T KNOW
REFUSED
INSTRUCTIONS FOR INTERVIEWER: USE FOLLOWING TABLE TO CONVERT FRACTIONS INTO DECIMALS FOR INTEREST RATES. ENTER THE INTEGER FIRST THEN THE DECIMAL USING THE FOLLOWING:
1/8TH = 0.125
1/4TH = 0.25
3/8TH = 0.375
1/2 = 0.50
5/8TH = 0.625
3/4 = 0.75
7/8TH = 0.875
e. What was the amount of the new mortgage (that is, the amount of the loan)?
$______________________
DON’T KNOW
REFUSED
f. Thinking back to the mortgage before it was refinanced or modified, what was the original interest rate on the mortgage? In other words, what was the interest rate on the loan when you first bought the house?
_____.____percent INTEREST RATE
DON’T KNOW
REFUSED
g. What was the original amount of the mortgage (that is, the amount of the loan when you first bought the house)?
$______________________
DON’T KNOW
REFUSED
152FORECLOSURE COUNSELING OUTCOME STUDY: FINAL REPORT HOUSING COUNSELING OUTCOME EVALUATION
APPENDIX F. FOLLOW-UP TELEPHONE SURVEY
SECTION C: CURRENT HOUSING SITUATION[RESPONDENT GROUP: ALL RESPONDENTS]
The next questions ask about your current housing situation.
1. Do you currently live in the same home as when you sought counseling assistance in [MONTH AND YEAR OF STUDY ENROLLMENT]?
YES [CODE AS OWNER]
NO è SKIP TO Q5
DON’T KNOW
REFUSED
2. Have you missed any of your mortgage payments at this time? You miss a payment when your payment is overdue for an entire month.
YES
NO è SKIP TO SECTION E: HOUSING PAYMENTS
DON’T KNOW è SKIP TO SECTION E: HOUSING PAYMENTS
REFUSED è SKIP TO SECTION E: HOUSING PAYMENTS
3. How many monthly payments have you missed? [INTERVIEWER NOTE: ENTER MONTHS]
______________ MONTHS
DON’T KNOW
REFUSED
4. Have you received a notice of intent to foreclose from your bank or lender?
YES
NO
DON’T KNOW
REFUSED
UNLESS Q1 = NO, SKIP TO SECTION E: HOUSING PAYMENTS
5. [IF Q1 = NO] What happened to the home that you owned? Did you:
Sell the home
Lose the home to foreclosure è SKIP TO Q6
Execute a deed-in-lieu of foreclosure è SKIP TO Q6
Other (specify:____________________________) è SKIP TO Q6
DON’T KNOW è SKIP TO Q6
REFUSED è SKIP TO Q6
153FORECLOSURE COUNSELING OUTCOME STUDY: FINAL REPORT HOUSING COUNSELING OUTCOME EVALUATION
APPENDIX F. FOLLOW-UP TELEPHONE SURVEY
a. When you sold the home, were you able to sell it for more than the amount you owed?
YES
NO
DON’T KNOW
REFUSED
6. I am going to read a list of reasons why you might not have been able to keep your home. For each reason, tell me if it applies to your situation.
YES NO DK REF
a. I did not have the financial resources needed to afford it.
b. I could not reach the lender to talk about my situation.
c. I was not able to complete the paperwork the lender required.
d. The lender rejected my request for a loan modification.
e. I was no longer interested in owning my house because it was worth much less than my mortgage.
f. I was overwhelmed by the challenges I was facing.
g. Is there another reason you were not able to keep your home? If so, what was it?
YES (specify:____________________________)
NO è SKIP TO Q7
DON’T KNOW è SKIP TO Q7
REFUSED è SKIP TO Q7
h. Is that it or is there another reason? If so, what was it?
YES (specify:____________________________)
NO
DON’T KNOW
REFUSED
154FORECLOSURE COUNSELING OUTCOME STUDY: FINAL REPORT HOUSING COUNSELING OUTCOME EVALUATION
APPENDIX F. FOLLOW-UP TELEPHONE SURVEY
7. What is your current living situation? Do you:
Live in a home that you own [CODE AS NEW OWNER]
Live in a home that you rent
Live in a home that someone else owns or rents
Live temporarily with friends or relatives
Other (specify:____________________________)
DON’T KNOW
REFUSED
8. What type of residence do you live in? Is it:
A single-family home
A townhouse or row house
A unit in a condominium or co-op building
A mobile home
A multi-family home with two or more apartments that you also own
Some other type of housing (specify: _______________________)
DON’T KNOW
REFUSED
9. What is the address of the residence? [INTERVIEWER: AFTER ENTER THE ADDRESS; PLEASE CONFIRM THE ADDRESS THEN ENTER 1 TO CONTINUE.]
a. Street 1:
b. Street 2:
c. City:
d. State:
e. Zip:
f. DON’T KNOW
g. REFUSED
155FORECLOSURE COUNSELING OUTCOME STUDY: FINAL REPORT HOUSING COUNSELING OUTCOME EVALUATION
APPENDIX F. FOLLOW-UP TELEPHONE SURVEY
SECTION D: NEW OWNERS[RESPONDENT GROUP: NEW OWNERS]
1. How did you acquire your current home? Did you:
Purchase it after leaving your last home at [ADDRESS AT TIME OF ENROLLMENT]?
Already own it before you left your home at [ADDRESS AT TIME OF ENROLLMENT]? è SKIP TO SECTION E: HOUSING PAYMENTS
Inherit it? è SKIP TO SECTION E: HOUSING PAYMENTS
Receive it as a gift? è SKIP TO SECTION E: HOUSING PAYMENTS
DON’T KNOW
REFUSED
2. What was the purchase price of your current home?
$______________________
DON’T KNOW
REFUSED
3. Did you finance the purchase of your current home with a mortgage?
YES
NO è SKIP TO SECTION E: HOUSING PAYMENTS
DON’T KNOW è SKIP TO SECTION E: HOUSING PAYMENTS
REFUSED è SKIP TO SECTION E: HOUSING PAYMENTS
4. What is the term of the mortgage, that is, what is the total number of years over which mortgage payments are to be made? Is it:
30 years
15 years
40 years
Some other term (specify:__________________)
DON’T KNOW
REFUSED
5. What type of mortgage is it? Is it a:
Fixed-rate mortgage
Adjustable-rate mortgage or ARM
Interest-only mortgage
Other type of mortgage (specify:___________________)
DON’T KNOW
REFUSED
156FORECLOSURE COUNSELING OUTCOME STUDY: FINAL REPORT HOUSING COUNSELING OUTCOME EVALUATION
APPENDIX F. FOLLOW-UP TELEPHONE SURVEY
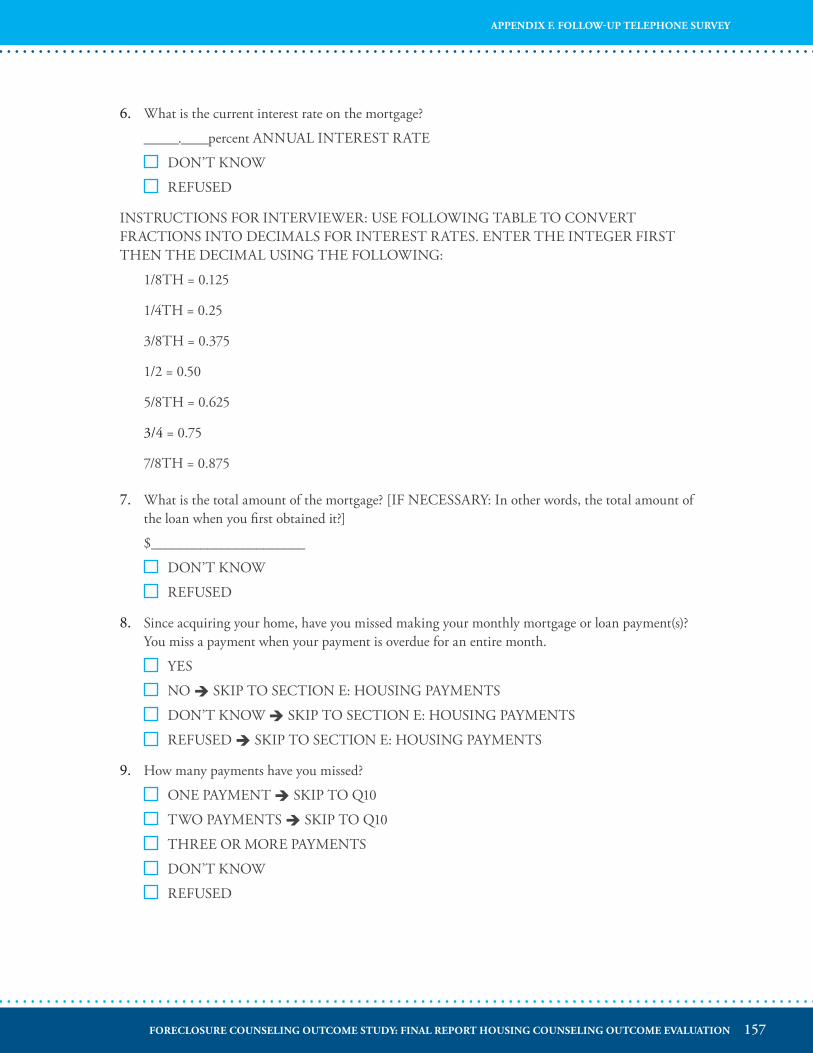
6. What is the current interest rate on the mortgage?
_____.____percent ANNUAL INTEREST RATE
DON’T KNOW
REFUSED
INSTRUCTIONS FOR INTERVIEWER: USE FOLLOWING TABLE TO CONVERT FRACTIONS INTO DECIMALS FOR INTEREST RATES. ENTER THE INTEGER FIRST THEN THE DECIMAL USING THE FOLLOWING:
1/8TH = 0.125
1/4TH = 0.25
3/8TH = 0.375
1/2 = 0.50
5/8TH = 0.625
3/4 = 0.75
7/8TH = 0.875
7. What is the total amount of the mortgage? [IF NECESSARY: In other words, the total amount of the loan when you first obtained it?]
$______________________
DON’T KNOW
REFUSED
8. Since acquiring your home, have you missed making your monthly mortgage or loan payment(s)? You miss a payment when your payment is overdue for an entire month.
YES
NO è SKIP TO SECTION E: HOUSING PAYMENTS
DON’T KNOW è SKIP TO SECTION E: HOUSING PAYMENTS
REFUSED è SKIP TO SECTION E: HOUSING PAYMENTS
9. How many payments have you missed?
ONE PAYMENT è SKIP TO Q10
TWO PAYMENTS è SKIP TO Q10
THREE OR MORE PAYMENTS
DON’T KNOW
REFUSED
157FORECLOSURE COUNSELING OUTCOME STUDY: FINAL REPORT HOUSING COUNSELING OUTCOME EVALUATION
APPENDIX F. FOLLOW-UP TELEPHONE SURVEY
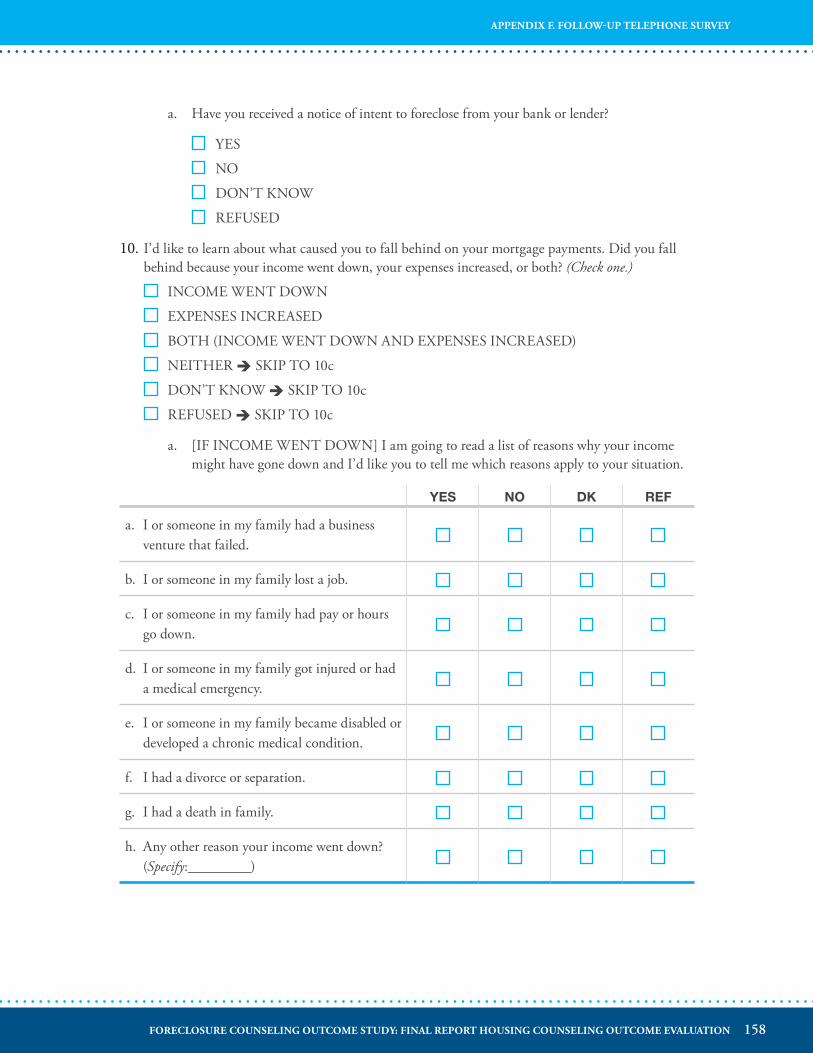
a. Have you received a notice of intent to foreclose from your bank or lender?
YES
NO
DON’T KNOW
REFUSED
10. I’d like to learn about what caused you to fall behind on your mortgage payments. Did you fall behind because your income went down, your expenses increased, or both? (Check one.)
INCOME WENT DOWN
EXPENSES INCREASED
BOTH (INCOME WENT DOWN AND EXPENSES INCREASED)
NEITHER è SKIP TO 10c
DON’T KNOW è SKIP TO 10c
REFUSED è SKIP TO 10c
a. [IF INCOME WENT DOWN] I am going to read a list of reasons why your income might have gone down and I’d like you to tell me which reasons apply to your situation.
YES NO DK REF
a. I or someone in my family had a business venture that failed.
b. I or someone in my family lost a job.
c. I or someone in my family had pay or hours go down.
d. I or someone in my family got injured or had a medical emergency.
e. I or someone in my family became disabled or developed a chronic medical condition.
f. I had a divorce or separation.
g. I had a death in family.
h. Any other reason your income went down? (Specify:_________)
158FORECLOSURE COUNSELING OUTCOME STUDY: FINAL REPORT HOUSING COUNSELING OUTCOME EVALUATION
APPENDIX F. FOLLOW-UP TELEPHONE SURVEY
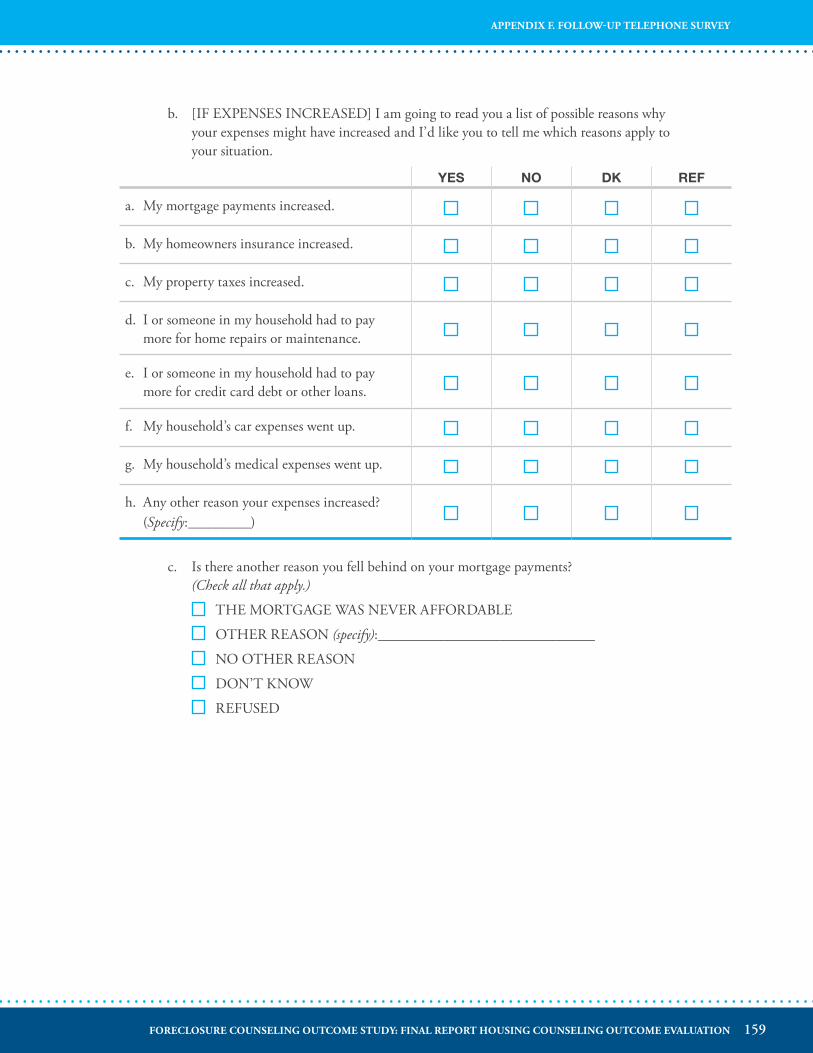
b. [IF EXPENSES INCREASED] I am going to read you a list of possible reasons why your expenses might have increased and I’d like you to tell me which reasons apply to your situation.
YES NO DK REF
a. My mortgage payments increased.
b. My homeowners insurance increased.
c. My property taxes increased.
d. I or someone in my household had to pay more for home repairs or maintenance.
e. I or someone in my household had to pay more for credit card debt or other loans.
f. My household’s car expenses went up.
g. My household’s medical expenses went up.
h. Any other reason your expenses increased? (Specify:_________)
c. Is there another reason you fell behind on your mortgage payments? (Check all that apply.)
THE MORTGAGE WAS NEVER AFFORDABLE
OTHER REASON (specify):_______________________________
NO OTHER REASON
DON’T KNOW
REFUSED
159FORECLOSURE COUNSELING OUTCOME STUDY: FINAL REPORT HOUSING COUNSELING OUTCOME EVALUATION
APPENDIX F. FOLLOW-UP TELEPHONE SURVEY
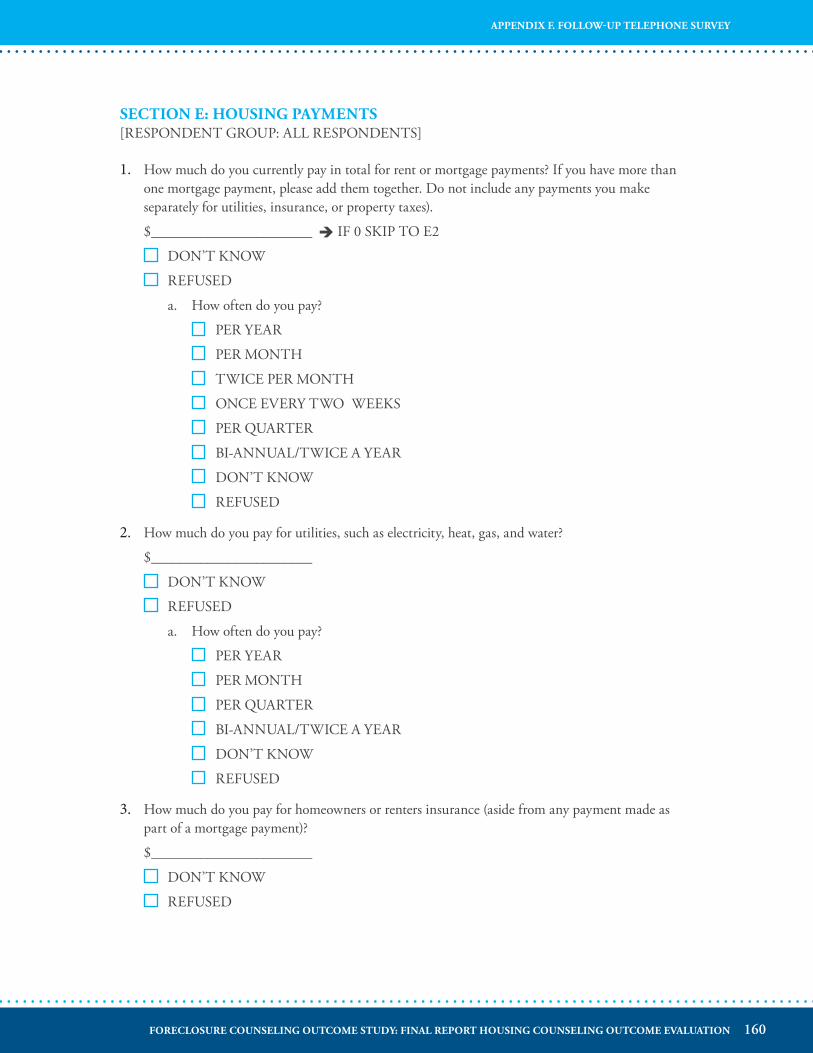
SECTION E: HOUSING PAYMENTS[RESPONDENT GROUP: ALL RESPONDENTS]
1. How much do you currently pay in total for rent or mortgage payments? If you have more than one mortgage payment, please add them together. Do not include any payments you make separately for utilities, insurance, or property taxes).
$_______________________ è IF 0 SKIP TO E2
DON’T KNOW
REFUSED
a. How often do you pay?
PER YEAR
PER MONTH
TWICE PER MONTH
ONCE EVERY TWO WEEKS
PER QUARTER
BI-ANNUAL/TWICE A YEAR
DON’T KNOW
REFUSED
2. How much do you pay for utilities, such as electricity, heat, gas, and water?
$_______________________
DON’T KNOW
REFUSED
a. How often do you pay?
PER YEAR
PER MONTH
PER QUARTER
BI-ANNUAL/TWICE A YEAR
DON’T KNOW
REFUSED
3. How much do you pay for homeowners or renters insurance (aside from any payment made as part of a mortgage payment)?
$_______________________
DON’T KNOW
REFUSED
160FORECLOSURE COUNSELING OUTCOME STUDY: FINAL REPORT HOUSING COUNSELING OUTCOME EVALUATION
APPENDIX F. FOLLOW-UP TELEPHONE SURVEY
a. How often do you pay?
PER YEAR
PER MONTH
PER QUARTER
BI-ANNUAL/TWICE A YEAR
DON’T KNOW
REFUSED
4. [OWNERS AND NEW OWNERS ONLY] How much do you pay for property taxes (aside from any payment made as part of a mortgage payment)?
$_______________________
DON’T KNOW
REFUSED
a. How often do you pay?
PER YEAR
PER MONTH
PER QUARTER
BI-ANNUAL/TWICE A YEAR
DON’T KNOW
REFUSED
5. [OWNERS AND NEW OWNERS ONLY] Do you pay condominium or cooperative fees or homeowner association dues?
YES
NO è SKIP TO SECTION F: EMPLOYMENT AND INCOME
DON’T KNOW è SKIP TO SECTION F: EMPLOYMENT AND INCOME
REFUSED è SKIP TO SECTION F: EMPLOYMENT AND INCOME
a. How much do you pay in condominium or cooperative fees or homeowner association dues?
$_______________________
DON’T KNOW
REFUSED
b. How often do you pay?
PER YEAR
PER MONTH
PER QUARTER
161FORECLOSURE COUNSELING OUTCOME STUDY: FINAL REPORT HOUSING COUNSELING OUTCOME EVALUATION
APPENDIX F. FOLLOW-UP TELEPHONE SURVEY
BI-ANNUAL/TWICE A YEAR
DON’T KNOW
REFUSED
SECTION F: EMPLOYMENT AND INCOME[RESPONDENT GROUP = ALL RESPONDENTS]
The next questions are about your employment situation and household income. Please report in whole dollars only.
1. What is your current work status? Are you: (check one.)
Employed full-time
Employed part-time
A homemaker or student
Unemployed, looking for work
Unemployed, not looking for work
Temporarily laid off or on leave
Retired or disabled
DON’T KNOW
REFUSED
2. What is your gross monthly income? (Include all sources of income and the income of other members of your household with whom you own or rent your home.)
$______________________ è SKIP TO Q3
DON’T KNOW
REFUSED è SKIP TO Q3
a. How much do you and other members of your household make in a year, before taxes?
$______________________
DON’T KNOW è SKIP TO Q3
REFUSED è SKIP TO Q3
b. So that’s about [ANNUAL AMOUNT DIVIDED BY 12] per month. Does that sound about right?
YES
NO
DON’T KNOW
REFUSED
162FORECLOSURE COUNSELING OUTCOME STUDY: FINAL REPORT HOUSING COUNSELING OUTCOME EVALUATION
APPENDIX F. FOLLOW-UP TELEPHONE SURVEY
3. Does your gross monthly income include:
YES NO DK REF
a. Income from employment?
b. Interest, dividend, or other investment income?
c. Child support payments, alimony, or maintenance payments?
d. Social Security retirement or disability benefits?
e. Other pensions or retirement income?
f. Unemployment benefits?
g. Other income?
4. How much money do you have in savings? (“Savings” includes money in checking accounts, savings accounts, money market accounts, certificates of deposit, mutual funds, brokerage accounts, savings at home, savings with others who are keeping it safe, and any other kinds of savings. Include your savings as well as the savings of other members of your household with whom you own or rent your home.) If you are not sure, please give your best estimate.
$______________________
DON’T KNOW
REFUSED
5. How much money do you have in retirement accounts, such as 401(k) accounts, 403(b) accounts, or IRAs? (Include your retirement accounts as well as those of other members of your household with whom you own or rent your home.) If you are not sure, please give your best estimate.
$______________________
DON’T KNOW
REFUSED
163FORECLOSURE COUNSELING OUTCOME STUDY: FINAL REPORT HOUSING COUNSELING OUTCOME EVALUATION
APPENDIX F. FOLLOW-UP TELEPHONE SURVEY
SECTION G: CHANGE IN HOUSEHOLD CIRCUMSTANCES SINCE STUDY ENROLLMENT[RESPONDENT GROUP: ALL RESPONDENTS]
The next questions are about how your household circumstances may have changed since you first went to [AGENCY NAME] for assistance in [MONTH AND YEAR OF ENROLLMENT].
1. How has your overall financial condition changed? Would you say it has:
Improved substantially
Improved slightly
Not changed
Worsened slightly
Worsened substantially
DON’T KNOW
REFUSED
2. Have you experienced any of the following changes in your household since [ENROLLMENT MONTH AND YEAR]? Have you: (check all that apply)
Married or moved in with a partner
Divorced or separated from a spouse or partner
Moved in with other relatives or friends
Had a child(ren) or added a child to your household
Experienced some other change to your household (specify): ______________
DON’T KNOW
REFUSED
SECTION H: CLOSING AND CONTACT INFORMATION[RESPONDENT GROUP: ALL RESPONDENTS]
Thank you very much for your time. We are almost done. We will be sending you a money order for $20 to thank you for your participation within the next four to six weeks. To make sure we send your check to the correct address, we would like to confirm your correct address, as well as a mailing address if it differs from your home address. This information will be kept strictly confidential.
1. Is [ORIGINAL ADDRESS/ADDRESS GIVEN IN Q21] your current home address?
YES è SKIP TO Q2
NO
REFUSED
DON’T KNOW
164FORECLOSURE COUNSELING OUTCOME STUDY: FINAL REPORT HOUSING COUNSELING OUTCOME EVALUATION
APPENDIX F. FOLLOW-UP TELEPHONE SURVEY
a. May I please have your current home address?
RECORD HOME ADDRESS:
STREET (INCLUDE UNIT #):
CITY, STATE, ZIP:
[INTERVIEWER: AFTER ENTERING THE ADDRESS; PLEASE CONFIRM THE ADDRESS BY READING IT BACK TO CONFIRM SPELLING, THEN ENTER 1 TO CONTINUE.]
2. Is [HOME ADDRESS] also your mailing address?
YES è SKIP TO CLOSING
NO
REFUSED
DON’T KNOW
a. May I please have your mailing address?
RECORD HOME ADDRESS:
STREET (INCLUDE UNIT #):
CITY, STATE, ZIP:
[INTERVIEWER: AFTER ENTERING THE ADDRESS; PLEASE CONFIRM THE ADDRESS BY READING IT BACK TO CONFIRM SPELLING, THEN ENTER 1 TO CONTINUE.]
CLOSING: Thanks again for taking the time to speak with me today. If you have any questions about this study, please call the Project Director, Jennifer Turnham, at Abt Associates at 1–410–382–4837, or you may leave a message on our toll-free number: 1–877–367–0088.
165FORECLOSURE COUNSELING OUTCOME STUDY: FINAL REPORT HOUSING COUNSELING OUTCOME EVALUATION
APPENDIX F. FOLLOW-UP TELEPHONE SURVEY
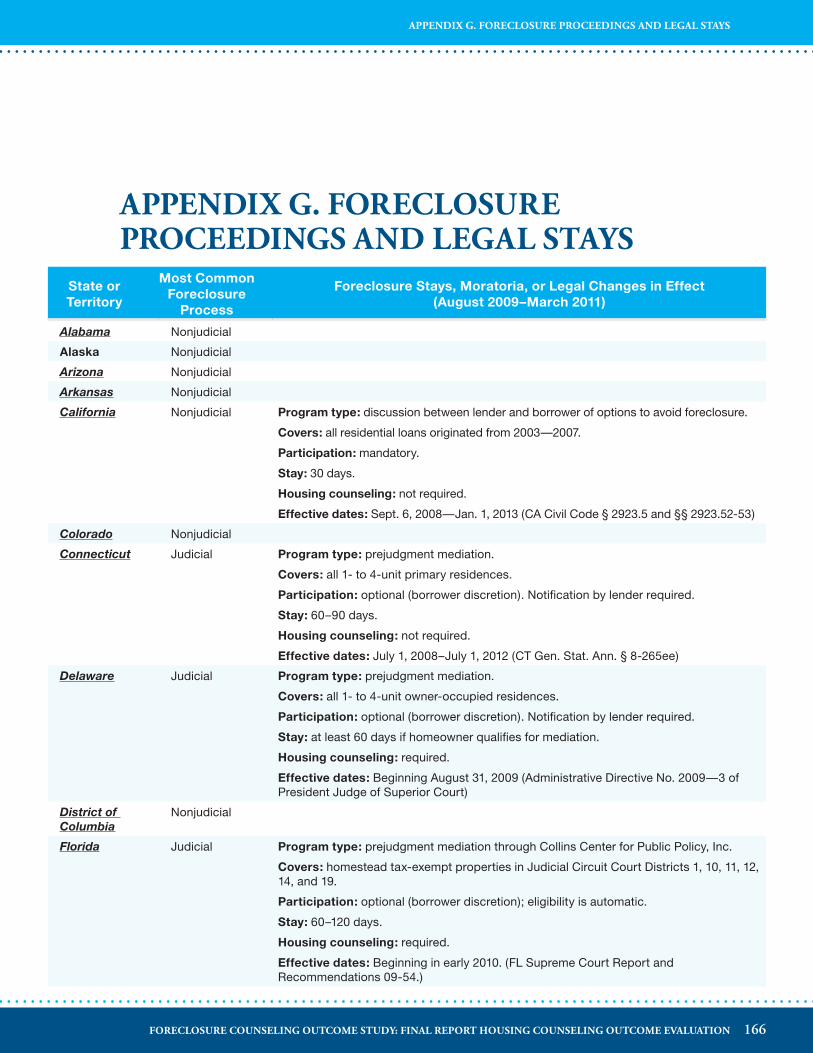
APPENDIX G� FORECLOSURE PROCEEDINGS AND LEGAL STAYS
State or Territory
Most Common Foreclosure
Process
Foreclosure Stays, Moratoria, or Legal Changes in Effect (August 2009–March 2011)
Alabama Nonjudicial
Alaska Nonjudicial
Arizona Nonjudicial
Arkansas Nonjudicial
California Nonjudicial Program type: discussion between lender and borrower of options to avoid foreclosure.
Covers: all residential loans originated from 2003—2007.
Participation: mandatory.
Stay: 30 days.
Housing counseling: not required.
Effective dates: Sept. 6, 2008—Jan. 1, 2013 (CA Civil Code § 2923.5 and §§ 2923.52-53)
Colorado Nonjudicial
Connecticut Judicial Program type: prejudgment mediation.
Covers: all 1- to 4-unit primary residences.
Participation: optional (borrower discretion). Notification by lender required.
Stay: 60–90 days.
Housing counseling: not required.
Effective dates: July 1, 2008–July 1, 2012 (CT Gen. Stat. Ann. § 8-265ee)
Delaware Judicial Program type: prejudgment mediation.
Covers: all 1- to 4-unit owner-occupied residences.
Participation: optional (borrower discretion). Notification by lender required.
Stay: at least 60 days if homeowner qualifies for mediation.
Housing counseling: required.
Effective dates: Beginning August 31, 2009 (Administrative Directive No. 2009—3 of President Judge of Superior Court)
District of Columbia
Nonjudicial
Florida Judicial Program type: prejudgment mediation through Collins Center for Public Policy, Inc.
Covers: homestead tax-exempt properties in Judicial Circuit Court Districts 1, 10, 11, 12, 14, and 19.
Participation: optional (borrower discretion); eligibility is automatic.
Stay: 60–120 days.
Housing counseling: required.
Effective dates: Beginning in early 2010. (FL Supreme Court Report and Recommendations 09-54.)
166FORECLOSURE COUNSELING OUTCOME STUDY: FINAL REPORT HOUSING COUNSELING OUTCOME EVALUATION
APPENDIX G. FORECLOSURE PROCEEDINGS AND LEGAL STAYS
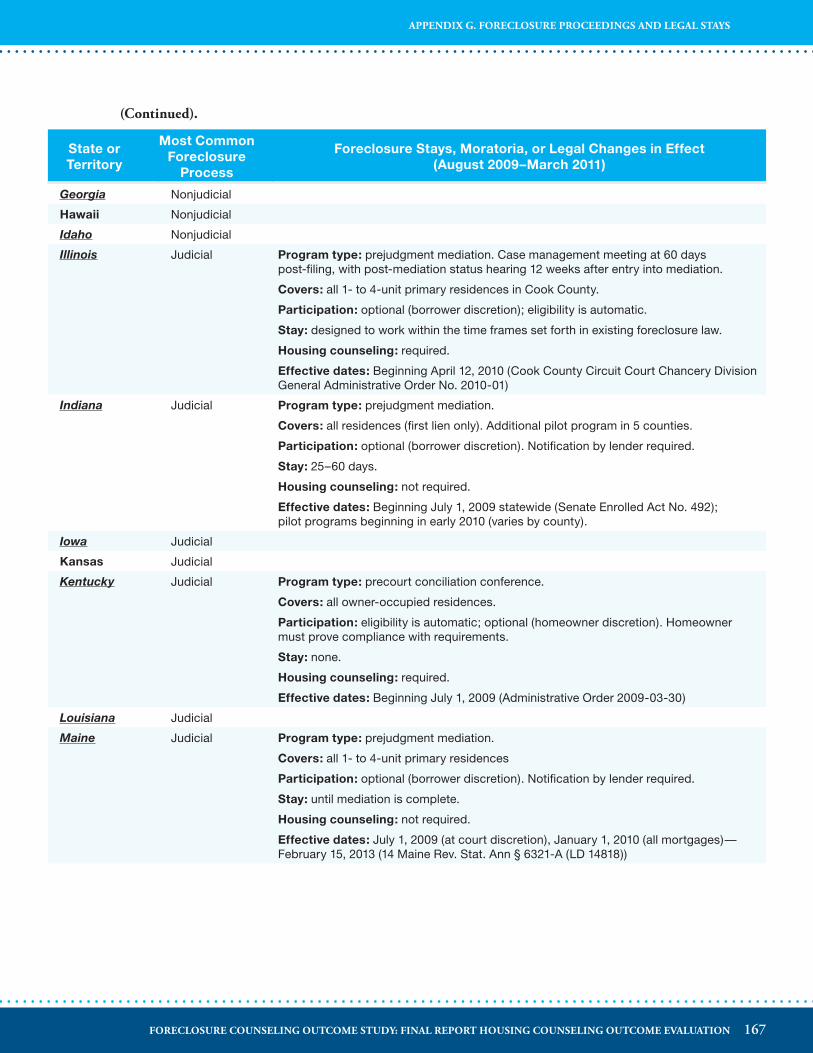
State or Territory
Most Common Foreclosure
Process
Foreclosure Stays, Moratoria, or Legal Changes in Effect (August 2009–March 2011)
Georgia Nonjudicial
Hawaii Nonjudicial
Idaho Nonjudicial
Illinois Judicial Program type: prejudgment mediation. Case management meeting at 60 days post-filing, with post-mediation status hearing 12 weeks after entry into mediation.
Covers: all 1- to 4-unit primary residences in Cook County.
Participation: optional (borrower discretion); eligibility is automatic.
Stay: designed to work within the time frames set forth in existing foreclosure law.
Housing counseling: required.
Effective dates: Beginning April 12, 2010 (Cook County Circuit Court Chancery Division General Administrative Order No. 2010-01)
Indiana Judicial Program type: prejudgment mediation.
Covers: all residences (first lien only). Additional pilot program in 5 counties.
Participation: optional (borrower discretion). Notification by lender required.
Stay: 25–60 days.
Housing counseling: not required.
Effective dates: Beginning July 1, 2009 statewide (Senate Enrolled Act No. 492); pilot programs beginning in early 2010 (varies by county).
Iowa Judicial
Kansas Judicial
Kentucky Judicial Program type: precourt conciliation conference.
Covers: all owner-occupied residences.
Participation: eligibility is automatic; optional (homeowner discretion). Homeowner must prove compliance with requirements.
Stay: none.
Housing counseling: required.
Effective dates: Beginning July 1, 2009 (Administrative Order 2009-03-30)
Louisiana Judicial
Maine Judicial Program type: prejudgment mediation.
Covers: all 1- to 4-unit primary residences
Participation: optional (borrower discretion). Notification by lender required.
Stay: until mediation is complete.
Housing counseling: not required.
Effective dates: July 1, 2009 (at court discretion), January 1, 2010 (all mortgages)—February 15, 2013 (14 Maine Rev. Stat. Ann § 6321-A (LD 14818))
(Continued)�
167FORECLOSURE COUNSELING OUTCOME STUDY: FINAL REPORT HOUSING COUNSELING OUTCOME EVALUATION
APPENDIX G. FORECLOSURE PROCEEDINGS AND LEGAL STAYS
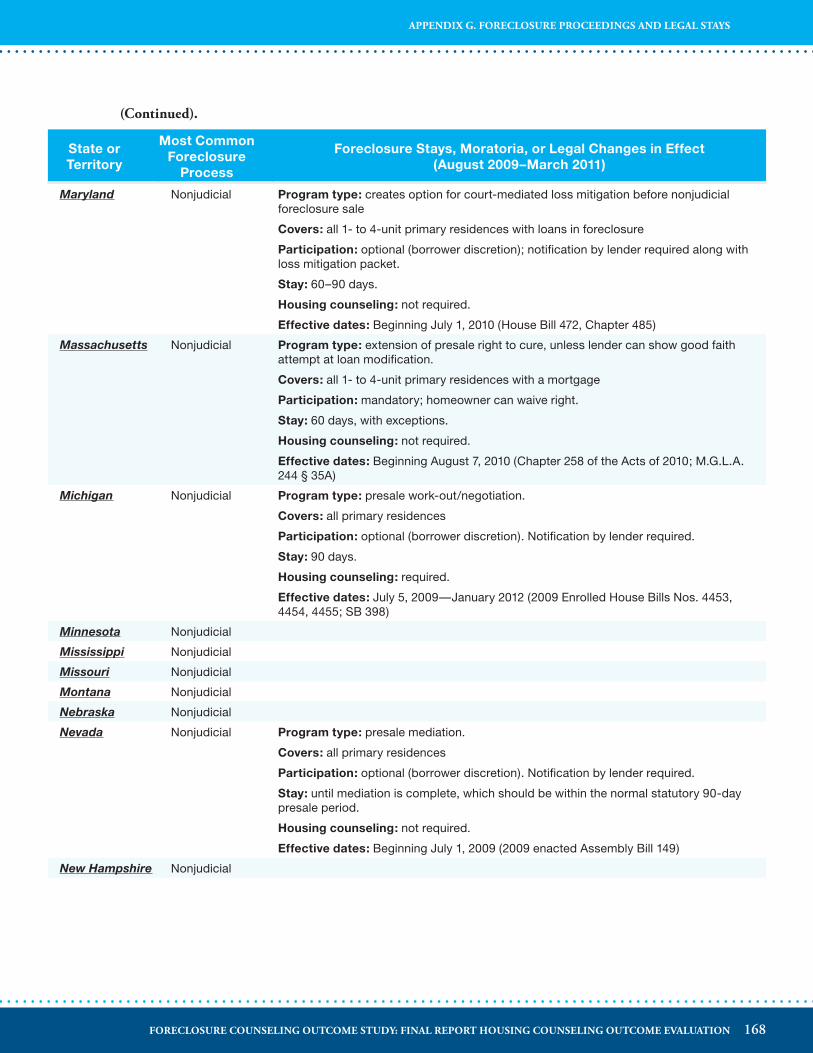
State or Territory
Most Common Foreclosure
Process
Foreclosure Stays, Moratoria, or Legal Changes in Effect (August 2009–March 2011)
Maryland Nonjudicial Program type: creates option for court-mediated loss mitigation before nonjudicial foreclosure sale
Covers: all 1- to 4-unit primary residences with loans in foreclosure
Participation: optional (borrower discretion); notification by lender required along with loss mitigation packet.
Stay: 60–90 days.
Housing counseling: not required.
Effective dates: Beginning July 1, 2010 (House Bill 472, Chapter 485)
Massachusetts Nonjudicial Program type: extension of presale right to cure, unless lender can show good faith attempt at loan modification.
Covers: all 1- to 4-unit primary residences with a mortgage
Participation: mandatory; homeowner can waive right.
Stay: 60 days, with exceptions.
Housing counseling: not required.
Effective dates: Beginning August 7, 2010 (Chapter 258 of the Acts of 2010; M.G.L.A. 244 § 35A)
Michigan Nonjudicial Program type: presale work-out/negotiation.
Covers: all primary residences
Participation: optional (borrower discretion). Notification by lender required.
Stay: 90 days.
Housing counseling: required.
Effective dates: July 5, 2009—January 2012 (2009 Enrolled House Bills Nos. 4453, 4454, 4455; SB 398)
Minnesota Nonjudicial
Mississippi Nonjudicial
Missouri Nonjudicial
Montana Nonjudicial
Nebraska Nonjudicial
Nevada Nonjudicial Program type: presale mediation.
Covers: all primary residences
Participation: optional (borrower discretion). Notification by lender required.
Stay: until mediation is complete, which should be within the normal statutory 90-day presale period.
Housing counseling: not required.
Effective dates: Beginning July 1, 2009 (2009 enacted Assembly Bill 149)
New Hampshire Nonjudicial
(Continued)�
168FORECLOSURE COUNSELING OUTCOME STUDY: FINAL REPORT HOUSING COUNSELING OUTCOME EVALUATION
APPENDIX G. FORECLOSURE PROCEEDINGS AND LEGAL STAYS
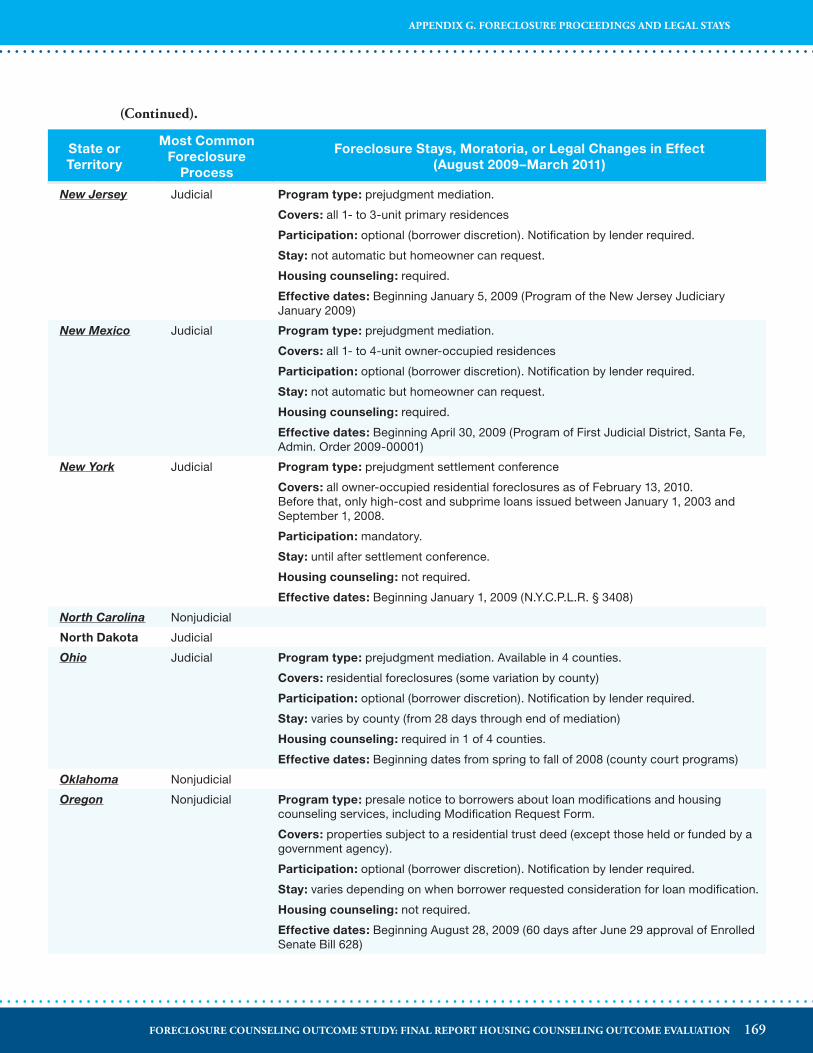
State or Territory
Most Common Foreclosure
Process
Foreclosure Stays, Moratoria, or Legal Changes in Effect (August 2009–March 2011)
New Jersey Judicial Program type: prejudgment mediation.
Covers: all 1- to 3-unit primary residences
Participation: optional (borrower discretion). Notification by lender required.
Stay: not automatic but homeowner can request.
Housing counseling: required.
Effective dates: Beginning January 5, 2009 (Program of the New Jersey Judiciary January 2009)
New Mexico Judicial Program type: prejudgment mediation.
Covers: all 1- to 4-unit owner-occupied residences
Participation: optional (borrower discretion). Notification by lender required.
Stay: not automatic but homeowner can request.
Housing counseling: required.
Effective dates: Beginning April 30, 2009 (Program of First Judicial District, Santa Fe, Admin. Order 2009-00001)
New York Judicial Program type: prejudgment settlement conference
Covers: all owner-occupied residential foreclosures as of February 13, 2010. Before that, only high-cost and subprime loans issued between January 1, 2003 and September 1, 2008.
Participation: mandatory.
Stay: until after settlement conference.
Housing counseling: not required.
Effective dates: Beginning January 1, 2009 (N.Y.C.P.L.R. § 3408)
North Carolina Nonjudicial
North Dakota Judicial
Ohio Judicial Program type: prejudgment mediation. Available in 4 counties.
Covers: residential foreclosures (some variation by county)
Participation: optional (borrower discretion). Notification by lender required.
Stay: varies by county (from 28 days through end of mediation)
Housing counseling: required in 1 of 4 counties.
Effective dates: Beginning dates from spring to fall of 2008 (county court programs)
Oklahoma Nonjudicial
Oregon Nonjudicial Program type: presale notice to borrowers about loan modifications and housing counseling services, including Modification Request Form.
Covers: properties subject to a residential trust deed (except those held or funded by a government agency).
Participation: optional (borrower discretion). Notification by lender required.
Stay: varies depending on when borrower requested consideration for loan modification.
Housing counseling: not required.
Effective dates: Beginning August 28, 2009 (60 days after June 29 approval of Enrolled Senate Bill 628)
(Continued)�
169FORECLOSURE COUNSELING OUTCOME STUDY: FINAL REPORT HOUSING COUNSELING OUTCOME EVALUATION
APPENDIX G. FORECLOSURE PROCEEDINGS AND LEGAL STAYS
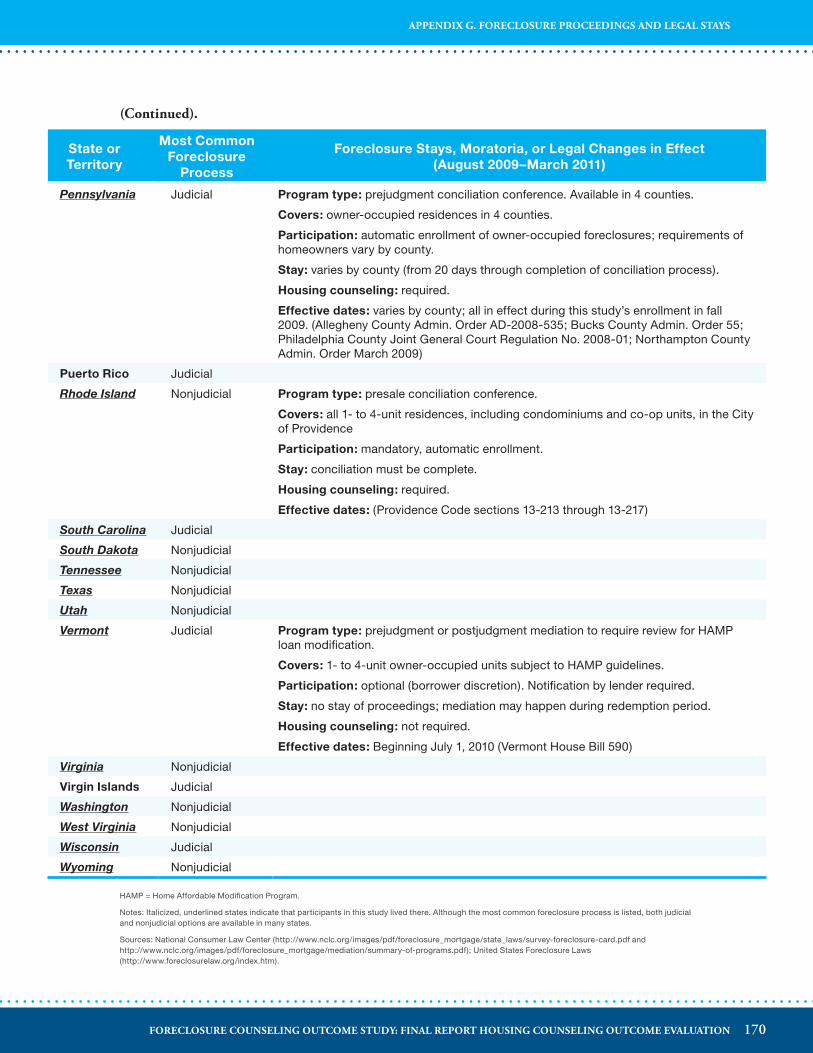
State or Territory
Most Common Foreclosure
Process
Foreclosure Stays, Moratoria, or Legal Changes in Effect (August 2009–March 2011)
Pennsylvania Judicial Program type: prejudgment conciliation conference. Available in 4 counties.
Covers: owner-occupied residences in 4 counties.
Participation: automatic enrollment of owner-occupied foreclosures; requirements of homeowners vary by county.
Stay: varies by county (from 20 days through completion of conciliation process).
Housing counseling: required.
Effective dates: varies by county; all in effect during this study’s enrollment in fall 2009. (Allegheny County Admin. Order AD-2008-535; Bucks County Admin. Order 55; Philadelphia County Joint General Court Regulation No. 2008-01; Northampton County Admin. Order March 2009)
Puerto Rico Judicial
Rhode Island Nonjudicial Program type: presale conciliation conference.
Covers: all 1- to 4-unit residences, including condominiums and co-op units, in the City of Providence
Participation: mandatory, automatic enrollment.
Stay: conciliation must be complete.
Housing counseling: required.
Effective dates: (Providence Code sections 13-213 through 13-217)
South Carolina Judicial
South Dakota Nonjudicial
Tennessee Nonjudicial
Texas Nonjudicial
Utah Nonjudicial
Vermont Judicial Program type: prejudgment or postjudgment mediation to require review for HAMP loan modification.
Covers: 1- to 4-unit owner-occupied units subject to HAMP guidelines.
Participation: optional (borrower discretion). Notification by lender required.
Stay: no stay of proceedings; mediation may happen during redemption period.
Housing counseling: not required.
Effective dates: Beginning July 1, 2010 (Vermont House Bill 590)
Virginia Nonjudicial
Virgin Islands Judicial
Washington Nonjudicial
West Virginia Nonjudicial
Wisconsin Judicial
Wyoming Nonjudicial
(Continued)�
HAMP = Home Affordable Modification Program.
Notes: Italicized, underlined states indicate that participants in this study lived there. Although the most common foreclosure process is listed, both judicial and nonjudicial options are available in many states.
Sources: National Consumer Law Center (http://www.nclc.org/images/pdf/foreclosure_mortgage/state_laws/survey-foreclosure-card.pdf and http://www.nclc.org/images/pdf/foreclosure_mortgage/mediation/summary-of-programs.pdf); United States Foreclosure Laws (http://www.foreclosurelaw.org/index.htm).
170FORECLOSURE COUNSELING OUTCOME STUDY: FINAL REPORT HOUSING COUNSELING OUTCOME EVALUATION
APPENDIX G. FORECLOSURE PROCEEDINGS AND LEGAL STAYS
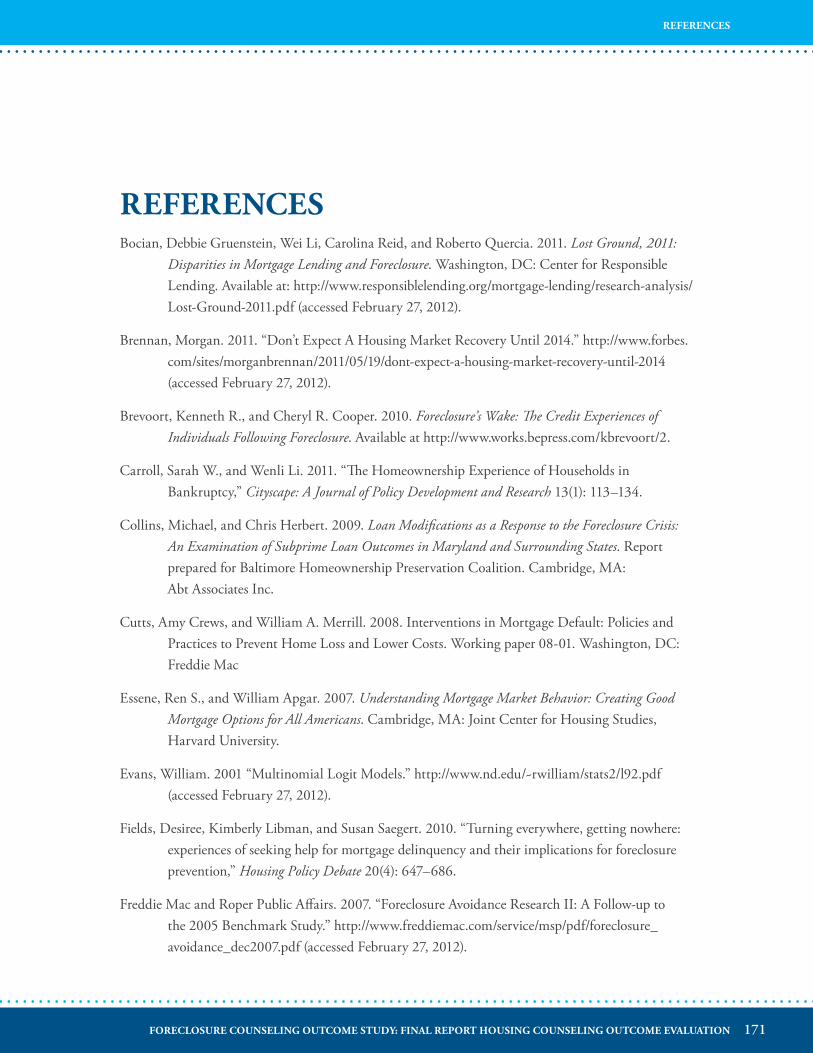
REFERENCESBocian, Debbie Gruenstein, Wei Li, Carolina Reid, and Roberto Quercia. 2011. Lost Ground, 2011:
Disparities in Mortgage Lending and Foreclosure. Washington, DC: Center for Responsible Lending. Available at: http://www.responsiblelending.org/mortgage-lending/research-analysis/Lost-Ground-2011.pdf (accessed February 27, 2012).
Brennan, Morgan. 2011. “Don’t Expect A Housing Market Recovery Until 2014.” http://www.forbes.com/sites/morganbrennan/2011/05/19/dont-expect-a-housing-market-recovery-until-2014 (accessed February 27, 2012).
Brevoort, Kenneth R., and Cheryl R. Cooper. 2010. Foreclosure’s Wake: The Credit Experiences of Individuals Following Foreclosure. Available at http://www.works.bepress.com/kbrevoort/2.
Carroll, Sarah W., and Wenli Li. 2011. “The Homeownership Experience of Households in Bankruptcy,” Cityscape: A Journal of Policy Development and Research 13(1): 113–134.
Collins, Michael, and Chris Herbert. 2009. Loan Modifications as a Response to the Foreclosure Crisis: An Examination of Subprime Loan Outcomes in Maryland and Surrounding States. Report prepared for Baltimore Homeownership Preservation Coalition. Cambridge, MA: Abt Associates Inc.
Cutts, Amy Crews, and William A. Merrill. 2008. Interventions in Mortgage Default: Policies and Practices to Prevent Home Loss and Lower Costs. Working paper 08-01. Washington, DC: Freddie Mac
Essene, Ren S., and William Apgar. 2007. Understanding Mortgage Market Behavior: Creating Good Mortgage Options for All Americans. Cambridge, MA: Joint Center for Housing Studies, Harvard University.
Evans, William. 2001 “Multinomial Logit Models.” http://www.nd.edu/~rwilliam/stats2/l92.pdf (accessed February 27, 2012).
Fields, Desiree, Kimberly Libman, and Susan Saegert. 2010. “Turning everywhere, getting nowhere: experiences of seeking help for mortgage delinquency and their implications for foreclosure prevention,” Housing Policy Debate 20(4): 647–686.
Freddie Mac and Roper Public Affairs. 2007. “Foreclosure Avoidance Research II: A Follow-up to the 2005 Benchmark Study.” http://www.freddiemac.com/service/msp/pdf/foreclosure_avoidance_dec2007.pdf (accessed February 27, 2012).
171FORECLOSURE COUNSELING OUTCOME STUDY: FINAL REPORT HOUSING COUNSELING OUTCOME EVALUATION
REFERENCES
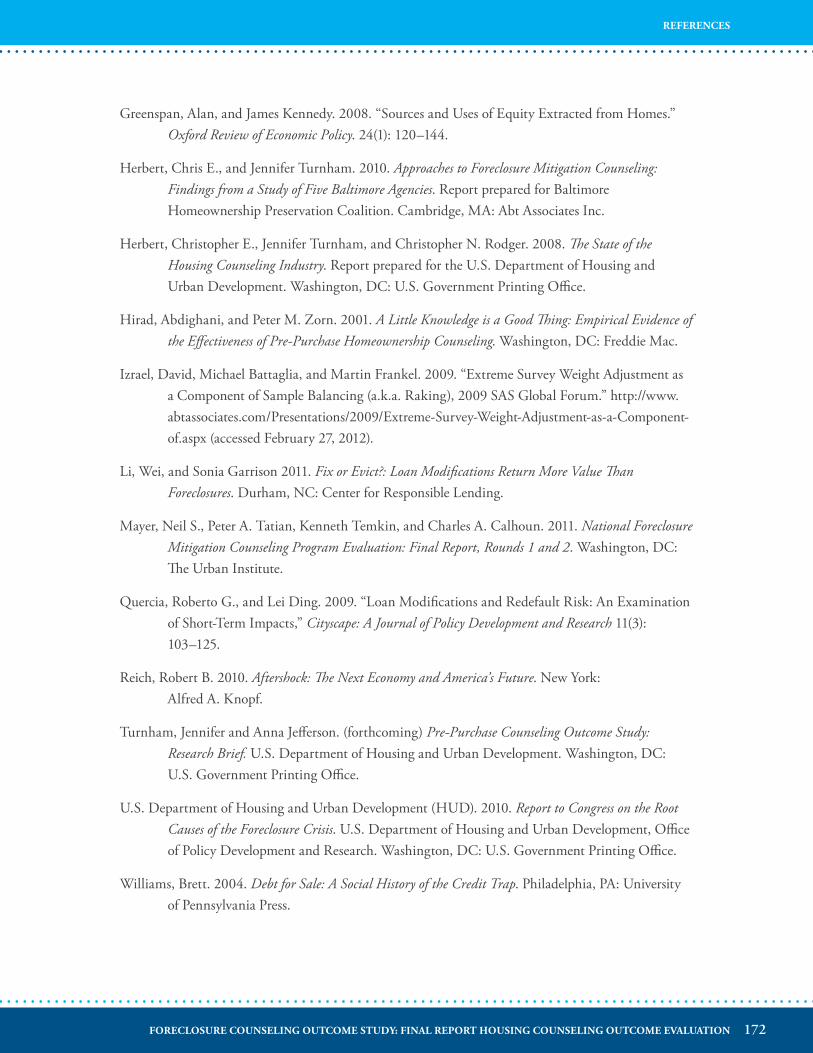
Greenspan, Alan, and James Kennedy. 2008. “Sources and Uses of Equity Extracted from Homes.” Oxford Review of Economic Policy. 24(1): 120–144.
Herbert, Chris E., and Jennifer Turnham. 2010. Approaches to Foreclosure Mitigation Counseling: Findings from a Study of Five Baltimore Agencies. Report prepared for Baltimore Homeownership Preservation Coalition. Cambridge, MA: Abt Associates Inc.
Herbert, Christopher E., Jennifer Turnham, and Christopher N. Rodger. 2008. The State of the Housing Counseling Industry. Report prepared for the U.S. Department of Housing and Urban Development. Washington, DC: U.S. Government Printing Office.
Hirad, Abdighani, and Peter M. Zorn. 2001. A Little Knowledge is a Good Thing: Empirical Evidence of the Effectiveness of Pre-Purchase Homeownership Counseling. Washington, DC: Freddie Mac.
Izrael, David, Michael Battaglia, and Martin Frankel. 2009. “Extreme Survey Weight Adjustment as a Component of Sample Balancing (a.k.a. Raking), 2009 SAS Global Forum.” http://www.abtassociates.com/Presentations/2009/Extreme-Survey-Weight-Adjustment-as-a-Component-of.aspx (accessed February 27, 2012).
Li, Wei, and Sonia Garrison 2011. Fix or Evict?: Loan Modifications Return More Value Than Foreclosures. Durham, NC: Center for Responsible Lending.
Mayer, Neil S., Peter A. Tatian, Kenneth Temkin, and Charles A. Calhoun. 2011. National Foreclosure Mitigation Counseling Program Evaluation: Final Report, Rounds 1 and 2. Washington, DC: The Urban Institute.
Quercia, Roberto G., and Lei Ding. 2009. “Loan Modifications and Redefault Risk: An Examination of Short-Term Impacts,” Cityscape: A Journal of Policy Development and Research 11(3): 103–125.
Reich, Robert B. 2010. Aftershock: The Next Economy and America’s Future. New York: Alfred A. Knopf.
Turnham, Jennifer and Anna Jefferson. (forthcoming) Pre-Purchase Counseling Outcome Study: Research Brief. U.S. Department of Housing and Urban Development. Washington, DC: U.S. Government Printing Office.
U.S. Department of Housing and Urban Development (HUD). 2010. Report to Congress on the Root Causes of the Foreclosure Crisis. U.S. Department of Housing and Urban Development, Office of Policy Development and Research. Washington, DC: U.S. Government Printing Office.
Williams, Brett. 2004. Debt for Sale: A Social History of the Credit Trap. Philadelphia, PA: University of Pennsylvania Press.
172FORECLOSURE COUNSELING OUTCOME STUDY: FINAL REPORT HOUSING COUNSELING OUTCOME EVALUATION
REFERENCES
Woodward, Susan. 2003. Consumer Confusion in the Mortgage Market. Unpublished paper. Sand Hill Economics. http://www.sandhillecon.com/pdf/consumer_confusion.pdf (accessed February 27, 2012).
ADDITIONAL READINGAvery, Robert B., Patricia E. Beeson, and Mark S. Sniderman. 1993. “Accounting for Racial
Differences in Housing Credit Markets.” Federal Reserve Bank of Cleveland Working Paper Series. Cleveland, OH: Federal Reserve Bank of Cleveland.
Immergluck, Dan. 2009. Foreclosed: High-Risk Lending, Deregulation, and the Undermining of America’s Mortgage Market. Ithaca, NY: Cornell University Press.
Keys, Benjamin J., Tanmoy Mukherjee, Amit Seru, and Vikrant Vig. 2010. “Did Securitization Lead to Lax Screening? Evidence from Subprime Loans,” Quarterly Journal of Economics 125(1): 307–362.
Lewis, Michael. 2010. The Big Short: Inside the Doomsday Machine. New York: W.W. Norton.
Morgan, Donald P., Benjamin Iverson, and Matthew Botsch. 2009. Seismic Effects of the Bankruptcy Reform. Federal Reserve Bank of New York Staff Report No. 358. New York: Federal Reserve Bank of New York.
Saegert, Susan, Desiree Fields, and Kimberly Libman. 2009. “Deflating the Dream: Radical Risk and the Neoliberalization of Homeownership,” Journal of Urban Affairs 31(3): 297–317.
Shiller, Robert J. 2008. The Subprime Solution: How Today’s Global Financial Crisis Happened, and What to Do about It. Princeton, NJ: Princeton University Press.
Squires, Gregory D., Derek S. Hyra, and Robert N. Renner. 2009. Segregation and the Subprime Crisis. Washington, DC: Federal Reserve System Community Affairs Research Conference.
White, Brent T. 2010. “Underwater and Not Walking Away: Shame, Fear and the Social Management of the Housing Crisis.” http://www.works.bepress.com/brent_white/2 (accessed February 27, 2012).
173FORECLOSURE COUNSELING OUTCOME STUDY: FINAL REPORT HOUSING COUNSELING OUTCOME EVALUATION
REFERENCES/ADDITIONAL READING