Embed Size (px)
Citation preview

Forecasts for the WFIRST High Latitude Survey using the BlueTides Simulation
Article (Accepted Version)
http://sro.sussex.ac.uk
Waters, Dacen, Di Matteo, Tiziana, Feng, Yu, Wilkins, Stephen M and Croft, Rupert A C (2016) Forecasts for the WFIRST High Latitude Survey using the BlueTides Simulation. Monthly Notices of the Royal Astronomical Society, 463 (4). pp. 3520-3530. ISSN 0035-8711
This version is available from Sussex Research Online: http://sro.sussex.ac.uk/id/eprint/63292/
This document is made available in accordance with publisher policies and may differ from the published version or from the version of record. If you wish to cite this item you are advised to consult the publisher’s version. Please see the URL above for details on accessing the published version.
Copyright and reuse: Sussex Research Online is a digital repository of the research output of the University.
Copyright and all moral rights to the version of the paper presented here belong to the individual author(s) and/or other copyright owners. To the extent reasonable and practicable, the material made available in SRO has been checked for eligibility before being made available.
Copies of full text items generally can be reproduced, displayed or performed and given to third parties in any format or medium for personal research or study, educational, or not-for-profit purposes without prior permission or charge, provided that the authors, title and full bibliographic details are credited, a hyperlink and/or URL is given for the original metadata page and the content is not changed in any way.

BlueTides Forecasts for WFIRST 1
Forecasts for the WFIRST High Latitude Survey using theBlueTides Simulation
Dacen Waters1, Tiziana Di Matteo1, Yu Feng2, Stephen M. Wilkins3,Rupert A.C. Croft11 McWilliams Center for Cosmology, Physics Dept., Carnegie Mellon University, Pittsburgh PA, 15213, USA2 Berkeley Center for Cosmological Physics, University of California at Berkeley, Berkeley, CA 94720, USA3 Astronomy Centre, Department of Physics and Astronomy, University of Sussex, Brighton, BN1 9QH, UK
ABSTRACTWe use the BlueTides simulation to predict the properties of the high-z galaxy and active galac-tic nuclei (AGN) populations for the planned 2200deg2 Wide-Field Infrared Survey Telescope’s(WFIRST) High Latitude Survey (HLS). BlueTides is a cosmological hydrodynamic simulation,which incorporates a variety of baryon physics in a (400h−1Mpc)3 volume evolved to z = 8 with 0.7trillion particles. The galaxy luminosity functions in the simulation show good agreement with allthe current observational constraints (up to z = 11) and predicts an enhanced number of UV brightgalaxies. At the proposed depth of the HLS (mUV < 26.75), BlueTides predicts 106 galaxies atz = 8 with a few up to z ∼ 15 due to the enhanced bright end of the galaxy luminosity function. Atz = 8, galaxies in the mock HLS have specific star formation rates of ∼ 10Gyr−1 and ages of ∼ 80Myr(both evolving linearly with redshift) and a non-evolving mass-metallicity relation. BlueTides alsopredicts ∼ 104 AGN in WFIRST HLS from z = 8 out to z ∼ 14. These AGN host black holesof M ∼ 106 − 108M accreting close to their Eddington luminosity. Galaxies and AGN have hosthalo masses of Mhalo ∼ 1011−12M and a linear bias b ≈ 13 − 20. Given the expected galaxy spacedensities, their high bias and large volume probed we speculate that it may be feasible for WFIRSTHLS detect the Baryon Acoustic Oscillation peak in the galaxy power spectrum out to z = 8 − 9.
Key words: galaxies: high-redshift - galaxies: abundances - galaxies: evolution -galaxies: formation - dark ages, reionization, first stars
1 INTRODUCTION
At the current high redshift observational frontier (z ∼ 6−10)there is, excitingly, evidence for a substantial populationof galaxies (see the compilation by Bouwens et al. (2015)(hereafter B15) and references therein), with glimpses of in-triguing properties seen (Oesch et al. 2014a; Holwerda et al.2013). These observations provide initial measurements of thegalaxy luminosity function (LF) (B15; Oesch et al. 2014a;McLeod et al. 2015) relying on around ∼ 100 galaxies atredshift z = 8 but fewer beyond redshift z = 9. However,the 2 arcmin wide IR field of view of HST WFC3 has meantthat cosmic variance is a dominant component of many ob-servational studies, making clustering measures and searchesfor rare objects extremely difficult. The James Webb SpaceTelescope (JWST) will increase the depth to which we ob-serve in deep fields of view, but cosmic variance will likelystill persist. However, Wide-Field Infrared Survey Telescope- Astrophysics Focused Telescope Assets (WFIRST-AFTA)will transform the field, resolving these issues by providingdepth comparable to that of HST Ultra Deep Fields with afield of view comparable to that of a ground based survey.
Spergel et al. (2013) (hereafter S13) reports an expected10σ and 5σ limiting magnitude of 26 and 26.75 respectively,which is comparable to that of the HST (specifically, S13reports Y, J, H, and F184 band imaging depths of 26.7, 26.9,26.7, and 26.2, respectively). The WFIRST High LatitudeSurvey (HLS) is planned to have a 2200 deg2 field of view,which will dramatically increase the number of galaxies avail-able at redshifts z = 8 and above. The WFIRST HLS willmap this large portion of the sky in four NIR passbands(Y, J, H, and F184) and will include a slitless spectroscopicsurvey component that will obtain R = λ/∆λ = 600 spectraallowing redshift measurements for these deep field objects.The observation of these high redshift galaxies are criticalfor our understanding of the first galaxies as well as theirrole in the epoch of reionization.
Numerical simulations, required to make theoretical pre-dictions for these early times, are lacking however, partic-ularly those with the dynamic range to cover both the for-mation of individual objects and make large scale statisticalstudies of them. Over the last few years, several large vol-ume cosmological simulations of galaxy formation have been
MNRAS Advance Access published August 23, 2016 at U
niversity of Sussex on September 14, 2016
http://mnras.oxfordjournals.org/
Dow
nloaded from

2 Dacen Waters et al.
Parameter Value Description
ΩΛ 0.7186 Vacuum energy density
Ωm 0.2814 Matter densityΩb 0.0464 Baryon density
h 0.697 Dimensionless Hubble parameter
ns 0.971 Spectral indexσ8 0.82 Linear mass dispersion at 8h−1 Mpc
L 400h−1 Mpc Length of one edge of the simulation box
N 2 × 70403 Initial number of gas and dark matter particlesMDM 1.2 × 10⁷h−1 Mpc Mass of one dark matter particle
MGas 2.36 × 10⁶h−1 Mpc Mass of one gas particleMBH 5 × 10⁵h−1 Mpc Seed mass of black hole particles
Table 1. Important parameters for the BlueTides simulation. BlueTides uses the cosmology from the Wilkinson Microwave Anisotropy
Probe nine-year data release (Hinshaw et al. 2013).
performed to study structure growth in the universe, galaxyformation, and reionization. MassiveBlack I ran a 533h−1Mpcside-length box to a redshift z = 4.75 (Di Matteo et al. 2012).MassiveBlack II reduced the boxsize to 100h−1Mpc but hadan improved resolution and ran all the way to redshift z = 0(Khandai et al. 2015). Illustris (Nelson et al. 2015) and theEAGLE simulation (Schaye et al. 2015) are both similar insize to Massive Black II but with different subgrid physicsprocesses and feedback mechanisms.
With our newest simulation, BlueTides (Feng et al.2016, hereafter F16, and Feng et al. 2015) (and the recentradical updates to the code efficiency, smoothed particlehydrodynamics formulation and star formation modeling) wehave reached an unprecedented combination of volume andresolution. This enables us to cover the evolution of most ofthe galaxy mass function for the first billion years of cosmichistory. We now are able to meet the challenge of simulatingthe next generation space telescope fields.
Cosmological simulations such as BlueTides are es-pecially relevant to the high redshift observational frontier.This can be seen if we consider the recent discovery of thehighest redshift galaxy to date. Oesch et al. (2016) observeda remarkably bright (MUV = −22.1) z = 11 galaxy, GN-z11, in the CANDLES/GOODS-N imaging data. Extrapo-lations from lower redshift observations suggest that theseUV bright galaxies should be exceedingly rare (0.06 per HSTfield of view in the best case) by z = 11. BlueTides, how-ever, predicts a significant probability of observing a galaxylike GN-z11 in the HST field of view (∼ 13 per cent). TheBlueTides galaxies with MUV ≈ −22 also match the in-ferred properties of GN-z11 such as the age, mass, and starformation rate (Waters et al. 2016).
In this work, we use BlueTides to predict the propertiesof the galaxy and active galactic nuclei (AGN) populationsthat will be discovered by the WFIRST HLS and their clus-tering at 8 < z < 15. In Section 2 we discuss the spectral syn-thesis models we use to process the star formation, metallicityand stellar ages from from BlueTides to determine galaxyluminosities. We present a simple, self-consistent model fordust extinction, and also find AGN luminosities. We presentthe BlueTides forecasts of the photometric properties ofgalaxies detectable by the WFIRST HLS at z > 8 in Section3. In Section 4 we present the BlueTides predictions forthe galaxy and AGN properties in the WFIRST HLS. We
discuss the clustering properties and bias of these galaxiesin Section 5 and conclude in Section 6.
2 THE BLUETIDES SIMULATION
With BlueTides (and the BlueWaters supercomputer at theNational Center for Supercomputing Applications) a quali-tative advance has been possible: we have been able to runthe first complete simulation (at least in terms of the hydro-dynamics and gravitational physics) of the creation of thefirst galaxies and large-scale structures in the universe. Theapplication required essentially the full BlueWaters system:we used 20,250 nodes (648,000 core equivalents). In order toeffectively use the resources, a number of improvements hadto be applied to the cosmological code P-Gadget3 (Springel2005) to make P(eta)-Gadget, now MP-Gadget, which isnow fully instrumented to run on Peta-scale resources (F16).The major updates to the parallel infrastructure allowedoperation at BlueWaters scale. The simulation code usesthe pressure-entropy formulation of smoothed particle hydro-dynamics (Hopkins 2013) to solve the Euler equations. The(400h−1Mpc)3 cubic simulation volume resulted in more than200,000 star forming galaxies at redshift z = 8. Halos wereidentified using a Friends-of-Friends algorithm with a linkinglength of 0.2 times the mean particle separation (Davis et al.1985). Table 1 shows some of the basic cosmological andcomputational values for BlueTides.
A variety of sub-grid physical processes were imple-mented to study their effects on galaxy formation:
• star formation based on a multi-phase star formationmodel (Springel & Hernquist 2003) with several effects fol-lowing Vogelsberger et al. (2013)
• gas cooling through radiative transfer (Katz et al. 1996)and metal cooling (Vogelsberger et al. 2014)
• formation of molecular hydrogen and its effects on starformation (Krumholz & Gnedin 2011)
• type II supernovae wind feedback (same model used inIllustris (Nelson et al. 2015))
• AGN feedback using the same model used in Massive-Black I and II (Di Matteo et al. 2005)
• a ”patchy” model of reionization (Battaglia et al. 2013)with a fiducial model of mean reionization redshift z ≈ 10(Hinshaw et al. 2013) with a UV background estimated byFaucher-Giguere et al. (2009)
at University of Sussex on Septem
ber 14, 2016http://m
nras.oxfordjournals.org/D
ownloaded from

BlueTides Forecasts for WFIRST 3
These sub-grid baryon-physics processes are importantfor determining the photometric properties of high redshiftgalaxies and were shown to produce results consistent withobservations in F16. In this section, we present the methodsused to perform the post-processing of BlueTides in orderto forecast the photometric and clustering properties of thegalaxies detectable by WFIRST.
2.1 Galaxy Luminosities and Dust Attenuation
Our methodology of producing synthetic galaxy photometryis detailed in Wilkins et al. (2016). In brief: galaxy spectralenergy distributions (SEDs) are calculated first by assign-ing a pure-stellar SED to each star particle according toits age and metallicity. We make use of the PEGASE v2(Fioc & Rocca-Volmerange 1997) stellar population synthe-sis (SPS) model assuming a Chabrier (2003) initial massfunction (IMF). We note however that the choice of SPSmodel can affect predicted UV luminosities by up to 0.1 dex(Wilkins et al. 2016). Assuming a Salpeter IMF, instead of aChabrier (2003) IMF, results in luminosities approximately0.2 dex lower.
To model dust attenuation we utilize a scheme inspiredby Jonsson (2006), where the metal density is integratedalong parallel lines of sight. The dust attenuation is assumedto be proportional to the surface density of metal along theline of sight,
τV (x, y, z) = κΣ(x, y, z) =
∫ z
0
dz′κρmetal(x, y, z′) (1)
where τV (x, y, z) is the dust optical depth, ρmetal(x, y, z′) is
the metal density, κ is a normalization factor, and we havechosen the z direction as the the line of sight direction. Thedust attenuation is then applied at subsequent redshifts (formore details see Wilkins et al. in-prep).
This simple model is calibrated so that we reproduce thebright end of the z ∼ 8 UV LF from B15 (we naturally repro-duce the faint end where we predict very little attenuation).It is however important to note that simply linking the metaldensity to the dust optical depth may not fully capture theredshift and luminosity/mass dependence of dust attenuation.This is because the production of dust is not expected tofully trace the production of metals (e.g. Mancini et al. 2015)with the expectation of lower dust-to-metal ratios at earliertimes, and thus lower attenuation at high redshift. This issupported by the recent discovery of GN−z11 (Oesch et al.2016; Waters et al. 2016). In the rest of this work, we presentthe predictions for both the dust corrected and intrinsic LFof galaxies in BlueTides for all redshifts.
2.2 Active Galactic Nuclei
Supermassive black holes were seeded in BlueTides withan initial mass of 5 × 10⁵h−1M once a halo reached a massgreater than 5 × 10¹⁰h−1M. BlueTides tracks the rate atwhich mass is accreted from the halo onto the super-massiveblackhole and from that a bolometric luminosity can befound. The blackhole bolometric luminosity is computed byassuming a mass-to-light conversion efficiency η = 0.1:
L = ηc2dMBH
dt(2)
where L is the bolometric luminosity and MBH is the massof the black hole. Black holes in the BlueTides simulationwere limited to having a mass accretion rate of two times thatof their Eddington limit, given by Medd = 4πGcMBHmp/σTwhere G, c, mp, and σT are Newton’s constant, the speed oflight, the mass of the proton, and the Thomson scatteringcross section, respectively. The UV magnitude of the AGNis determined by (Fontanot et al. 2012):
MUV = −2.5 log10
L
fbolνB+ 34.1 + ∆B,UV (3)
where fbol = 10.4 is the bolometric correction (Elvis et al.1994), νB = 6.74 × 10¹⁴Hz, and ∆B,UV = −0.48.
2.3 Clustering
Utilizing the spatial positions of galaxies in the BlueTidessimulation, we compute the two-point spatial correlationfunction ξgg(r). For a particular redshift, we use all galaxiesbrighter than the WFIRST magnitude limit in the periodicvolume of the box and use direct pair counts to measureξgg(r) = DD/RR − 1 where DD and RR are normalizedpair counts in the BlueTides sample and a random catalog,receptively. We also compute the dark matter correlationfunction, ξdm(r) using a Fast Fourier Transform (FFT) basedalgorithm 1.
For each redshift we compute the linear bias defined by
b =
√ξgg(r)
ξdm(r)(4)
We compute b by averaging equation 4 between the distancesr = 10h−1Mpc and r = 75h−1Mpc. We select this rangebecause the FFT algorithm was used with a mesh resolutioncorresponding to a scale of about 5h−1Mpc, so we select alittle beyond this to be cautious and to stay well within thelinear regime.
3 THE WFIRST HLS GALAXY POPULATION
3.1 Predicted Luminosity Functions
The intrinsic and dust corrected LFs from the galaxies inBlueTides are shown in Figure 1 for z = 8, 9 and 10, withPoisson errors given by the shaded regions. We show onlydown to MUV ∼ −18.5 to show that our results agree wellwith current observations. The full range of the galaxy LFthat BlueTides probes (down to MUV ∼ −15.5) is addressedin F16 and Wilkins et al. (2016). The dashed blue and greenlines show a double power law (DPL) fit to the BlueTidesintrinsic and dust corrected LFs, respectively. We note thata standard Schechter function does not represent a gooddescription of the UV LF in BlueTides as it consistentlyunder predicts the bright end (with and without account-ing for dust). Here we use a DPL (B15; Bowler et al. 2014)defined by:
φ(M) =φ∗
100.4(α+1)(M−M∗) + 100.4(β+1)(M−M∗)(5)
1 https://github.com/bccp/nbodykit
at University of Sussex on Septem
ber 14, 2016http://m
nras.oxfordjournals.org/D
ownloaded from
4 Dacen Waters et al.
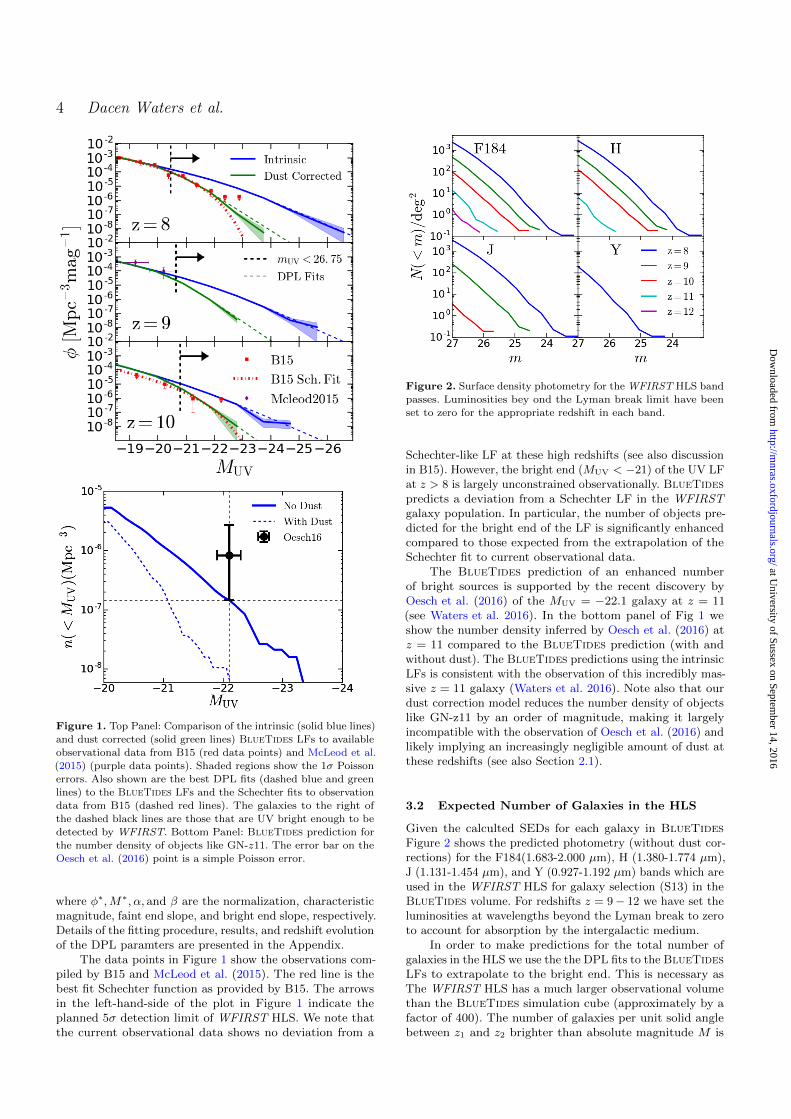
Figure 1. Top Panel: Comparison of the intrinsic (solid blue lines)
and dust corrected (solid green lines) BlueTides LFs to availableobservational data from B15 (red data points) and McLeod et al.
(2015) (purple data points). Shaded regions show the 1σ Poisson
errors. Also shown are the best DPL fits (dashed blue and greenlines) to the BlueTides LFs and the Schechter fits to observation
data from B15 (dashed red lines). The galaxies to the right ofthe dashed black lines are those that are UV bright enough to bedetected by WFIRST. Bottom Panel: BlueTides prediction for
the number density of objects like GN-z11. The error bar on theOesch et al. (2016) point is a simple Poisson error.
where φ∗,M∗, α, and β are the normalization, characteristicmagnitude, faint end slope, and bright end slope, respectively.Details of the fitting procedure, results, and redshift evolutionof the DPL paramters are presented in the Appendix.
The data points in Figure 1 show the observations com-piled by B15 and McLeod et al. (2015). The red line is thebest fit Schechter function as provided by B15. The arrowsin the left-hand-side of the plot in Figure 1 indicate theplanned 5σ detection limit of WFIRST HLS. We note thatthe current observational data shows no deviation from a
Figure 2. Surface density photometry for the WFIRST HLS bandpasses. Luminosities bey ond the Lyman break limit have been
set to zero for the appropriate redshift in each band.
Schechter-like LF at these high redshifts (see also discussionin B15). However, the bright end (MUV < −21) of the UV LFat z > 8 is largely unconstrained observationally. BlueTidespredicts a deviation from a Schechter LF in the WFIRSTgalaxy population. In particular, the number of objects pre-dicted for the bright end of the LF is significantly enhancedcompared to those expected from the extrapolation of theSchechter fit to current observational data.
The BlueTides prediction of an enhanced numberof bright sources is supported by the recent discovery byOesch et al. (2016) of the MUV = −22.1 galaxy at z = 11(see Waters et al. 2016). In the bottom panel of Fig 1 weshow the number density inferred by Oesch et al. (2016) atz = 11 compared to the BlueTides prediction (with andwithout dust). The BlueTides predictions using the intrinsicLFs is consistent with the observation of this incredibly mas-sive z = 11 galaxy (Waters et al. 2016). Note also that ourdust correction model reduces the number density of objectslike GN-z11 by an order of magnitude, making it largelyincompatible with the observation of Oesch et al. (2016) andlikely implying an increasingly negligible amount of dust atthese redshifts (see also Section 2.1).
3.2 Expected Number of Galaxies in the HLS
Given the calculted SEDs for each galaxy in BlueTidesFigure 2 shows the predicted photometry (without dust cor-rections) for the F184(1.683-2.000 µm), H (1.380-1.774 µm),J (1.131-1.454 µm), and Y (0.927-1.192 µm) bands which areused in the WFIRST HLS for galaxy selection (S13) in theBlueTides volume. For redshifts z = 9 − 12 we have set theluminosities at wavelengths beyond the Lyman break to zeroto account for absorption by the intergalactic medium.
In order to make predictions for the total number ofgalaxies in the HLS we use the the DPL fits to the BlueTidesLFs to extrapolate to the bright end. This is necessary asThe WFIRST HLS has a much larger observational volumethan the BlueTides simulation cube (approximately by afactor of 400). The number of galaxies per unit solid anglebetween z1 and z2 brighter than absolute magnitude M is
at University of Sussex on Septem
ber 14, 2016http://m
nras.oxfordjournals.org/D
ownloaded from

BlueTides Forecasts for WFIRST 5
Figure 3. Top Panel: Surface density for z = 8 and beyond. The
results for z = 9, 11, and 13 are left out for clarity. The WFIRSTfield of view is ∼ 2200deg2, so will be able to detect galaxies out
to z = 15 according to the BlueTides LF results. Our dust modelis too extreme by z = 10, so the lower limit at these redshifts arevery conservative estimates. Bottom Panel: Predicted number of
galaxies in the WFIRST HLS at or above a given redshift. Thepredictions shown are for the BlueTides galaxies (blue region)
and AGN (green line) for the 5σ limit. Extrapolation of the B15
z = 8 Schecther function is also shown (black dashed line). Thegrey lines show the same quantities but for the 10σ limit.
simply given by
N =
∫ z2
z1
dz r2 dr
dz
∫ M
−∞dM ′φ(M ′, z) sr−1 (6)
where r = r(z) is the comoving distance to redshift z. In thetop panel of Figure 3 we show the expected surface densitiesin the WFIRST HLS as a function of the rest-frame UVluminosities (for all magnitudes less than the WFIRST 5σlimit). We calculate the surface density at each redshift zwith equation 6 between redshift z − 0.5 and z + 0.5 as afunction of apparent magnitude. The upper (lower) limits ateach redshift are from the LF without (with) dust correction.We give redshift evolution fits for the number densities inthe Appendix.
The bottom panel of Figure 3 shows the total cumulativenumber of galaxies above a given redshift for the 5σ and10σ WFIRST limits. We calculate the cumulative number for
Figure 4. AGN LFs for BlueTides. Shaded regions show the 1σ
Poisson errors. Grey dashed lines show a best fit to a power lawLF. The black arrow and dashed line indicates the galaxies thatare UV brighter than the WFIRST 5σ limit.
Figure 5. AGN surface densities according to BlueTides forAGN that have an intrinsic brightness above the WFIRST 5σ
limit (no dust correction assumed).
each redshift using equation 6 with a magnitude limit at eachredshift that corresponds to the appropriate WFIRST limit.For comparison we also show the results for the cumulativenumber obtained using the B15 z = 8 Schechter function bestfit considering an optimistic evolution of the characteristicmagnitude (dM∗/dz = 0.36) with α and φ∗ held constant asin S13. The pessimistic evolution from S13 (dM∗/dz = 1.06)significantly under fits the z = 10 results from B15 andare therefore not considered. The BlueTides LFs predicts acomparable total number of galaxies as the B15 extrapolationbut BlueTides predicts objects out to a significantly higherredshift. This is a result of the near identical normalizationsof the BlueTides and B15 z = 8 LFs, but an enhancedbright end in BlueTides compared to the extrapolationof observed constraints. BlueTides predicts a total of 106
galaxies beyond z = 8, and up to a few at z = 14 − 15 atthe planned depth and area of the WFIRST HLS. Withoutmuch dust, WFIRST will detect galaxies out to z = 15 atthe 5σ level.
at University of Sussex on Septem
ber 14, 2016http://m
nras.oxfordjournals.org/D
ownloaded from

6 Dacen Waters et al.
Figure 6. Stellar mass vs halo mass for the WFIRST galaxy pop-ulation as predicted by BlueTides. Dashed lines show results from
abundance matching by Behroozi et al. (2013). Data points showthe z = 7 results from Harikane et al. (2016). The 2D histogram
shows the distribution of galaxies in the BlueTides volume atz = 8. Solid lines show the mean in bins of MHalo for the higherredshifts as indicated in the figure.
3.3 Expected Number of AGN
The proposed survey area and depth of the WFIRST HLSwill allow for the discovery of substantial populations of high-z AGN. Currently the highest redshift known quasar is atz = 7.1 (Mortlock et al. 2011) and only a handful of objectsknown at z > 6 from SDSS (Fan et al. 2006). The limitedknowledge of high-z black holes will be revolutionized byWFIRST HLS. Using the black hole population simulatedin BlueTides we examine the predictions for the LF andthe expected number of AGN in the HLS at z ≥ 8. Figure 4shows the intrinsic UV LF for AGN in BlueTides with thedashed black line indicating the detection limit of WFIRSTHLS. In order to predict the total number of AGN expectedin the field of the HLS we fit the AGN LFs to a power lawwhich we can then extrapolate to obtain the surface densityof AGN above a given magnitude for those AGN beyond the5σ cutoff for WFIRST (Figure 5). Figure 3 (green and greylines) shows tens of thousand of AGN could be detectable atthe 5σ level, with the brightest AGN out to z = 13 − 14.
4 WFIRST GALAXY AND AGN PROPERTIES
In this section, we examine a number of fundamental prop-erties of the galaxy and AGN population predicted in theWFIRST HLS by BlueTides.
4.1 Galaxy Properties
In Figure 6, we show the stellar - halo mass relation for thegalaxies in BlueTides. Galaxies detected in our mock HLShave stellar masses between 108 −1010M that are hosted bydark matter halos with masses of 1010.5 − 1012M which arecorrelated with each other. The mean is well fit by a power lawat each redshift,M∗ = (Mh/M0)α where the slope shows mildredshift evolution (α ≈ −0.2(1 + z) + 2.8). We compare therelation in BlueTides with the abundance matching results
Figure 7. Galaxy properties for those bright enough to be de-
tected by WFIRST. The 2D histogram shows the distribution ofgalaxies in the BlueTides volume at z = 8. The solid lines showthe mean values in bins of stellar mass. sSFR observations come
from Gonzalez et al. (2014). Best fit to metallicity measurementsat z = 3.5 come from Maiolino et al. (2008) and observations atz = 5 come from Faisst et al. (2016).
from Behroozi et al. (2013) at z = 0 and extrapolated to z =8. The galaxy population in BlueTides appears somewhatcloser to z = 0 relation but perhaps showing less prominentsigns of quenching at the high mass end. It is interestingto note that the predicted relation is in agreement with thehalo occupation distribution modeling results (Harikane et al.2016). The z = 7 stellar - halo mass relation of Harikane et al.(2016) comes from the observations of around 300 Lymannbreak galaxies in the GOODS-N and GOODS-S fields. Theysplit their z = 7 sample into two subsamples (mUV < 28.2and mUV < 28.4) each with around 100 galaxies and occupyhalos with a model that assumes the number of galaxies in agiven halo only depends on the halo mass.
In Figure 7 we show various galaxy properties from z = 8to 12. The top panel shows the specific star formation rate(SFR/M∗) as a function of stellar mass. SFR/M∗ shows astrong evolution with redshift with a dependence sSFR ≈[2.3(1 + z)− 10.03] Gyr−1 at M∗ = 109M. The BlueTidesspecific star formation rate compares reasonably well withthe redshift evolution observed in the GOODS-S field ofview (Gonzalez et al. 2014). Our simple power law evolution
at University of Sussex on Septem
ber 14, 2016http://m
nras.oxfordjournals.org/D
ownloaded from
BlueTides Forecasts for WFIRST 7
presented for the sSFR is within the error bars of the z = 6observation and about 1.5σ less than the z = 5 observation.
The age of galaxies (defined to be the mean time sinceformation of their constituent star particles) range from∼ 80 Myr at z = 8 to ∼ 40 Myrs old at z = 12. Wefind (for M∗ = 109M) a redshift dependence such thatage ≈ [−10.1(1 + z) + 167] Myr.
Gas-phase metallicity as a function of stellar mass (mass-metallicity, MS, relation) is shown in the bottom panel ofFigure 7, where log10(Z/Z) + 8.69 = 12 + log10(O/H)(Asplund et al. 2009) and we have assumed Z = 0.02. Wedefine the metallicity using the star-forming star particleswithin the galaxies, which are typically centrally concentrated.This is likely to most closely match with how metallicitiesare measured observationally from star-forming regions. Wepoint out that a different definition of the gas-phase metal-licity that includes all gas particles (not only SF) in galaxiesleads to values about 0.5 dex lower than what shown inFig. 7. The mass-metallicity relation for the mock HLS galax-ies shows negligible redshift evolution and a dependenceon stellar mass ( d log10 Z
d log10M∗ ∼ 0.4 with M∗ in units of M).
The slope of the predicted MS relation is consistent to theobserved one. Recent measurements of the MS relation athigh-z has been carried out by Faisst et al. (2016) who findcomparable metallicities for z ∼ 5 in the COSMOS fieldsto the z = 3.5 results of Maiolino et al. (2008), implying aweak dependence with redshift for z > 3.5. The BlueTidesresults predict an amplitude consistent with the measure-ments of Faisst et al. (2016) and Maiolino et al. (2008), andsupports the lack of redshift evolution of metallicity at high-z. However, the measurements of the MS relation at thesehigh redshifts still has large uncertainties and even at lowredshfits (not shown here), these measurements are subjectto calibration issues that can change values up to 0.7 dex(Kewley & Ellison 2008). This makes it hard to place con-straints on BlueTides star formation models and feedbackprocesses based on predictions for the amplitude of the MSrelation.
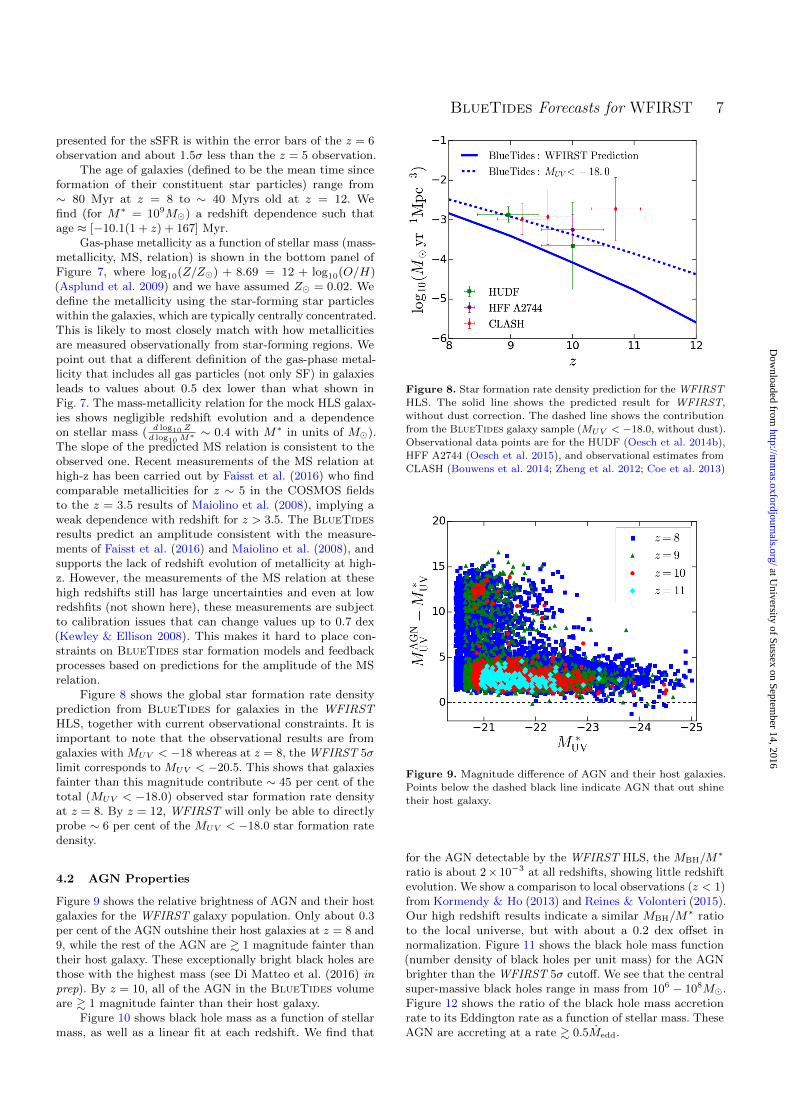
Figure 8 shows the global star formation rate densityprediction from BlueTides for galaxies in the WFIRSTHLS, together with current observational constraints. It isimportant to note that the observational results are fromgalaxies with MUV < −18 whereas at z = 8, the WFIRST 5σlimit corresponds to MUV < −20.5. This shows that galaxiesfainter than this magnitude contribute ∼ 45 per cent of thetotal (MUV < −18.0) observed star formation rate densityat z = 8. By z = 12, WFIRST will only be able to directlyprobe ∼ 6 per cent of the MUV < −18.0 star formation ratedensity.
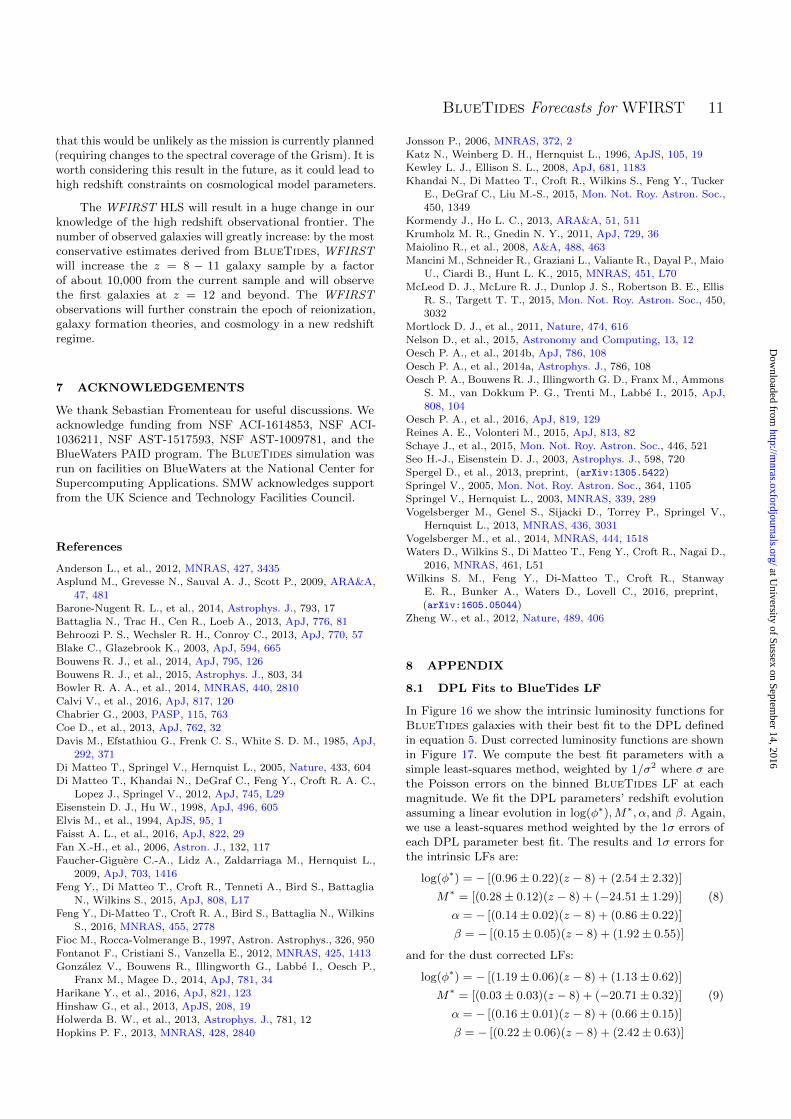
4.2 AGN Properties
Figure 9 shows the relative brightness of AGN and their hostgalaxies for the WFIRST galaxy population. Only about 0.3per cent of the AGN outshine their host galaxies at z = 8 and9, while the rest of the AGN are & 1 magnitude fainter thantheir host galaxy. These exceptionally bright black holes arethose with the highest mass (see Di Matteo et al. (2016) inprep). By z = 10, all of the AGN in the BlueTides volumeare & 1 magnitude fainter than their host galaxy.
Figure 10 shows black hole mass as a function of stellarmass, as well as a linear fit at each redshift. We find that
Figure 8. Star formation rate density prediction for the WFIRSTHLS. The solid line shows the predicted result for WFIRST,
without dust correction. The dashed line shows the contributionfrom the BlueTides galaxy sample (MUV < −18.0, without dust).
Observational data points are for the HUDF (Oesch et al. 2014b),
HFF A2744 (Oesch et al. 2015), and observational estimates fromCLASH (Bouwens et al. 2014; Zheng et al. 2012; Coe et al. 2013)
Figure 9. Magnitude difference of AGN and their host galaxies.Points below the dashed black line indicate AGN that out shinetheir host galaxy.
for the AGN detectable by the WFIRST HLS, the MBH/M∗
ratio is about 2× 10⁻³ at all redshifts, showing little redshiftevolution. We show a comparison to local observations (z < 1)from Kormendy & Ho (2013) and Reines & Volonteri (2015).Our high redshift results indicate a similar MBH/M
∗ ratioto the local universe, but with about a 0.2 dex offset innormalization. Figure 11 shows the black hole mass function(number density of black holes per unit mass) for the AGNbrighter than the WFIRST 5σ cutoff. We see that the centralsuper-massive black holes range in mass from 106 − 108M.Figure 12 shows the ratio of the black hole mass accretionrate to its Eddington rate as a function of stellar mass. TheseAGN are accreting at a rate & 0.5Medd.
at University of Sussex on Septem
ber 14, 2016http://m
nras.oxfordjournals.org/D
ownloaded from

8 Dacen Waters et al.
Figure 10. Black hole mass vs. stellar mass for the AGN brighterthan the WFIRST 5σ limit. Data points show the distribu-
tion at each redshift. The solid lines show the best linear fit
at each redshift. Grey and black dashed lines show the best fitsto local observations (z < 1) from Kormendy & Ho (2013) andReines & Volonteri (2015), respectively.
Figure 11. Black hole mass function for the AGN with intrinsicluminosities bright enough to be detected by WFIRST. Shaded
region indicates 1σ Poisson errors.
5 CLUSTERING
Given the large sample of galaxies expected in the WFIRSTHLS, it will be possible to measure their correlation functionsat these high redshifts. Measurement of three-dimensionalclustering will require galaxy redshift information. TheWFIRST Grism survey is planned to cover about one thirdof the area of the HLS. It is designed primarily for searchingfor emission line galaxies with redshifts z ≈ 1− 3, using theirHα lines and the OIII doublet. As a result the wavelengthcoverage is planned to be 1.35-1.89 microns with R=461.The galaxy described by Oesch et al. (2016) was confirmedto be at redshift z = 11.09 from observation of the Lyαbreak in HST Grism spectroscopy. Given that we predictfrom BlueTides that large populations of galaxies of similarapparent magnitude exist at redshifts z = 8, it is possible
Figure 12. AGN mass accretion rate vs. stellar mass for the
AGN with intrinsic luminosities bright enough to be detected by
WFIRST.
that redshifts can be measured to similar accuracy, dependingon the performance of WFIRST spectroscopy. One obstacleto measuring redshifts below z = 10.1 however is that thecurrent lower limit of the WFIRST Grism coverage wouldexclude detection of the Lyα break.
Without spectroscopy, multiband photometric redshiftswill be obtained for the galaxies we investigate in this work.For example, Calvi et al. (2016) have recently extended theBORG (Brightest of Reionizing Galaxies) survey to z = 9−10using HST five-band photometry. They find that approxi-mately 30 per cent of galaxies are interlopers with z ∼ 1,whose Balmer break is masquerading as a Lyα break at higherz. This contamination results in a suppression in angularclustering which should be modeled. In this work, we concen-trate on three dimensional measurements of the correlationfunction to illustrate the clustering bias and other propertiesof the galaxies in BlueTides. We leave specific modelingof the impact of Grism redshifts on three dimensional clus-tering (or projected clustering), and also angular clustering(for example using photometric information only) to futurework. As a result, our speculations below on the possibility ofdetecting the BAO feature in clustering represent a best casescenario, intended to spur research into the idea of making ameasurement at these high redshifts.
We calculate the correlation functions from the Blue-Tides galaxies as described in Section 2.3. We compute thecorrelation functions in real space, as we expect the redshiftdistortions of these highly biased objects to be small. Toestimate errors on the galaxy correlation function, we uti-lize a delete-one jacknife method. We divide the BlueTidesvolume into eight sub samples and calculate the correlationfunction, removing each sub sample one at a time. The errorson the correlation function are then given by
σ2(r) =N − 1
N
N∑i
(ξ(r) − ξi(r))2 (7)
where ξ(r) is the correlation function for the entire volumeand ξi(r) is the correlation function with the ith sub volumeremoved. Figure 13 shows the measured correlation functionof the BlueTides galaxies brighter than the WFIRST 5σ
at University of Sussex on Septem
ber 14, 2016http://m
nras.oxfordjournals.org/D
ownloaded from

BlueTides Forecasts for WFIRST 9
Figure 13. Galaxy correlation functions for redshifts z = 8, 9, and 10. Error bars are delete-one jacknife errors. Green dashed line shows
the dark matter correlation function multiplied by the square of the linear bias.
Figure 14. Bias measurements for the galaxies visible to WFIRSTfrom BlueTides (blue points). Also shown is the bias from Blue-Tides for galaxies in halos above a given halo mass, b(> MHalo)
(dashed lines).
limit. Also shown is the dark matter correlation function.We multiply the dark matter correlation function by the biascomputed in equation 4.
Barone-Nugent et al. (2014) measured a linear bias ofb = 8.6 using about 650 Lyman Break Galaxies at z ∼ 7in the HST Ultra Deep Fields. The WFIRST HLS will becapable of detecting ∼ 650 galaxies at z = 13 according toBlueTides. So WFIRST may have a large enough galaxysample to determine the linear bias out to z ∼ 13. The galaxybias as a function of redshift is shown in Figure 14 with errorspropagated forward from the jacknife errors on the galaxycorrelation functions (no error assumed on the dark matteronly correlation function). The WFIRST galaxy populationin BlueTides implies values of b = 13.4 ± 1.8 at z = 8,which will be the largest bias ever measured. The galaxy bias
BOSS CMASS WFIRST
z 0.57 8.0
z 0.43 < z < 0.7 7.865 < z < 8.135
Pdm(h−3Mpc3) 2040 75.3b 2.0 13.36
Pgg(h−3Mpc3) 8160 13240
n (h3Mpc−3) 3.0 × 10⁻⁴ 1.19 − 3.6 × 10⁻⁴
nPgg 2.45 1.60-4.87
ASurvey (deg2) 3275 2200
V (Gpc3) 3.89 4.58
Table 2. Comparison of the BOSS CMASS sample
(Anderson et al. 2012) and the WFIRST z = 8 sample aspredicted by BlueTides. Pgg and Pdm are computed at the BAOscale k = 0.2h/Mpc at the mean redshift of the sample in question.
Ranges for n (and nP ) are computed using galaxies brighter thanthe WFIRST 5σ according to the intrinsic and dust corrected
galaxy luminosities. V is the comoving volume for each survey’s
respective area coverage, assuming the same range in redshiftcentered about the mean redshift z.
increases linearly with redshift (b ≈ 2.1(1 + z)−5.3) reachingvalues close to b ∼ 20 by z = 11.
Figure 13 shows that at r ∼ 100h−1Mpc, the BlueTidesgalaxy correlation function is consistent with no BAO peak.This is a result of the relatively small simulation volume ofBlueTides. However WFIRST HLS will cover a much biggercomoving volume (by a factor of ∼ 400). The detectabilityof the BAO peak is largely determined by the survey volumeand the product nPgg, where n is the number density ofthe galaxy population and Pgg = b2Pdm is the galaxy powerspectrum evaluated at the BAO scale k = 0.2hMpc−1. FornPgg < 1, the error on the measurement of the BAO peak isdominated by shot noise. For nPgg > 1 the BAO peak can befully sampled for a strong detection. Given the bias measuredabove and the number density of galaxies in BlueTides (andthe dark matter only power spectrum from Eisenstein & Hu(1998) for Pdm) we can estimate the expected strength of theBAO signal.
at University of Sussex on Septem
ber 14, 2016http://m
nras.oxfordjournals.org/D
ownloaded from

10 Dacen Waters et al.
Figure 15. nPgg computed for the WFIRST survey using the
number density and bias computed from BlueTides. Upper (lower)
limit uses the number density n computed with the intrinsic (dustcorrected) luminosities. Black line shows the value for the BOSS
CMASS sample which detected the BAO peak at the 5σ level.(Anderson et al. 2012)
Table 2 shows the comparison at z = 8 for BOSS CMASS(Anderson et al. 2012), which detected the BAO peak at the5σ level, and WFIRST utilizing the number density and biasmeasurements from BlueTides. Although the dark matterpower spectrum is an order of magnitude lower at z = 8, wesee that BlueTides predicts values of nPgg for WFIRSTat z = 8 (nPgg = 1.60 − 4.87 ) which are comparable tothat of the BOSS CMASS sample (nPgg = 2.45). This isdue to the fact that the galaxy bias is larger by an orderof magnitude and the expected number density at z = 8(n = 1.2 − 3.6 × 10⁻⁴h3Mpc−3) is nearly the same as theBOSS CMASS number density (n = 3×10⁻⁴h3Mpc−3). Thecomoving volume for WFIRST is shown in Table 2 for thesame change in redshift as the BOSS CMASS sample, ∆z =0.27, centered around z = 8 to show that these surveys havesimilar observation volumes (before selection effects). Sincethe comoving volume of WFIRST is larger (V = 3.89Gpc3
for BOSS CMASS and V = 4.58Gpc3 for WFIRST), andthe values of nPgg are very comparable, this means that ifsufficiently accurate redshift information was available for thegalaxies, WFIRST would be able to detect the BAO signalat z = 8. As we have noted above, in practice, the WFIRSTGrism survey as planned will only cover one third of the areaof the HLS, and its spectral coverage of the Lyman break willnot include z = 8 − 9 in any case. Our BAO predictions aretherefore mostly illustrative, serving to highlight that thereis potentially a large population of galaxies which could beused to make this cosmological measurement. Further workwould be needed to decide whether changes to the WFIRSTmission instrument parameters would be enough to make themeasurement feasible.
Figure 15 shows the product nPgg at the BAO scaleas a function of redshift. The blue band shows nPgg forthe number density of galaxies detectable by WFIRST de-termined by the intrinsic (upper limit) and dust corrected(lower limit) luminosities. The black dashed line shows nPgg
for the BOSS CMASS sample (Anderson et al. 2012). The
error on the BAO measurement scales with V−1/2survey and
(1 + nPgg)/nPgg (Seo & Eisenstein 2003). Using this as arough measure for the detection strength of the BAO sig-nal compared to the 5σ detection strength from the BOSSCMASS sample, BlueTides predicts a ∼ 4.7 − 6.3σ detec-tion of the BAO signal at z = 8. At z = 9 and z = 10,BlueTides predicts detection significances of ∼ 1.4 − 4.0σand ∼ 0.5 − 1.5σ, respectively, assuming accurate redshiftinformation. We find a similar result following the methodof Blake & Glazebrook (2003), including the effects of shotnoise, so that the error on the power spectrum is given byσP /Pgg = 2π(k2∆kVsurvey)−1/2(1 + nPgg)/nPgg. Assuming∆k = 0.015h/Mpc, we find a 4.7σ difference between thegalaxy power spectrum and the no-wiggle power spectrum ofEisenstein & Hu (1998) at the BAO scale for the non-dustcorrected number density at z = 8. We note again that in-clusion of uncertainties on photometric redshifts, which willreduce the observed BAO signal, is necessary for a completeanalysis.
6 CONCLUSIONS
Using the BlueTides cosmological hydrodynamic simula-tion, we have forecast the properties of the galaxy and AGNpopulations to be discovered by the WFIRST HLS in the red-shift range z = 8 − 15. The BlueTides simulation producesresults which agree well with the galaxy LF from currentHST observations, including the highest redshift galaxy todate (Oesch et al. 2016). Our conclusions for the BlueTidespredictions are as follows:
• & 106 star forming galaxies beyond z = 8 will be de-tectable by the WFIRST HLS, significantly more than previ-ously predicted (S13).
• We find that even with a dust-corrected model, thebright end of the luminosity function deviates from that of astandard Schechter function. This is relevant to the WFIRSTLFs, since the HLS survey will only be able to detect thebrightest galaxies at such high redshift.
• z = 15 galaxies are likely to be within the 5σ detectionlimit of WFIRST since dust effects seem to be small beyondz = 11.
• Around 104 AGN will have UV luminosities brightenough to be detected by WFIRST at z = 8 and beyond.These will be the highest redshift AGN observed to date.
• The WFIRST galaxy population will have specific starformation rates of ∼ 10/Gyr−1, ages between 10s to 100sof million years, and gas phase metallicities in the range12 + log10(O/H) = 6 to 8. The galaxies will reside in darkmatter halos with masses & 1010.5M.
• A few of the brightest AGN sources in the BlueTidesvolume outshine their host galaxy in the UV. The AGNWFIRST will observe have black hole masses that rangefrom 105 − 108M and their mass accretion results in aluminosity around half the Eddington value or more.
• The WFIRST galaxy population will be very highlybiased. The bias at z = 8 will be b = 13.4 ± 1.8 and willevolve linearly with redshift.
• Due to the high bias and large number density predictedby BlueTides, if redshift information is available for thesegalaxies (using the WFIRST Grism) WFIRST could perhapsdetect the BAO peak to a high level of significance at z = 8,comparable to that of the BOSS CMASS sample. We note
at University of Sussex on Septem
ber 14, 2016http://m
nras.oxfordjournals.org/D
ownloaded from
BlueTides Forecasts for WFIRST 11
that this would be unlikely as the mission is currently planned(requiring changes to the spectral coverage of the Grism). It isworth considering this result in the future, as it could lead tohigh redshift constraints on cosmological model parameters.
The WFIRST HLS will result in a huge change in ourknowledge of the high redshift observational frontier. Thenumber of observed galaxies will greatly increase: by the mostconservative estimates derived from BlueTides, WFIRSTwill increase the z = 8 − 11 galaxy sample by a factorof about 10,000 from the current sample and will observethe first galaxies at z = 12 and beyond. The WFIRSTobservations will further constrain the epoch of reionization,galaxy formation theories, and cosmology in a new redshiftregime.
7 ACKNOWLEDGEMENTS
We thank Sebastian Fromenteau for useful discussions. Weacknowledge funding from NSF ACI-1614853, NSF ACI-1036211, NSF AST-1517593, NSF AST-1009781, and theBlueWaters PAID program. The BlueTides simulation wasrun on facilities on BlueWaters at the National Center forSupercomputing Applications. SMW acknowledges supportfrom the UK Science and Technology Facilities Council.
References
Anderson L., et al., 2012, MNRAS, 427, 3435
Asplund M., Grevesse N., Sauval A. J., Scott P., 2009, ARA&A,47, 481
Barone-Nugent R. L., et al., 2014, Astrophys. J., 793, 17
Battaglia N., Trac H., Cen R., Loeb A., 2013, ApJ, 776, 81
Behroozi P. S., Wechsler R. H., Conroy C., 2013, ApJ, 770, 57
Blake C., Glazebrook K., 2003, ApJ, 594, 665
Bouwens R. J., et al., 2014, ApJ, 795, 126
Bouwens R. J., et al., 2015, Astrophys. J., 803, 34
Bowler R. A. A., et al., 2014, MNRAS, 440, 2810
Calvi V., et al., 2016, ApJ, 817, 120
Chabrier G., 2003, PASP, 115, 763
Coe D., et al., 2013, ApJ, 762, 32
Davis M., Efstathiou G., Frenk C. S., White S. D. M., 1985, ApJ,
292, 371
Di Matteo T., Springel V., Hernquist L., 2005, Nature, 433, 604
Di Matteo T., Khandai N., DeGraf C., Feng Y., Croft R. A. C.,
Lopez J., Springel V., 2012, ApJ, 745, L29
Eisenstein D. J., Hu W., 1998, ApJ, 496, 605
Elvis M., et al., 1994, ApJS, 95, 1
Faisst A. L., et al., 2016, ApJ, 822, 29
Fan X.-H., et al., 2006, Astron. J., 132, 117
Faucher-Giguere C.-A., Lidz A., Zaldarriaga M., Hernquist L.,
2009, ApJ, 703, 1416
Feng Y., Di Matteo T., Croft R., Tenneti A., Bird S., BattagliaN., Wilkins S., 2015, ApJ, 808, L17
Feng Y., Di-Matteo T., Croft R. A., Bird S., Battaglia N., WilkinsS., 2016, MNRAS, 455, 2778
Fioc M., Rocca-Volmerange B., 1997, Astron. Astrophys., 326, 950
Fontanot F., Cristiani S., Vanzella E., 2012, MNRAS, 425, 1413
Gonzalez V., Bouwens R., Illingworth G., Labbe I., Oesch P.,Franx M., Magee D., 2014, ApJ, 781, 34
Harikane Y., et al., 2016, ApJ, 821, 123
Hinshaw G., et al., 2013, ApJS, 208, 19
Holwerda B. W., et al., 2013, Astrophys. J., 781, 12
Hopkins P. F., 2013, MNRAS, 428, 2840
Jonsson P., 2006, MNRAS, 372, 2
Katz N., Weinberg D. H., Hernquist L., 1996, ApJS, 105, 19
Kewley L. J., Ellison S. L., 2008, ApJ, 681, 1183Khandai N., Di Matteo T., Croft R., Wilkins S., Feng Y., Tucker
E., DeGraf C., Liu M.-S., 2015, Mon. Not. Roy. Astron. Soc.,450, 1349
Kormendy J., Ho L. C., 2013, ARA&A, 51, 511
Krumholz M. R., Gnedin N. Y., 2011, ApJ, 729, 36Maiolino R., et al., 2008, A&A, 488, 463
Mancini M., Schneider R., Graziani L., Valiante R., Dayal P., MaioU., Ciardi B., Hunt L. K., 2015, MNRAS, 451, L70
McLeod D. J., McLure R. J., Dunlop J. S., Robertson B. E., Ellis
R. S., Targett T. T., 2015, Mon. Not. Roy. Astron. Soc., 450,3032
Mortlock D. J., et al., 2011, Nature, 474, 616
Nelson D., et al., 2015, Astronomy and Computing, 13, 12
Oesch P. A., et al., 2014b, ApJ, 786, 108Oesch P. A., et al., 2014a, Astrophys. J., 786, 108
Oesch P. A., Bouwens R. J., Illingworth G. D., Franx M., AmmonsS. M., van Dokkum P. G., Trenti M., Labbe I., 2015, ApJ,
808, 104
Oesch P. A., et al., 2016, ApJ, 819, 129Reines A. E., Volonteri M., 2015, ApJ, 813, 82
Schaye J., et al., 2015, Mon. Not. Roy. Astron. Soc., 446, 521
Seo H.-J., Eisenstein D. J., 2003, Astrophys. J., 598, 720Spergel D., et al., 2013, preprint, (arXiv:1305.5422)
Springel V., 2005, Mon. Not. Roy. Astron. Soc., 364, 1105
Springel V., Hernquist L., 2003, MNRAS, 339, 289Vogelsberger M., Genel S., Sijacki D., Torrey P., Springel V.,
Hernquist L., 2013, MNRAS, 436, 3031Vogelsberger M., et al., 2014, MNRAS, 444, 1518Waters D., Wilkins S., Di Matteo T., Feng Y., Croft R., Nagai D.,
2016, MNRAS, 461, L51Wilkins S. M., Feng Y., Di-Matteo T., Croft R., Stanway
E. R., Bunker A., Waters D., Lovell C., 2016, preprint,
(arXiv:1605.05044)Zheng W., et al., 2012, Nature, 489, 406
8 APPENDIX
8.1 DPL Fits to BlueTides LF
In Figure 16 we show the intrinsic luminosity functions forBlueTides galaxies with their best fit to the DPL definedin equation 5. Dust corrected luminosity functions are shownin Figure 17. We compute the best fit parameters with asimple least-squares method, weighted by 1/σ2 where σ arethe Poisson errors on the binned BlueTides LF at eachmagnitude. We fit the DPL parameters’ redshift evolutionassuming a linear evolution in log(φ∗),M∗, α, and β. Again,we use a least-squares method weighted by the 1σ errors ofeach DPL parameter best fit. The results and 1σ errors forthe intrinsic LFs are:
log(φ∗) = − [(0.96 ± 0.22)(z − 8) + (2.54 ± 2.32)]
M∗ = [(0.28 ± 0.12)(z − 8) + (−24.51 ± 1.29)] (8)
α = − [(0.14 ± 0.02)(z − 8) + (0.86 ± 0.22)]
β = − [(0.15 ± 0.05)(z − 8) + (1.92 ± 0.55)]
and for the dust corrected LFs:
log(φ∗) = − [(1.19 ± 0.06)(z − 8) + (1.13 ± 0.62)]
M∗ = [(0.03 ± 0.03)(z − 8) + (−20.71 ± 0.32)] (9)
α = − [(0.16 ± 0.01)(z − 8) + (0.66 ± 0.15)]
β = − [(0.22 ± 0.06)(z − 8) + (2.42 ± 0.63)]
at University of Sussex on Septem
ber 14, 2016http://m
nras.oxfordjournals.org/D
ownloaded from

12 Dacen Waters et al.
Figure 16. Intrinsic luminosity functions for BlueTides. Dashedlines show the best fit DPL defined in equation 5.
where φ∗ is in [Mpc−3mag−1].We define the AGN power law LF as
log(φ) = log(φ∗) + log[0.4 log 10)]
+0.4 log(10)(M∗ −M)(1 − α) (10)
where we arbitrarily choose M∗ = −18.0 (grey dashed linesin Figure 4). Using the same method as for the galaxy LFs,the best fit redshift evolutions are given by
log(φ∗) = − [(1.44 ± 0.26)(z − 8) + (26.15 ± 2.64)]
α = − [(0.01 ± 0.07)(z − 8) + (2.38 ± 0.68)]
(11)
8.2 Fits to Cumulative Number Density
The cumulative number of objects brighter than a givenmagnitude is well fit by a power law at each redshift (Figure3). We perform the same fitting scheme as with the LFs inthe previous section and present here redshift evolution fitswith 1σ errors. We fit the results with the following:
log10
(N(< mUV)/deg2) = A+ b mUV (12)
where
A = (−2.61 ± 0.22)(1 + z) + (5.93 ± 2.83) (13)
b = (0.07 ± 0.01)(1 + z) + (0.19 ± 0.11)
for the intrinsic luminosities and
A = (−3.23 ± 0.29)(1 + z) + (−1.74 ± 3.67) (14)
b = (0.09 ± 0.01)(1 + z) + (0.46 ± 0.14)
for the dust corrected luminosities.
Figure 17. Dust corrected luminosity functions for BlueTides.Dashed lines show the best fit DPL defined in equation 5.
at University of Sussex on Septem
ber 14, 2016http://m
nras.oxfordjournals.org/D
ownloaded from