Embed Size (px)
Citation preview

Forecasting two-photon absorption based on
one-photon properties
Mikhail Drobizhev, Zhiyong Suo, Aleks RebaneE. Scott Tarter, Benjamin D. Reeves, Brenda Spangler
Fanqing Meng, Charles W. SpanglerCraig J. Wilson, Harry L. Anderson
Department of Physics, Montana State University, Bozeman, MTSensopath Technologies, Inc., Bozeman, MT
MPA Technologies, Inc., Bozeman, MTDepartment of Chemistry, University of Oxford, Mansfield, Oxford,
UK
Nikolay Makarov,Department of Physics, Montana State University

Outline
• Motivation
• Experiments
• Calculations
• Conclusions

Motivation: Why to predict?
Which one is better? Why?
HH
N
N
N
N
N
N
N
N
NH
N
NH N
N
N
N
N
Cl
C l C l
C l
N
NC
N
NC
N
NC
N
NC
N HN
NNHCl
Cl
N
N
N
N HN
NNH
N
N

Motivation: What can quantum chemistry do?
2
222
2
423
2 gi
ee
nc
f
m mmg
mgfmjg
0, E0, 0
1, E1, 1
m, Em, m
?2?,,, gE mkjii
C. Katan, S. Tretiak, M.H.V. Werts, A.J. Bain, R.J. Marsh, N. Leonczek, N. Nicolaou, E. Badaeva, O. Mongin, M. Blanchard-Desce,“Two-photon transitions in quadrupolar and branched chromophores: experiment and theory”, J. Phys. Chem. B 2007, 111, 9468-9483

Experiments: Setup
Jobin Yvon Triax 550
Wavelength control
PCLabView
LNCCD
sample
L1
M1
F1
300 600 1200l/mm-1
Laser system
Coherent VERDI 64W CW 532nm
Coherent MIRA 9000.5W 795nm 150fs
Coherent LEGEND Regen. Amplifier1.1W 1kHz 795nm 150fs
TOPAS-C0.3W 1kHz 125fs
OSAFROGCorre-lator
Pulse characterization
Filter wheel
CCD camera control and DAQ
Digital Oscilloscope Ref. Channel DAQ GPIB
USB Serial
Intensity control
Ref. detector
sample
Hamamatsu Streak Camera C5680
Perkin-Elmer Lambda900Spectrophotometer
Perkin-Elmer LS 50BLuminescence Spectrometer
L2

Experimental Results
0.0 0.1 0.2 0.3 0.4 0.50
500
1000
1500
2000
2500
3000
3500
4000
4500
5000
pe
nta
na
l
2-c
hlo
rob
uta
ne
iso
bu
tyl a
ceta
te
iso
bu
tyl i
sob
ytyr
ate
bu
tyl e
the
r
n-o
cta
ne
Sto
kes
Sh
ift, c
m-1
f(D)
1 4 5 10
0 1 2 3 4 5 6 7
1E-3
0.01
0.1
1
12, 1.14 ns
11, 0.86 ns
9, 3.11 ns
6, 1.46 ns
4, 1.28 ns
1, 1.71 ns
No
rma
lize
d f
luo
resc
ent i
nte
nsity
Time, ns
560 580 600 620 640 660 680 700 720 740
0
50
100
15018000 17000 16000 15000 14000
Wavelength, nm
2, G
M
11,
M-1cm
-1
1.25104
0
2.5104
3.75104
5104
2, G
M 2
, GM
3
300 320 340 360 380 400 420 440
0
20
40
60
80
10032000 30000 28000 26000 24000
, M
-1cm
-1
1104
0
2104
3104
4104
Frequency, cm-1Frequency, cm-1
2, G
M
1
300 320 340 360 380 400 420 4400
20
40
60
80
100
32000 30000 28000 26000 24000
, M
-1cm
-1
1.25104
0
2.5104
3.75104
5104
300 320 340 360 380 400 420 440
0
20
40
60
80
10032000 30000 28000 26000 24000
Wavelength, nm
2, G
M
5
, M
-1cm
-1
1.25104
0
2.5104
3.75104
500 520 540 560 580 600 620 640 660 680 700
0
10
20
30
40
50
6020000 19000 18000 17000 16000 15000
2, G
M
10
, M
-1cm
-1
1104
0
2104
3104
4104
Frequency, cm-1
2, G
M
14
280 300 320 340 360 380 4000
100
200
300
400
50034000 32000 30000 28000 26000
, M
-1cm
-1
1104
0
2104
3104
4104
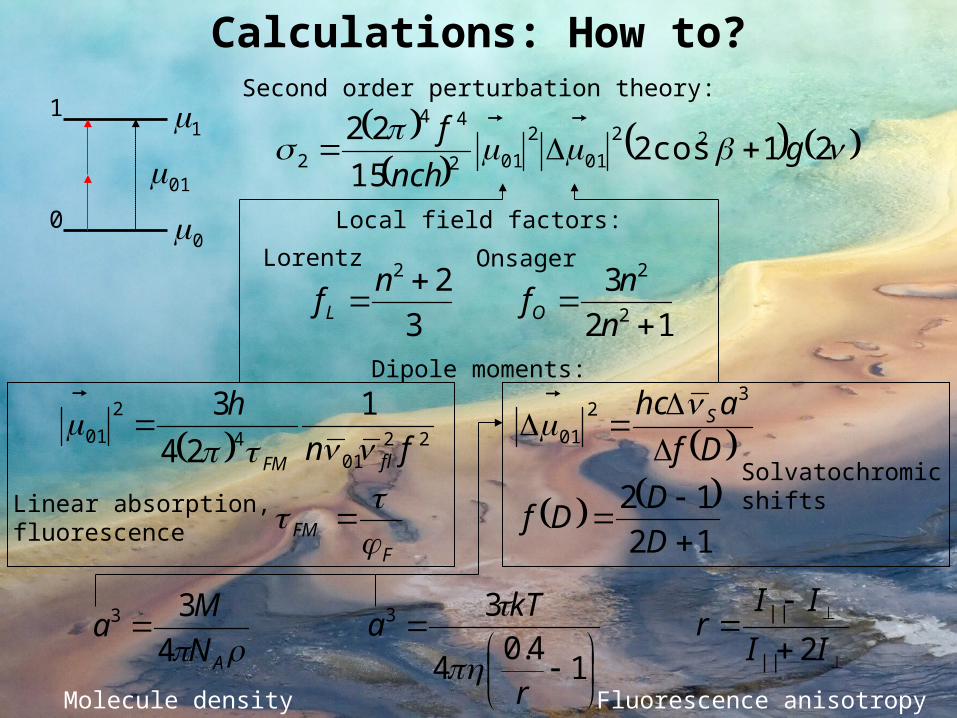
Calculations: How to?
2201
4
2
01
1
24
3
fn
h
flFM
FFM
Dfahc S
3
2
01
12
12
D
DDf
AN
Ma
4
33
1
4.04
33
r
kTa
II
IIr
2||
||
21cos215
22 22
01
2
012
44
2 gnch
f
0
1
01
1
0
12
3
3
22
22
n
nf
nf OL
Second order perturbation theory:
Local field factors:
Lorentz Onsager
Dipole moments:
Linear absorption,fluorescence
Solvatochromicshifts
Molecule density Fluorescence anisotropy
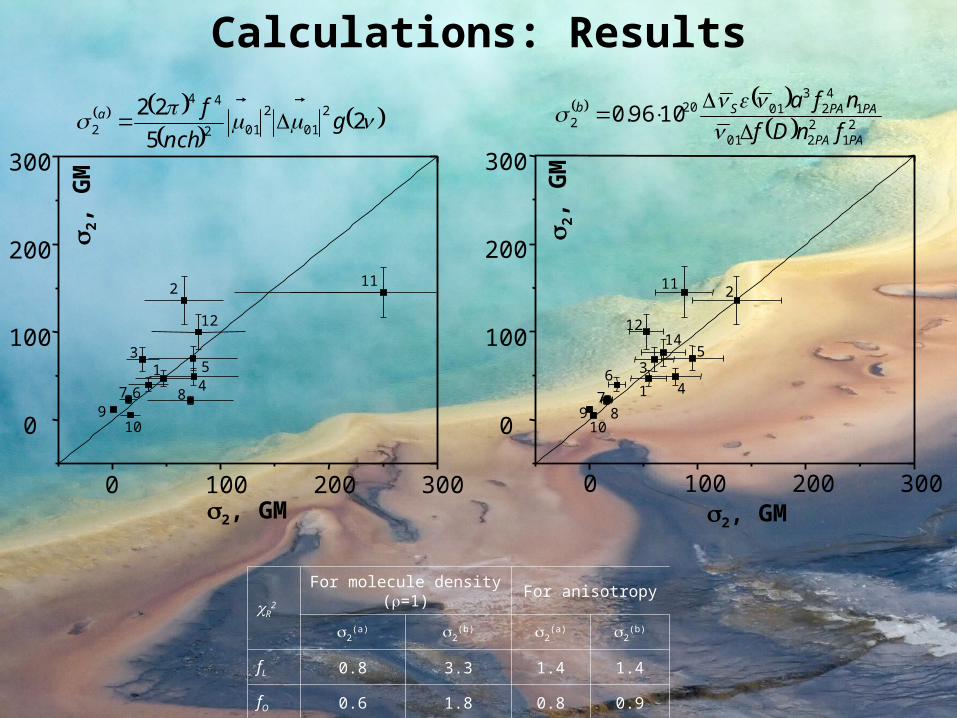
Calculations: Results
0 100 200 300
0
100
200
300
7
2 11
69
1
8
54
3
12
10
2,
GM
2, GM
25
22 2
01
2
012
44
2 gnch
fa
0 100 200 300
0
100
200
300
2, GM
11 2
12
10
5
416
97
8
3
2,
GM
14
2
12201
14
23
01202 1096.0
PAPA
PAPASb
fnDf
nfa
R2
For molecule density (=1) For anisotropy
2(a) 2
(b) 2(a) 2
(b)
fL 0.8 3.3 1.4 1.4
fO 0.6 1.8 0.8 0.9

Conclusions
See poster for details
• We show that the perturbation theory applied for two-level system quantitatively predicts the 2PA cross sections in dipolar molecules, provided that the necessary molecular parameters such as transition- and permanent dipole moments are independently measured.• In most cases, the discrepancy between theory and experiment was less than 20%, and always less than 50%. This is the first time that such direct quantitative correspondence is demonstrated for a wide range of dipolar molecules.• The overall significance of this work demonstrates a practical way how a set of relatively straightforward linear spectroscopic measurements can be used to study and predict nonlinear 2PA properties.
AcknowledgementsThe work was supported by AFOSR.