Embed Size (px)
Citation preview

FORECASTING REVENUE PASSENGER ENPLANEMENTS USING
WAVELET-SUPPORT VECTOR MACHINE
MOHAMAD AIMAN ZAINUDDIN
A thesis submitted in fulfillment of the
requirements for the award of the degree of
Master of Science (Mathematics)
Faculty of Science
Universiti Teknologi Malaysia
MAY 2015

iii
This thesis is the final will that a father left for his son during his dying moment
To my late father,
Haji Zainuddin Bin Embong
(March 5th
, 2014, Makkah)
may you rest in peace.
To the Dean family,
Lea, Jimmy, Annie & Ella
thank you for being strong.
To my mentor who is always the dad,
Mr Ibrahim M. Jais
Thank you for not giving up on me.
To my fantabulous lecturer,
Dato’ Dr Affendi Hashim
Esprit de corps.
To my KMM tutor whom I respect like a father,
Mr Khairil Afandi Mohd Sedek
Thank you for starting this journey and keep me going until the end.
To my brit buddy who keep our hair blonde and our eyes blue,
Muhammad Asyraf Mohd Shuisma
Thank you for all of the supports that came from all around the world.
To the 489,
Tan Mei Jing (태연), Wong Pei Shien (제시카) & Chong Lee Fang (청이팡)
Although volleyball that connects us, is our friendship that actually keep us going.
Keep the volleyball flying.

iv
ACKNOWLEDGEMENT
Alhamdulillah, with all the blessings from the Almighty Allah S.W.T, I am
grateful that another ‘book’ has been completed successfully. This volume is
precious than the previous one due to the responsibility to not only completing it as
a master thesis, but it is also a will that was left for me to finish by my late father,
Haji Zainuddin Bin Embong during his dying moment. It is unfortunate since he is
no longer around to hold this complete thesis in his hands. May he rest in peace.
Also to the Dean family, thank you for being strong especially after our beloved
father had passed away. It is hard for each of us but we will get through it with a
smile eventually.
To Mr Ibrahim, Dato’ Dr Affendi Hashim, Mr Afandi, Asyraf Shuisma, the
489 and all of those who were there for me since the start of this journey until the
end, thank you very much for keeping me going, for not giving up on me, helped
me to stand up again when I fall, and brought back the sun when it rained heavily,
especially when my late father passed away. I would not have completed this
journey without all of the sincere supports from each and every one of you.
To my supervisor, Dr Ani Shabri, thank you for all the patience that you
have spent on me just to make sure I manage in completing this thesis, eventhough
it was really hard on you.
Last but not least, I say my thank to my former classmate and lab partner,
Basri Badyalina whom I highly respect for his sincerity in sharing his knowledge
and guidance, and for his willingness in helping others without any hesitation.

v
ABSTRACT
Forecasting is an important element in an airline industry due to its capability
in projecting airport activities that will reflect the relationship that drives aviation
activities. A wavelet-support vector machine (WSVM) conjunction model for
revenue passenger enplanements forecast is proposed in this study. The conjunction
model is the combination of two models which are Discrete Wavelet Transform
(DWT) and Support Vector Machine (SVM). The method is then compared with
single SVM and Seasonal Decomposition-Support Vector Machine (SDSVM)
conjunctions. Seasonal Decomposition (SD) readings are obtained through X-12-
ARIMA. The monthly domestic and international revenue passenger enplanements
data dated from January 1996 to December 2012 are used. The performances of the
three models are then compared utilizing mean absolute error (MAE), mean square
error (MSE) and mean absolute percentage error (MAPE). The results indicate that
WSVM conjunction model has higher accuracy and performs better than both basic
single SVM and SDSVM conjunctions.

vi
ABSTRAK
Proses ramalan merupakan elemen penting dalam industri penerbangan
kerana melalui proses ini, segala hubungkait antara aktiviti di lapangan terbang yang
mempengaruhi aktiviti penerbangan dapat dilihat. Model gabungan gelombang-
mesin vektor sokongan (WSVM) bagi meramal pendapatan daripada bilangan
penumpang yang menaiki pesawat dicadangkan dalam kajian ini. Gabungan tersebut
adalah daripada dua model iaitu gelombang singkat diskrit (DWT) dan mesin vektor
sokongan (SVM). Model yang dicadangkan kemudiannya dibandingkan dengan
model SVM tunggal dan penguraian piawai – mesin vektor sokongan (SDSVM).
Bacaan daripada penguraian bermusim (SD) diperoleh dengan menggunakan kaedah
X-12-ARIMA. Dalam kajian ini, data bulanan yang digunakan untuk meramal
pendapatan daripada bilangan penumpang yang menaiki pesawat adalah jumlah
pendapatan daripada penumpang yang menaiki pesawat bagi penerbangan domestik
dan antarabangsa masing-masing dengan julat masa dari Januari 1996 hingga
Disember 2012. Prestasi setiap model dinilai berdasarkan bacaan purata ralat mutlak
(MAE), purata ralat kuasa dua (MSE) dan purata peratusan ralat mutlak (MAPE).
Keputusan perbandingan antara semua model menunjukkan bahawa model WSVM
mempunyai prestasi yang baik berbanding model SVM tunggal dan model gabungan
SDSVM.

vii
TABLE OF CONTENTS
CHAPTER TITLE PAGE
DECLARATION
ii
DEDICATION
iii
ACKNOWLEDGEMENT
iv
ABSTRACT
v
ABSTRAK
vi
TABLE OF CONTENTS
vii
LIST OF TABLES
x
LIST OF FIGURES
xi
LIST OF SYMBOLS
xiii
1 INTRODUCTION
1
1.1 Background of the Study
1.2 Problem Statement
1.3 Objectives of the Study
1.4 Scope of Study
1.5 Significance of the Study
1
6
8
9
9
2 LITERATURE REVIEW
11
2.1 Introduction
2.2 Revenue Passenger Enplanements Forecasting
2.3 Seasonal Decomposition (SD) using X-12-ARIMA
2.4 Discrete Wavelet Transform (DWT)
2.5 Support Vector Machine (SVM)
11
12
15
16
17

viii
2.6 Conjunction of Forecasting Models
2.7 Summary
19
21
3 RESEARCH METHODOLOGY
26
3.1 Introduction
3.2 Seasonal Decomposition (SD)
3.2.1 X-12-ARIMA
3.2.1.1 Smoothing
3.2.1.2 Moving Average (MA)
3.2.1.3 Multiplicative Model
3.2.1.4 Multiplicative Decomposition
3.2.1.5 Additive Model
3.2.1.6 Additive Decomposition
3.3 Discrete Wavelet Transform (DWT)
3.4 Support Vector Machine (SVM)
3.4.1 Modelling Structure
3.4.2 Classification of Support Vector Machine
3.4.2.1 Regression SVM Type 1 (Epsilon-
SVM Regression)
3.4.3 Kernel Function
3.5 Conjunction Forecasting Models
3.5.1 Wavelet-Support Vector Machine Conjunction
Model (WSVM)
3.5.2 Seasonal Decomposition-Support Vector
Machine (SDSVM)
3.6 Performance Criteria
3.7 Operational Framework
3.8 Summary
26
27
29
30
31
33
34
35
35
37
39
40
42
44
46
47
48
49
51
52
53
4 ANALYSIS OF REVENUE PASSENGER
ENPLANEMENTS
54
4.1 Introduction
4.2 Forecasting Revenue Passenger Enplanements Using
SVM Model
54
55
ix
4.2.1 Data Normalization
4.2.2 Modelling Structure
4.2.3 SVM Optimization
4.2.3.1 Regression SVM Type 1 Optimization
4.2.4 Fitting Kernel Function into SVM
4.2.4.1 Kernel Trick
4.2.4.2 Modification Due to Kernel Function
4.2.5 Performance Criteria
4.2.6 Results for Forecasting Revenue Enplanements
Using SVM
4.3 Forecasting Revenue Passenger Enplanements Using
Conjunction Model
4.3.1 Forecasting Revenue Passenger Enplanements
Using SDSVM
4.3.1.1 Additive Decomposition for Revenue
Passenger Enplanements Data Series
4.3.1.2 Results for Forecasting Revenue
Passenger Enplanements Using
SDSVM
4.3.2 Forecasting Revenue Passenger Enplanements
Using WSVM
4.3.2.1 Results for Forecasting Revenue
Passenger Enplanements Using
WSVM
4.4 Comparison of Models and Measures of Evaluation
for Revenue Passenger Enplanements’ Data
4.5 Summary
55
56
59
62
64
64
65
66
69
74
74
75
78
81
83
87
90
5 CONCLUSION AND RECOMMENDATION
92
5.1 Summary
5.2 Recommendations for Future Study
92
94
REFERENCES 95

x
LIST OF TABLES
TABLE NO. TITLE PAGE
2.1 Previous studies on aviation forecasting
23
4.1 SVM model input structure for forecasting time series data
58
4.2 The performance of revenue passenger enplanements
forecasting using SVM for domestic flights
70
4.3 The performance of revenue passenger enplanements
forecasting using SVM for international flights
71
4.4 The performance of revenue passenger enplanements
forecasting using SDSVM for domestic flights
78
4.5 The performance of revenue passenger enplanements
forecasting using SDSVM for international flights
79
4.6 The performance of revenue passenger enplanements
forecasting using WSVM for domestic flights
84
4.7 The performance of revenue passenger enplanements
forecasting using WSVM for international flights
84
4.8 The comparison of forecasting model’s performance in
revenue passenger enplanements forecasting for domestic
flights
87
4.9 The comparison of forecasting model’s performance in
revenue passenger enplanements forecasting for
international flights
88

xi
LIST OF FIGURES
TABLE NO. TITLE PAGE
3.1 Original series (non-seasonally adjusted series) of
Departures of Israelis Abroad by Air, monthly, from
January 2000 to March 2004
28
3.2 Graphical representations of time series components
29
3.3 Example of series that requires multiplicative
decomposition model
33
3.4 Example of series that requires additive decomposition
model
35
3.5 Input space original data
40
3.6 Mapped data in feature space
41
3.7 Support vector machines
41
3.8 The WSVM model structure
49
3.9 The SDSVM model structure
50
3.10 The overall process of the forecasting model analysis
52
4.1 Training time series plot for revenue (domestic) data and
SVM input 12
72
4.2 Testing time series plot for revenue (domestic) data and
SVM input 12
72
4.3 Training time series plot for revenue (international) data
and SVM input 12
73
4.4 Testing time series plot for revenue (international) data and
SVM input 12
73
4.5 Actual revenue passenger enplanement data series for
domestic flights
75
xii
4.6 Actual revenue passenger enplanement data series for
international flights
75
4.7 Training time series plot for revenue (domestic) data and
SDSVM
79
4.8 Testing time series plot for revenue (domestic) data and
SDSVM
80
4.9 Training time series plot for revenue (international) data
and SDSVM
80
4.10 Testing time series plot for revenue (international) data and
SDSVM
81
4.11 Decomposition of original data at 3-level decomposition
82
4.12 Training time series plot for revenue (domestic) data and
WSVM
85
4.13 Testing time series plot for revenue (domestic) data and
WSVM
85
4.14 Training time series plot for revenue (international) data
and WSVM
86
4.15 Testing time series plot for revenue (international) data and
WSVM
86
4.16 Testing time series plot for revenue (domestic) data, SVM,
SDSVM and WSVM
89
4.17 Testing time series plot for revenue (international) data,
SVM, SDSVM and WSVM
89

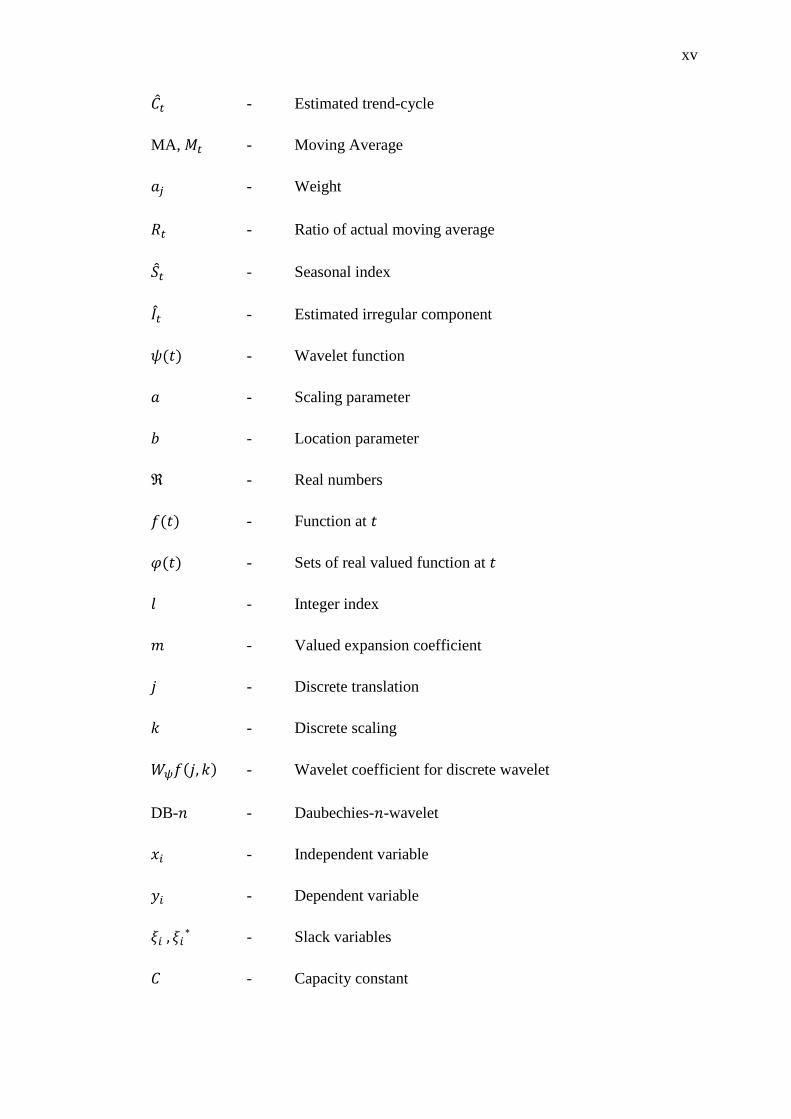
xiii
LIST OF SYMBOLS
FAA - Federal Aviation Administration
U.S.A. - United States of America
SVM - Support Vector Machine
EEMD - Ensemble Empirical Mode Decomposition
CAA - Civil Aviation Authority
DETR - Department of the Environment, Transportation and Regions
UK - United Kingdom
ANN - Artificial Neural Network
GP - Genetic Programming
EMD - Empirical Mode Decomposition
SD - Seasonal Decomposition
LSSVR - Least Squares Support Vector Regression
SRM - Structural Risk Minimization
DWT - Discrete Wavelet Transform
WSVM - Wavelet-Support Vector Machine conjunction
ARIMA - Autoregressive Integrated Moving Average
RM - Revenue Management
WTP - Willingness-To-Pay

xiv
SDSVM - Seasonal Decomposition-Support Vector Machine conjunction
MAE - Mean Absolute Error
MSE - Mean Square Error
MAPE - Mean Absolute Percentage Error
RITA - Research and Innovative Technology Administration
SVM-𝑛 - SVM model with 𝑛th input
NMSE - Normalize Mean Square Error
RMSE - Root Mean Square Error
MAPE - Mean Absolute Percentage Error
GMRAE - Geometric Mean Relative Absolute Error
DS - Dynamical System
SARIMA - Seasonal Autoregressive Integrated Moving Average
CSD - Core Standard
LESA - Line Extrapolation with Seasonal Adjustment
R - Correlation coefficient
MRA - Multiresolution Analysis
SRC - Sediment Rating Curve
SW - SARIMA-wavelet conjunction
𝑌𝑡 - Original data
𝐶𝑡 - Trend-cycle
𝑆𝑡 - Seasonal component
𝐼𝑡 - Irregular component
𝐷𝑡 - De-trend component
xv
�̂�𝑡 - Estimated trend-cycle
MA, 𝑀𝑡 - Moving Average
𝑎𝑗 - Weight
𝑅𝑡 - Ratio of actual moving average
�̂�𝑡 - Seasonal index
𝐼𝑡 - Estimated irregular component
𝜓(𝑡) - Wavelet function
𝑎 - Scaling parameter
𝑏 - Location parameter
ℜ - Real numbers
𝑓(𝑡) - Function at 𝑡
𝜑(𝑡) - Sets of real valued function at 𝑡
𝑙 - Integer index
𝑚 - Valued expansion coefficient
𝑗 - Discrete translation
𝑘 - Discrete scaling
𝑊𝜓𝑓(𝑗, 𝑘) - Wavelet coefficient for discrete wavelet
DB-𝑛 - Daubechies-𝑛-wavelet
𝑥𝑖 - Independent variable
𝑦𝑖 - Dependent variable
𝜉𝑖 , 𝜉𝑖∗ - Slack variables
𝐶 - Capacity constant

xvi
𝑤 - Vector of coefficient
𝜀 - Width of tube
RBF - Radial Basis Function
𝐾 - Kernel
Ds, 𝐷𝑡 - Detail component
𝑋𝑡 - Normalize data at time 𝑡
𝑦𝑚𝑎𝑥 - Maximum value in the original data set
�̂�𝑡 - Normalized forecasted data at time 𝑡
�̂�𝑡 - Value of forecasted data at time 𝑡
𝑥𝑡+𝑛 - Predicted value 𝑡
𝑠𝑖 - Lag period
x
- Derivative
Σ - Summation
𝛼𝑖 - Lagrange multiplier
ℒ - Langrangian
SV, 𝑤 - Support Vector
𝑧 - Sample data
),( ji xxK - Kernel function
𝑒𝑡 - Error at time 𝑡
𝐴𝑡 - Approximate component
�̂�𝑡 - Predicted approximate component
�̂�𝑡 - Predicted detail component
CHAPTER 1
INTRODUCTION
1.1 Background of the Study
Forecasting is an important element in airline industry due to its capability in
projecting airport activity that will then reflect the underlying causal relationship that
drives aviation activity. Aviation activity levels are resulted from the interaction of
demand and supply factors. The demand for aviation is mostly a function of
demographic and economic activity. Activity levels are influenced by supply factors
such as cost, competition and regulations.
Normally, passenger enplanements can be modelled as a function of variables
such as real personal income and real yield. The number of commercial operations,
in turn, is a function of passenger enplanements as well as operational factors
including average load factors and average seats per aircraft. Thus, local population
and income levels, the cost of flying, and the number of based aircraft at the airport
are examples of elements that can determine a general aviation activity.

2
Generally, forecasters evaluate the projections of aviation activity that result
from applying appropriate forecasting methods and its relationships before they are
finalized. Other than providing a means for developing quantifiable results, aviation
forecasters use forecasting methods and their professional judgement to determine
what is reasonable. Thus, making the evaluation forecast results an essential part of
the forecasting process (GRA Inc., 2001).
The level and type of aviation activity expected at the airport, as well as the
nature of planning being done determine the parameters that needed to be forecast.
The level and type of aviation demand generated at the airport that are measured by
aircraft operations is mainly the most important activity forecast for airfield
planning. This is due to this demand that defines the runway and taxiway
requirements. Runway and taxiway improvements are one of the dominant categories
of airport improvement funding provided through the Federal Aviation
Administration (FAA). For airport that is served by commercial air carriers, another
important activity measure is the level of commercial passenger enplanements
because it assists in determining the size of the terminal, the number of gates, and
other important elements of airport infrastructures. A number of aviation planning is
conducted on a regional basis and would include both regional demand and the
distribution of demand among airports in the region. Other planning requires detailed
analysis of enplanements and aircraft movements by city-pair. In planning a hub
airport, detailed network analysis of the hub and spoke system of service may be
involved.
Developing forecast of commercial activity is represented by passenger
enplanements, operational factors and operations. Although primary forecast need
may be aircraft operations, the forecast for commercial airports should begin with
projecting air carrier and commuter enplanements and then apply forecast of average
seats per aircraft and average load factor by category in order to develop air carrier
and commuter operations.

3
FAA Aerospace Forecasts done by FAA is a forecast of national level U.S.A.
aviation demand. The study provides a 12-year outlook and is updated each year in
March (FAA, 2001). It is classified as the official FAA view of the immediate future
aviation. Aggregate level forecast of passenger enplanements, revenue passenger
miles, fleet, and hours flown for large air carriers and regional/commuters are also
included. Another study done by FAA is the FAA Long Range Aerospace Forecasts
which is a long-range forecast that extends the 12-year forecast to a longer time
horizon for a period of 25 years (FAA, 2000). The forecast contains projections of
aircraft fleet and hours, air carrier and regional/commuter passenger enplanements,
air cargo freight revenue ton-miles, pilots, and FAA workload measures.
GRA Inc. (2001) stated that forecasting method used is not the main concern
in forecasting aviation demand due to the behaviour of data used. Different types of
data require suitable forecasting methods that can satisfy every criteria and its
behaviour. When the variables are finalized, only then appropriate methods is
selected to develop the forecast for the airport’s forecasting. Incorporating an
analysis of local and regional socioeconomic is very useful. This includes historical
and forecast data on variables such as population, revenue, and employment.
In forecasting, trend analysis is also a part of the process. Trend analysis
relies on projecting historic trends into the future. A regression is used with time as
the independent variable in trend analysis. This is one of the fundamental techniques
used to analyse and forecast aviation activity. It is often used as a back-up or
expedient technique but it is highly valuable because of its simplicity when applying.
In certain time, trend analysis is used as a reasonable method of projecting variables
that would be very complicated and costly to project by other means.
After the list of forecast elements has been identified, appropriate forecasting
methods is then selected with gathered data, the methods then need to be applied in
order to obtain the forecast of aviation activity. The results evaluation process is
essential. A useful step in evaluating the results is to graph key forecast results

4
against historic data trends. This is to determine whether the forecast appear
reasonable.
Air passenger traffic forecast provides a concrete basis for planning decisions
in air transport infrastructure for civil aviation authorities. For example, the Civil
Aviation Authority (CAA) in United Kingdom has the responsibility for regulating
the air transport industry in the UK and advising the government’s Department of the
Environment, Transport and Regions (DETR) on air transport matters (Grubb and
Mason, 2001) DETR is then presented the national forecasts periodically for the
future demand for air travel, by passenger numbers, at UK airports as a whole since
1980s.
The quantitative forecasting models falls into two categories which are
econometric modelling and forecasting but little attention has been paid on time
series models in air passenger traffic forecasting. Recent research on modelling time
series with complex nonlinearity, dynamic variation, and high irregularity provided
two promising directions. Firstly is to establish emerging artificial intelligence
models such as artificial neural networks (ANN), support vector machine (SVM) and
genetic programming (GP). Secondly is to integrate data decomposition techniques
such as empirical model decomposition (EMD) or ensemble empirical mode
decomposition (EEMD) into a unified modelling framework to forecast complex
nonlinear time series with great fluctuation and irregularity. Xie, Wang and Kin
(2013) also did a study on air passenger forecasting using hybrid seasonal
decomposition (SD) and least squares support vector regression (LSSVR) approach.
Air transportation has grown considerably around the world due to increment
of revenues and populations, and the change of the industry’s structure. An example
is the competition between high-speed railroad service and air transport (Park and
Ha, 2006). Therefore, air passenger forecasting can provide a key input into decision
of daily operation management and infrastructure planning of airports and navigation
services, and for aircraft ordering and design (Scarpel, 2013). Thus, enhanced

5
forecasting tools are to be used to satisfy the new conditions of airlines and airports.
SVM has been proven to possess excellent capability for classification and prediction
by minimizing an upper bound of the generalization error (Vapnik, 1995).
For this present study, a similar case of passenger enplanements forecasting is
studied but in term for its monthly revenue. The data are distributed by months for
each year involved. It second the above statement stating that the need of revenue
passenger enplanements forecasting is to assist the aviation activity for it being able
to optimize its system or to plan for future expansion or reduction. Thus, makes it a
major importance in planning an aviation activity.
The application of wavelet transform for analyzing variations, periodicities,
trends in time series has received much attention in recent years (Smith et al., 1998).
Discrete Wavelet Transform (DWT), a technique with a mathematical origin, is very
appropriate for noise filtering, data reduction and singularity detection which makes
it a good choice for time series data processing. DWT is a powerful tool for a time-
scale multiresolution analysis on time series and has been used to break down an
original time series into different components, each of which may carry meaningful
signals of the time series (Chaovalit et al., 2011). For example, a time series with a
frequency of five event occurrences per minute represents an interval (scale) of 12s
between events. Since DWT is a data transformation technique that produces a new
data representation which can be dispersed to multiple scales, the analysis of the
transformed data can also be performed at multiple resolution level. Partal and
Kucuk (2006) used a DWT for determining the possible trends in annual total
precipitation series.
In this study, an attempt to use a Wavelet-Support Vector Machine (WSVM)
conjunction model to forecast the revenue passenger enplanements time series data.
SVM offers remarkable generalization performance in many areas such as pattern
recognition, text classification and regression estimation (Asefa et al., 2006). Feng et
al., (2010) stated that SVM has become a popular tool in recent years in pattern

6
recognition and machine learning. SVM is used for classification problems and its
goal is to optimize “generalization” (Cristianini and John, 2000). Fernandez (2007)
used Wavelet-and-SVM-based forecasts to analyse U.S. metal and materials
manufacturing industry. Turkoglu and Avci (2008) used the same approach, WSVM,
but it was applied towards fuzzy inference system for texture classification. Both
studies compared their WSVM model with other benchmark models based on their
performance criteria and the outcomes are the same; where WSVM won against
other benchmark model such as ARIMA (Fernandez, 2007; Turkoglu and Avci,
2007).
1.2 Problem Statement
In the nascent years of airline Revenue Management (RM) system, American
Airlines once simplistically described the developing practice as “selling the right
seats to the right customers at the right prices” (Smith et al., 1992). This was and still
is the goal of Revenue Management. A generation ago, RM could have been
considered a narrow area of interest to academics and airline operations enthusiasts;
it was somewhat of a curiosity in the heavily regulated industry where airlines had
minimal control over fares and booking methods. Today, RM is an indispensable
tool, as nearly every carrier in the world seeks to maximize passenger revenue by
extracting fares at customers’ highest willingness-to-pay (WTP). Following
deregulation of the US airline industry in 1978, airlines faced two choices: either
adaptation to a new business environment – one without artificial limits on
competition – or obsolescence. And just as the nimble airlines once developed
creative new RM approaches to confront wholesale changes in the business of a new
competitive environment – one where the assumptions previously made about
customers’ booking habits have been invalidated. The simplification of traditional
fare structures is common in today’s air transportation marketplace. The crucial
question that in RM: what kind of demand can be expected for this flight?
Forecasting is the process of quantitatively estimating the expected demand for a

7
particular service and relies on bookings for previous or current similar services
(Reyes, 2006).
In this study, an attempt in applying SVM on revenue passenger
enplanements forecasting is done. Support vector machine (SVM) is considered one
of the soft computational techniques that have been successfully used in various
research areas (Vapnik et al., 1996; Yoon et al., 2004; McNamara et al., 2005; Awad
et al., 2007; Kaheil et al., 2008; Gao et al., 2010). This was brought about by the
remarkable characteristics of SVM such as good generalization performance, the
absence of local minima and sparse representation of solution. Another key
characteristic of SVM is that training SVM is equivalent to solving a linearly
constrained quadratic programming problem so that the solution of SVM is always
unique and globally optimal, unlike other networks’ training SVM which requires
nonlinear optimization with the danger of getting stuck into local minima. In SVM,
the solution to the problem is only dependent on a subset of training data points
which are referred to as support vectors. Using only support vectors, the same
solution can be obtained as using all the training data points. Although SVMs have
good generalization performance, they can be abysmally slow in test phase (Burges,
1996; Osuna and Girosi, 1998). From a practical point of view, the most serious
problem with SVM is the high algorithmic complexity and extensive memory
requirements of the required quadratic programming in large-scale tasks (Horváth,
2003).
Recently, wavelet transform is widely known for its capability in analyzing
variations, periodicities trends in time series. It also allows decomposition of a signal
into different levels of resolution scales where required data components can be
extracted. Choi, Yu and Au (2011) used DWT to decompose time series data into
several scales, where both the coarse and fine parts of the data are obtained. The
coarse scales (approximated) reveal the trend, while the fine (detailed) scales tend to
be related to seasonal influences and exogenous variables. Usually, the extracted data
gain from wavelet transform become input to the model applied. Thus, the ability
8
wavelet transform has become a major reason in improving the ability of model
applied predictions.
The term conjunction or hybridization of at least two forecasting models is
the trend nowadays. The reason is that it improves the performance of singular
forecasting method. Thus, in this study, a conjunction model between Discrete
Wavelet Transform (DWT) and SVM is proposed to model the revenue passenger
enplanements forecasting. The goal of this thesis is to answer the following question:
Does hybrid forecasting lead to revenue passenger enplanements improvement over
singular forecasting?
1.3 Objectives of the Study
In view of the problems mentioned, this study is intended to propose a
WSVM revenue passenger enplanements estimation for U.S.A. airports for domestic
and international flights. The objectives of the study are as follows:
i. To explore the potential application of SVM model for revenue passenger
enplanements forecasting
ii. To propose a conjunction model for revenue passenger enplanements by
combining DWT and SVM
iii. To compare the performance of the proposed conjunction model with
other forecasting models such as singular SVM and SDSVM in terms of
MAE, MSE and MAPE.

9
1.4 Scope of Study
In this study, the data used are secondary data that was obtained from
Research and Innovative Technology Administration (RITA), Bureau of
Transportation Statistics, T-100 Market and Segment, U.S. Air Carrier Traffic
Statistics (www.rita.dot.gov/bts/acts). There are two data sets where one is the
domestic flight and the other one is the international flight for revenue passenger
enplanements. Both data sets are monthly data dated from January 1996 to December
2012 which total to 204 data for each set.
The SVM models applied in this study are SVM2, SVM4, SVM6, SVM8,
SVM10 and SVM12 before each performance is evaluated. For SDSVM, an
application of X-12-ARIMA additive decomposition is used for data decomposition
before it is combined with SVM. The DWT Daubechies wavelet was chosen as
mother wavelet and DWT is decomposed using Mallat algorithm. One, two and three
level decomposition of DWT were applied in this study. DWT is later combined with
SVM forming a WSVM model. SVM and SDSVM are then used to compare their
performance with WSVM. At the final stage, each model’s performance in
estimating revenue passenger enplanements forecasting is evaluated by its mean
absolute error (MAE), mean squared error (MSE) and mean absolute percentage
error (MAPE).
1.5 Significance of the Study
This research is to expect that the proposed model WSVM can be used as an
alternative model compared to singular SVM and SDSVM because WSVM is an
improvement of SVM model and due to its conjunction; it is supposed to outperform

10
SDSVM because wavelet decomposition is known to be better than seasonal
decomposition (SD).
REFERENCES
Addison, P. S. (2002). The Illustrated Wavelet Transform Handbook. UK: IOP
Publishing Ltd.
Alekseev, K. P. G. and Seixas, J. M. (2009). A multivariate neural forecasting
modelling for air transport – Preprocessed by decomposition: A Brazilian a
pplication. Journal of Air Transport, 15: 212-216.
Asefa, T., Kemblowski, M., Mckee, M. and Khalil, A. (2006). Multi-time scale
streamflow predictions: the support vector machines approach. Journal of
hydrology. 318, 7-16.
Ashley, D. J. and Hanson, P. (1995). A policy-sensitive traffic forecasting model for
Schiphol Airport. Journal of Air Transport Management. 2(2): 89-97.
Awad, M., Jiang, X. and Motai, Y. (2007). Incremental support vector machine
Framework for visual sensor network networks, EURASIP. Journal Advance
in Signal Processes. 1-14.
Bao, Y., Xiong, T. and Hu, Z. (2012). Forecasting Air Passenger Traffic by Support
Vector Machines with Ensemble Empirical Mode Decomposition and Slope-
Based Method. Discrete Dynamics in Nature and Society. Vol. 2012(2012).
Bureau of Transportation Statistics (2013). U. S. Air Carrier Traffic Statistics.
Retrieved from www.rita.dot.gov/bts/acts

96
Bowden, G. J., Dandy, G. C. and Maier, H. R. (2005). Input determination for neural
network models in water resources applications: Part 1 – Background and
methodology. Journal of Hydrology, 301(1-4): 75-92.
Bozic, M. and Stojanovic, M. (2011). Application of SVM method for methods for
mid-term loard forecasting. Serbian journal of electrical engineering. 8(1):
73-83.
Burges, C. J. C. (1998). A Tutorial on Support Vector Machines for Pattern
Recognition. Data Mining and Knowledge Discovery, 2: 121-167.
Cao, J. L. and Tay, F. E. H. (2003). Support Vector Machines with adaptive
parameters in financial time series forecast. IEEE transaction on networks
14(6): 1506-1518.
Cao, L. and Tay, F. E. H. (2001). Financial forecasting using support vector
machines. Neurocomputing and application. 10, 184-192.
Chaovalit, P., Gangopadhyay, A., Karabatis, G. and Chen, Z. (2011). Discrete
wavelet transform-based time series analysis and mining. Journal ACM
Computing Surveys (CSUR). 43(2): 1-31.
Chen, K. Y. and Wang, C. H. (2007). A hybrid SARIMA and support vector
machines in forecasting the production values of the machinery industry in
Taiwan. Expert System with Applications. 32(1): 254-264.
Choi, T. M., Yu, Y. and Au, K. F. (2011). A hybrid SARIMA wavelet transform
method for sales forecasting. Decision Support System. 51(1): 130-140.
Chou , C. M. and Wang, R. Y. (2002). On-line Estimation of Unit Hydrographs using
the Wavelet-based LMS Algorithm. Hydrological Sciences Journal, 47(4):
721-738.

97
Cline, R. C., Ruhl, T. A., Gosling, G. D. and Gillen, D. W. (1998). Air transportation
demand forecasts in emerging market economies: a case study of the Kyrgyz
Republic in the former Soviet Union. Journal of Air Transport Management.
4: 11-23
Cortes, C. and Vapnik, V. (1995). Support vector networks. Machine learning 20 (3):
273-279.
Coulibaly, P. and Burn, H. D. (2004). Wavelet Analysis of Variability in Annual
Canadian Streamflows. Water Resource Research, 40(3): 1-4.
Cristianini, N. and John, S. T. (2000). An Introduction To Support Vector Machines
And Other Kernel Based Learning Methods. Cambridge University Press.
Dawson, C. W., Abrahart, R. J., Shamseldin, A. Y. and Wilby, R. I. (2006). Flood
estimation at ungauged sites using artificial neural network. Journal of
Hydrology. 319: 391-409.
Durgesh S. K. and Lekha, B. (2009). Data classification using support vector
machine. Journal of Theoretical and Applied Information Technology. 12.
Evans, A. and Schӓfer, A. (2011). The impact of airport capacity constraints on
future growth in the US air transportation system. Journal of Air Transport
Management, 17: 288-295.
Federal Aviation Administration (2000). FAA Long Range Aerospace Forecasts
Fiscal Years 2015, 2020 and 2025.
Federal Aviation Administration (2001). FAA Aerospace Forecasts, Fiscal Years
2001-2012.
Feng, L., Yao. and Jin, B. (2010). Research on credit scoring model with SVM for
network management. Journal of computational information system 6(11):
3567-3574.

98
Fernandez, V. (2007). Wavelet-and SVM-based forecasts: An analysis of the U.S.
metal and materials manufacturing industry. Resources Policy, 32(1-2): 80-
89.
Fildes, R., Wei, Y. and Ismail, S. (2011). Evaluating the forecasting performance of
econometric models of air passenger traffic flows using multiple error
measures. International Journal of Forecasting. 27: 902-922.
Firat, M. (2008). Comparison of artificial intelligence techniques for river flow
forecasting. Hydrology Earth System Science. 12(1): 123-139.
Firat, M. and Güngӧr, M. (2007). River flow estimation using adaptive neuro fuzzy
inference system. Mathematical Computational Simulation. 75(3-4): 87-96.
Francis, E. H. and Cao, T. L. (2001). Application of support vector machines in
financial time series forecasting. International journal of management
science. 29: 309-317
Froglich, H. and Zeil, A. (2005). Efficient parameter selection for support vector
machines in classification and regression via model based global
optimization. Proceedings of the 2005 IEEE international conference on
neural networks (IJCNN ’05). 3: 1431-1436
Gao, S., Zhang, Z. and Cao, C. (2010). Road traffic freight volume forecasting using
support vector machine. International conference on computer science and
computational technology (ISCSCT ’10). 329-332.
Ghobbar, A. A. and Friend, C. H. (2003). Evaluation of forecasting methods for
intermittent parts demand in the field of aviation: a predictive model.
Computers & Operations Research. 30: 2097-2114.
Graham, B. (1999). Airport-specific traffic forecasts: a critical perspective. Journal
of Transport Geography. 7: 285-289.

99
GRA, Incorporated (2001). Forecasting Aviation Activity by Airport. Federal
Aviation Administration Office of Aviation Policy and Plans Statistics and
Forecast Branch. (APO-110), 3-11, 13-15.
Grubb, H. and Mason, A. (2001). Long lead-time forecasting of UK air passenger by
Holt-Winters methods with damped trend. International Journal of
Forecasting. 17(1): 71-82.
Han, D., Chan, L. and Zhu, N. (2007). Flood forecasting using support vector
machines. Journal of hydroinformatics. 9(4): 267-276.
Hood, C. C. (2002). Comparison of Time Series Characteristics for Seasonal
Adjustments from SEATS and X-12-ARIMA. U.S. Census Bureau.
Hsu, C. I., Li, H. C., Liao, P.and Hansen, M. M. (2009). Responses of air cargo
carriers to industrial changes. Journal of Air Transport Management. 15:
330-336.
Huang, W., Nakamori, Y. and Wang, S. (2005). Forecasting stock market movement
direction with support vector machines. Computer and operation research,
32(10): 2513-2522.
Joachims, T. (2002). Learning to Classify Text Using Support Vector Machines:
Methods, Theory, and Algorithms. Book Reviews.
Kaheil, Y. H., Rosero, E., Gill, M. K., McKee, M. and Bastidas, L. A. (2008).
Downscaling and forecasting of evapotranspiration using a synthetic model of
wavelets and support vector machines. IEEE Trans. Geosci. Remote Sens.
46(9): 2692-2707.
Kandananond, K. (2012). A comparison of various forecasting methods for
autocorrelation time series. International Journal of Engineering Business
Management. 4(4): 1-6.

100
Karamouz, M., Ahmadi, A. and Moridi, A. (2009). Probabilistic Reservoir Operation
Using Bayesian Stochastic Model and Support Vector Machine. Advances in
Water Resources. 32: 1588-1600.
Keesman, K. J. and Stappers, R. (2007). Nonlinear set-membership estimation: a
support vector machine approach. Hydrology Science Journal. 12(1): 27-41.
Khalil, A., Almasri, M. N., Mckee, M. and Kaluarachchi, J. (2005). Applicability of
statistical learning algorithms in groundwater quality modelling. Water
Resources Research. 41(5).
Khashei, M. and Bijari, M. (2011). A novel hybridization of artificial neural
networks and ARIMA models for time series forecasting. Applied Soft
Computing. 11(2): 2664-2675.
Kim, K. (2003). Financial time series forecasting using support vector machines.
Neurocomputing. 55: 307-319.
Kisi, O. and Cimen, M. (2011). A wavelet-support vector machine conjunction
model for monthly streamflow forecasting. Journal of Hydrology. 399: 132-
140.
Kriechbaumer, T., Angus, A., Parsons, D. and Casado, M. R. (2013). An improved
wavelet-ARIMA approach for forecasting metal prices. Resource Policy. 39:
32-41.
Law, M. (2011). A Simple Introduction to Support Vector Machine. [PowerPoint
slides]. Retrieved from
http://www.cise.ufl.edu/class/cis4930sp11dtm/notes/intro_svm_new.pdf .
Lamorski, K., Pachepsky, Y., Slawiński, C. and Walczak, R. T. (2008). Using
Support Vector Machines to Develop Pedotransfer Functions for Water
Retention of Soils in Poland. Alliance of Crop, Soil, and Environmental
Science Societies. 72(5): 1243-1247

101
Lewis, C. D. (1985). Industrial and business forecasting method: A practical guide
to exponential smoothing and curve fitting. London; Boston: Butterworth
Scientific.
Lin, J. Y., Cheng, C. T. and Chau, K. W. (2006). Using support vector machines for
long-term discharge prediction. Hydrology Science Journal. 51(4): 599-612.
Lin, G. F., Chen, G. R., Huang, P. Y. and Chou, Y. C. (2009). Support vector
machine-based models for hourly reservoir inflow forecasting during
typhoon-warning periods. Journal of Hydrology. 372, 17-29.
Lin, G. F., Chou, Y. C. and Wu, M. C. (2013). Typhoon flood forecasting using
integrated two-stage Support Vector Machines approach. Journal of
Hydrology. 4486, 33-342.
Liong, S. Y., and Sivapragasam, C. (2002). Flood Stage Forecasting with Support
Vector Machines. JAWRA Journal of the American Water Resources
Association. 38(1): 173-186.
Liu, J. L., Li, J. P., Xu, W. X. and Shi. Y. (2011). A weighted 𝐿𝑞 adaptive least
squares support vector machine classifiers – Robust and sparse
approximation. Expert Systems with Applications. Vol. 38(3): 2253-2259.
Lu., R. Y. (2002). Decomposition of Interdecadal and Interannual Components for
North China Rainfall in Rainy Season. China Journal Atmosphere. 26: 611-
624.
L’Heureux, E. (1986). A new twist in forecasting short-term passenger pickup, 26th
AGIFORS Annual Symposium Proceedings. 248-261.
Mallat, S. G. (1989). A theory for multiresolution signal decomposition: the wavelet
representation. IEEE Transaction on Pattern Analysis and Machine
Intelligence. 11: 674-693.

102
McNamara, J. D., Scalea, F. L. and Fateh, M. (2005). Automatic defect classification
in long-range ultrasonic rail inspection using a support vector machine-based
“smart system”. Hydrology Science Journal. 46(6): 331-337.
Mezghani, A. B. D., Boujelbene, Z. S. and Ellouze, N. (2010). Evaluation of SVM
kernels and conventional machine learning algorithm for speaker
identification. International journal of hybrid information technology. 3(3):
23-34.
Miller, D. M. and Williams, D. (2003). “Shrinkage Estimators for Damping
X-12-ARIMA Seasonal” discussion paper, Virginia Commonwealth
University USA.
Müller, K. R., Smola, A., Rӓtsch, G., Schӧlkopf, B., Kohlmorgen, J. and Vapnik, V.
(1997). Predicting time series with support vector machines. Proceedings,
International Conference on Artificial Neural Networks. 999.
Nigel, P. S. and Dennis. (2002). Long-term route traffic forecasts and flight schedule
pattern for a medium-sized European airport. Journal of Air Transport
Managemenent. 8: 313-324.
Nourani, V., Alami, M. T. and Aminfar, M. H. (2009). A combined neural-wavelet
model for prediction of Ligvanchai watershed precipitation. Engineering
Applications of Artificial Intelligence. 22(3): 466-472.
Park, Y. and Ha, H. K. (2006). Analysis of the impact of high-speed railroad service
on air transport demand. Transportation Research Part E: Logistics and
Transportation Review. 42: 95-104.
Partal, T. and Cigizoglu, H. K. (2008). Estimation and forecasting of daily suspended
sediment data using wavelet-neural networks. Journal of Hydrology. 358
(3-4): 317-331.

103
Partal, T. and Kucuk, M. (2006). Long-Term Trend Analysis Using Discrete Wavelet
Components of Annual Precipitations Measurements in Marmara Region
(Turkey). Physics Chemical Earth, Part A Solid Earth Geod. 31: 1189-1200.
Phadke, A. C. and Rege, P. P. (2013). Classification of Architectural Distortion from
Other Abnormalities in Mammograms. International Journal of Application
or Innovation in Engineering & Management (IJAIEM). 2(2): 2319-4847.
Profillidis, V. A. (2000). Econometric and fuzzy models for the forecast of demand
in the airport of Rhodes. Journal of Air Transport Management. 6: 95-100.
Profillidis, V. A. (2012). An ex-post assessment of a passenger demand forecast of
an airport. Journal of Air Transport Management. 25: 47-49.
Rajaee, T. (2010). Wavelet and Neuro-fuzzy Conjunction Approach for Suspended
Sediment Prediction. CLEAN – Soil, Air, Water. 38(3): 275-286.
Reyes, M. H. (2006). Hybrid Forecasting for Airline Revenue Management in
Semi-Restricted Fare Structures. (Degree of Master Science in
Transportation).
Robert, R. A., Amir, F. A. and Hisham, El-S. (2010). Combination of long term and
short term forecasts, with application to tourism demand forecasting.
International Journal of Forecasting. 27: 870-886.
Samsudin, R., Saad, P. and Shabri, A. (2010). A hybrid least squares support vector
machines and GMDH approach for river flow forecasting. Hydrology Earth
System Science. 7: 3691-3731.
Scarpel, R. A. (2013). Air accessibility and growth – The economic effects of a
capacity expension a Vienna International Airport. Journal of Air Transport
Management. 16: 325-329

104
Sellner, R. and Nagi, P. (2010). Air accessibility and growth – The economic effects
of a capacity expansion at Vienna International Airport. Journal of Air
Transport Management. 16: 325-329.
Singh, K. K., Pal, M., Ojha, C. S. P. and Singh, V. P. (2008). Estimation of removal
efficiency for settling basins using neural networks and support vector
machines. Journal Hydrology Engineering. 13(3): 146-155.
Sivapragasam, C. and Muttil, N. (2005). Discharge rating curve extension: a new
Approach. Water Resource Management. 19(5): 505-520.
Smith, B. L. and Jordaan, M. I. (2002). Comparison of parametric and nonparametric
models for traffic flow forecasting. Transportation Research Part C:
Emerging Technologies. 10(4): 303-321.
Smith, L. C., Turcotte, D. L. and Isacks, B. (1998). Streamflow Characterization and
Feature Detection using Discrete Wavelet Transform. Hydrology Process. 12:
233-249.
Smith, B. C., Leimkhuler, J. F. and Darrow, R. M. (1992). Yield Management at
American Airlines. Interfaces. 22(1): 8-31.
Smola, A. J. and Schӧlkopf, B. (2004). Statistics and Computing. A tutorial on
support vector regression. 14(3): 199-222.
Stanikov, A., Hardin, D., Guyon, I. and Aliferis, C. F. (2009). A Gentle Introduction
to Support Vector Machines in Biomedicine. AMIA. 2-206.
Suykens, J. A. K., Gestel, T. V., Brabanter, J. D., Moor, B. D. and Vandewalle, J.
(2005). Least Square Support Vector Machine. New Jersey: World Scientific.
Taylor, W. J. (2004). Smooth Transition Experimental Smoothing. Journal of
Forecasting. 23: 385-394.
105
Turkoglu, I. and Avci, E. (2008). Comparison of wavelet-SVM and wavelet-adaptive
network based fuzzy inference system for texture classification. Digital
Signal Processing. 18(1): 15-24.
U.S. Census Bureau (2001). Transportation. Statistical Abstract of the United States.
Section 23, 659-662.
U.S. Census Bureau (2009). Transportation. Statistical Abstract of the United States.
Section 23, 651-654.
Vapnik, V. (1998). Statistical Learning Theory. Wiley-Interscience.
Vapnik, V. (1995). The Nature of Statistical Learning Theory. Springer Verlag, New
York, USA.
Vapnik, V., Golowich, S. E. and Smola, A. J. (1996). Support Vector Method for
Function Approximation, Regression Estimation and Signal Processing
Advances in Neural Information Processing Systems. 9: 281-287.
Veldhuis and Jan. (2005). Impacts of the Air France-KLM merger for airlines,
airports and air transport users. Journal of Air Transport Management. 11: 9-
18.
Vladimir, C. and Yunqian, M. (2004). Selection of SVM parameters and noise
estimation for SVM regression. ELSEVIER, Neural networks. 17: 113-126.
Vogt, M. (2008). Support vector machines for identification and classification
Problems in control engineering. Dissertation, VDI-Verlag, Düsseldorf,
Germany.
Wai, H. K. T., Balli, H. O., Gilbey, A. and Gow, H. (2013). Forecasting of
Hong Kong airport’s passenger throughput. Tourism Management. 42: 62-76.

106
Wang,W. and Ding, S. (2003). Wavelet Network Model and Its Application to the
Predication of Hydrology. Nature and Science. 1(1): 67-71.
Wang, W. S., Jin, J. L., and Li, Y. Q. (2009). Prediction of Inflow at Three Gorges
Dam in Yangtze River with Wavelet Network Model. Water Resource
Management. 23: 2791-2803.
Weatherford, L. (1999). Forecast aggregation and disaggregation. IATA Revenue
Management Conference Proceedings.
Wu, C. L., Chau, K. W. and Li, Y. S. (2008). River stage prediction based on a
distributed support vector regression. Journal of Hydrology. 358(1-2): 96-
111.
Xie, G., Wang, S., Zhao, Y. and Lai, K. K. (2013). Hybrid approaches based on
LSSVR model for container throughout forecasting. A comparative study.
Applied Soft Computing. 13(5): 2232-2241.
Xingang. D., Ping, W. and Jifan, C. (2003). Multiscale Characteristics of the Rainy
Season Rainfall and Interdecadal Decaying of Summer Monsoon in North
China. China Science Bulletin. 48: 2730-2734.
Yoon, S., Zhang, Q. and Welsh, W. J. (2004). Improved method for predicting β-turn
using support vector machine. Oxford Journals. 21(10): 2370-2374.
Zhang, G., Patuwo, E. B. and Hu, Y. M. (1998). Forecasting with artificial neural
network the state of the art. International Journal of Forecasting. 14: 35-62.
Zhou, H. C., Peng, Y. and Liang, G. H. (2008). The Research of Monthly Discharge
Predictor-corrector Model Based on Wavelet Decomposition. Water
Resource Management. 22: 217-227.


![[PPT]Assalammu’alaikum Wr.Wb - siroo fehling – Just another ... · Web view* * * * * * * * * * * * * Proses penguraian senyawa organik menjadi senyawa organik lain yang berlangsung](https://img.dokumen.tips/doc/110x75/5b3a792b7f8b9a895a8b80d6/pptassalammualaikum-wrwb-siroo-fehling-just-another-web-view.jpg)