Embed Size (px)
Citation preview

Forecasting Overview and Historicals Deliverable
September 14, 2002

Topics
1. Deliverable 6: Historical Financials Update and Historical Ratios
Online sources for historical 10-K and 10-Q filings
2. Forecasting Overview 3 categories of financial statements to forecast
Operating Investing Financing
Example model3. Forecasting Revenues

Topic 1: Deliverable 6: Historical Financials
1. Next week you will receive an Excel Workbook that includes a portion of the historical financial information.
2. The Excel Workbook is formatted in the Burkenroad Report Style and is not a model. You will create the forecast model during the course.
3. You will do ALL of your forecasting work in this workbook to insure that the links you create are not lost. Add as many worksheets as needed.

Topic 1: Deliverable 6: Historical Financials
4. Excel Workbook sheets related to Deliverable 6:
Statement worksheet: 5 sections on the statement worksheet
Income statement (annual & quarterly) Income statement common size information Balance sheet (annual & quarterly) Balance sheet common size information Cash flow statement (annual & quarterly)
Ratio worksheet (formulas are already linked to the statement information)
The other worksheets are not used for the historical financials deliverable

Topic 1: Historical Financials (Deliverable 6)
Online sources for historical financial statement information as filed by the company with the SEC 2 Turchin library databases Other online sources of SEC filings
FreeEdgar.com
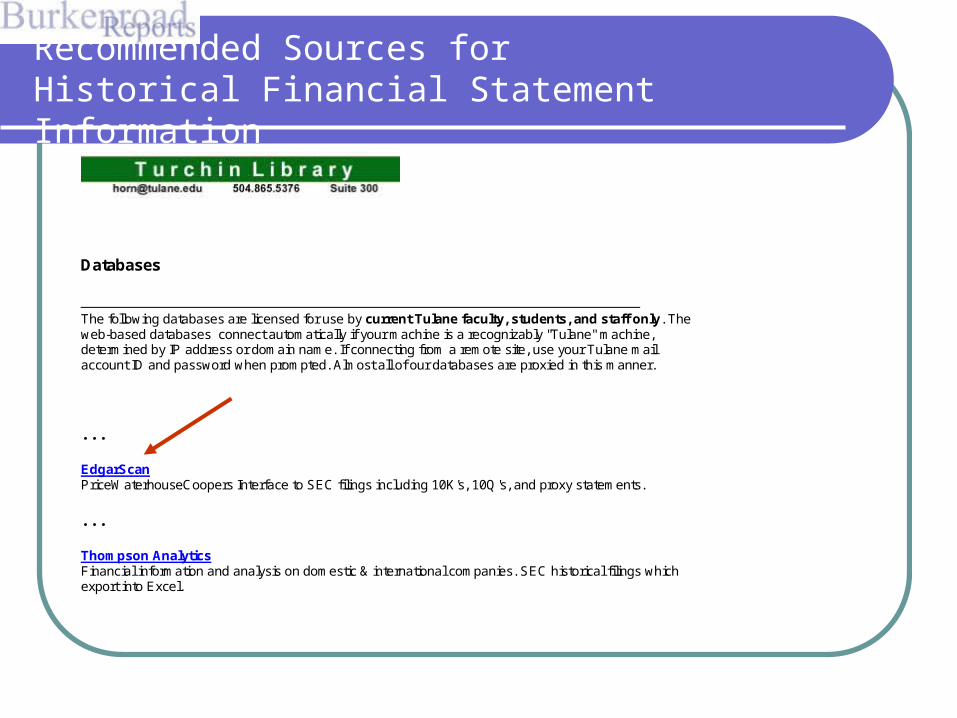
Databases
The following databases are licensed for use by current Tulane faculty, students, and staff only. The web-based databases connect automatically if your machine is a recognizably "Tulane" machine, determined by IP address or domain name. If connecting from a remote site, use your Tulane mail account ID and password when prompted. Almost all of our databases are proxied in this manner.
. . .
EdgarScan PriceWaterhouseCoopers Interface to SEC filings including 10K's, 10Q's, and proxy statements.
. . .
Thompson Analytics Financial information and analysis on domestic & international companies. SEC historical filings which export into Excel.
Recommended Sources for Historical Financial Statement Information

Recommended Sources for Historical Financial Statement Information
EdgarScanTM: An Intelligent Interface to the SEC EDGAR Database.
Ticker Symbol: safm
search
Standard Industrial Classifications
Initial Public Offerings
EdgarScan is an interface to the United States Securities and Exchange Commission Electronic Data Gathering, Analysis and Retrieval (SEC EDGAR) Filings. EdgarScan pulls filings from the SEC's servers and parses them automatically to find key financial tables and normalize financials to a common format that is comparable across companies. Using hyperlinks we can go directly to specific sections of the filing, including the financial statements, footnotes, extracted financial data and computed ratios. A small (35 kilobytes) Java applet called the "Benchmarking Assistant" performs graphical financial benchmarking interactively. Tables showing company comparisons can be downloaded as Excel charts and registered users can store company portfolios for future benchmarking.

Recommended Sources for Historical Financial Statement Information
EdgarScanTM
SANDERSON FARMS INC (business) (SAFM) (Poultry Slaughtering and Processing)
Extracted Financial Data:
hypertextual table slightly less hypertextual table -- recommended for slower connections Benchmarking Assistant Excel Spreadsheet
Recent Filings (by Filing Date):
10-Q/A 2002-09-10 8-K 2002-01-08
Quarterly Filings (10-Q's by Filing Period):
Q3 2002-07-31 Q2 2002-04-30 Q1 2002-01-31 Q3 2001-07-31 Q2 2001-04-30 Q1 2001-01-31 Q3 2000-07-31 Q2 2000-04-30 Q1 2000-01-31 Q3 1999-07-31 Q2 1999-04-30 Q1 1999-01-31 Q3 1998-07-31 Q2 1998-04-30 Q1 1998-01-31 Q3 1997-07-31 Q2 1997-04-30 Q1 1997-01-31 Q3 1996-07-31 Q2 1996-04-30 Q1 1996-01-31 Q3 1995-07-31 Q2 1995-04-30 Q1 1995-01-31 Q3 1994-07-31
Annual Filings (10-K's by Filing Period):
10-K 2001-10-31 10-K 2000-10-31 10-K 1999-10-31 10-K 1998-10-31 10-K 1997-10-31 10-K 1996-10-31 10-K 1995-10-31 10-K 1994-10-31
SOURCES FOR HISTORICALInformation – deliverable 6
Recommended Sources for Historical Financial Statement Information

EdgarScanTM
SANDERSON FARMS INC 10-K for period ending 2001-10-31
Extracted Financial Data
Table of Contents
Item 1. Business Item 2. Properties. Item 3. Legal Proceedings. Item 4A. Executive Officers of the Registrant. Item 5. Market for the Registrant's Common Item 6. Selected Financial Data. Item 7A. Quantitative and Qualitative Disclosure About Market Risk. Item 8. Financial Statements and Supplementary Data.
Balance Sheet -- Excel Spreadsheet Income Statement -- Excel Spreadsheet Cash Flow -- Excel Spreadsheet
Footnotes Tax Table -- Excel Spreadsheet
Item 9. Changes in and Disagreements With Accountants Item 10. Directors and Executive Item 11. Executive Compensation. Item 12. Security Ownership of Certain Item 13. Certain Relationships Item 14. Exhibits, Financial Statement
Recommended Sources for Historical Financial Statement Information
DOWNLOAD IN EXCEL FORMAT
Recommended Sources for Historical Financial Statement Information

Databases
The following databases are licensed for use by current Tulane faculty, students, and staff only. The web-based databases connect automatically if your machine is a recognizably "Tulane" machine, determined by IP address or domain name. If connecting from a remote site, use your Tulane mail account ID and password when prompted. Almost all of our databases are proxied in this manner.
. . .
EdgarScan PriceWaterhouseCoopers Interface to SEC filings including 10K's, 10Q's, and proxy statements.
. . .
Thompson Analytics Financial information and analysis on domestic & international companies. SEC historical filings which export into Excel.
Recommended Sources for Historical Financial Statement Information

The database that you are requesting access to is licensed for use by current Tulane students, faculty, and staff. Please enter your Tulane mail account name and password (RS/6000 account) to access this database.
Please enter your username: pshaw
Please enter your password: Submit Query
Recommended Sources for Historical Financial Statement Information

Recommended Sources for Historical Financial Statement Information
To View Company Information
Enter a Ticker, CUSIP, SEDOL,ISIN, Valor, or Permanent Identifier in the Company Name/Symbol/Key box on the left.
Step 1.
Note: To search for a Company by Name, click on the "Entity Lookup" link.
Step 2. Click on a desired tab, then select the options from the pull-down menus
Name/Symbol/Key safm
Entity Lookup

Recommended Sources for Historical Financial Statement InformationRecommended Sources for Historical Financial Statement Information
Company Overview Sanderson Farms Symbol: SAFM (C000004017) 225 N 13th Ave Exchange: NASNM CUSIP: 800013104 Laurel, MS 39440-4109 USA Sector: Consumer, Non-Cyclical SEDOL: 2774336 http://www.sandersonfarms.com Industry: Food Retailers & Wholesalers Company Status: Active
Business Description View Profile Source: Compustat
Key Financials View Financials Y2001 Y2000 Y1999 Sales 706.00 605.91 559.03 Operating Income
51.09 -0.59 23.01
Net Income 27.78 -5.57 10.55 Total Assets 288.97 281.86 283.51 Total Liabilities 144.63 161.84 152.67 EBITDA 77.25 26.13 48.07 Market Cap 230.13
Source: Compustat - Millions USD Key Ratios View Ratios P/E Ratio* 8.51 Dividend Yld 2.29
Price to Book 1.47 1Yr Tot Return
29.44
Price To CF 3.60 Beta** 0.86 1Yr Sales Growth
16.52 1Yr EPS Growth
n/a
Source: Worldscope,*IBES,**Worldscope
Price Chart Interactive Chart
Analyst Rating
Source: I/B/E/S
Estimate Revisions
Source: I/B/E/S
EPS Estimate Forecasts View Forecasts
Source: I/B/E/S
Quote: SAFM Last 18.100 Change 0.390 % Change 2.200% Open 17.500 High 18.100 Low 17.500 Close 17.710 Volume 22,700 52 Wk High 28.450 52 Wk Low 10.690 Currency
as of 3:59:00 PM EST
Source: ILX Systems Inc.
at least 15 minutes delayed.
Related Conte nt
Company Overview Company Profile Company Report Price Char t Detailed Quote Financials (Standardized) Ann. Financials (As F iled) Qtr. Financials (As Filed) Annual Ratios Earnings Peer Report Filings Summary Company News View Sources View Relationships
CLICK ON FILINGS TAB AT TOP

Recommended Sources for Historical Financial Statement Information
SANDERSON FARMS INC
See complete filing on Thomson Research... Company Filings
10-K 10/31/01
10-Q 07/31/02
US Annual Report 10/31/01
US 10K Curr Financials 10/31/01
US 10Q Curr Financials 07/31/02
Consensus Earnings 09/13/02
US Detailed Earnings 09/06/02
Proxy Executive Comp 01/28/02
SEC Company Full Rpt 08/28/02
US 10Q Hist Financials 08/29/02
US 10K Hist Financials 08/29/02
SEC Financial Tearsheet 09/04/02
SEC Company Tearsheet 09/06/02
Recommended Sources for Historical Financial Statement Information
Download Full Texts of Reports in Adobe Format – useful for key word searches
Download Financials in Excel Format
Advantage of this Database as compared to Edgarscan: Balance Sheet, Income Stmt & Cash Flow Stmt all download into the same workbook.

Topic 2: Forecasting Overview
We prepare the forecasts in 3 stages:
Operating items on the income statement, balance sheet and cash flow statement
Investing items on the income statement, balance sheet and cash flow statement
Financing items on the income statement balance sheet and cash flow statement

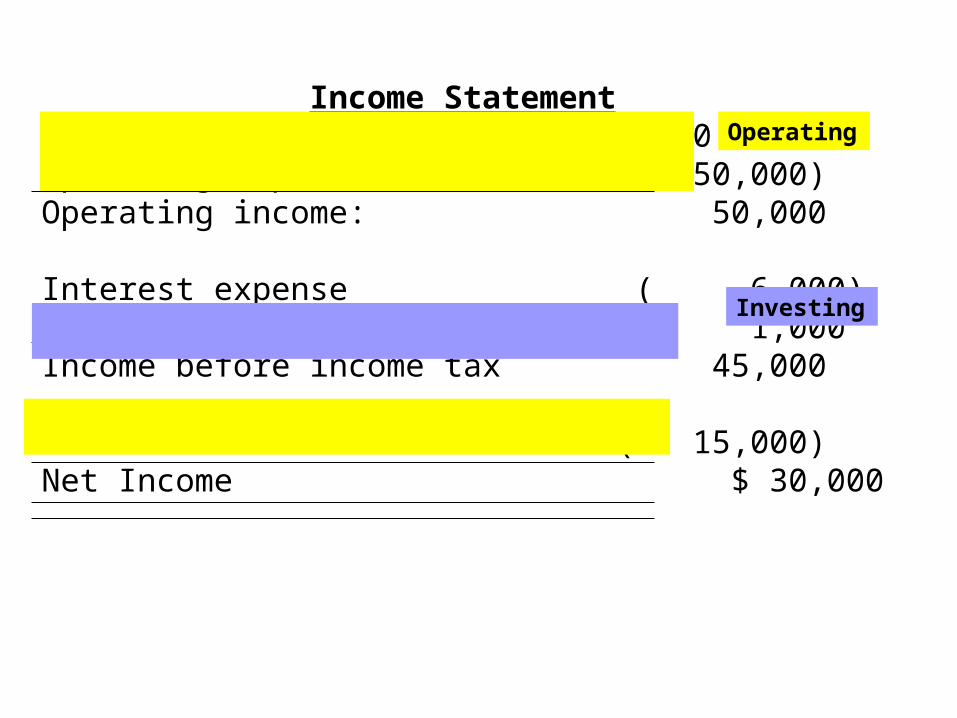
Income StatementRevenues: $ 200,000Operating expenses ( 150,000)Operating income: 50,000 Interest expense ( 6,000)Investment income 1,000Income before income tax 45,000
less: Income Tax ( 15,000)Net Income $ 30,000
Operating

Cash Flow Example Balance Sheet
Assets:Cash $ 25,000Accounts Receivable 32,000Inventory 29,000Investments 10,000Fixed assets, net 180,000Total $276,000Liabilities and Equity:Accounts Payable $ 24,000Long-term debt 80,000Common Stock 147,000Retained Earnings 25,000Total $276,000
Operating
Forecast all operating items simultaneously because operating items on each statement will be closely related to operating items forecast on the income statement. –
Example: Accounts receivable is usually a consistent % of sales revenue.

Operating cash flows:Net income $30,000Depreciation expense 10,000Change in A/R (2,000)Change in Inv (3,000)Change in A/P 5,000Total cash used by operating activities $ 40,000
Cash used by investing activities:Purchase of fixed assets ($10,000)
Cash from financing activities: Borrowing, net of repayments (35,000)Payment of dividends (5,000)Total cash provided by financing activities (40,000)
Net inflow for the year (10,000) Beginning cash balance: 35,000 Ending cash balance $ 25,000
Cash Flow Statement
Operating
Income StatementRevenues: $ 200,000Operating expenses ( 150,000)Operating income: 50,000 Interest expense ( 6,000)Investment income 1,000Income before income tax 45,000
less: Income Tax ( 15,000)Net Income $ 30,000
Operating
Investing

Cash Flow Example Balance Sheet
Assets:Cash $ 25,000Accounts Receivable 32,000Inventory 29,000Investments 10,000Fixed assets, net 180,000Total $276,000Liabilities and Equity:Accounts Payable $ 24,000Long-term debt 80,000Common Stock 147,000Retained Earnings 25,000Total $276,000
Operating
Investing

Operating cash flows:Net income $30,000Depreciation expense 10,000Change in A/R (2,000)Change in Inv (3,000)Change in A/P 5,000Total cash used by operating activities $ 40,000
Cash used by investing activities:Purchase of fixed assets ($10,000)Purchase of investments (1,000)Total cash used in investing activities (11,000)
Cash from financing activities: Borrowing, net of repayments (34,000)Payment of dividends (5,000)Total cash provided by financing activities (39,000)
Net inflow for the year (10,000) Beginning cash balance: 35,000 Ending cash balance $ 25,000
Cash Flow Statement
Operating
Investing
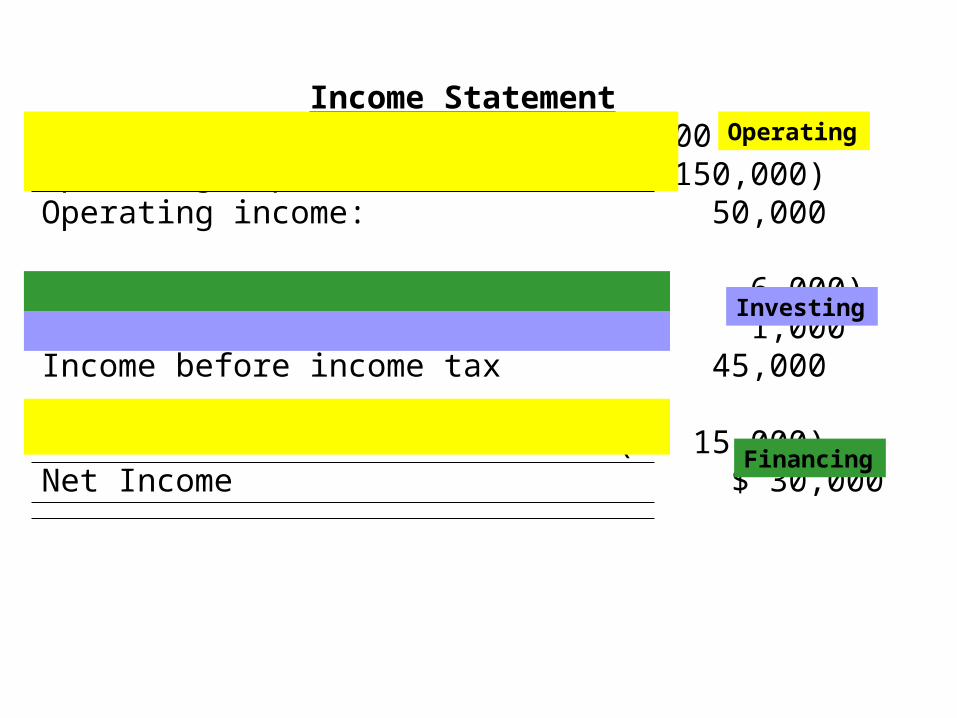
Income StatementRevenues: $ 200,000Operating expenses ( 150,000)Operating income: 50,000 Interest expense ( 6,000)Investment income 1,000Income before income tax 45,000
less: Income Tax ( 15,000)Net Income $ 30,000
Operating
Investing
Financing

Cash Flow Example Balance Sheet
Assets:Cash $ 25,000Accounts Receivable 32,000Inventory 29,000Investments 10,000Fixed assets, net 180,000Total $276,000Liabilities and Equity:Accounts Payable $ 24,000Long-term debt 80,000Common Stock 147,000Retained Earnings 25,000Total $276,000
Operating
Investing
Financing

Operating cash flows:Net income $30,000Depreciation expense 10,000Change in A/R (2,000)Change in Inv (3,000)Change in A/P 5,000Total cash used by operating activities $ 40,000
Cash used by investing activities:Purchase of fixed assets ($10,000)Purchase of investments (1,000)Total cash used in investing activities (11,000)
Cash from financing activities: Borrowing, net of repayments (34,000)Payment of dividends (5,000)Total cash provided by financing activities (39,000)
Net inflow for the year (10,000) Beginning cash balance: 35,000 Ending cash balance $ 25,000
Cash Flow Statement
Operating
Investing
Financing

Topic 2: Forecasting Overview
Example Company
Along with your Excel Workbook for your BURKENROAD company, I will send you an EXAMPLE Company that includes sample formulas for creating forecasted statements.

Topic 3: Forecasting Revenues
Revenues are the most important item you will forecast as this number is the primary determinate of your target price and your investment recommendation.
Build a model for each revenue segment. The footnotes to your financial statements will include a
segment footnote that describes revenues, costs, fixed assets, depreciation and capital expenditures for each segment.
4 Primary Revenue model types Data availability may drive the type of model you use since
you are limited to publicly available data Use multiple models if possible and compare the results.

Topic 3: Forecasting Revenues
4 Primary Revenue model types:
1.Revenue = Price per unit X Quantity Units are not always product units. For example, for a labor-intensive service
company, the model may beRevenue = Avg. sales per employee
X Avg. number of employees for the period
For Piccadilly Cafeterias, the model may beRevenue = Avg. sales per store X Avg. number of stores

Topic 3: Forecasting Revenues
2. Revenue = Total revenues forecast for the market X forecast market share for the company
Define the market and collect sales information for the companies in this market on an historical basis – can be difficult if there are a number of private companies that comprise your market, e.g., many of SCP Pool’s competitors are private companies.
Calculate the historical market share for your company
Forecast total market revenues during the forecast period and forecast your company’s market share

Topic 3: Forecasting Revenues
3. Revenues = Prior period revenues X forecast growth rate
What growth rate is appropriate? Is there an indicator that is generally known and
forecasted (e.g., GNP) and highly correlated with the segment revenues?
Is it appropriate to “grow” sales by 10% per year based on prior growth patterns? This is a weak method and should be used only as a method of last resort.
Topic 3: Forecasting Revenues
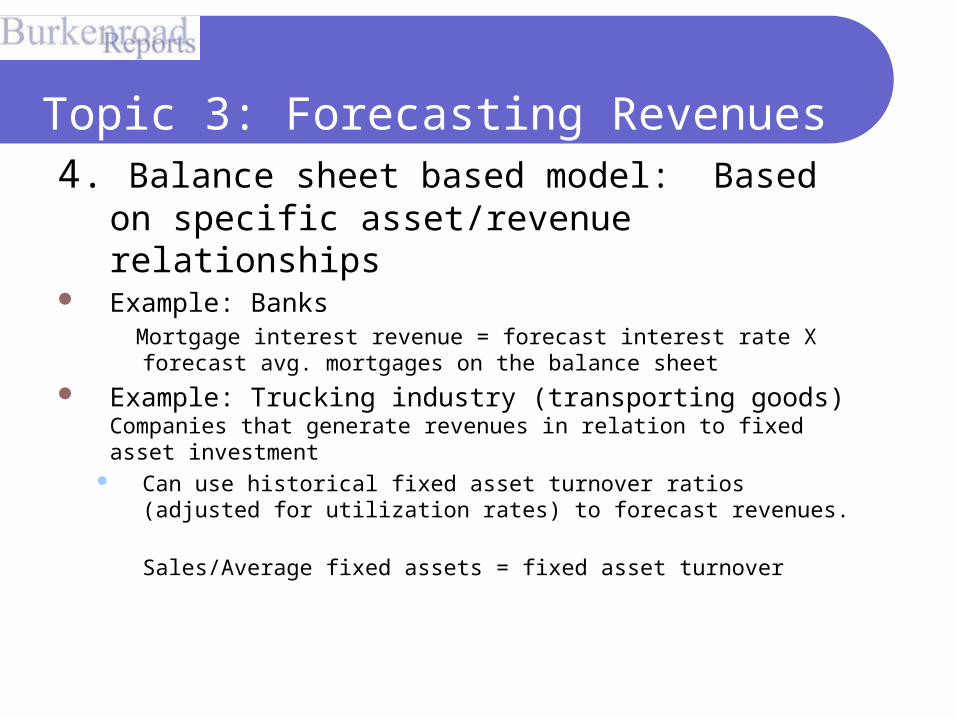
4. Balance sheet based model: Based on specific asset/revenue relationships
Example: Banks Mortgage interest revenue = forecast interest rate X forecast
avg. mortgages on the balance sheet
Example: Trucking industry (transporting goods)Companies that generate revenues in relation to fixed asset investment
Can use historical fixed asset turnover ratios (adjusted for utilization rates) to forecast revenues.
Sales/Average fixed assets = fixed asset turnover
Topic 3: Forecasting Revenues

Topic 3: Forecasting Revenues
Case Example – Chis Kent
Oil Service Industry Revenue Forecasts