Embed Size (px)
Citation preview

Forecasting in government to achieve value for money
Cross-government
Reportby the Comptroller and Auditor General
HC 969 SESSION 2013-14 31 JANUARY 2014

The National Audit Office scrutinises public spending for Parliament and is independent of government. The Comptroller and Auditor General (C&AG), Amyas Morse, is an Officer of the House of Commons and leads the NAO, which employs some 860 staff. The C&AG certifies the accounts of all government departments and many other public sector bodies. He has statutory authority to examine and report to Parliament on whether departments and the bodies they fund have used their resources efficiently, effectively, and with economy. Our studies evaluate the value for money of public spending, nationally and locally. Our recommendations and reports on good practice help government improve public services, and our work led to audited savings of almost £1.2 billion in 2012.
Our vision is to help the nation spend wisely.
Our public audit perspective helps Parliament hold government to account and improve public services.

Report by the Comptroller and Auditor General
Ordered by the House of Commons to be printed on 30 January 2014
This report has been prepared under Section 6 of the National Audit Act 1983 for presentation to the House of Commons in accordance with Section 9 of the Act
Amyas Morse Comptroller and Auditor General National Audit Office
27 January 2014
Cross-government
HC 969 London: The Stationery Office £16.00
Forecasting in government to achieve value for money

This report examines the production and use of forecasts to inform government departments’ decisions on resource and capital spending in light of HM Treasury’s aims, and against good forecasting practice.
© National Audit Office 2014
The text of this document may be reproduced free of charge in any format or medium providing that it is reproduced accurately and not in a misleading context.
The material must be acknowledged as National Audit Office copyright and the document title specified. Where third party material has been identified, permission from the respective copyright holder must be sought.
Links to external websites were valid at the time of publication of this report. The National Audit Office is not responsible for the future validity of the links.
Printed in the UK for The Stationery Office Limited on behalf of the Controller of Her Majesty’s Stationery Office
2618829 01/14 PRCS

The National Audit Office study team consisted of: Andrew Tuffin, Tom McBride, Adrian Leigh and Erin Mansell, under the direction of Michael Kell.
This report can be found on the National Audit Office website at www.nao.org.uk/2014-forecasting
For further information about the National Audit Office please contact:
National Audit Office Press Office 157–197 Buckingham Palace Road Victoria London SW1W 9SP
Tel: 020 7798 7400
Enquiries: www.nao.org.uk/contact-us
Website: www.nao.org.uk
Twitter: @NAOorguk
Contents
Key facts 4
Summary 5
Part OneThe importance of forecasting 11
Part TwoProducing forecasts 21
Part ThreeHow forecasts are used 27
Part FourDepartmental environment 37
Part FiveThe centre of government 41
Appendix OneOur audit approach 50
Appendix TwoOur evidence base 52
Appendix ThreeFigure 4 source references 58
Appendix FourIllustrative examples of forecasting 59
Endnotes 64

4 Key facts Forecasting in government to achieve value for money
Key facts
forecast departmental expenditure limit (DEL) spend for 2015-16, allocated in Spending Round 2013
forecast central government underspend against DEL for 2012-13 – at 3.2 per cent of total DEL this was nearly three times the recent average
of our reports since January 2010 have identified concerns about forecasts
39 per cent of analysts we surveyed thought senior managers used forecasts effectively
450 per cent approximate increase in total DEL carried forward by HM Treasury under budget exchange in 2012-13 compared with the previous financial year
£74 million estimated cost to the Ministry of Defence to avoid approximately £623 million of further spend once it became clear its carrier strike forecast costs were based on immature information and assumptions
21 per cent of analysts we surveyed thought that their department was sharing good forecasting practice
32,000 approximate overstatement of the estimated number of new homes the New Homes Bonus policy would deliver in its first ten years, as a result of an arithmetical error
£360bn £11.5bn 71

Forecasting in government to achieve value for money Summary 5
Summary
1 Effective financial management is vital for sound decision-making, accountability, planning and managing risks. Our recent report on financial management in government identified the strategic challenges facing finance professionals, including cost reduction, strategic planning, prioritisation and the funding of local public services.
2 Forecasting is an essential component of good financial management and informed decision-making, and taxpayers bear the costs where poor forecasting means projects or services cost more than anticipated, are delivered late or produce fewer benefits than predicted. Effective forecasting requires organisations to recognise that forecasts are more than a technical activity, and emphasise their importance to financial and operational management. It is essential that departments generate cooperation and understanding between the analysts who produce forecasts, and their policy, operational and finance colleagues who use them to manage the business.
3 High-profile errors, such as the one found in the model used to evaluate bids in the InterCity West Coast franchise competition in 2012, which led to unforeseen costs to taxpayers of £54 million, have prompted greater focus on the quality and accuracy of analysis which underpins business critical decisions. In response, HM Treasury commissioned the Macpherson review of the quality assurance of modelling. This recommended that departments put in place the right processes and culture to support quality assurance.
4 Poor forecasts of aggregated expenditure can lead to late identification of under or overspending and rapid, poor value-for-money responses. HM Treasury has announced that departments demonstrating excellent financial management – including accurate aggregate spending forecasts – would be rewarded with greater budgetary freedoms. In addition, it made changes to the budgetary system to encourage earlier and more transparent forecasting of future underspends. HM Treasury has also published a review of financial management capability.
5 We often identify problems with project-level forecasting, but these latest developments mean this is a good time to consider government forecasting holistically.

6 Summary Forecasting in government to achieve value for money
Scope and approach
6 We examine how departments produce and use forecasts. While we mainly focus on forecasting that informs expenditure, our findings are relevant to forecasting more generally – for example forecasting the benefits from new investment.
7 We consider resource and capital spending in the area of spending known as departmental expenditure limits (DEL). We do not address in this report demand-driven areas of spending, such as benefits (known as annually managed expenditure, or AME). AME also requires high-quality forecasts, which are scrutinised by the Office for Budget Responsibility.
8 Drawing on our evaluative framework, we consider:
• the importance of forecasting in government (Part One)
• departmental forecasting, covering:
• production (Part Two);
• use (Part Three);
• the departmental environment (Part Four); and
• HM Treasury’s role and the impact of its budgetary system on forecasting (Part Five).
Key findings
9 Poor forecasting is an entrenched problem, leading to poor value for money and taxpayers bearing the costs. Since 2010, over 70 of our reports have identified forecasting weaknesses (paragraph 1.13).
a At project and programme level:
• The Ministry of Defence’s decision to procure the carrier variant of the Joint Strike Fighter had to be reversed, at a cost of £74 million, after it became clear the forecast costs were based on immature information and assumptions.a Its decision avoided further spending of £623 million. In many of our reports we have identified weaknesses in the quality of information available or used in government, and analysts considered this a key concern (paragraphs 2.11 to 2.13). For High Speed 1, the Department for Transport did not challenge optimistic forecast passenger numbers, exposing taxpayers to an ongoing liability. We estimated that net taxpayer support could reach £10 billion (paragraph 3.8).
a Comptroller and Auditor General, Carrier Strike: The 2012 reversion decision, Session 2013-14, HC 63, National Audit Office, May 2013. The figure of £74 million was the Departmental estimate at the time and may be subject to revision because it is dependent on contractual costs that require up to two years to finalise following termination.

Forecasting in government to achieve value for money Summary 7
• More generally, forecasts often lack ranges and sensitivity analysis. Without this information, decision-makers cannot manage risks effectively. Our analysis of impact assessments found that fewer than half included sensitivity analysis (paragraphs 2.15 to 2.16).
b At the aggregate level:
• In our 2011 report on financial management in the Department for International Development we noted how it managed outturn by delaying or bringing forward payments rather than through effective forecasting (paragraph 1.10).
• Finance directors identified that poor forecasts meant opportunities to spend on worthwhile projects were missed (paragraph 1.11).
10 We have identified several root causes for departments’ poor production and use of forecasts:
• Decision-makers need greater understanding of forecasts to provide effective challenge and manage risks. Only 39 per cent of analysts thought that senior managers used forecasts effectively (paragraphs 3.6 to 3.9).
• When decision-makers need to introduce new interventions quickly they sometimes fail to recognise and manage the risks this creates for the quality of forecasts. For example, the Department for Communities and Local Government failed to make effective use of available information or sufficiently test its assumptions before introducing its mortgage rescue scheme. It misjudged demand and underestimated costs for the scheme and had to increase its budget by £80 million soon after introducing it (paragraphs 4.5 to 4.7).
• ‘Optimism bias’ is a significant problem, with analysts concerned about the pressure to provide supportive rather than realistic forecasts. In 2012, the Committee of Public Accounts noted that only a third of government major projects were delivered on time and on budget. The Major Projects Authority now expects that two-thirds of current projects will be delivered to time and on budget (paragraphs 4.8 to 4.10).

8 Summary Forecasting in government to achieve value for money
• Good decision-making requires a culture that promotes and explains the importance of forecasting, but we found that:
• There is often a weak relationship between analysts and finance staff, increasing the risk of poorly informed budgetary decisions. Senior analysts identified the finance function as a ‘black box’. A disconnect between analysts’ forecasts and finance’s budgeting creates a risk of failure in how uncertainty is addressed (paragraphs 3.15 to 3.16).
• Departments do not always make best use of forecasting. We found examples where departments could have tested potential performance improvements and identified savings by better use of analysis. For instance, in 2009 we estimated that HM Revenue & Customs could have identified potential annual savings of between £30 million and £50 million through better use of modelling to manage its staffing and demand (paragraphs 3.3 to 3.4). The department has subsequently introduced planning and modelling tools, which it refreshes to inform resource deployment.
• We identified few examples of clear sanctions or rewards for the quality of forecasting. One exception is the Department for Business, Innovation & Skills, which uses awards and league tables to encourage more accurate year-end forecasts (paragraphs 3.23 to 3.24).
11 The centre of government also needs to do more. First and foremost, while HM Treasury has taken steps to incentivise better forecasting, these are at risk of being overwhelmed by other incentives in the spending control framework:
• Departments can and do meet year-end targets through rapid and late shifts of funding. This masks bad forecasting, and the effort involved can crowd out departments’ ability to focus on improving forecasting (paragraphs 5.13 to 5.20).
• Until 2010, under the End Year Flexibility system departments could draw down an amount from their stock of previous underspends in-year with HM Treasury’s permission. This system enabled departments to accumulate a stock of £19 billion of underspending. HM Treasury erased this sum when it introduced ‘budget exchange’ in 2011, which restricted the carrying forward of underspend to one year and to a strict limit. It also sought to encourage better forecasting by requiring departments to identify underspends early to claim budget exchange and by linking access to good financial management. However, in 2012-13, HM Treasury let departments carry forward more than its rules allowed, with no clear relationship to the quality of their financial management (paragraphs 5.22 to 5.27).

Forecasting in government to achieve value for money Summary 9
12 Second, there is insufficient information to assess the quality of departments’ forecasting. Spending teams lack a consistent approach to assess and compare the quality of programme forecasting. The information departments publish on how and why their spending varied from what they expected is insufficient to support Parliamentary scrutiny (paragraphs 5.21 to 5.33).
13 Third, while we are encouraged that HM Treasury has acted to improve the quality assurance of modelling through the Macpherson review, its scope is limited. Macpherson’s recommendations focus on promoting a culture of effective quality assurance for business-critical models, rather than systemic factors preventing good forecasting. HM Treasury needs to ensure departments’ responses to the review deliver real change (paragraphs 5.5 to 5.10).
14 Finally, the centre of government needs to collaborate more than it has to date to encourage good forecasting. Both the Cabinet Office and the Finance Leadership Group (FLG) also have important roles to play in terms of building capability. They and HM Treasury will have to work together and coordinate activity in order to deliver an improvement in how forecasting is used in government (paragraphs 5.34 to 5.35).
Conclusion on value for money
15 High-quality expenditure forecasting is an essential element in achieving value for money for the taxpayer. Despite examples of good practice, our past work has identified many high-profile failures. Forecasting is not taken sufficiently seriously and is often hampered by poor quality data and unrealistic assumptions driven by policy agendas. Departments could improve the value for money they achieve by improving how they produce and use forecasts to manage individual projects and control aggregate spending. HM Treasury’s efforts to improve forecasting through incentives in the budgetary system are unlikely to prove effective given the pressure in the spending control framework to avoid overspending and deliver small underspends. Improvements to transparency and scrutiny are needed to enable HM Treasury and Parliament to assess more effectively the quality of departments’ financial management and the value delivered.

10 Summary Forecasting in government to achieve value for money
Recommendations
16 In implementing the Macpherson review recommendations, departments should:
• lead cultural change from the top, with departmental boards embedding a management culture that supports prioritised production and active use of forecasts – including communicating uncertainty and applying proportionate risk management;
• break down barriers between analytical, policy and finance functions – for example through training, secondments and greater transparency in the way in which finance decisions are informed by forecasts;
• deploy capacity adequately to reflect the importance of forecasting, as a recognised discipline, to financial and operational management;
• ensure clear ownership and accountability for forecast production and use, including the application of assumptions and scenarios;
• incentivise accurate and integrated forecast production and use through performance management arrangements; and
• understand the reasons for variance in order to improve forecast quality.
17 By the end of this Parliament, HM Treasury should:
a work with the Cabinet Office and the Finance Leadership Group to:
• develop and promote guidance to senior managers and boards on how to challenge and use forecasts when making decisions and managing risks; and
• ensure the Major Projects Leadership Academy curriculum drives good forecasting practice;
b work with departments and the relevant professional networks to support:
• the development and active promotion of advice on forecasting – for example through the planned ‘Rainbow Book’ and associated training for senior managers, as well as the refresh of The Green Book; and
• the establishment of cross-government, cross-profession thematic expert groups to provide peer review and an active professional network sharing forecasting activities, data, assumptions and best practice;
c strengthen how forecasts are challenged, by:
• working with the NAO and Parliament to identify how to support informed scrutiny of departments’ forecasts – for example in its review of the presentation of departments’ reports and accounts and the introduction of mid-year reports; and
• strengthening spending teams’ ability to interrogate departments’ forecasts, at programme and project levels, for example through training and enhancements to data collection.

Forecasting in government to achieve value for money Part One 11
Part One
The importance of forecasting
1.1 In this part, we set out the importance of forecasting, the impacts of poor forecasting and good practice.
Why forecasting matters
1.2 In Spending Round 2013, the government allocated £360 billion for 2015-16. Robust forecasts of future demand and costs are an essential element of the financial management needed to plan and prioritise services effectively. The need for accurate forecasting has increased with the difficult economic climate and cuts to departmental spending.
1.3 This report is one of a suite of studies addressing aspects of informed decision-making, including reports on financial management and evaluation.1
1.4 Forecasts are predictions of future requirements under differing scenarios, based on data and assumptions about influencing factors. They help staff at all levels of an organisation understand what is expected to occur and the range of uncertainty to inform planning and risk management. Forecasts can reflect simple trend extrapolations, but ideally involve computer-based modelling and more complex quantitative analysis (see Figure 1 overleaf).
1.5 Forecasts inform a range of decisions (see Figure 2 on page 13). At project and programme level, departments use forecasts to consider new investment as well as whether existing initiatives need to be changed, terminated or resourced from elsewhere. Such forecasts include projected:
• costs, such as the capital expense of building and maintaining a large infrastructure project;
• demand for services;
• staff resources to deliver a service; and
• revenue receipts.
1.6 At the aggregate level, departments need to manage total spending to meet annual budgets. Responsibility for this rests with departments’ finance directors, who:

12 Part One Forecasting in government to achieve value for money
• participate in project and programme decisions; and
• advise boards throughout the year on progress against forecast – including cashflow, the risks of overspending and the scope to reallocate underspends.
1.7 Departments’ medium-term budget allocations are informed by project and programme level spending forecasts for spending reviews, alongside their strategic assessments.
Figure 1Forecasting inputs and outputs
Judgement
Forecast may be based directly on the output or adjusted to take account of other factors
Other factors
Source: National Audit Offi ce
Model
A computer package which runs calculations on the inputs
Quantitative and qualitative analysis
ForecastsOutput Decision Outcome
Actual outcome is compared with forecast to improve future iterations
Data
Assumptions

Forecasting in government to achieve value for money Part One 13
Figure 2Producing and using spending forecasts in departments
Forecast production
Finance directorates work with policy teams and budget holders to aggregate high-level spending forecasts – including control totals
Source: National Audit Offi ce
Policy teams and budget holders, with analytical support, combine forecasts of spending from projects and programmes
• Budget and spending review submissions and negotiations with HM Treasury
•Budgetary allocation across the department
•Monitoring against departmental budgets
• Cashflow monitoring
• Allocating spending on business as usual and change portfolios
• Monitoring outturns against budgets and portfolio management
(e.g. reallocation)
• Investment decisions
•Operational management, including monitoring
project spendingagainst forecast
Analysts work with policy and operational functions to forecast spending for specific new and existing initiatives
Purpose or use of forecast
DEL controltotals
Portfoliosand
programmes
ProjectsSp
end
ing
fore
cast
sB
udg
et allocatio
n
Impacts of poor forecasts
1.8 Poor forecasting can cause avoidable differences between expectations and outcomes:
• Private sector organisations have concerns about poor forecasting, which can lead to lost market share, lower profits or even bankruptcy. A 2009 survey identified that 85 per cent of managers recognised the importance of forecasts, but only 52 per cent considered them to be high quality.2
• In the public sector, poor forecasting can mean ill-informed decisions, and taxpayers bearing the costs and poor delivery of services. It may mean that projects cost more, are completed later, or produce fewer benefits than predicted. Underspends can mean that opportunities to spend on worthwhile projects are missed. Poor forecasting on one project can affect other projects in departments’ spending portfolios, as budgets are varied to accommodate unexpected changes (see Figure 3 overleaf).

14 Part One Forecasting in government to achieve value for money
Figure 3Potential impacts of poor spending forecasts
At project/programme level At departmental-wide/aggregate level
Spend is overestimated… leading to an underspend
Underspends may represent good management and an opportunity to reinvest unused funds.
However, where underspending results from poor forecasting, for example because demand for a service is overestimated, there may be opportunity costs in terms of how this resource could have been better used. In the current economic climate, underspending on infrastructure as a result of poor forecasts could have macro-economic implications for growth.
Within strict limits, departments can carry a proportion of underspend forward to the next financial year, but this restricts their future ability to do so.
To avoid returning funds to HM Treasury at year end, departments may make rapid decisions to reallocate unused funds. Hasty decisions may represent poor value for money. They may also undermine optimal allocation of funds between departments.
Consistent overestimates of spending may also lead to a culture of acceptance of ‘approval to spend’, hindering efforts to improve efficiency.
Spend is underestimated… leading to an overspend
Where spend is underestimated, for instance because demand for a service has been underestimated, departments may seek efficiencies.
However, the original value-for-money case for the project or programme may no longer be valid. Furthermore, the department may act by:
• reducing quality or deferring delivery; and
• quickly cutting spend where it is easiest, not necessarily in areas delivering least value.
At aggregate level, if poor spend forecasting means that a department exceeds its allocated budget for the year, it needs to request an excess vote.
In practice, departments seek to avoid this by managing spend across their portfolio – reallocating funds to stay within their control totals. If done quickly and with limited consideration, these decisions may represent poor value for money.
Source: National Audit Offi ce

Forecasting in government to achieve value for money Part One 15
Impacts of poor project and programme forecasting
1.9 While we have identified examples of good practice (see Appendix Four), many of our reports have noted how poor forecasts have led to poor value-for-money decisions (see Figure 4 overleaf).
Impacts of poor forecasting at the aggregate level
1.10 Departments manage spending to meet annual budgets. We have previously noted that poor forecasting means departments make rapid allocation decisions to meet end-of-year pressures. A consistent record of poor forecasting can also erode confidence in forecasts generally:
• Our 2011 report on financial management in the Department for International Development noted that it historically managed its outturn close to budget – in large part through its ability to delay or bring forward payments to partner organisations rather than through effective forecasting. Staff were reluctant to forecast underspends in case unspent funds were lost. Forecasts were often inaccurate and senior managers did not trust them.3 The department told us it had addressed the subsequent recommendations from the Public Accounts Committee.
1.11 Finance directors identified how weak forecasts had meant they had:
• authorised unplanned spend to utilise underspends;
• offset overspends in one programme with underspends elsewhere;
• carried forward underspends; and
• been unable to reallocate underspends because these were declared too late.
The Macpherson review of modelling
1.12 Forecasts are often underpinned by models. Recent modelling failures, such as for the InterCity West Coast franchise, prompted HM Treasury to commission the Macpherson review of the quality assurance of modelling.4 This identified a need to improve the extent and nature of quality assurance for the 484 business-critical
models identified (see paragraph 2.16).

16 Part One Forecasting in government to achieve value for money
Figure 4Poor project and programme forecasting
1 Mortgage rescue
The Department for Communities and Local Government’s assumptions about demand and cost were unrealistic, and decision-makers did not understand the level of uncertainty. Demand was substantially higher than expected for the most expensive option, which also cost more than expected. The Department had to increase its budget by £80m within a few months.
2 Academies programme
The Department for Education initially underestimated the scale of demand for the programme and did not develop robust cost estimates. To remain within spending limits without restricting the pace or scale of the expansion in the two years up to March 2012, it used additional contingency funding of £105m and reassigned £244m from other budgets.
5 Child maintenance
Assumptions in the Child Maintenance and Enforcement Commission’s forecasts may not be prudent, potentially exposing the taxpayer to higher costs. The Commission did not quantify the cost of any increase in the number of families going to court to agree child maintenance arrangements instead of paying fees.
6 Telephone enquiries
We built a model to show that, by reducing estimated avoidable contact, matching resources more closely to demand and achieving better staff use, the Department could save up to £50m per year.
4 Typhoon fighter
In 1996, the Ministry of Defence approved funding for the Typhoon fighter on the basis of an over-optimistic cost estimate. The result was that it could afford 30 per cent fewer planes than expected, albeit a more capable aircraft than envisaged meant sufficient Typhoons were routinely available to meet operational and training requirements.
7 Capital for school places
The Department for Education underestimated the extra demand for school places resulting from an increasing birth rate. Gaps in its evidence on local demand and capacity, the costs of providing places, and local authorities’ financial contributions meant that it could not present a fully robust bid for funding at Spending Review 2010.
3 High Speed 1
Passenger numbers were around 30 per cent below the Department for Transport’s forecasts when it had agreed to guarantee the project debt in 1998. This had exposed taxpayers to an ongoing liability. We estimated that net taxpayer support may reach £10bn by 2070 (in 2010 prices).
Note
1 These examples are discussed in the body of the report or in Appendix Four. We use our back catalogue to provide illustrative historic examples from recent years where forecasting was an issue. In most cases, forecasting was only one of many issues and departments may have subsequently acted to address any concerns raised.
Source: See Appendix Three
New project
Business as usual
Capital
Resource

Forecasting in government to achieve value for money Part One 17
NAO findings on forecasting
1.13 Since January 2010, we have identified weaknesses in forecasting in 71 of our reports. The most frequently cited failings (see Figure 5) were:
• limited or poor-quality data;
• unrealistic assumptions and optimism bias;
• a lack of forecasting or modelling; and
• inadequate sensitivity and scenario analysis.
Figure 5Key weaknesses identified in recent NAO reports
Weakness
Source: National Audit Office
Poor-quality data and/or lack of data
Optimism bias/unrealistic assumptions
Lack of/inadequate sensitivity orscenario analysis
Limited/insufficiently detailed modellingor forecasting
Lack of forecasting/modelling
Failure to compare outturn to forecast/need to use monitoring and evaluation
Poor presentation to decision-makers
Year-end crisis management/peak spending
Number of reports in which weakness mentioned
31
23
12
9
20
11
10
7
Production
Use
0 5 10 15 20 25 30 35

18 Part One Forecasting in government to achieve value for money
Good practice in forecasting
1.14 In Figure 6 we set out our good practice framework for maximising the benefits of forecasts as a financial management tool:
• When producing forecasts, high-quality data, skilled staff, well-reasoned assumptions and clear presentation of uncertainty are required.
• When using forecasts, decision-makers need to understand the level of risk and uncertainty and the reasons behind this, to make informed decisions on how to allocate resources to deliver services on time and budget.
1.15 The processes of producing and using forecasts must be well integrated, with shared understanding between all parties and capability to produce and use forecasts at project, programme and aggregate levels in order to drive effective decision-making and value for money for the taxpayer.
1.16 Organisations need the right incentives to maximise the benefits of forecasting. This requires a supportive environment within departments and across government, which promotes good practice and ensures accountability.
This study
1.17 We used our framework as the basis for this study. In Parts Two to Four we consider how departments produce and use forecasts and whether they have a supportive culture. In Part Five, we address the role of HM Treasury, including the influence of the budgetary system.
1.18 Forecasting relates to all government work and we have not sought to assess all such activity or quantify the values involved. Government spending comprises departmental expenditure limits (DEL) and annually managed expenditure (AME) (see Figure 7 on page 20). DEL budgets cover spending that departments can control. AME covers spending that is harder to control.
1.19 We focus on DEL forecasts because they are subject to less external scrutiny than AME, which increases the risk to their quality. However, the need to forecast AME accurately is likely to increase with the government’s intention to cap a large proportion of it, and many of our findings have relevance for AME forecasting.5
1.20 We employed a range of methods and drew on Deloitte’s review for us of good practice in the private sector. Appendices One and Two describe our audit approach and evidence base. Appendix Four includes further examples from our back catalogue. We use past studies to provide illustrative historic examples from recent years where forecasting was an issue. In most cases, forecasting was only one of many issues and departments may have subsequently acted to address any concerns raised.

Forecasting in government to achieve value for money Part One 19
Figure 6Good practice in forecasting
Aims
Resource
Testing
Learning
Use Production
Application
Collaboration
Informed challenge
Communication
Concept and design
Uncertainty and testing sensitivity
Making use of forecast
Development
Assumptions Data
Note
1 See Appendix Two for a more detailed explanation.
Source: National Audit Offi ce
Assumptions
Data

20 Part One Forecasting in government to achieve value for money
Figure 7Types of spending
Departments’ budgets comprise the following elements
Type of spending 2013-14 (£bn) Implications for forecasting
DEL (departmental expenditure limit) for general running costs – split into the following ‘control totals’:
• Resource DEL (RDEL), such as pay or procurement; and
• Capital DEL (CDEL) relating to investment in assets, such as buildings, equipment and land.
£360bn
£318bn88 per cent of total DEL
£42bn12 per cent of total DEL
Often on ‘business as usual’, which tends to be more predictable.
Often on specific and longer-term items, which can be harder to predict and manage.
AME (annually managed expenditure), which reflects volatile spending such as benefits payments.
£338bn Although unpredictable in nature, considerable effort is given to forecasting AME by departments for which it is significant. These forecasts are also subject to scrutiny from HM Treasury and the Office for Budget Responsibility.
Source: National Audit Offi ce, based on data in HM Treasury, Autumn Statement 2013

Forecasting in government to achieve value for money Part Two 21
Part Two
Producing forecasts
2.1 Forecasts are typically produced by economists, statisticians, operational researchers or accountants belonging to a professional network (such as the Government Operational Research Service).b These networks provide career support and technical guidance to their members.
2.2 In this part, we examine how well forecast production meets good practice – including aims, resourcing, use of data and assumptions, quality assurance and presentation.
Clear aims and transparency
2.3 All parties should agree the aims of a forecast, what outputs are required by when and how these requirements will be met. Analysis should be checked against these aims, with no scope for misunderstanding.
2.4 We have previously identified cases where forecast production lacked clarity. This makes it hard to detect when a forecast does not meet requirements or is unreliable. It also hinders wider use of the analysis:
• In our 2012 report we found the model underpinning the Child Maintenance and Enforcement Commission’s complex reforms of child maintenance was overly complicated and not fit for purpose. Parts of the model were unclear and some data sources hard to validate.6
2.5 We conducted a case study of the Ministry of Justice’s prison population projections and found substantial communication between users and producers about the forecasts’ purpose.7 This openness helps ensure that everyone is clear about the aims and value of the work.
Resources and skills
2.6 Forecasting relies on departments hiring sufficient analytical capability. The government has a substantial pool of analytical expertise, with over 3,100 statisticians, operational researchers and economists and over 4,800 qualified finance professionals.
b However, in the Ministry of Defence, forecasts are typically generated by Project Teams and Commands. The internal Cost Assurance and Analysis Service produces independent cost estimates allowing risks to the accuracy of costings to be understood.

22 Part Two Forecasting in government to achieve value for money
2.7 The three departments with the largest departmental expenditure limits (DEL) maintained 152 (31 per cent) of the models considered by the Macpherson review. These models represent only part of the departments’ forecasting activity. While the departments have 458 statisticians, operational researchers and economists between them, these analysts will typically be fulfilling many unrelated tasks.
2.8 Our evidence suggests that few analysts are involved in forecasting. For another study, we surveyed government analysts on their use of information: while 830 statisticians, operational researchers and economists participated in this survey, only 107 such analysts identified themselves as being involved in DEL forecasts and responded to the forecasting survey we conducted alongside it.
2.9 Of the 85 analysts who commissioned, produced or quality assured DEL forecasts, 54 per cent spent five or fewer days per month on forecasting and only 45 per cent agreed that sufficient resources were invested in the forecasts they produced.
2.10 Senior analysts in our focus groups identified resource constraints as a concern and noted problems in recruiting suitably skilled staff and acquiring software. One explained how difficult it had been to secure departmental approval to buy vital software costing a few hundred pounds.
Data and assumptions
2.11 Forecasts should use the most accurate and timely data available. However, over half the analysts we surveyed identified a lack of good quality data as preventing good forecasting and this was also a concern for senior analysts at our focus groups.
2.12 Where proxies or imperfect data have to be used, forecasters need to present how this affects the level of uncertainty. In some cases, departments should improve data; for example, we recommended that the Department for Transport conduct new research because it was using ten-year-old data to calculate High Speed 2 benefits for business travellers – the largest estimated benefit.8 The Department responded to our recommendation by releasing updated values that have since been included within the Economic Case for High Speed 2 published in October 2013.
2.13 Leading private sector practice is for data and assumptions to be rigorously tested to ensure they remain ‘fit for purpose’. Good quality forecasting requires assumptions, their rationale and accountability to be documented. For instance, in the Ministry of Justice, internal and external stakeholders discussed data use, assumptions and scenarios, with a documented audit trail (Figure 8).
Sensitivity analysis
2.14 Sensitivity analysis tests how outputs change in relation to assumptions. The Green Book recommends its use in project appraisals, but the proportionate application of sensitivity analysis extends to all spending decisions.9

Forecasting in government to achieve value for money Part Two 23
2.15 However, our analysis of impact assessments found that fewer than half included sensitivity analysis.10 Poor sensitivity analysis means decision-makers are unaware of the range of possible outcomes:
• In our review of rail passenger capacity, we found that the Department for Transport did not test widely the sensitivity of its model’s demand forecasts to changes in assumptions. It did not test its forecasts’ sensitivity to variations in the relationship between growth and demand. The recession subsequently significantly affected its demand projections.11
Quality assurance
2.16 Effective quality assurance should guard against poor production and avoid situations where a model developed for one purpose is inappropriately used for another:
• We identified various failings in the Department for Transport’s process to evaluate bids for the InterCity West Coast franchise competition, which led to the contract award being cancelled.12 One of the main contributory factors was an error in the Department’s modelling of the financial performance of the bids. It had calculated what capital (‘subordinated loan facility’) bidders would need to cover possible operator losses, to protect the Department against default and guarantee the bidders’ premium payments. However:
• it had not developed a method of calculating the loan facility in advance. Instead, it quickly adapted a model which, although well designed, had been built for another purpose;
• it did not apply any additional quality assurance to its model; and
• the model produced outputs in real terms rather than the nominal terms needed to calculate potential losses in any given year, thus understating the loan for one bidder by over £100 million.
Consequently, the Department requested a loan facility that provided less protection against franchisee collapse than it wanted. Had the error not been detected, and the competition cancelled, the Department would have been at a greater risk of lost revenue than their model forecast. The cancellation led to unforeseen costs to the taxpayer of £54 million.
Figure 8Data and assumption ownership for prison population projections
Assumptions are cleared with relevant data owners and analysts, while policy assumptions are agreed with policy colleagues. This is documented and all stakeholders can challenge the assumptions.
Higher, central and lower projections are informed by scenario analysis, developed in consultation with a wide range of internal and external stakeholders. A senior steering group meets regularly, to consider upcoming issues that might affect the prison population.
Source: Ministry of Justice

24 Part Two Forecasting in government to achieve value for money
2.17 All finance directors we surveyed agreed that the quality of forecasting for total DEL had improved in the last three years. They were also confident that their departments’ quality assurance arrangements meant forecasts were fit for purpose. However, analysts responding to our survey were slightly less positive, with only 62 per cent agreeing that quality assurance arrangements were sufficient (Figure 9).
Figure 9Analysts’ views on quality assurance
Note
1 Base: analysts commissioning, producing or quality assuring DEL forecasts (n=85).
Source: National Audit Office
Percentage
0 10 20 30 40 50 60 70 80 90 100
The forecasts I produce are subject toquality assurance
Quality assurance arrangements in the area I work are sufficient to provide assurance
on the overall quality of forecasts produced
Quality assurance of more importantforecasts is more rigorous than for less
important forecasts
Externally produced models undergo lessrigorous quality assurance than internally
produced models
Forecasts produced by external consultantsare generally of good quality
Strongly agree
Agree
Neither agree nor disagree
Disagree
Strongly disagree
Don’t know/not applicable
Analysts responded that their forecasts were subject to quality assurance, but only 62 per cent considered the quality assurance arrangements were sufficient
Forecasting in government to achieve value for money Part Two 25
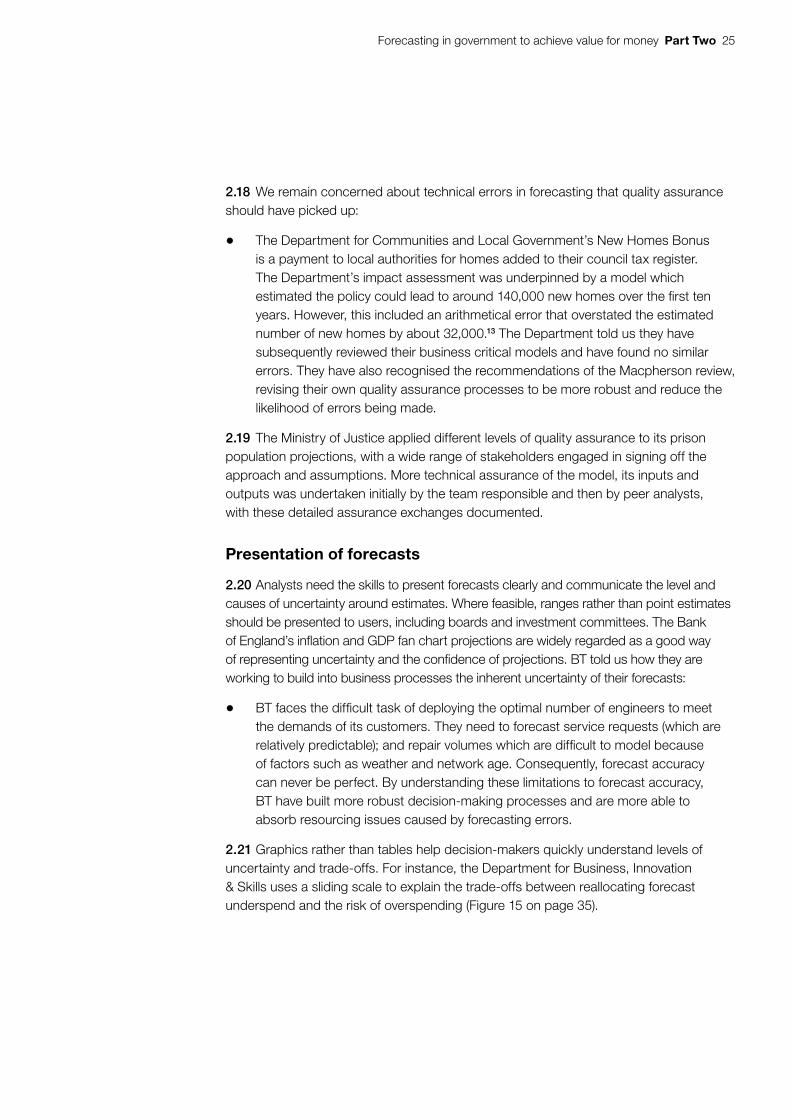
2.18 We remain concerned about technical errors in forecasting that quality assurance should have picked up:
• The Department for Communities and Local Government’s New Homes Bonus is a payment to local authorities for homes added to their council tax register. The Department’s impact assessment was underpinned by a model which estimated the policy could lead to around 140,000 new homes over the first ten years. However, this included an arithmetical error that overstated the estimated number of new homes by about 32,000.13 The Department told us they have subsequently reviewed their business critical models and have found no similar errors. They have also recognised the recommendations of the Macpherson review, revising their own quality assurance processes to be more robust and reduce the likelihood of errors being made.
2.19 The Ministry of Justice applied different levels of quality assurance to its prison population projections, with a wide range of stakeholders engaged in signing off the approach and assumptions. More technical assurance of the model, its inputs and outputs was undertaken initially by the team responsible and then by peer analysts, with these detailed assurance exchanges documented.
Presentation of forecasts
2.20 Analysts need the skills to present forecasts clearly and communicate the level and causes of uncertainty around estimates. Where feasible, ranges rather than point estimates should be presented to users, including boards and investment committees. The Bank of England’s inflation and GDP fan chart projections are widely regarded as a good way of representing uncertainty and the confidence of projections. BT told us how they are working to build into business processes the inherent uncertainty of their forecasts:
• BT faces the difficult task of deploying the optimal number of engineers to meet the demands of its customers. They need to forecast service requests (which are relatively predictable); and repair volumes which are difficult to model because of factors such as weather and network age. Consequently, forecast accuracy can never be perfect. By understanding these limitations to forecast accuracy, BT have built more robust decision-making processes and are more able to absorb resourcing issues caused by forecasting errors.
2.21 Graphics rather than tables help decision-makers quickly understand levels of uncertainty and trade-offs. For instance, the Department for Business, Innovation & Skills uses a sliding scale to explain the trade-offs between reallocating forecast underspend and the risk of overspending (Figure 15 on page 35).

26 Part Two Forecasting in government to achieve value for money
2.22 Without this information, departments cannot develop informed monitoring and risk strategies. However, eight of the eleven finance directors responding to our survey said that policy teams’ forecasts only ‘sometimes’ provided ranges:
• In our report on High Speed 2, we described how initial construction cost estimates for phase one were based on a high-level desk-based exercise. Given the uncertainty at this early stage it was unwise to present a point estimate of £16.3 billion rather than the range of £15.4 billion to £17.3 billion presented in some documents.14 The Department told us that in response to our recommendations, they now present a range of construction costs for High Speed 2 rather than a point estimate.

Forecasting in government to achieve value for money Part Three 27
Part Three
How forecasts are used
3.1 The users of project forecasts are policy, operational and finance staff when considering initiating new projects or changing existing ones.
3.2 In this part we consider whether managers act as informed customers for forecasts at project and programme levels. We also discuss whether analytical, finance and policy functions work collaboratively to integrate forecasts into decision-making. In the second half, we address how aggregate spending forecasts inform departmental budgeting.
Demand for forecasts
3.3 Forecasts are not just a technical tool. Managers need good quality forecasts to help them decide how best to secure value. Ideally, forecasts should be underpinned by proportionate, logical, accurate and transparent quantitative analysis and modelling. However, senior analysts told us that spending on smaller projects was often not modelled, and most finance directors we surveyed said that policy teams’ forecasts were only sometimes based on modelling or significant quantitative analysis.
3.4 We have previously identified examples where departments could have made savings through more analysis:
• In 2009, we built a model to estimate possible performance improvements for HM Revenue & Customs.15 We estimated that if it could reduce low value contact by the total value of its own early unrefined estimate (35 per cent), it could hit its 90 per cent target for answering calls, and save between £30 million and £50 million. The Department has subsequently introduced its own planning and modelling tools, which it refreshes to inform resource deployment.16
3.5 Senior decision-makers need good forecasts when weighing up options – including the longer-term impacts of decisions to speed up, slow down or defer spending:
• The Ministry of Defence’s decision in December 2008 to slow the production of aircraft carriers to help it manage its budget in year reduced long-term value for money. The Department relied on initial industry estimates that the total net cost increase would be £674 million, but by 2010, identified further costs of £562 million, bringing the cost increase to £1.24 billion.c As a result of these cost increases the Department agreed a final target cost with industry of £5.24 billion in 2011, an increase of 50 per cent above the level approved in 2007.17
c In the National Audit Office’s Major Projects Report 2010, this increase was reported as £1.56 billion. However, in line with HM Treasury’s ‘clear line of sight’ policy implemented on 1 April 2010, the cost of capital is now excluded from the calculation, producing a revised figure of £1.24 billion.

28 Part Three Forecasting in government to achieve value for money
Informed challenge
3.6 To make defensible decisions, users should request clear explanations and be able to ask informed questions. They need to recognise that forecasts are based on assumptions, understand the nature and extent of related uncertainty and manage the resulting risks. Managers will be more incentivised to do this if they are accountable for their use of forecasts.
3.7 However, over a quarter of analysts we surveyed were concerned about a lack of senior management understanding of what forecasts mean and only 39 per cent thought senior managers used forecasts effectively (Figure 10).
Figure 10Analysts’ views on senior managers’ use of forecasts
Note
1 Base: analysts commissioning, producing or quality assuring DEL forecasts and those packaging/presenting findings to policycustomers/senior management (n=93).
Source: National Audit Office
Senior management understandsthe importance of forecasting
There is a demand from seniormanagement for good quality forecasts
Senior management has the skillsto understand forecasts
Senior management usesforecasts effectively
0 20 40 60 80 100
Percentage
Strongly agree
Agree
Neither agree nor disagree
Disagree
Strongly disagree
Don’t know/not applicable
Analysts considered senior managers understood the importance of forecasting, but only 39 per cent thought senior managers used forecasts effectively

Forecasting in government to achieve value for money Part Three 29
3.8 Our focus group participants identified similar concerns. They drew a distinction between quality of production and users’ ability to understand forecasts’ assumptions and limitations. We have previously identified the impacts of not challenging forecasts or inadequately addressing risks:
• In our report on High Speed 1, we found that passenger numbers were around 30 per cent below the Department for Transport’s forecasts when it had agreed to guarantee the project debt in 1998. This had exposed taxpayers to an ongoing liability. We estimated that net taxpayer support may reach £10.2 billion by 2070 (in 2010 prices).18
Collaboration between users and producers
3.9 Deloitte identified the importance of functions collaborating in the production and use of forecasts. Leading practice is for operational and financial forecasting to be integrated, with all parties collaborating and providing challenge. The equivalent relationship in government is between analysts, policymakers and finance who should liaise closely to understand and trust forecasts.
Use at project and programme level
3.10 Decision-makers should combine analysts’ forecasts with judgement to make evidence-based decisions and manage risks. For example, the Ministry of Justice uses prison population forecasts for short-term operational decisions and medium-term estates planning, as well as the impacts of policy options (Figure 11 overleaf).
Risk management
3.11 Good forecasting helps managers identify risks, but they need to take into account that data and assumptions can themselves be part of that risk:
• In our report on the Department for Work & Pensions’ Work Programme, we noted that the data supporting key estimates, while the best available, was incomplete and assumptions had to be made.19 The Department made aggressive assumptions about the level of performance that could be achieved by the Work Programme and at what price. These assumptions create risk to the sustainability of current contracts that will need to be monitored closely.
3.12 Managers should monitor outturn and build in contingency to address their total financial commitments and risk. However, our back catalogue illustrates failures to address identified uncertainty and the resulting risks:
• In 2011, we reported that although HM Revenue & Customs had many of the necessary arrangements in place to deliver £955 million annual running cost reductions by 2014-15, there was uncertainty about its plans and a lack of contingency.20 In 2013, we reported that it had strengthened management of its change programme, and was addressing the need for contingency by the way it managed its portfolio of projects.21

30 Part Three Forecasting in government to achieve value for money
Figure 11How prison population forecasts inform decision-making
Notes
1 Short-term plans focus on the gap between actual population and usable capacity, with potential refurbishment delays the main source of uncertainty. Managers use weekly updates to track actual fi gures against projections and make local operational changes.
2 In the medium term NOMS decides whether to open and close prisons based on central population projections and the need to balance fl exibility against the need to minimise vacant places. Recent projections have given NOMS the confi dence to accelerate closures from future years.
3 NOMS works with Ministry of Justice analysts to understand the impacts of policy options that are under consideration, such as sanctions for knife possession, so that it can advise ministers on capacity implications.
Source: National Offender Management Service
National Offender Management Service (NOMS) manages its estate by combining:
• annual prison population forecasts;
• data on current use;
• forecasts of future capacity; and
• weekly monitoring of actual population figures against projections.
Prison capacity and population (000)
Usable operational capacity including announced changes
Actual population – 10 January 2014 – 84,258
Published population projections
87
86
88
89
83
82
81
80
79
84
85
90
91
92
Jan May Sep May SepJan May SepJan May SepJan JanOct
2010 20152011 2012 2013 2014
NOMS uses prisoner forecasts to help plan operational capacity and inform policy making

Forecasting in government to achieve value for money Part Three 31
Monitoring outturns
3.13 Forecast producers and users need to compare outturn with forecasts to understand variance, identify policy implications and improve forecasts’ accuracy. HM Treasury has recently acknowledged the need ‘to better understand the costs of activities and ensure this understanding will be used to inform better decision-making.22
3.14 However, we note in our report on evaluation the limited use of evidence on outcomes to inform decision making.23 Unless departments learn from outturns, poor quality forecasting will persist for projects, and for spending generally:
• Our 2012 report on financial management in the Department for Business, Innovation & Skills noted that forecasting had been an area of weakness, leading to significant over or underspends. While it was taking steps to improve forecasting, it did not monitor spending against the most recent forecast and thus could not judge forecasts’ quality.24
Use at the aggregate level
Analytical and finance coordination
3.15 Finance officials use forecasts to inform annual budgeting decisions and spending review submissions. However, senior analysts identified a ‘disconnect’ between the analytical and finance functions. They were concerned that finance is a ‘black box’, with a lack of clarity about how forecasts inform allocation. They also identified how analysts’ and accountants’ use of different language perpetuated this disconnect.d
3.16 This perceived disconnect creates a risk in how uncertainty is considered across departments’ spending portfolios, with significant implications for value for money. To address this, the Ministry of Justice has nominated analysts to work closely with its finance directorate and key change programmes to bridge the functions.
Managing volatility
3.17 Departments have considerable freedom to allocate budgets within HM Treasury’s rules and often move substantial funds between programmes. For example, in the space of ten months the Department for Communities and Local Government moved 40 per cent of its resources between programmes.25
d HM Treasury guidance notes that “Many practitioners of investment appraisal confuse the financial appraisals with the economic appraisals. The economic case focuses on VfM, taking into account resource costs and benefits. In contrast, the financial case focuses on ‘affordability’ of the options appraised in the economic case…”. See: HM Treasury, Public Sector Business Cases using the Five Case Model: a Toolkit, 2007.

32 Part Three Forecasting in government to achieve value for money
3.18 Spending is most volatile as year end approaches. Departments’ average monthly spend is higher in the last two months of the financial year than in the previous ten months (Figure 12).
3.19 Our analysis of departments’ monthly spending returns to HM Treasury also demonstrates how expected spending on programme lines can vary significantly late into the year (Figure 13).
3.20 Most finance directors we surveyed agreed that, while budgets were balanced at a macro level, there was often significant budget switching and that volatile spending lines posed a challenge to financial management (Figure 14 on page 34). In Part One, we noted how large and late allocation shifts risk destroying value.
Figure 12Current spending on public services in real terms
£ billion in 2011-12 prices
Departments’ average monthly spend is higher near the end of the financial year
Source: Budget 2013, HM Treasury
2009-10
2010-11
2011-12
2012-13
Monthly averageApr to Jan
Monthly average Feb to Mar
(implied for 2012-13)
0
30
31
32
33
34
35
36
29

Forecasting in government to achieve value for money Part Three 33
Skills Funding Agency 7.5 3.0 3.0 4.3 4.0 3.1 2.9 0.4 -2.2 0.5 0.1 0.0 0.0
Grant to the Higher Education Funding Council 7.0 -1.8 -1.8 -1.8 -1.8 -1.8 -1.9 -1.9 -1.9 -1.8 -0.1 0.0 0.0
Engineering and Physical Sciences Research Council -8.7 1.2 1.2 1.1 1.1 1.1 1.1 1.1 1.1 1.1 1.1 0.0 0.0
Central Government higher education programmes -46.4 -36.7 -36.7 -32.5 -32.5 -32.5 17.4 17.1 20.0 20.3 20.0 0.0 0.0
Figure 13Variance in forecast spending
During 2011-12, the Department for Business, Innovation & Skills substantially changed its forecast spending for its four largest resource DEL (RDEL) lines (totalling 82 per cent of all RDEL) – often allocating money late in the year.
The Department told us that this volatility is a result of the higher education business cycle. As each academic year begins the Department receives forecasts of the volume of students entering and continuing in the system and their support requirements. The exact behaviour of students throughout the year is difficult to predict with a high degree of accuracy which can lead to variances at year end.
For example, in June 2011, the Department expected to spend 46 per cent less on central government higher education programmes than it ultimately spent, but as late as March 2012 it was forecasting spending that was 20 per cent higher than the final outturn.
Variance between forecast and outturn (percentage of outturn) (%)
Monthly forecast returns
Source: National Audit Office analysis of Combined Online Information System (COINS) data
-10
0
10
20
-50
-40
-30
-20
30
Jun Jul Aug Sep Oct Nov Dec Jan Feb Mar Apr May Outturn
2011 2012
Departments can experience substantial variance in forecast spending through to the end of the financial year

34 Part Three Forecasting in government to achieve value for money
3.21 While such volatility could reflect many factors, including policy decisions and unforeseeable developments, some reflects poor forecasting. Most finance directors agreed that better forecasting could help reduce volatility and the risks to value. Some identified a need to communicate earlier with budget holders to understand and challenge their forecasts. For example, the Department for Transport finance team told us it was working with policy teams to identify possible underspends earlier in the financial year.
3.22 Finance directors typically rely on policy teams’ forecasts to produce their portfolio estimates. But with policy teams often providing only point estimates, there is a risk that finance directorates cannot understand total potential variation across their portfolios and manage risk appropriately.
3.23 The Department for Business, Innovation & Skills recently implemented an approach to portfolio-level forecasting, to incentivise better forecasting and improve their oversight of volatility (Figure 15).
3.24 Our work on managing budgets26 identified how one case study had developed a framework to improve budgetary management (Figure 16 on page 36).
Figure 14Forecasting and spending volatility
Source: National Audit Office
0 1 2 3 4 5 6 7 8 9 10 11
Number of finance directors
Strongly agree
Agree
Neither agree nor disagree
Disagree
Annual budgets are almost always balanced at a macro level, but atthe level of programmes and projects there is typically significant
in-year switching of budgets between spending lines
Spend lines that are very volatile pose a significant financialmanagement challenge for my department
Pressure quickly to address in-year underspends or overspends oftenmeans that spending is cut, delayed or reallocated in the areas where
it is easiest to do so, rather than to maximise value for money
Improvements to analysis and forecasting in my department couldplay a role in helping to manage volatility in spend lines and reduce
risks to achieving value for money
Most finance directors agreed that improvements to analysis and forecasting could help in managing volatility in spending and reducing risks to value for money

Forecasting in government to achieve value for money Part Three 35
(Results assume zero volatility around redeployed funds)
Redeploying up to around £310 million will:• Significantly reduce the size of underspend with no impact on the probability of overspend
The permanent secretary and finance director promoted this approach to budget holders, and used league tables and awards to incentivise accuracy. Directors were set targets of an average 1 per cent underspend against forecast, but could exceed this with good reason. The finance team reviewed forecasts to guard against perverse behaviour (for instance, teams spending money simply to hit targets) and to ensure that teams forecast the most likely outturn rather than the most pessimistic scenario.
The Department identified a number of benefits:• greater ownership of forecasts by senior policy officials and thus understanding of uncertainty;• a better central understanding of volatility and how to manage it; and• strengthened relationships between analysts, policy and finance functions.
For 2012-13, the Department reported its lowest underspend for resource DEL (94 per cent of total DEL) since its formation in 2009-10. It acknowledged, however, that differences in outturn against budgets at the start of the year remain high and it had focused primarily on RDEL.
Source: Department for Business, Innovation & Skills
Figure 15Forecasting spending
In 2011-12, the Department for Business, Innovation & Skills experienced high spending volatility and a DEL underspend of £1.4 billion.
The following year the finance directorate worked with analysts to develop a new approach to forecasting aggregate spending. Rather than collating single-point forecasts, the team aggregates forecast ranges and distributions quarterly from policy teams across around 600 budget lines. This enables them to create a central range and estimate the probability of under or overspending and identify key drivers of volatility. It also lets them present the trade-offs from changing spending patterns so that the Performance, Finance and Risk Committee can reallocate underspends while minimising the risk of overspending.
Probability of overspend (%) Expected underspend (£m)
0
20
40
60
80
90
70
50
30
10
100
0
100
200
300
400
450
350
250
150
50
500
Underspends will decline gradually as more underspends are redeployed
Uncertainty around size of expected underspend
Probability of overspend increases sharply if more than around £400m is redeployed
0 50 100 150 200 250 300 350 400 450 500 600550
DEL near-cash redeployed (£m)
Increase amount of DEL programme near-cash redeployed
Expected underspend Probability of overspend
The Department for Business, Innovation & Skills has sought to improve its approach to portfolio-level forecasting

36 Part Three Forecasting in government to achieve value for money
Figure 16Prioritisation Matrix
The business prioritises attention on the most volatile spend and where forecast accuracy is low. This had helped it to spread good practice and improve the efficiency of its budget management.
Learn lessons and share
Identify champions
High priority for budgetary resources
Innovate
Low priority Consider new approaches
Adopt reactive targeted approach
Materiality/ Volatility of spend
Historic forecast accuracy
Source: PricewaterhouseCoopers
High
High
Low
Low

Forecasting in government to achieve value for money Part Four 37
Part Four
Departmental environment
4.1 In this part, we consider whether departments have a culture to support forecasting and the factors that may hinder this.
A supportive culture
4.2 Departments need to establish a culture that raises forecasting quality. The Macpherson review recognised the value of a culture which supports quality assurance.
4.3 Leading private sector practice involves investing time and resources in forecasting. Managers communicate expectations and champion forecasting. They ensure accountability for production and use is agreed and linked to staff reporting. They also encourage knowledge sharing, for instance by holding ‘forecasting forums’.
4.4 Analysts and finance directors considered that senior managers understood the importance of forecasting and demanded good quality forecasts. However, our evidence suggests that the environment for producing forecasts could be more supportive. For instance, senior analysts in our focus groups considered more senior support could drive improvements to data systems and quality. Just over half of the analysts responding to our survey thought that involvement in forecasting would help them develop their career.
Managing time pressures
4.5 Departments need to manage the tension between fast-moving policy demands and the time needed for reliable analysis, for example by prioritising their forecasting needs. Senior analysts suggested that policymakers were ‘blind to uncertainty’ and that weaknesses in its presentation reflected managers’ demands for point estimates, rather than poor analysis.
4.6 Analysts identified time pressures as the main factor preventing good quality forecasting (see Figure 17 overleaf). Finance directors were similarly concerned and one of our focus groups considered it the biggest challenge.

38 Part Four Forecasting in government to achieve value for money
4.7 Only 52 per cent of analysts responding to our survey agreed that forecasting in their department struck an appropriate balance between analytical rigour and speed. Where departments need to move quickly, they should be aware how this affects the quality of analysis and manage associated risks to value for money, for instance by closely monitoring progress against forecasts:
• The Department for Communities and Local Government did not adequately test the assumptions underpinning the business case for its mortgage rescue scheme; failed to make effective use of available information; misjudged the demand for different types of mortgage rescue; and did not take action early enough to improve the value obtained from public investment in the scheme after realising its initial assumptions were wide of the mark. As a result, it had to increase the scheme’s budget by £80 million five months after it started.27
Figure 17Factors preventing good quality forecasting
Analysts saw time pressures as the main factor preventing good quality forecasts
Note
1 Base: analysts commissioning, producing or quality assuring DEL forecasts (n=85).
Source: National Audit Office
700 10 20 30 40 50 60
Percentage of analysts responding
Time pressure due to general workload
Timescales imposed by political process/decision-making
Lack of quality data
Lack of understanding from senior managementof what forecasts are telling them
Software issues
Pressure to produce forecasts that supporta predetermined course or decision
Analysis and models underpinning forecastsbeing used in ways that were not intended
64
55
53
27
27
25
24

Forecasting in government to achieve value for money Part Four 39
Optimism bias and pressure for supportive analysis
4.8 A quarter of analysts responding to our survey were concerned that decision-makers want forecasts that support their viewpoint and intentions. Finance directors also identified optimism bias as the main factor preventing good quality forecasting (Figure 18). Our back catalogue review found unrealistic assumptions and over-optimism to be the second most frequent weakness (see Figure 5).
4.9 Optimism bias is a well-established concept, with a substantial body of research showing that forecast costs and benefits are generally highly inaccurate. To address this, HM Treasury requires proposals to be adjusted to reflect optimism bias for similar projects.28 For instance initial forecast costs of non-standard civil engineering works are increased by up to 66 per cent.
4.10 Nevertheless, we continue to identify over-optimistic forecasts, which sometimes have long-term implications. In 2012, the Committee of Public Accounts noted that only a third of government major projects were delivered on time and on budget.29 The Major Projects Authority annual report states that two-thirds of current projects are expected to be delivered to time and on budget.30
Figure 18Factors preventing good quality forecasting
Finance directors identified optimism bias as their main concern
Source: National Audit Office
10 2 3 4 5 6 7 8 9 10
Number of finance directors
Optimism bias/tendency tobe too optimistic
Time pressure due togeneral workload
Lack of skills/experiencein forecasting
Lack of incentives to produceaccurate forecasts
Ministerial pressure
Timescales imposed by politicalprocess/decision-making
Lack of sharing of best practiceon forecasting
Software issues
9
7
7
6
5
5
4
4

40 Part Four Forecasting in government to achieve value for money
Integrating forecasting activity
4.11 Models are often indirectly related and use at least some of the same data and assumptions. Leading practice in the private sector addresses this by consolidating information from across the business.
4.12 Our focus groups identified the risk of inconsistency from the use of multiple models. Senior managers need to encourage communication between users and producers to ensure awareness of all forecasting activities and a cohesive approach. For example, the Ministry of Justice has sought to integrate the models informing prison population projections (Figure 19).
Figure 19Integrated modelling
Crown Court forecasts
Probation projections
Prison population projections
Parole workload
Crown Court workload model
Magistrates criminal workload model
Magistrates Court forecasts
Sentencing module
Source: Ministry of Justice
The Ministry of Justice has sought to integrate the models informing prison population projections
Prison population projections are driven by a number of models. Three years ago, the Ministry of Justice integrated these models to create a consistent and interlinked suite. This allowed the impacts of changes at any point in the system to be assessed more effectively.
Analysts believe a key benefit is greater accuracy. Short-term and long-term performance is now being monitored in the single model.

Forecasting in government to achieve value for money Part Five 41
Part Five
The centre of government
5.1 HM Treasury leads the government’s interests in spend forecasting, through its management of the budgetary system and guidance on economic analysis. Its spending teams monitor departments’ forecast and actual spend.
5.2 This part considers its recent actions to raise forecasting standards through better quality assurance of modelling at project and programme levels and budgetary incentives at the aggregate level. These are positive steps, but we discuss how budgetary incentives in particular are affected by wider tensions in the system.
Recent developments
5.3 HM Treasury recognises the need to improve forecasting, stating:
“Forecasting performance, in particular, must improve … sound forecasts enable the government to ensure that departments are not overspending but also to identify in good time, and then reallocate, any underspends …” 31
5.4 The main steps it has taken are:
• introducing plans to improve modelling following the Macpherson review;
• its review of financial management, published in December 2013;
• changes to the budgetary system to:
• incentivise better forecasting; and
• improve its monitoring of departments’ financial positions.

42 Part Five Forecasting in government to achieve value for money
The Macpherson review
5.5 The Macpherson review of the quality assurance for business critical models recommended that departments should:
• have appropriate quality assurance and a dedicated senior responsible officer for all such models;
• develop plans to ensure:
• a supportive environment for quality assurance, including sufficient capacity, time and skills for it; and
• effective quality assurance processes, with clear guidance and a shared understanding between producers and users about the purpose and limitations of the models.
5.6 If implemented well, these recommendations will raise standards. However, the review’s focus on the quality assurance of key models means that it will have less impact on:
• where analysis is lacking: we identified in Part Three how spend forecasts are often not based on modelling or quantitative analysis; or
• the need to improve production and use of forecasts more generally, or how these activities are best integrated and inform budgeting.
5.7 HM Treasury’s planned review of progress against these recommendations in 2014 is an opportunity to ensure that departments’ plans will deliver real change.
Lesson learning and guidance
5.8 In our survey of analysts, only 21 per cent said good practice was being shared between departments. Forecasting practice has been poorly addressed by central guidance: neither HM Treasury’s The Green Book nor its Business Case guidance address it in any detail.32 The cross-departmental expert group formed following the Macpherson review plans to collate good practice on modelling (provisionally titled the ‘Rainbow Book’). This and the update to The Green Book present an opportunity to improve forecasting practice.
5.9 There are no mechanisms to ensure departments share data or assumptions, increasing the risk that they duplicate effort or make decisions based on contradictory evidence.
5.10 Our focus groups supported improvements to guidance, but identified a need for more active knowledge sharing across the professions. HM Treasury is well placed to assist this by sharing lessons between departments, such as the initiative in the Department for Business, Innovation & Skills (Figure 15).

Forecasting in government to achieve value for money Part Five 43
Financial management capability
5.11 In December 2013, the government published its review of financial management in government which noted that “excellent financial management is critical to the government’s continued ability to reduce the deficit, achieve value for money from public expenditure and deliver high quality public services”.33 The review contained recommendations on:
• investment in understanding and using information on the cost of activities;
• the need for better management information;
• increasing analytic capacity to use the information effectively in decision-making and resource allocation; and
• creating a Director General for Spending and Finance role in HM Treasury, which will be responsible for leadership of the finance function and overall public spending.
The budgetary system
5.12 Deloitte identified that leading private sector practice is for forecasting to be a true reflection of the most probable outcome, not just a routine exercise to hit targets.
5.13 The relationship between forecasting and public sector budgeting is complex (see Figure 20 overleaf). Many factors influence how departments and HM Treasury allocate budgets, including political priorities and unexpected developments. Budgeting should, however, be informed by robust forecasts of spending.
5.14 Parliament looks to HM Treasury to ensure departments spend within agreed limits. In turn, HM Treasury designs and manages the budgetary system with the aim of:
• controlling spending; and
• incentivising departments to provide value-for-money services.
We have, however, previously reported that this system is better at meeting the first aim than the second.34
5.15 At the aggregate level, departments rarely overspend and typically register small underspends. However, as we noted in Part Three, there is often considerable volatility in departments’ spending at programme level, increasing the risk of poor value-for-money decisions. Although some volatility reflects poor forecasting, some reflects the influence of the budgetary system itself.

44 Part Five Forecasting in government to achieve value for money
Figure 20The budgetary cycle
Departments finance activities through Parliament voting them the money. Departments’ main estimates are voted annually and supplementary estimates enable them to alter these amounts, with HM Treasury and parliamentary agreement
Source: HM Treasury, Improving Spending Control, April 2012
Jan to Feb
Supplementary estimates
Nov to Dec
Deadline for budget exchange and reserve claims
Apr to May
Main estimates
Jun to Jul
First round of Chief Secretary bilaterals
Apr
Start of financial year
Nov to Jan
Second round of Chief Secretary bilaterals
Monthly
Departmental Online System for Central Accounting Reporting (OSCAR) returns
Public Sector Finances statistical bulletin

Forecasting in government to achieve value for money Part Five 45
5.16 If a department overspends against its supplementary estimate, it will require an excess vote, have its accounts qualified and face parliamentary scrutiny. Departments therefore focus on balancing their budgets by year end. We have previously noted that this drive to meet annual control totals has the greatest influence on departments’ behaviour and can lead to poor decisions.35
5.17 Almost all finance directors we surveyed agreed they focused more on forecasts for year end than on forecasts during the year. Most also considered that the spending control framework incentivised them to over-budget and underspend. We note, for example, that departments often increase budgets at supplementary estimates but do not spend the full increase.
5.18 Some finance directors were concerned that capital was set on an annual basis, despite it being hard to profile lifetime spend reliably. HM Treasury has partially addressed this by announcing that certain infrastructure spending, for instance for High Speed 2, may be given greater flexibility to move money between years.36
5.19 We have previously observed that departments shift spending between programmes to meet their overall budget; or spend quickly to avoid having to return funds to HM Treasury. Such behaviour is unlikely to protect value for money. Some finance directors raised concerns about the behaviours the spending control framework drove – including cutting, delaying or reallocating spending on the grounds of ease, rather than value for money. Senior analysts also registered concerns about the budgetary system’s complexity and the potential for game playing such as bringing forward spending to avoid losing it.
5.20 This has implications for forecasting, in terms of potentially:
• Not incentivising good forecasting. Departments know that they can address the impacts of poor forecasts by shifting spend against budgets.
• Making it hard to assess quality. Changes to departments’ expected spending may reflect adjustments to hit targets rather than poor forecasting.
• Crowding out good behaviour. One finance director noted that the attention paid to hitting targets diverted resources from improving forecasting.
5.21 Departments’ estimates provide limited information on spending variation and NAO and Parliamentary reports have identified weaknesses in Parliament’s ability to scrutinise spending.37 HM Treasury’s review of the presentation of departmental accounts, and plans for mid-year reporting, are opportunities to better support informed challenge of departments’ forecasting.38

46 Part Five Forecasting in government to achieve value for money
Incentivising good forecasting: budget exchange
5.22 In 2012, HM Treasury announced that it would adjust departments’ budgetary freedoms to reward or punish them for their financial management. It identified the freedom to carry forward underspending as a key tool.
5.23 Small underspends may reflect good management, but significant and persistent underspending represents poor forecasting and missed opportunities. However, there are few incentives on departments to avoid underspending and limited requirements to explain significant underspending.
5.24 Under the former ‘end year flexibility’ system, departments had accumulated underspends of £19 billion by 2010.39 In 2011-12, HM Treasury replaced this system with budget exchange. Departments can only carry forward underspending for one year and within strict limits, provided they have forecast it by the supplementary estimates.
5.25 Budget exchange is intended to incentivise departments to forecast and reallocate underspending rather than lose it. Departments’ access to it was to reflect the quality of their financial management. However, by 2012-13:
• Estimated underspending increased to £11.5 billion – nearly three times the recent average. The nature and reasons for this are not readily clear.
• HM Treasury allowed many departments which received budget exchange to exceed their limits and carry over a total of £4.4 billion spread over two years – approximately 450 per cent higher than for 2011-12 (Figure 21).40
5.26 HM Treasury encouraged underspends for Budget 2013. Its flexing of the budget exchange rules:
• was not clearly related to better financial management;
• risks weakening the incentive to improve forecasting and its message that good forecasting matters; and
• illustrates the difficulties in using the budgetary system to incentivise better forecasting, given the influence of other factors – such as pressure to cut spending.
5.27 HM Treasury acknowledged that departments could improve their pipelines of projects to ensure they can choose the option that maximises value from underspends.

Forecasting in government to achieve value for money Part Five 47
Figure 21Budget exchange for 2012-13
HM Treasury allowed five departments to carry forward more resource DEL, and six departments more capital DEL, than allowed under its budget exchange rules
Note
1 Budget exchange limits calculated according to HM Treasury thresholds. Figures are based on voted spend.
Source: National Audit Office analysis of HM Treasury data and departmental accounts
Department for Education
Ministry of Defence
Department for Communities and Local Government– Communities
Department for Communities and Local Government– Local government
Department for Business, Innovation & Skills
Department for Culture, Media & Sport
Home Office
Department for Transport
Department for International Development
Department for Environment, Food & Rural Affairs
Department of Energy & Climate Change
Department for Transport
Ministry of Defence
Department for Education
Department for Communities and Local Government– Communities
Department for Business, Innovation & Skills
Department for Culture, Media & Sport
Home Office
0 500 750250 1,000 1,5001,250
£ million
0 200100 400300 600500
£ million
Budget exchange limit Budget exchange used
Resource DEL Budget exchange 2012-13
Capital DEL Budget exchange 2012-13
Reported underspend
Not yet available
-3.5%
-11.1%
-0.4%
-1.8%
-30.6%
-3.2%
-6.7%
-1.3%
-0.7%
-5.8%
Reported underspend
-2.3%
-1.5%
Not yet available
-8.2%
-19.4%
-21.3%
-4.2%

48 Part Five Forecasting in government to achieve value for money
HM Treasury’s monitoring role
5.28 HM Treasury’s spending teams need to be able to identify good forecasting if they are to incentivise good practice. Budget exchange provides an incentive for departments to forecast and declare underspends earlier in the year. However, in the two years since announcing its enhanced incentives policy, HM Treasury has yet to apply any formal rewards or sanctions, preferring to use information on departments’ forecasting performance in their negotiations around major financial events.
5.29 A key source of information for the teams is OSCAR (Online System for Central Accounting Reporting), which departments update monthly with planned and actual programme spending. This system has greater functionality than its predecessor. However, one of its main functions is to help teams check that top-level budgets are under control, rather than to support the analysis and comparison of departments’ forecasting quality. Data are:
• collected at different levels of detail by departments, hindering comparisons; and
• reported at a level that does not help teams identify volatility at project level.
5.30 Its 2012 Internal Audit Report noted that some departments saw no reason to prioritise HM Treasury’s data requirements and provided late or inaccurate financial returns. The subsequent introduction of OSCAR was intended to reduce the burden and improve the quality of data submissions. HM Treasury also uses league tables of the quality and timeliness of OSCAR data, including comparisons of in-year forecasts to outturn for control total spending. Such high-level analysis may identify areas for further examination, but alone is unlikely to detect poor forecasting.
5.31 Spending teams supplement OSCAR with other information, including regular contacts with officials, board papers and management information. However, HM Treasury’s internal audit noted that teams rely on ad hoc data and lack a consistent approach.
5.32 We have previously noted that spending teams’ skills vary and that departments have found HM Treasury to be insufficiently joined up.41 Spending teams need:
• the information and skills to challenge departments’ programme and project forecasts;
• to work collaboratively and share lessons; and
• to liaise with colleagues who handle financial reporting.
5.33 The Cabinet Office told us that they are working with spending teams to encourage them to use management information to compare departments’ expenditure and performance on common areas of spend such as IT and Estates.

Forecasting in government to achieve value for money Part Five 49
5.34 As part of their Spending Control Change Programme HM Treasury is establishing a new unit to improve data quality and to support spending teams’ use of OSCAR. This is a positive development and an opportunity to raise teams’ ability to challenge departments’ forecasts. Without more informed challenge by spending teams we expect the pattern of broadly accurate aggregate forecasts, but poor quality programme-level forecasts, to continue.
Leadership from the centre of government
5.35 Although HM Treasury leads on forecasting, others have a role in driving good practice:
• The Cabinet Office, through the Efficiency and Reform Group, supports departments to deliver savings. It provides guidance on programme and portfolio management through the Major Projects Authority (MPA), which also oversees major project assurance and is responsible for improving project delivery capability through the Major Projects Leadership Academy.
• The Cabinet Office and HM Treasury jointly oversee government’s policy on improving the use of management information, and the Cabinet Office is accountable for driving up officials’ commercial capability.
• The Finance Leadership Group (FLG), which brings together senior finance managers, aims to improve financial professionalism through its Finance Transformation Programme. The FLG recently announced that all departments will assess their financial management over the next two years against a framework that includes forecasting.42
5.36 All three groups need to work together to deliver an improvement in forecasting across government, and avoid the tendency we have previously noted for the Cabinet Office and HM Treasury to operate separately.43 HM Treasury’s review of financial management capability recognises the need to improve the way the Cabinet Office and HM Treasury work together.

50 Appendix One Forecasting in government to achieve value for money
Appendix One
Our audit approach
1 Our report considered the extent to which government departments produce and use forecasts effectively to understand their future financial position and manage associated risks. We focused on the forecasting of departmental expenditure limits (DEL) from the point of view of producers and users, as well as on the role of central government in influencing forecasting behaviours.
2 We considered the role and importance of good forecasting and established an evaluative framework. We then assessed:
• the extent to which production of forecasts relevant to DEL spending reflects good practice;
• whether the use by government of forecasts relevant to DEL spending reflects good practice; and
• the impact of the wider environment on the government producing and using forecasts relevant to DEL spending.
3 Our audit approach is summarised in Figure 22. Our evaluative framework and evidence base are described in Appendix Two.

Forecasting in government to achieve value for money Appendix One 51
Figure 22Our audit approach
The objective of government
How this will be achieved
Our study
Our evaluative criteria
Our evidence
(see Appendix Two for details)
Our conclusions
Back catalogue
Spending data
Private sector experience
Survey of finance directors
Focus groups with senior analysts
Back catalogue
Private sector experience
Survey of analysts
Survey of finance directors
Focus groups with senior analysts
Back catalogue
Private sector experience
Spending data
Guidance
Survey of finance directors
Focus groups with senior analysts
Interviews with officials in HM Treasury and the Cabinet Office
Back catalogue
Private sector experience
Survey of analysts
Survey of finance directors
Focus groups with senior analysts
Case studies
What is the role and importance of forecasting?
Forecast production: Do forecasts have clear aims; are they conducted by skilled staff with appropriate resources, data and assumptions?
Are they presented so decision-makers can understand the level of uncertainty?
The use of forecasts: Can decision-makers challenge forecasts, and use them to make evidence-based decisions with appropriate risk management?
Do analytical, financial and policy functions liaise closely?
Is the departmental environment supportive of forecasting?
Does the centre of government provide leadership in driving up the quality of forecasting?
What is the impact of the budgetary system?
Good forecasts are a key element of effective financial management and should help government make informed spending decisions that represent value for money. HM Treasury has an objective for government to strengthen its approach to monitoring spending and improving forecasting. It has also identified a need to extend best practice in modelling across the whole of government.
HM Treasury designs and manages the government’s budgetary system, including the spending control framework, and provides guidance to departments. Specifically, HM Treasury has recently put in place:
• new incentives to encourage more accuracy in spending forecasts; and
• requirements to improve the quality assurance of modelling for critical business models.
This report examined the production and use of forecasts to inform government departments’ decisions on resource and capital spending in light of HM Treasury’s aims, and against good forecasting practice.
High-quality expenditure forecasting is an essential element in achieving value for money for the taxpayer. Despite examples of good practice, our past work has identified many high-profile failures. Forecasting is not taken sufficiently seriously and is often hampered by poor quality data and unrealistic assumptions driven by policy agendas. Departments could improve the value for money they achieve by improving how they produce and use forecasts to manage individual projects and control aggregate spending. HM Treasury’s efforts to improve forecasting through incentives in the budgetary system are unlikely to prove effective given the pressure in the spending control framework to avoid overspending and deliver small underspends. Improvements to transparency and scrutiny are needed to enable HM Treasury and Parliament to assess more effectively the quality of departments’ financial management and the value delivered.

52 Appendix Two Forecasting in government to achieve value for money
Appendix Two
Our evidence base
1 We reached our independent conclusions on the production and use of forecasts when making decisions about departmental expenditure limit (DEL) spending following our analysis of evidence collected between February and September 2013.
2 We developed our good practice evaluative framework (Figure 23) by adapting our internal framework for assessing the quality of modelling, and by drawing on work we commissioned from one of our strategic partners, Deloitte, to identify transferable good practice lessons for both costing and forecasting from the private sector. Our audit approach is outlined in Appendix One.

Forecasting in government to achieve value for money Appendix Two 53
Figure 23Good practice in forecasting
AimsClearly defined andagreed purpose for the forecast; and how it will be developed and used in decisions
Wider environmentEconomic contextPolitical and strategic objectivesControl frameworkSupportive and collaborative corporate culture
Resource Forecasts are ideally underpinned by models which are proportionate, built logically, accurately and transparently by staff with appropriate skills and resources
Data Forecasts should ideally be built on accurate, timely and appropriate data, and employ accurate analysis
Testing Scenario and sensitivity analysis should be used to test by how much the forecasts change under different conditions
LearningActual outcomes are compared with forecasts to understand variance and any implications for policy and to improve future forecasts
Use Production
ApplicationDecision-makers combine forecasts with judgement and other factors to make evidence-based decisions and build appropriate levels of risk management into their plans
Collaboration Policy and operational users work closely with financial and analytical colleagues to understand and use forecasts in a collaborative and integrated way
Informed challenge Decision-makers should understand the forecasts and have the ability to challenge them – including the underpinning data and assumptions
CommunicationForecasts should be communicated clearly and reflect the level of uncertainty around any estimates. Where feasible, ranges rather than point estimates should be presented to decision-makers
Concept and design
Uncertainty and testing sensitivity
Making use of forecast
Development
Assumptions Data
Source: National Audit Offi ce framework
AssumptionsShould be documented with clear explanations as to why they are considered reasonable. Ownership of the assumptions should be clear and subject to critical review

54 Appendix Two Forecasting in government to achieve value for money
3 Our main evidence sources were:
• analysis of our back catalogue of published reports between January 2010 and July 2013, to identify and extract key relevant findings from studies that have considered forecasting;
• analysis of key central government documents, to understand the spending control framework as well as planned and actual spending, including: Consolidated Budgeting Guidance,44 Managing Public Money,45 Improving Spending Control,46 Budget 2013,47 and Spending Round 2013;48
• analysis of departmental spending data, to understand the extent to which forecasts, budgets and variance in actual spending against these are presented, including:
• data recorded on HM Treasury’s COINS (Combined Online Information System) and OSCAR (Online System for Central Accounting Reporting) data; and
• data in official publications, including: Public Expenditure Outturn White Paper (PEOWP) reports, Supplementary Estimates, Public Expenditure Statistical Analyses (PESA), and the Economic and Fiscal Outlooks (EFOs) published by the Office for Budget Responsibility.
• consideration of HM Treasury’s Review of quality assurance of government analytical models (the Macpherson review), to understand its findings and recommendations;49
• an online survey of departmental finance directors across government, to request their views on the production of forecasts, the use of forecasts in financial management and the role of the budgetary system. We received 11 responses from finance directors in the 15 main spending departments. For three further spending departments, we interviewed the finance director in place of their survey response;
• focus groups of senior analysts, to discuss their views on the key challenges in departments’ production and use of forecasts relevant to DEL spending and potential recommendations. In total, 12 senior analysts from 10 departments participated in the two focus groups we held;

Forecasting in government to achieve value for money Appendix Two 55
• case study work in two departments, to understand in greater depth:
• prison population forecasting in the Ministry of Justice and its use by the Ministry and the National Offender Management Service (NOMS) – based on analysis of key documents and interviews with analysts and senior officials in the Ministry and NOMS; and with the relevant spending team in HM Treasury; and
• the development of aggregate financial forecasts in the Department for Business, Innovation & Skills, based on analysis of key documents and interviews with the lead analyst and the Department’s finance director; as well as with the relevant spending team in HM Treasury.
• an online survey of analysts across government, to understand their experience of forecasting related to DEL spending and their views on the production and use of such forecasts and the key challenges involved. The target population for this survey was government analysts involved in forecasting relating to DEL. There was no prior information available on this group of staff, although as specialised analysts we expected that they would generally belong to one of the following three professional analytical networks:
• Government Economic Service (GES);
• Government Operational Service (GORS); or
• Government Statistical Service (GSS).
We also invited members of the Government Social Research (GSR) and Government Finance Profession (GFP) to participate. We developed the survey with the assistance of the professional analytical networks, who also helped with its distribution. A link to the online survey was emailed to each member of GES, GORS, GSS and GSR at Grade 6 or below (3,727 staff in total), giving all the opportunity to respond. Members of the GFP were also invited to participate through the GFP’s own website. The survey was anonymous, although we collected basic information about the respondent’s grade, department and professional field. Fieldwork took place between 28 February and 22 March 2013.
We received 146 responses in total to the survey, of which 107 were statisticians, operational researchers and economists. However, we screened out 61 respondents because they answered that they did not commission, produce or quality assure DEL forecasts. In most cases, therefore, the number of eligible respondents to our questions was 85 (of which 65 produced forecasts). For questions involving interaction with senior managers, we included responses from 8 of the 61 screened out respondents who had indicated that they presented forecasts to managers, so that the base for these questions was 93.

56 Appendix Two Forecasting in government to achieve value for money
The nominal response rate of 2 per cent is very low, although this largely reflects the fact that the majority of staff in the networks do not commission, produce or quality assure DEL forecasts. By its nature, the survey sample is self-selecting and it may not be representative of all staff who carry out forecasting. Of the 85 respondents who formed the basis for most of our analysis, 63 belonged to the four analytical professions and 22 belonged to the GFP. Of all the professions, GORS had the highest proportion of responses (26 members, 6.1 per cent of membership at Grade 6 and below) and GSR the least (1 member, 0.1 per cent of membership at Grade 6 and below), reflecting our expectations about likely involvement in DEL forecasting for members of these professions.
Wherever possible, we triangulated findings from our survey with other primary sources of evidence, such as views expressed at our focus groups and by finance directors as well as secondary evidence such as our back catalogue review.
• analysis of good practice in the private sector commissioned from Deloitte and comprising desk-based research, interviews with subject matter experts, input from private sector attendees at the Deloitte Cost Management Forum, plus case studies of five private sector organisations;
• interviews with senior officials and spending team members in HM Treasury for our case study departments, to understand their role in relation to receipt and consideration of departments’ forecasts and HM Treasury’s recent actions in relation to DEL forecasting; and
• interviews with officials at the Cabinet Office, to understand its role in relation to DEL forecasting.
4 We identified the role and importance of forecasting by drawing on:
• our back catalogue to identify examples of good and poor practice;
• our consideration of central government documents on the scale of spending;
• the Macpherson review of the quality assurance of modelling;
• Deloitte’s work identifying experiences and good practice in the private sector;
• the views expressed by finance directors in our survey of them and in semi-structured interviews we conducted with them; and
• the views expressed by senior analysts at the focus groups we conducted.
5 We assessed the production and use of forecasts in departments by drawing in particular on:
• our back catalogue review, to identify illustrative examples;
• Deloitte’s work identifying experiences and good practice in the private sector;

Forecasting in government to achieve value for money Appendix Two 57
• the results of our online survey of analysts engaged in commissioning, producing or quality assuring DEL forecasts;
• the views expressed by senior analysts at the focus groups we conducted;
• the views expressed by finance directors in our survey of them and in semi-structured interviews we conducted with them; and
• detailed consideration of our case studies.
6 We assessed the departmental environment for forecasting by drawing in particular on:
• our back catalogue review, to identify illustrative examples;
• Deloitte’s work identifying experiences and good practice in the private sector;
• the results of our online survey of analysts engaged in commissioning, producing or quality assuring DEL forecasts;
• the views expressed by finance directors in our survey of them and in semi-structured interviews we conducted with them; and
• the views expressed by senior analysts at the focus groups we conducted.
7 We considered the role of the centre of government by drawing in particular on:
• our back catalogue review, to identify illustrative examples;
• Deloitte’s work identifying experiences and good practice in the private sector;
• the views expressed by senior analysts at the focus groups we conducted;
• the views expressed by finance directors in our survey of them and in semi-structured interviews we conducted with them;
• our consideration of the Macpherson review;
• our analysis of departmental spending data recorded on COINS, OSCAR and in other official publications;
• our semi-structured interviews with officials in HM Treasury responsible for the systems used by spending teams to monitor spending (COINS/OSCAR);
• our semi-structured interviews with officials in the spending teams for the Ministry of Justice and the Department for Business, Innovation & Skills; and
• our interviews with officials at HM Treasury and the Cabinet Office.
58 Appendix Three Forecasting in government to achieve value for money
Appendix Three
Figure 4 source references
1 Comptroller and Auditor General, The Mortgage Rescue Scheme, Session 2010–2012, HC 1030, National Audit Office, May 2011.
2 Comptroller and Auditor General, Managing the expansion of the academies programme, Session 2012-13, HC 682, National Audit Office, November 2012.
3 Comptroller and Auditor General, The completion and sale of High Speed 1, Session 2010–2012, HC 1834, National Audit Office, March 2012.
4 Comptroller and Auditor General, Management of the Typhoon Project, Session 2010-11, HC 755, National Audit Office, March 2011.
5 Comptroller and Auditor General, Child Maintenance and Enforcement Commission: Cost Reduction, Session 2010–2012, HC 1793, National Audit Office, February 2012.
6 Comptroller and Auditor General, Handling telephone enquiries, Session 2009-10, HC 211, National Audit Office, January 2010.
7 Comptroller and Auditor General, Capital funding for new school places, Session 2012-13, HC 1042, National Audit Office, March 2013.

Forecasting in government to achieve value for money Appendix Four 59
Appendix Four
Illustrative examples of forecasting
1 We use our back catalogue to provide illustrative historic examples from recent years where forecasting was an issue. In most cases, forecasting was only one of many issues and departments may have subsequently acted to address any concerns raised.
2 Our review identified a range of examples of good and poor forecasting. We describe some of these below, according to the relevant parts in our report.
Part One
Examples of good practice
3 In our 2012 report on Financial management in the Home Office,50 we noted that the Department regularly reviewed spending, reporting outturn and forecasts to the board. In 2009-10, its resource accounts had been qualified due to an excess vote, after police forces provided poor estimates of the funding needed to cover in-year cash deficits on police pension funds. In an example of partnership working, the Department had since worked closely with forces to improve financial forecasts.
4 In 2011, we reported how the Department for Education had taken a cautious approach and employed experts in its forecasts for the government’s policy to require young people to continue participating in education and training until the age of 18.51 We concluded that the analysis was thorough and comprehensive, compared with the quality of analysis across government that we assessed previously. We did, however, note that the Department should have included the results of its sensitivity analysis in the published impact assessment to bring them more readily to the attention of decision-makers. We also criticised the Department for not retaining the data and information used in its analysis in an accessible form, to support monitoring and evaluation of the policy.
5 In our 2011 report on Regulating financial sustainability in higher education, we examined the model developed by the Funding Council to identify institutions that may face a ‘going concern’ risk during the transition phase to a new funding regime and in the longer term.52 Its modelling included assumptions on student demand, fee levels, public funding from a variety of sources, and other changes such as student finance for part-time students currently being developed by the government. We found the model to be reasonably comprehensive, covering a wide range of the known risk factors, although there was scope to develop it further by, for instance, modelling other scenarios.

60 Appendix Four Forecasting in government to achieve value for money
6 In our 2010 study on changes to public sector pensions, we reviewed the Government Actuary’s Department modelling of public service pension payments over the next 50 years.53 We concluded that it had exercised appropriate controls and checks in developing its model, managing data and reviewing outputs. Its assumptions were cumulatively reasonable, based on reliable data sources and scheme experience, and appropriate for the type of model. However, we also noted shortcomings in the extent of sensitivity analysis conducted by HM Treasury in modelling changes to the schemes, such as changes in workforce size or impacts on tax receipts. This meant that overall costs to taxpayers differ from current projections.
7 In our 2012 report on the Animal Health and Veterinary Laboratories Agency, we found that the Agency had taken a reasonable approach in its modelling and forecasting of staff cost savings from its business reform programme.54
8 Our 2012 report on managing change in the defence workforce noted that the Ministry of Defence had developed good models and tools that had helped it to profile the numbers of headcount cuts required to reduce its workforce by over 54,000 personnel, and the predicted savings.55 The Ministry was regularly reviewing and revising its analysis to keep it updated.
9 Our report in 2012 on the government’s long-term plans for energy delivery noted that despite inherent difficulties in predicting how the electricity sector would look in 2050, the Department of Energy and Climate Change had modelled illustrative ‘pathways’ and published an online ‘calculator’ for people to model options and their implications for greenhouse gas emissions and costs. In its modelling of pathways to 2050, it regularly tested its approach and key assumptions against those used by other bodies and used a range of models so it was not reliant on one approach.56
Impacts of poor forecasting at the aggregate level
10 In our report on financial management in the Department for Culture, Media & Sport,57 we noted its history of overcommitting budgets to its arm’s-length bodies, and that it tended to increase direct intervention towards the end of the year as outturns became clearer.

Forecasting in government to achieve value for money Appendix Four 61
Part Two
Data and assumptions
11 In our 2012 report on the Child Maintenance and Enforcement Commission, we considered its complex reforms to raise income through the introduction of an upfront application fee and a surcharge on money transfers between parents.58 It estimated implementation costs of £598 million which would be more than offset by savings. However, we considered that the Commission’s model was not based on reliable data and prudent assumptions. The value of forecast savings had fallen markedly because the expected costs of running the existing scheme had declined to the point where they were below the expected costs of implementing and running the new scheme. There was also a risk that the new scheme would cost more than budgeted to implement. For instance, the Commission had not estimated the cost of more families going to court to agree child maintenance arrangements instead of using the new scheme, because it believed that the numbers would be negligible.
12 In our 2013 report on the Department for Communities and Local Government’s New Homes Bonus policy, we found that the Department’s modelling was insufficiently reliable.59 It used unrealistic assumptions, based on very limited evidence of local authorities’ actual behaviour. The Department did not consider a sufficient range of scenarios: a more sophisticated assessment of how local authorities in different situations might react would have allowed a more reliable estimate of the potential impact on housing supply. The model was also sensitive to changes in the underpinning assumptions, but the Department did not do a sensitivity analysis. The Department had no plans to use modelling to compare estimated impact with actual results.
13 Our 2013 study into the provision of capital for increasing the number of school places found that the Department for Education had underestimated the extra demand resulting from an increasing birth rate.60 Gaps in its evidence on local demand and capacity, the costs of providing places, and local authorities’ financial contributions meant that it could not present a fully robust bid for funding at Spending Review 2010.
14 In our report on how the former UK Border Agency implemented its student visa system, we noted that when it introduced new criteria for sponsors, it lacked the data to model how well the criteria might work in practice and it did not know how realistic its assessment was.61 The Agency had not modelled how all the additional requirements it had introduced would interact with each other to impact on student numbers.

62 Appendix Four Forecasting in government to achieve value for money
Quality assurance
15 In our 2013 report on High Speed 2, we noted that the calculation of the benefit–cost ratio for phase one had twice contained errors in passenger demand forecasting.62 One of these errors had substantial implications for the business case – cutting forecast benefits by nearly £8 billion. The Department for Transport had only carried out limited challenge of modelling outputs and had been slow to respond to issues raised by internal and external assurance. The Department told us that it has since made significant improvements to its assurance of analytical outputs and, in line with recommendations from the Macpherson review of quality assurance of government models, employs an analytical assurance framework across all business areas.
Presentation of forecasts
16 In our 2011 report on financial management in the Department for Culture, Media & Sport, we concluded that board submissions should include further financial information that might be useful to them in understanding what flexibility there was to reallocate resources, particularly towards the end of the financial year.63
Part Three
Demand for forecasts
17 Our report on central government’s skills requirements noted how a 2010 report conducted for the Permanent Secretaries Management Group had highlighted the issue of data quality in workforce planning. Jobcentre Plus used sophisticated modelling to combine detailed process management data for key front-line and contact centre tasks with regional economic indicators to predict how many staff will be needed and where. By contrast, in other organisations, determining staffing levels in policy teams was ‘more art than science’, with business units themselves developing a staffing structure based on a given budget, which was then subject to internal challenge.
Informed Challenge
18 The seven UK Research Councils agreed with the Department for Business, Innovation & Skills to work in partnership to harmonise back-office activities via a shared service centre.64 The project cost £130 million against an original budget of £79 million – a 65 per cent overspend – with projected savings significantly less than expected. The financial case relied heavily on generating 85 per cent of the gross savings from better procurement. These projections were inherently uncertain and did not take into account potential savings from existing joint procurement. The financial analysis failed to prompt a re-evaluation of available options.

Forecasting in government to achieve value for money Appendix Four 63
Part Four
Managing time pressures
19 The Department for Education gave urgent priority to its academies programme, introducing the Academies Bill within a month of the government taking office.65 The Department’s decision to expand the programme at pace presented a number of significant challenges. It initially underestimated demand and costs, omitted some costs, and made simplistic assumptions about some funding elements. Its cost modelling improved, but remained incomplete at the time of the 2010 Spending Review. Rapid cost growth led to pressures on the Department’s wider financial position, requiring it to transfer funding from other budgets to manage the resultant risks. By May 2011, it was forecasting a £500 million overspend for 2011-12. To remain within overall spending limits without restricting the pace or scale of the expansion, it used additional contingency funding of £105 million in 2011-12. It also reassigned money from other budgets, including around £84 million of previously allocated discretionary funding in 2010-11, and £160 million in 2011-12.
Optimism bias and pressure for supportive analysis
20 The failure of FiReControl was based on unrealistic estimates of project costs and expected local savings, and a lack of sector buy-in. However, there were other issues including the under-appreciation of the complexity of the IT involved. FiReControl would have wasted about £469 million. The Department for Communities and Local Government has informed us that it has learned from this experience and, following the closure of the project, is supporting the delivery of locally-planned solutions and has allocated £81 million of funding. The Department is working collaboratively with the main stakeholders to provide assurance on value for money going forward.66
21 In our 2012 report on Peterborough and Stamford Hospitals NHS Foundation Trust, we found that the Trust board developed, and enthusiastically supported, an unrealistic business case for the new hospital that incorporated overly optimistic financial projections.67 Monitor, the foundation trust regulator, had raised well-founded concerns about the realism of the Trust’s forecast that its financial performance would be as strong as any foundation trust in the country. It was also concerned that, compared with the Department of Health’s published guidance on financial assumptions the Trust’s financial model underestimated the rate of pay and non-pay inflation, and overestimated the tariff payments from commissioners. However, neither the Trust board nor the Department addressed these concerns fully before approval of the business case. The Trust’s poor financial management had left it in a critical financial position. In 2011-12, the Trust’s in-year deficit was £46 million and in 2012-13 it was £39 million.

64 Endnotes Forecasting in government to achieve value for money
Endnotes
1 Comptroller and Auditor General, Financial management in government, Session 2013-14, HC 131, National Audit Office, June 2013; National Audit Office, Evaluation in Government, December 2013.
2 Driving Profitability in Turbulent Times with Agile Planning and Forecasting. Prepared by CFO Research Services in collaboration with SAP and Deloitte, May 2009.
3 Comptroller and Auditor General, Department for International Development – Financial Management Report, Session 2010–2012, HC 820, National Audit Office, April 2011.
4 HM Treasury, Review of quality assurance of government analytical models: final report, March 2013.
5 HM Treasury, Budget 2013, HC 1033, March 2013.
6 Comptroller and Auditor General, Child Maintenance and Enforcement Commission: Cost Reduction, Session 2000–2012, HC 1793, National Audit Office, February 2012.
7 Ministry of Justice, Prison Population Projections 2013–2019 England and Wales, November 2013.
8 Comptroller and Auditor General, High Speed 2: A review of early programme preparation, Session 2013-14, HC 124, National Audit Office, May 2013.
9 HM Treasury, The Green Book – Appraisal and Evaluation in Central Government, 2003.
10 Comptroller and Auditor General, Option Appraisal: Making informed decisions in government, National Audit Office, July 2010.
11 Comptroller and Auditor General, Increasing passenger rail capacity, Session 2010-11, HC 33, National Audit Office, June 2010.
12 Comptroller and Auditor General, Lessons from cancelling the InterCity West Coast franchise competition, Session 2012-13, HC 796, National Audit Office, December 2012.
13 Comptroller and Auditor General, The New Homes Bonus, Session 2012-13, HC 1047, National Audit Office, March 2013.
14 Comptroller and Auditor General, High Speed 2: A review of early programme preparation, Session 2013-14, HC 124, National Audit Office, May 2013.
15 Comptroller and Auditor General, Handling telephone enquiries, Session 2009-10, HC 211, National Audit Office, January 2010.

Forecasting in government to achieve value for money Endnotes 65
16 Comptroller and Auditor General, Customer service performance, Session 2012-13, HC 211, National Audit Office, December 2012.
17 Comptroller and Auditor General, Ministry of Defence – The Major Projects Report 2012, Session 2012-13, HC 684-I, National Audit Office, January 2013; Ministry of Defence – The Major Projects Report 2012 Appendices and Project Summary Sheets, Session 2012-13, HC 684-II, National Audit Office, January 2013.
18 Comptroller and Auditor General, The completion and sale of High Speed 1, Session 2010–2012, HC 1834, National Audit Office, March 2012.
19 Comptroller and Auditor General, The introduction of the Work Programme, Session 2010–2012, HC 1701, National Audit Office, January 2012.
20 Comptroller and Auditor General, Reducing Costs in HM Revenue & Customs, Session 2010–2012, HC 1278, National Audit Office, July 2011.
21 Comptroller and Auditor General, Progress on reducing costs, Session 2012-13, HC 889, National Audit Office, February 2013.
22 HM Treasury, Review of financial management in government, 2013.
23 National Audit Office, Evaluation in Government, December 2013.
24 Comptroller and Auditor General, Department for Business, Innovation & Skills: Financial management report, Session 2012-13, HC 507, National Audit Office, July 2012.
25 Comptroller and Auditor General, Managing budgeting in government, Session 2012-13, HC 597, National Audit Office, October 2012.
26 PricewaterhouseCoopers, Good budgetary processes: comparators – case studies from the public and private sector, October 2012.
27 Comptroller and Auditor General, The Mortgage Rescue Scheme, Session 2010–2012, HC 1030, National Audit Office, May 2011.
28 HM Treasury, Green Book supplementary guidance: optimism bias, April 2013.
29 HC Committee of Public Accounts, Assurance for major projects, Fourteenth Report of Session 2012-13, HC 384, September 2012.
30 Major Projects Authority, Annual report 2012-13, May 2013.
31 HM Treasury, Improving Spending Control, April 2012.
32 HM Treasury, Public Sector Business Cases using the Five Case Model: a Toolkit, 2007.
33 HM Treasury, Review of financial management in government, 2013.
34 Comptroller and Auditor General, Managing budgeting in government, Session 2012-13, HC 597, National Audit Office, October 2012.

66 Endnotes Forecasting in government to achieve value for money
35 Comptroller and Auditor General, Progress in improving financial management in government, Session 2010-11, HC 487, National Audit Office, March 2011.
36 HM Treasury, Investing in Britain’s future, June 2013.
37 Comptroller and Auditor General, Managing budgeting in government, Session 2012-13, HC 597, National Audit Office, October 2012; Edward Leigh MP and Dr John Pugh MP, Options to Improve Parliamentary Scrutiny of Government Expenditure, December 2012.
38 HM Treasury, Central government annual reports and accounts: consultation on simplifying and streamlining the presentation of annual reports and accounts, June 2013.
39 HM Treasury, Public Expenditure 2009-10: Provisional Outturn, July 2010.
40 Office for Budget Responsibility, Economic and Fiscal Outlook, March 2013.
41 Comptroller and Auditor General, Managing budgeting in government, Session 2012-13, HC 597, National Audit Office, October 2012.
42 Government Finance Profession, Putting finance at the heart of decision-making, July 2013.
43 Comptroller and Auditor General, Memorandum on the 2012 Civil Service Reform Plan, Session 2012-13, HC 915, National Audit Office, January 2013.
44 HM Treasury, Consolidated budgeting guidance from 2013-14, March 2013.
45 HM Treasury, Managing Public Money, July 2013.
46 HM Treasury, Improving Spending Control, April 2012.
47 HM Treasury, Budget 2013, HC 1033, March 2013.
48 HM Treasury, Spending Round 2013, Cm 8639, June 2013.
49 HM Treasury, Review of quality assurance of government analytical models: final report, March 2013.
50 Comptroller and Auditor General, Financial management in the Home Office, Session 2010–2012, HC 1832, National Audit Office, April 2012.
51 Comptroller and Auditor General, Raising the participation age: an assessment of the cost–benefit analysis, National Audit Office, July 2011.
52 Comptroller and Auditor General, Regulating financial sustainability in higher education, Session 2010-11, HC 816, National Audit Office, March 2011.
53 Comptroller and Auditor General, The impact of the 2007-08 changes to public service pensions, Session 2010-11, HC 662, National Audit Office, December 2010.
54 Comptroller and Auditor General, Improving the delivery of animal health and welfare services through the Business Reform Programme, Session 2012-13, HC 468, National Audit Office, July 2012.

Forecasting in government to achieve value for money Endnotes 67
55 Comptroller and Auditor General, Managing change in the Defence workforce, Session 2010–2012, HC 1791, National Audit Office, February 2012.
56 Comptroller and Auditor General, The government’s long-term plans to deliver secure, low carbon and affordable electricity, Session 2012-13, HC 189, June 2012.
57 Comptroller and Auditor General, Department for Culture, Media & Sport – Financial Management, Session 2010-11, HC 821, National Audit Office, March 2011.
58 Comptroller and Auditor General, Child Maintenance and Enforcement Commission: Cost Reduction, Session 2000–2012, HC 1793, National Audit Office, February 2012.
59 Comptroller and Auditor General, The New Homes Bonus, Session 2012-13, HC 1047, National Audit Office, March 2013.
60 Comptroller and Auditor General, Capital funding for new school places, Session 2012-13, HC 1042, National Audit Office, March 2013.
61 Comptroller and Auditor General, Immigration: The Points Based System – Student Route, Session 2010–2012, HC 1827, National Audit Office, March 2012.
62 Comptroller and Auditor General, High Speed 2: A review of early programme preparation, Session 2013-14, HC 124, National Audit Office, May 2013.
63 Comptroller and Auditor General, Department for Culture, Media & Sport – Financial Management, Session 2010-11, HC 821, National Audit Office, March 2011.
64 Comptroller and Auditor General, Shared services in the Research Councils, Session 2010–2012, HC 1459, National Audit Office, October 2011.
65 Comptroller and Auditor General, Managing the expansion of the academies programme, Session 2012-13, HC 682, National Audit Office, November 2012.
66 Comptroller and Auditor General, The failure of the FiReControl project, Session 2010-2012, HC1272, National Audit Office, July 2011.
67 Comptroller and Auditor General, Peterborough and Stamford Hospitals NHS Foundation Trust, Session 2012-13, HC 658, National Audit Office, November 2012.

This report has been printed on Evolution Digital Satin and contains material sourced from responsibly managed and sustainable forests certified in accordance with the FSC (Forest Stewardship Council).
The wood pulp is totally recyclable and acid-free. Our printers also have full ISO 14001 environmental accreditation, which ensures that they have effective procedures in place to manage waste and practices that may affect the environment.
Design and Production by NAO Communications DP Ref: 10341-001

Published by TSO (The Stationery Office) and available from:
Online www.tsoshop.co.uk
Mail, telephone, fax and email TSO PO Box 29, Norwich NR3 1GN Telephone orders/general enquiries: 0870 600 5522 Order through the Parliamentary Hotline Lo-Call 0845 7 023474 Fax orders: 0870 600 5533 Email: [email protected] Textphone: 0870 240 3701
The Houses of Parliament Shop 12 Bridge Street, Parliament Square, London SW1A 2JX Telephone orders/general enquiries: 020 7219 3890 Fax orders: 020 7219 3866 Email: [email protected] Internet: http://www.shop.parliament.uk
TSO@Blackwell and other accredited agents
£16.00
9 780102 987485
ISBN 978-0-10-298748-5