Embed Size (px)
Citation preview

0
1
Forecasting in a Down Economy: Lessons from VolkswagenJonathan SparksManager of Sales Planning & ForecastingManager of Sales Planning & Forecasting
Agenda• Introductions
• Company Background and Supply Chain Overview
• Industry Outlook in 2008
• How Recessions Affect Forecast Results
• Forecasting Techniques for a Down Economy
2
• Responding to the 2008 Recession
• Results and Next Steps

0
2
Company Overview• Volkswagen Group
• Headquartered in Wolfsburg, Germany• 99 factories in 27 countries• Delivered 8 265 million vehicles in 2011• Delivered 8.265 million vehicles in 2011• 12.3% global market share
Company Overview• Volkswagen of America• HQ in Herndon VA• HQ in Herndon, VA• 13 car product portfolio• 324,000 sales in 2011• 2.5% market share• Jetta #1 selling product• Jetta #1 selling product

0
3
Supply Chain Overview• 6 factories – Portugal, Germany, Mexico, Slovakia, US
• 4 Ports of Entry– Shipping methods :boat, air, rail, truck
5 R i l Offi• 5 Regional Offices– Wholesaling, marketing, incentives, network development
VW Forecast Overview (2008)• Long term forecasts (10 years) – volume and mix
– Lifecycle management– Industry projectionsy p j– Segment projections– Economic factors– Carline growth
• Short term forecasts (1‐2 years) – volume and mix– Statistical modeling from history– Subjective judgment– Regional feedback– Growth targets
6

0
4
2008 Industry Outlook
20
Industry Fcst
16
Sales U
nits (M
illions)
12
8
16.515.815.114.614.416.1
4
0201220112010200920082007
4
2008‐2011 Reality
‐19%‐23%29%
20
ActualIndustry Fcst
23%‐29%‐8% 16.5
12.8
15.8
11.6
15.1
10.4
14.613.2
14.4
16.116.1
Sales U
nits (M
illions)
16
12
8
2012201120102009200820070
4
0
5
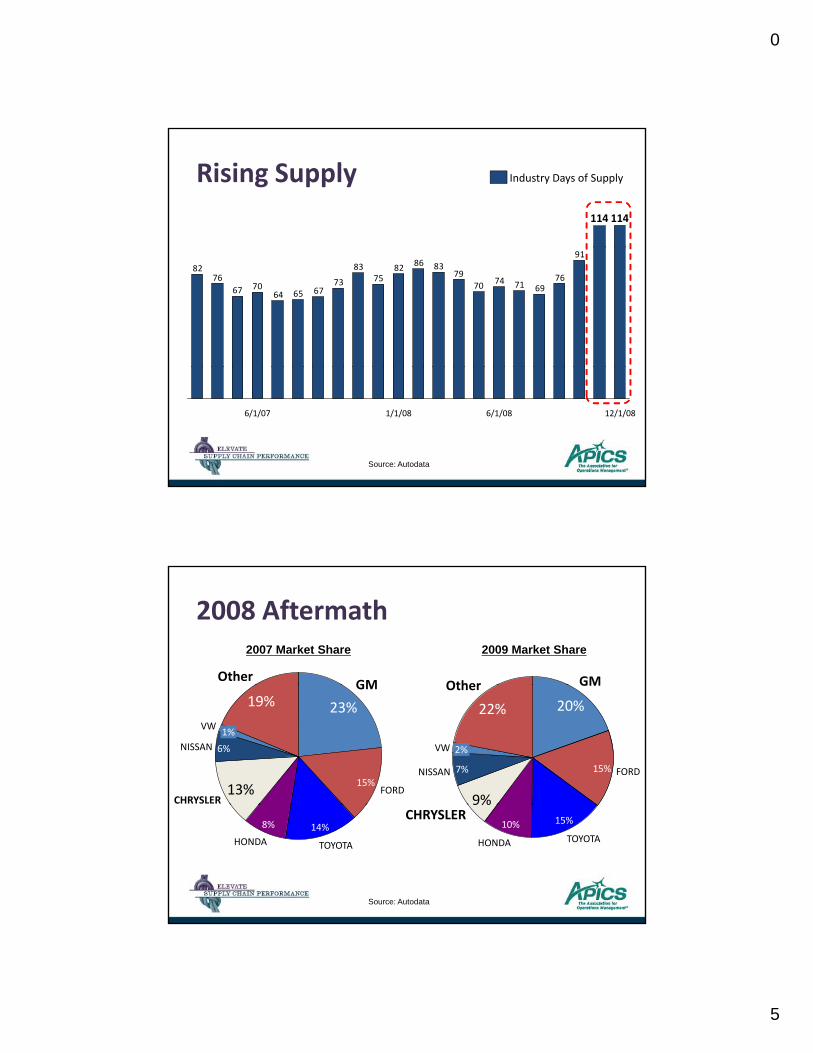
Rising Supply114114
Industry Days of Supply
91
7669717470
79838682
7583
73676564
706776
82
12/1/086/1/081/1/086/1/07
Source: Autodata
2008 Aftermath
GMOtherOther GM
2007 Market Share 2009 Market Share
13% FORD15%
GM
23%19%VW 1%
NISSAN 6%
CHRYSLER 9%
Other
22%
VW 2%
NISSAN 7% FORD15%
GM
20%
14%HONDA
8%
TOYOTA
9%CHRYSLER
HONDA
10%TOYOTA
15%
Source: Autodata

0
6
2008 Aftermath
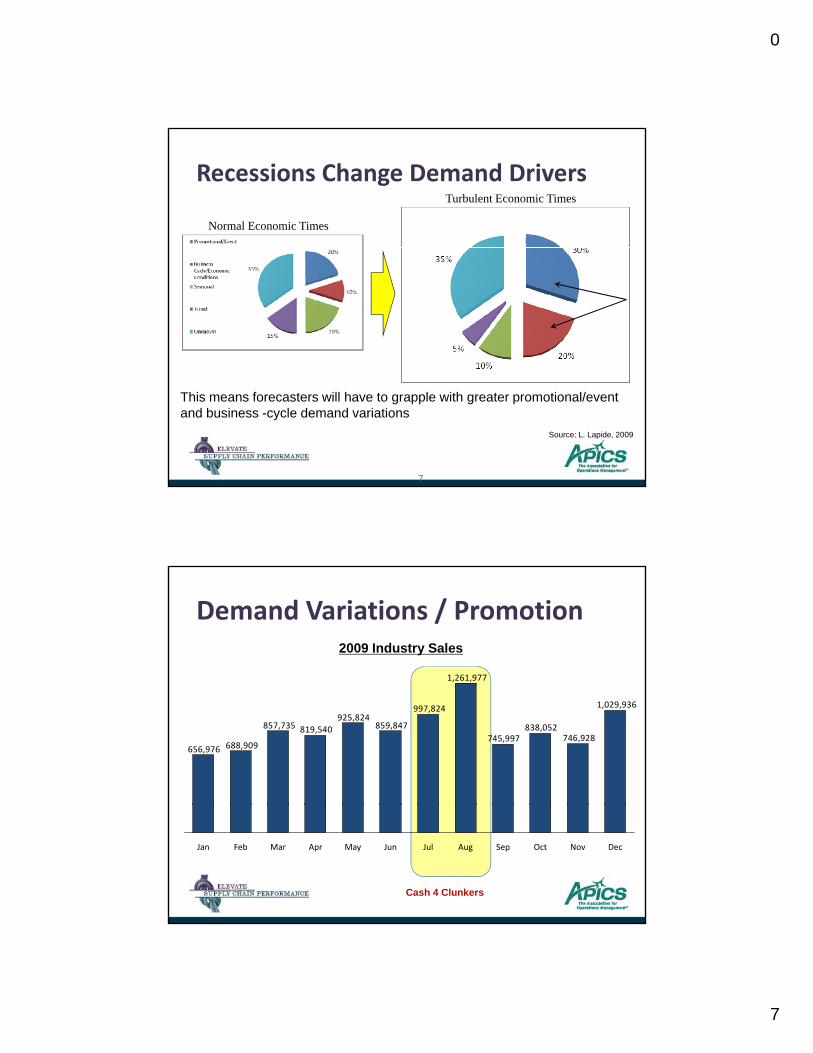
Demand Drivers
Percent of Demand Variation Analysis (Components of Demand Variation ) Source: L. Lapide, 2009
6
0
7
Normal Economic Times
Turbulent Economic Times
Recessions Change Demand Drivers
This means forecasters will have to grapple with greater promotional/event and business -cycle demand variations
Source: L. Lapide, 2009
7
Demand Variations / Promotion
1,261,977
2009 Industry Sales
1,029,936
746,928838,052
745,997
997,824
859,847925,824
819,540857,735
688,909656,976
Jan AugJulJunMayAprMarFeb Sep Oct Nov Dec
Cash 4 Clunkers
0
8
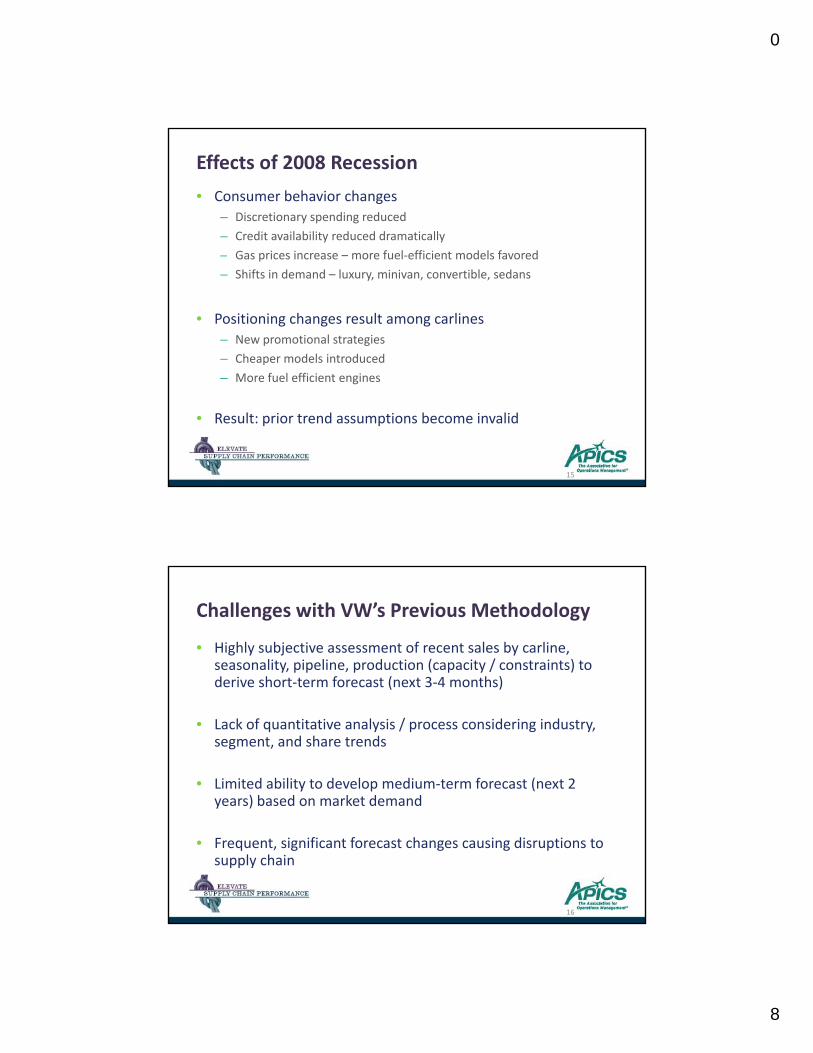
Effects of 2008 Recession• Consumer behavior changes
– Discretionary spending reduced– Credit availability reduced dramatically– Gas prices increase – more fuel‐efficient models favored– Shifts in demand – luxury, minivan, convertible, sedans
• Positioning changes result among carlines– New promotional strategies– Cheaper models introduced– More fuel efficient engines
• Result: prior trend assumptions become invalid
15
Challenges with VW’s Previous Methodology
• Highly subjective assessment of recent sales by carline, seasonality, pipeline, production (capacity / constraints) to derive short‐term forecast (next 3‐4 months)derive short term forecast (next 3 4 months)
• Lack of quantitative analysis / process considering industry, segment, and share trends
• Limited ability to develop medium‐term forecast (next 2 years) based on market demandyears) based on market demand
• Frequent, significant forecast changes causing disruptions to supply chain
16

0
9
Techniques for Turbulent Times1. Stay abreast of what is going on in the market
and organization2008 Situation
Finance IncentivesSales
Forecasting
Marketing
DistributionProduct Planning
Source: L. Lapide, 2009
Sales Forecasting
Techniques for Turbulent Times1. Stay abreast of what is going on in the market
and organization2012 Situation Forecasting
Marketing
Product
Distribution
Product Planning
Finance
Incentives
Source: L. Lapide, 2009

0
10
Techniques for Turbulent Times2. Collect timely downstream data as early
indicators of the performance of promotions and new products (e.g., point of consumption information)
Nissan AltimaHonda AccordFord Fusion
July Aug Sept Oct Nov Dec
27 28 29 30 31 32 33 34 35 36 37 38 39 40 41 42 43 44 45 46 47 48 49 50 51 52
Honda CivicNissan Sentra
Techniques for Turbulent Times3. Stay abreast of changing economic conditions,
listening to internal and external economists
50
100
150
Building Pe
rmits (Tho
usands)
Housing Starts
1
2
3
4
5
Avg. Fue
l Price
Fuel Prices
02007 20092008
02007 20092008
Source: US. Dept. of Commerce Source: US. Dept. of Energy
Source: L. Lapide, 2009

0
11
Techniques for Turbulent Times4. Minimize forecast uncertainty by placing more
focus on high volume and revenue‐generating segments
Source: L. Lapide, 2009
Techniques for Turbulent Times5. Use scenario and range forecasting to model
and represent forecast uncertainties‐Explore multiple forecasting methodsExplore multiple forecasting methods‐Measure effectiveness of each technique

0
12
Techniques for Turbulent Times6. Communicate forecast errors enterprise‐wide to
support risk management strategies in supply (e.g., hedging, buffering, and risk‐pooling)
• Incorporate into scorecard• Hold accountability with stakeholders• Identify largest errors and administer root cause analysis• Discuss with impacted team to mitigate for future
Techniques for Turbulent Times1. Stay on top of industry and departmental actions2. Look ahead for competitor actions that could impact
your business3. Look at economic conditions for leading indicators4. Evaluate your portfolio to focus on core revenue
generators5. Explore alternative forecasting methods and test results5 p o e a te at e o ecast g et ods a d test esu ts6. Communicate forecast errors and discuss root cause
0
13
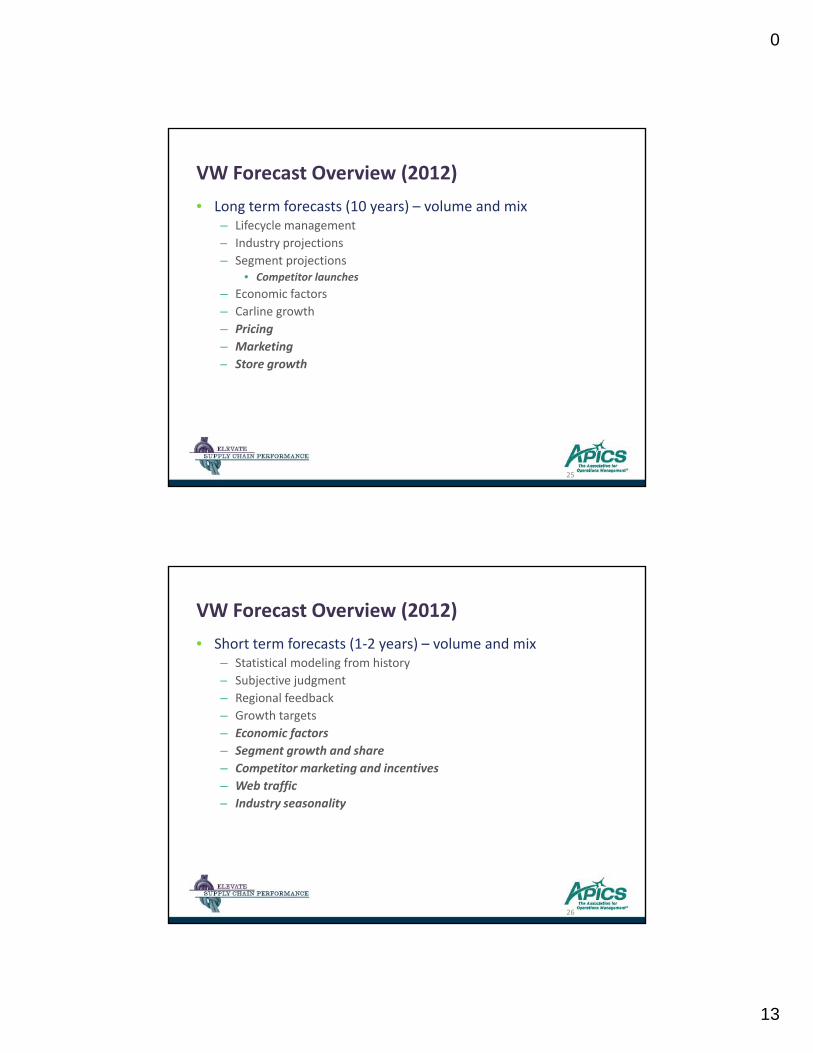
VW Forecast Overview (2012)• Long term forecasts (10 years) – volume and mix
– Lifecycle management– Industry projectionsy p j– Segment projections
• Competitor launches– Economic factors– Carline growth– Pricing– Marketing– Store growthStore growth
25
VW Forecast Overview (2012)• Short term forecasts (1‐2 years) – volume and mix
– Statistical modeling from history– Subjective judgmentj j g– Regional feedback– Growth targets– Economic factors– Segment growth and share– Competitor marketing and incentives– Web traffic– Industry seasonalityIndustry seasonality
26

0
14
VW Revised Methodology – Statistical
• Baseline forecast produced using alternative statistical methods and consensus agreementmethods and consensus agreement
• Seasonal lift factors are calculated by internal and external sales history
• Remove seasonal lift factors to calculate true trendline
• Overlay seasonal trends with moving average
27
Results
• Increased trend stability due to economic modeling
• Increased collaboration with stakeholders to determine shifts in market conditions
• Promotional programs developed to meet adjusted sales targets
• Marketing strategies adjusted to respond to changes in the market
28

0
15
Results
29
Thank you