Embed Size (px)
Citation preview

ISPRS Int. J. Geo-Inf. 2013, 2, 978-995; doi:10.3390/ijgi2040978OPEN ACCESS
ISPRS InternationalJournal of
Geo-InformationISSN 2220-9964
www.mdpi.com/journal/ijgi
Article
Forecast-Driven Enhancement of Received Signal Strength(RSS)-Based Localization SystemsPaolo Barsocchi 1,*, Stefano Chessa 1,2, Alessio Micheli 2 and Claudio Gallicchio 2
1 ISTI-CNR, Pisa Research Area, Via G.Moruzzi 1, Pisa 56124, Italy;E-Mail: [email protected]
2 Computer Science Department, University of Pisa, Largo B. Pontecorvo 3, Pisa 56127, Italy;E-Mails: [email protected] (A.M.); [email protected] (C.G.)
* Author to whom correspondence should be addressed; E-Mail: [email protected];Tel.: +39-50-315-2965; Fax: +39-50-315-2040.
Received: 12 July 2013; in revised form: 17 September 2013 / Accepted: 22 September 2013 /Published: 16 October 2013
Abstract: Real-time user localization in indoor environments is an important issue inambient assisted living (AAL). In this context, localization based on received signal strength(RSS) has received considerable interest in the recent literature, due to its low cost and energyconsumption and to its availability on all wireless communication hardware. On the otherhand, the RSS-based localization is characterized by a greater error with respect to othertechnologies. Restricting the problem to localization of AAL users in indoor environments,we demonstrate that forecasting with a little user movement advance (for example, whenthe user is about to leave a room) provides significant benefits to the accuracy of RSS-basedlocalization systems. Specifically, we exploit echo state networks (ESNs) fed with RSSmeasurements and trained to recognize patterns of user’s movements to feed back to theRSS-based localization system.
Keywords: ambient assisted living; localization systems; received signal strength;movement forecasting; echo state networks; wireless sensor networks

ISPRS Int. J. Geo-Inf. 2013, 2 979
1. Introduction
Wireless sensor networks (WSNs) are an important source of context information, which findimportant applications in smart environments and ambient assisted living (AAL) [1]. In theseapplications, WSNs can monitor various parameters of the user and his/her home, includingphysiological parameters, movements and activities [2]. Among all parameters of interest for AAL,user localization and tracking are some of the most important (it is essential to supply the AAL servicesin the appropriate location). Unfortunately, this cannot be achieved by the widely used, satellite-basedglobal positioning systems, since they do not achieve the required accuracy in indoor environments,where AAL applications typically operate. For this reason, most localization systems for AAL rely onWSN [3].
WSN-based solutions are constructed by deploying a set of fixed sensors (called anchors) in theuser environment and a sensor on the user itself (called the mobile), and they estimate the (unknown)location of the mobile with respect to the anchors, whose position is known. This estimation exploitsmeasurements of physical quantities related to beacon packets exchanged between the mobile and theanchors. Radio signal measurements are typically the received signal strength (RSS), the angle of arrival(AOA), the time of arrival (TOA) and the time difference of arrival (TDOA). Although AOA or TDOAcan guarantee high localization precision, they require specific and complex hardware. This is a majordrawback in particular in AAL applications, which are deeply involved with user monitoring and, thus,may suffer from complex and too invasive hardware. In this work, we consider localization-based onRSS, since it does not require any special hardware and is available in most standard wireless devices.Furthermore, the measurement of RSS has almost a null impact on power consumption, sensor size andcost, and for these reasons, it has received considerable interest in the recent literature [4].
Although simple, the RSS-based indoor localization algorithms are not sufficient by themselves, sinceRSS measurements are affected by noise, which makes localization information imprecise. This problemis due both to the multipath effects of indoor environments and to the fact that the body of the useraffects the radio signal propagation with irregular patterns, depending on the orientation of the user, theorientation of the antenna, etc.
An approach to improve the accuracy of RSS-based localization consists of exploiting contextinformation that might be produced by other sensors of AAL applications. For example, if the userturns on the light, the AAL system identifies the user position very precisely (although for a shorttime), and this information can be used to feed back to the localization system in order to adjust itsparameters and improve further measurements [4]. However, this improvement is only opportunistic,as the information used to feed back to the localization system is available only sporadically and in thepresence of appropriate sensors in the applications (e.g., on the doors, light switches, etc.).
In this work we take into consideration machine learning models to predict some activities of the userthat imply a specific position of the user in the environment, and we use this information to feed back tothe localization system. Specifically, we exploit recurrent neural networks (RNNs) [5] to process RSSinformation in order to predict whether the user is going to leave the current room, assuming that sucha decision depends on the user movement pattern. This information is then given to the localizationalgorithm, which, leveraging on it, improves the localization accuracy (Figure 1).

ISPRS Int. J. Geo-Inf. 2013, 2 980
Figure 1. The L3 system: The same received signal strength (RSS) data stream is used bothby the Prediction and the Localization subsystems. The output of the Prediction subsystemis the input to the Localization subsystem.
������������� ���
�
������������������ ������������
����� ����������
We present the results of a set of experiments in a real indoor environment aimed at producing asufficiently large dataset to be used for the training of an RNN, and we assess its accuracy in a predictiveclassification of user movement patterns and cost. In particular, we evaluate the cost in terms of thenumber of anchors that are necessary to achieve the desired accuracy in the prediction and in terms ofthe degree of independence of these predictions from errors in the actual deployment of the anchors,which has a direct impact on deployment costs. In our experiments, we show that our approach providesoptimal accuracy with four anchors, but it can already provide good accuracy, even with a single anchor.
Later, we present the results of experiments that leverage the proposed prediction system togetherwith an RSS localization algorithm, showing how the combination of these two elements increases theoverall accuracy of the RSS-based localization.
2. Related Works
In order to increase their accuracy, current RSS-based localization techniques exploit informationcoming from the surrounding environment. In [6], the authors describe an opportunistic RSS-basedlocalization method. The basic idea consists of allowing mobile users to opportunistically exchangelocation information when they happen to be in the radio range and to exploit this information in orderto improve their self-localization accuracy. The authors show that opportunistic localization paradigmis effective in enhancing the node’s localization accuracy in indoor environments, even though theperformance increment is strongly dependent on the node’s mobility patterns, the heterogeneity of theopportunistic nodes and the accuracy of the ranging.
Another approach, called COAL (Context Aware Localization) [7], exploits a different kind of contextinformation. In particular, COAL leverages the user programs (such as an ongoing event, seminarschedule or personal agenda) to facilitate the user localization. By employing this context information,the authors significantly reduce the localization frequency, thus reducing energy consumption, whilemaintaining a high degree of accuracy.

ISPRS Int. J. Geo-Inf. 2013, 2 981
Other approaches employ additional sensory data, such as sound and light, to identify a location [8].Learning techniques are often used to train the system and increase accuracy. Examples includeEEMSS [9] and CenceMe [10]. CenceMe combines the inference of the presence of mobiles usingsensor-enabled mobile phones with the information shared through social networking applications, suchas Facebook and MySpace.
In [4], the authors exploit context information produced by devices that monitor the user activitiesas part of AAL applications. Such devices provide information about opening/closing of refrigerators,doors or light switches.
Differently from the above works, in our approach, we do not use additional sources of information,but we simply rely on the same RSS information that is used for localization to infer by anRNN additional information that is localization-related and use this information to feed back to thelocalization system.
3. L3—AAL Localization and Learning
The proposed L3 system is composed of two subsystems, namely, the Prediction subsystem and theLocalization subsystem. The Prediction subsystem (described in Section 3.1) is based on the ReservoirComputing paradigm, while the Localization subsystem (described in Section 3.2) exploits a well-knowntrilateration algorithm. In practice, the key idea is to predict the user movements in order to provide tothe localization algorithm the knowledge about the room in which the user is entering. This knowledgeis leveraged by the localization system as an additional input.
3.1. The Prediction Subsystem
Reservoir Computing (RC) is a computational paradigm covering several models in the recurrentneural network (RNN) family, which are characterized by the presence of a large and sparselyconnected hidden reservoir layer of recurrent non-linear units, which are read by means of someread-out mechanism, i.e., typically a linear combination of the reservoir outputs. With respectto traditional RNN training, where all weights are adapted, RC performs learning mainly on theoutput weights, leaving those in the reservoir untrained. As other RNNs, RC models are wellsuited for modeling of dynamical systems and, in particular, for temporal data processing. As themovement prediction problem discussed in this paper is, from a machine learning perspective, atime-series prediction task, we are naturally interested in analyzing and discussing the effectivenessof the RC paradigm on such a scenario. In particular, we focus on the computationally-efficientecho state networks (ESNs) [11–13], which are one of the best-known RC models, which arecharacterized by an input layer of NU units, a hidden reservoir layer of NR untrained recurrentnon-linear units and a readout layer of NY feed-forward linear units (see Figure 2). Within atime-series prediction task, the untrained reservoir acts as a fixed non-linear temporal expansion function,implementing an encoding process of the input sequence into a state space where the trained linearreadout is applied. Standard ESN reservoirs are built from simple additive units with a sigmoid activationfunction that, however, has been shown to weakly model the temporal evolution of slow dynamicalsystems [14]. In particular, [5] have shown that indoor user movements can be best modeled by a leaky

ISPRS Int. J. Geo-Inf. 2013, 2 982
integrator type of RC network (LI-ESNs) [14]. Given an input sequence s = [u(1), . . . ,u(n)] overthe input space, RNU , at each time step t = 1, . . . , n, the LI-ESN reservoir computes the followingstate transition:
x(t) = (1− a)x(t− 1) + af(Winu(t) + Wx(t− 1)) (1)
where x(t) ∈ RNR denotes the reservoir state (i.e., the output of the reservoir units) at time step t,Win ∈ RNR×NU is the input-to-reservoir weight matrix (possibly including a bias term), W ∈ RNR×NR
is the (sparse) recurrent reservoir weight matrix and f is the component-wise applied activation functionof the reservoir units (we use f ≡ tanh). The temporal recursion in Equation (1) is based on a null initialstate, i.e., x(0) = 0 ∈ RNR . The term, a ∈ [0, 1], is a leaking rate parameter, which is used to controlthe speed of the reservoir dynamics, with small values of a resulting in reservoirs that react slowly to theinput [13,14]. Compared to the standard ESN model, LI-ESN applies an exponential moving average tothe state values produced by the reservoir units (i.e., x(t)), resulting in a low-pass filter of the reservoiractivations that allows the network to better handle input signals that change slowly with respect to thesampling frequency. LI-ESN state dynamics are therefore more suitable for representing the history ofinput signals.
Figure 2. The architecture of an echo state network (ESN): Win, W and Wout denote theinput, the reservoir and the output weights, respectively. The terms, u(t) and y(t), identifythe input at time t and the corresponding predicted read-out; x(t) is the associated reservoirstate. Further details are given in the text.
Win Wout
W^u(t ) y (t )x (t )
ReadoutInput Reservoir
For a binary classification task over sequential data, the linear readout is applied only after theencoding process computed by the reservoir is terminated, by using:
y(s) = sgn(Woutx(n)) (2)
where sgn is a sign threshold function returning +1 for non-negative arguments and −1, otherwise,y(s) ∈ {−1,+1}NY is the output classification computed for the input sequence, s, and Wout ∈ RNY ×NR
is the reservoir-to-output weight matrix (possibly including a bias term).The reservoir is initialized to satisfy the so-called Echo State Property (ESP) [11]. The ESP asserts
that the reservoir state of an ESN driven by a long input sequence only depends on the input sequenceitself. Dependencies on the initial states are progressively forgotten after an initial transient (the reservoirprovides an echo of the input signal). A sufficient and a necessary condition for the reservoir initialization

ISPRS Int. J. Geo-Inf. 2013, 2 983
is given in [11]. Usually, only the necessary condition is used for reservoir initialization, whereas thesufficient condition is often too restrictive [11]. The necessary condition for the ESP is that the systemgoverning the reservoir dynamics of Equation (1) is locally asymptotically stable around the zero state,0 ∈ RNR . By setting W = (1−a)I + a W, where a is the leaking rate parameter, the necessary conditionis satisfied whenever the following constraint holds:
ρ(W) < 1 (3)
where ρ(W) is the spectral radius of W. Matrices Win and W are therefore randomly initialized froma uniform distribution, and W is successively scaled, such that Equation (3) holds. In practice, valuesof ρ close to one are commonly used, leading to reservoir dynamics close to the edge of chaos, oftenresulting in the best performance in applications (e.g., [11]).
In sequence classification tasks, each training sequence is presented to the reservoir for a number ofNtransient consecutive times, to account for the initial transient. The final reservoir states correspondingto the training sequences are collected in the columns of matrix X, while the vector, ytarget, contains thecorresponding target classifications (at the end of each sequence). The linear readout is therefore trainedto solve the least squares linear regression problem:
min ‖WoutX− ytarget‖22 (4)
Usually, Moore-Penrose pseudo-inversion of matrix X or ridge regression are used to train thereadout [13].
3.2. The Localization Subsystem
In order to take into account the knowledge coming from the Prediction subsystem about the roomin which the user is or he/she is entering, we consider two localization algorithms, one based onmultilateration and the other one based on fingerprinting, which uses least mean squares (LMS inthe following). Each of these algorithms may be augmented with context information. The modifiedalgorithms use the output of the Prediction subsystem in order to establish the room where the usercurrently is in at any moment. An example of how the multilateration algorithm works is shown inFigure 3 (for the sake of simplicity, this figure is depicted disregarding the effect of the wall attenuation).The three anchors, a1, a2 and a3, with a greater RSS are selected, and only two out of the six intersectionpoints (I1 and I2) are considered, since they are in the room indicated by the Prediction subsystem. Theintersection points are treated as point masses, and the mobile position M is then estimated, evaluatingthe centroid of all masses. Of course there exists a chance that all the intersection points are outside theroom (however, this never happened in all our experiments). In this case, the input data are not consistentand, depending on the requirements of the localization system, there are different possible alternatives;for example, the system may return an inconsistency or it may return the last known position, etc.
The LMS algorithm, on the other hand, exploits an RSS map of the environment that is computedduring the deployment of the localization system. This map is a list of pairs <coordinate, RSS tuple> that,for a given point of coordinates (x, y) in the environment, expresses an N-tuple of RSS measurementsamong each of the N anchors, ai, and the mobile at that point. Typically, this list is computed at the

ISPRS Int. J. Geo-Inf. 2013, 2 984
nodes of a regular grid in the environment, and its granularity depends on the precision required by thelocalization. At runtime, the LMS algorithm takes the N-tuple of measured RSS < r1, r2, ..., rN >, andit finds in the list the RSS tuple that minimizes the mean square error between the two tuples. Then, itoutputs the corresponding coordinate pair (x, y). In the LMS algorithm, only the pairs <coordinate, RSStuple> computed in the room indicated by the Prediction subsystem are used.
Figure 3. The modified version of the received signal strength (RSS)-based trilaterationalgorithm; only the intersection points inside the room selected by the Prediction subsystemare considered.
4. Scenario
A measurement campaign has been performed on the first floor of the the ISTIinstitute of CNRinthe Pisa Research Area, in Italy. The scenario is a typical office environment comprising six roomswith different geometries, as depicted in Figure 4. Rooms contain typical office furniture: desks, chairs,cabinets and monitors. From the point of view of wireless communications, this is a harsh environment,due to the multi-path reflections caused by walls and the interference produced by electronic devices.Experimental measurements have been performed by a sensor network of 15 IRISnodes embedding aChipcon AT86RF230 radio subsystem that implements the IEEE 802.15.4 standard [15]. Fifteen sensors,in the following anchors, are located in fixed positions in the environment (as depicted in Figure 4), andone sensor is placed on the user, hereafter called the mobile. The height of the anchors has been set to1.5 m from the ground, and the mobile was worn on the chest of the user. The user moves along free pathsto facilitate with a constant speed of about 1 m/s. The measurement campaign comprises experimentson six different rooms with a total surface of about 100 m2. Experiments consist in measuring the RSSbetween anchors and the mobile for the two selected paths, hereby referred to as the first and secondpath. Figures 4 and 5 show the position and the orientation of the anchors deployed in the environment,as well as the performing path for the fist and second path, respectively. We collected RSS samples bysending a beacon packet from the anchors to the mobile at regular intervals, eight times per second, usingthe full transmission power of the IRIS nodes.

ISPRS Int. J. Geo-Inf. 2013, 2 985
Figure 4. Deployed anchors and the first path: two rooms and the hallway are used duringthis measure.
Figure 5. Deployed anchors and the second path: three rooms and the hallway are usedduring this measure.
5. Experimental Results
This section describes the results of the experiments conducted in the scenarios drawn in theprevious section.
During the experiments, we performed specific measurements for the evaluation of the performanceof the Prediction subsystem, both in terms of predictive classification accuracy and cost. In a second setof experiments, we evaluated the performance in terms of the localization accuracy of the L3 localization

ISPRS Int. J. Geo-Inf. 2013, 2 986
system, for the two selected paths of the scenarios. Moreover, we quantified how the prediction systemincreases the overall accuracy with respect to both trilateration and fingerprinting methods.
5.1. Location Forecasting Accuracy
In order to evaluate the performance in terms of prediction accuracy, we performed experimentsconsisting of the measurement of the RSS between a set of four anchors and the mobile for a set ofrepeated user movements. The measurement campaign comprises experiments on six different rooms,hereby referred as dataset 1, 2, 3, 4, 5 and 6. Figure 6 shows the anchors deployed in a room and theset of three prototypal trajectories of the user (numbered from 1 to 3). The straight path (labeled 1) ranfrom inside the room to outside and yielded to a change in the spatial context of the user (i.e., to a roomexit). The curved paths (labeled as 2 and 3, in the figure) preserved the spatial context (i.e., are within thesame room). Table 1 summarizes the number of experiments for the six different rooms (correspondingto datasets 1–6) and for each path. Note that, due to physical constraints, dataset 1 does not have thecurved path in the room denoted as path 3. The number of paths leading to a room exit, with respect tothose that preserve the spatial context, is given in Table 1 and labeled as Tot. Exit and Tot. Unchanged,respectively. Each path produces a trace of RSS measurements that is marked when the user reaches apoint (denoted with M in Figure 6) located at 0.6 m from the door. Overall, the experiment producedabout 5,000 RSS samples from each of the four anchors and for each dataset. The marker, M, is the samefor all the movements; therefore, different paths cannot be distinguished based only on the RSS valuescollected at M.
Figure 6. Experimental setting: generic representation of the anchors’ position andprototypical user trajectories. Straight path, labeled as 1, yields to a room exit, while curvedmovement (paths 2 and 3) preserves the spatial context. The M markers denote the pointswhere the system predicts whether the user is going to exit the room. The actual settingdiffers from this schematics by the presence of office furniture (covering roughly 50% ofthe space) that is asymmetrically arranged and influences the actual user trajectories in thedifferent rooms.
������������
The experimental scenario and the gathered RSS measures are used to feed a binary classificationtask on time series for movement forecasting. The RSS values from the four anchors are organized intosequences of varying length (see Table 1) corresponding to trajectory measurements from the starting

ISPRS Int. J. Geo-Inf. 2013, 2 987
point until marker M. A target classification label is associated with each input sequence to indicatewhether the user is about to exit the room or not. In particular, target class +1 is associated with locationchanging movements (i.e., path 1 in Figure 6), while label−1 is used to denote location preserving paths(i.e., paths 2 and 3 in Figure 6).
Table 1. Number of experiments for the six different rooms for each user movement.
Path Type Dataset 1 Dataset 2 Dataset 3 Dataset 4 Dataset 5 Dataset 6
1 26 26 26 26 27 27
2 26 13 13 14 12 13
3 - 13 13 14 12 13
Tot. Exit 26 26 26 26 27 27
Tot. Unchanged 26 26 26 28 24 26
In [5], the baseline performance of different ESN models on user movement prediction with a smalltwo-room dataset has been analyzed. Such an analysis suggests that the LI-ESN model, described inSection 3.1, is best suited to deal with slowly changing RSS time series. Therefore, in the remainder ofthe section, we limit our analysis to the assessment of a leaky-integrated model, with meta-parameterschosen as in [5]. In particular, we consider LI-ESNs comprising reservoirs of NR = 500 units and a10% of randomly generated connectivity, spectral radius ρ = 0.99, input weights in [−1, 1] and leakingrate a = 0.1. Results refer to the average of 10 independent and randomly guessed reservoirs. Thereadout (NY = 1) is trained using pseudo-inversion and ridge regression with regularization parameterλ ∈ {10−i|i = 1, 3, 5, 7}.
Input data comprise time series of four dimensional RSS measurements (NU = 4) corresponding tothe four anchors in Figure 6, normalized in the range [−1, 1] independently for each dataset. NormalizedRSS sequences are fed to the LI-ESN network only until the marker signal, M.
We used the data collected in the experiment to train an RC to forecast whether the user will exit theroom or not when he reaches point M. In particular, to test the ability of RC to generalize its prediction tounseen indoor environments, we define an experimental evaluation setup, where RC training is performedon RSS measurements corresponding to only two rooms of the scenarios, while the experiments inthe remaining rooms are used to test the generalization capability of the RC model. Specifically, wehave defined two experimental settings (ESs) that are intended to assess the predictive performance ofthe LI-ESNs when training/test data comes from both uniform (ES1) and previously unseen ambientconfigurations (ES2), i.e., providing an external test set. Setting ES1 comprises datasets 1, 2, 3 and 4to form a single dataset of 210 sequences. This leads to a training set of a size of 168 and a test set ofa size of 42, with stratification on the path types. The readout regularization parameter of ES1 is set toλ = 10−1, on a (33%) validation set extracted from the training samples. In setting ES2, we use theLI-ESN with the readout regularization selected in the ES1. We train it on the union of datasets 1, 2, 3and 4 (i.e., four rooms), and we use dataset 5 and 6 as an external test set (with measurements from twounknown environments). Table 2 reports the mean test accuracy for both the ESs. An excellent predictiveperformance is achieved for ES1, which is coherent with the results reported in [5]. This seems to

ISPRS Int. J. Geo-Inf. 2013, 2 988
indicate that the LI-ESN approach, on the one hand, scales well as the number of training environmentsincreases, while, on the other hand, it is robust to changes to the training room configurations. Notethat RSS trajectories for different rooms are, typically, consistently different, and, as such, the additionof novel rooms strongly exercises the short-term memory of the reservoirs and their ability to encodecomplex dynamical signals.
Table 2. The mean test accuracy (and standard deviation) of leaky integrator type of RCnetwork (LI-ESNs) for the two experimental settings (ESs).
ES1 ES2
95.95%(±3.54) 89.52%(±4.48)
The result on the ES2 setting is more meaningful, as it shows that the performance of the LI-ESNmodel can be generalized to unknown environments. Specifically, the model reaches a predictiveaccuracy of about 90% on the external test comprising unseen ambient configurations. Table 3 describesthe confusion matrix of the external test-set in ES2, averaged over the reservoir guesses and expressed aspercentages over the number of test samples. This allows appreciating the equilibrium of the predictiveperformance, which has comparable values for both classes. Note that total accuracy is obtained as thesum over the diagonal, while error is computed from the sum of the off-diagonal elements.
Table 3. Mean confusion matrix (expressed in % over the number of samples) on the ES2external test-set.
LI-ESN Prediction+1 −1
Actual+1 44.04%(±5.17) 7.88%(±5.17)−1 2.60%(±2.06) 45.48%(±2.06)
5.2. Localization Results
Leveraging the prediction system trained with the previous ad hoc measurement campaign (ES2),we evaluate the accuracy of the proposed L3 localization system by using both the trilateration and theLMS algorithms. The localization performance is evaluated in terms of the localization error ε, which isthe distance between the point where the mobile actually is and the point identified by the localizationalgorithm. This is the metric that is most commonly used in the literature: while not necessarily themost significant for practical applications, it allows an easy comparison between different methods indifferent environments. Let the Cumulative Distribution Function (CDF) of ε be the probability that thelocalization error takes on a value less than or equal to x meters. Figures 7 and 8 show the CDF of thelocalization error ε by using both the L3 and the trilateration or the LMS algorithms, with or without theprediction system, respectively.

ISPRS Int. J. Geo-Inf. 2013, 2 989
Figure 7. Cumulative Distribution Function (CDF) of the localization error: actualperformance of both the L3 and common trilateration algorithms, i.e., with and without theuse of a predictive system, respectively.
0 50 100 150 200 250 300 350 4000
0.1
0.2
0.3
0.4
0.5
0.6
0.7
0.8
0.9
1
Localization Error [cm]
CDF
L3 - second pathL3 - first pathTrilateration - first pathTrilateration - second path
Figure 8. CDF of the localization error: actual performance of both the L3 and least meansquares (LMS) algorithms, i.e., with and without the use of predictive system, respectively.
0.5 1 1.5 2 2.5 3 3.5 4 4.5 50
0.1
0.2
0.3
0.4
0.5
0.6
0.7
0.8
0.9
1
Localization error [m]
CDF
L3-LMS
LMS
5.2.1. Trilateration Results
One of the factors influencing the RSS values is the distance between the anchor (emitter) and themobile (receiver), as this distance causes an attenuation in RSS values. Therefore, it is mandatory todetermine the dependence among those RSS values and the distance between the emitter and the receiver.This attenuation, caused by the distance between the emitter and the receiver, is known as path loss, and

ISPRS Int. J. Geo-Inf. 2013, 2 990
it is generally modeled to be inversely proportional to the distance between the emitter and the receiverraised to a certain exponent, known as the path loss exponent [16] or path loss gradient [17]. Otherfactors that affect RSS values are the wall attenuation factor and the attenuation at a reference distance.The path loss in decibels between a given anchor and a given mobile can be expressed as:
L(d)∣∣∣dB
= l0 + 10α log10 d+W∑w=1
lw (5)
where l0 is the path loss at a reference distance, α is the path loss exponent and lw is the attenuationintroduced by each of the W walls traversed by the signal. An estimation of the RSS value, r, receivedfrom the anchor at the mobile is thus:
R = r0 − 10α log10 d− LW , being LW =W∑w=1
lw (6)
where r0, representing the RSS at a reference distance of 1 m, is a term that depends on several factors,such as averaged fast and slow fading, antenna gains and transmitted power. In practice, the value of r0can be known beforehand [16].
The objective of calibration is to adapt the theoretical propagation model (Equation (6)) to theenvironment where it is actually used. The parameters of the propagation model (Equation (6)) are:r0 (RSS measured at 1 m), α (the path loss exponent) and lw (the attenuation factor for the wall, w). r0should be estimated in a generic environment similar to the one in which we are going to carry out thelocation, since it only depends on the physical properties of the devices’ hardware. The other parametershave been estimated by using the automatic virtual calibration procedure described in [4] that does notrequire human intervention. This methods leverages the communications among the anchors (whoseposition is a priori known) to evaluate the parameters of the Equation (6).
After calibration, the performance of both the L3 and the trilateration algorithm, with or without theprediction system on two paths (Figures 4 and 5) have been evaluated. As highlighted in Figure 7, wecan see that in 50% of the cases, the localization error ε of L3 in the two paths is below 2.2 m and 1.6 m,while without exploiting the prediction system, ε is below 3.4 and 3.5 in 50% of the cases. Therefore,the use of the prediction system improves the localization accuracy by about 47%. The localizationaccuracy is increased in both paths, in particular, the median localization error of path 1 is decreased by1.9 m, while the ε of path 2 is decreased by 1.2 m. If we look at Figure 7 from the point of view ofusability, in this setting and with a target localization error of 2 m, the common trilateration techniquewithout the prediction system is practically unusable, as it gives correct results in less than 25% of thecases. On the other hand, with the same target error, L3 achieves the goal barely more than half of thetimes. For more restricted accuracy requirements, for example, ε < 1.5 m, we can see that the use of theprediction system significantly improves the overall localization accuracy (on the order of 75%), but itis not sufficient to make the localization system usable, as the error is always greater than 1.5 m in morethan 50% of the cases.
5.2.2. LMS Results
The calibration of the LMS algorithm consisted in a set of measures between an anchor and a pointof a grid with side of about 1 m (Figure 9). These measures have been memorized to create the RSS
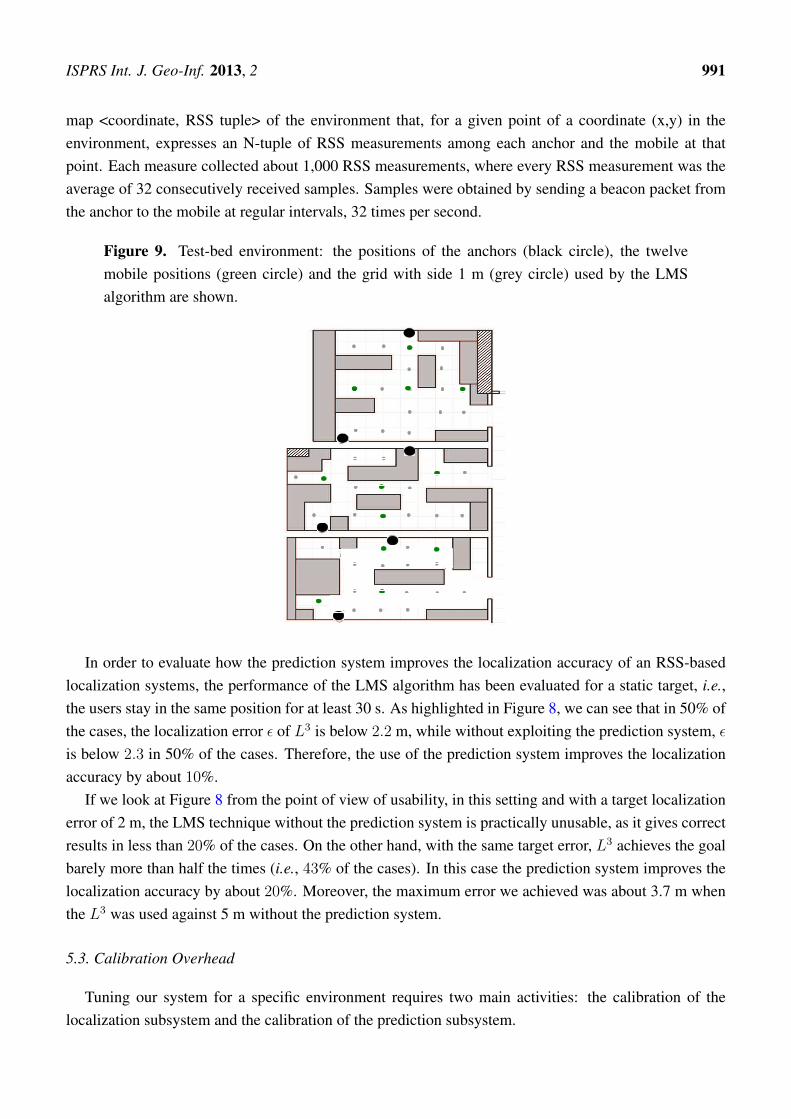
ISPRS Int. J. Geo-Inf. 2013, 2 991
map <coordinate, RSS tuple> of the environment that, for a given point of a coordinate (x,y) in theenvironment, expresses an N-tuple of RSS measurements among each anchor and the mobile at thatpoint. Each measure collected about 1,000 RSS measurements, where every RSS measurement was theaverage of 32 consecutively received samples. Samples were obtained by sending a beacon packet fromthe anchor to the mobile at regular intervals, 32 times per second.
Figure 9. Test-bed environment: the positions of the anchors (black circle), the twelvemobile positions (green circle) and the grid with side 1 m (grey circle) used by the LMSalgorithm are shown.
In order to evaluate how the prediction system improves the localization accuracy of an RSS-basedlocalization systems, the performance of the LMS algorithm has been evaluated for a static target, i.e.,the users stay in the same position for at least 30 s. As highlighted in Figure 8, we can see that in 50% ofthe cases, the localization error ε of L3 is below 2.2 m, while without exploiting the prediction system, εis below 2.3 in 50% of the cases. Therefore, the use of the prediction system improves the localizationaccuracy by about 10%.
If we look at Figure 8 from the point of view of usability, in this setting and with a target localizationerror of 2 m, the LMS technique without the prediction system is practically unusable, as it gives correctresults in less than 20% of the cases. On the other hand, with the same target error, L3 achieves the goalbarely more than half the times (i.e., 43% of the cases). In this case the prediction system improves thelocalization accuracy by about 20%. Moreover, the maximum error we achieved was about 3.7 m whenthe L3 was used against 5 m without the prediction system.
5.3. Calibration Overhead
Tuning our system for a specific environment requires two main activities: the calibration of thelocalization subsystem and the calibration of the prediction subsystem.

ISPRS Int. J. Geo-Inf. 2013, 2 992
In our experiments, the calibration of the localization subsystem required the collection of RSSsamples in a grid of points placed 1 m from each other, to cover a total space of about 50 m2. Thus,the total number of points in the grid was about 50. For each point, we took RSS measurements byexchanging data between the anchors and the mobile for 3 min. Just for the measurements, the calibrationtime was 2.5 h . This, however, does not include the time required to replace the mobile device at eachpoint, to restart the measurements and to execute the calibration.
The calibration of the prediction subsystem instead took around 6 h of work, mainly spent simulatingthe movements of a user along the different paths. This latter time of calibration is particularly important,because this is the additional overhead required to improve the localization accuracy of the fingerprintingmethod. Furthermore, the same amount of time could be spent to improve the localization subsystemwith more conventional methods, by augmenting the resolution of the grid of points (i.e., using morereference points for fingerprinting).
We observe, however, that the calibration of the fingerprinting needs to be executed during thedeployment phase, before the user can actually use the system, while the calibration of the predictionsubsystem does not have this requirement, as it can be overlapped with a period of actual use of thesystem by the user (during this period, the localization system based on fingerprinting works alone, withreduced performances).
Specifically, the calibration of the prediction subsystem requires traces of RSS measurements thatprecede the event in which the user exits from a room/environment. The precise detection of theoccurrence of such an event can be achieved in different ways; for example, it can be used in anynear-field communication mechanism (RFID-based or others), with the reader placed near the doorsand the tagon the user. Whenever the reader detects the tag, this is taken as an indication of an “exit”event. Consequently, the previous few seconds of RSS measurements (in our experiments, 6 s) are takenas a sample of an “exit” event. Any other sequence of RSS measurements can be taken as a negative“exit” event. Such an automatic method of data collection had the drawback that it requires an additionalsubsystem, which, however, is only temporarily deployed to acquire the necessary data in the first daysof use and can be removed once the predictive subsystem is fully calibrated.
Hence, in this configuration, the time required to appropriately calibrate the prediction subsystemis almost transparent to the user (he/she only need to wear an RFID tag or a similar device for alimited period of time). On the other hand, the time required to perform a deeper fingerprinting of theenvironment has a stronger impact on the user, as it is the time of the inactivity of the system and requiresan invasive intervention in the user environment, due to human operators performing the fingerprinting.
6. Conclusions and Discussions
We have presented an RC approach to user movement prediction in indoor environments, based onRSS traces collected by low-cost WSN devices. We exploit the ability of LI-ESNs in capturing thetemporal dynamics of slowly changing noisy RSS measurements to yield to very accurate predictionsof the user spatial context. The performance of the proposed model has been tested on challengingreal-world data comprising RSS information collected in real environments.

ISPRS Int. J. Geo-Inf. 2013, 2 993
We have shown that the LI-ESN approach is capable of generalizing its predictive performance totraining information related to multiple setups. More importantly, it can effectively generalize movementforecasting to previously unseen environments, as shown by the external test-set assessment. Suchflexibility is of paramount importance for the development of practical smart-home solutions, as itallows one to consistently reduce the installation and setup costs. For instance, we envisage a scenarioin which an ESN-based localization system is trained off-line (e.g., in the laboratory/factory) on RSSmeasurements captured on a (small) set of sample rooms. Then, the system is deployed and put intooperation into its target environment, reducing the need of an expensive fine tuning phase.
In order to evaluate how the prediction system increases the performance of an RSS-based localizationsystem, we have made measurements in a typical office environment consisting of six adjacent roomswith furniture.
We considered a common trilateration and a fingerprinting localization algorithm, and we evaluatedthem, both with and without the previous trained prediction system. The information used by thelocalization system consists in knowing whether the user is exiting from the current room. Measurementsshow that the trilateration algorithm, coupled with this information, provides more usable performance,in that it gives the correct result about 80% of the time for a target localization error of 3 m. Moreover, theproposed L3 localization system leveraging the prediction movements improves the accuracy by about47% with respect to an RSS-based trilateration localization system that does not exploit it. We thenevaluated the performance of a fingerprinting localization algorithm with and without the predictionsystem. In order to really show how the prediction system improves the localization accuracy of anRSS-based localization system, the performance has been evaluated for a static target, i.e., the usersstays in the same position for at least 30 s. Even if this is a more suitable case for the RSS-basedlocalization algorithms, the accuracy increases by about 10%.
While, the computational cost is a minor detail, since we envision a dedicated server, which elaboratesall this information and these algorithms, an analysis of the calibration cost is required. Usually, theRSS-based localization algorithms need to be calibrated. In this paper, we exploited the automaticvirtual calibration for the trilateration localization system (therefore, without calibration cost) [4], andwe calibrated the fingerprinting localization system by creating an RSS map of about 50 entries. Despitethe calibration of the RSS-based localization systems that depend on the techniques used, the proposedL3 system needs to be further calibrated. Indeed, the prediction system has been trained with about100 straight paths and 100 curved paths. Even if the calibration phase is time expensive, it makes theRSS-base localization systems (both trilateration and fingerprinting techniques) usable.
Conflict of Interest
The authors declare no conflict of interest.
References
1. Van Den Broek, G.; Cavallo, F.; Wehrmann, C. AALIANCE Ambient Assisted Living Roadmap;IOS Press: Amsterdam, The Netherlands, 2010,

ISPRS Int. J. Geo-Inf. 2013, 2 994
2. Barsocchi, P. Position recognition to support bedsores prevention. IEEE J. Biomed. HealthInforma. 2013, 17, 53–59.
3. Alvarez-Garcia, J.A.; Barsocchi, P.; Chessa, S.; Salvi, D. Evaluation of localization and activityrecognition systems for ambient assisted living: The experience of the 2012 EvAAL competition.JAISE 2013, 5, 119–132.
4. Barsocchi, P.; Lenzi, S.; Chessa, S.; Furfari, F. Automatic virtual calibration of range-based indoorlocalization systems. Wirel. Commun. Mob. Comput. 2012, 12, 1546–1557.
5. Gallicchio, C.; Micheli, A.; Barsocchi, P.; Chessa, S. User Movements Forecasting by ReservoirComputing Using Signal Streams Produced by Mote-Class Sensors. In MOBILIGHT; Ser, J.D.,Jorswieck, E.A., Miguez, J., Matinmikko, M., Palomar, D.P., Salcedo-Sanz, S., Gil-Lopez, S., Eds.;Springer: Berlin/Heidelberg, Germany, 2011; Volume 81, pp. 151–168.
6. Zorzi, F.; Zanella, A. Opportunistic Localization: Modeling and Analysis. In Proceedings of theIEEE 69th Vehicular Technology Conference, Barcelona, Spanish, 26–29 April 2009.
7. Liu, Y.; Lu, S.; Liu, Y. COAL: Context Aware Localization for High Energy Efficiency in WirelessNetworks. In Proceedings of the IEEE Wireless Communications and Networking Conference(WCNC), Cancun, Quintana Roo, Mexico, 28–31 March 2011; pp. 2030–2035.
8. Azizyan, M.; Constandache, I.; Roy Choudhury, R. SurroundSense: Mobile Phone Localizationvia Ambience Fingerprinting. In Proceedings of the 15th Annual International Conference onMobile Computing and Networking (MobiCom ’09), Beijing, China, 20–25 September 2009,ACM: New York, NY, USA; pp. 261–272.
9. Wang, Y.; Jacobson, Q.A.; Lin, J.; Hong, J.; Annavaram, M.; Krishnamachari, B.; Sadeh, N.A Framework of Energy Efficient Mobile Sensing for Automatic User State Recognition. InProceedings of the International Conference on Mobile Systems, Applications and Services(MobiSys), Krakov, Poland, 22–25 June 2009.
10. Miluzzo, E.; Lane, N.D.; Fodor, K.; Peterson, R.; Lu, H.; Musolesi, M.; Eisenman, S.B.;Zheng, X.; Campbell, A.T. Sensing Meets Mobile Social Networks: The Design, Implementationand Evaluation of the CenceMe Application. In Proceedings of the 6th ACM Conference onEmbedded network Sensor Systems (SenSys ’08), Raleigh, North Carolina, USA, 5–7 November2008; ACM: New York, NY, USA; pp. 337–350.
11. Jaeger, H. The “Echo State” Approach to Analysing and Training Recurrent Neural Networks;Technical Report; GMD—German National Research Institute for Computer Science: Darmstadt,Germany, 2001.
12. Jaeger, H.; Haas, H. Harnessing nonlinearity: Predicting chaotic systems and saving energy inwireless communication. Science 2004, 304, 78–80.
13. Lukosevicius, M.; Jaeger, H. Reservoir computing approaches to recurrent neural network training.Comput. Sci. Rev. 2009, 3, 127–149.
14. Jaeger, H.; Lukosevicius, M.; Popovici, D.; Siewert, U. Optimization and applications of echo statenetworks with leaky-integrator neurons. Neural Netw. 2007, 20, 335–352.
15. Crossbow Technology Inc. Available at: http://www.xbow.com. (accessed on 10 October 2013).16. Pahlavan, K.; Levesque, A.H. Wireless Information Networks; Wiley: New York, NY, USA, 1995.

ISPRS Int. J. Geo-Inf. 2013, 2 995
17. Li, X. RSS-based location estimation with unknown pathloss model. IEEE Trans. Wirel. Commun.2006, 5, 3626–3633.
c© 2013 by the authors; licensee MDPI, Basel, Switzerland. This article is an open access articledistributed under the terms and conditions of the Creative Commons Attribution license(http://creativecommons.org/licenses/by/3.0/).