Embed Size (px)
Citation preview
August 2019 1
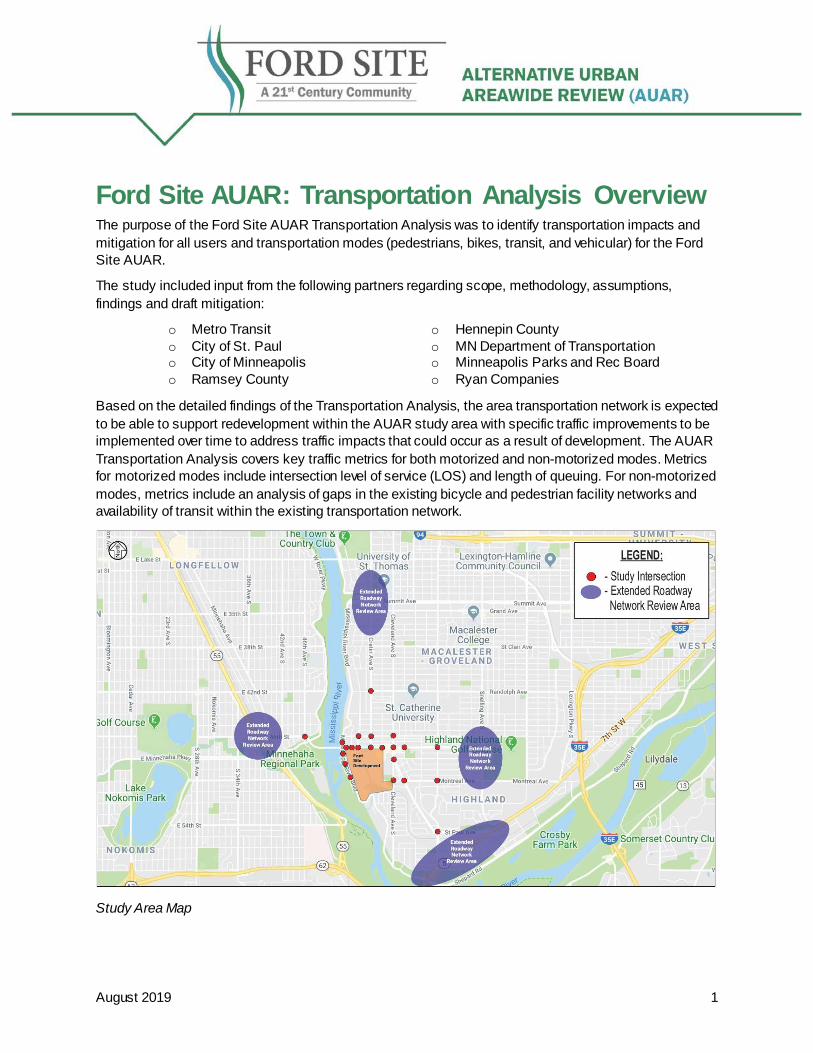
Ford Site AUAR: Transportation Analysis Overview The purpose of the Ford Site AUAR Transportation Analysis was to identify transportation impacts and mitigation for all users and transportation modes (pedestrians, bikes, transit, and vehicular) for the Ford Site AUAR.
The study included input from the following partners regarding scope, methodology, assumptions, findings and draft mitigation:
o Metro Transit o City of St. Paul o City of Minneapolis o Ramsey County
o Hennepin County o MN Department of Transportation o Minneapolis Parks and Rec Board o Ryan Companies
Based on the detailed findings of the Transportation Analysis, the area transportation network is expected to be able to support redevelopment within the AUAR study area with specific traffic improvements to be implemented over time to address traffic impacts that could occur as a result of development. The AUAR Transportation Analysis covers key traffic metrics for both motorized and non-motorized modes. Metrics for motorized modes include intersection level of service (LOS) and length of queuing. For non-motorized modes, metrics include an analysis of gaps in the existing bicycle and pedestrian facility networks and availability of transit within the existing transportation network.
Study Area Map

August 2019 2
Transportation Analysis Methodology 1. Identify Existing Transportation Conditions
a. Conduct vehicular, pedestrian, and bicycle counts b. Identify roadway (lanes, traffic controls), pedestrian and bicycle (facilities, gaps), and
transit (routes, frequency) characteristics c. Evaluate intersection capacity (levels-of-service, queues) d. Identify issues and mitigation, if needed
2. Confirm Study Assumptions and Future Scenarios for Evaluation a. Land use, roadway connections, access, evaluation years
3. Develop Traffic Forecasts a. Review historical trends and regional model assumptions/forecasts b. Identify general background growth c. Evaluate transportation network assumption changes d. Identify development related trip generation estimates e. Review directional distribution
4. Evaluate Future Conditions a. Review roadway volumes and capacity (average daily traffic volumes) b. Evaluate intersection capacity (levels-of-service, queues) for all scenarios c. Identify issues and mitigation
5. Evaluate Potential Mode Conflicts a. Access and circulation of all transportation modes b. Identify issues and mitigation
Data Collection • Intersection data for vehicles, pedestrian, and bicycle counts were collected in May 2019. • All Universities and private and public schools were in session.

August 2019 3
Study Intersections
Motor Vehicle Capacity Analysis An intersection capacity analysis was conducted to determine how traffic is currently operating at the study intersections during typical weekday a.m. and p.m. peak hour conditions. All intersections were analyzed using Synchro/SimTraffic software, which is an industry standard. Capacity analysis results identify a level of service (LOS), which indicates how well an intersection is operating. Intersections are graded from LOS A through LOS F. The LOS results are based on average delay per vehicle, which

August 2019 4
corresponds to the delay threshold values shown in the table below. LOS A indicates the best traffic operation and LOS F indicates an intersection where demand exceeds capacity. Overall intersection LOS A through D is generally considered acceptable within the Twin Cities Metropolitan Area, although longer delays for short periods of time and/or for specific movements are often considered acceptable as well. In urban areas, it is common for intersections to operate at LOS E or LOS F for short periods of time, particularly when balancing other transportation modal priorities.
Based on the results of the study and the estimated traffic generated by the proposed development scenarios within the AUAR study area, a limited number of intersections may operate at less than LOS D; none of the intersections are anticipated to operate below LOS E.1 The LOS Capacity Analysis reviewed both AM and PM peak hour conditions. The analysis consistently showed that the PM peak hour represents the worst-case condition.
11 Traff ic counts occurred on Thursday, May 9, Wednesday May 15, or Thursday May 16. All schools w ere still in session during the counts.

August 2019 5
Trip Generation
Trip Generation for the AUAR Scenarios was determined for the level of traffic, walk/bike, and transit. The Trip Generation estimates were developed using ITE Trip Generation Handbook and the Traffic Generated by Mixed-Use Developments - Thirteen-Region Study Using Consistent Measures of Built Environment, (2015) published by the Transportation Research Board (No. 2500).
Directional Distribution

August 2019 6
Capacity Analysis for PM Peak Hour – Existing Conditions Existing Conditions

August 2019 7
Existing Conditions with Mitigation
• Identified Mitigation for Ford Parkway/Cleveland Avenue:
o Remove parking on the west side of Cleveland Avenue from Ford Parkway to the alley and provide a southbound right-turn lane to reduce southbound queues and improve operations.
o Extend the eastbound left-turn lane approximately 75 feet by removing part of the center median along Ford Parkway to provide additional turn lane storage.

August 2019 8
Capacity Analysis for Year 2040 – No Build Condition 2040 No Build
• Improvements assumed in the model:
o Ford Parkway/Cretin Ave: Addition of a southbound right-turn lane. Eastbound left-turn lane extended.

August 2019 9
2040 No Build Condition with Mitigation
• Potential mitigation based on the analysis:
o Ford Parkway/Fairview Ave: Install left-turn signal phasing capability for all approaches to improve left-turn
operations and balance queues. o Cretin Ave/Randolph Ave:
Restripe and/or widen to provide northbound and southbound left-turn lanes to reduce queues.

August 2019 10
Capacity Analysis for Year 2040 – Ryan Development Scenario 2040 Ryan Development Scenario
• Improvements assumed in the model: o Travel pattern changes with build out of Ford Site network. o Ford Parkway/Fairview Avenue – left-turn phasing on all approaches. o Cretin Avenue/Randolph Avenue – northbound/southbound left-turn lanes provided.

August 2019 11
2040 Ryan Development Scenario with Mitigation
Potential mitigation based on the analysis:
• Ford Parkway/Mount Curve Boulevard o Install a traffic signal and construct northbound and southbound left-turn lanes to
accommodate the Ford Site approach. o Extend the eastbound left-turn lane about 50 feet to accommodate turn lane queues.
• Ford Parkway/Cretin Avenue o Install northbound, southbound, and westbound left-turn signal phasing. o Extend the eastbound left-turn lane. o Extend the westbound left-turn lane about 75 feet to accommodate turn lane queues. o Restrict on-street parking along the west side of Cretin Avenue from Ford Parkway to
Highland Parkway. • Ford Parkway/Fairview Avenue
o Construct a southbound right-turn lane to improve operations and reduce queues. • Cleveland Avenue/Montreal Avenue
o Switch the stop control from the Montreal Avenue approaches to stop control for the Cleveland Avenue approaches.
o Construct the intersection such that a potential future traffic signal could be installed without having to reconstruct the intersection.
• St Paul Avenue/Montreal Avenue o Install a traffic signal or hybrid roundabout to improve operations.

August 2019 12
Capacity Analysis for Year 2040 – Master Plan Max Density Scenario
• Improvements Assumed in the Model:
o Ford Parkway/Mount Curve Boulevard – signalize – turn lane improvements o Ford Parkway/Cretin Avenue – left-turn signal phasing, turn lane improvements and
restrict on street parking and restripe to Highland Parkway o Ford Parkway/Fairview Avenue – southbound right-turn lane o St. Paul Ave/Montreal Ave – signalize – northbound left-turn lane
Potential mitigation based on the analysis:
• Ford Parkway/Cretin Avenue o Construct a southbound right-turn lane that is approximately 150 feet to reduce
southbound queues. • Ford Parkway/Fairview Avenue
o Implement Travel Demand Management (TDM) strategies to reduce vehicular trips; example strategies include: Provide indoor secure bike parking for commercial, office, and residential land
uses. Require residents, employees, and customers to pay for parking. Provide a Free Transit Pass Program to residents and employees. Provide a ride/carpooling/vanpooling and/or guaranteed ride home program.

August 2019 13
o Refine land use guidance/assumptions to move more density to the southern and southeastern portions of the site to better balance traffic volumes throughout the area.
Extended Roadway Network Review • A planning-level review was completed to understand potential impacts associated with a wider
geographic area. • This review focused on existing and development related traffic volume impacts for various
roadway segments surrounding the Ford Site during the AM and PM peak hours. • The planning-level review found that the roadway volumes in both scenarios are within the
estimated roadway capacity (see results in table).
August 2019 14
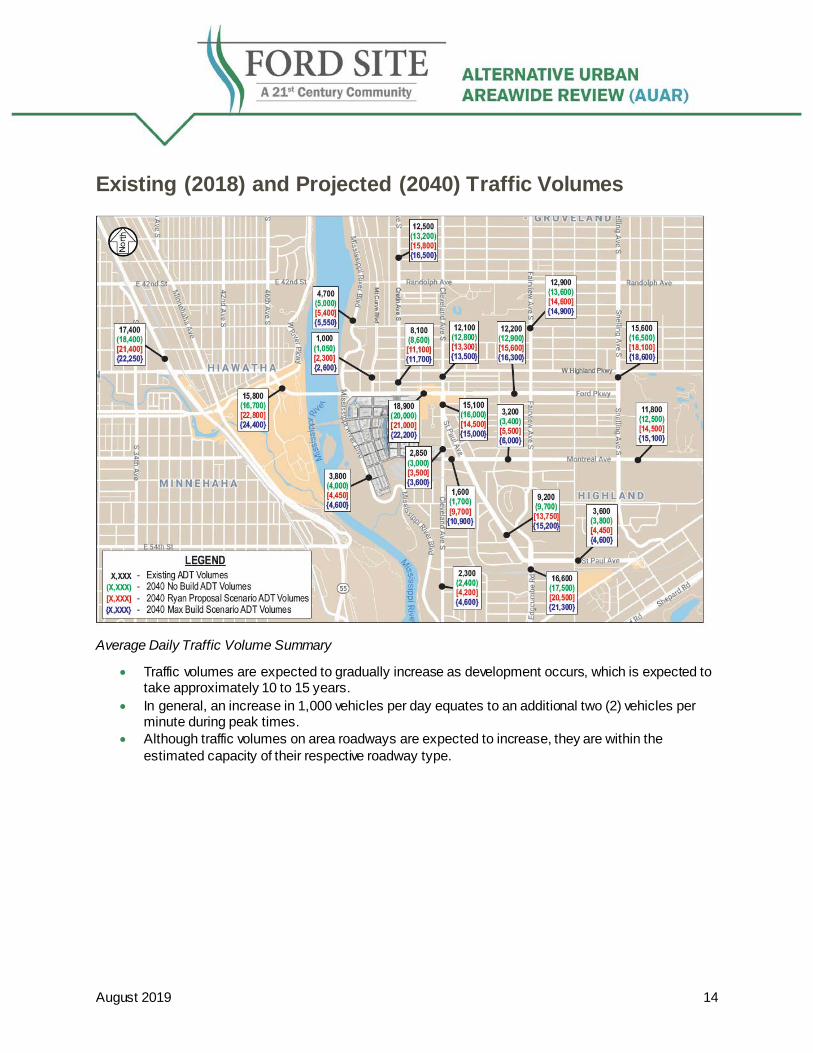
Existing (2018) and Projected (2040) Traffic Volumes
Average Daily Traffic Volume Summary
• Traffic volumes are expected to gradually increase as development occurs, which is expected to take approximately 10 to 15 years.
• In general, an increase in 1,000 vehicles per day equates to an additional two (2) vehicles per minute during peak times.
• Although traffic volumes on area roadways are expected to increase, they are within the estimated capacity of their respective roadway type.

August 2019 15
Average Daily Traffic Volume Summary

August 2019 16
Pedestrian By resolution, the City of Saint Paul formally adopted a sidewalk infill policy in 2017 providing for the construction of sidewalks on both sides of every street as part of street construction projects. The City’s adopted Pedestrian Plan (adopted June 5, 2019) reiterates the sidewalk in-fill policy and further requires private property owners to install sidewalk adjacent to all streets abutting properties undergoing site redevelopment. It is therefore expected that these gaps will be in-filled over time.
Existing Sidewalk Gaps

August 2019 17
• Sidewalks will be constructed within the Ford Site on both sides of the new street network. • Future pedestrian facility improvements (fill gaps):
o Cleveland Avenue o Mount Curve Boulevard (from Hartford Avenue to Scheffer Avenue) o Mississippi River Boulevard (from 175 feet north of Hartford Avenue to the South) o Hartford Avenue (from Mississippi River Boulevard to Mount Curve Boulevard) o Magoffin Avenue (from Mississippi River Boulevard to Colby Avenue) o Traffic Signal Enhancements
These are not planned as part of the Ford Site project. Sidewalks and bike trails are subject to independent City plans and policies to make improvements over time.
Bicycle The City of Saint Paul Bicycle Plan identifies the existing and planned bicycle facilities, including several bikeway priorities serving the AUAR study area.
These are not planned as part of the Ford Site project. Sidewalks and bike trails are subject to independent City plans and policies to make improvements over time.

August 2019 18
Existing Bicycle Facilities

August 2019 19
Transit • The Ford Site is expected to generate between 4,400 and 6,000 transit riders per day, depending
on the AUAR build scenario. • Metro Transit indicated the future potential to reroute some bus routes through the Ford Site,
primarily along Cretin Avenue and Montreal Avenue. • Space has been allocated on each side of Cretin Avenue to accommodate future enhanced
transit service, including the potential for dedicated transit lanes. • Potential for a multi-modal shared transportation corridor south of Montreal Avenue, connecting to
Cretin Avenue through the Canadian Pacific Railway Property. There have been discussions regarding a future Riverview Corridor transit spur that could serve the Ford Site.
Existing Transit Service
Note: METRO Blue Line generally follows Hiawatha Avenue between the MSP airport and Minneapolis.
Travel Pattern Changes • Under the future build conditions, travel patterns are expected to change as the roadway network
is constructed through the Ford Site.

August 2019 20
• The build out of the transportation network through the Ford Site is expected to reduce the traffic volume traveling through the Ford Parkway/Cleveland Avenue intersection.
• Traffic volumes are expected to reduce by appropriately 2,000 to 2,500 vehicles per day at the Ford Parkway/Cleveland Avenue intersection.
o Operations at the Ford Parkway/Cleveland Avenue intersection are expected to improve from LOS E to LOS D as a result of the travel pattern changes.
Transportation Network Travel Pattern Changes