Embed Size (px)
Citation preview

Ford Customer Service DivisionTechnical Training

IMPORTANT SAFETY NOTICE
Appropriate service methods and proper repair procedures are essential for the safe, reliable operation of all motor vehicles, as well as the personal safety of the individual doing the work. This manual provides general directions for accomplishing service and repair work with tested, effective techniques. Following them will help assure reliability.
There are numerous variations in procedures, techniques, tools and parts for servicing vehicles, as well as in the skill of the individual doing the work. This manual cannot possibly anticipate all such variations and provide advice or cautions as to each. Accordingly, anyone who departs from instructions provided in this manual must first establish that he compromises neither his personal safety nor the vehicle integrity by his choice of methods, tools or parts.
As you read through the procedures, you will come across NOTES, CAUTIONS, and WARNINGS. Each one is there for a specific purpose. NOTES give you added information that will help you to complete a particular procedure. CAUTIONS are given to prevent you from making an error that could damage the vehicle. WARNINGS remind you to be especially careful in those areas where carelessness can cause personal injury. The following list contains some general WARNINGS that you should follow when you work on a vehicle.
The recommendations and suggestions contained in this manual are made to assist the dealer in improving his dealership parts and/or service department operations. These recommendations and suggestions do not supersede or override the provisions of the Warranty and Policy Manual, and in any cases where there may be a conflict, the provisions of the Warranty and Policy Manual shall govern.
The descriptions, testing procedures, and specifications in this handbook were in effect at the time the handbook was approved for printing. Ford Motor Company reserves the right to discontinue models at any time, or change specifications, design, or testing procedures without notice and without incurring obligation. Any reference to brand names in this manual is intended merely as an example of the types of tools, lubricants, materials, etc. recommended for use. Equivalents, if available, may be used. The right is reserved to make changes at any time without notice.
WARNING: MANY BRAKE LININGS CONTAIN ASBESTOS FIBERS. WHEN WORKING ON BRAKE COMPONENTS, AVOID BREATHING THE DUST. BREATHING THE ASBESTOS DUST CAN CAUSE ASBESTOSIS AND CANCER.
Breathing asbestos dust is harmful to your health.
Dust and dirt present on car wheel brake and clutch assemblies may contain asbestos fibers that are hazardous to your health when made airborne by cleaning with compressed air or by dry brushing.
Wheel brake assemblies and clutch facings should be cleaned using a vacuum cleaner recommended for use with asbestos fibers. Dust and dirt should be disposed of in a manner that prevents dust exposure, such as sealed bags. The bag must be labeled per OSHA instructions and the trash hauler notified as to the contents of the bag.
If a vacuum bag suitable for asbestos is not available, cleaning should be done wet. If dust generation is still possible, technicians should wear government approved toxic dust purifying respirators.
OSHA requires areas where asbestos dust generation is possible to be isolated and posted with warning signs. Only technicians concerned with performing brake or clutch service should be present in the area.
Copyright © 2002 Ford Motor Company Produced and Coordinated by Technical Support Operations Ford Customer Service Division
March, 2002
• Always wear safety glasses for eye protection.
• Use safety stands whenever a procedure requires you tobe under the vehicle.
• Be sure that the ignition switch is always in the OFFposition, unless otherwise required by the procedure.
• Set the parking brake when working on the vehicle. If youhave an automatic transmission, set it in PARK unlessinstructed otherwise for a specific service operation. If youhave a manual transmission it should be in REVERSE(engine OFF) or NEUTRAL (engine ON) unless instructedotherwise for a specific service operation.
• Operate the engine only in a well-ventilated area to avoidthe danger of carbon monoxide.
• Keep yourself and your clothing away from moving partswhen the engine is running, especially the fan and belts.
• To prevent serious burns, avoid contact with hot metalparts such as the radiator, exhaust manifold, tail pipe,catalytic converter and muffler.
• Do not smoke while working on the vehicle.
• To avoid injury, always remove rings, watches, loosehanging jewelry, and loose clothing before beginning towork on a vehicle. Tie long hair securely behind yourhead.
• Keep hands and other objects clear of the radiator fanblades. Electric cooling fans can start to operate at anytime by an increase in underhood temperatures, eventhough the ignition is in the OFF position. Therefore,care should be taken to ensure that the electric coolingfan is completely disconnected when working under thehood.

CUSTOMER EXPECTATIONS
Expectation 3 “Fix It Right The First Time, on Time.”
Both service advisors and technicians are important players when it comes to Expectation #3. Why
Customers tell us “Fixing It Right The First Time, on Time” is one of the reasons they would decide to return to a dealer to buy a vehicle and get their vehicles serviced. Technician Training It is our goal to help the technician acquire all of the skills and knowledge necessary to “Fix It Right The First Time, on Time.” We refer to this as “competency.” Technician’s Role Acquire the skills and knowledge for competency in your specialty via:
STST New Model – Self Study – Self Study – FordStar Broadcasts – FordStar Broadcasts – Ford Multimedia Training (FMT) – Instructor Led – Instructor Led
The Benefits
The successful implementation of expectations means: – Satisfied customers – Repeat vehicle sales – Repeat service sales – Recognition that Ford and Lincoln/Mercury technicians are “the Best in the Business”
Customer Expectations: Service1. Make it convenient to have my vehicle
serviced at your dealership.
2. The Service Advisor should demonstrate a genuine concern for my service needs.
3. Fix it right the first time.
4. Complete servicing my vehicle in a timely and professional manner.
5. Provide me with a clear and thorough explanation of the service performed.
6. Call me within a reasonable amount of time after my service visit to ensure that I'm completely satisfied.
7. Be responsive to questions or concerns I bring to your attention.

TABLE OF CONTENTS
Diagnosis and Testing September, 2003 TOC-1
INTRODUCTION Engine Performance Curriculum Goals .......................................................................................................... Intro 1 Planned Training Pathway .............................................................................................................................. Intro 1 Engine Performance Curriculum Overview .................................................................................................... Intro 1 How to Complete the Curriculum.................................................................................................................... Intro 2 Course Description .......................................................................................................................................... Intro 3 Course Length ................................................................................................................................................. Intro 3 Target Audience .............................................................................................................................................. Intro 3 Course Prerequisites ........................................................................................................................................ Intro 3 Course Structure .............................................................................................................................................. Intro 3 Course Objectives ........................................................................................................................................... Intro 4 Classroom Multimedia Training (CMT) ......................................................................................................... Intro 5 PC-Assisted Activities ..................................................................................................................................... Intro 5 Evaluation Strategy ......................................................................................................................................... Intro 5 Day One Flowchart ......................................................................................................................................... Intro 6 Day Two Flowchart ........................................................................................................................................ Intro 7 Day Three Flowchart ...................................................................................................................................... Intro 8 Day Four Flowchart ...................................................................................................................................... Intro 10 DIAGNOSTIC PROCESS REVIEW Student Objectives ................................................................................................................................................ 1-1 SSCC Process ........................................................................................................................................................ 1-2 Diagnostic Process ................................................................................................................................................ 1-7 Diagnostic Tests .................................................................................................................................................. 1-17 Electronic PC/ED Worksheet .............................................................................................................................. 1-23 On-Vehicle Worksheet ........................................................................................................................................ 1-24 IGNITION SYSTEM DIAGNOSIS AND TESTING Student Objective .................................................................................................................................................. 2-1 Ignition Concerns .................................................................................................................................................. 2-2 Misfire Diagnosis .................................................................................................................................................. 2-4 COP Misfire Diagnosis ......................................................................................................................................... 2-8 No Start Condition Diagnosis ............................................................................................................................. 2-13 Ignition Bench Worksheet .................................................................................................................................. 2-14 Ignition COP On-Vehicle Worksheet ................................................................................................................. 2-15 Ignition HDR On-Vehicle Worksheet ................................................................................................................. 2-16 FUEL SYSTEM DIAGNOSIS AND TESTING Student Objective .................................................................................................................................................. 3-1 Fuel Delivery System ............................................................................................................................................ 3-2 Fuel Control .......................................................................................................................................................... 3-8 Fuel Economy Test ............................................................................................................................................. 3-22 Fuel System – Bench Worksheet ........................................................................................................................ 3-23 Fuel System – On-Vehicle Worksheet ................................................................................................................ 3-24 PCM WIRING AND CIRCUITS REVIEW Student Objective .................................................................................................................................................. 4-1 PCM Inputs ........................................................................................................................................................... 4-2 PCM Outputs ...................................................................................................................................................... 4-11 PCM Power and Ground ..................................................................................................................................... 4-18

TABLE OF CONTENTS
TOC-2 April, 2002 Diagnosis and Testing
AIR INLET DIAGNOSIS AND TESTING Student Objective .................................................................................................................................................. 5-1 IAC Valve ............................................................................................................................................................. 5-2 Controlled Air Inlet Systems ................................................................................................................................. 5-5 PASSIVE ANTI-THEFT SYSTEM (PATS) Student Objective .................................................................................................................................................. 6-1 Basic PATS ........................................................................................................................................................... 6-2 Integrated PATS (IPATS) ..................................................................................................................................... 6-3 Engine Performance Concerns Unrelated to PATS .............................................................................................. 6-4 EMISSIONS SYSTEM DIAGNOSIS AND TESTING Student Objective .................................................................................................................................................. 7-1 Positive Crankcase Ventilation (PCV) ................................................................................................................. 7-2 Exhaust Gas Recirculation (EGR) ........................................................................................................................ 7-5 Thermostat Heater Control .................................................................................................................................. 7-10 Catalysts .............................................................................................................................................................. 7-13 Evaporative Emissions (EVAP) System ............................................................................................................. 7-16 EVAP Worksheet ................................................................................................................................................ 7-24 OBD Test Modes Worksheet .............................................................................................................................. 7-25 EGR / IAC Worksheet ........................................................................................................................................ 7-26 DAY THREE WORKSHEETS Worksheet 1 (WDS EVAP Diagnosis – Hands-on) ........................................................................................ WS3-3 Worksheet 2 (MIL ON – PC Assisted) ............................................................................................................ WS3-4 Worksheet 3 (Runs Very Rough at Idle – Hands-on) ..................................................................................... WS3-6 Worksheet 4 (Crank/No Start CMT) ............................................................................................................... WS3-8 DAY FOUR WORKSHEETS Worksheet 1 (No Start – Hands-on) ............................................................................................................... WS4-2 Worksheet 2 (Engine Runs Rough – PC Assisted) .......................................................................................... WS4-6 Worksheet 3 (Hesitation on Acceleration – Hands-on) ................................................................................. WS4-8 Worksheet 4 (Engine Runs Rough – CMT) .................................................................................................. WS4-10
INTRODUCTION
Diagnosis and Testing January, 2006 Intro 1
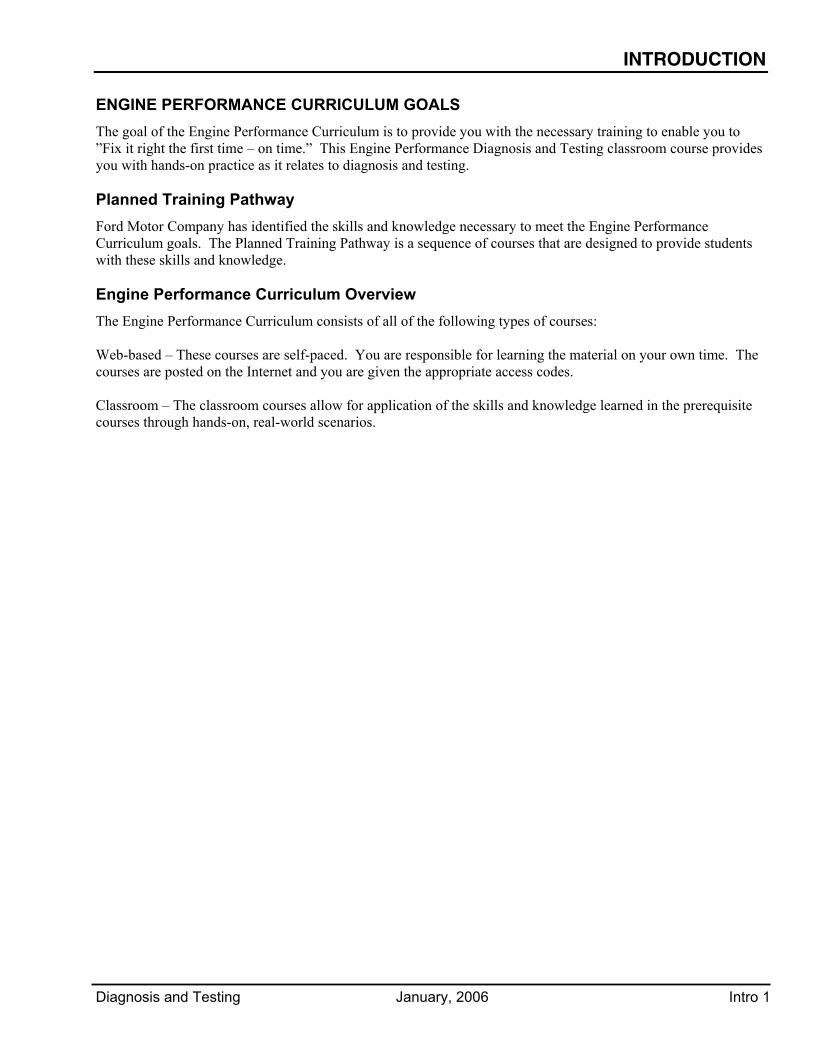
ENGINE PERFORMANCE CURRICULUM GOALS The goal of the Engine Performance Curriculum is to provide you with the necessary training to enable you to ”Fix it right the first time – on time.” This Engine Performance Diagnosis and Testing classroom course provides you with hands-on practice as it relates to diagnosis and testing. Planned Training Pathway
Ford Motor Company has identified the skills and knowledge necessary to meet the Engine Performance Curriculum goals. The Planned Training Pathway is a sequence of courses that are designed to provide students with these skills and knowledge. Engine Performance Curriculum Overview
The Engine Performance Curriculum consists of all of the following types of courses: Web-based – These courses are self-paced. You are responsible for learning the material on your own time. The courses are posted on the Internet and you are given the appropriate access codes. Classroom – The classroom courses allow for application of the skills and knowledge learned in the prerequisite courses through hands-on, real-world scenarios.
INTRODUCTION
Intro 2 January, 2006 Diagnosis and Testing
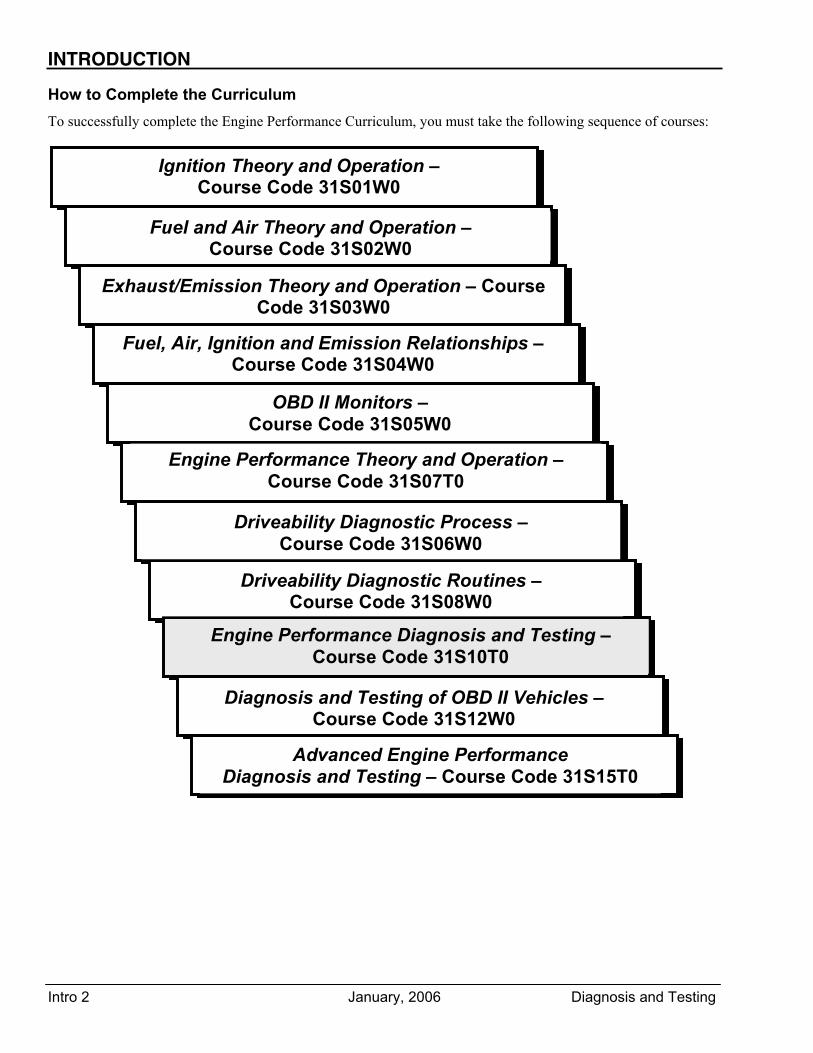
How to Complete the Curriculum To successfully complete the Engine Performance Curriculum, you must take the following sequence of courses: Ignition System Theory and Operation -
Ignition Theory and Operation – Course Code 31S01W0
Fuel and Air Theory and Operation – Course Code 31S02W0
Exhaust/Emission Theory and Operation – Course Code 31S03W0
Fuel, Air, Ignition and Emission Relationships – Course Code 31S04W0
OBD II Monitors – Course Code 31S05W0
Engine Performance Theory and Operation – Course Code 31S07T0
Driveability Diagnostic Process – Course Code 31S06W0
Driveability Diagnostic Routines – Course Code 31S08W0
Engine Performance Diagnosis and Testing – Course Code 31S10T0
Diagnosis and Testing of OBD II Vehicles – Course Code 31S12W0
Advanced Engine Performance Diagnosis and Testing – Course Code 31S15T0

INTRODUCTION
Diagnosis and Testing January, 2006 Intro 3
Course Description This course is designed to provide you with hands-on application of guided diagnosis and testing of driveability concerns. The course emphasizes the SSCC process as well as critical thinking skills. Although you work together in groups, each technician is responsible for completing their own worksheets. The course includes instructor lecture, instructor-led group discussion, student activities, and student hands-on workstations. Course Length This is a four-day, hands-on classroom course. Course Structure The Engine Performance Diagnosis and Testing classroom course includes the following:
• Instructor-led Discussion – You are asked to complete review questions that address content previously covered in the WBT courses. Instructor-led group discussions focus on critical thinking skills and specific concepts that are critical when following a diagnostic process to identify a faulty component or circuit.
• Instructor Lecture – The instructor presents new information as it relates to guided diagnosis and testing.
• Student Activities – The student activities are designed to reinforce concepts presented during the instructor lecture.
• Workstations – The instructor presents the concepts that are critical to successfully completing the workstations. You participate in four on-vehicle hands-on exercises, two classroom media training (CMT) activities delivered on CD-ROM, and two PC-assisted activities during the workstation portion of the course.
• Worksheets – All activities and workstations have an accompanying worksheet designed to complement the hands-on activities. Day One and Day Two student activity worksheets are identified by name. Day Three and Day Four worksheets are identified by number.
• Evaluation – At the end of the four-day course, the instructor asks you to complete a final written test, a final hands-on workstation, and a course evaluation.
INTRODUCTION
Intro 4 April, 2002 Diagnosis and Testing
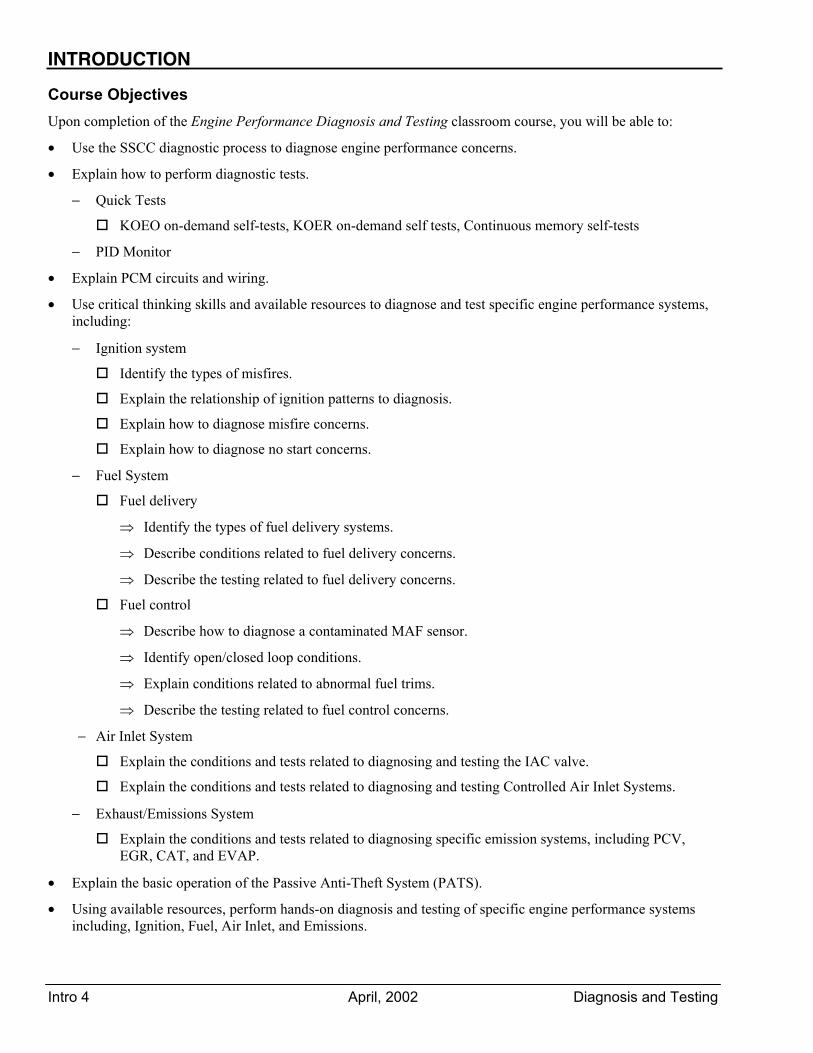
Course Objectives Upon completion of the Engine Performance Diagnosis and Testing classroom course, you will be able to:
• Use the SSCC diagnostic process to diagnose engine performance concerns.
• Explain how to perform diagnostic tests.
− Quick Tests
KOEO on-demand self-tests, KOER on-demand self tests, Continuous memory self-tests
− PID Monitor
• Explain PCM circuits and wiring.
• Use critical thinking skills and available resources to diagnose and test specific engine performance systems, including:
− Ignition system
Identify the types of misfires.
Explain the relationship of ignition patterns to diagnosis.
Explain how to diagnose misfire concerns.
Explain how to diagnose no start concerns.
− Fuel System
Fuel delivery
⇒ Identify the types of fuel delivery systems.
⇒ Describe conditions related to fuel delivery concerns.
⇒ Describe the testing related to fuel delivery concerns.
Fuel control
⇒ Describe how to diagnose a contaminated MAF sensor.
⇒ Identify open/closed loop conditions.
⇒ Explain conditions related to abnormal fuel trims.
⇒ Describe the testing related to fuel control concerns.
− Air Inlet System
Explain the conditions and tests related to diagnosing and testing the IAC valve.
Explain the conditions and tests related to diagnosing and testing Controlled Air Inlet Systems.
− Exhaust/Emissions System
Explain the conditions and tests related to diagnosing specific emission systems, including PCV, EGR, CAT, and EVAP.
• Explain the basic operation of the Passive Anti-Theft System (PATS).
• Using available resources, perform hands-on diagnosis and testing of specific engine performance systems including, Ignition, Fuel, Air Inlet, and Emissions.

INTRODUCTION
Diagnosis and Testing April, 2002 Intro 5
Classroom Multimedia Training (CMT) The CMTs are workstation activities delivered via CD and include video and audio elements. These are simulated hands-on practice in diagnosis and testing of driveability concerns. The PCED information is included in each activity. The CMTs include:
• Scenarios – These are DTC driven routines that address driveability concerns.
• Interactive Exercises – These exercises allow you the opportunity to apply the information presented during instruction.
PC-Assisted Activities The PC-assisted activities are workstation activities delivered via CD. They do not include the use of video and audio elements. These are simulated hands-on practice in diagnosis and testing of driveability concerns with heavy emphasis in using the actual PCED (hard copy or electronic). The PC-assisted activities include:
• Scenarios – These are DTC driven routines that address driveability concerns.
• Interactive Exercises – These exercises allow the technicians the opportunity to apply the information presented.
Evaluation Strategy Your evaluation is based on the score of a final written test and a hands-on workstation. These are completed on the afternoon of the last day. A non-passing grade in either of these two evaluation areas constitutes a failing grade for the course. There are no make-up tests or "do-overs" available. Any technician that fails this course must sign up to take the course for a second time. Final Written Test You complete the final written test at your seat. The written test consists of 30 multiple-choice questions. The questions focus on diagnostic concerns and processes identified during the classroom session and require critical thinking skills to solve problems. You must correctly answer 80% of these questions (24 of 30 questions) to pass. Final Hands-on Workstation You must diagnose the final hands-on workstation and correctly answer all of the accompanying worksheet questions with 100% accuracy. The hands-on activity is done without instructor assistance and the worksheet must be completed individually. You may use all of the reference material available to you in the classroom, including workshop manuals and the student reference book.

INTRODUCTION
Intro 6 April, 2002 Diagnosis and Testing
Day One Flowchart
Instructor Lecture • Ignition System
Diagnosis and Testing
Review Diagnostic Process Worksheets
Review Ignition System Worksheets
Break
Instructor Lecture • Fuel System Diagnosis
and Testing
Instructor Introduces Homework
• PCM Wiring and Circuits Review
Ignition System
Activities
End of Day One
Instructor Introduction
Review Questions
Instructor-Led Discussion• Diagnostic Process
Review
Lunch
Break
Diagnostic Process
Activities
INTRODUCTION
Diagnosis and Testing April, 2002 Intro 7
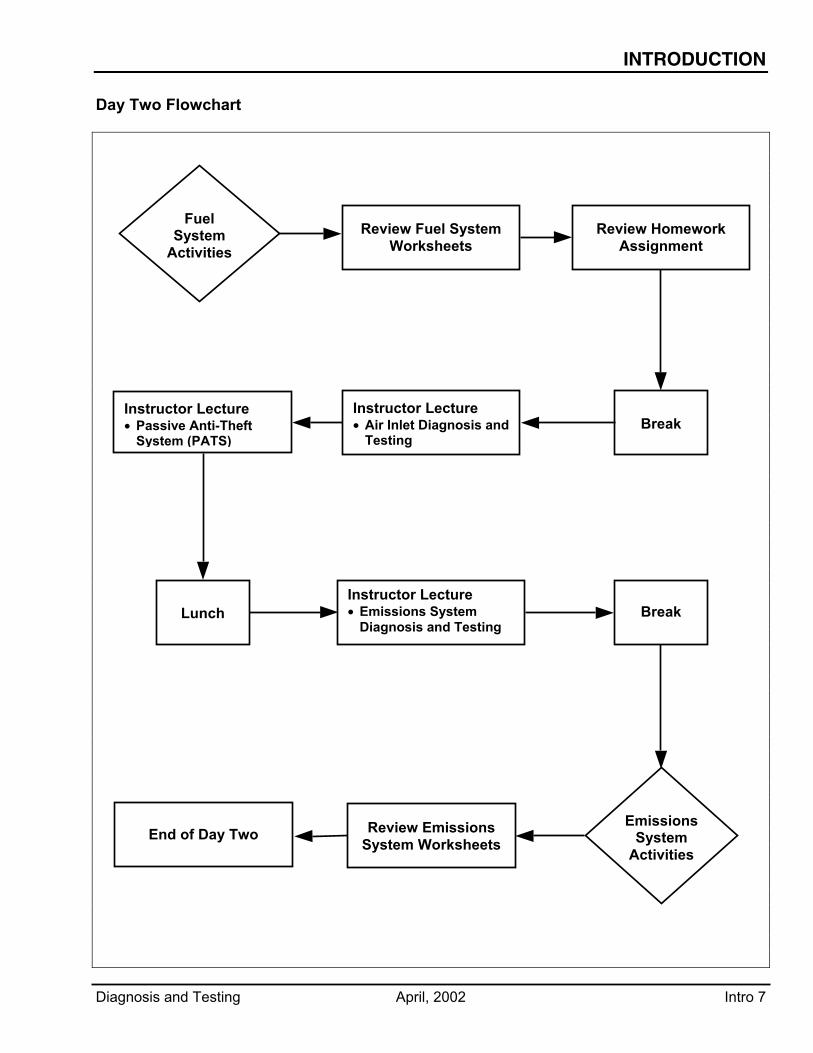
Day Two Flowchart
Fuel System
Activities
Instructor Lecture • Emissions System
Diagnosis and Testing
Lunch
Instructor Lecture • Air Inlet Diagnosis and
Testing
Break
Review Fuel System Worksheets
Review Emissions System Worksheets
Break
Instructor Lecture • Passive Anti-Theft
System (PATS)
Emissions System
Activities
End of Day Two
Review Homework Assignment

INTRODUCTION
Intro 8 April, 2002 Diagnosis and Testing
Day Three Flowchart
Day Three Workstations• Rotation 1 • Rotation 2
Lunch
Break
Review of Day One and Day Two
Review of Day Three Worksheets
Break
End of Day Three
Introduction of Day Three Workstations
Day Three Workstations • Rotation 3 • Rotation 4

INTRODUCTION
Diagnosis and Testing April, 2002 Intro 9
DAY THREE WORKSTATION ROTATIONS
Team 3 – Worksheet 3 Runs Very Rough at Idle (Hands-on)
Team 4 – Worksheet 4 Crank/No Start (CMT)
Team 3 - Worksheet 2 MIL On (PC-assisted)
Team 3 – Worksheet 4 Crank/No Start (CMT)
Team 3 – Worksheet 1 EVAP - Smoke Tester (Hands-on)
Team 4 – Worksheet 2 MIL On (PC-assisted)
Team 4 – Worksheet 3 Runs Very Rough at Idle (Hands-on)
Team 4 – Worksheet 1 EVAP - Smoke Tester (Hands-on)
Team 2 – Worksheet 1 EVAP - Smoke Tester (Hands-on)
Team 2 – Worksheet 2 MIL On (PC-assisted)
Team 2 – Worksheet 3 Runs Very Rough at Idle (Hands-on)
Team 2 – Worksheet 4 Crank/No Start (CMT)
Team 1 – Worksheet 1 EVAP - Smoke Tester (Hands-on)
Team 1 – Worksheet 2 MIL ON (PC-assisted)
Team 1 – Worksheet 3 Runs Very Rough at Idle (Hands-on)
Team 1 – Worksheet 4 Crank/No Start (CMT)
INTRODUCTION
Intro 10 April, 2002 Diagnosis and Testing
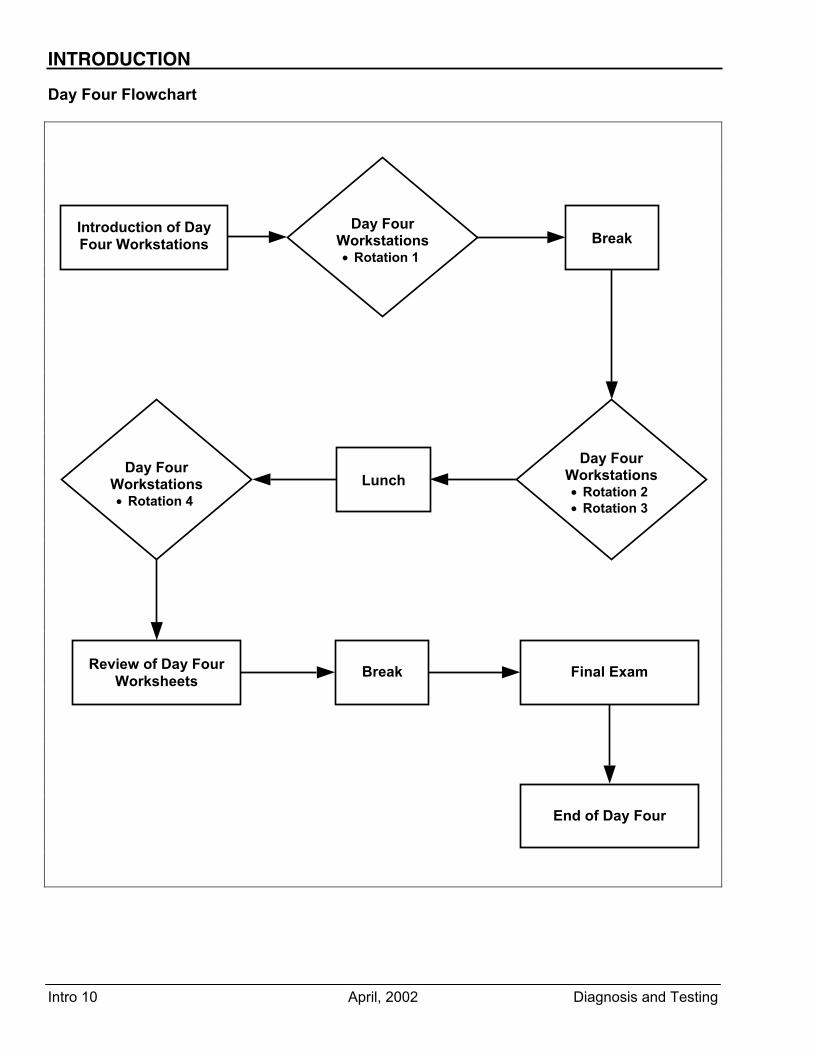
Day Four Flowchart
Day Four
Workstations• Rotation 1
Break
Lunch
Day Four Workstations• Rotation 2 • Rotation 3
Introduction of Day Four Workstations
Day Four
Workstations • Rotation 4
Break
Final Exam
Review of Day Four Worksheets
End of Day Four

INTRODUCTION
Diagnosis and Testing April, 2002 Intro 11
DAY FOUR WORKSTATION ROTATIONS
Team 1 – Worksheet 1 No Start (Hands-on)
Team 2 – Worksheet 2 Engine Runs Rough (PC-assisted)
Team 3 – Worksheet 3 Hesitation on Acceleration (Hands-on)
Team 4 – Worksheet 4 Engine Runs Rough (CMT)
Team 1 – Worksheet 2 Engine Runs Rough (PC-assisted)
Team 1 – Worksheet 3 Hesitation on Acceleration (Hands-on)
Team 1 – Worksheet 4 Engine Runs Rough (CMT)
Team 2 – Worksheet 3 Hesitation on Acceleration (Hands-on)
Team 2 – Worksheet 4 Engine Runs Rough (CMT)
Team 2 – Worksheet 1 No Start (Hands-on)
Team 3 - Worksheet 2 Engine Runs Rough (PC-assisted)
Team 3 – Worksheet 4 Engine Runs Rough (CMT)
Team 3 – Worksheet 1 No Start (Hands-on)
Team 4 – Worksheet 2 Engine Runs Rough (PC-assisted)
Team 4 – Worksheet 3 Hesitation on Acceleration (Hands-on)
Team 4 – Worksheet 1 No Start (Hands-on)

INTRODUCTION
Intro 12 April, 2002 Diagnosis and Testing
NOTES

DAY ONE REVIEW QUESTIONS
Review Questions April, 2002 RQ-2
1. SSCC stands for ______________________________________.
A. System Sensors, Comprehensive Components B. Symptom to System, Component to Cause C. Symptom Service, Component Control D. Service System Causing Concern
2. The first step in the diagnostic process is to ______________.
A. verify the concern B. pinpoint the failed system C. isolate the failure D. identify related systems
3. You begin identifying the system causing the concern by _______________________________.
A. replacing the suspect component B. finding the root cause C. testing each system in the vehicle until the system causing the concern is identified D. eliminating the systems that could not cause the concern
4. Once the suspect system has been identified, the next step is to _______________________________.
A. replace the failed system B. determine which component failed C. clear all codes and retest D. identify related systems
5. To ensure the failure does not recur, you must _______________________________.
A. replace the failed component with a factory-approved replacement B. perform a road test C. replace all associated wiring D. determine the root cause
6. When the conditions to recreate the concern are unclear on the repair order, you should _______________.
A. road test the vehicle to determine the concern B. consult the service advisor or customer for further information C. replace the suspect component D. consult the appropriate service publication
7. If the vehicle has multiple symptoms, you should ___________________________________.
A. begin by repairing the most severe symptom first B. begin by repairing the least severe symptom first C. look for a relationship among the symptoms D. begin by repairing each symptom separately
8. If no DTCs are present, you should go to the appropriate ______________________.
A. Symptom Chart B. Pinpoint Test C. Workshop Manual D. DataLogger screen

DAY ONE REVIEW QUESTIONS
Review Questions April, 2002 RQ-3
9. To identify the possibility of a recurring concern, you should consult ______________________.
A. the EVTM B. the PC/ED C. the Workshop Manual D. OASIS
10. You should never enter a pinpoint test until you are directed to go there unless _____________________.
A. you have a clear understanding of the concern B. replacing the suspect component fails to fix the problem C. you have multiple concerns D. none of the above
11. The final step in any diagnostic procedure is to ______________.
A. make the repair B. clear all DTCs C. verify the repair D. rerun Quick Test
12. To verify a repair, it is necessary to _________________.
A. clear all DTCs and retest under the same conditions B. perform the pinpoint test again C. check for proper operation of the repaired system D. recreate the concern
13. The Quick Test contains the ______________________.
A. KOEO On-Demand Self-Test B. KOER On-Demand Self-Test C. Continuous Memory Self-Test D. all of the above
14. Which test is especially valuable when diagnosing intermittent faults?
A. KOEO On-Demand Self-Test B. KOER On-Demand Self-Test C. Continuous Memory Self-Test D. PID Monitor
15. You must use ________________________ to retrieve generic OBD II emission-related MIL DTCs.
A. the WDS B. the NGS C. a DVOM D. any scan tool that meets OBD II requirements

DAY ONE DIAGNOSTIC PROCESS REVIEW
Diagnosis and Testing September, 2003 1-1
Student Objectives • Review the Diagnostic Process
• Explain how to perform diagnostic tests
− Quick Tests
− KOEO on-demand self-tests
− KOER on-demand self-tests
− Continuous memory self-tests
− PID Monitor
− WDS Guided Diagnostics
Content • SSCC Process
− Symptom Verification
− System Identification
− Component Identification
− Cause Determination
• Diagnostic Process
− Verify the symptom(s)
− Identify the conditions necessary to recreate the symptom
− Identify any related symptoms
− Identify the system(s)
− Perform all diagnostic tests necessary to isolate the failure
− Interpret the test results
− Isolate the root cause of the failure
− Make the repair
− Verify the repair
• Diagnostic Tests
− Quick Test
− Parameter Identification (PID) Monitor
− WDS Guided Diagnostics
DIAGNOSTIC PROCESS REVIEW DAY ONE
1-2 September, 2003 Diagnosis and Testing
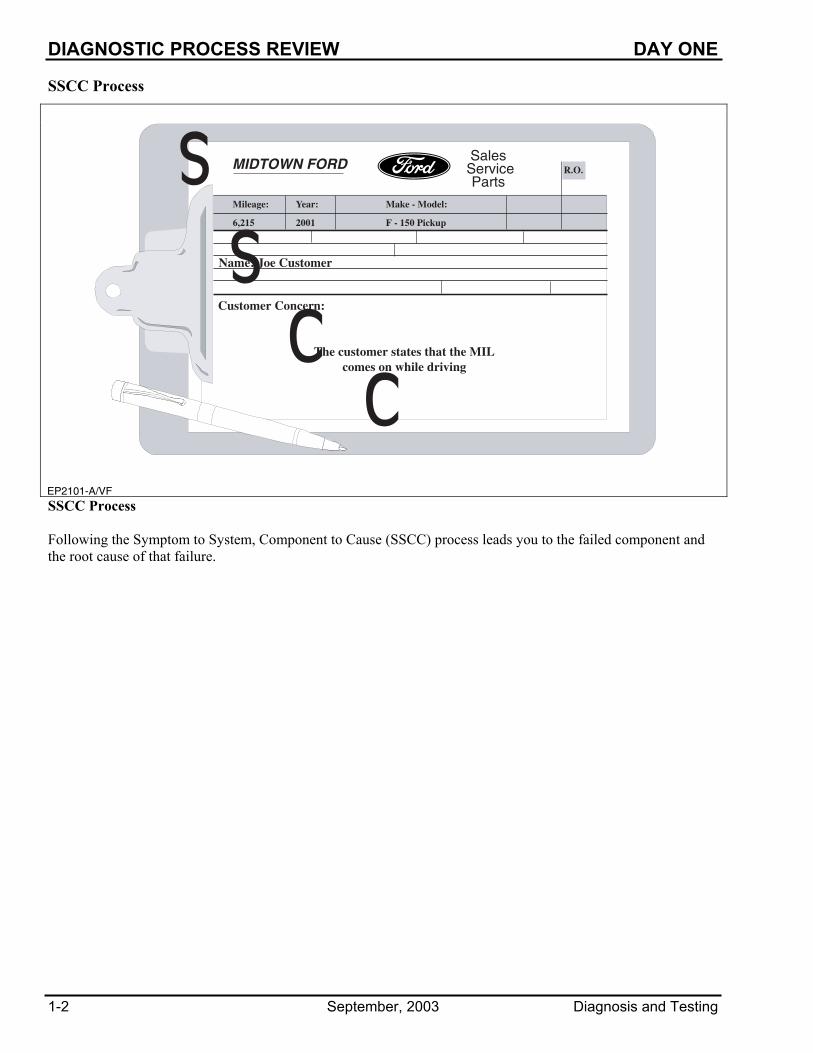
SSCC Process
SSCC Process Following the Symptom to System, Component to Cause (SSCC) process leads you to the failed component and the root cause of that failure.
DAY ONE DIAGNOSTIC PROCESS REVIEW
Diagnosis and Testing September, 2003 1-3
SSCC Process
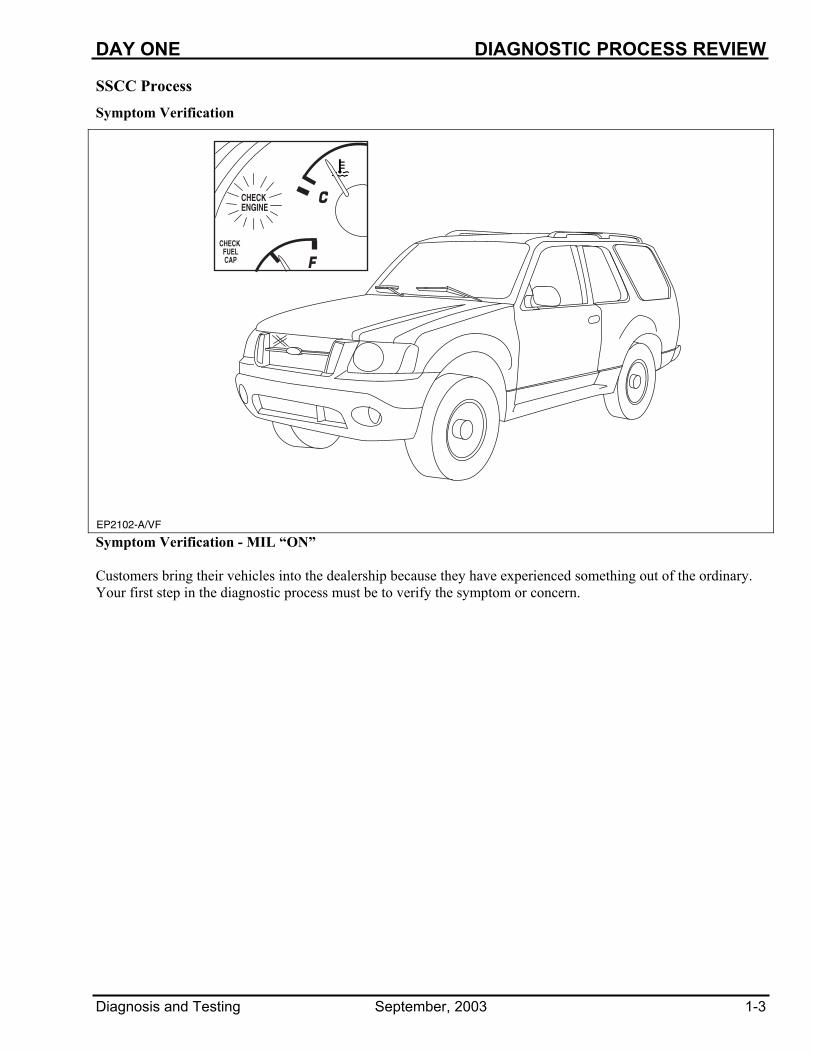
Symptom Verification
CHECK ENGINE
CHECK FUELCAP
C
F
EP2102-A/VF Symptom Verification - MIL “ON” Customers bring their vehicles into the dealership because they have experienced something out of the ordinary. Your first step in the diagnostic process must be to verify the symptom or concern.

DIAGNOSTIC PROCESS REVIEW DAY ONE
1-4 September, 2003 Diagnosis and Testing
SSCC Process
System Identification
System Elimination Once the symptom has been verified, the next step is to determine the system that could be causing the customer's concern. You begin by eliminating systems that could not cause the concern.

DAY ONE DIAGNOSTIC PROCESS REVIEW
Diagnosis and Testing September, 2003 1-5
SSCC Process
Component Identification
Testing Components NOTE: Always use the proper flex probes when testing with the DVOM. Once the system has been identified, you must determine the component that has failed. Perform the necessary tests on the suspect system to identify the failed circuit or component.
DIAGNOSTIC PROCESS REVIEW DAY ONE
1-6 September, 2003 Diagnosis and Testing
SSCC Process
Cause Determination
EPII001-A/VF Repairing and Determining Root Cause
At this point, the symptom has been verified, the system has been identified, and the failed component/circuit has been identified. Now, the root cause must be determined to ensure that the failure does not recur.
EP2105-A/VF
DAY ONE DIAGNOSTIC PROCESS REVIEW
Diagnosis and Testing September, 2003 1-7
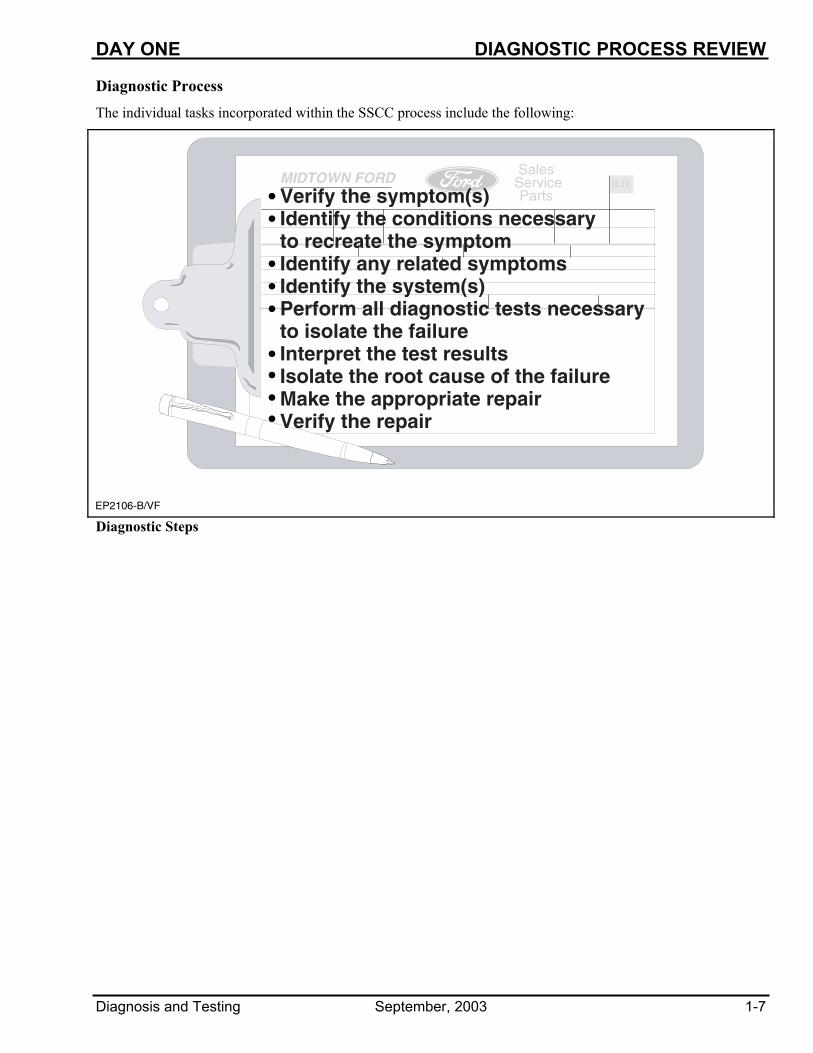
Diagnostic Process
The individual tasks incorporated within the SSCC process include the following:
Diagnostic Steps

DIAGNOSTIC PROCESS REVIEW DAY ONE
1-8 September, 2003 Diagnosis and Testing
Diagnostic Process
Verify the Symptom(s)
Road Test/Visual Inspection The first step is always verifying that the concern exists. Verifying the symptom (customer's concern) can be as simple as doing a visual inspection to confirm that in fact there is a failure, or as complex as an intermittent stalling condition that needs to be captured using a Vehicle Data Recorder (VDR).
EP2107-A/VF

DAY ONE DIAGNOSTIC PROCESS REVIEW
Diagnosis and Testing September, 2003 1-9
Diagnostic Process
Identifying Conditions
Repair Order/Consulting the Customer The repair order is the first piece of information you receive. At this point, the customer's concern is an interpretation of the information the service advisor gathered from the customer. The vehicle may have to be placed under certain conditions, such as driven under a load, turning a sharp corner, or coming to a stop, to recreate the concern. If the repair order does not clearly define those conditions, or the concern could not be duplicated, then consult the service adviser or customer for further information.

DIAGNOSTIC PROCESS REVIEW DAY ONE
1-10 September, 2003 Diagnosis and Testing
Diagnostic Process
Identify Related Symptoms
Identify Related Symptoms/Systems If the work order contains multiple symptoms, look for a relationship among those symptoms that could help you pinpoint the failed system.
As soon as the symptom(s) is verified, start a mental evaluation of what you experienced. Start identifying systems that you think could create the symptom(s). Once you have made the determination that the symptom is a driveability concern, check OASIS for information that may help isolate the system.

DAY ONE DIAGNOSTIC PROCESS REVIEW
Diagnosis and Testing September, 2003 1-11
Diagnostic Process
Identify the System(s)
OASIS/Service Publications/WDS Once the symptom (customer’s concern) is identified, the system(s) that is causing the concern has to be identified. Use all available tools and resources to complete this step. Go to the Symptom Charts section of the PC/ED and perform a Quick Test. Carefully review and evaluate all of the information downloaded from OASIS. If any of the TSBs, special service messages, or open recalls relate to the symptom you have experienced, follow the directions within the information to continue diagnosis. Finally, review the service history information. The service history could relate previous repairs to the symptom you are experiencing. For example, if the vehicle you are diagnosing has just had a battery replaced and now the engine idles rough for a brief period when first started, there is a possibility that the information stored in KAM has not been relearned and could be the cause of the symptom. Section 3 - Symptom Charts
• QT Step 1: PCM Quick Test Index
• Step 2: No DTC(s) Present Symptom Chart Index
• Step 3: No DTC(s) Present Symptom Charts
DIAGNOSTIC PROCESS REVIEW DAY ONE
1-12 September, 2003 Diagnosis and Testing
Diagnostic Process
Isolate the Failure
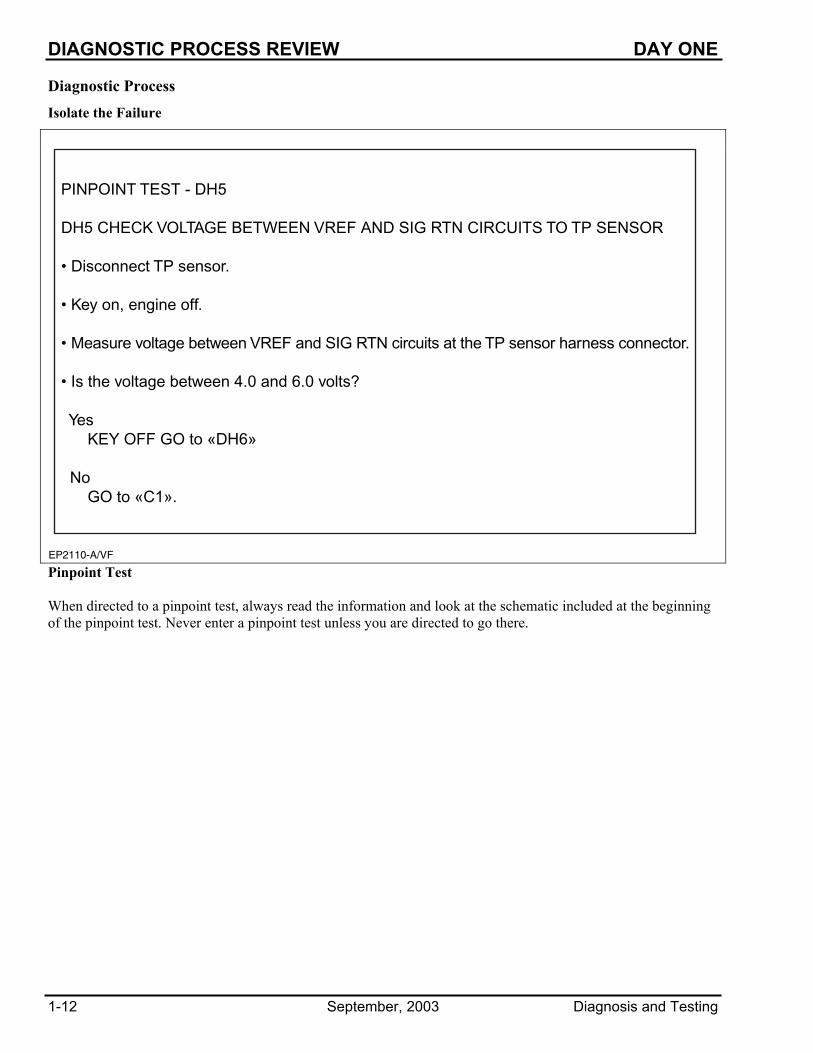
EP2110-A/VF Pinpoint Test When directed to a pinpoint test, always read the information and look at the schematic included at the beginning of the pinpoint test. Never enter a pinpoint test unless you are directed to go there.
DAY ONE DIAGNOSTIC PROCESS REVIEW
Diagnosis and Testing September, 2003 1-13
Diagnostic Process
Interpret Test Results
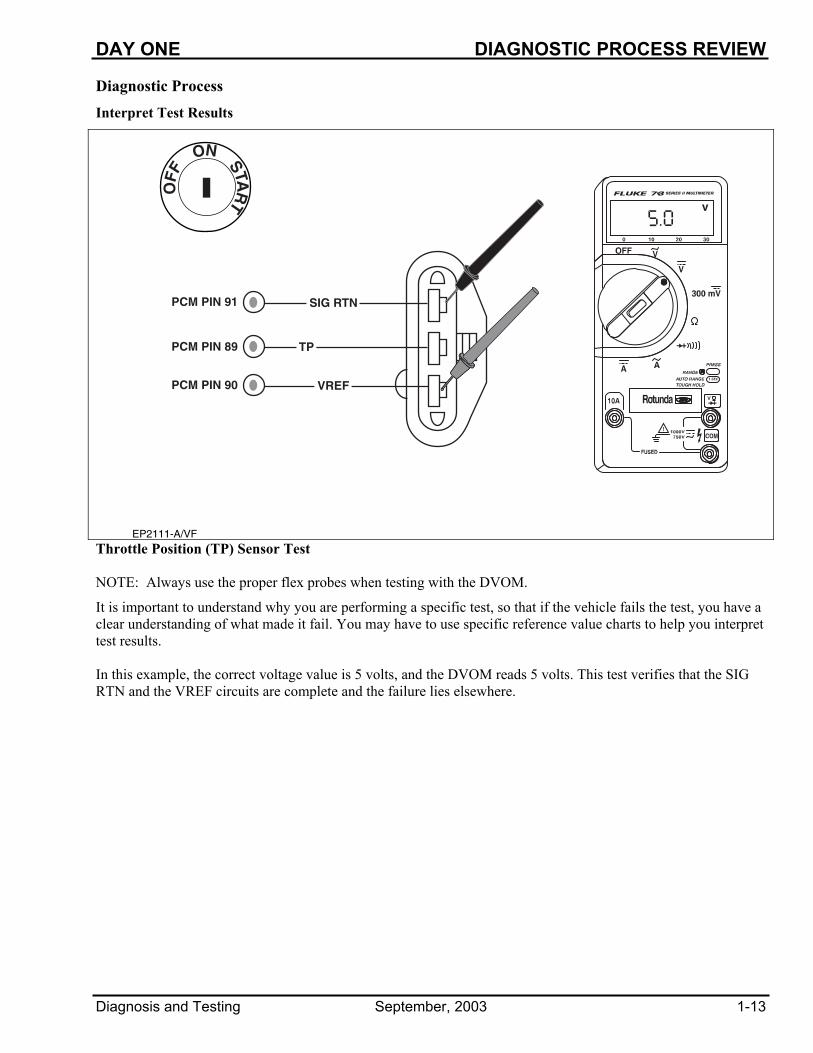
Throttle Position (TP) Sensor Test NOTE: Always use the proper flex probes when testing with the DVOM.
It is important to understand why you are performing a specific test, so that if the vehicle fails the test, you have a clear understanding of what made it fail. You may have to use specific reference value charts to help you interpret test results. In this example, the correct voltage value is 5 volts, and the DVOM reads 5 volts. This test verifies that the SIG RTN and the VREF circuits are complete and the failure lies elsewhere.

DIAGNOSTIC PROCESS REVIEW DAY ONE
1-14 September, 2003 Diagnosis and Testing
Diagnostic Process
Isolate the Root Cause
TP Wire Cut The root cause of the failure must be determined to ensure the failure does not recur. The root cause can be simple or complex. In either case, a thorough examination of the circumstances involved in the failure must be performed. In this example, the root cause of the TP circuit failure is the wiring harness is routed too close to the plastic shield. The wiring harness has to be rerouted to prevent similar failures.
EP2112-A/VF

DAY ONE DIAGNOSTIC PROCESS REVIEW
Diagnosis and Testing September, 2003 1-15
Diagnostic Process
Make the Repair
EP2113-A/VF
1
2
3
4
5
Wire Repair Procedure Item Description Item Description
1 Strip the wires 4 Position heat shrink tubing over wire repair (overlap)
2 Install heat shrink tubing, twist wires together, solder wires
5 Apply heat to the heat shrink tubing until adhesive flows out of both ends
3 Bend wires back in straight line* *Wait for solder to cool before moving wires. Once the failure has been identified and the root cause corrected, the repair must be made. Consult the Workshop Manual or Wiring Diagrams (EVTM) for proper repair procedures.

DIAGNOSTIC PROCESS REVIEW DAY ONE
1-16 September, 2003 Diagnosis and Testing
Diagnostic Process
Verify the repair
Worldwide Diagnostic System (WDS)
The final step of any diagnostic procedure is to verify that the repair has resolved the concern as well as not created any new concerns. Therefore, it is necessary to clear all DTCs and retest the vehicle under the same conditions at which you originally verified the symptom. This could include road testing through the entire OBD II drive cycle, or portions of the OBD II drive cycle, as indicated at the end of the diagnostic pinpoint test.
During testing procedures, you will be instructed to disconnect components and perform circuit tests. This may cause new DTCs to be set. Moving components and wiring during the test may also cause new concerns. The repair is complete if you cannot recreate the concern and no new concerns are noted.
EP2114-A/VF
DAY ONE DIAGNOSTIC PROCESS REVIEW
Diagnosis and Testing September, 2003 1-17
INSTRUCTOR NOTES
Diagnostic Tests
Quick Test
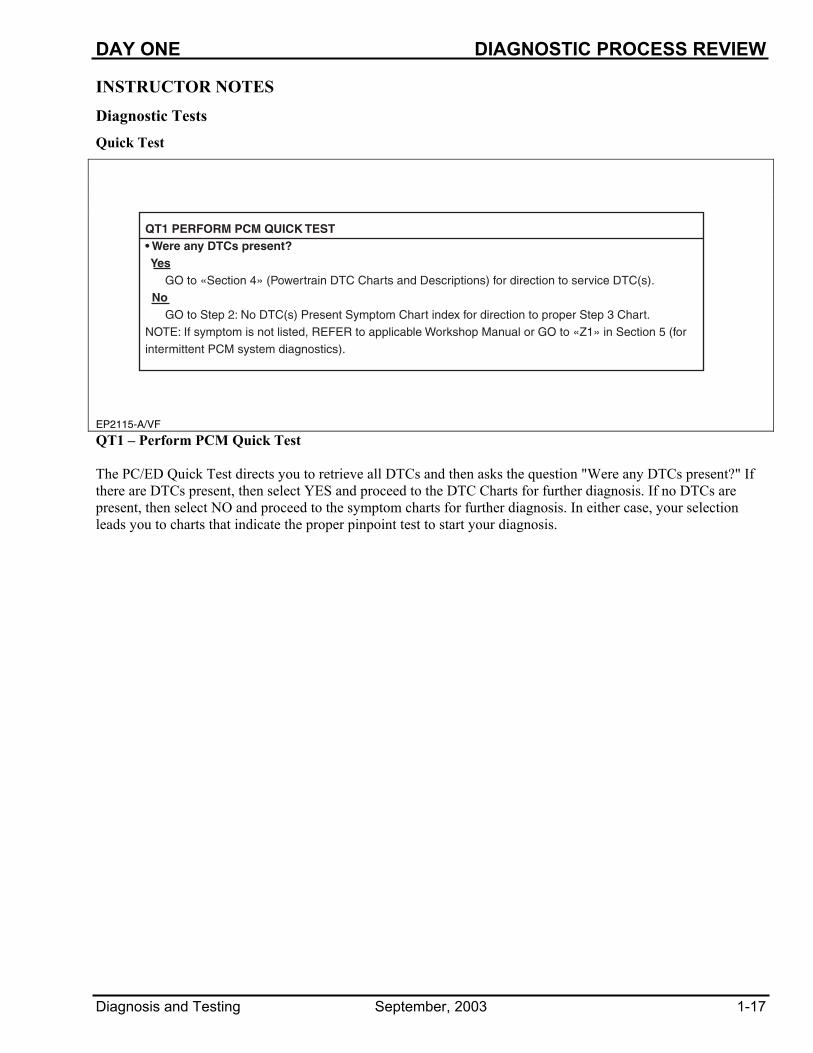
QT1 – Perform PCM Quick Test The PC/ED Quick Test directs you to retrieve all DTCs and then asks the question "Were any DTCs present?" If there are DTCs present, then select YES and proceed to the DTC Charts for further diagnosis. If no DTCs are present, then select NO and proceed to the symptom charts for further diagnosis. In either case, your selection leads you to charts that indicate the proper pinpoint test to start your diagnosis.

DIAGNOSTIC PROCESS REVIEW DAY ONE
1-18 September, 2003 Diagnosis and Testing
Diagnostic Tests
Quick Test (Continued)
DTC Retrieval Using WDS
After the concern has been verified, a visual inspection completed, and OASIS has been checked for documented failures relating to the concern, perform a Quick Test as directed by the PC/ED.
Quick Test is divided into three specialized tests:
• Key On Engine Off (KOEO) On-Demand Self-Test
• Key On Engine Running (KOER) On-Demand Self-Test
• Continuous Memory Self-Test
Quick Test checks the integrity and function of the Electronic EC System and outputs the test results when requested by a scan tool.
Quick Test also provides a quick end check of the powertrain control system. It is performed at the start of each diagnostic procedure with all accessories off. Quick Test is also performed at the end of most pinpoint tests for verification of repair and to make sure no other faults were induced while repairing a previous fault.
A system pass is displayed when no DTCs are output and a scan tool communication error does not exist. System pass means that hardware monitored by the PCM is functioning within normal operating limits. Only a system pass, DTC, or an incomplete OBDII drive cycle (P1000) is displayed.
EP2116-A/VF
DAY ONE DIAGNOSTIC PROCESS REVIEW
Diagnosis and Testing September, 2003 1-19
Diagnostic Tests
Quick Test (Continued)
Key On Engine Off (KOEO) On-Demand Self-Test
The Key On Engine Off (KOEO) On-Demand Self-Test is a functional test of the powertrain control module performed on demand with the key on and the engine off. This test performs checks on certain sensor and actuator circuits. A fault must be present at the time of testing for the KOEO Self-Test to detect the fault. When a fault is detected, a Diagnostic Trouble Code (DTC) is output on the data link at the end of the test when requested by a scan tool. Depressing the clutch pedal on manual transmission vehicles may be required to prevent false DTCs. Key On Engine Running (KOER) On-Demand Self-Test
The Key On Engine Running (KOER) On-Demand Self-Test is a functional test of the powertrain control module performed on demand with the key on engine running and vehicle stopped. A check of certain inputs and outputs is made during operating conditions and at normal operating temperature. The brake pedal position, transmission control and power steering switch tests are part of the KOER On-Demand Self-Test and MUST be performed during this operation if applicable. These are described below. A fault must be present at the time of the KOER On-Demand Self-Test to detect the fault. When a fault is detected, a Diagnostic Trouble Code (DTC) is output on the data link at the end of the test when requested by a scan tool.
Brake Pedal Position Test
This tests the ability of the Electronic EC system to detect a change of state in the stoplight switch. Brake pedal MUST briefly be applied and released on all vehicles equipped with brake pedal position input. This is done during the KOER On-Demand Self-Test. Transmission Control Switch Test
This tests the ability of the Electronic EC system to detect a change of state in the transmission control switch (TCS). The switch MUST briefly be cycled on all vehicles equipped with TCS input. This is done during the KOER On-Demand Self-Test. Power Steering Pressure Test
This tests the ability of the Electronic EC system to detect a change in power steering system fluid pressure. The steering wheel MUST briefly be turned at least 1/4 of a revolution on vehicles equipped with a power steering pressure (PSP) switch or sensor. This is done during the KOER On-Demand Self-Test.

DIAGNOSTIC PROCESS REVIEW DAY ONE
1-20 September, 2003 Diagnosis and Testing
Diagnostic Tests
Quick Test (Continued)
Continuous Memory Self-Test Testing for Continuous Memory DTCs is a functional test of the powertrain control module performed under any condition (engine running or off) with the key on. Unlike the KOEO and KOER self-tests, which can only be activated on demand, the Continuous Memory Self-Test is always active. This test detects failures contributing to driveability or emission concerns. The vehicle may need to be driven or the OBDII Drive Cycle completed to allow the PCM to detect a fault. Refer to «Drive Cycles» for more information. When a fault is stored in memory, a Diagnostic Trouble Code (DTC) is output on the data link at the end of the test when requested by a scan tool. Continuous Memory DTCs are especially valuable when diagnosing intermittent faults because a fault does not need to be present at the time of testing. There are two types of Continuous Memory DTCs. The first type is an emission related malfunction indicator lamp (MIL) code that illuminates the CHECK ENGINE or SERVICE ENGINE SOON indicator in the instrument cluster. The second is a non-emission related non-MIL code that never illuminates the MIL. For emission related MIL codes, the PCM stores the DTC in continuous memory when a fault is detected for the first time. At this point, the DTC does not illuminate the MIL and is now considered a pending code. The purpose of pending codes is to assist in repair verification by reporting a pending DTC after one drive cycle. If the same fault is detected after the next drive cycle, the emission related MIL code illuminates the MIL. The MIL remains on even if the fault is intermittent. The MIL is extinguished if the fault is not present through three consecutive drive cycles or a PCM reset is performed. Also, an emission related pending MIL and non-emission related (non-MIL) code is erased after approximately 40-80 vehicle warm up cycles or a PCM reset. Any scan tool that meets OBDII requirements can access Continuous Memory to retrieve emission related MIL DTCs. However, not all scan tools access pending and non-emission related (non-MIL) DTCs in the same way.

DAY ONE DIAGNOSTIC PROCESS REVIEW
Diagnosis and Testing September, 2003 1-21
Diagnostic Tests
Parameter Identifier (PID) Monitor
Typical WDS DataLogger PID Display Parameter Identifiers are sensor output values displayed on a scan tool and are chosen based on the vehicle concern. During a guided diagnostic routine, PIDs are accessed that relate to a specific pinpoint test. The pinpoint test directs the technician to the specific PID(s) and tells the technician exactly what to look for, or how to manipulate them.
Remember that a component not providing an expected value may be affected by another sensor’s output (for example, an IAC value that is out of its expected range could be affected by the TP sensor’s output).
EP2117-A/VF
DIAGNOSTIC PROCESS REVIEW DAY ONE
1-22 September, 2003 Diagnosis and Testing
Diagnostic Tests
WDS Guided Diagnostics
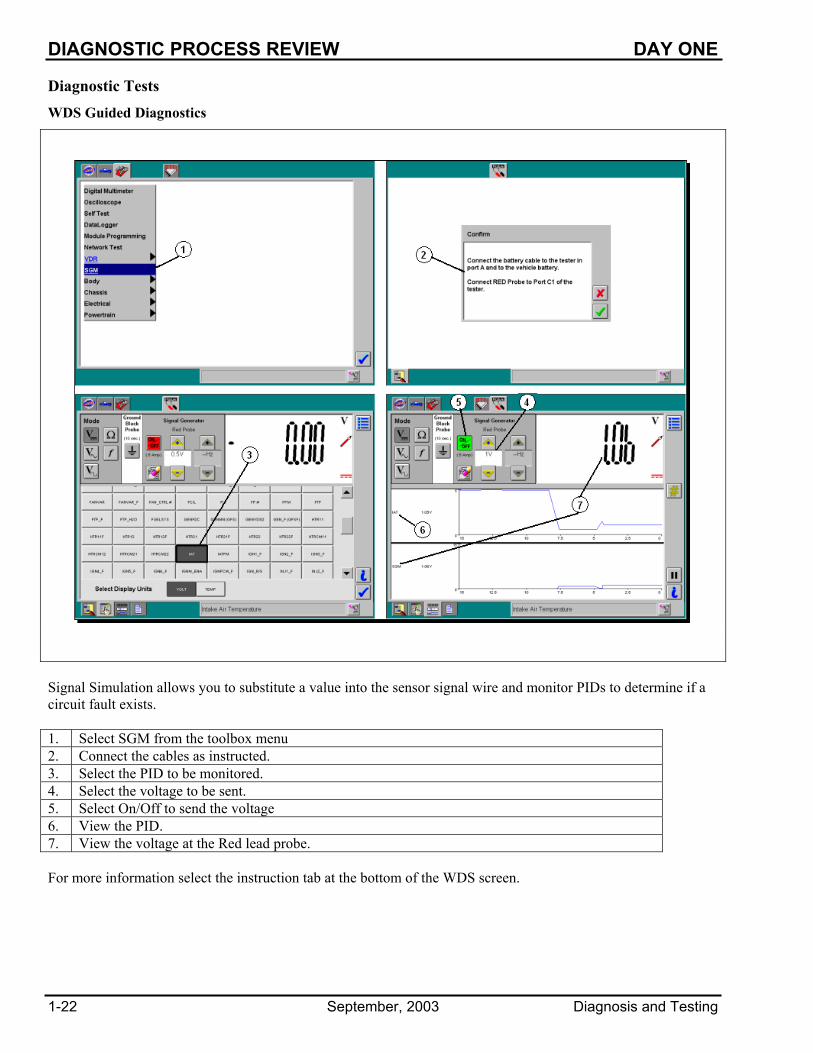
Signal Simulation allows you to substitute a value into the sensor signal wire and monitor PIDs to determine if a circuit fault exists. 1. Select SGM from the toolbox menu 2. Connect the cables as instructed. 3. Select the PID to be monitored. 4. Select the voltage to be sent. 5. Select On/Off to send the voltage 6. View the PID. 7. View the voltage at the Red lead probe. For more information select the instruction tab at the bottom of the WDS screen.
DAY ONE DIAGNOSTIC PROCESS REVIEW
Diagnosis and Testing September, 2003 1-23
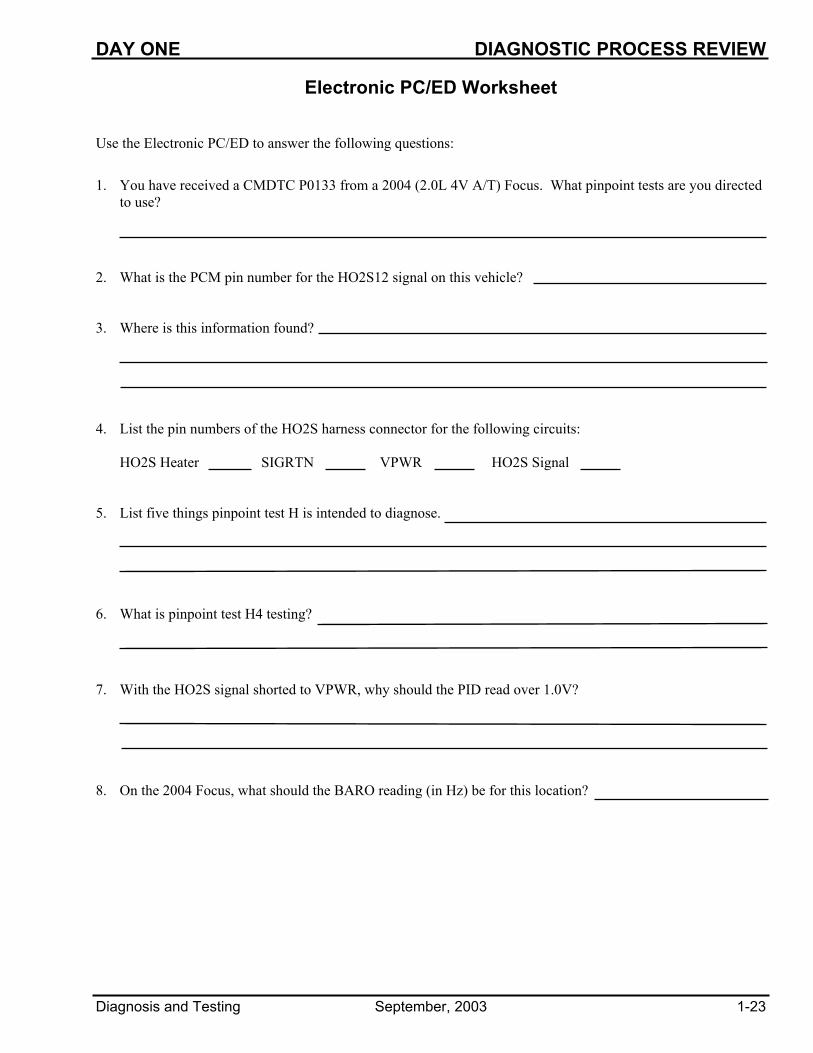
Electronic PC/ED Worksheet Use the Electronic PC/ED to answer the following questions:
1. You have received a CMDTC P0133 from a 2004 (2.0L 4V A/T) Focus. What pinpoint tests are you directed to use?
2. What is the PCM pin number for the HO2S12 signal on this vehicle?
3. Where is this information found?
4. List the pin numbers of the HO2S harness connector for the following circuits:
HO2S Heater SIGRTN VPWR HO2S Signal
5. List five things pinpoint test H is intended to diagnose.
6. What is pinpoint test H4 testing?
7. With the HO2S signal shorted to VPWR, why should the PID read over 1.0V?
8. On the 2004 Focus, what should the BARO reading (in Hz) be for this location?

DIAGNOSTIC PROCESS REVIEW DAY ONE
1-24 January, 2006 Diagnosis and Testing
On-Vehicle Worksheet Perform the PCM Quick Test in Section 3 Step QT1 in the PC/ED. 1. Were any obvious problems found during the preliminary checks?
2. What OASIS symptom code would help you diagnose a rough running engine while driving?
3. Record all codes retrieved during the Quick Test.
KOEO ODDTC KOER ODDTC
KOEO CMDTC KOER CMDTC
PENDING
4. List the PIDs recorded in the Freeze Frame Data.
5. What does Freeze Frame Data tell the technician?
6. What pinpoint test is the technician directed to if the scan tool does not communicate with the vehicle?
7. Where is the technician directed to go if there are no codes present?

DAY ONE IGNITION SYSTEM DIAGNOSIS & TESTING
Diagnosis and Testing September, 2003 2-1
Student Objective • Use critical thinking skills and available resources to diagnose and test the Ignition System
- Identify types of misfires
- Explain the relationship of ignition patterns to diagnosis
- Explain how to diagnose misfire concerns
- Explain how to diagnose No Start concerns
Content • Ignition Concerns
- Misfire
- No Start
• Misfire Diagnosis
- Power Balance
- Spark Duration/Peak KV
- Normal Duration – Normal Peak KV
- Short Duration – High Peak KV
- Long Duration – Low Peak KV
- COP Misfire Diagnosis
- Power Balance
- Live Display
- COP Coil Stress Test
- WDS Oscilloscope
• No-Start Diagnosis
- Spark tester
- Test light

IGNITION SYSTEM DIAGNOSIS & TESTING DAY ONE
2-2 September, 2003 Diagnosis and Testing
Ignition Concerns
EP2200-A/VF
2
4
1
3
Ignition System Diagnostic Tools Item Description Item Description
1 WDS power balance display 3 Spark tester 2 WDS spark duration and peak KV display 4 Test light
There are two types of ignition system concerns: Misfires and No Start conditions. Misfires can be caused by weak spark, no spark, incorrect air/fuel mixtures, or base engine problems. Another cause of misfire is a plugged tube in a port-fed EGR system (typical application is a 4.2L engine). If a tube, or tubes, in a port-fed EGR system become restricted, that cylinder (or cylinders) receives no EGR and the other cylinders receive all of the EGR, possibly causing a random misfire. A misfire at idle may not turn on the MIL because the catalyst temperature at idle may not exceed a level that would damage the catalyst. A No Start condition can be caused by a fault in the ignition system primary or secondary circuitry, a fuel system concern, or a base engine concern. Diagnostic Tools • WDS
- Self-Test (check for codes first) - Power Balance (identify the cylinder of concern) - Relative Compression (rule out a mechanical concern) - Fuel System Tests (Fuel Pressure/Leakdown, Relative Injector Flow) - Spark Duration/Peak KV - Oscilloscope (detailed signal analysis)
• Spark Tester • Test Light

DAY ONE IGNITION SYSTEM DIAGNOSIS & TESTING
Diagnosis and Testing September, 2003 2-3
Misfires
Profile Correction
The misfire monitor is not active until the profile correction is learned. Profile correction software is used to learn and correct for mechanical inaccuracies in the crankshaft trigger wheel tooth spacing. Actual mechanical inaccuracies may not be visually detectable. The profile correction is learned during closed throttle, non-braking, de-fueled decelerations in the 60 to 40 mph range after exceeding 60 mph. This may have to be done up to three times for the profile correction to be learned.
If the battery is disconnected or Keep Alive Memory is cleared, the profile correction has to be relearned to enable the misfire monitor. If the profile correction is not yet learned, the WDS monitor screen still indicates the Misfire Monitor has completed (misfire display is green), but does not pick up a misfire. You must look at the MP_LRN PID to determine if the Misfire Monitor is enabled (displays YES for enabled/NO for disabled). NOTE: NGS refers to this PID as CKP_LWP. Type A misfire
A type A misfire is a severe misfire that could result in overheating of the catalytic converter. It is counted over a continuous 200 revolution period. At the end of each evaluation period a total misfire rate and the misfire rate for each individual cylinder is computed. It is then compared to a calibrated parameter obtained from an engine speed/load table to determine if it is severe enough to cause catalyst damage. Once a type A misfire occurs, a DTC is stored and the MIL blinks once per second. If a type A misfire persists, it could cause over-temperature catalyst damage. The fuel injector to that cylinder may be shut off for a period. For any engine with six or more cylinders, up to two fuel injectors may be shut off at one time. For performance and safety reasons, the fuel shut off feature is not used on four cylinder engines. The MIL flashes on the first occurrence of a type A misfire. This is an exception to the two consecutive drive cycles rule. Type B misfire:
A type B misfire is not severe enough to overheat the catalytic converter but could result in increased emission levels and is counted over a continuous 1000 revolution period. At the end of each evaluation period, a total misfire rate for the engine is computed. It is then compared to a calibrated parameter in the PCM to determine if the misfire rate is severe enough to cause emissions to exceed 1.5 times the standard.
The DTC associated with multiple cylinder misfire for a type A or type B misfire is DTC P0300.
The DTCs associated with an individual cylinder misfire for a type A or type B misfire are DTCs P0301 - P0310.

IGNITION SYSTEM DIAGNOSIS & TESTING DAY ONE
2-4 September, 2003 Diagnosis and Testing
Misfire Diagnosis
Power Balance
WDS Power Balance Test The WDS Power Balance Test identifies a problem with the power contribution of a cylinder when the engine is running between 500 rpm and a calibrated maximum RPM. When the pre-calibrated out of range rpm is reached, the RPM bar graph turns yellow indicating the data retrieved from the DCL may not be reliable. The RPM displayed at the bottom of the screen is the average RPM of all cylinders in a complete engine cycle. A drop in RPM identified in one or more cylinders may be caused by a fault in the ignition system, fuel system, or the cylinder’s relative compression. Not all RPM drops are plotted during a live display. If an RPM drop is felt but not displayed, an event capture should be made. During playback, all of the RPM drops are displayed. The button on the Red Roving Probe activates the capture feature when connected to port 1. This allows for convenient road test capture.
EP2201-A/VF
DAY ONE IGNITION SYSTEM DIAGNOSIS & TESTING
Diagnosis and Testing September, 2003 2-5
Misfire Diagnosis
Spark Duration/Peak KV
Normal Duration – Normal Peak KV
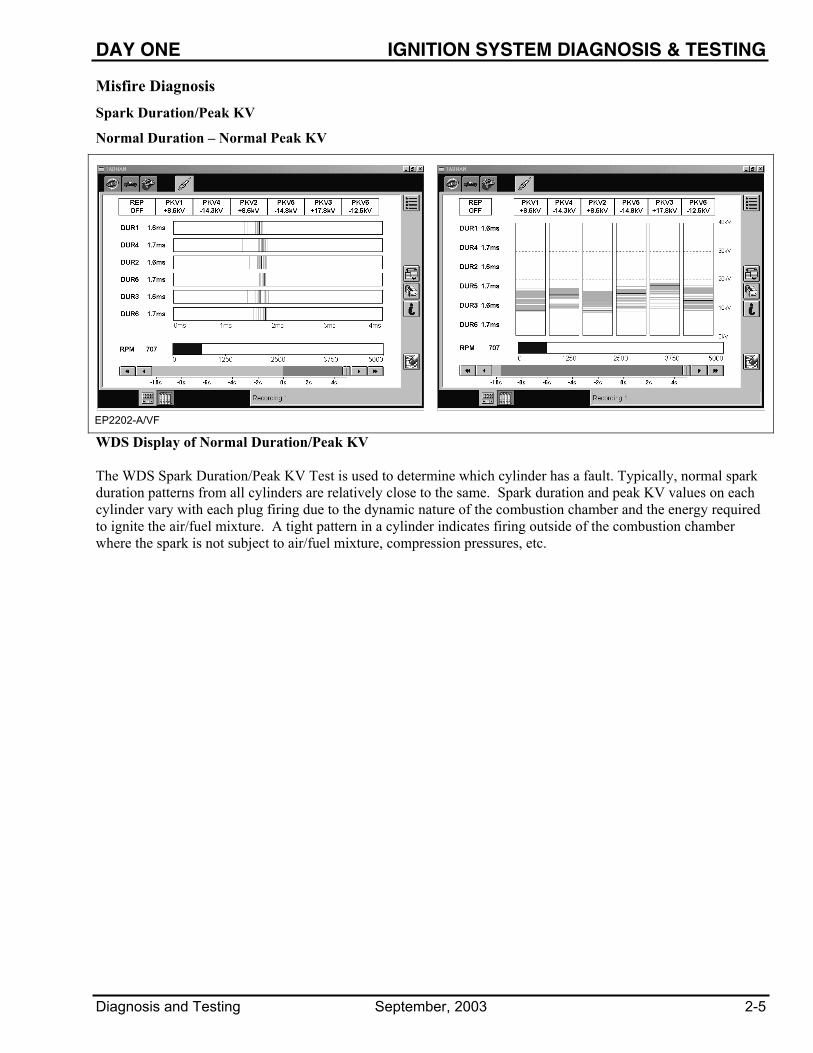
WDS Display of Normal Duration/Peak KV The WDS Spark Duration/Peak KV Test is used to determine which cylinder has a fault. Typically, normal spark duration patterns from all cylinders are relatively close to the same. Spark duration and peak KV values on each cylinder vary with each plug firing due to the dynamic nature of the combustion chamber and the energy required to ignite the air/fuel mixture. A tight pattern in a cylinder indicates firing outside of the combustion chamber where the spark is not subject to air/fuel mixture, compression pressures, etc.
EP2202-A/VF

IGNITION SYSTEM DIAGNOSIS & TESTING DAY ONE
2-6 September, 2003 Diagnosis and Testing
Misfire Diagnosis
Spark Duration/Peak KV
Short Duration – High Peak KV
WDS Display of Short Duration – High Peak KV This pattern is typical of an open in the secondary (higher than normal resistance) such as a wide spark plug gap, damaged spark plug, open in the secondary wire or lean air/fuel mixture.
EP2203-A/VF

DAY ONE IGNITION SYSTEM DIAGNOSIS & TESTING
Diagnosis and Testing September, 2003 2-7
Misfire Diagnosis
Spark Duration/Peak KV Long Duration – Low Peak KV
WDS Display of Long Duration – Low Peak KV This pattern is typical of lower than normal resistance such as a short in the secondary, a fouled spark plug, a secondary wire arcing to ground, a narrow spark plug gap, or a rich air/fuel mixture.
EP2204-A/VF
IGNITION SYSTEM DIAGNOSIS & TESTING DAY ONE
2-8 September, 2003 Diagnosis and Testing
COP Misfire Diagnosis Power Balance Test
Power Balance Test Relative Compression Test
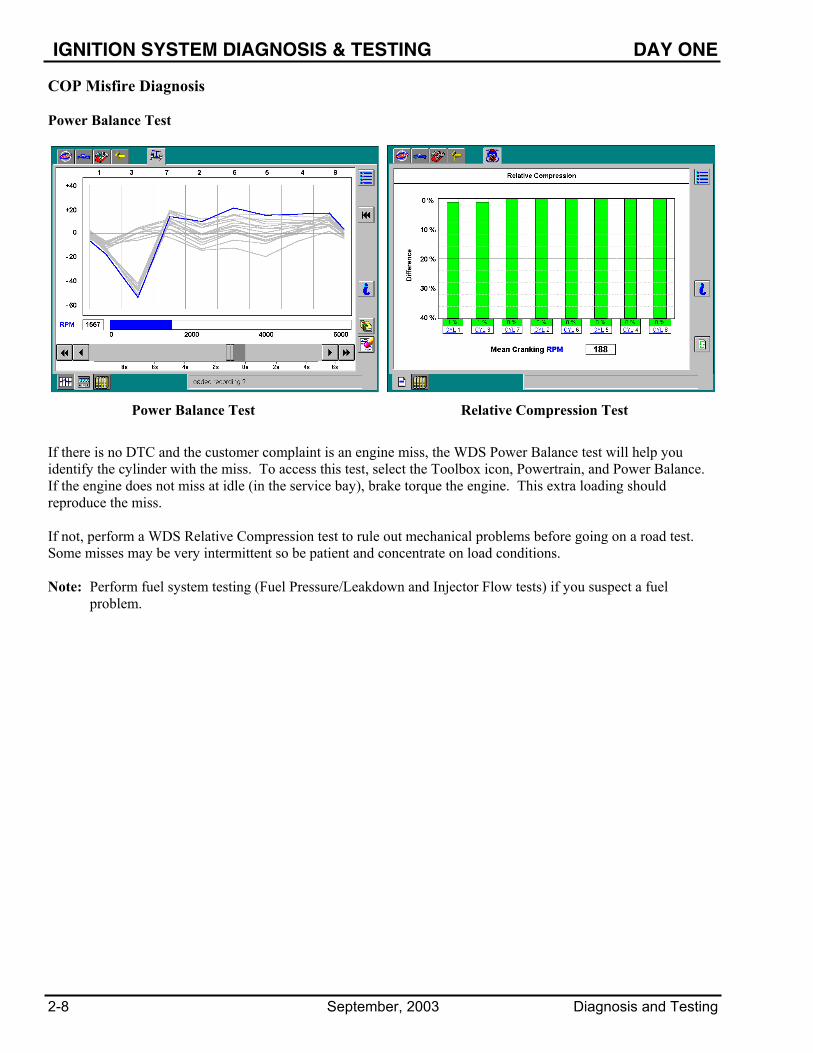
If there is no DTC and the customer complaint is an engine miss, the WDS Power Balance test will help you identify the cylinder with the miss. To access this test, select the Toolbox icon, Powertrain, and Power Balance. If the engine does not miss at idle (in the service bay), brake torque the engine. This extra loading should reproduce the miss. If not, perform a WDS Relative Compression test to rule out mechanical problems before going on a road test. Some misses may be very intermittent so be patient and concentrate on load conditions. Note: Perform fuel system testing (Fuel Pressure/Leakdown and Injector Flow tests) if you suspect a fuel
problem.

DAY ONE IGNITION SYSTEM DIAGNOSIS & TESTING
Diagnosis and Testing September, 2003 2-9
COP Misfire Diagnosis
Live Display
Low Duration Values High Peak KV
When performing an ignition system test, attach the WDS COP ignition clips to the suspect coil (red probe) and a known good coil (black probe). Look for spark duration (DUR) and kilovolt (KV) values that stand out. The concern is ignition related if the values displayed on the red probe (suspect cylinder) vary greatly from the values displayed on the black probe (known good cylinder). Use the WDS oscilloscope with the COP kit to determine if a faulty spark plug or a faulty COP coil causes the concern. If the WDS oscilloscope is not available, swap the coil of the misfiring cylinder with the coil of any other cylinder. The coil is faulty if the problem moves with the coil. The spark plug is the faulty component if the problem stays with the cylinder.
IGNITION SYSTEM DIAGNOSIS & TESTING DAY ONE
2-10 September, 2003 Diagnosis and Testing
COP Misfire Diagnosis
COP Coil Stress Test
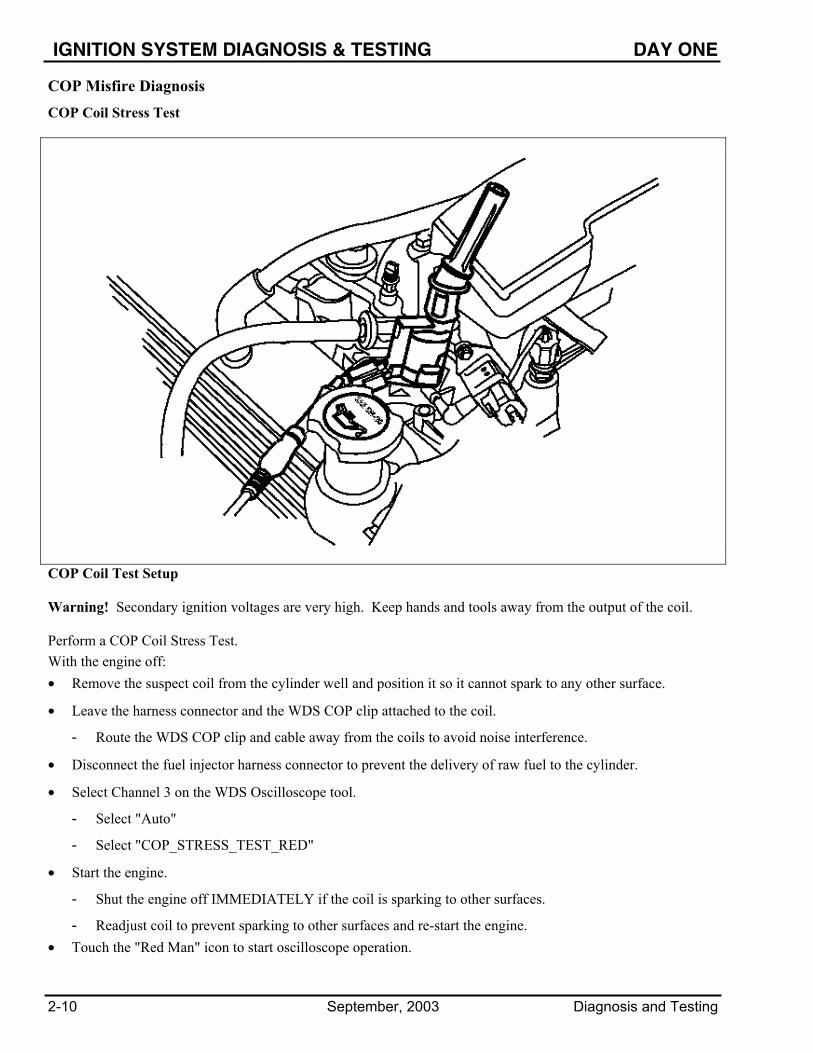
COP Coil Test Setup Warning! Secondary ignition voltages are very high. Keep hands and tools away from the output of the coil. Perform a COP Coil Stress Test. With the engine off: • Remove the suspect coil from the cylinder well and position it so it cannot spark to any other surface.
• Leave the harness connector and the WDS COP clip attached to the coil.
- Route the WDS COP clip and cable away from the coils to avoid noise interference.
• Disconnect the fuel injector harness connector to prevent the delivery of raw fuel to the cylinder.
• Select Channel 3 on the WDS Oscilloscope tool.
- Select "Auto"
- Select "COP_STRESS_TEST_RED"
• Start the engine.
- Shut the engine off IMMEDIATELY if the coil is sparking to other surfaces.
- Readjust coil to prevent sparking to other surfaces and re-start the engine. • Touch the "Red Man" icon to start oscilloscope operation.

DAY ONE IGNITION SYSTEM DIAGNOSIS & TESTING
Diagnosis and Testing September, 2003 2-11
COP Misfire Diagnosis
WDS Oscilloscope
Properly Functioning COP Coil All settings are pre-configured – no adjustments are necessary. The type of waveform displayed on the oscilloscope shows whether it is a faulty coil or plug that is causing the concern. If the waveform is similar to the waveform shown above, the coil is functioning properly. Replace the spark plug.

IGNITION SYSTEM DIAGNOSIS & TESTING DAY ONE
2-12 September, 2003 Diagnosis and Testing
COP Misfire Diagnosis
WDS Oscilloscope (Continued)
Above are examples of problem coils. Notice the difference between these waveforms and the good waveform on the previous page. Misfires can sometimes be difficult to diagnose, making the WDS Oscilloscope an important tool.

DAY ONE IGNITION SYSTEM DIAGNOSIS & TESTING
Diagnosis and Testing September, 2003 2-13
No Start Condition Diagnosis
EP2205-A/VF Spark Tester and Test Lamp A quick and easy check to determine if the no-start condition is a result of an ignition system fault is to use a spark tester and test lamp. The spark tester is used to see if there is sufficient spark to fire the spark plug. If sufficient spark is present on all cylinders, the fault lies somewhere in the air/fuel system or there is a base engine concern. If spark is not present, the fault lies somewhere in the ignition system. The test lamp is used to see if there is a CD (coil driver) signal present from the PCM to the ignition coil(s) while the engine is cranking.

IGNITION SYSTEM DIAGNOSIS & TESTING DAY ONE
2-14 September, 2003 Diagnosis and Testing
Ignition – Bench Worksheet Select the following WDS recording:
• "IGNITION - Expedition 5.4L – BENCH" - Recording Group: COIL1, Description: COIL_DISCONNECT
View the WDS recording of a 2003 Expedition with a 5.4L engine and answer the following questions:
1. At approximately what time during the recording did the Misfire Monitor detect a misfire?
2. Do any of the injectors indicate they are not functioning properly?
3. If so, which injector is malfunctioning?
4. On which bank of the engine does the recording indicate the misfire?
5. Which PIDs on the recording lead you to this conclusion?
6. Why did the system go into open loop?
7. What happens to HO2S22 after the misfire is detected?
DAY ONE IGNITION SYSTEM DIAGNOSIS & TESTING
Diagnosis and Testing January, 2006 2-15
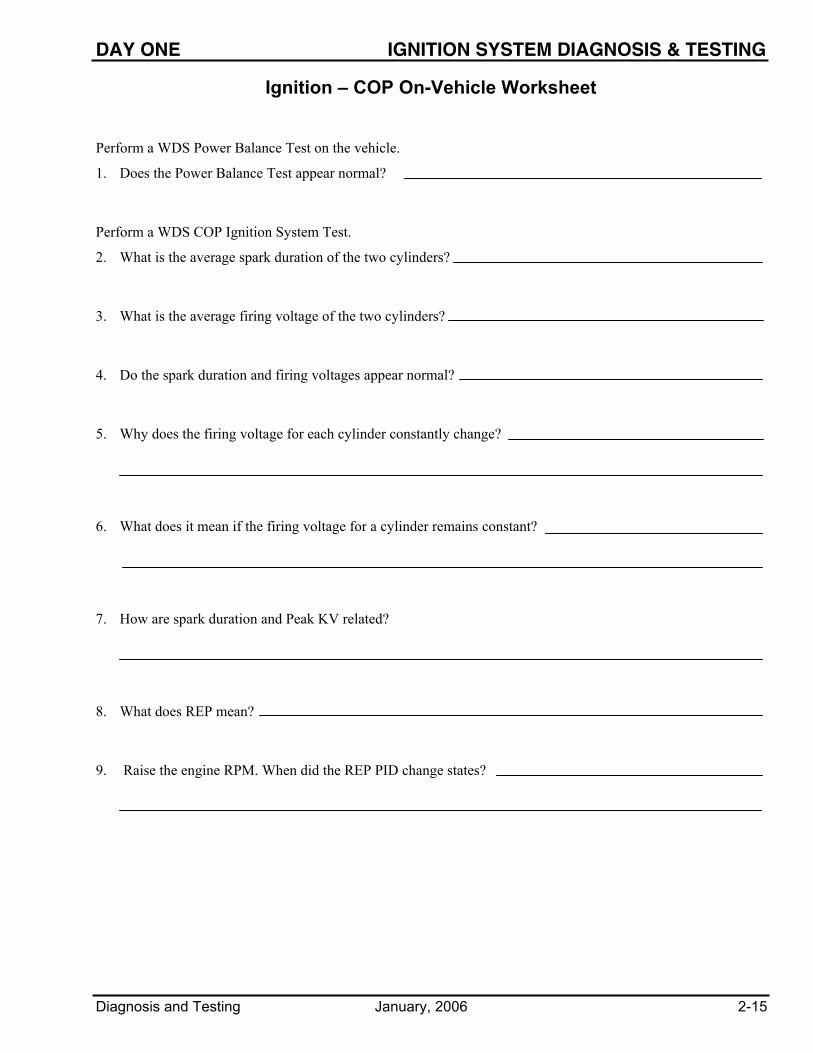
Ignition – COP On-Vehicle Worksheet
Perform a WDS Power Balance Test on the vehicle.
1. Does the Power Balance Test appear normal?
Perform a WDS COP Ignition System Test.
2. What is the average spark duration of the two cylinders?
3. What is the average firing voltage of the two cylinders?
4. Do the spark duration and firing voltages appear normal?
5. Why does the firing voltage for each cylinder constantly change?
6. What does it mean if the firing voltage for a cylinder remains constant?
7. How are spark duration and Peak KV related?
8. What does REP mean?
9. Raise the engine RPM. When did the REP PID change states?

IGNITION SYSTEM DIAGNOSIS & TESTING DAY ONE
2-16 September, 2003 Diagnosis and Testing
Ignition – HDR On-Vehicle Worksheet Perform a WDS Power Balance Test on the vehicle.
1. Does the Power Balance Test appear normal?
Perform a WDS Ignition System Test.
2. What is the average spark duration of all the cylinders?
3. What is the average firing voltage of all the cylinders?
4. Do the spark duration and firing voltages appear normal?
5. Why does the firing voltage for each cylinder constantly change?
6. What does it mean if the firing voltage for a cylinder remains constant?
7. Why do some of the cylinders have a (+) and some have a (-) before the cylinder when looking at peak KV?
8. How can you tell which cylinders are paired together when looking at a WDS Ignition Test?

DAY ONE IGNITION SYSTEM DIAGNOSIS & TESTING
Diagnosis and Testing September, 2003 2-17
NOTES
IGNITION SYSTEM DIAGNOSIS & TESTING DAY ONE
2-18 September, 2003 Diagnosis and Testing
NOTES

DAY ONE FUEL SYSTEM DIAGNOSIS & TESTING
Diagnosis and Testing September, 2003 3-1
Student Objective
• Use critical thinking skills and available resources to diagnose and test the Fuel System, including:
- Fuel delivery
- Identify the types of fuel delivery systems
- Describe conditions related to fuel delivery concerns
- Describe the testing related to fuel delivery concerns
- Fuel control
- Describe how to diagnose a contaminated MAF sensor
- Identify open/closed loop conditions
- Explain conditions related to abnormal fuel trims
- Describe the testing related to fuel control concerns
Content
• Fuel Delivery
- Return-type fuel system
- Returnless-type fuel system
- Mechanical
- Electronic
- Fuel pressure and leakdown test
• Fuel Control
- MAF/BARO
- Open loop operation
- Closed loop operation
- Fuel trims
- Normal fuel trim
- Abnormal fuel trim (1 bank)
- Abnormal fuel trim (both banks)
- Injector flow testing
• Fuel economy testing
FUEL SYSTEM DIAGNOSIS & TESTING DAY ONE
3-2 September, 2003 Diagnosis and Testing
Fuel Delivery System
EP2300-A/VF
1 2
45
3
8
6
7
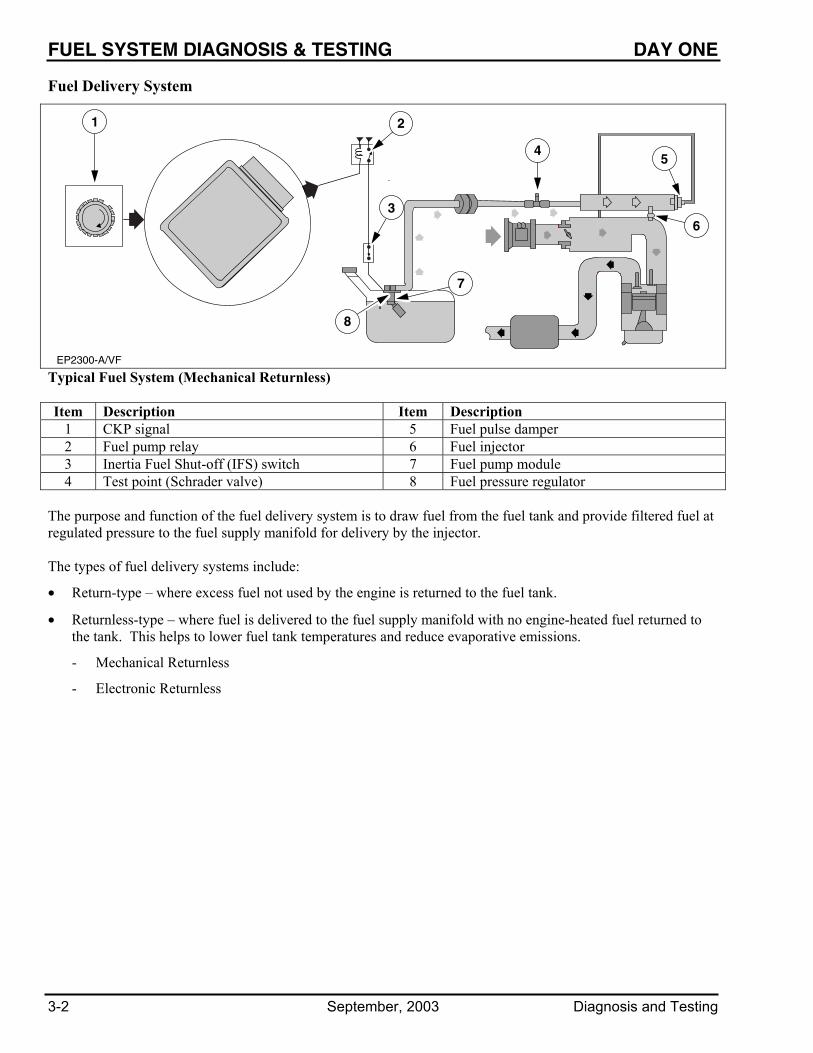
Typical Fuel System (Mechanical Returnless) Item Description Item Description
1 CKP signal 5 Fuel pulse damper 2 Fuel pump relay 6 Fuel injector 3 Inertia Fuel Shut-off (IFS) switch 7 Fuel pump module 4 Test point (Schrader valve) 8 Fuel pressure regulator
The purpose and function of the fuel delivery system is to draw fuel from the fuel tank and provide filtered fuel at regulated pressure to the fuel supply manifold for delivery by the injector. The types of fuel delivery systems include:
• Return-type – where excess fuel not used by the engine is returned to the fuel tank.
• Returnless-type – where fuel is delivered to the fuel supply manifold with no engine-heated fuel returned to the tank. This helps to lower fuel tank temperatures and reduce evaporative emissions.
- Mechanical Returnless
- Electronic Returnless

DAY ONE FUEL SYSTEM DIAGNOSIS & TESTING
Diagnosis and Testing September, 2003 3-3
Fuel Delivery System
Return-type Fuel System
EP2301-A/VF
1
4
5
3 8
7
9
2
6
Typical Return-type Fuel System Item Description Item Description
1 CKP signal 6 Schrader valve 2 Powertrain Control Module (PCM) 7 Fuel pressure regulator 3 Fuel pump relay 8 Pulse damper 4 Inertia Fuel Shut-off (IFS) switch 9 Fuel pump module 5 Fuel injector
The return-type fuel system uses an electric fuel pump with a mechanical regulator on the fuel supply manifold. Excess fuel not used by the engine is returned to the fuel tank. A pressure test point (Schrader valve) is located on the fuel supply manifold. This is used to connect the WDS or other diagnostic tools when measuring fuel pressure.

FUEL SYSTEM DIAGNOSIS & TESTING DAY ONE
3-4 September, 2003 Diagnosis and Testing
Fuel Delivery System
Mechanical Returnless Fuel System
EP2302-A/VF
A
B
Typical Mechanical Returnless-type Fuel System
The mechanical returnless fuel system uses an electric pump. The fuel pressure in this system is regulated mechanically by an in-tank pressure regulator (A).
A Schrader valve (B) is used as a pressure test point is located on the fuel supply manifold. This is used to connect the WDS or other diagnostic tools when measuring fuel pressure. 3-Port Fuel Filter
EP2303-A/VF
12
3
Fuel filter with quick-connect fittings
Some mechanical returnless fuel systems now use a three-port fuel filter.
• 1: Fuel pickup
• 2: Fuel delivery to engine
• 3: Fuel returned to tank

DAY ONE FUEL SYSTEM DIAGNOSIS & TESTING
Diagnosis and Testing September, 2003 3-5
Fuel Delivery System
Electronic Returnless Fuel System
EP1139-A/VF
2
1
43
Typical Electronic Returnless-type Fuel System Item Description Item Description
1 Fuel Rail Pressure (FRP) sensor 3 Fuel Pump Driver Module (FPDM) 2 Engine Fuel Temperature (EFT) sensor
(not on all vehicles) 4 Parallel Pressure Relief Valve (PPRV)
The electronic returnless fuel delivery system uses an electric pump. Fuel pressure in this system is controlled electronically by varying the fuel pump speed. The PCM commands a duty cycle to the Fuel Pump Driver Module (FPDM), which modulates the voltage to the fuel pump to achieve the proper fuel system pressure. The duty cycle is based on load and engine fuel temperature, with feedback from the Fuel Rail Pressure (FRP) sensor. Engine fuel temperature may be an inferred value or input from an engine fuel temperature sensor (example: ’98 ZX2). The Parallel Pressure Relief Valve (PPRV) combines the function of a fuel pump outlet check valve and a relief valve. It relieves excess pressure, through the fuel pump, created by hot expanding fuel in the fuel supply manifold during engine off conditions. It takes 1 psi of pressure to allow fuel to flow to the fuel rail. When the engine is off, fuel is returned to the tank if the pressure exceeds 50 psi. A pressure test point (Schrader valve) may be located on the fuel supply manifold to allow the connection of diagnostic tools. On vehicles without the Schrader valve (example: 2001 Focus 2.0L Zetec engine), fuel pressure may be monitored by accessing the FP (fuel pressure) PID.
EP2304-A/VF

FUEL SYSTEM DIAGNOSIS & TESTING DAY ONE
3-6 September, 2003 Diagnosis and Testing
Fuel Delivery System
Fuel Pressure and Leakdown Test
EP2305-A/VF
Fuel Pump Running Pressure Test Fuel Pressure and Leakdown Test This test first checks the vehicle fuel system's ability to supply and maintain adequate system pressure. The test is comprised of two distinct phases:
• A pump running pressure test
• A pump off leakdown pressure test If the fuel system passes these tests, you are also able to initiate an engine running test and initiate the relative injector flow test. The engine running test displays the continuously updated measured fuel system pressure.
DAY ONE FUEL SYSTEM DIAGNOSIS & TESTING
Diagnosis and Testing September, 2003 3-7
Fuel Delivery System
Fuel Pressure and Leakdown Test (continued)
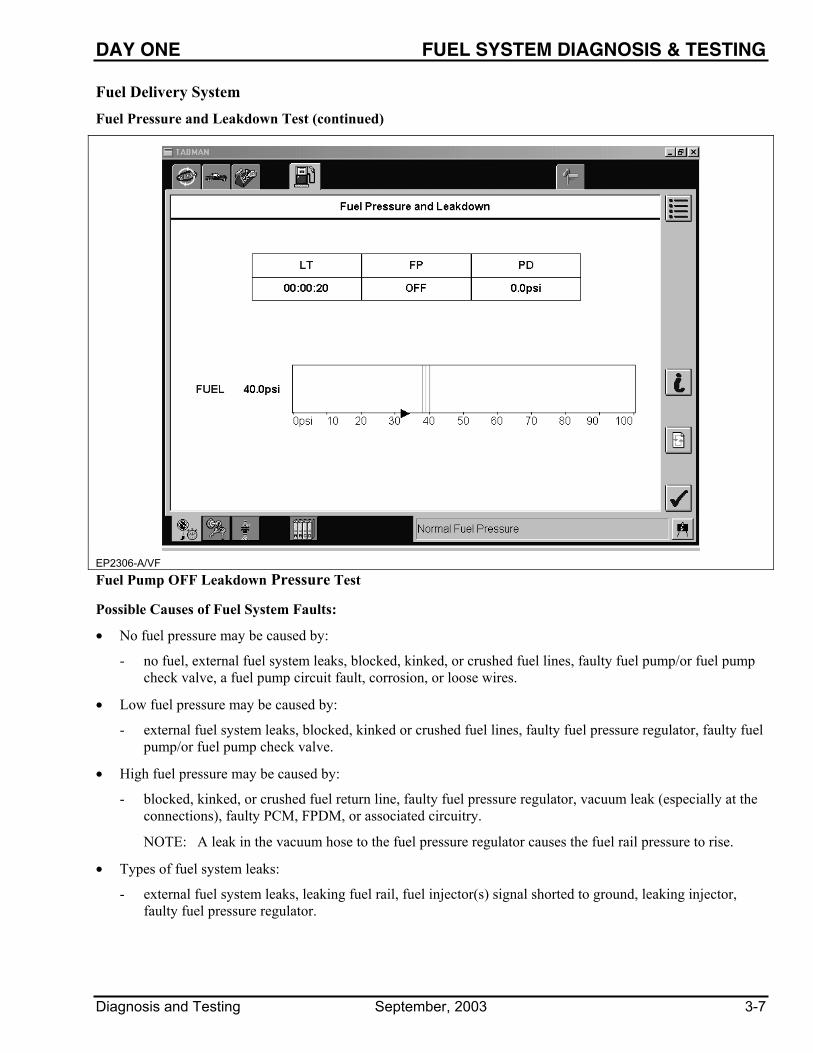
EP2306-A/VF Fuel Pump OFF Leakdown Pressure Test Possible Causes of Fuel System Faults:
• No fuel pressure may be caused by:
- no fuel, external fuel system leaks, blocked, kinked, or crushed fuel lines, faulty fuel pump/or fuel pump check valve, a fuel pump circuit fault, corrosion, or loose wires.
• Low fuel pressure may be caused by:
- external fuel system leaks, blocked, kinked or crushed fuel lines, faulty fuel pressure regulator, faulty fuel pump/or fuel pump check valve.
• High fuel pressure may be caused by:
- blocked, kinked, or crushed fuel return line, faulty fuel pressure regulator, vacuum leak (especially at the connections), faulty PCM, FPDM, or associated circuitry.
NOTE: A leak in the vacuum hose to the fuel pressure regulator causes the fuel rail pressure to rise.
• Types of fuel system leaks:
- external fuel system leaks, leaking fuel rail, fuel injector(s) signal shorted to ground, leaking injector, faulty fuel pressure regulator.
FUEL SYSTEM DIAGNOSIS & TESTING DAY ONE
3-8 September, 2003 Diagnosis and Testing
Fuel Control
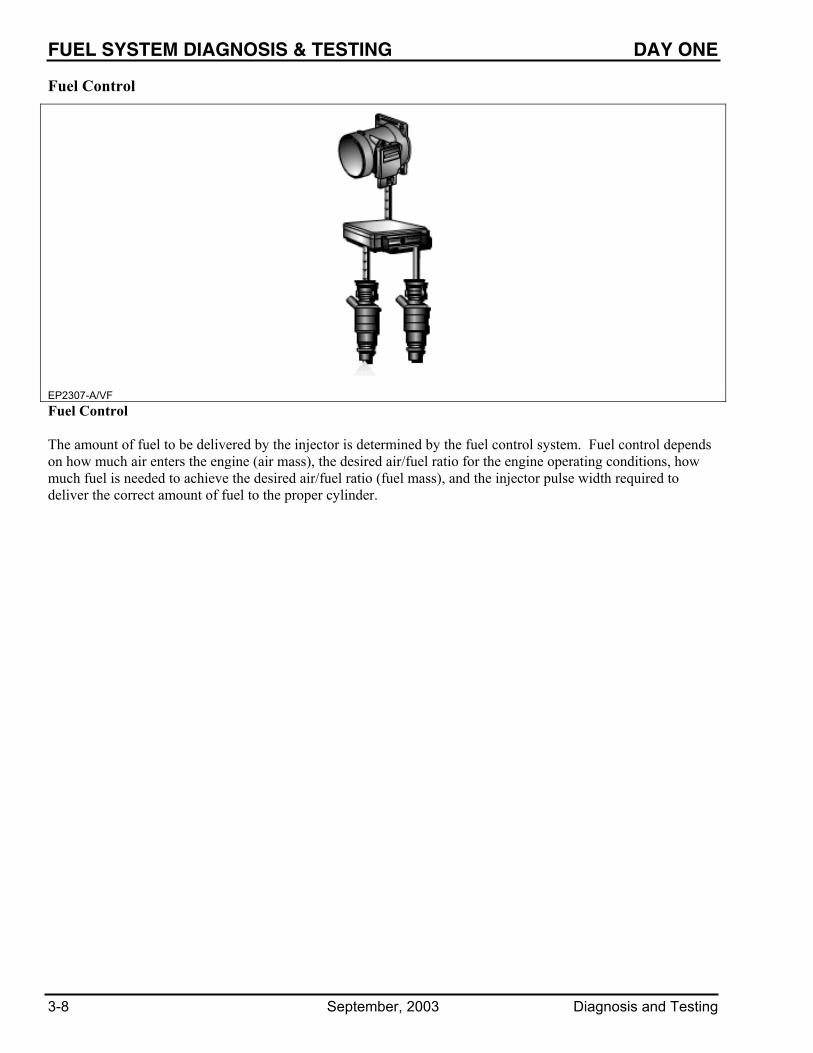
EP2307-A/VF Fuel Control The amount of fuel to be delivered by the injector is determined by the fuel control system. Fuel control depends on how much air enters the engine (air mass), the desired air/fuel ratio for the engine operating conditions, how much fuel is needed to achieve the desired air/fuel ratio (fuel mass), and the injector pulse width required to deliver the correct amount of fuel to the proper cylinder.
DAY ONE FUEL SYSTEM DIAGNOSIS & TESTING
Diagnosis and Testing September, 2003 3-9
Fuel Control
Heated Oxygen Sensor (HO2S)
EP2308-A/VF
O2 O2
O2
O2
O2O2
02
O2
O2O2
O2
O2 O2
O2 O2
O2
O2
O2
O2
4
3
2
O2
1
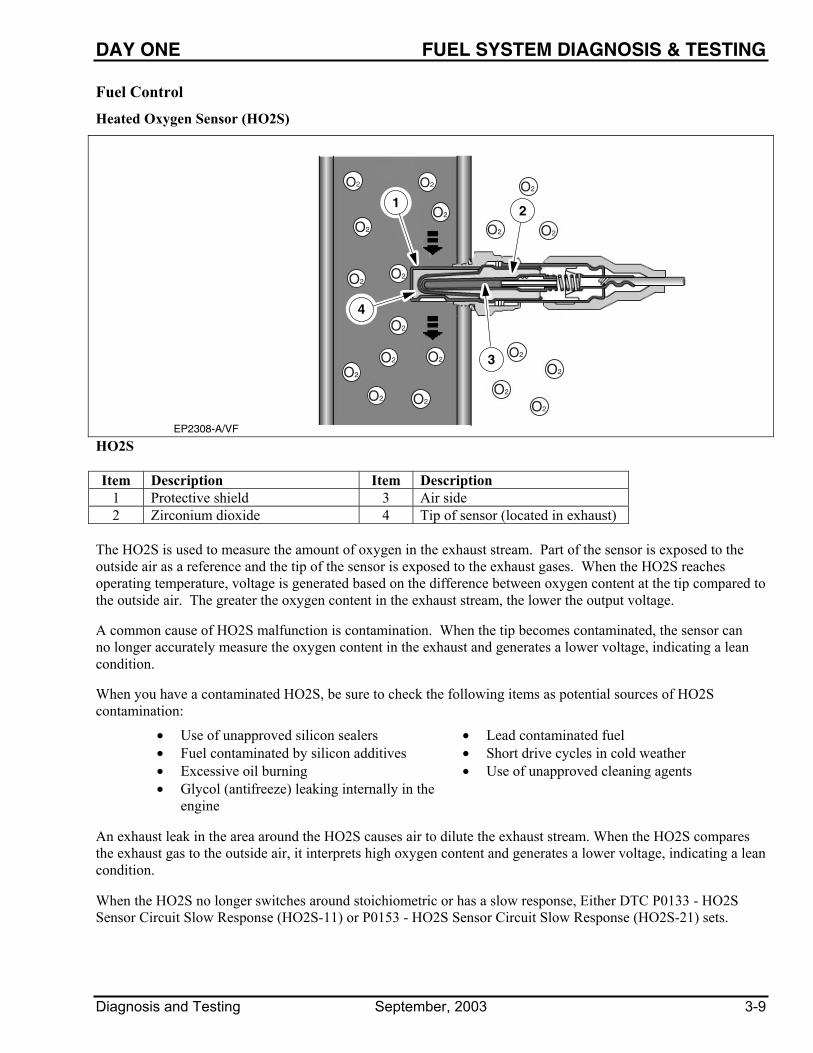
HO2S Item Description Item Description
1 Protective shield 3 Air side 2 Zirconium dioxide 4 Tip of sensor (located in exhaust)
The HO2S is used to measure the amount of oxygen in the exhaust stream. Part of the sensor is exposed to the outside air as a reference and the tip of the sensor is exposed to the exhaust gases. When the HO2S reaches operating temperature, voltage is generated based on the difference between oxygen content at the tip compared to the outside air. The greater the oxygen content in the exhaust stream, the lower the output voltage.
A common cause of HO2S malfunction is contamination. When the tip becomes contaminated, the sensor can no longer accurately measure the oxygen content in the exhaust and generates a lower voltage, indicating a lean condition.
When you have a contaminated HO2S, be sure to check the following items as potential sources of HO2S contamination:
• Use of unapproved silicon sealers • Lead contaminated fuel • Fuel contaminated by silicon additives • Short drive cycles in cold weather • Excessive oil burning • Use of unapproved cleaning agents • Glycol (antifreeze) leaking internally in the
engine
An exhaust leak in the area around the HO2S causes air to dilute the exhaust stream. When the HO2S compares the exhaust gas to the outside air, it interprets high oxygen content and generates a lower voltage, indicating a lean condition. When the HO2S no longer switches around stoichiometric or has a slow response, Either DTC P0133 - HO2S Sensor Circuit Slow Response (HO2S-11) or P0153 - HO2S Sensor Circuit Slow Response (HO2S-21) sets.

FUEL SYSTEM DIAGNOSIS & TESTING DAY ONE
3-10 September, 2003 Diagnosis and Testing
Fuel Control
MAF/BARO
EP2309-A/VF
A
Typical MAF Sensor A common cause of MAF failure is contamination. When the MAF becomes contaminated, the hot wire (A) becomes insulated. Contamination on the wire prevents passing air from cooling the wire. The result is that more air enters the engine than the MAF indicates to the PCM. The PCM adjusts the fuel injector pulse width to match the amount of air the MAF indicates. If more air is entering the engine than the MAF indicates, the PCM delivers less fuel than is needed, resulting in a lean condition. If vehicle is driven at Wide Open Throttle (WOT) or high loads, the fuel system normally goes open loop rich to provide maximum power. If the MAF sensor is contaminated, the fuel system is actually lean because of underestimated airflow. During open loop fuel operation, the vehicle applies Long Term Fuel Trim corrections that have been learned during closed loop operation. These corrections are often lean corrections learned at lower airflows. A consistent rich or lean condition can be identified by looking at the fuel trim PIDs (primarily LONGFT). MAF sensors can be contaminated from a variety of sources such as dirt, silicon, spider webs, potting compound from the sensor itself, etc. Symptoms of MAF contamination include a lack of power, spark knock/detonation, buck/jerk, hesitation/surge on acceleration, and the MIL lamp ON. The following DTCs can be generated because of a contaminated MAF sensor:
• P0171 (Lean Bank 1)
• P0174 (Lean Bank 2)
• P1130, P1131, P1132 (HO2S11 lack of switching Bank 1)
• P1150, P1151, P1152 (HO2S21 lack of switching Bank 2)

DAY ONE FUEL SYSTEM DIAGNOSIS & TESTING
Diagnosis and Testing September, 2003 3-11
Fuel Control
MAF/BARO (continued)
Barometric Pressure (in. HG.)
Barometric Pressure (kPa)
BARO/MAP PID (Hz)
Altitude above sea level (ft)
3.5 11.8 89.3 5 16.9 92.8
10 33.8 104.6 15 50.7 117.0 14,000 20 67.5 129.6 10,000 21 70.9 132.5 9,000 22 74.3 135.4 8,000 23 77.7 138.3 7,000 24 81.1 141.1 6,000 25 84.4 144.0 5,000 26 87.8 146.9 4,000 27 91.2 149.8 3,000 28 94.6 152.8 2,000 29 97.9 155.8 1,000 30 101.3 158.9 0 (Sea Level) 31 104.7 162.0
31.875 107.7 164.7 Barometric Pressure Reference Chart
One of the indicators for diagnosing a contaminated MAF sensor is barometric pressure. Barometric pressure (BARO) is inferred by the Powertrain Control Module (PCM) software at part-throttle and WOT (there is no actual BARO sensor on MAF-equipped vehicles, except for the 3.8L supercharged engine). At high air flows, a contaminated MAF sensor underestimates air flow coming into the engine. The PCM infers the vehicle is operating at a higher altitude. Look at the BARO PID. Refer to the Barometric Pressure Reference Chart above. At sea level, BARO should read about 158.9 Hz (30 in. Hg.). As a reference, Denver, Colorado at 1524 meters (5000 ft.) altitude should be about 144 Hz (25 in. Hg.). Normal learned BARO variability is up to +/-6 Hz (+/-2 in. Hg.). If BARO indicates a higher altitude than you are at (7 or more Hz lower than expected), the MAF may be contaminated. You should keep in mind that local weather conditions (high and low pressure areas) change the local barometric pressure (+/- 3 Hz, +/-1 in. Hg.). The BARO value is updated only when the vehicle is at high throttle openings. The BARO reading is stored in Keep Alive Memory (KAM) after it is updated.

FUEL SYSTEM DIAGNOSIS & TESTING DAY ONE
3-12 September, 2003 Diagnosis and Testing
Fuel Control
Open Loop Operation Although stoichiometric is considered the ideal air/fuel ratio, a stoichiometric ratio is not desired in many operating conditions. When operating conditions require an air/fuel ratio other than stoichiometric, or the oxygen sensors are not at operating temperature, the fuel system is commanded to open loop mode. When the engine is operating in open loop, the PCM ignores oxygen sensor input and commands an air/fuel ratio that is typically richer than stoichiometric. Once the desired air/fuel ratio and the air mass are determined, the PCM calculates the appropriate injector pulse width. The PCM commands open loop operation under the following conditions: • During cold engine startup, the oxygen sensor does not produce an accurate signal because it has not reached
operating temperature. The PCM is programmed to wait a certain amount of time after starting before attempting to go to closed loop operation. During warm-up operation, air/fuel ratio is commanded rich to aid in engine and catalytic converter warm-up.
• During high load or wide-open throttle conditions, the air/fuel ratio is commanded rich for maximum power.
• During catalyst overtemp protection, the air/fuel ratio is commanded rich because a richer air/fuel ratio burns cooler. This lowers the catalyst temperature to prevent damage.
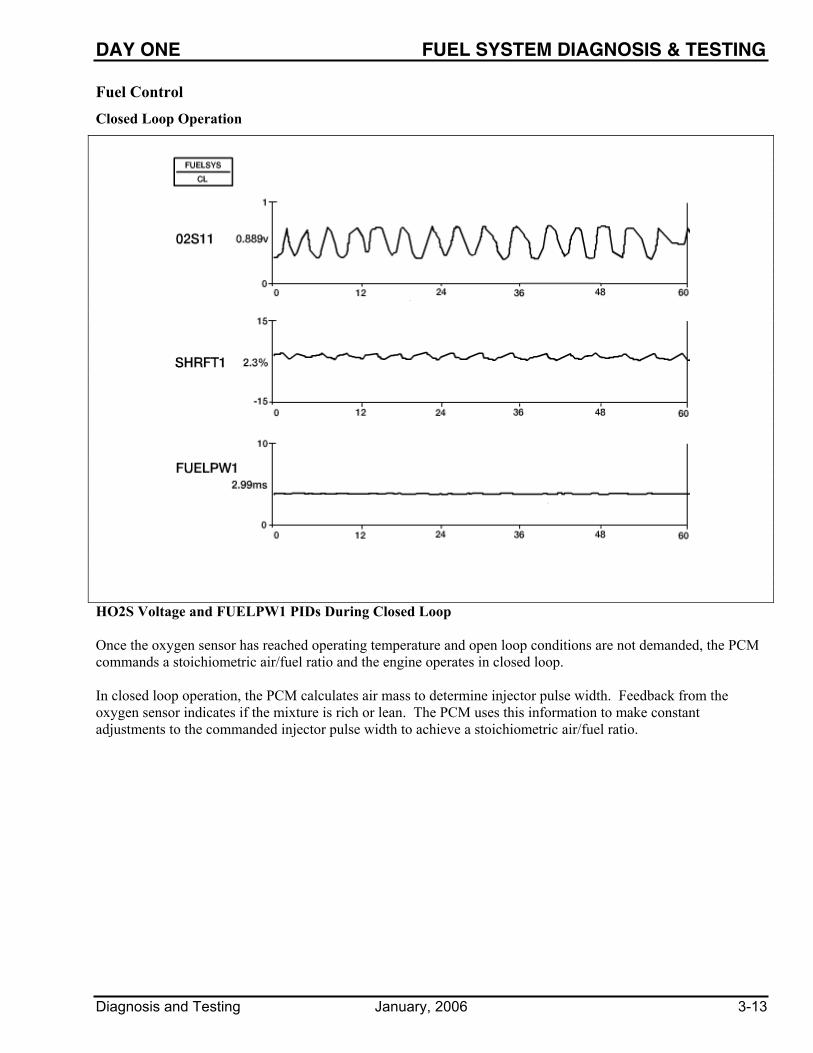
DAY ONE FUEL SYSTEM DIAGNOSIS & TESTING
Diagnosis and Testing January, 2006 3-13
Fuel Control
Closed Loop Operation
HO2S Voltage and FUELPW1 PIDs During Closed Loop Once the oxygen sensor has reached operating temperature and open loop conditions are not demanded, the PCM commands a stoichiometric air/fuel ratio and the engine operates in closed loop. In closed loop operation, the PCM calculates air mass to determine injector pulse width. Feedback from the oxygen sensor indicates if the mixture is rich or lean. The PCM uses this information to make constant adjustments to the commanded injector pulse width to achieve a stoichiometric air/fuel ratio.

FUEL SYSTEM DIAGNOSIS & TESTING DAY ONE
3-14 September, 2003 Diagnosis and Testing
NOTES

DAY ONE FUEL SYSTEM DIAGNOSIS & TESTING
Diagnosis and Testing September, 2003 3-15
Fuel Control
Fuel System Monitor
EP2311-A/VF
2
1
34
Fuel System Item Description Item Description
1 The HO2S provides the PCM with feedback indicating air/fuel ratio 3
When air/fuel ratio exceeds a calibrated limit and the fuel trims can no longer compensate, the Fuel System Monitor sets a DTC
2 A correction factor is added to the fuel injector pulse width calculation based on the Long and Short Term Fuel Trims
4 The MIL is activated after a fault is detected on two consecutive drive cycles
The purpose of the fuel system monitor is to detect deterioration or failures of components that cause emissions to exceed 1.5 times the standard. As components age over the life of the vehicle, the adaptive fuel strategy learns deviations from the stoichiometric air/fuel ratio while running in closed loop. These learned corrections are stored in Keep Alive Memory as long term fuel trim corrections. The fuel system monitor uses long and short term fuel trim corrections to determine when the fuel system has deteriorated beyond its ability to maintain the correct air/fuel ratio. If components change beyond normal limits or if a malfunction occurs, the long term fuel trim values reach a calibrated rich or lean limit. When this occurs, the adaptive fuel strategy is no longer allowed to compensate. Long term fuel trim corrections at their limit plus a calibrated deviation in short term fuel trim indicate a rich or lean system malfunction. Input from the ECT or CHT, IAT, and MAF sensors is required to activate the fuel trim system, which in turn activates the Fuel System Monitor. Additional conditions required to operate the Fuel System Monitor are engine RPM between idle and 4000, system in closed loop, and EVAP duty cycle at 0%.

FUEL SYSTEM DIAGNOSIS & TESTING DAY ONE
3-16 January, 2006 Diagnosis and Testing
Fuel Control
Normal Fuel Trim Operation
EP2312-A/VF
How Short Term and Long Term Fuel Trims are Used Item Description
1 The oxygen sensor indicates a rich condition 2 SHRTFT responds to reduce the amount of fuel delivered until the oxygen sensor starts switching again 3 LONGFT keeps learning negative corrections until SHRTFT returns to averaging around 0%
Short Term Fuel Trim
During closed loop operation, short term fuel trim values are calculated by the PCM using oxygen sensor inputs in order to maintain a stoichiometric air/fuel ratio. The PCM is constantly adjusting the short term fuel trim, which causes the oxygen sensor voltage to switch from rich to lean around the stoichiometric point. As long as the short term fuel trim is able to cause the oxygen sensor voltage to switch, a stoichiometric air/fuel ratio is maintained. Short term fuel trim operates within pre-calibrated limits. If short term fuel trim is not able to cause the oxygen sensor to switch, a DTC is set.
1
2
3

DAY ONE FUEL SYSTEM DIAGNOSIS & TESTING
Diagnosis and Testing September, 2003 3-17
Fuel Control
Normal Fuel Trim Operation (continued)
Long Term Fuel Trim As components of the fuel, air, or engine systems age or otherwise change over the life of the vehicle, the PCM learns to adapt fuel control. This is known as adaptive fuel strategy. Corrections are only learned during closed loop operation, and are stored in the PCM as long term fuel trim values. Long term fuel trim values are only learned when short term fuel trim corrections are able to cause the oxygen sensor to switch. If the short term fuel trim average remains above or below zero percent, the PCM learns to use a new long term fuel trim value, which allows the short term fuel trim to return to an average value near zero percent. There is a different long term fuel trim value stored for various RPM and load operating conditions. Long term fuel trim values are displayed on a scan tool as a percentage of fuel added or subtracted. Long term fuel trim also operates within pre-calibrated limits. When those limits are exceeded, a DTC is set.

FUEL SYSTEM DIAGNOSIS & TESTING DAY ONE
3-18 January, 2006 Diagnosis and Testing
Fuel Control
Abnormal Fuel Trim (1 Bank)
EP2313-A/VF
Abnormal Fuel Trim (1 Bank) Looking at fuel trims when diagnosing a concern may help you identify the possible fault. An abnormal fuel trim on only one bank indicates a possible fault in the coil, a spark plug, a secondary wire, an injector, a circuitry problem (to injector or coil), and on rare occasions an intake leak (affecting only one bank). Whenever a fuel injector or fuel pressure regulator is replaced, Keep Alive Memory (KAM) should be cleared. This is necessary so the PCM does not use the previously learned fuel trim values.

DAY ONE FUEL SYSTEM DIAGNOSIS & TESTING
Diagnosis and Testing January, 2006 3-19
Fuel Control
Abnormal Fuel Trim (Both Banks)
EP2314-A/VF
Abnormal Fuel Trim (Both Banks) Abnormal fuel trims on both banks indicate a fault that affects the entire engine, such as a vacuum leak, an EGR concern, low fuel pressure, high fuel pressure, MAF sensor fault, or an air intake leak.

FUEL SYSTEM DIAGNOSIS & TESTING DAY ONE
3-20 September, 2003 Diagnosis and Testing
Fuel Control
Injector Flow Test
EP2315-A/VF
Relative Injector Flow Test The data for the relative injector flow test is displayed in cylinder firing order from left to right. Below the cylinder number is the elapsed time (in milliseconds) for the required pressure drop to occur when the injector is energized. The bar graph represents a comparison of all the flow data. Ideally, the bars should be relatively even and centered between the pass/fail markers. When a value falls outside the pass/fail limit, the bar is shaded darker than the others. • Low injector flow (LF) occurs if the pressure drop for an injector takes significantly longer than the others.
• High injector flow (HF) occurs if the pressure drop for an injector is significantly faster than the others.
• No injector flow (NF) occurs if no pressure drop is detected when the injector is energized.
• Invalid injector data (ID) occurs when a pressure drop occurs before the injector is energized.
• If one or more injectors appear high or low on the bar graph, the injector(s) is not necessarily faulty.
For example, if all but one injector is defective, the defective injectors appear normal, while the good injector has a relatively faster flow time, possibly causing it to appear out of spec.

DAY ONE FUEL SYSTEM DIAGNOSIS & TESTING
Diagnosis and Testing September, 2003 3-21
Fuel Control
Injector Flow Test (continued) Possible causes of low injector flow:
• Air in fuel system or in test equipment
• Contaminated fuel system causing obstructed injector(s)
• Obstructed or dirty fuel injector(s)
• Leaking injector
• Faulty injector
Possible causes of high injector flow:
• Improper injector(s) for vehicle application installed
• Obstructed or dirty fuel injector(s)
Possible causes of no injector flow:
• Air in fuel system or in test equipment
• Faulty injector
• Obstructed or dirty fuel injector(s)
• Faulty fuel injector circuit
NOTE: No injector flow for all injectors is most likely caused by air in the fuel system but also may be caused by the fuel pump running continuously during the test or a loss of the power feed to all injectors.
Possible causes of invalid injector data:
• Most likely an intermittent condition because a pressure and leakdown check is performed at the beginning of the flow test
• Leaking injector
• Faulty fuel pressure regulator
• Faulty fuel pump/or fuel pump check valve
NOTE: An injector that remains open after being flow tested may show the next tested injector as “Invalid Data” (ID).
NOTE: The engine must be run after each injector flow test to clear fuel from the combustion chamber.
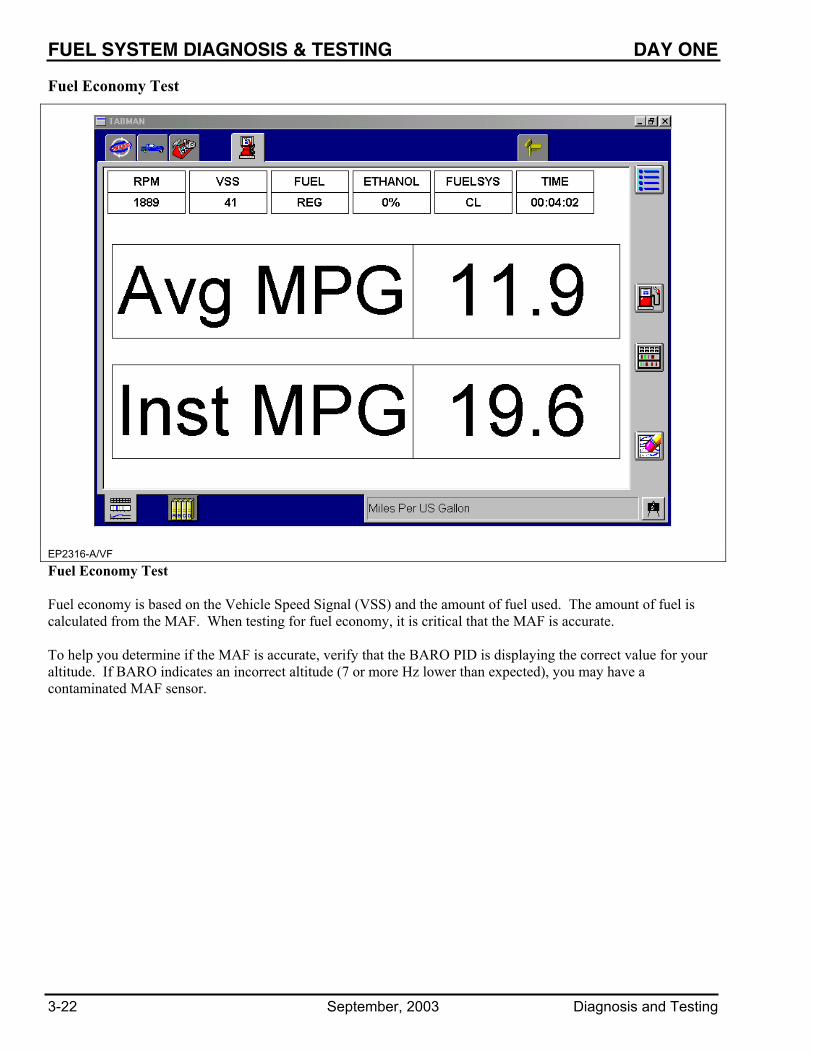
FUEL SYSTEM DIAGNOSIS & TESTING DAY ONE
3-22 September, 2003 Diagnosis and Testing
Fuel Economy Test
EP2316-A/VF
Fuel Economy Test Fuel economy is based on the Vehicle Speed Signal (VSS) and the amount of fuel used. The amount of fuel is calculated from the MAF. When testing for fuel economy, it is critical that the MAF is accurate. To help you determine if the MAF is accurate, verify that the BARO PID is displaying the correct value for your altitude. If BARO indicates an incorrect altitude (7 or more Hz lower than expected), you may have a contaminated MAF sensor.

DAY TWO FUEL SYSTEM DIAGNOSIS & TESTING
Diagnosis and Testing September, 2003 3-23
Fuel System – Bench Worksheet Select the "FUEL – Expedition 5.4L – BENCH" WDS recording (Recording Group: INJ1, Description:
INJECTOR_DISCONNECT).
View the WDS recording of a 2003 Expedition with a 5.4L engine and answer the following questions: 1. At approximately what time during the recording did the Misfire Monitor detect a misfire?
2. Do any of the injectors indicate they are not functioning properly? If yes, which one(s)?
3. Which HO2S indicates a cylinder miss?
4. What happens to the affected downstream HO2S after the cylinder starts missing?
5. Why does the affected downstream HO2S respond in this manner?
6. At what point in the recording does the system go into open loop? Why?
7. What happens to spark advance after a misfire is detected?
8. What happens to SHRTFT1 and SHRTFT2 after the misfire is detected?

FUEL SYSTEM DIAGNOSIS & TESTING DAY TWO
3-24 January, 2006 Diagnosis and Testing
Fuel System – On-Vehicle Worksheet
Perform the following WDS Fuel System Tests:
• Fuel Pressure and Leakdown
• Relative Injector Flow
• Engine Running Pressure Test.
1. What type of fuel system does this vehicle have?
2. What is the fuel pressure on this vehicle?
3. How long does the leakdown test run?
4. What would cause this vehicle to have too much fuel pressure leakdown?
5. Why is the injector test called the Relative Injector Flow Test?
6. What is the MAF reading at idle (in volts)?
7. Is this value within specifications as listed in the PC/ED?
8. What is the value of the BARO PID on this vehicle?
9. Is the BARO PID value correct for this area?
10. What does it mean if the BARO PID is out of range?

DAY TWO PCM WIRING AND CIRCUITS REVIEW
Diagnosis and Testing September, 2003 4-1
Student Objective • Explain PCM wiring and circuits.
Content • PCM wiring and circuits
- PCM Inputs
- Potentiometer
- Thermistor
- Mass Air Flow (MAF)
- Heated Oxygen Sensor (HO2S)
- Pressure Sensor
- Differential Pressure Sensor
- Knock Sensor
- Variable Reluctance Sensor
- Switches
- Outputs
- Relays
- Solenoids
- Fuel Injectors
- IAC/EGR Valves
- Motors
• PCM Power and Ground
- 104 pin
- 122 pin
- 150 pin
- 190 pin

PCM WIRING AND CIRCUITS REVIEW HOMEWORK
4-2 September, 2003 Diagnosis and Testing
PCM Inputs Potentiometer/Three-Wire Sensors
013 26 39 52 65 78 84 91
4.5384.2573.648
2.4291.8201.2100.601
3.039
THROTTLE ANGLE
VREF
PCM SIG RTN
SIGNAL
SENSOR
PID
EPII016
Potentiometer/Three-Wire Sensors (TP Sensor) The PCM supplies a reference voltage and a ground for the sensor and monitors the signal circuit. 1. What would you expect the TP PID value range to be under normal operating conditions?
2. What would you expect the TP PID value to be with the VREF circuit open?
3. What would you expect the TP PID value to be with the SIG RTN circuit open?
4. What would you expect the TP PID value to be with the Signal circuit open?
5. What would you expect the TP PID value to be with the Signal circuit shorted to VREF?
6. What would you expect the TP PID value to be with the Signal circuit shorted to VPWR?
7. What would you expect the TP PID value to be with the Signal circuit shorted to GND?
8. What would you expect the TP PID value to be with the Signal circuit shorted to SIG RTN?
SIG RTNVREF TP
Signal
SENSOR
PCM
1.210V
4.538V 4.257V 3.648V 3.039V 2.429V 1.820V
0.601V
13 26 39 52 65 78 84 91Throttle Angle (degrees)
EP2400-A/VF
PID

HOMEWORK PCM WIRING AND CIRCUITS REVIEW
Diagnosis and Testing September, 2003 4-3
PCM Inputs
Thermistor
Two-Wire Sensors (Temperature Sensor) A thermistor is a temperature sensitive resistor, which along with a resistor network in the PCM provides an output voltage inversely proportional to temperature. As temperature increases, voltage decreases. This is referred to as Negative Temperature Coefficient. 1. What would you expect the ECT PID value range to be under normal operating conditions?
2. What would you expect the ECT PID value to be with the SIG RTN circuit open?
3. What would you expect the ECT PID value to be with the Signal circuit open?
4. What would you expect the ECT PID value to be with the Signal circuit shorted to VREF?
5. What would you expect the ECT PID value to be with the Signal circuit shorted to VPWR?
6. What would you expect the ECT PID value to be with the Signal circuit shorted to GND?
7. What would you expect the ECT PID value to be with the Signal circuit shorted to SIG RTN?
PID
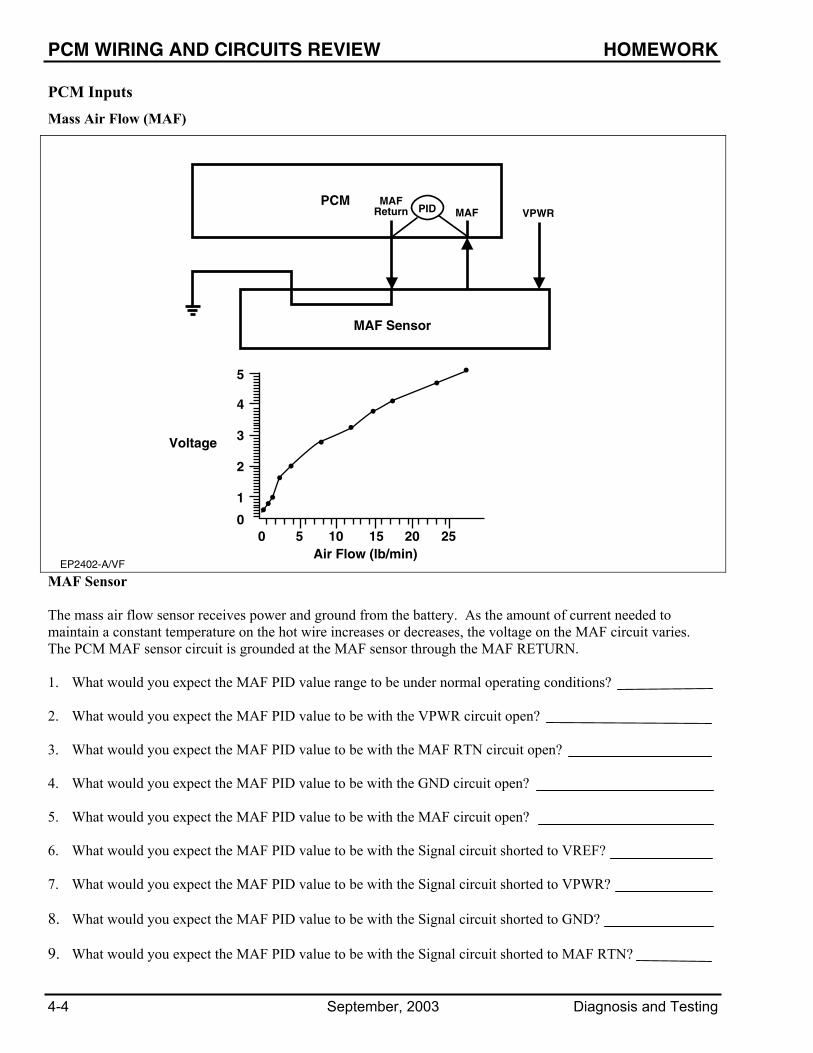
PCM WIRING AND CIRCUITS REVIEW HOMEWORK
4-4 September, 2003 Diagnosis and Testing
PCM Inputs Mass Air Flow (MAF)
EP2402-A/VF
PCM
Air Flow (lb/min)
Voltage
MAF Sensor
VPWRMAFMAF
Return PID
5
4
3
2
1
00 5 10 15 20 25
MAF Sensor The mass air flow sensor receives power and ground from the battery. As the amount of current needed to maintain a constant temperature on the hot wire increases or decreases, the voltage on the MAF circuit varies. The PCM MAF sensor circuit is grounded at the MAF sensor through the MAF RETURN. 1. What would you expect the MAF PID value range to be under normal operating conditions?
2. What would you expect the MAF PID value to be with the VPWR circuit open?
3. What would you expect the MAF PID value to be with the MAF RTN circuit open?
4. What would you expect the MAF PID value to be with the GND circuit open?
5. What would you expect the MAF PID value to be with the MAF circuit open?
6. What would you expect the MAF PID value to be with the Signal circuit shorted to VREF?
7. What would you expect the MAF PID value to be with the Signal circuit shorted to VPWR?
8. What would you expect the MAF PID value to be with the Signal circuit shorted to GND?
9. What would you expect the MAF PID value to be with the Signal circuit shorted to MAF RTN?
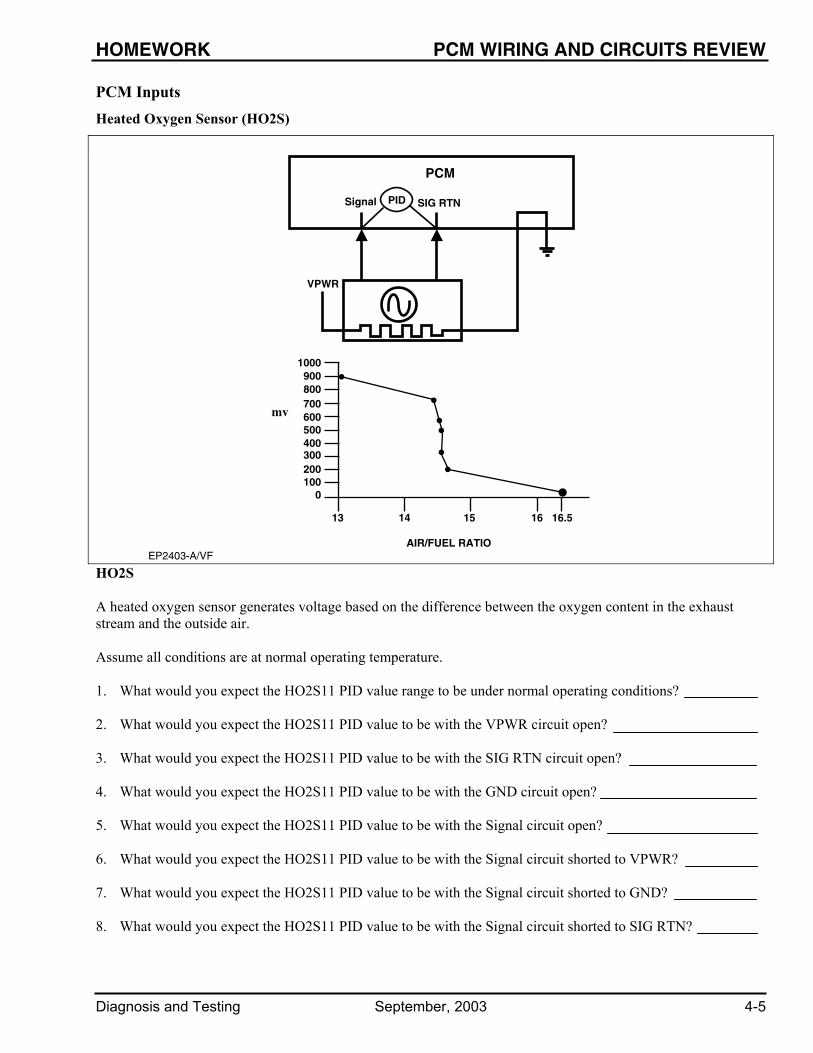
HOMEWORK PCM WIRING AND CIRCUITS REVIEW
Diagnosis and Testing September, 2003 4-5
PCM Inputs Heated Oxygen Sensor (HO2S)
EP2403-A/VF
PCM
SIG RTNSignal
VPWR
PID
1000900800700600500400300200100
13 14 15 16 16.5
0
AIR/FUEL RATIO
mv
HO2S A heated oxygen sensor generates voltage based on the difference between the oxygen content in the exhaust stream and the outside air. Assume all conditions are at normal operating temperature.
1. What would you expect the HO2S11 PID value range to be under normal operating conditions?
2. What would you expect the HO2S11 PID value to be with the VPWR circuit open?
3. What would you expect the HO2S11 PID value to be with the SIG RTN circuit open?
4. What would you expect the HO2S11 PID value to be with the GND circuit open?
5. What would you expect the HO2S11 PID value to be with the Signal circuit open?
6. What would you expect the HO2S11 PID value to be with the Signal circuit shorted to VPWR?
7. What would you expect the HO2S11 PID value to be with the Signal circuit shorted to GND?
8. What would you expect the HO2S11 PID value to be with the Signal circuit shorted to SIG RTN?
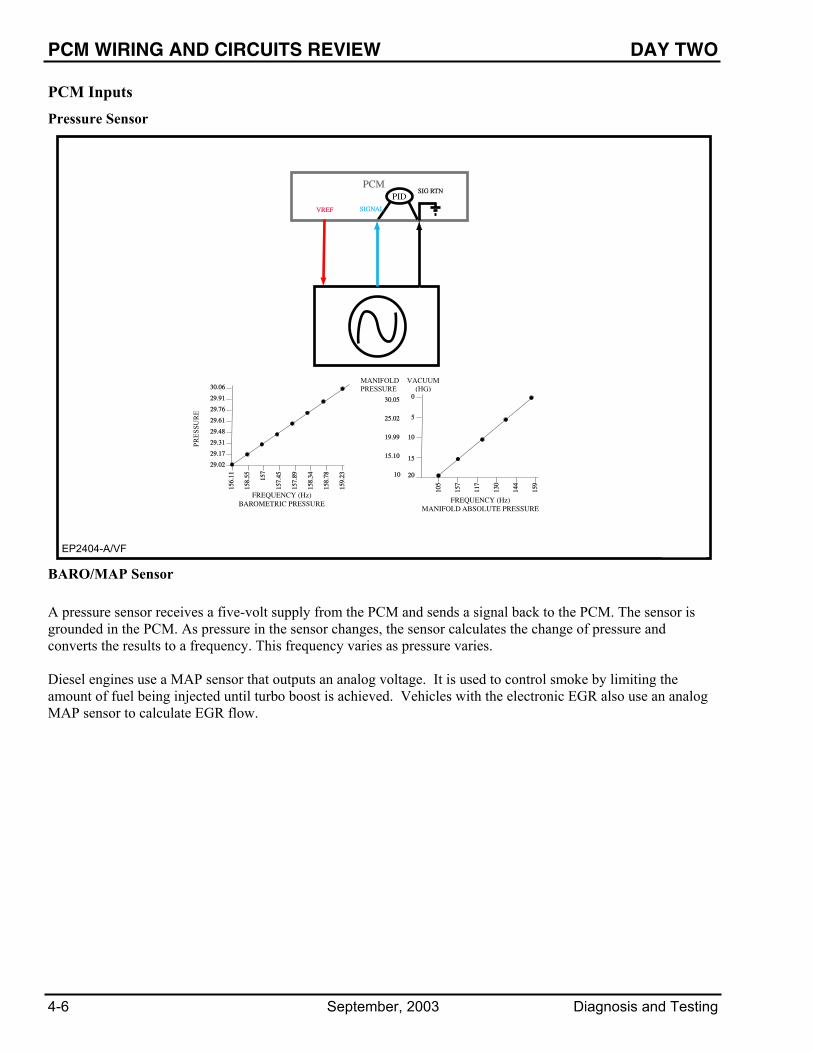
PCM WIRING AND CIRCUITS REVIEW DAY TWO
4-6 September, 2003 Diagnosis and Testing
PCM Inputs Pressure Sensor
VREF
PCMSIG RTN
SIGNAL
156.
11
158.
55 157
157.
89
157.
45
158.
34
158.
78
159.
23
30.06
29.76
29.61
29.48
29.31
29.17
29.02
29.91
FREQUENCY (Hz)BAROMETRIC PRESSURE
PRE
SSU
RE
105
157
117
130
144
159
30.05
25.02
19.99
15.10
10 20
15
10
5
0
FREQUENCY (Hz)MANIFOLD ABSOLUTE PRESSURE
MANIFOLDPRESSURE
VACUUM(HG)
PID
EPII019 BARO/MAP Sensor A pressure sensor receives a five-volt supply from the PCM and sends a signal back to the PCM. The sensor is grounded in the PCM. As pressure in the sensor changes, the sensor calculates the change of pressure and converts the results to a frequency. This frequency varies as pressure varies. Diesel engines use a MAP sensor that outputs an analog voltage. It is used to control smoke by limiting the amount of fuel being injected until turbo boost is achieved. Vehicles with the electronic EGR also use an analog MAP sensor to calculate EGR flow.
EP2404-A/VF
MANIFOLD PRESSURE
PRES
SUR
E
VACUUM(HG)
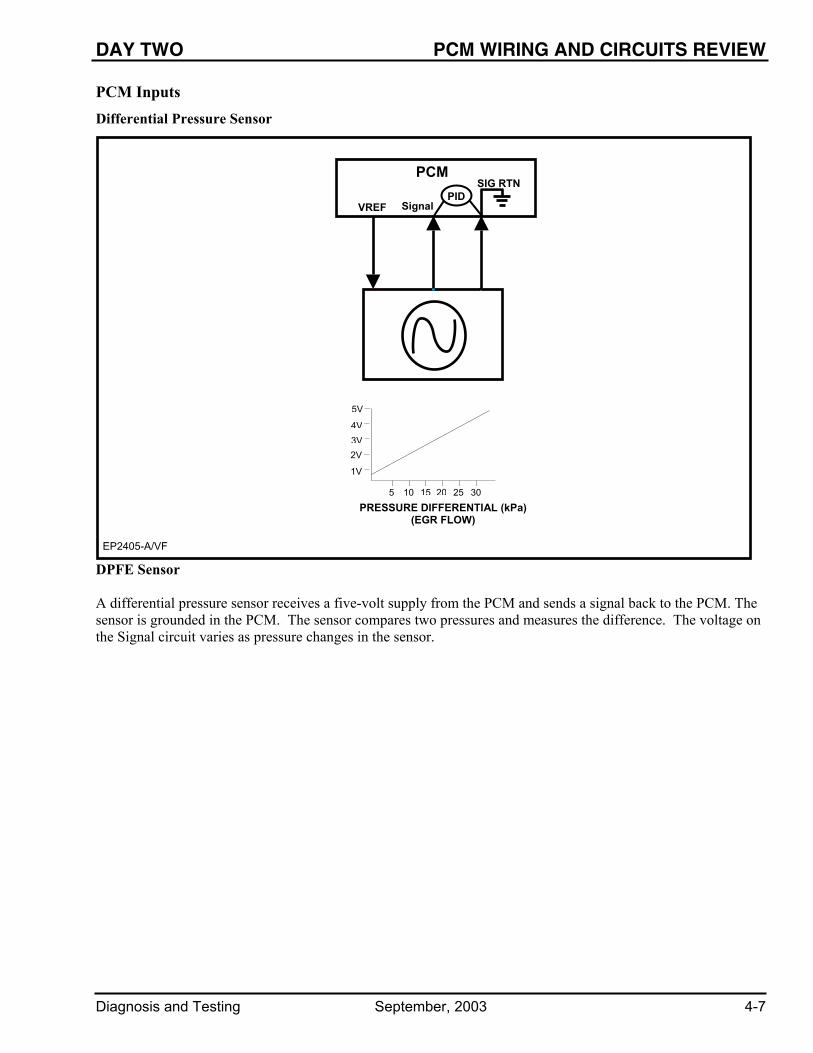
DAY TWO PCM WIRING AND CIRCUITS REVIEW
Diagnosis and Testing September, 2003 4-7
PCM Inputs Differential Pressure Sensor
105 15 20 3025
1V
2V
3V
4V
5V
PRESSURE DIFFERENTIAL (KpA)(EGR FLOW)
VREFVREF
PCMSIG RSIG RTNTN
SIGNALSIGNAL
PID
EPII020
DPFE Sensor A differential pressure sensor receives a five-volt supply from the PCM and sends a signal back to the PCM. The sensor is grounded in the PCM. The sensor compares two pressures and measures the difference. The voltage on the Signal circuit varies as pressure changes in the sensor.
PIDSignalVREF
5V
4V3V2V
1V
5 10 15 20 25 30
PRESSURE DIFFERENTIAL (kPa) (EGR FLOW)
EP2405-A/VF
PCMSIG RTN

PCM WIRING AND CIRCUITS REVIEW DAY TWO
4-8 September, 2003 Diagnosis and Testing
PCM Inputs Knock Sensor (KS)
PCMSIG RTN
SIGNALPID
EPII022
Knock Sensor The knock sensor is a tuned accelerometer that converts engine vibrations to an electrical signal.
PID
PCM
Signal SIG RTN
EP2406-A/VF
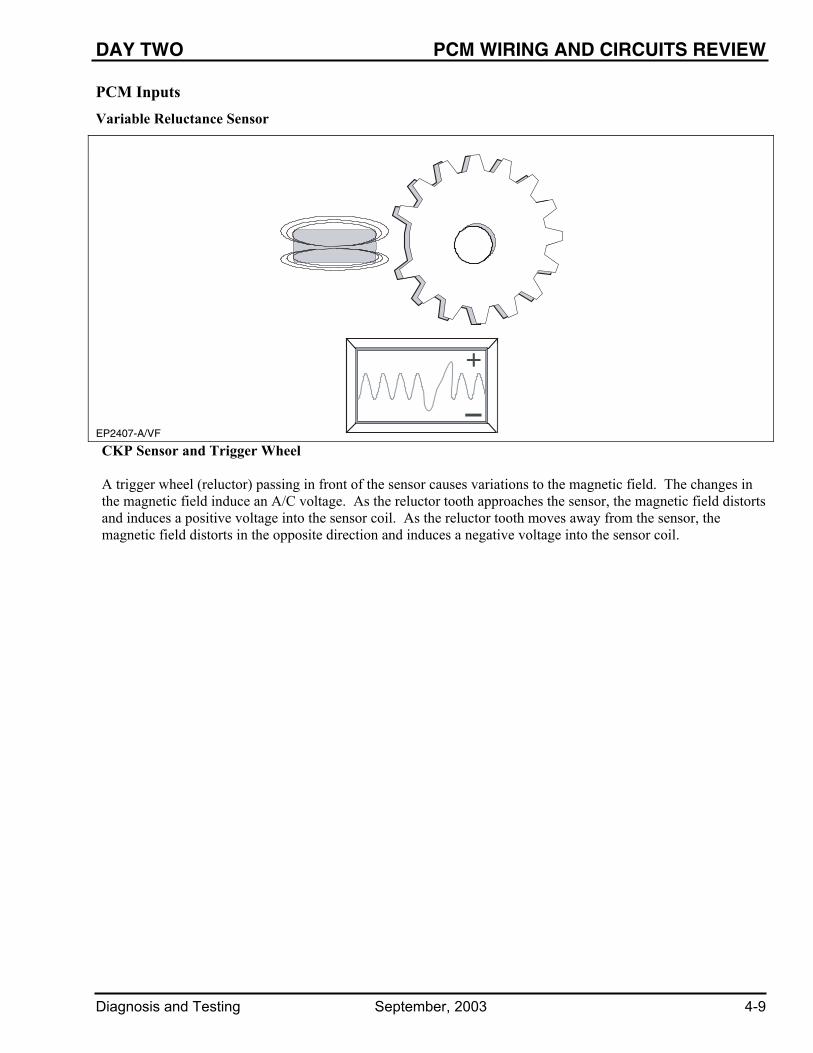
DAY TWO PCM WIRING AND CIRCUITS REVIEW
Diagnosis and Testing September, 2003 4-9
PCM Inputs Variable Reluctance Sensor
EP2407-A/VF CKP Sensor and Trigger Wheel A trigger wheel (reluctor) passing in front of the sensor causes variations to the magnetic field. The changes in the magnetic field induce an A/C voltage. As the reluctor tooth approaches the sensor, the magnetic field distorts and induces a positive voltage into the sensor coil. As the reluctor tooth moves away from the sensor, the magnetic field distorts in the opposite direction and induces a negative voltage into the sensor coil.
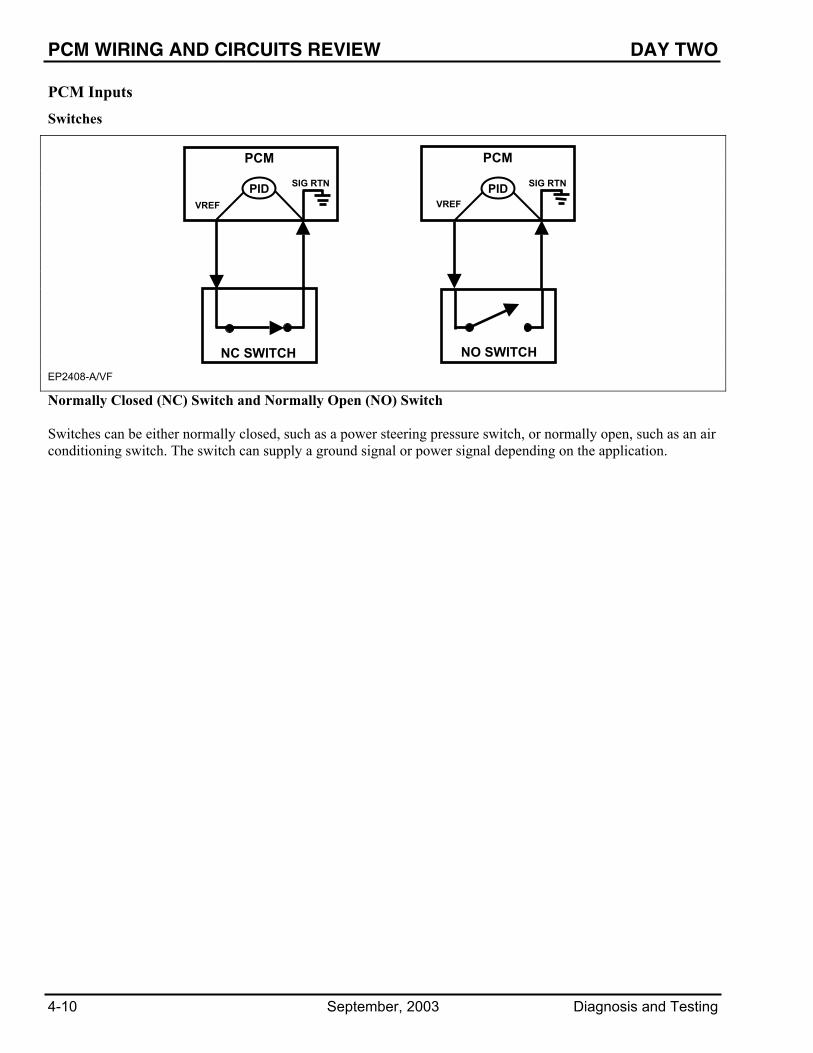
PCM WIRING AND CIRCUITS REVIEW DAY TWO
4-10 September, 2003 Diagnosis and Testing
PCM Inputs Switches
Normally Closed (NC) Switch and Normally Open (NO) Switch Switches can be either normally closed, such as a power steering pressure switch, or normally open, such as an air conditioning switch. The switch can supply a ground signal or power signal depending on the application.
EP2408-A/VF
PCM
PID VREF
SIG RTN
NC SWITCH
PCM
PID SIG RTN
VREF
NO SWITCH

DAY TWO PCM WIRING AND CIRCUITS REVIEW
Diagnosis and Testing September, 2003 4-11
PCM Outputs Relays
EP2409-A/VF
30 85
87A 87 86
Typical Relay Relays are used to isolate the low current signal circuitry from the high current load. This way, low current signals can be used to control high current loads. Relays can supply power or a ground path to a component. When energized (current flowing through the coil, such as circuits 85 / 86 above), the magnetic field around the coil causes the switch to change states. Some relays have a diode or resistor placed in parallel with the relay coil to control voltage spikes that could damage components or circuitry.

PCM WIRING AND CIRCUITS REVIEW DAY TWO
4-12 September, 2003 Diagnosis and Testing
PCM Outputs Solenoids
EP2410-A/VF
Typical EGR Vacuum Regulator (EVR) Item Description Item Description
1 To EGR valve 3 Vacuum output (in-Hg) 2 Source vacuum 4 Duty cycle (%)
A solenoid converts electrical energy into linear motion. When an electric coil is energized, the magnetic force causes an iron core plunger to move. It is this movement of the plunger that can be used to move different components or direct the flow of vacuum, fuel, and air. Many different solenoid valves are used to control the flow of vacuum, fuel, and air in various systems.
1
2
3
4

DAY TWO PCM WIRING AND CIRCUITS REVIEW
Diagnosis and Testing September, 2003 4-13
NOTES

PCM WIRING AND CIRCUITS REVIEW DAY TWO
4-14 September, 2003 Diagnosis and Testing
PCM Outputs Fuel Injectors
Typical Fuel Injector
A fuel injector is a normally closed solenoid that supplies fuel to the engine. The PCM controls current through the injector coil by opening and closing the ground side circuit. When energized the magnetic field pulls a pintle valve off its seat to spray pressurized fuel into the intake manifold. You should always make sure to use the proper injector for the application. The color of the injector connector indicates the flow rate. Similar connector colors may have different part numbers and different flow rates. Be sure to check application. The injector is the Deposit Resistant Injection (DRI) type and does not have to be cleaned (although it is not harmful to clean the injector). Never apply battery positive voltage (B+) directly to the fuel injector electrical connector terminals. The fuel injector may be internally damaged in a matter of seconds. The fuel injectors can be flow checked and they should be replaced if they are found outside of specification. When replacing fuel injectors, replace the O-rings with ones that are made of special fuel-resistant material. The use of ordinary O-rings can cause the fuel system to leak. Never reuse O-rings.
EP2411-A/VF

DAY TWO PCM WIRING AND CIRCUITS REVIEW
Diagnosis and Testing September, 2003 4-15
PCM Outputs Fuel Injectors
2001 Fuel Delivery System Test Information/Specification Chart
Engine Application
Resistance (Ohms)
Fuel System
Type
Fuel Pressure
(kPa)
Fuel Pressure
(psi) CAR 2.0L 2V Escort/Focus 13.8 – 15.2 ERFS 240 - 448 35 - 65 2.0L 4V Escort ZX2/Focus 13.8 – 15.2 ERFS 240 - 448 35 - 65 3.0L Lincoln LS6 13.8 – 15.2 ERFS 270 - 380 39 - 55 3.0L 2V Taurus/Sable 11.4 – 12.6 ERFS 270 - 450 39 - 65 3.0L 4V Taurus/Sable 13.1 – 14.5 ERFS 270 - 380 39 - 55 3.0L FFV Taurus/Sable 11.4 – 12.6 ERFS 240 - 448 30 - 65 3.8L Mustang 11.4 – 12.6 ERFS 240 - 380 35 - 55 3.9L Lincoln LS8/Thunderbird 11.4 – 12.6 ERFS 270 - 450 39 - 65 4.6L Crown Vic/Grand Marquis/Town Car 13.8 – 15.2 ERFS 270 - 483 40 - 70 4.6L 2V Mustang GT 13.8 – 15.2 ERFS 270 - 483 40 - 70 4.6L 4V Mustang Cobra 13.8 – 15.2 ERFS 207 - 380 30 - 55 4.6L 4V Marauder 11.4 – 12.6 ERFS 270 - 483 40 - 70 4.6L NGV Crown Victoria 4 – 6 NGV 276 – 827 80 - 120 TRUCK 2.0L 4V Escape 13.8 – 15.2 MRFS 345 - 448 50 - 65 2.3L Ranger 11.4 – 12.6 MRFS 345 - 448 50 - 65 3.0L Ranger 11.4 – 12.6 MRFS 345 - 448 50 - 65 3.0L 4V Escape 13.1 – 14.5 MRFS 345 - 448 50 - 65 3.0L FFV Ranger 11.4 – 12.6 MRFS 275 - 380 40 - 55 3.8L Windstar 11.4 – 12.6 RFS 207 - 310 30 - 45 4.0L SOHC Explorer/Mountaineer/Ranger 11 – 18 MRFS 345 - 448 50 - 65 4.2L E/F-Series 11.4 – 12.6 RFS 207 - 310 30 - 45 4.6L Explorer/Mountaineer 11.4 – 12.6 MRFS 345 - 483 50 - 70 4.6L E/F-Series 13.8 – 15.2 RFS 207 - 310 30 - 45 4.6L Expedition 13.8 – 15.2 MRFS 240 - 448 35 - 65 4.6L 4V Aviator 13.8 – 15.2 ERFS 172 - 448 25 - 65 5.4L 2V E/F-Series/Excursion 13.8 – 15.2 RFS 207 - 380 30 - 55 5.4L 2V Expedition 13.8 – 15.2 MRFS 240 - 448 35 - 65 5.4L 2V SC F-Series 13.8 – 15.2 RFS 207 - 310 30 - 45 5.4L 4V Navigator/Blackwood 13.8 – 15.2 MRFS 240 - 448 35 - 65 5.4L NGV E/F-Series 4 – 6 NGV 276 – 827 80 - 120 6.8L E/F-Series/Excursion 11 – 18 RFS 207 - 310 30 - 45
Item Description Item Description ERFS Electronic Returnless Fuel System RFS Return Fuel System MRFS Mechanical Returnless Fuel System
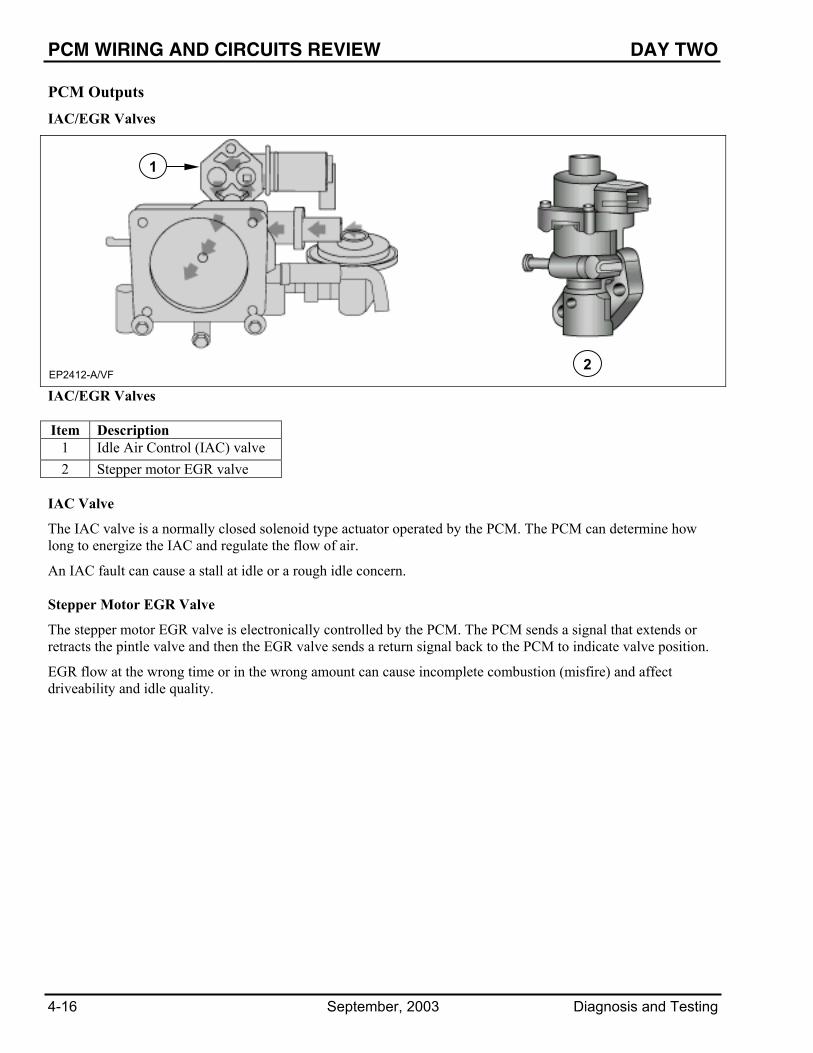
PCM WIRING AND CIRCUITS REVIEW DAY TWO
4-16 September, 2003 Diagnosis and Testing
PCM Outputs IAC/EGR Valves
IAC/EGR Valves Item Description
1 Idle Air Control (IAC) valve 2 Stepper motor EGR valve
IAC Valve
The IAC valve is a normally closed solenoid type actuator operated by the PCM. The PCM can determine how long to energize the IAC and regulate the flow of air.
An IAC fault can cause a stall at idle or a rough idle concern. Stepper Motor EGR Valve
The stepper motor EGR valve is electronically controlled by the PCM. The PCM sends a signal that extends or retracts the pintle valve and then the EGR valve sends a return signal back to the PCM to indicate valve position.
EGR flow at the wrong time or in the wrong amount can cause incomplete combustion (misfire) and affect driveability and idle quality.
2
1
EP2412-A/VF

DAY TWO PCM WIRING AND CIRCUITS REVIEW
Diagnosis and Testing September, 2003 4-17
PCM Outputs Motors
EP2413-A/VF Fuel Pump Module A motor provides rotational motion. When the motor’s coil is energized, the magnetic force causes the armature to move. Motors are tested by applying an appropriate voltage and ground.

PCM WIRING AND CIRCUITS REVIEW DAY TWO
4-18 September, 2003 Diagnosis and Testing
PCM Power and Ground
EPII026
1351
1516
55 71
97
Typical 104 Pin PCM Application (2003): Escort, Focus, Taurus/Sable, Mustang, Crown Victoria/Grand Marquis, Town Car, Escape, Ranger, Windstar, Explorer Sport/Sport Trac, E-Series, F-Series, Lightning, Blackwood, Excursion Application (2004): Focus, Taurus/Sable, Mustang, Crown Victoria/Grand Marquis, Town Car, Escape, Ranger, Freestar/Monterey, Explorer Sport Trac, E-Series, F-Series Heritage, F-Series Super Duty, Lightning, Excursion
104 pin PCM Power and Grounds
PCM Pin
Function Description PCM Pin
Function Description
3 PWRGND Power ground 71 VPWR Voltage input to module 13 Flash EPROM Power Supply 76 PWRGND Power ground 15 Bus (-) Data Link Connector (DLC) 77 PWRGND Power ground 16 Bus (+) Data Link Connector (DLC) 90 VREF 5V reference 24 PWRGND Power ground 91 SIGRTN Signal return 25 CSEGND Case ground 97 VPWR Voltage input to module 51 PWRGND Power ground 103 PWRGND Power ground 55 KAPWR Keep alive power
Connector pinouts for the 104 pin PCM vary from vehicle to vehicle, but the power, ground, and data bus circuits have the same pin numbers throughout all vehicle lines (where 104 pin PCMs are used).
90 91
EP2414-A/VF
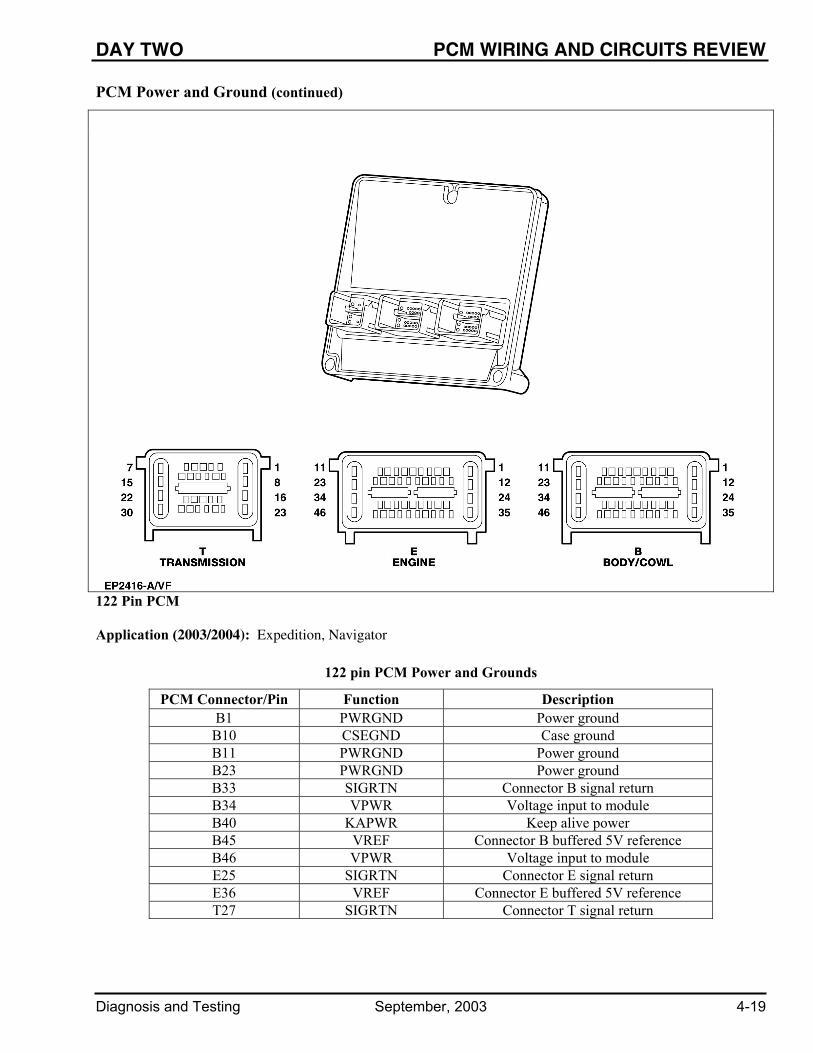
DAY TWO PCM WIRING AND CIRCUITS REVIEW
Diagnosis and Testing September, 2003 4-19
PCM Power and Ground (continued)
122 Pin PCM Application (2003/2004): Expedition, Navigator
122 pin PCM Power and Grounds
PCM Connector/Pin Function Description B1 PWRGND Power ground
B10 CSEGND Case ground B11 PWRGND Power ground B23 PWRGND Power ground B33 SIGRTN Connector B signal return B34 VPWR Voltage input to module B40 KAPWR Keep alive power B45 VREF Connector B buffered 5V reference B46 VPWR Voltage input to module E25 SIGRTN Connector E signal return E36 VREF Connector E buffered 5V reference T27 SIGRTN Connector T signal return

PCM WIRING AND CIRCUITS REVIEW DAY TWO
4-20 September, 2003 Diagnosis and Testing
PCM Power and Ground (continued)
150 Pin PCM
Application (2003) Application (2004) Lincoln LS, Thunderbird, Explorer/Mountaineer, Aviator Lincoln LS, Thunderbird, Aviator
150 pin PCM Power and Grounds
PCM Connector/Pin Function Description B17 (B5 – LS/Thunderbird) SIGRTN Connector B signal return
B20 (2004: B55 – LS/Thunderbird) VREF Connector B buffered 5V reference B24 PWRGND Power ground B25 PWRGND Power ground B26 PWRGND Power ground B27 PWRGND Power ground B32 VPWR Voltage input to module B33 VPWR Voltage input to module B43 CSEGND Case ground B44 KAPWR Keep alive power E17 SIGRTN Connector E signal return
E20 (E14 – LS/Thunderbird) VREF Connector E buffered 5V reference T17 (T14 – LS/Thunderbird) SIGRTN Connector T signal return

DAY TWO PCM WIRING AND CIRCUITS REVIEW
Diagnosis and Testing September, 2003 4-21
PCM Power and Ground (continued)
150 Pin PCM Application (2003) Application (2004) 2.3L Focus 2.3L Focus, Explorer/Mountaineer
150 pin PCM Power and Grounds
PCM Connector/Pin Function Description B10 CSEGND Case ground B35 VPWR Voltage input to module B36 VPWR Voltage input to module B40 VREF Connector B buffered 5V reference B41 SIGRTN Connector B signal return B45 KAPWR Keep alive power B47 PWRGND Power ground B48 PWRGND Power ground B49 PWRGND Power ground E40 VREF Connector E buffered 5V reference E41 SIGRTN Connector E signal return T41 SIGRTN Connector T signal return
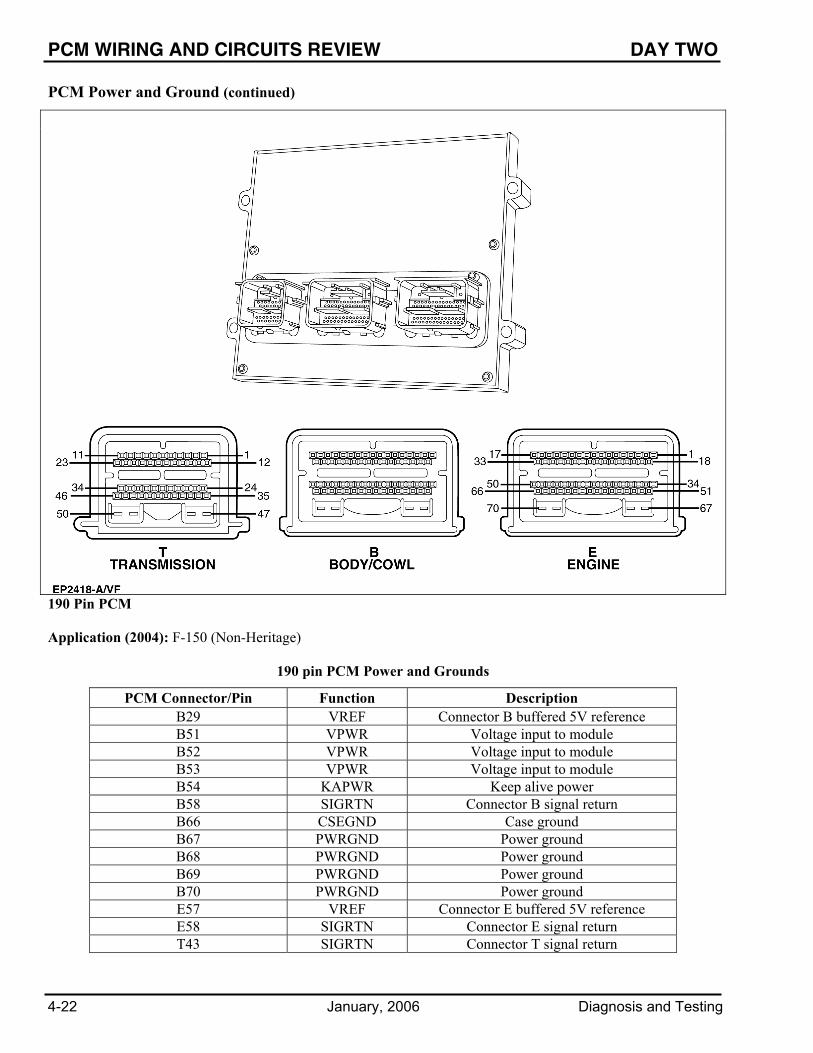
PCM WIRING AND CIRCUITS REVIEW DAY TWO
4-22 January, 2006 Diagnosis and Testing
PCM Power and Ground (continued)
190 Pin PCM Application (2004): F-150 (Non-Heritage)
190 pin PCM Power and Grounds
PCM Connector/Pin Function Description B29 VREF Connector B buffered 5V reference B51 VPWR Voltage input to module B52 VPWR Voltage input to module B53 VPWR Voltage input to module B54 KAPWR Keep alive power B58 SIGRTN Connector B signal return B66 CSEGND Case ground B67 PWRGND Power ground B68 PWRGND Power ground B69 PWRGND Power ground B70 PWRGND Power ground E57 VREF Connector E buffered 5V reference E58 SIGRTN Connector E signal return T43 SIGRTN Connector T signal return

DAY TWO AIR INLET DIAGNOSIS AND TESTING
Diagnosis and Testing April, 2002 5-1
Student Objective • Use critical thinking skills and available resources to diagnose and test the Air Inlet System.
- Explain the conditions and tests related to diagnosing and testing the IAC valve.
- Explain the conditions and tests related to diagnosing and testing the Controlled Air Inlet System, including IMTV, IMRC, and IMSC.
Content
• Idle Air Control (IAC) Valve
- IAC Diagnosis & Testing
• Controlled Air Inlet Systems
- Intake Manifold Tuning Valve (IMTV) system
- Intake Manifold Runner Control (IMRC) system
- Intake Manifold Swirl Control (IMSC) system
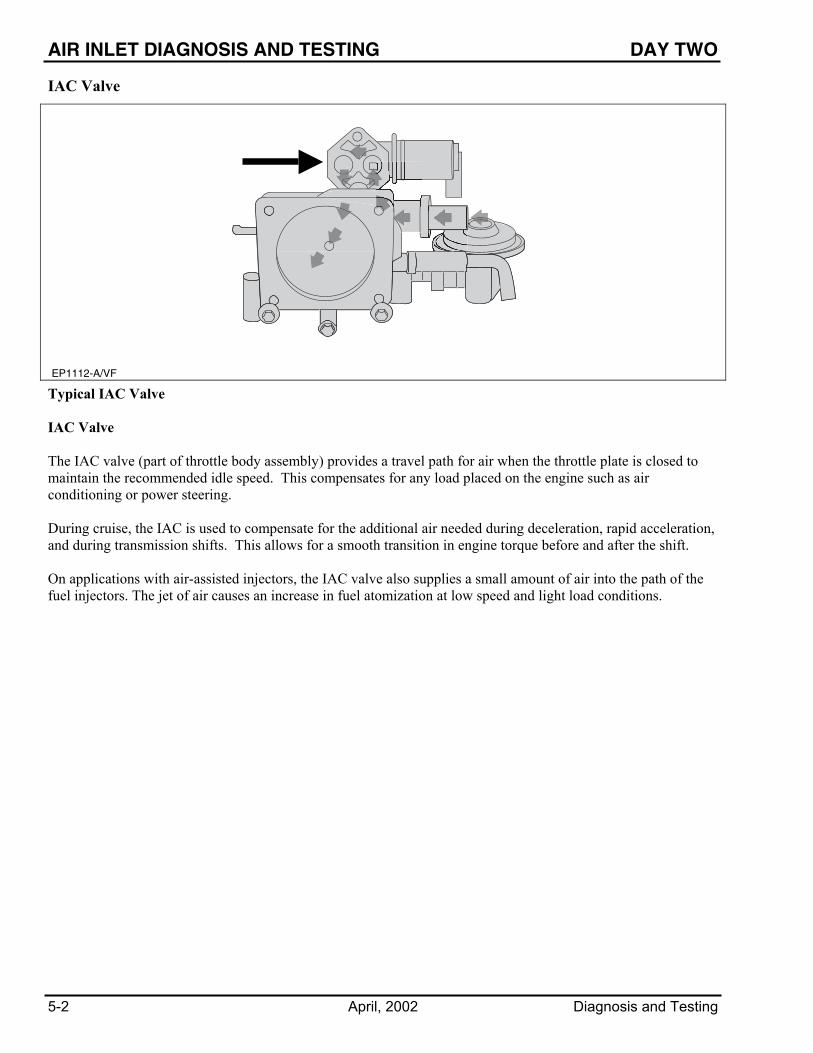
AIR INLET DIAGNOSIS AND TESTING DAY TWO
5-2 April, 2002 Diagnosis and Testing
IAC Valve
EP1112-A/VF Typical IAC Valve IAC Valve The IAC valve (part of throttle body assembly) provides a travel path for air when the throttle plate is closed to maintain the recommended idle speed. This compensates for any load placed on the engine such as air conditioning or power steering. During cruise, the IAC is used to compensate for the additional air needed during deceleration, rapid acceleration, and during transmission shifts. This allows for a smooth transition in engine torque before and after the shift. On applications with air-assisted injectors, the IAC valve also supplies a small amount of air into the path of the fuel injectors. The jet of air causes an increase in fuel atomization at low speed and light load conditions.
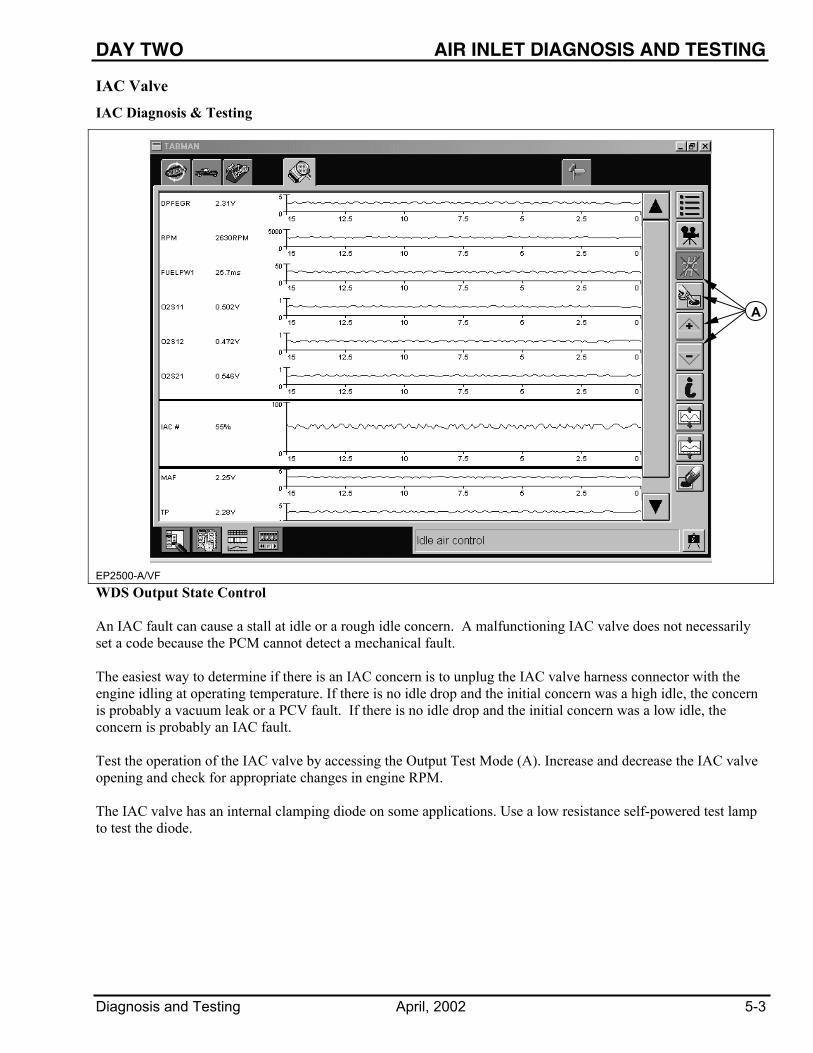
DAY TWO AIR INLET DIAGNOSIS AND TESTING
Diagnosis and Testing April, 2002 5-3
IAC Valve
IAC Diagnosis & Testing
EP2500-A/VF
WDS Output State Control An IAC fault can cause a stall at idle or a rough idle concern. A malfunctioning IAC valve does not necessarily set a code because the PCM cannot detect a mechanical fault. The easiest way to determine if there is an IAC concern is to unplug the IAC valve harness connector with the engine idling at operating temperature. If there is no idle drop and the initial concern was a high idle, the concern is probably a vacuum leak or a PCV fault. If there is no idle drop and the initial concern was a low idle, the concern is probably an IAC fault. Test the operation of the IAC valve by accessing the Output Test Mode (A). Increase and decrease the IAC valve opening and check for appropriate changes in engine RPM. The IAC valve has an internal clamping diode on some applications. Use a low resistance self-powered test lamp to test the diode.
A

AIR INLET DIAGNOSIS AND TESTING DAY TWO
5-4 April, 2002 Diagnosis and Testing
NOTES

DAY TWO AIR INLET DIAGNOSIS AND TESTING
Diagnosis and Testing April, 2002 5-5
Controlled Air Inlet Systems
EP1116-A/VF
1 2 3
Typical Controlled Air Inlet Systems There are three basic types of controlled air inlet systems:
1. Intake Manifold Tuning Valve (IMTV) system
2. Intake Manifold Runner Control (IMRC) system
3. Intake Manifold Swirl Control (IMSC) system
The IMSC system is a type of IMRC system. The symptoms of a faulty controlled air inlet system are poor performance and increased emissions.

AIR INLET DIAGNOSIS AND TESTING DAY TWO
5-6 April, 2002 Diagnosis and Testing
Controlled Air Inlet Systems
Intake Manifold Tuning Valve (IMTV) System
EP2501-A/VF
1
2
3
IMTV System Operation Item Description Item Description
1 The TP sensor and CKP signals are used to determine activation of the IMTV system.
3 When commanded ON by the PCM, the motorized actuator shutter opens up the end of the vertical separating wall at high engine speeds to allow both sides of the manifold to blend.
2 The PCM uses this information to control the IMTV.
The IMTV system is designed to provide increased intake airflow to improve torque and performance. The overall quantity of air metered to the engine is controlled by the throttle body. A malfunction in the IMTV system affects engine performance. There is no monitor input to the PCM to indicate shutter position since a failure of this system does not affect emissions.
DAY TWO AIR INLET DIAGNOSIS AND TESTING
Diagnosis and Testing April, 2002 5-7
Controlled Air Inlet Systems
Intake Manifold Tuning Valve (IMTV) System (continued) Since there is no monitor input to the PCM to indicate shutter position, a mechanical failure such as a stuck shutter does not set a code or illuminate the MIL. If you suspect a malfunction of the IMTV system, the following checks may help you isolate the fault. Be sure to refer to the PC/ED for the complete testing procedure.
• Make sure the harness is intact and the connector is firmly in place.
• Check the PCM driver command.
- Access the IMTV PID (KOER).
- Increase engine speed slowly to about 4000 rpm while observing IMTV PID. Note: The vehicle must be driven if rev limiter does not allow 3500 rpm in the bay.
The PID IMTV PID should read 100% then drop to 50% while rpm goes above 3500.
• Check all associated wiring for shorts and opens.
• Check the IMTV shutter for damage.
- Remove the IMT Valve.
- Visually inspect the IMT valve shutter for damage.
- Rotate the shutter by hand.
The shutter should rotate freely.
• Check the IMT valve actuator for coil damage.
- Reconnect the IMT valve harness connector.
- Key on, engine off.
- Access the Output Test Mode (OTM).
- Command all outputs on.
The IMT valve shutter should rotate when all outputs are commanding on.
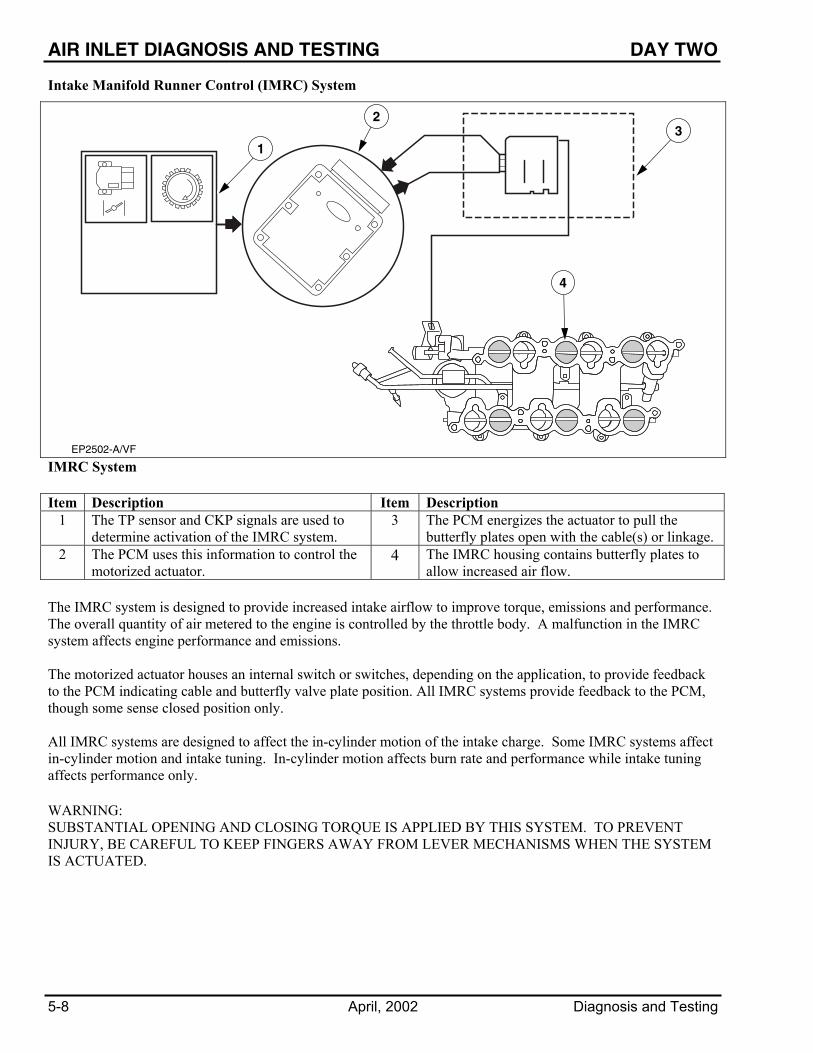
AIR INLET DIAGNOSIS AND TESTING DAY TWO
5-8 April, 2002 Diagnosis and Testing
Intake Manifold Runner Control (IMRC) System
EP2502-A/VF
1
23
4
IMRC System Item Description Item Description
1 The TP sensor and CKP signals are used to determine activation of the IMRC system.
3 The PCM energizes the actuator to pull the butterfly plates open with the cable(s) or linkage.
2 The PCM uses this information to control the motorized actuator.
4 The IMRC housing contains butterfly plates to allow increased air flow.
The IMRC system is designed to provide increased intake airflow to improve torque, emissions and performance. The overall quantity of air metered to the engine is controlled by the throttle body. A malfunction in the IMRC system affects engine performance and emissions. The motorized actuator houses an internal switch or switches, depending on the application, to provide feedback to the PCM indicating cable and butterfly valve plate position. All IMRC systems provide feedback to the PCM, though some sense closed position only. All IMRC systems are designed to affect the in-cylinder motion of the intake charge. Some IMRC systems affect in-cylinder motion and intake tuning. In-cylinder motion affects burn rate and performance while intake tuning affects performance only. WARNING: SUBSTANTIAL OPENING AND CLOSING TORQUE IS APPLIED BY THIS SYSTEM. TO PREVENT INJURY, BE CAREFUL TO KEEP FINGERS AWAY FROM LEVER MECHANISMS WHEN THE SYSTEM IS ACTUATED.
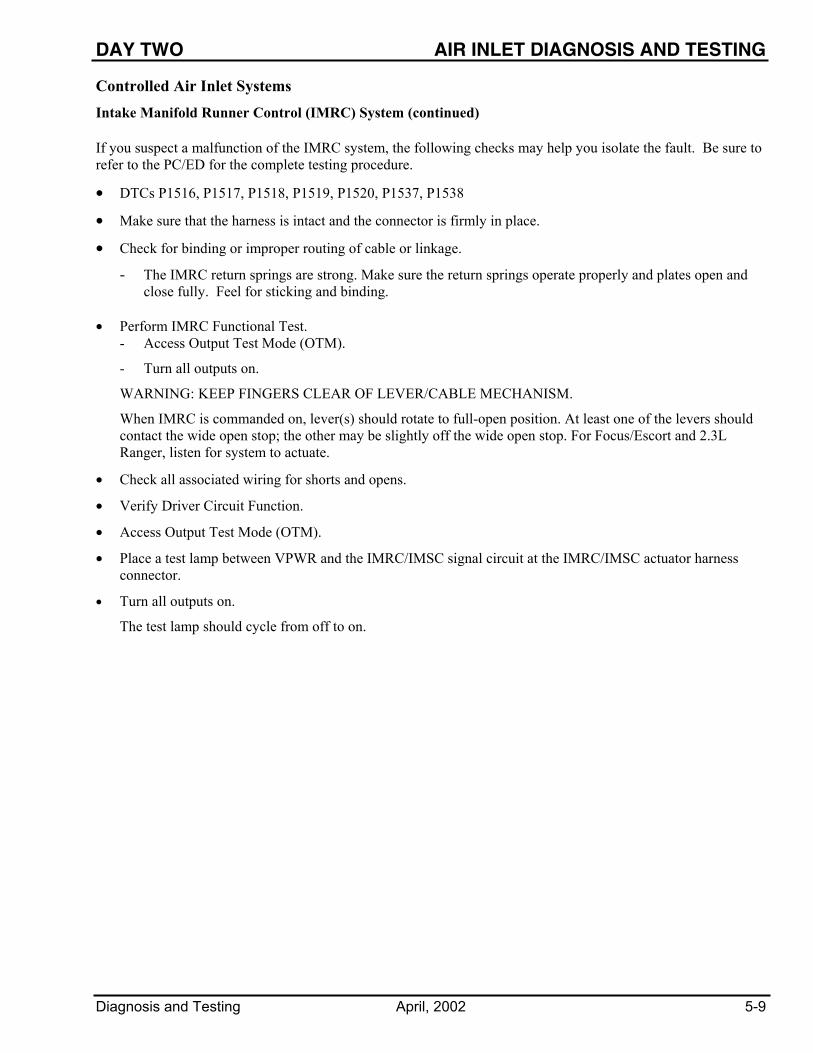
DAY TWO AIR INLET DIAGNOSIS AND TESTING
Diagnosis and Testing April, 2002 5-9
Controlled Air Inlet Systems
Intake Manifold Runner Control (IMRC) System (continued) If you suspect a malfunction of the IMRC system, the following checks may help you isolate the fault. Be sure to refer to the PC/ED for the complete testing procedure.
• DTCs P1516, P1517, P1518, P1519, P1520, P1537, P1538
• Make sure that the harness is intact and the connector is firmly in place.
• Check for binding or improper routing of cable or linkage.
- The IMRC return springs are strong. Make sure the return springs operate properly and plates open and close fully. Feel for sticking and binding.
• Perform IMRC Functional Test.
- Access Output Test Mode (OTM).
- Turn all outputs on.
WARNING: KEEP FINGERS CLEAR OF LEVER/CABLE MECHANISM.
When IMRC is commanded on, lever(s) should rotate to full-open position. At least one of the levers should contact the wide open stop; the other may be slightly off the wide open stop. For Focus/Escort and 2.3L Ranger, listen for system to actuate.
• Check all associated wiring for shorts and opens.
• Verify Driver Circuit Function.
• Access Output Test Mode (OTM).
• Place a test lamp between VPWR and the IMRC/IMSC signal circuit at the IMRC/IMSC actuator harness connector.
• Turn all outputs on.
The test lamp should cycle from off to on.

AIR INLET DIAGNOSIS AND TESTING DAY TWO
5-10 April, 2002 Diagnosis and Testing
Intake Manifold Swirl Control (IMSC) System
EP2503-A/VF
1
23
IMSC System Item Item
1 The TP sensor, CHT, and CKP signals are used to determine activation of the IMSC system.
3 The PCM energizes the solenoid with the key on engine running, vacuum is then applied to the actuator to pull the butterfly plates closed.
2 The PCM uses this information to control the electric solenoid.
The IMSC system is a type of IMRC system and is designed to provide increased intake airflow to improve torque, emissions and performance. The overall quantity of air metered to the engine is controlled by the throttle body. A malfunction in the IMSC system affects engine performance and emissions. The PCM senses valve plate position on all IMRC/IMSC systems. Some IMSC systems sense closed position only. The IMSC system may have an IMRC position sensor that signals the PCM. The PCM uses this position information to verify the valve is in the commanded position and to make changes to ignition spark advance. The IMSC system is designed to affect in-cylinder motion and has little affect on intake tuning. In-cylinder motion affects burn rate and performance while intake tuning affects performance only. The IMRC is tested in the same manner as the IMSC. WARNING: SUBSTANTIAL OPENING AND CLOSING TORQUE IS APPLIED BY THIS SYSTEM. TO PREVENT INJURY, BE CAREFUL TO KEEP FINGERS AWAY FROM LEVER MECHANISMS WHEN THE SYSTEM IS ACTUATED.

DAY TWO PASSIVE ANTI-THEFT SYSTEM
Diagnosis and Testing April, 2002 6-1
Student Objective • Identify the basic operation of the Passive Anti-Theft System (PATS).
Content
• Basic Passive Anti-Theft System (PATS)
• Integrated Passive Anti-Theft System (IPATS)
• Engine performance concerns unrelated to PATS

PASSIVE ANTI-THEFT SYSTEM DAY TWO
6-2 April, 2002 Diagnosis and Testing
Passive Anti-Theft System (PATS)
Basic PATS
Basic PATS
Item Description Item Description 1 Transceiver 5 Data link connector 2 Ignition key 6 Starter motor 3 Theft indicator 7 PATS module 4 PCM
The basic PATS has a module that is external from the PCM. The PATS module either could be a stand-alone type or incorporated within the instrument cluster. When the ignition key is placed in the RUN position, the PATS module powers up the ignition key through the transceiver. The ignition key then transmits a code through the transceiver back to the PATS module. If the key code is correct, then the PATS module sends a “known key (enable) message” to the PCM. The PCM then tries to identify the PATS module’s ID number and responds back to the PATS module to enable or disable the engine. The theft indicator on the instrument panel flashes every two seconds with the ignition key in the OFF position as a visual theft deterrent. When the ignition key is placed in the RUN or START position, the theft indicator illuminates for three seconds and then goes out if the system is OK. If a fault is detected, then the theft indicator illuminates briefly, starts to flash rapidly or stays on solid for one minute, and finally flashes a fault code ten times.

DAY TWO PASSIVE ANTI-THEFT SYSTEM
Diagnosis and Testing April, 2002 6-3
Passive Anti-Theft System
Integrated Passive Anti-Theft System (IPATS)
IPATS Integrated in the PCM
Item Description Item Description 1 Transceiver 4 Data link connector 2 Ignition key 5 Starter motor 3 Theft indicator 6 PCM
The IPATS has the PATS function integrated in the PCM. When the ignition key is placed in the RUN position, the PCM powers up the ignition key through the transceiver. The ignition key sends a code to the transceiver, which sends the code to the PCM. The PCM checks the key code against a known key code and enables or disables the engine. The theft indicator, in the instrument cluster, flashes every two seconds with the ignition key in the OFF position as a visual theft deterrent. When the ignition key is placed in the RUN or START position, the theft indicator illuminates for three seconds and then goes out if the system is OK. If a fault is detected, then the theft indicator illuminates briefly, starts to flash rapidly or stays on solid for one minute, and finally flashes a fault code ten times.
PASSIVE ANTI-THEFT SYSTEM DAY TWO
6-4 April, 2002 Diagnosis and Testing
Engine Performance Concerns Unrelated to PATS The following conditions are NOT attributable to the PATS:
• No communication with the PCM.
- The PCM always communicates on the diagnostic link regardless of theft status.
• The engine runs poorly or poor fuel economy.
- The PATS either allows the engine to run or not run.
• The engine stalls while driving.
- Once the engine runs for one second, PATS CANNOT disable the engine.
• The alarm goes off.
- PATS is completely separate from the vehicle alarm system.
• Remote entry/keyless entry problems.
- PATS is not related to the remote entry/keyless entry system.
• No crank problems on vehicles without the starter disable function.
• PATS theft indicator flashing every two seconds with the ignition key in the OFF position.
- Normal operation.

DAY TWO EMISSIONS SYSTEM DIAGNOSIS AND TESTING
Diagnosis and Testing September, 2003 7-1
Student Objective • Use critical thinking skills and available resources to diagnose and test the Emissions System.
- Explain conditions and tests related to diagnosing specific emission systems, including PCV, EGR, CAT, and EVAP.
Content
• Positive Crankcase Ventilation (PCV)
• Exhaust Gas Recirculation (EGR)
• Catalysts
- Mode 6 Data
• Evaporative Emission Systems (EVAP)
- Output State Control
- EVAP Diagnostics

EMISSIONS SYSTEM DIAGNOSIS AND TESTING DAY TWO
7-2 September, 2003 Diagnosis and Testing
Positive Crankcase Ventilation (PCV)
A
EP1042 -A/VF Typical PCV System The Positive Crankcase Ventilation (PCV) system (A) vents the vapors from the crankcase and delivers them to the engine intake manifold, where they mix with the intake air for combustion. The amount and content of vapors purged from the crankcase affects the fuel system. If a condition occurs that results in high fuel content in the vapor, the oxygen sensor indicates a rich condition and short term fuel trim and long term fuel trim goes negative to compensate. On some applications (beginning in the 2001 model year), the PCV valve may be installed into the rocker cover using a quarter-turn cam-lock design with high retention force molded plastic lines from the PCV valve to the intake manifold to prevent accidental disconnection. Currently, Ford uses heated (water or electric) and non-heated PCV valves. On vehicles that are equipped with an electrically heated PCV valve, the thermal harness only provides electrical continuity when the temperature is less than 40° F (5° C) +/- 7° F (+/- 4°C).
EP2700-A/VF

DAY TWO EMISSIONS SYSTEM DIAGNOSIS AND TESTING
Diagnosis and Testing September, 2003 7-3
Positive Crankcase Ventilation (PCV) Diagnosis and Testing If the customer’s complaint is poor fuel economy, high idle, engine stall, or no start, you should check the PCV system for a malfunction. Keep in mind that beginning with the 2001 model year, disconnecting the PCV on vehicles with the PCV monitor causes an immediate engine stall or the engine is not allowed to restart. Refer to the PC/ED for the complete testing procedures. • Verify the proper PCV valve is securely installed. • Check for a stuck PCV valve.
- Verify the PCV valve is clean.
- Shake the PCV valve.
The PCV valve should rattle when shaken.
• Plug the PCV valve.
RPM should drop.
• PCV System Check.
- Start the engine and bring to normal operating temperature.
- Disconnect the closure (fresh air) hose from the remote air cleaner or air outlet tube.
- Place a stiff piece of paper over the hose end. Wait one minute.
The vacuum should hold the paper in place. If not, check for vacuum leaks/obstruction in the PCV system (such as oil cap, PCV valve, hoses, cut grommets, valve cover bolt torque/gasket leak).

EMISSIONS SYSTEM DIAGNOSIS AND TESTING DAY TWO
7-4 September, 2003 Diagnosis and Testing
NOTES
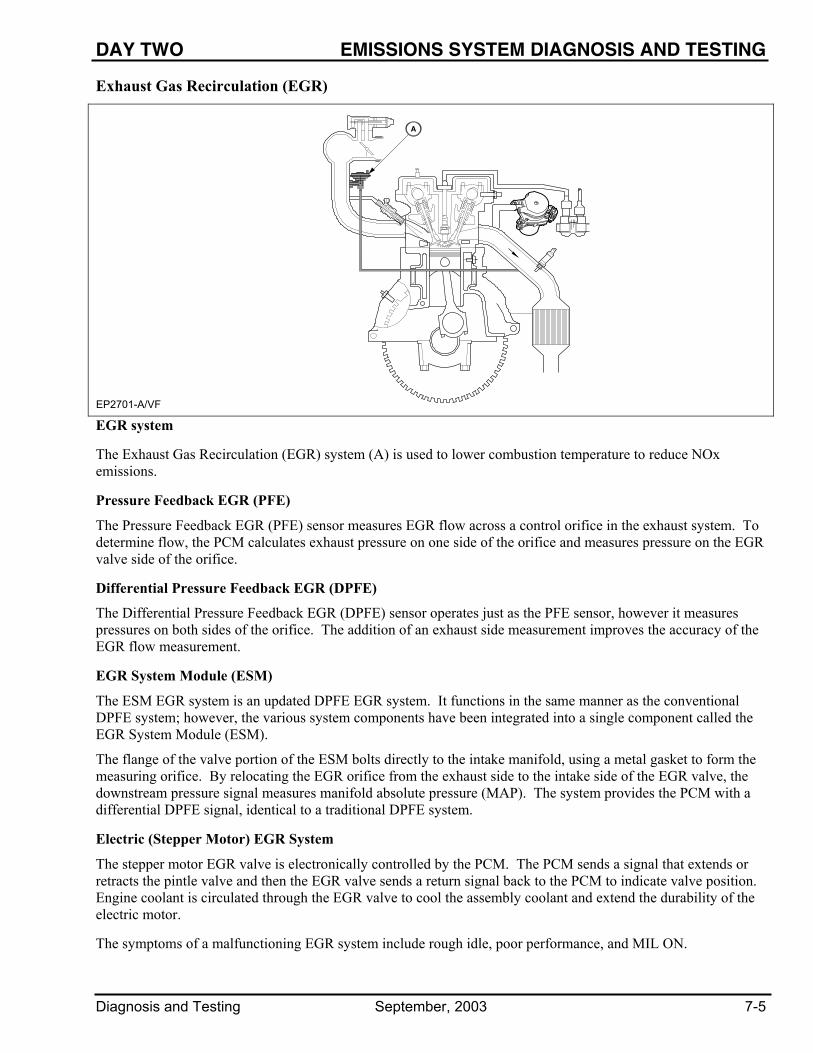
DAY TWO EMISSIONS SYSTEM DIAGNOSIS AND TESTING
Diagnosis and Testing September, 2003 7-5
Exhaust Gas Recirculation (EGR)
A
EP1063-A/VF EGR system The Exhaust Gas Recirculation (EGR) system (A) is used to lower combustion temperature to reduce NOx emissions. Pressure Feedback EGR (PFE)
The Pressure Feedback EGR (PFE) sensor measures EGR flow across a control orifice in the exhaust system. To determine flow, the PCM calculates exhaust pressure on one side of the orifice and measures pressure on the EGR valve side of the orifice. Differential Pressure Feedback EGR (DPFE)
The Differential Pressure Feedback EGR (DPFE) sensor operates just as the PFE sensor, however it measures pressures on both sides of the orifice. The addition of an exhaust side measurement improves the accuracy of the EGR flow measurement. EGR System Module (ESM)
The ESM EGR system is an updated DPFE EGR system. It functions in the same manner as the conventional DPFE system; however, the various system components have been integrated into a single component called the EGR System Module (ESM).
The flange of the valve portion of the ESM bolts directly to the intake manifold, using a metal gasket to form the measuring orifice. By relocating the EGR orifice from the exhaust side to the intake side of the EGR valve, the downstream pressure signal measures manifold absolute pressure (MAP). The system provides the PCM with a differential DPFE signal, identical to a traditional DPFE system. Electric (Stepper Motor) EGR System
The stepper motor EGR valve is electronically controlled by the PCM. The PCM sends a signal that extends or retracts the pintle valve and then the EGR valve sends a return signal back to the PCM to indicate valve position. Engine coolant is circulated through the EGR valve to cool the assembly coolant and extend the durability of the electric motor. The symptoms of a malfunctioning EGR system include rough idle, poor performance, and MIL ON.
EP2701-A/VF
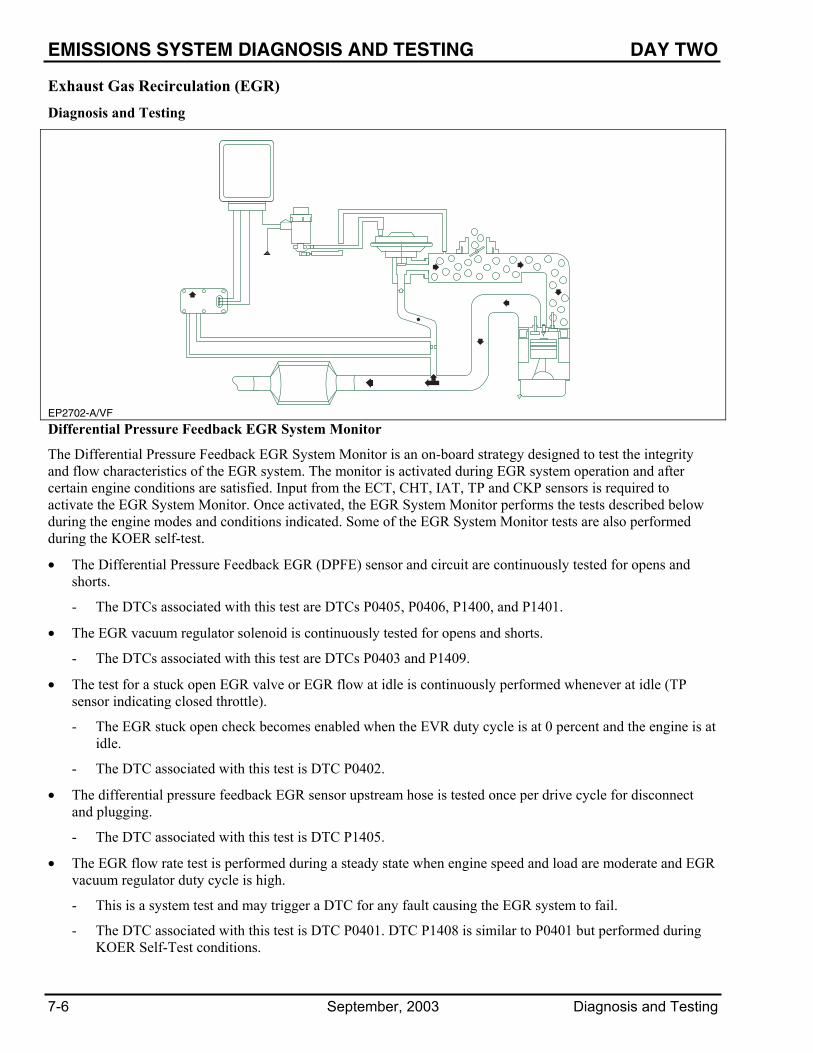
EMISSIONS SYSTEM DIAGNOSIS AND TESTING DAY TWO
7-6 September, 2003 Diagnosis and Testing
Exhaust Gas Recirculation (EGR)
Diagnosis and Testing
EP2702-A/VF Differential Pressure Feedback EGR System Monitor
The Differential Pressure Feedback EGR System Monitor is an on-board strategy designed to test the integrity and flow characteristics of the EGR system. The monitor is activated during EGR system operation and after certain engine conditions are satisfied. Input from the ECT, CHT, IAT, TP and CKP sensors is required to activate the EGR System Monitor. Once activated, the EGR System Monitor performs the tests described below during the engine modes and conditions indicated. Some of the EGR System Monitor tests are also performed during the KOER self-test.
• The Differential Pressure Feedback EGR (DPFE) sensor and circuit are continuously tested for opens and shorts.
- The DTCs associated with this test are DTCs P0405, P0406, P1400, and P1401.
• The EGR vacuum regulator solenoid is continuously tested for opens and shorts.
- The DTCs associated with this test are DTCs P0403 and P1409.
• The test for a stuck open EGR valve or EGR flow at idle is continuously performed whenever at idle (TP sensor indicating closed throttle).
- The EGR stuck open check becomes enabled when the EVR duty cycle is at 0 percent and the engine is at idle.
- The DTC associated with this test is DTC P0402.
• The differential pressure feedback EGR sensor upstream hose is tested once per drive cycle for disconnect and plugging.
- The DTC associated with this test is DTC P1405.
• The EGR flow rate test is performed during a steady state when engine speed and load are moderate and EGR vacuum regulator duty cycle is high.
- This is a system test and may trigger a DTC for any fault causing the EGR system to fail.
- The DTC associated with this test is DTC P0401. DTC P1408 is similar to P0401 but performed during KOER Self-Test conditions.

DAY TWO EMISSIONS SYSTEM DIAGNOSIS AND TESTING
Diagnosis and Testing September, 2003 7-7
Exhaust Gas Recirculation (EGR)
Differential Pressure Feedback EGR (DPFE)
Diagnosis and Testing (continued)
- The EGR flow rate is checked when the EVR duty cycle is between 80 and 100 percent and the engine RPM is less than 2500.
• The MIL is activated after one of the above tests fails on two consecutive drive cycles. Refer to the PC/ED for the complete testing procedures.
• Check all associated wiring for opens, shorts, and proper voltage.
• Check EGR system vacuum hoses for integrity and proper connection.
- A pinched or plugged EGR vacuum hose can trap vacuum between the EGR vacuum regulator solenoid and EGR valve not allowing the EGR valve to close.
• Check DPFEGR sensor output by applying vacuum with a hand pump.
- Disconnect pressure hoses at DPFE sensor (KOEO) and connect a hand vacuum pump to the downstream connection at sensor.
- Access DPFEGR PID and note PID value.
- Apply 27 to 30 kPa (8 to 9 in-Hg) vacuum to the DPFE sensor and hold for a few seconds, then quickly release the vacuum.
The DPFEGR PID voltage must be between 0.2 and 1.3 volt with the key on and no vacuum applied.
The DPFEGR PID voltage must increase to greater than 4.0 volts with the vacuum applied.
The DPFEGR PID must drop to less than 1.5 volts in less than 3 seconds when vacuum is released.
• Check for EGR flow at idle with the EVR solenoid connector off.
- Disconnect the vacuum hose at the EGR valve and connect the hose to a vacuum gauge.
- Start the engine and bring to an idle.
- While monitoring the vacuum gauge, disconnect the EGR vacuum regulator solenoid harness connector.
The EGR valve requires vacuum greater than 5.4 kPa (1.6 in-Hg) to begin to open. If the vacuum reading remains greater than 5.4 kPa (1.6 in-Hg) after the EGR vacuum regulator solenoid is electrically disconnected, this would indicate a mechanical fault in the EGR vacuum regulator solenoid.
• Inspect the EVR solenoid vent for plugging. A plugged EGR vacuum regulator solenoid vent does not allow the EGR vacuum to vent to the atmosphere.
- Disconnect the EGR vacuum regulator solenoid vacuum hoses, remove the EGR vacuum regulator solenoid vent cap (if removable), remove the filter, and inspect for blockage (or icing in some cases).
- With the EGR vacuum supply port plugged, apply 34 to 51 kPa (10 to 15 in-Hg) of vacuum directly to the EGR vacuum regulator solenoid vacuum source port with a hand vacuum pump.
If the vacuum holds or is slow to release to the atmosphere, the EGR vacuum regulator solenoid vent could be plugged or restricted.
• Measure EVR solenoid coil resistance.
Resistance should be between 26 and 40 ohms.

EMISSIONS SYSTEM DIAGNOSIS AND TESTING DAY TWO
7-8 September, 2003 Diagnosis and Testing
Exhaust Gas Recirculation (EGR)
Stepper Motor EGR System Diagnosis and Testing
EP2703-B/VF
B+
A1 B1 A2 B2
B+
23
1
6
45
Stepper Motor
Item Description Item Description
1 PCM 4 Intake manifold 2 TMAP sensor 5 Stepper motor EGR valve 3 Fresh air inlet 6 Exhaust
Stepper Motor EGR Monitor
The Stepper Motor EGR Monitor consists of an electrical and functional test that checks the stepper motor and the EGR system for proper flow. The PCM controls the EGR valve by commanding from 0 to 52 discreet increments or "steps" to get the valve from fully closed to fully open. • The stepper motor electrical test is a continuous check of the four electric stepper motor coils and circuits to
the PCM.
- The DTC associated with this test is P0403 (open circuit, short to power, or short to ground).
- If a malfunction is detected, the EGR system is disabled, setting the KOER, and CMDTC P0403 DTC.
- Additional monitoring is suspended for the remainder of the driving cycle, or until the next engine startup.

DAY TWO EMISSIONS SYSTEM DIAGNOSIS AND TESTING
Diagnosis and Testing September, 2003 7-9
Exhaust Gas Recirculation (EGR)
Stepper Motor EGR System Diagnosis and Testing (continued) • The PCM controls the EGR valve by commanding from 0 to 52 discreet increments or "steps" to get the valve
from fully closed to fully open to check for proper flow.
- DTC P0400 indicates high or low flow malfunction.
- Flow is monitored by using a Temperature Manifold Absolute Pressure (TMAP) sensor.
- In certain applications, the temperature function is used as a second IAT.
- Increased EGR flow increases manifold pressure. • A DTC of P1408, like the P0400, indicates an EGR flow failure (outside the minimum or maximum limits)
but is only set during the KOER self test.
• The P0400 and P0403 are MIL codes; the P1408 is a non-MIL code. Refer to the PC/ED for the complete testing procedures. If the DTC (Diagnostic Trouble Code) was generated by an intermittent condition, maximum benefit of the following pinpoint tests is obtained by having an assistant wiggle the harness/connectors when making measurements. • Check all associated wiring for opens, shorts, and proper voltage. • Make sure the harness connector at the stepper motor is properly seated. • Check all four stepper motor coil windings for opens and shorts.
Resistance should be between 20 and 24 ohms. • Check for stuck valve operation.
- Access the EEGR PID (EGRMDSD) and the MAP PID (MAP).
- EGRMDSD (Electronic EGR Motor Desired Position)
- Operate the engine at normal operating temperature between 1000/1200 rpm to prevent engine stalling.
- Select the Output State Control (OSC) function on the scan tool.
- Add a small amount of EGR (approx. 8 to 12 steps) using the OSC function while monitoring the MAP PID.
The MAP value should increase as EGR is introduced. The engine RPM must be held at a fixed value during this test. Additionally, DTCs may have been generated as a result of this procedure. After running this test clear any DTC that may have been induced.
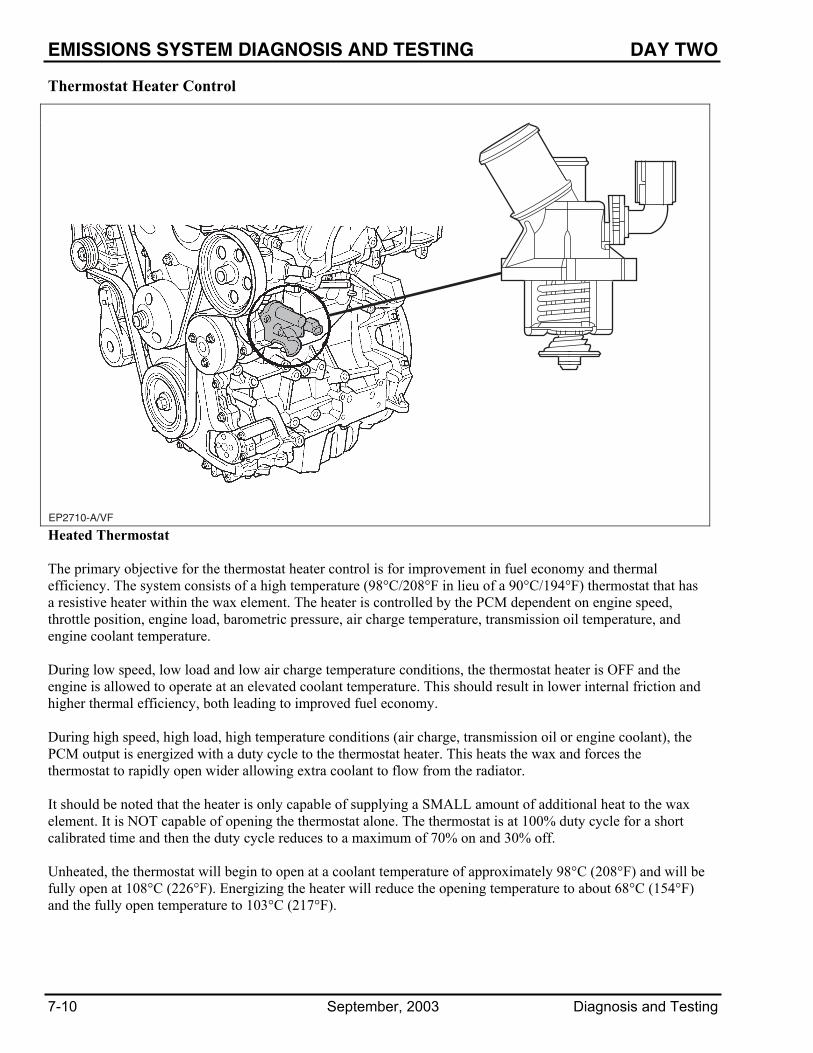
EMISSIONS SYSTEM DIAGNOSIS AND TESTING DAY TWO
7-10 September, 2003 Diagnosis and Testing
Thermostat Heater Control
Heated Thermostat
The primary objective for the thermostat heater control is for improvement in fuel economy and thermal efficiency. The system consists of a high temperature (98°C/208°F in lieu of a 90°C/194°F) thermostat that has a resistive heater within the wax element. The heater is controlled by the PCM dependent on engine speed, throttle position, engine load, barometric pressure, air charge temperature, transmission oil temperature, and engine coolant temperature. During low speed, low load and low air charge temperature conditions, the thermostat heater is OFF and the engine is allowed to operate at an elevated coolant temperature. This should result in lower internal friction and higher thermal efficiency, both leading to improved fuel economy. During high speed, high load, high temperature conditions (air charge, transmission oil or engine coolant), the PCM output is energized with a duty cycle to the thermostat heater. This heats the wax and forces the thermostat to rapidly open wider allowing extra coolant to flow from the radiator. It should be noted that the heater is only capable of supplying a SMALL amount of additional heat to the wax element. It is NOT capable of opening the thermostat alone. The thermostat is at 100% duty cycle for a short calibrated time and then the duty cycle reduces to a maximum of 70% on and 30% off. Unheated, the thermostat will begin to open at a coolant temperature of approximately 98°C (208°F) and will be fully open at 108°C (226°F). Energizing the heater will reduce the opening temperature to about 68°C (154°F) and the fully open temperature to 103°C (217°F).
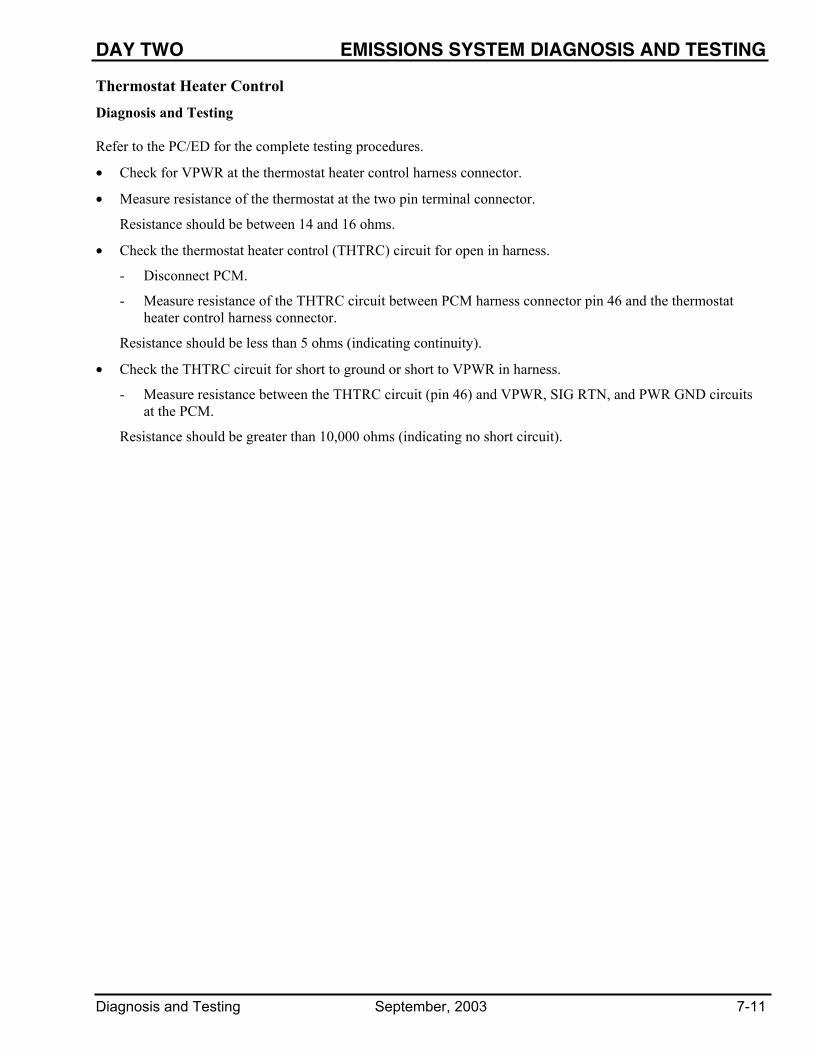
DAY TWO EMISSIONS SYSTEM DIAGNOSIS AND TESTING
Diagnosis and Testing September, 2003 7-11
Thermostat Heater Control
Diagnosis and Testing Refer to the PC/ED for the complete testing procedures.
• Check for VPWR at the thermostat heater control harness connector.
• Measure resistance of the thermostat at the two pin terminal connector.
Resistance should be between 14 and 16 ohms.
• Check the thermostat heater control (THTRC) circuit for open in harness.
- Disconnect PCM.
- Measure resistance of the THTRC circuit between PCM harness connector pin 46 and the thermostat heater control harness connector.
Resistance should be less than 5 ohms (indicating continuity).
• Check the THTRC circuit for short to ground or short to VPWR in harness.
- Measure resistance between the THTRC circuit (pin 46) and VPWR, SIG RTN, and PWR GND circuits at the PCM.
Resistance should be greater than 10,000 ohms (indicating no short circuit).

EMISSIONS SYSTEM DIAGNOSIS AND TESTING DAY TWO
7-12 September, 2003 Diagnosis and Testing
NOTES

DAY TWO EMISSIONS SYSTEM DIAGNOSIS AND TESTING
Diagnosis and Testing September, 2003 7-13
Catalysts
1
2
4
3
22
5
EP1083-A/VF
COC, TWC, and TWC + COC
Item Description Item 1 TWC 4 COC 2 Muffler 5 TWC and COC 3 From Secondary AIR Supply
With increasing exhaust emissions, a catalytic converter was added to the exhaust system in the mid-1970s. Catalytic converter technology has steadily improved, and as a result, the modern day catalyst has become the cornerstone of emission control devices. The function of the catalyst is to chemically alter or "convert" HCs, CO, and NOx gases in the exhaust to environmentally safe gases by heating precious metals such as platinum, palladium, rhodium, and ceria. In general, there are three different catalyst system types: the Conventional Oxidation Catalyst (COC), Three-Way Catalyst (TWC), and TWC + COC. The only type of catalyst that is currently monitored by On-Board Diagnostics II (OBD II) is the TWC. Catalyst Efficiency Monitor The Catalyst Efficiency Monitor uses an oxygen sensor before and after the catalyst to infer the hydrocarbon efficiency based on oxygen storage capacity of the catalyst. Under normal, close-loop fuel conditions, high efficiency catalysts have significant oxygen storage. This makes the switching frequency of the rear heated oxygen sensor (HO2S) very slow and reduces the amplitude of those switches as compared to the switching frequency and amplitude of the front HO2S. As the catalyst efficiency deteriorates, its ability to store oxygen declines. The post-catalyst or downstream HO2S signal begins to switch more rapidly with increasing amplitude, approaching the switching frequency and amplitude of the pre-catalyst or upstream HO2S. Symptoms of a malfunctioning catalyst include poor performance (plugged) and the MIL ON (DTCs).
2 2
54
1
EP2704-A/VF
3

EMISSIONS SYSTEM DIAGNOSIS AND TESTING DAY TWO
7-14 September, 2003 Diagnosis and Testing
Catalysts
Diagnosis and Testing Refer to the PC/ED for the complete testing procedures.
• Check the rear HO2S wiring and PCM connections.
If the electrical connections of the rear HO2S are interchanged/crossed, the Catalyst Efficiency Monitor Test will fail.
• Check the fuel pressure.
- Inspect the vacuum hose going to the fuel pressure regulator (return system) or the fuel rail pulse damper (mechanical returnless) for proper installation and cracks.
- On Electronic Returnless Fuel System (ERFS), the fuel pressure can be monitored by the scan tool using the Fuel Rail Pressure (FRP) sensor PID
Fuel pressures above specification can produce an abnormally rich air/fuel mixture. The rich air/fuel mixture can cause higher than normal catalyst operating temperatures.
• Inspect the exhaust system for leaks, cracks, loose connections or punctures.
If a catalyst is in series with a leaking exhaust system, it can fail the Catalyst Efficiency Monitor test.
• Inspect the exhaust system for dents, areas of collapsed material and unusual bending.
• Check manifold vacuum for an indication of restriction.
Manifold vacuum should rise above 54 kPa (16 inches-Hg) with the engine speed at 2000 rpm. The vacuum gauge reading may be normal when the engine is first started and idling. However, excessive restriction in the exhaust system causes intake manifold vacuum to decrease with the engine at a steady/constant above-idle speed.

DAY TWO EMISSIONS SYSTEM DIAGNOSIS AND TESTING
Diagnosis and Testing January, 2006 7-15
Mode 6 Data
WDS Path and Display of Mode 6 Data Mode 6 Data is a list of OBD II test results from the last time the monitor ran. WDS displays a description of the tests that are performed, test and component identifiers, the acceptable limits for the individual tests performed, and the actual value of the test since the last time the monitor ran (some monitors run every ignition key cycle). When diagnosing an intermittent concern, look for values that are just barely within the limits. These tests may identify the system causing the intermittent failure, even though a DTC has not been recorded. When there are no DTCs present and the symptom is intermittent, accessing Mode 6 Data could help you identify the area of concern. Mode 6 data can be used to diagnose numerous systems, however, it is usually used to diagnose HO2S and CAT systems. Mode 1 Data only contains the government mandated PIDs. Therefore you should use datalogger to view PIDs.

EMISSIONS SYSTEM DIAGNOSIS AND TESTING DAY TWO
7-16 January, 2006 Diagnosis and Testing
Evaporative Emission Systems (EVAP) System
EVAP System Fuel or Hydrocarbons, if not contained, evaporate into the atmosphere and contribute to photochemical smog, ozone deterioration, and eye irritation. In the fuel tank, raw fuel (when heated) evaporates and may cause HC pollutants to escape into the atmosphere. The EVAP system (A) collects these vapors, stores them, and then disposes of them through combustion. Evaporative Emission (EVAP) Leak Check Monitor
The Evaporative Emission (EVAP) Leak Check Monitor is an on-board strategy designed to detect a leak from a hole (opening) equal to or greater than 1.016 mm (0.040 inch) in the Enhanced EVAP system. If the system passes this test, the monitor then checks for a leak from a hole (opening) equal to or greater than 0.508 mm (0.020 inch). The proper function of the individual components of the Enhanced EVAP system is also examined. The EVAP Leak Check Monitor relies on the individual components of the Enhanced EVAP system to apply vacuum to the fuel tank and then seal the entire Enhanced EVAP system from atmosphere. The fuel tank pressure is then monitored to determine the total vacuum lost (bleed-up) for a calibrated period of time. Inputs from the Engine Coolant Temperature (ECT) or Cylinder Head Temperature (CHT) sensor, Intake Air Temperature (IAT) sensor, Mass Air Flow (MAF) sensor, vehicle speed, Fuel Level Input (FLI) and Fuel Tank Pressure (FTP) sensor are required to enable the EVAP Leak Check Monitor. The EVAP Leak Check Monitor does not run if the key is turned off after a PCM reset or a MAF sensor failure is indicated. The EVAP Leak Check Monitor does not initiate until the Heated Oxygen Sensor (HO2S) Monitor has completed. A malfunctioning EVAP system may cause a fuel odor and/or the MIL light to illuminate.
EP2706-A/VF

DAY TWO EMISSIONS SYSTEM DIAGNOSIS AND TESTING
Diagnosis and Testing September, 2003 7-17
Evaporative Emission Systems (EVAP) System
Diagnosis and Testing Refer to the PC/ED for the complete testing procedures. • Check all associated wiring for opens, shorts, and proper voltage. • Check the resistance of the EVAP canister purge valve.
- The EVAP canister purge valve resistance reading must be taken with the engine cooled down.
Resistance should be between 30 and 38 ohms (between 2.5 and 6 ohms for electronic EVAP canister purge valve).
• Check for causes of excessive fuel tank vacuum.
- Check for kinks or bends in the fuel vapor hoses/tubes (EVAP canister purge outlet tube and EVAP canister tube).
- Visually inspect the EVAP canister inlet port, CV solenoid filter and canister vent hose assembly for contamination or debris.
- Check the CV solenoid filter for blockage or contamination. • Check for FTP sensor connector contamination.
- Check for a completely submerged FTP sensor (tank mounted type only) in liquid fuel (can affect correct FTP voltage reading).
• Check for a missing or leaking fuel filler cap. • Check the resistance of the EVAP canister vent solenoid.
Resistance should be between 48 and 65 ohms.

EMISSIONS SYSTEM DIAGNOSIS AND TESTING DAY TWO
7-18 September, 2003 Diagnosis and Testing
Output State Control
WDS Output State Control Icons Output State Control aids in servicing output actuators associated with the PCM. This mode allows the technician to energize and de-energize most of the system output actuators on command. For example, by pressing the Output State Control icon (#) and then selecting the appropriate control (A) the technician could:
• turn the fuel pump ON or OFF.
• change the speed of the fuel pump to change fuel pressure (electronic returnless systems).
• activate the IAC valve and control engine rpm.
• activate the charcoal canister vent solenoid and pressure test the EVAP system. NOTE: As a safety precaution, Output State Control defaults to the OFF state after 10 minutes. The fuel pump
defaults to the OFF state after approximately 7-10 seconds. Output State Control also turns off after the vehicle is started or after cycling the key OFF then ON.
EP2500-A/VF
A

DAY TWO EMISSIONS SYSTEM DIAGNOSIS AND TESTING
Diagnosis and Testing September, 2003 7-19
EVAP Diagnostics
EP2707-B/VF
3
1
4
5
2
EVAP Test & Equipment Item Description Item Description
1 WDS “Powertrain” selection 4 Smoke EVAP tester 2 WDS “Fuel” selection 5 Gas EVAP tester 3 WDS “EVAP Test” selection
After retrieving DTCs with the WDS, the EVAP test function is used to determine if a leak exists. If a leak is detected, the technician can use either the Gas EVAP tester or the Smoke EVAP tester in conjunction with WDS to introduce gas or smoke into the system, to locate the leak.
• If DTC P0456 is generated, use the 0.040” leak standard.
• If DTC P0442 is generated, use the 0.020” leak standard. EVAP Test Procedure
• The charcoal canister vent solenoid is commanded ON (closed), using the output state control function.
• The Gas EVAP tester is connected to the EVAP test port and an inert gas is introduced into the system until the leak is located.
Or
• The Smoke EVAP tester is connected to the EVAP test port and smoke is introduced into the system until the leak is located.
NOTE: The gas and smoke EVAP testers are also capable of determining if a leak exists, but a scan tool is needed to close the charcoal canister vent solenoid.
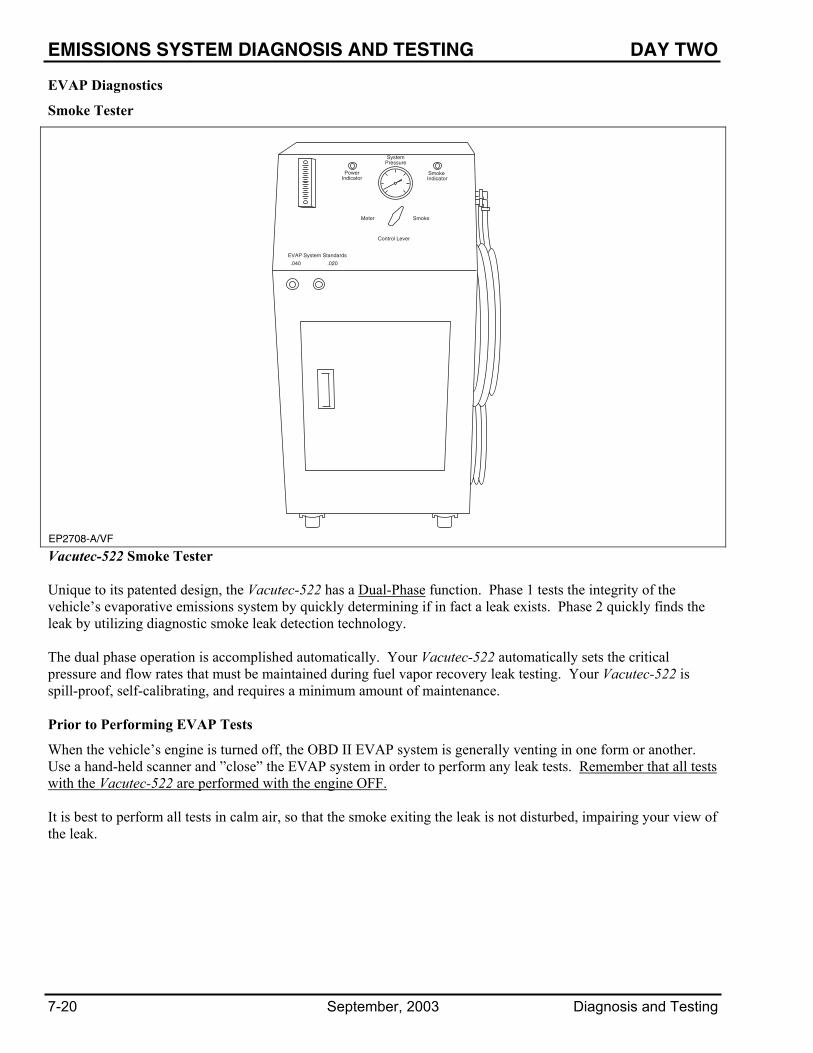
EMISSIONS SYSTEM DIAGNOSIS AND TESTING DAY TWO
7-20 September, 2003 Diagnosis and Testing
EVAP Diagnostics
Smoke Tester
EP2708-A/VF
EVAP System Standards
.040 .020
PowerIndicator
Smoke Indicator
SystemPressure
Meter Smoke
Control Lever
Vacutec-522 Smoke Tester Unique to its patented design, the Vacutec-522 has a Dual-Phase function. Phase 1 tests the integrity of the vehicle’s evaporative emissions system by quickly determining if in fact a leak exists. Phase 2 quickly finds the leak by utilizing diagnostic smoke leak detection technology. The dual phase operation is accomplished automatically. Your Vacutec-522 automatically sets the critical pressure and flow rates that must be maintained during fuel vapor recovery leak testing. Your Vacutec-522 is spill-proof, self-calibrating, and requires a minimum amount of maintenance. Prior to Performing EVAP Tests
When the vehicle’s engine is turned off, the OBD II EVAP system is generally venting in one form or another. Use a hand-held scanner and ”close” the EVAP system in order to perform any leak tests. Remember that all tests with the Vacutec-522 are performed with the engine OFF. It is best to perform all tests in calm air, so that the smoke exiting the leak is not disturbed, impairing your view of the leak.
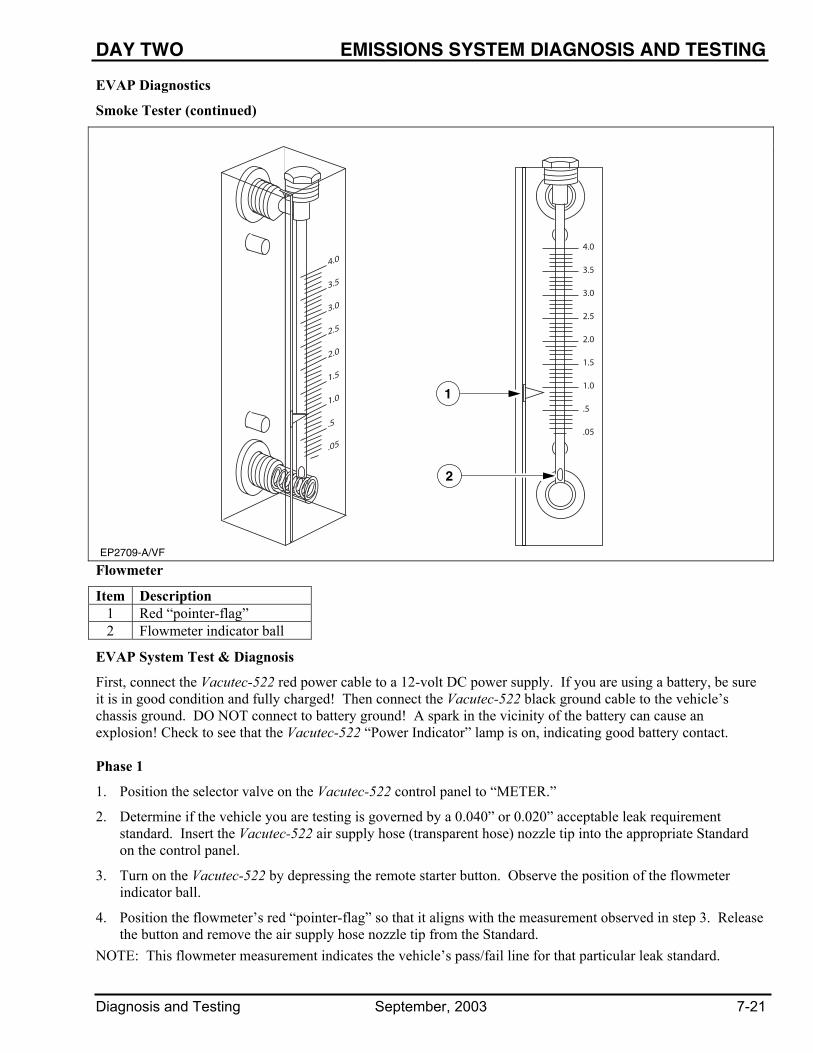
DAY TWO EMISSIONS SYSTEM DIAGNOSIS AND TESTING
Diagnosis and Testing September, 2003 7-21
EVAP Diagnostics
Smoke Tester (continued)
EP2709-A/VF
4.0
3.5
3.0
2.5
2.0
1.5
1.0
.5
.05
4.0
3.5
3.0
2.5
2.0
1.5
1.0
.5
.05
1
2
Flowmeter
Item Description 1 Red “pointer-flag” 2 Flowmeter indicator ball
EVAP System Test & Diagnosis
First, connect the Vacutec-522 red power cable to a 12-volt DC power supply. If you are using a battery, be sure it is in good condition and fully charged! Then connect the Vacutec-522 black ground cable to the vehicle’s chassis ground. DO NOT connect to battery ground! A spark in the vicinity of the battery can cause an explosion! Check to see that the Vacutec-522 “Power Indicator” lamp is on, indicating good battery contact. Phase 1
1. Position the selector valve on the Vacutec-522 control panel to “METER.”
2. Determine if the vehicle you are testing is governed by a 0.040” or 0.020” acceptable leak requirement standard. Insert the Vacutec-522 air supply hose (transparent hose) nozzle tip into the appropriate Standard on the control panel.
3. Turn on the Vacutec-522 by depressing the remote starter button. Observe the position of the flowmeter indicator ball.
4. Position the flowmeter’s red “pointer-flag” so that it aligns with the measurement observed in step 3. Release the button and remove the air supply hose nozzle tip from the Standard.
NOTE: This flowmeter measurement indicates the vehicle’s pass/fail line for that particular leak standard.

EMISSIONS SYSTEM DIAGNOSIS AND TESTING DAY TWO
7-22 September, 2003 Diagnosis and Testing
EVAP Diagnostics
Smoke Tester (continued)
5. Locate the vehicle’s EVAP Service Port and remove the green cap.
6. Install the EVAP Service Port Adapter that is provided with the Vacutec-522.
7. Connect the Vacutec-522 transparent air supply hose nozzle tip to the EVAP Service Port Adapter.
NOTE: Be sure the vehicle’s EVAP system has been closed.
8. Depress the remote starter button to activate the Vacutec-522. Notice that at the beginning of the test procedure, the flowmeter indicator ball is all the way at the top of the flowmeter. This indicates that the EVAP system is being filled. Usually less than 30 seconds after activating the Vacutec-522 (depending on capacity and fuel system level), the flowmeter indicator ball falls within the meter’s visible scale. Continue to depress the remote starter button until the ball stops descending. This could take an additional two minutes.
9. Once the indicator ball has stopped descending, observe if the indicator ball is above or below the red pointer-flag. A measurement above the pointer-flag indicates an unacceptable leak in the EVAP system (FAIL). A measurement below the pointer-flag indicates an acceptable leak in the EVAP system (PASS).
Helpful Tip
You will find that many of the leaks in the EVAP system are due to a faulty or unsecured fuel filler cap. We recommend you do not disturb the fuel filler cap prior to completing the Phase 1 test. If an unacceptable leak has been determined after completing the Phase 1 test, you can reposition or test the fuel filler cap, then perform the Phase 1 test again. If you disturb the fuel filler cap prior to performing Phase 1 and the vehicle passes the test, you can never know for sure if the leak was a fuel filler cap problem or if you are dealing with an intermittent condition. Proceed to Phase 2 of the test procedure if it has been determined that the vehicle you are testing has an unacceptable leak in the EVAP system.

DAY TWO EMISSIONS SYSTEM DIAGNOSIS AND TESTING
Diagnosis and Testing September, 2003 7-23
EVAP Diagnostics
Smoke Tester (continued) IMPORTANT: The EVAP Service Port on OBD II vehicles was designed with a Schrader valve prior to considering diagnostic smoke as a means of diagnosing EVAP leaks. It has been determined that this smoke, when passed through the Schrader valve has a tendency to partially condense and not be as dense and as effective as when it comes directly from the Vacutec-522. For this reason, during the Phase 2 testing, it is strongly recommended that you remove the Schrader valve prior to introducing the diagnostic smoke into the EVAP system. WARNING: The Schrader valve is installed with a left-hand thread! You must turn it in a CLOCKWISE direction to remove it. Phase 2
1. Position the selector valve on the Vacutec-522 control panel to “SMOKE.”
2. Remove the air supply hose nozzle tip and the EVAP Service Port Adapter from the vehicle being tested.
3. Carefully remove the vehicle’s EVAPO Service Port Schrader valve using a CLOCKWISE rotation.
4. Reinstall the EVAP Service Port Adapter onto the vehicle.
5. Connect the Vacutec-522 smoke supply hose nozzle tip to the EVAP Service Port Adapter.
NOTE: This is the Vacutec-522 black hose.
6. Remove the fuel filler cap prior to introducing smoke into the EVAP system. Depress the remote starter button to activate the Vacutec-522. The “Diagnostic Smoke Indicator Light” on the control panel lights up indicating that it is producing smoke. A cold machine may take 15-30 seconds to start producing smoke. Secure the fuel filler cap once smoke is observed exiting the fuel filler area. The removal of the fuel filler cap saves time when filling the EVAP system.
NOTE: The Vacutec-522 flowmeter is inactive during the Phase 2 test procedure.
7. Continue to introduce smoke into the EVAP system for 60 seconds so test pressure is obtained. Use the provided halogen spotlight to follow the EVAP system’s path and look for smoke exiting at the source of the leak(s). See the smoke and you’ve found the leak!
Helpful Tip
After the system has been filled with smoke for 60 seconds and test pressure has been obtained (step 7), continue to introduce smoke into the EVAP system in a pulsating manner. Press and release the remote starter button in intervals of approximately 15 seconds ON and 15 seconds OFF. This technique introduces smoke while allowing the system pressure to decrease. Continue this cycle until you see smoke exiting the leak(s).
NOTE: Exiting smoke is actually more visible as the system pressure decreases.
8. Repair the leak(s) and once again perform the Phase 1 test to verify the integrity of the EVAP system.
9. Reinstall the vehicle’s EVAP Service Port Schrader valve in a COUNTER-CLOCKWISE rotation.

EMISSIONS SYSTEM DIAGNOSIS AND TESTING DAY TWO
7-24 September, 2003 Diagnosis and Testing
EVAP Worksheet Use the Smoke Tester to check for an EVAP leak. Use the 0.020 leak standard.
1. Which solenoid must be closed to perform this test?
2. How do you close this solenoid?
3. How do you calibrate the Smoke Tester?
4. When do you take the reading for the system test in Phase 1?
5. Does this vehicle pass the EVAP Leak Test?
6. What do you do if the vehicle fails the Phase 1 test?
7. Why are you supposed to remove the Schrader valve prior to running the Smoke Test?
8. Which direction do you turn the Schrader valve to remove it?
9. Perform a Phase 2 smoke test. Remove the gas cap to create a leak. What does the flow meter indicate during the Phase 2 test?
10. What additional tool should be used to help you see the smoke?
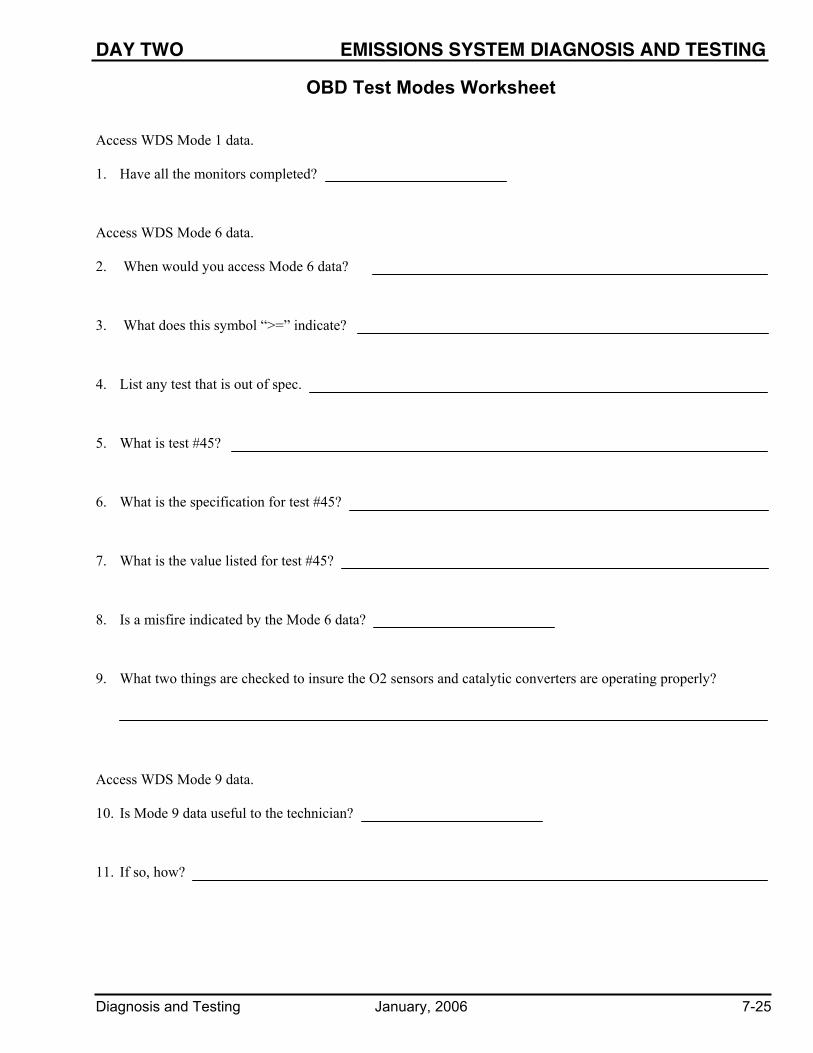
DAY TWO EMISSIONS SYSTEM DIAGNOSIS AND TESTING
Diagnosis and Testing January, 2006 7-25
OBD Test Modes Worksheet Access WDS Mode 1 data.
1. Have all the monitors completed?
Access WDS Mode 6 data.
2. When would you access Mode 6 data?
3. What does this symbol “>=” indicate?
4. List any test that is out of spec.
5. What is test #45?
6. What is the specification for test #45?
7. What is the value listed for test #45?
8. Is a misfire indicated by the Mode 6 data?
9. What two things are checked to insure the O2 sensors and catalytic converters are operating properly?
Access WDS Mode 9 data.
10. Is Mode 9 data useful to the technician?
11. If so, how?
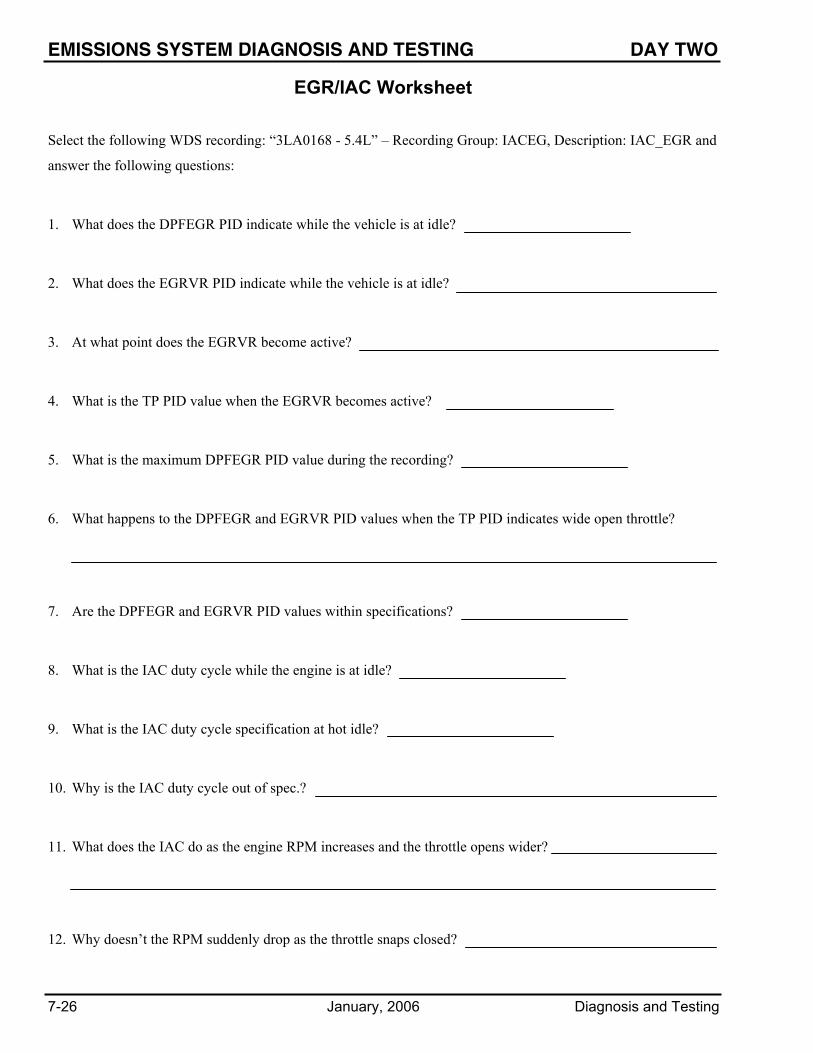
EMISSIONS SYSTEM DIAGNOSIS AND TESTING DAY TWO
7-26 January, 2006 Diagnosis and Testing
EGR/IAC Worksheet Select the following WDS recording: “3LA0168 - 5.4L” – Recording Group: IACEG, Description: IAC_EGR and
answer the following questions:
1. What does the DPFEGR PID indicate while the vehicle is at idle?
2. What does the EGRVR PID indicate while the vehicle is at idle?
3. At what point does the EGRVR become active?
4. What is the TP PID value when the EGRVR becomes active?
5. What is the maximum DPFEGR PID value during the recording?
6. What happens to the DPFEGR and EGRVR PID values when the TP PID indicates wide open throttle?
7. Are the DPFEGR and EGRVR PID values within specifications?
8. What is the IAC duty cycle while the engine is at idle?
9. What is the IAC duty cycle specification at hot idle?
10. Why is the IAC duty cycle out of spec.?
11. What does the IAC do as the engine RPM increases and the throttle opens wider?
12. Why doesn’t the RPM suddenly drop as the throttle snaps closed?
DAY TWO EMISSIONS SYSTEM DIAGNOSIS AND TESTING
Diagnosis and Testing September, 2003 7-27

EMISSIONS SYSTEM DIAGNOSIS AND TESTING DAY TWO
7-28 September, 2003 Diagnosis and Testing
NOTES

WORKSHEETS


DAY THREE WORKSHEETS
Diagnosis and Testing April, 2002 WS3-1
Worksheet 1 – EVAP DIAGNOSTICS (w/Smoke Tester) This workstation is a hands-on activity that requires you to perform an EVAP leak test using WDS and the EVAP Smoke Tester. You are asked to locate the source of the leak and identify all of the diagnostic steps taken to resolve the concern. Worksheet 2 – MIL IS ON This workstation is a PC-assisted activity that requires you to diagnose 2001 Ranger with a MIL ON. You are required to toggle between the computer menu list/test results and the Ford electronic PC/ED and are asked to identify all of the diagnostic steps taken to resolve the concern. Worksheet 3 – RUNS VERY ROUGH AT IDLE This workstation is a hands-on activity that requires you to diagnose the cause of a very rough idle and identify all of the diagnostic steps taken to resolve the concern. Worksheet 4 – CRANK/NO START This workstation is a computer-simulated activity that requires you to diagnose a Crank/No Start condition on a 2001 Town Car and identify all of the diagnostic steps taken to resolve the concern.

WORKSHEETS DAY THREE
WS3-2 April, 2002 Diagnosis and Testing
NOTES
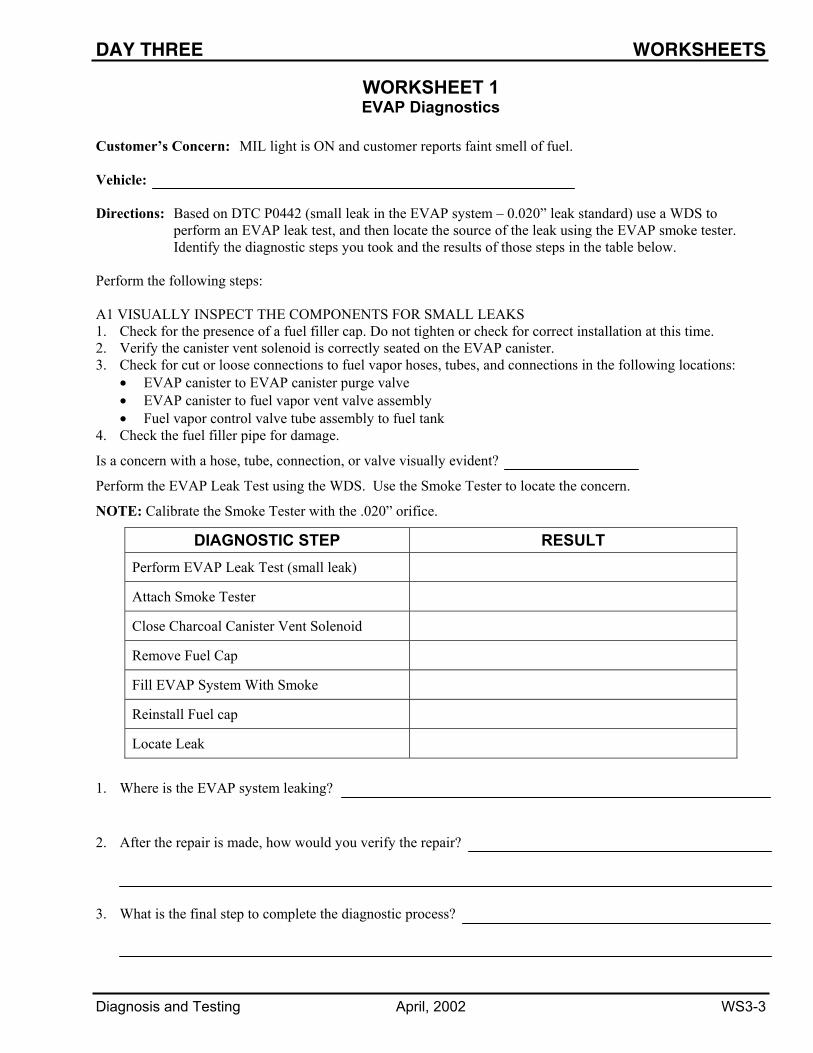
DAY THREE WORKSHEETS
Diagnosis and Testing April, 2002 WS3-3
WORKSHEET 1 EVAP Diagnostics
Customer’s Concern: MIL light is ON and customer reports faint smell of fuel.
Vehicle:
Directions: Based on DTC P0442 (small leak in the EVAP system – 0.020” leak standard) use a WDS to perform an EVAP leak test, and then locate the source of the leak using the EVAP smoke tester. Identify the diagnostic steps you took and the results of those steps in the table below.
Perform the following steps: A1 VISUALLY INSPECT THE COMPONENTS FOR SMALL LEAKS 1. Check for the presence of a fuel filler cap. Do not tighten or check for correct installation at this time. 2. Verify the canister vent solenoid is correctly seated on the EVAP canister. 3. Check for cut or loose connections to fuel vapor hoses, tubes, and connections in the following locations:
• EVAP canister to EVAP canister purge valve • EVAP canister to fuel vapor vent valve assembly • Fuel vapor control valve tube assembly to fuel tank
4. Check the fuel filler pipe for damage.
Is a concern with a hose, tube, connection, or valve visually evident?
Perform the EVAP Leak Test using the WDS. Use the Smoke Tester to locate the concern.
NOTE: Calibrate the Smoke Tester with the .020” orifice.
DIAGNOSTIC STEP RESULT Perform EVAP Leak Test (small leak)
Attach Smoke Tester
Close Charcoal Canister Vent Solenoid
Remove Fuel Cap
Fill EVAP System With Smoke
Reinstall Fuel cap
Locate Leak 1. Where is the EVAP system leaking?
2. After the repair is made, how would you verify the repair?
3. What is the final step to complete the diagnostic process?

WORKSHEETS DAY THREE
WS3-4 April, 2002 Diagnosis and Testing
WORKSHEET 2 MIL is ON
Customer’s Concern: The customer brings in a 2001 Ranger (4.0L engine) with the MIL ON. Directions: Based on the customer’s concern, perform the diagnostic steps directed by the PC/ED until you
locate the failed component or circuit. Identify the diagnostic steps you took and the results of those steps in the table below (i.e. QT1=Yes or Performed test XX and the test results were XX Volts).
DIAGNOSTIC STEP RESULT

DAY THREE WORKSHEETS
Diagnosis and Testing April, 2002 WS3-5
WORKSHEET 2 MIL is ON
1. What component(s) or circuit(s) failed?
2. When jumpered, why DIDN’T the HO2S PID read battery voltage?
3. What did this pinpoint test step tell you?
4. What was the root cause of the failure?
5. After the repair is made, how would you verify the repair?
6. What is the final step to complete the diagnostic process?

WORKSHEETS DAY THREE
WS3-6 January, 2006 Diagnosis and Testing
WORKSHEET 3 Runs Very Rough at Idle
Vehicle:
DIRECTIONS: Your instructor has provided you with a repair order that states the concern of the vehicle at this workstation. Verify the concern, perform tests and diagnose the concern. 1. What is the symptom?
2. Based on the symptom, what system(s) could be at fault?
3. Based on the symptom, what component (s) could be at fault?
Diagnose the vehicle concern and fill in the table below. Include all critical information such as: wire color. circuit numbers, and measurements that you have obtained.
DIAGNOSTIC STEP RESULT
Continued on next page

DAY THREE WORKSHEETS
Diagnosis and Testing January, 2006 WS3-7
WORKSHEET 3 Runs Very Rough at Idle
Diagnostic table- continued DIAGNOSTIC STEP RESULT
4. What was the cause of the customer concern?
WORKSHEETS DAY THREE
WS3-8 April, 2002 Diagnosis and Testing
WORKSHEET 4 Crank / No Start
Customer’s Concern: The customer brings in a 2001 Town Car with an engine that cranks but does not start.
Directions: Based on the customer’s concern, perform the diagnostic steps directed by the PC/ED until you locate the failed component or circuit. Identify the diagnostic steps you took and the results of those steps in the table below (i.e. QT1=Yes or Performed test XX and the test results were XX Volts).
DIAGNOSTIC STEP RESULT

DAY THREE WORKSHEETS
Diagnosis and Testing April, 2002 WS3-9
WORKSHEET 4 Crank / No Start
1. What component(s) or circuit(s) failed?
2. What pinpoint test step checks the Flash EPROM power supply?
3. Why is the Flash EPROM power supply checked?
4. After the repair is made, how would you verify the repair?
5. What is the final step to complete the diagnostic process?

WORKSHEETS DAY THREE
WS3-10 April, 2002 Diagnosis and Testing
NOTES

DAY FOUR WORKSHEETS
Diagnosis and Testing January, 2006 WS4-1
Worksheet 1 – NO CRANK / NO START or CRANK / NO START This workstation is a hands-on activity that requires you to diagnose a “No Crank/No Start” or a “Crank/No Start” condition. You are asked to locate the cause of the fault and identify all of the diagnostic steps taken to resolve the concern. Worksheet 2 – ENGINE RUNS ROUGH This workstation is a PC-assisted activity that requires you to diagnose a rough running engine on a 2001 Town Car. You are required to toggle between the computer images and the Ford electronic PC/ED and asked to identify all of the diagnostic steps taken to resolve the concern. Worksheet 3 – HESITATION ON ACCELERATION This workstation is a hands-on activity that requires you to diagnose the cause of a slight hesitation on acceleration and identify all of the diagnostic steps taken to resolve the concern. Worksheet 4 – ENGINE RUNS ROUGH This workstation is a computer-simulated activity that requires you to diagnose a rough running engine on a 2001 Ranger and identify all of the diagnostic steps taken to resolve the concern.

WORKSHEETS DAY FOUR
WS4-2 January, 2006 Diagnosis and Testing
WORKSHEET 1 No Crank / No Start
Vehicle:
DIRECTIONS: Your instructor has provided you with a repair order that states the concern of the vehicle at this workstation. Verify the concern, perform tests and diagnose the concern. 1. What is the symptom?
2. Based on the symptom, what system(s) could be at fault?
3. Based on the symptom, what component (s) could be at fault?
Diagnose the vehicle concern and fill in the table below. Include all critical information such as: wire color. circuit numbers, and measurements that you have obtained.
DIAGNOSTIC STEP RESULT
Continued on next page
DAY FOUR WORKSHEETS
Diagnosis and Testing January, 2006 WS4-3
WORKSHEET 1 No Crank / No Start
Diagnostic table- continued
DIAGNOSTIC STEP RESULT
4. What was the cause of the customer concern?

WORKSHEETS DAY FOUR
WS4-4 September, 2003 Diagnosis and Testing
WORKSHEET 2 Engine Runs Rough
Customer’s Concern: The customer brings in a 2001 Town Car with the MIL ON and a rough running engine. Directions: Based on the customer’s concern, perform the diagnostic steps directed by the PC/ED until you
locate the failed component or circuit. Identify the diagnostic steps you took and the results of those steps in the table below (i.e. QT1=Yes or Performed test XX and the test results were XX Volts).
DIAGNOSTIC STEP RESULT

DAY FOUR WORKSHEETS
Diagnosis and Testing September, 2003 WS4-5
WORKSHEET 2 Engine Runs Rough
1. What component(s) or circuit(s) failed?
2. Why did the pinpoint test have you check the DPFEGR PID at KOER and at KOEO?
3. Why didn’t the INJx_F PID detect the fault?
4. After the repair is made, how would you verify the repair?
5. What is the final step to complete the diagnostic process?
WORKSHEETS DAY FOUR
WS4-6 January, 2006 Diagnosis and Testing
WORKSHEET 3 Hesitation on Acceleration
Vehicle:
DIRECTIONS: Your instructor has provided you with a repair order that states the concern of the vehicle at this workstation. Verify the concern, perform tests and diagnose the concern. 1. What is the symptom?
2. Based on the symptom, what system(s) could be at fault?
3. Based on the symptom, what component (s) could be at fault?
Diagnose the vehicle concern and fill in the table below. Include all critical information such as: wire color. circuit numbers, and measurements that you have obtained.
DIAGNOSTIC STEP RESULT
Continued on next page

DAY FOUR WORKSHEETS
Diagnosis and Testing January, 2006 WS4-7
WORKSHEET 3 Hesitation on Acceleration
Diagnostic table- continued
DIAGNOSTIC STEP RESULT
4. What was the cause of the customer concern?

WORKSHEETS DAY FOUR
WS4-8 September, 2003 Diagnosis and Testing
WORKSHEET 4 Engine Runs Rough
Customer’s Concern: The customer brings in a 2001 Ranger (4.0L) with the MIL ON and the engine running rough.
Directions: Based on the customer’s concern, perform the diagnostic steps directed by the PC/ED until you
locate the failed component or circuit. Identify the diagnostic steps you took and the results of those steps in the table below (i.e. QT1=Yes or Performed test XX and the test results were XX Volts).
DIAGNOSTIC STEP RESULT

DAY FOUR WORKSHEETS
Diagnosis and Testing September, 2003 WS4-9
WORKSHEET 4 Engine Runs Rough
1. What component(s) or circuit(s) failed?
2. After the repair is made, how would you verify the repair?
3. What is the final step to complete the diagnostic process?

WORKSHEETS DAY FOUR
WS4-10 September, 2003 Diagnosis and Testing
NOTES