Embed Size (px)
Citation preview
Forced Relocation and ResidentialInstability among Urban Renters
matthew desmondHarvard University
carl gershensonHarvard University
barbara kiviatHarvard University
abstract Residential instability often brings about other forms of instability in
families, schools, and communities that compromise the life chances of adults and
0037-7
children. Social scientists have found that low-income families move frequently
without fully understanding why. Drawing on novel data of more than 1,000 Mil-
waukee renters, this article explores the relationship between forced relocation and
residential instability. It finds that low incomes are associated with higher rates of
mobility due to poorer renters’ greater exposure to forced displacement. Not only
do higher rates of formal and informal eviction, landlord foreclosure, and building
condemnation directly increase the mobility of poorer renters, but forced displace-
ment also increases subsequent unforced mobility. A forced move often compels
renters to accept substandard housing, which drives them to soon move again.
This article reveals mechanisms of residential mobility among low-income renters,
identifies previously undocumented consequences of forced displacement, and de-
velops a more comprehensive model of residential instability and urban inequality.
oduction
intrLow-income Americans have high rates of residential instability. Between2005 and 2010, half of all households below the poverty line moved at leastonce ðIhrke and Faber 2012; see also Phinney 2013Þ. Poor children are al-most twice as likely to experience acute residential instability than theirwealthier counterparts, moving more than six times before adulthoodðWood et al. 1993Þ. That low-income families move often is well known;why they move is a question that remains largely unresolved.
Social Service Review (June 2015). © 2015 by The University of Chicago. All rights reserved.
961/2015/8902-0001$10.00
227
This content downloaded from 128.103.149.52 on Tue, 19 May 2015 08:31:52 AMAll use subject to JSTOR Terms and Conditions

Identifying the mechanisms of residential mobility among low-income
228 | Social Service Review
families is important because residential stability can reinforce family, ed-ucational, and neighborhood stability ðEvans 2004Þ.When a family moves,children often change schools and must make new friends, adults mustintegrate into new neighborhoods, and both the sending and receivingcommunities must adjust to new arrivals ðBeen et al. 2011; Sampson 2012Þ.Residential instability has been linked to a wide array of social and healthdisparities ðJelleyman and Spencer 2008; Sharkey and Sampson 2010Þ.Understanding why families move would promote our understanding ofthose disparities and could inform policy solutions aimed at stabilizingdisadvantaged families and communities.
Drawing on novel data ofmore than 1,000Milwaukee renters, this articleexplores, through statistical analyses, the relationship between forced relo-cation and residential instability. We examine the degree to which low-income renters exhibit higher rates of residential mobility than better-offrenters because they experience higher rates of forced displacement. Thisstudy also investigates if forced mobility contributes to higher rates ofsubsequent unforced mobility, as families seek to move quickly from sub-standard housing they were compelled to accept in the hurried aftermath ofan eviction. Do urban renters whose most recent move was forced live inlower-quality housing, compared to those who did not experience forceddisplacement? Are urban renters who experienced a forced move morelikely to undertake an unforced move soon thereafter, compared to thosewho did not experience forced displacement? Together, these researchquestions explore the link between residential instability, forced displace-ment, and housing quality.
moving for attainment or necessity?
If residential instability is a driver of social inequality and health disparitiesðe.g., Haynie and South 2005; Jelleyman and Spencer 2008Þ, then a crucialquestion for social scientists and policy makers is why families move. Thisquestion is especially pertinent in regard to low-income families, who notonly exhibit high rates of residential instability but also have fewer re-sources that can be marshaled to buffer the negative effects of a move.
Social scientists trying to understand why low-income families move asmuch as they do mainly have built on the residential attainment model,which perceives mobility as the result of social climbing ðLogan and Alba
This content downloaded from 128.103.149.52 on Tue, 19 May 2015 08:31:52 AMAll use subject to JSTOR Terms and Conditions

1993; South and Crowder 1997Þ. When people move, they try to move up,
Forced Relocation and Residential Instability | 229
parlaying economic capital for residential advantage. Spatial location isunderstood to be the outcome of an “individual-level attainment process”involving families “upgrading from central-city slums to working-classneighborhoods to suburbs” ðLogan and Alba 1993, 243–44Þ.
According to the residential attainment perspective, moving typically isvolitional, beneficial, and associated with upward mobility and residentialsatisfaction. Much of the residential mobility literature bears the imprint ofthis perspective as well as an intentionality bias, taking for granted thatrelocations are self-actuated and intentional. To Greg Duncan and SandraNewman ð2007, 174–75Þ, for example, “moves are, for the most part, ratio-nal, deliberate, and planned. . . .The sequence begins with a desire to moveand proceeds to crystallized intentions or plans and finally to the move it-self.” Yet many moves undertaken by low-income families in fact are in-voluntary and harmful, especially in the case of forced displacement. Thissuggests a different perspective on residential mobility, which we call theresidential instability model.
Peter Rossi’s classic book Why Families Move ð½1955� 1980Þ generally isremembered for explaining residential mobility as the result of life cyclechanges, but Rossi also writes a fair deal about forced moves. He classifiesalmost 40 percent of the moves in his study as forced due to events such aseviction, building demolition, or severe income loss. New York City pro-cesses roughly 350,000 housing courts cases a year and most allege non-payment of rent ðBrescia 2009Þ. Milwaukee, a city of just 104,720 renterhouseholds—and the setting of this study—sees 16 court-ordered evictions aday, with 1 in 14 renter-occupied households in inner-city black neighbor-hoods evicted annually ðDesmond 2012bÞ. Most evictions are attributed tononpayment of rent. A recent survey of tenants in eviction court found thatone-third devoted at least 80 percent of their household income to rent andthat 92 percent received an eviction notice for falling behind ðDesmondet al. 2013Þ. It does not take a major life event ði.e., death, divorceÞ to causeseverely housing-burdened families to miss a rent payment; pedestrianexpenses or setbacks such as a reduction in work hours or a public benefitssanction can cause families to come up short with the rent.1
1. In recent decades, the incomes of the poor have fallen or flat-lined, rents have soared,
and housing assistance has not been extended to meet growing need ðSchwartz 2010Þ. As a
This content downloaded from 128.103.149.52 on Tue, 19 May 2015 08:31:52 AMAll use subject to JSTOR Terms and Conditions

Far from being associated with social mobility or prosocial outcomes,
230 | Social Service Review
forced mobility has been linked to downward moves with respect to neigh-borhood quality as well as to a number of adverse individual-level effectsðDeLuca, Garboden, and Rosenblatt 2013Þ. A recent study finds that renterswho experienced a forced move relocated to neighborhoods with higherpoverty and violent-crime rates than the neighborhoods from which theywere evicted ðDesmond and Shollenberger 2013Þ. Eviction and other kindsof forced moves also have been linked to material hardship and homeless-ness ðBurt 2001; Hartman and Robinson 2003Þ, and the resulting trauma hasbeen associated with mental health problems and even suicide ðSerby et al.2006; Manzo, Kleit, and Couch 2008Þ.
toward a more comprehensive model of residential
mobility among urban rentersThe residential attainment and residential instability perspectives presentcomplementary outlooks onwhy households move and what moving meansfor their life chances.These perspectives can be combined into a more com-prehensive model of the relationship between residential and financial sta-bility. This model is predicated on the simple but underappreciated recog-nition that some city dwellers move because they are forced to and somemove because they desire to. We expect the incidence of forced moves todecline with income and the incidence of unforced moves to increase withincome. Combining these two trends into a single model suggests threebroad types of mobility among urban renters corresponding to their eco-nomic position: forced mobility ðe.g., evictionÞ, immobility ðstaying in thesame home over timeÞ, and unforced mobility ðe.g., voluntarily moving to abigger apartmentÞ.We expect forced mobility to be more prevalent amongfinancially insecure renters, unforced mobility to be more prevalent amongfinancially secure renters, and immobility or residential stability to be moreprevalent among renters who fall in between those two groups in theincome distribution ðCoulton, Theodos, and Turner 2012; Phinney 2013Þ.This is illustrated in figure 1.
Our proposed model focuses on the experiences of urban renters. Na-tionwide the majority of low-income families live in rental housing, andmost receive no federal housing assistance ðRetsinas and Belsky 2008Þ. To
result, most poor renting families in America now devote over half of their income to hous-
g costs ðDesmond 2015Þ.
inThis content downloaded from 128.103.149.52 on Tue, 19 May 2015 08:31:52 AMAll use subject to JSTOR Terms and Conditions
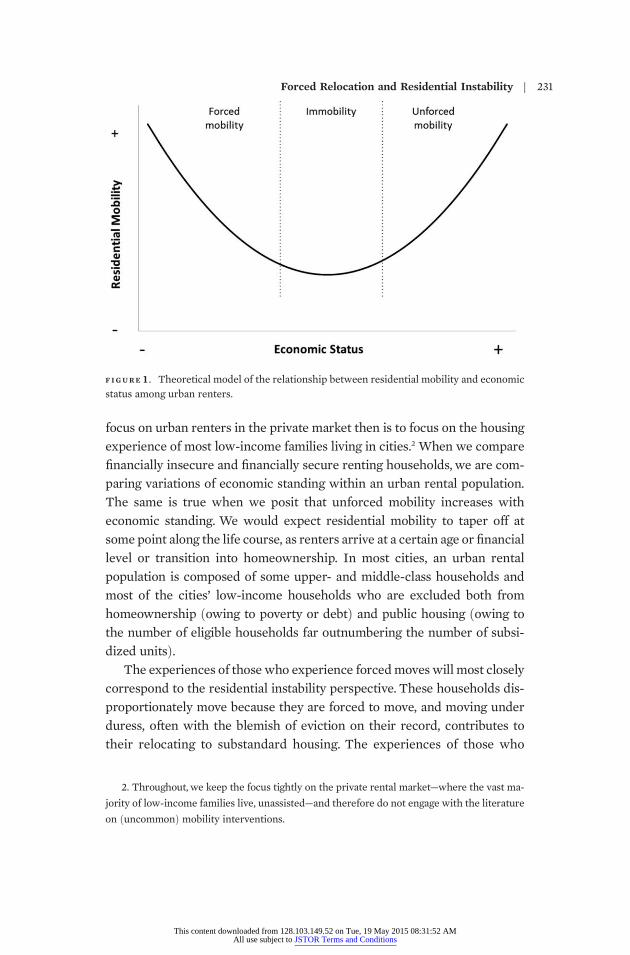
focus on urban renters in the private market then is to focus on the housing2
F IGURE 1 . Theoretical model of the relationship between residential mobility and economicstatus among urban renters.
Forced Relocation and Residential Instability | 231
experience of most low-income families living in cities. When we comparefinancially insecure and financially secure renting households, we are com-paring variations of economic standing within an urban rental population.The same is true when we posit that unforced mobility increases witheconomic standing. We would expect residential mobility to taper off atsome point along the life course, as renters arrive at a certain age or financiallevel or transition into homeownership. In most cities, an urban rentalpopulation is composed of some upper- and middle-class households andmost of the cities’ low-income households who are excluded both fromhomeownership ðowing to poverty or debtÞ and public housing ðowing tothe number of eligible households far outnumbering the number of subsi-dized unitsÞ.
The experiences of those who experience forcedmoves will most closelycorrespond to the residential instability perspective. These households dis-proportionately move because they are forced to move, and moving underduress, often with the blemish of eviction on their record, contributes totheir relocating to substandard housing. The experiences of those who
2. Throughout, we keep the focus tightly on the private rental market—where the vast ma-
jority of low-income families live, unassisted—and therefore do not engage with the literature
on ðuncommonÞ mobility interventions.
This content downloaded from 128.103.149.52 on Tue, 19 May 2015 08:31:52 AMAll use subject to JSTOR Terms and Conditions

undertake unforced moves, on the other hand,will most closely correspond
232 | Social Service Review
to the residential attainment model. These households move because theywant better housing or better neighborhoods. The experience of the resi-dentially immobile, those somewhere in between financial insecurity andsecurity, are reflected in neither the residential attainment nor the residen-tial instability models, precisely because these families stay put.They are notso poor that they frequently experience forced displacement, but neithercan they move to get ahead by relocating to a safer block or a better apart-ment. Together, these considerations lead us to hypothesize that, amongurban renters, those at both tails of the income distribution ðthe financiallyinsecure and secureÞ will have higher rates of residential mobility thanthose in the middle of the distribution ðhypothesis 1Þ.
If the moves of very poor renters often are forced displacements suchas landlord foreclosures, building condemnations, formal court-mediatedevictions, or informal evictions in which landlords pressure tenants toleave short of taking full legal action ðHartman and Robinson 2003Þ, thenin the absence of forced moves these families might very well enjoy a de-gree of residential stability. This leads us to our second hypothesis: be-cause forced moves mediate the association between income and mobility,income will not be statistically associated with residential mobility aftercontrolling for forced relocations ðhypothesis 2Þ.
forced moves and subsequent
residential instabilityIf involuntary displacement results in renters moving into dilapidated hous-ing units, then these renters may be anxious to quickly relocate to moredesirable units once they get back on their feet. Consider, for example, theexperiences of the Hinkstons, an African American family an author of thisstudy met while conducting fieldwork among low-income tenants and theirlandlords in Milwaukee ðDesmond 2012a, 2012bÞ.3 Doreen ð44Þ, a singlemother of four who received disability payments,was the oldest member ofthe Hinkston household, followed by her two oldest daughters, Patrice ð25Þ,herself a single mother of three, and Natasha ð19Þ. The Hinkstons lived for5 years in a five-bedroom house in a low-income and segregated, but fairly
3. All names in this paragraph are pseudonyms.
This content downloaded from 128.103.149.52 on Tue, 19 May 2015 08:31:52 AMAll use subject to JSTOR Terms and Conditions
stable, neighborhood.When Doreen spent money to help a sister affected
Forced Relocation and Residential Instability | 233
by Hurricane Katrina, this unexpected expense led the family to be evicted.Eager to avoid a homeless shelter, the Hinkstons moved into a run-down,two-bedroom apartment in a high-crime, inner-city neighborhood where alandlord was willing to overlook Doreen’s eviction record. “They wererushers,” their landlord later explained, acknowledging the poor conditionof the unit. “They moved in on top of roaches.” The apartment was far toosmall for a family of eight—no one’s bed was theirs alone—and toilets andsinks would remain stopped up for days, an external door fell off its hinges,and there were so many roaches that Doreen planned to leave all the fur-niture in the apartment when they eventually left it. “We took this ½apart-ment� because we were desperate,” Doreen said. “But we not gonna be herelong.” The family soon started looking for better housing. In a year’s time,the family was able to voluntarily move to a better apartment. On beingasked if she looked forward to moving, Doreen’s youngest daughter ð13Þ an-swered, “Of course. I hate this house.”
The Hinkstons likely would not have moved from their five-bedroomhouse had they not been evicted, nor would they have moved from thesecond, roach-infested apartment had it not been so small and run-down.Housing dissatisfaction was a key mechanism linking their first, forcedmove to their subsequent, unforced relocation. Based on experiences likethose of the Hinkstons, we hypothesize that urban renters whose mostrecent move was forced will live in lower-quality housing, compared tothose who did not experience forced mobility ðhypothesis 3Þ. We also hy-pothesize that urban renters who experienced a forced move will be morelikely to undertake an unforced move soon thereafter, compared to thosewho did not experience forced mobility ðhypothesis 4Þ.
Taken together, our four hypotheses posit multiple residential trajecto-ries among urban renters. We expect financially secure renters to exhibitheightened rates of voluntary mobility aimed at gaining residential advan-tage or improved housing conditions.We expect financially insecure rentersto exhibit heightened rates of involuntary mobility, moving because theymust. Involuntary mobility by definition causes residential instability, butwe expect that in many cases the influence of a forced move on residentialmobility will last beyond the relocation immediately following eviction be-cause those relocating under duress often accept subpar housing but soonafter look to move to better conditions.
This content downloaded from 128.103.149.52 on Tue, 19 May 2015 08:31:52 AMAll use subject to JSTOR Terms and Conditions
data
234 | Social Service Review
Designed to collect new data related to housing, poverty, and urban life, theMilwaukee Area Renters Study ðMARSÞ is an in-person survey of 1,086households in Milwaukee. One person per household, usually an adultleaseholder, was interviewed. The MARS instrument is composed of morethan 250 unique items and was administered in English and Spanish. TheUniversity of Wisconsin Survey Center supervised data collection, whichtook place between 2009 and 2011.4
TheMARS samplewas limited to renters. As inmany cities, Milwaukee’srenters are poorer than its overall population. Comparing the weightedMARS sample to 2010 US Census data, we see that the median annualhousehold income among Milwaukee renters is almost $5,500 lower thanthat of the city’s population ð$30,398 vs. $35,851Þ.
Milwaukee is a strategic setting in which to investigate the experiencesof urban renters for at least three reasons. First, the characteristics of Mil-waukee’s residents and rental market are comparable to those of manyAmerican cities. In racial composition, population size, and unemploymentrate, Milwaukee is similar to many midsize American cities. Just over halfof Milwaukee’s housing units ð52 percentÞ are occupied by renters, similarto the proportions of Chicago, Houston, Dallas, San Diego, Columbus, andBaltimore ðNational Multi Housing Council 2009Þ. In terms of median rent,Milwaukee County falls in the most expensive third of the country, ranking1,420th out of 4,763 counties in the United States and Puerto Rico. Citieswith similar rent distributions include Portland, OR; Charlotte, NC; Gary,IN; and Baton Rouge, LA ðUS Department of Housing and Urban Develop-ment 2009Þ. Second, renter protections in Milwaukee are fairly typical.Cities with a stalwart tradition of tenant unionizing and an economicallydiverse rental population such as New York and Boston tend to boast oftoothier tenant protections than those like Milwaukee, in which mostmiddle- and upper-class households own their homes. But most cities’renter protections more closely resemble Milwaukee’s than New York’s orBoston’s ðManheim 1989Þ. Third, Milwaukee is one of many understudiedcities within urban sociology. Data on New York, Chicago, and Los Angeles
4. TheMARS survey took place in thewake of the foreclosure crisis. Although foreclosures
of rental property increased during the crisis ðBeen and Glashausser 2009Þ, evictions in Mil
waukee actually declined ðDesmond 2012bÞ. These opposing trends may somewhat cance
out one another.
This content downloaded from 128.103.149.52 on Tue, 19 May 2015 08:31:52 AMAll use subject to JSTOR Terms and Conditions
-
l

are readily available, but there are fewer data on many other cities such
Forced Relocation and Residential Instability | 235
as Milwaukee, Cincinnati, and Buffalo ðSmall 2007Þ. Studying Milwaukeenot only expands data on and knowledge of different urban environ-ments; it also may produce findings that are more applicable to cities dis-tinct from America’s important yet exceptional global hubs.
Households were selected through multistage stratified probability sam-pling. Drawing on census data, all Milwaukee block groups were sorted intothree strata based on racial composition. No block groups were excludedfrom the sampling frame. Block groups were placed in white, black, orHispanic strata depending on the race of the largest proportion of residents.5
Then, each of these strata was subdivided into high- and low-povertyneighborhoods based on the overall income distribution of each racial orethnic group in the city.6 Blocks from within each of these six strata ðwhichwere based on block group boundaries, the smallest geographic unit forwhich income data were availableÞ were randomly selected.When a blockwas selected into the sample, interviewers visited every household in theselected block, saturating the targeted areas.This sampling strategy resultedin renting households from across the city being included in the study,including those in low-poverty and racially integrated blocks. The MARSstudy drew from 168 of 591 unique block groups, representing 28 percent ofMilwaukee neighborhoods. After data collection, the full sample wasweighted to facilitate estimates generalizable to Milwaukee’s rental popu-lation.We use these custom weights in our descriptive statistics.
According to the American Association for Public Opinion ResearchðAAPORÞ, the most conservative calculation of a response rate ðAAPORresponse rate 1Þ places in the numerator only fully completed interviewsand in the denominator refusals and all cases of unknown eligibility. Accord-ing to this metric, MARS has a response rate of 83.4 percent.
MARS collected a complete 2-year retrospective residential history foreach respondent. To prime memory, respondents were shown a 2-year cal-endar and asked to provide their birthday and to name “two or three
5. Some block groups did not have a clear racial majority, but as in many other American
cities, the racial composition of Milwaukee neighborhoods follows a U-shaped distribution
with most residents living in highly segregated neighborhoods.
6. Block groups were classified as high-poverty neighborhoods if their poverty rate ex-
ceeded 47 percent for predominantly Hispanic neighborhoods, 54 percent for predominantly
African American neighborhoods, and 19 percent for predominantly white neighborhoods.
This content downloaded from 128.103.149.52 on Tue, 19 May 2015 08:31:52 AMAll use subject to JSTOR Terms and Conditions

things that have happened in the past two years that really stand out.” Then,
236 | Social Service Review
going back 2 years, interviewers asked respondents to list “all the places½they had� lived or stayed for at least a month.” Respondents were askedseveral questions about each residence, including why theymoved from oneplace to another. Retrospective data are most reliable if they have to do withsalient life events, are limited to a recent recall period, and are collectedwith the aid of a memory prop ðBeckett et al. 2001; Sayles, Belli, and Ser-rano 2010Þ. This study’s retrospective data meet all three criteria: they fo-cus on the memorable event of moving, are restricted to a 2-year recallperiod, and were collected with a recent history calendar designed to primememory.
Surveys that simply ask respondents if they have been evicted during acertain time period, such as the American Housing Survey, likely result insizable underestimates of the frequency of forced mobility among low-income families. As one of the authors learned during fieldwork, becausetenants often have strict understandings of what constitutes eviction, manywho experienced involuntary removal would not report as much if asked ina straightforwardway.This is why studies based on court records ðDesmond2012bÞ produce much larger estimates of the frequency of eviction thanthose based on self-reports. Informed by ethnographic work among urbanrenters, the MARS survey implemented new techniques designed to collectreliable data about renters’motivations for moving. Interviewers asked eachrespondent a series of ordered yes/no questions, beginning with forcedremovals and ending with unforced moves.
1. An eviction is when your landlord forces you to move when you don’twant to.Were you, or a person you were staying with, evicted?
2. Did you, or a person you were staying with, ½leave after receiving� aneviction notice?
3. Did youmove away from this place because your landlord told you, ora person you were staying with, to leave?
4. Did youmove away from this place because you, or a person youwerestaying with, missed a rent payment and thought that if you didn’tmove you would be evicted?
5. Did you move away from this place because the city condemned theproperty and forced you to leave?
6. Did youmove away from this place because ðaÞ the landlord raised therent; ðbÞ the neighborhood was dangerous; ðcÞ the landlord wouldn’tfix anything and your place was getting run down; ðdÞ the landlordwent into foreclosure?
This content downloaded from 128.103.149.52 on Tue, 19 May 2015 08:31:52 AMAll use subject to JSTOR Terms and Conditions

Respondents who answered no to question 1 were asked question 2, and
Forced Relocation and Residential Instability | 237
so on. If a respondent answered no to all of these questions, she or he finallywas asked, “I see that none of these reasons fit your case.Why did you moveaway from this place?” This approach minimized recall bias about themotivations for moves. It also allowed us to capture a wide variety of forcedmobility. To our knowledge, the MARS database offers the most compre-hensive data to date on forced displacement in a representative sample ofurban renters.
We recorded all residential moves renters undertook 2 years prior tobeing surveyed. A move is considered to be forced if it was initiated bylandlords or city officials ðe.g., code inspectorsÞ and involved situations inwhich tenants had no choice other than to relocate ðor thought as muchÞ.Forced moves include formal evictions ðwhich are processed through thecourtÞ, informal evictions ðwhich are notÞ, landlord foreclosures, and hous-ing being condemned. All other moves we consider unforced.These includepurely voluntary moves often carried out to gain residential advantage, aswell as moves responding to deteriorating housing or neighborhood condi-tions ðe.g., rent hikes, escalating violenceÞ.
method
modeling the number of movesWe use one set of models to address hypotheses 1 and 2. To explain thenumber of moves renters undertook in the 2 years prior to being surveyed,we fit a negative binomial regression model. This model is appropriate forcount data and allows for overdispersion.7 In the full model, the predictedoutcome for respondent i, Movesi, is related to the independent variablesthrough the log-link function:
logðmovesiÞ5 B0 1 B1forced movei 1 B2incomei 1 B3income2i1 B4black renteri 1 B5Hispanic renteri1 B6other race renteri 1 B7less than HS degreei1 B8some collegei 1 B9bachelor’s degree or morei
1 B10female renteri 1 B11marriedi
1 B12children in householdi 1 B13agei1 B14criminal recordi 1 B15past job lossi1 B16past breakupi:
7. Using Poisson or zero-inflated models did not substantively alter our findings.
This content downloaded from 128.103.149.52 on Tue, 19 May 2015 08:31:52 AMAll use subject to JSTOR Terms and Conditions

To test our first hypothesis ðthat financially insecure and secure renters
238 | Social Service Review
will have higher rates of residential mobilityÞ, we examine the associationbetween household income and its quadratic term and the number ofmovesthat renters experienced in the previous 2 years. Household income wasmeasured at the time of the interview. Owing to validity limitations, retro-spective income data were not collected. This is limiting insofar as incomemay fluctuate over the study period. Our models do account for more stablemarkers of socioeconomic status, such as renters’ highest levels of educa-tion, as well as for two time-varying life events related to household incomeand residential mobility: job loss and the end of a self-defined seriousrelationship. We created dummy variables that indicate whether or not arespondent had experienced these shocks 13–24 months prior to beinginterviewed.
Our models also control for a number of other relevant factors. Becauseracial dynamics often influence mobility decisions ðSouth and Crowder1997Þ, we control for renters’ race and ethnicity, defined as white, black,Hispanic, or other ethnicity. Because residential mobility tends to decreaseover the life course, we control for age. We also observe renters’ gender,marital status, and if they have children under age 18 in the household, asthese factors have been linked to residential mobility and particularly toforced mobility ðDesmond et al. 2013Þ. Individuals with criminal recordsmay exhibit higher rates of residential instability, either because they rely onothers for housing or because they are on the run ðWestern 2006; Goffman2009Þ. Accordingly, we create a dummy variable that indicates whether arenter has a criminal record.
To assess our second hypothesis ðthat income will not be statisticallyassociated with residential mobility after controlling for forced relocationsÞ,we investigate if accounting for forced mobility weakens the statistical as-sociation between income and residential instability in the regressionmodel.Specifically, we observe if renters experienced a forced move 13–24 monthsprior to being interviewed. Focusing only on forced moves that occurred inyear 1 of the 2-year retrospective calendar allows for enough time to pass toobserveanassociation, shouldoneexist, between forcedmobilityand the like-lihood that a renterwill move again. Inmodels that control for forcedmoves,we do not count the first forced move ðduring the 13–24 months prior tobeing interviewedÞ in the outcome variable ðtotal movesÞ. This adjustmentensures that in these models the first forced move is represented only onthe right-hand side of the equation and so is not simply explaining itself.
This content downloaded from 128.103.149.52 on Tue, 19 May 2015 08:31:52 AMAll use subject to JSTOR Terms and Conditions
modeling housing quality and subsequent mobility
Forced Relocation and Residential Instability | 239
To assess hypothesis 3, that urban renters whose most recent move wasforced will live in lower-quality housing than renters whose last move wasnot forced,we estimate the effects of forced mobility on housing quality. Inthese analyses, our outcome is a variable indicating whether renters expe-rienced any of the following problems in the year prior to being interviewed:ðaÞ a broken stove or other appliance, ðbÞ a broken window, ðcÞ a broken ex-terior door or lock, ðdÞmice, rats, or other pests, ðeÞ exposed wires or otherelectrical problems for at least three days, ð f Þ no heat, ðgÞ no running water,or ðhÞ stopped-upplumbing for at least 24hours.We also constructed a countvariable measuring how many of these housing problems were experi-enced.
To estimate the effect of a forcedmove on housing quality,we use doublyrobust logistic regressionmodels. In these models, the predicted probabilityof an event for respondent i, pi, is related to the independent variablesthrough the link function:
log½ðpiÞ=ð12 piÞ�5 B0 1 B1forced movei 1 B2incomei 1 B3income2i1 B4black renteri 1 B5Hispanic renteri
1 B6other race renteri 1 B7less than HS degreei1 B8some collegei 1 B9bachelor’s degree or morei1 B10female renteri 1 B11marriedi
1 B12children in householdi 1 B13agei1 B14criminal recordi 1 B15rental assistancei
1 B16past job lossi 1 B17past breakupi
1 B18residential tenure before movei1 B19months in current homei:
Estimates of the effect of a forced move may be biased if those who aremost likely to experience such a move ðbecause they lack the material orsocial resources to avoid oneÞ also suffer disproportionately large effectsfrom forced moves. Matching methods allow us to reduce estimation biasdue to effect hetereogeneity by creating data sets that have similar multi-variate distributions of covariates ðbalanceÞ across groups of peoplewho didand did not experience forced mobility. Matching achieves balance throughpruning observations for which there are no good comparisons and weight-ing those that remain, resulting in the weighted distribution of covariates
This content downloaded from 128.103.149.52 on Tue, 19 May 2015 08:31:52 AMAll use subject to JSTOR Terms and Conditions

being similar in both groups of individuals ðMorgan andWinship 2007Þ.The240 | Social Service Review
doubly robust regression uses weights produced by the matching programto adjust for imperfect covariate balance and, in this case, will provide anunbiased estimator as long as either the matching model or the regressionmodel is correctly specified ðStuart 2010; Iacus, King, and Porro 2012Þ.
To implement the doubly robust regression, we use coarsened exactmatching. In the logic of matching, every renter who experienced a forcedmove ideally would be matched with a renter with identical covariates whodid not experience a forced move; however, exact matching is virtuallyimpossible when matching on multiple variables or continuous covariates.Coarsened exact matching compromises by treating continuous variables ascategorical variables ðe.g., a continuous measure of age is transformed into10-year intervalsÞ and then assigns observations to strata wherein every ob-servation is an exact match on the full set of coarsened covariates. Coars-ened exact matching then produces weights so that the sample is perfectlybalanced in terms of these coarsened variables ðBlackwell et al. 2009; Iacuset al. 2012Þ.
We rely on previous research to select variables across which to improvebalance. Because family structure and point in the lifecycle are associatedwith likelihood of eviction,wematch on respondent’s gender, marital status,age, and the presence of children in the household. We also match on re-spondent’s race and ethnicity and on a variable indicating a criminal record,which can hamper one’s housing prospects. To account for socioeconomicstatus, we match on income and variables indicating whether the respon-dent has no degree, a high school degree, or some college education.We alsoconsider an integer variable measuring the number of months respondentslived in the residences from which they were involuntarily removed. Ifrespondents did not experience a forced move, this variable measures howlong they have lived in their current residence. An uninterrupted housingspell is an indication that the respondent has a low latent propensity forforced moves. And because we focus on housing problems that rentersexperienced in the previous year in their current residence, we add avariable to the doubly robust regression that measures how many monthsthe respondent was living in the current residence out of the previous12 months.8
8. Roughly 6 percent of households in Milwaukee’s private rental market ðand in the
weighted MARS sampleÞ receive housing assistance ðPabst 2013Þ. Controlling for housing
assistance had no effect on our main findings.
This content downloaded from 128.103.149.52 on Tue, 19 May 2015 08:31:52 AMAll use subject to JSTOR Terms and Conditions

We were able to perform exact matches on gender, marital status, the
Forced Relocation and Residential Instability | 241
presence of children under 18 years of age in the household, race/ethnicityðblack and HispanicÞ, criminal record, and education. We coarsened age,income, and residential tenure before matching, choosing sample quartilesas cut-points.We refined our matching specification with the goal of im-proving either sample size or multivariate balance across the entire set ofvariables discussed above. Multivariate balance is measured by the L1statistic ðusing the Scott method for breaksÞ with lower values represent-ing more balance ðBlackwell et al. 2009Þ. Because achieving the bestmultivariate balance often required sacrificing sample size, we fit each ofour models on two matched samples: one with a moderate sample size buta moderate L1 and another with a small sample size but a lower L1.
To estimate the average effect of a forced move through doubly robustregression, we regress unforced moves on our set of matched variables inaddition to other variables related to housing quality. As in our negativebinomial models,we control for job loss and the end of a serious relationship13–24 months prior to being interviewed and prior to the first forced moveðif anyÞ. Finally, we control for household income squared, receipt of rentalassistance, and “other” ethnicity because respondents were not matched onthese covariates. In the appendix, we display summary statistics of our keyvariables ðtable A1Þ.9
Last, to address hypothesis 4, that urban renters who experienced aforced move will be more likely to undertake an unforced move soon after,we estimate the effect of having experienced a forced move on the likeli-hood of undertaking a subsequent unforced move.10 Analyses estimating theeffect of forced mobility on subsequent unforced mobility are similar tothose estimating its effects on housing quality; we use matching to improvebalance across the same variables considered in the models estimatinghousing quality.11
9. Owing to space constraints, and because the LI statistic is the best indicator of multivariate
balance across groups of renters who do and do not experience a forced move, we have
excluded summary statistics for our matched data, but they are available upon request.
10. As expected, the association of a forced move with making any kind of subsequent
move ðforced or notÞ is statistically significant and noticeably larger than the estimated
association of a forced move with making a subsequent unforced move, as in the displayed
models.
11. The variable “tenure before move” covers a different set of residences in the housing
quality models than in the moving models. Accordingly, the optimal matching specification
differs between these models.
This content downloaded from 128.103.149.52 on Tue, 19 May 2015 08:31:52 AMAll use subject to JSTOR Terms and Conditions

Because we wish to determine if having experienced forced removal
242 | Social Service Review
increases the chances of future unforcedmobility, we first observedwhetherrespondents experienced a forced move during the first year of our retro-spective calendar ði.e., 13–24 months prior to being interviewedÞ. Respon-dents who did were placed in the forced-move group. We next observedwhether respondents voluntarily moved in the second year of the retro-spective calendar. We assigned those respondents who moved a 1 on theunforced moves variable. This approach guarantees at least 1 full year ofobservation after the forced move.12
results
the frequency and motivation of movesamong milwaukee rentersWe display in table 1 the number of recent moves undertaken by renters byincome quartile. In the MARS sample, households with incomes less than$12,204 belong to our first quartile, and those with incomes above $32,400fall into the fourth. Because mobility patterns of the renters in the secondquartile closely resembled those in the third, resembling natural breaks inthe data, and because our theoretical model postulates three mobility pro-cesses corresponding to one’s income with more renters belonging to themiddle of the distribution than the tails, we combine the second and thirdincome quartiles into a single category. These renters live in householdswith incomes between $12,205 and $32,400.
Table 1 shows that roughly half of Milwaukee’s renters relocated at leastonce in the 2 years prior to being interviewed. Nearly 34 percent movedonce, and nearly 16 percent moved more than once. Roughly 42 percentof the poorest renters in Milwaukee moved in the 2 years prior to beinginterviewed, compared to 56 percent of the city’s most financially secure
12. It has the added benefit of conservatively biasing our estimates of the effect of a
forced removal toward zero by misclassifying as “forced move without subsequent move”
ðsubsequent unforced move5 0Þ instances in which ðaÞ the forced and subsequent unforced
move both occur in the first year; or ðbÞ a forced move occurs in the first year but the
unforced move occurs after the interview. Similarly, we conservatively misclassify cases in
which the forced move occurs before the start of the retrospective calendar ðbut the sub-
sequent unforced move is observedÞ as “subsequent move without forced move” ðsubse-quent voluntary move 5 1Þ.
This content downloaded from 128.103.149.52 on Tue, 19 May 2015 08:31:52 AMAll use subject to JSTOR Terms and Conditions

renters and 49 percent of renters in the middle group. At first glance,
table 1. Residential Relocations by Income Quartile
Moves in Previous 2 Years
0 1 21
1st quartile 58.38 25.08 16.542nd and 3rd quartiles 51.26 40.86 7.884th quartile 44.24 29.46 26.30Total 50.33 33.82 15.85
Note.—Weighted percentages displayed. Renters in the 1st quar-
tiles live in households with annual incomes less than $12,204. Thosein the 2nd and 3rd quartiles live in households with annual incomes
between $12,205 and $32,400. Those in the 4th quartile live in house-holds with incomes above $32,400. N 5 989 renters.
Forced Relocation and Residential Instability | 243
residential instability among urban renters does not appear to rise thefurther one falls down the economic ladder. That one in six renters movedtwo or more times within a 24-month period implies that a nontrivialpercentage experience relatively high levels of residential mobility. AmongMilwaukee renters, those on each tail of the income distribution are morelikely to have undertaken multiple moves. While less than 8 percent ofrenters in our second and third quartile reported having moved two ormore times recently, 16.5 percent of renters in the first quartile and 26.3 per-cent of renters in the fourth quartile did.13
Table 2 displays the percent of forced and unforced moves by incomequartile. Roughly 17 percent of the moves Milwaukee renters undertook inthe 2 years prior to being surveyed were forced. The city’s poorest renterswere more likely to have experienced forced mobility, with almost one infour recent moves undertaken by those in the lowest income quartile be-ing forced. By comparison, a little over 1 in 7 of the recent moves under-taken by renters in the highest income quartile were forced. This differ-ence, involving the frequency of forced mobility among renters in the firstand fourth income quartiles, is statistically significant ð p < .05Þ. The fre-quency of forced mobility among renters, even the most financially stable
13. Comparisons between renters who had not recently moved and those who did revealed
a statistically significant difference only between the first and fourth income quartiles ðp <
.01Þ. Comparisons between renters who had experienced two or more recent moves and those
who had not ðstayers and one-time moversÞ revealed statistically significant differences
between all three groups, with the biggest differences generated when the second and third
quartile group was involved in the comparison ðp < .001Þ.
This content downloaded from 128.103.149.52 on Tue, 19 May 2015 08:31:52 AMAll use subject to JSTOR Terms and Conditions
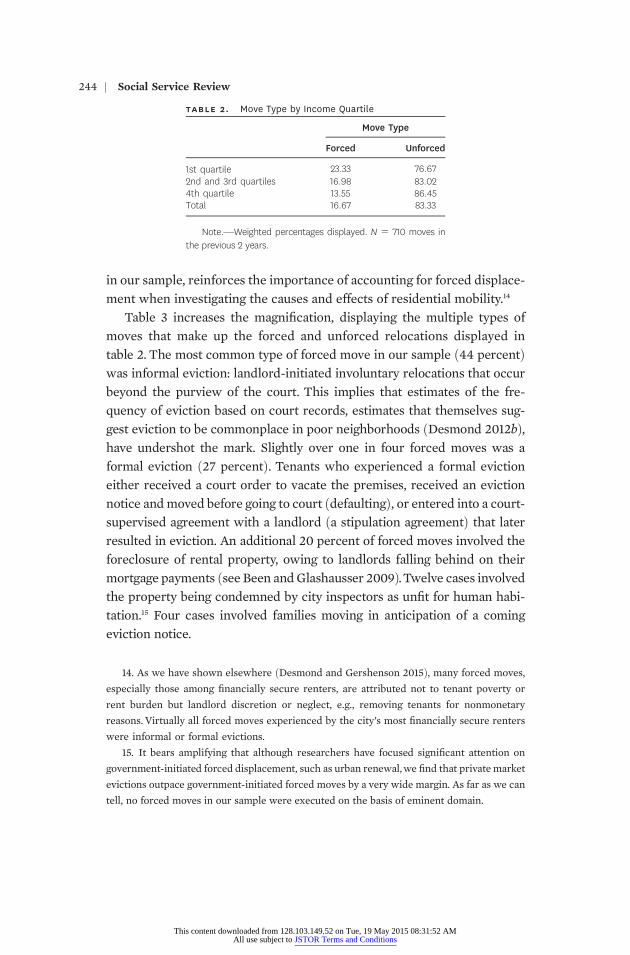
in our sample, reinforces the importance of accounting for forced displace-14
table 2. Move Type by Income Quartile
Move Type
Forced Unforced
1st quartile 23.33 76.672nd and 3rd quartiles 16.98 83.024th quartile 13.55 86.45Total 16.67 83.33
Note.—Weighted percentages displayed. N 5 710 moves in
the previous 2 years.
244 | Social Service Review
ment when investigating the causes and effects of residential mobility.Table 3 increases the magnification, displaying the multiple types of
moves that make up the forced and unforced relocations displayed intable 2. The most common type of forced move in our sample ð44 percentÞwas informal eviction: landlord-initiated involuntary relocations that occurbeyond the purview of the court. This implies that estimates of the fre-quency of eviction based on court records, estimates that themselves sug-gest eviction to be commonplace in poor neighborhoods ðDesmond 2012bÞ,have undershot the mark. Slightly over one in four forced moves was aformal eviction ð27 percentÞ. Tenants who experienced a formal evictioneither received a court order to vacate the premises, received an evictionnotice andmoved before going to court ðdefaultingÞ, or entered into a court-supervised agreement with a landlord ða stipulation agreementÞ that laterresulted in eviction. An additional 20 percent of forced moves involved theforeclosure of rental property, owing to landlords falling behind on theirmortgage payments ðsee Been andGlashausser 2009Þ.Twelve cases involvedthe property being condemned by city inspectors as unfit for human habi-tation.15 Four cases involved families moving in anticipation of a comingeviction notice.
14. As we have shown elsewhere ðDesmond and Gershenson 2015Þ, many forced moves,
especially those among financially secure renters, are attributed not to tenant poverty or
rent burden but landlord discretion or neglect, e.g., removing tenants for nonmonetary
reasons. Virtually all forced moves experienced by the city’s most financially secure renters
were informal or formal evictions.
15. It bears amplifying that although researchers have focused significant attention on
government-initiated forced displacement, such as urban renewal,we find that private market
evictions outpace government-initiated forced moves by a very wide margin. As far as we can
tell, no forced moves in our sample were executed on the basis of eminent domain.
This content downloaded from 128.103.149.52 on Tue, 19 May 2015 08:31:52 AMAll use subject to JSTOR Terms and Conditions
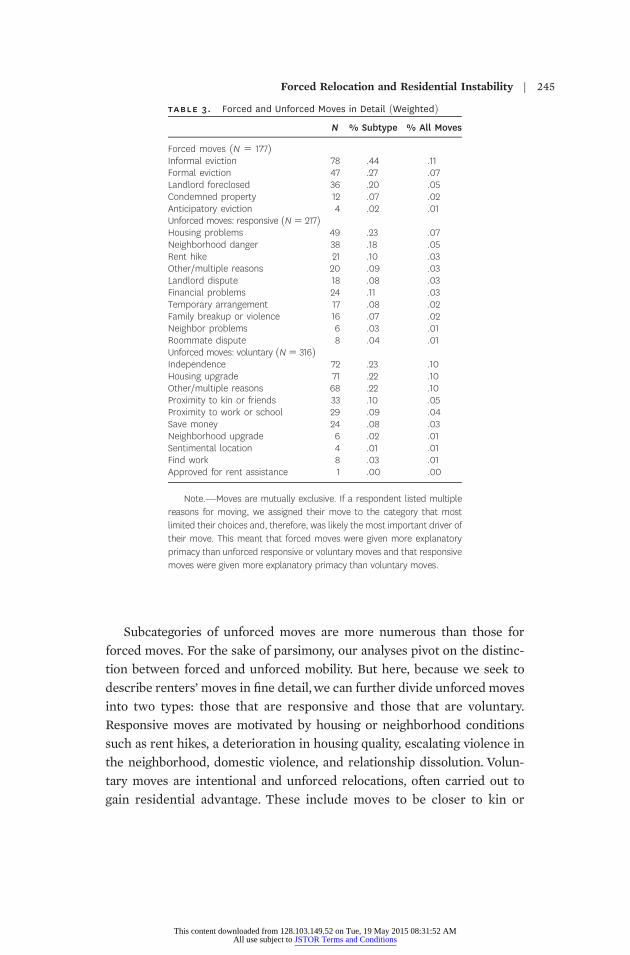
Subcategories of unforced moves are more numerous than those for
table 3. Forced and Unforced Moves in Detail ðWeightedÞN % Subtype % All Moves
Forced moves ðN 5 177ÞInformal eviction 78 .44 .11Formal eviction 47 .27 .07Landlord foreclosed 36 .20 .05Condemned property 12 .07 .02Anticipatory eviction 4 .02 .01Unforced moves: responsive ðN5 217ÞHousing problems 49 .23 .07Neighborhood danger 38 .18 .05Rent hike 21 .10 .03Other/multiple reasons 20 .09 .03Landlord dispute 18 .08 .03Financial problems 24 .11 .03Temporary arrangement 17 .08 .02Family breakup or violence 16 .07 .02Neighbor problems 6 .03 .01Roommate dispute 8 .04 .01Unforced moves: voluntary ðN5 316ÞIndependence 72 .23 .10Housing upgrade 71 .22 .10Other/multiple reasons 68 .22 .10Proximity to kin or friends 33 .10 .05Proximity to work or school 29 .09 .04Save money 24 .08 .03Neighborhood upgrade 6 .02 .01Sentimental location 4 .01 .01Find work 8 .03 .01Approved for rent assistance 1 .00 .00
Note.—Moves are mutually exclusive. If a respondent listed multiplereasons for moving, we assigned their move to the category that most
limited their choices and, therefore, was likely the most important driver oftheir move. This meant that forced moves were given more explanatory
primacy than unforced responsive or voluntary moves and that responsivemoves were given more explanatory primacy than voluntary moves.
Forced Relocation and Residential Instability | 245
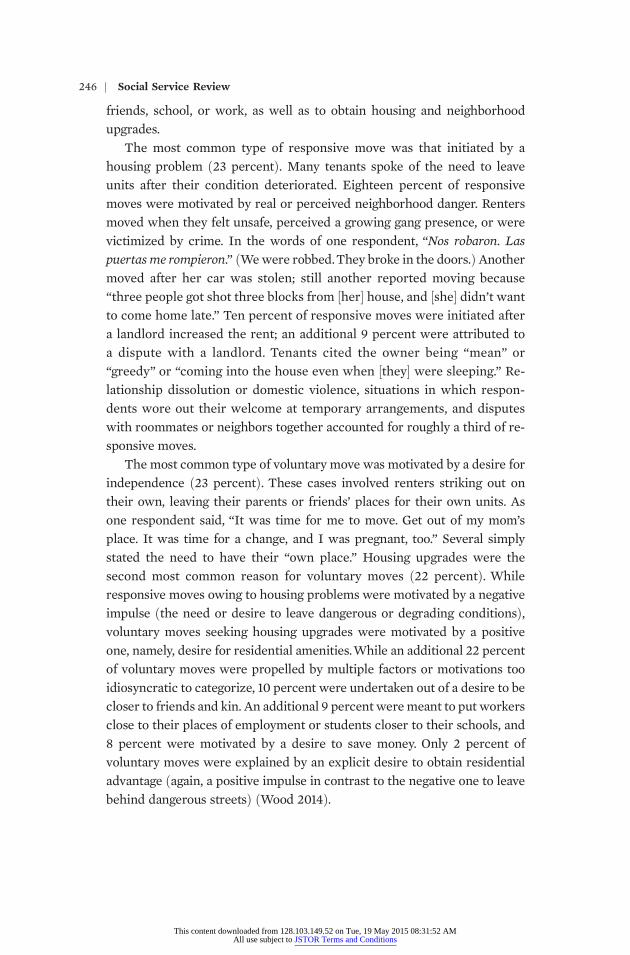
forced moves. For the sake of parsimony, our analyses pivot on the distinc-tion between forced and unforced mobility. But here, because we seek todescribe renters’moves in fine detail,we can further divide unforced movesinto two types: those that are responsive and those that are voluntary.Responsive moves are motivated by housing or neighborhood conditionssuch as rent hikes, a deterioration in housing quality, escalating violence inthe neighborhood, domestic violence, and relationship dissolution. Volun-tary moves are intentional and unforced relocations, often carried out togain residential advantage. These include moves to be closer to kin or
This content downloaded from 128.103.149.52 on Tue, 19 May 2015 08:31:52 AMAll use subject to JSTOR Terms and Conditions
friends, school, or work, as well as to obtain housing and neighborhood
246 | Social Service Review
upgrades.The most common type of responsive move was that initiated by a
housing problem ð23 percentÞ. Many tenants spoke of the need to leaveunits after their condition deteriorated. Eighteen percent of responsivemoves were motivated by real or perceived neighborhood danger. Rentersmoved when they felt unsafe, perceived a growing gang presence, or werevictimized by crime. In the words of one respondent, “Nos robaron. Laspuertas me rompieron.” ðWewere robbed.They broke in the doors.Þ Anothermoved after her car was stolen; still another reported moving because“three people got shot three blocks from ½her� house, and ½she� didn’t wantto come home late.” Ten percent of responsive moves were initiated aftera landlord increased the rent; an additional 9 percent were attributed toa dispute with a landlord. Tenants cited the owner being “mean” or“greedy” or “coming into the house even when ½they� were sleeping.” Re-lationship dissolution or domestic violence, situations in which respon-dents wore out their welcome at temporary arrangements, and disputeswith roommates or neighbors together accounted for roughly a third of re-sponsive moves.
The most common type of voluntary move was motivated by a desire forindependence ð23 percentÞ. These cases involved renters striking out ontheir own, leaving their parents or friends’ places for their own units. Asone respondent said, “It was time for me to move. Get out of my mom’splace. It was time for a change, and I was pregnant, too.” Several simplystated the need to have their “own place.” Housing upgrades were thesecond most common reason for voluntary moves ð22 percentÞ. Whileresponsive moves owing to housing problems were motivated by a negativeimpulse ðthe need or desire to leave dangerous or degrading conditionsÞ,voluntary moves seeking housing upgrades were motivated by a positiveone, namely, desire for residential amenities.While an additional 22 percentof voluntary moves were propelled by multiple factors or motivations tooidiosyncratic to categorize, 10 percent were undertaken out of a desire to becloser to friends and kin. An additional 9 percent weremeant to put workersclose to their places of employment or students closer to their schools, and8 percent were motivated by a desire to save money. Only 2 percent ofvoluntary moves were explained by an explicit desire to obtain residentialadvantage ðagain, a positive impulse in contrast to the negative one to leavebehind dangerous streetsÞ ðWood 2014Þ.
This content downloaded from 128.103.149.52 on Tue, 19 May 2015 08:31:52 AMAll use subject to JSTOR Terms and Conditions
residential mobility and economic status
Forced Relocation and Residential Instability | 247
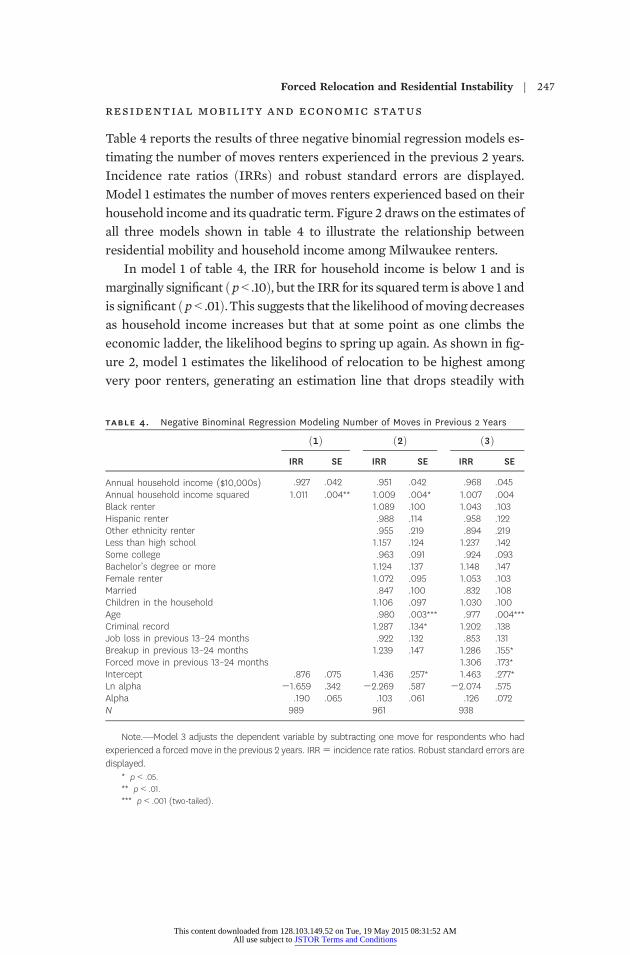
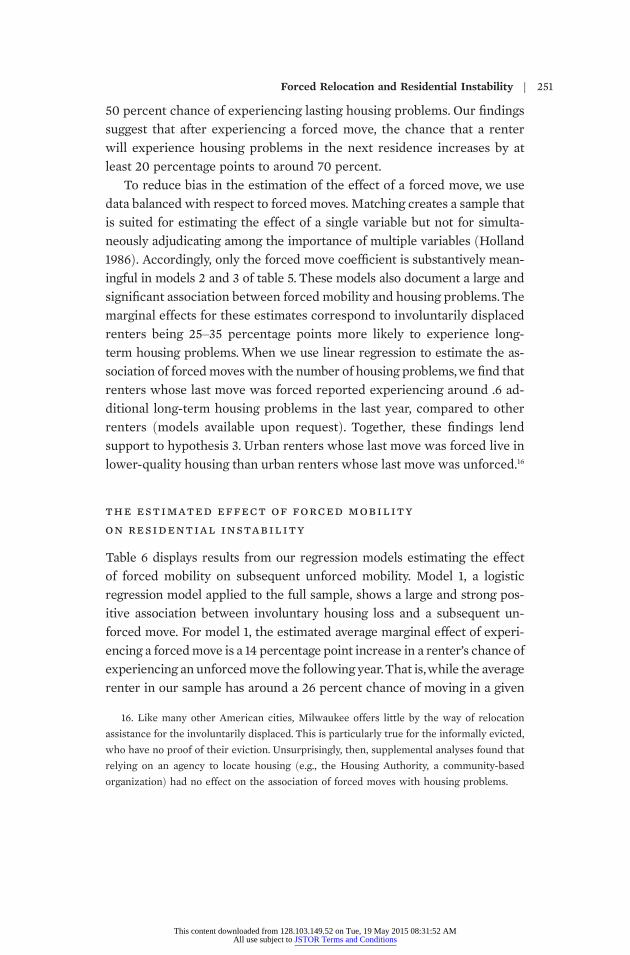
Table 4 reports the results of three negative binomial regression models es-timating the number of moves renters experienced in the previous 2 years.Incidence rate ratios ðIRRsÞ and robust standard errors are displayed.Model 1 estimates the number of moves renters experienced based on theirhousehold income and its quadratic term. Figure 2 draws on the estimates ofall three models shown in table 4 to illustrate the relationship betweenresidential mobility and household income among Milwaukee renters.
In model 1 of table 4, the IRR for household income is below 1 and ismarginally significant ð p < .10Þ, but the IRR for its squared term is above 1 andis significant ðp < .01Þ.This suggests that the likelihood of moving decreasesas household income increases but that at some point as one climbs theeconomic ladder, the likelihood begins to spring up again. As shown in fig-ure 2, model 1 estimates the likelihood of relocation to be highest amongvery poor renters, generating an estimation line that drops steadily with
table 4. Negative Binominal Regression Modeling Number of Moves in Previous 2 Years
ð1Þ ð2Þ ð3ÞIRR SE IRR SE IRR SE
Annual household income ð$10,000sÞ .927 .042 .951 .042 .968 .045Annual household income squared 1.011 .004** 1.009 .004* 1.007 .004Black renter 1.089 .100 1.043 .103Hispanic renter .988 .114 .958 .122Other ethnicity renter .955 .219 .894 .219Less than high school 1.157 .124 1.237 .142Some college .963 .091 .924 .093Bachelor’s degree or more 1.124 .137 1.148 .147Female renter 1.072 .095 1.053 .103Married .847 .100 .832 .108Children in the household 1.106 .097 1.030 .100Age .980 .003*** .977 .004***Criminal record 1.287 .134* 1.202 .138Job loss in previous 13–24 months .922 .132 .853 .131Breakup in previous 13–24 months 1.239 .147 1.286 .155*Forced move in previous 13–24 months 1.306 .173*Intercept .876 .075 1.436 .257* 1.463 .277*Ln alpha 21.659 .342 22.269 .587 22.074 .575Alpha .190 .065 .103 .061 .126 .072N 989 961 938
Note.—Model 3 adjusts the dependent variable by subtracting one move for respondents who hadexperienced a forced move in the previous 2 years. IRR5 incidence rate ratios. Robust standard errors are
displayed.* p < .05.
** p < .01.
*** p < .001 ðtwo-tailedÞ.
This content downloaded from 128.103.149.52 on Tue, 19 May 2015 08:31:52 AMAll use subject to JSTOR Terms and Conditions

income gains, bottoms out for households making between $30,000 and
F IGURE 2 . Incidence rate ratios estimating the number of moves renters experienced in theprevious 2 years, drawn from table 4 models 1, 2, and 3.
248 | Social Service Review
$35,000, and increases at a shallow pitch for households making more.In model l, the relationship between residential mobility and economic
status is visualized as a downward slope with a slight uptick at the tail.Including our control variables in model 2 has the effect of reshaping thisdownward slope into a shallow bowl. The squared term for householdincome remains significant in this model, but levels of residential mobilityno longer appear as heightened among very poor renters. In model 2, movecounts fall until household income reaches $25,000. The line then flattensbut begins to rise again for renters in households making more than$32,000. Model 2 supports our theoretical model postulating the relation-ship between economic status and residential mobility to be curvilinear.After controlling for race and ethnicity, education, family structure, criminalrecord, and recent shocks ðjob loss and relationship dissolutionÞ, we findsupport for hypothesis 1: residential mobility is highest among the mostfinancially insecure and secure renters in our sample.
We also hypothesize that, among urban renters, the curvilinear relation-ship between economic status and residential mobility is driven by in-creased forced mobility on the lower end of the income distribution andincreased unforced mobility on the higher end. If this is true, then low
This content downloaded from 128.103.149.52 on Tue, 19 May 2015 08:31:52 AMAll use subject to JSTOR Terms and Conditions

income should not be associated with higher levels of residential mobility
Forced Relocation and Residential Instability | 249
once we control for forced moves ðhypothesis 2Þ. This is precisely whatwe find. In model 3, which observes if renters experienced a forced move13–24 months prior to being interviewed, the squared term for householdincome is reduced to marginal significance ðp < .10Þ, but the coefficient forforced moves is statistically significant and substantively large. All elseequal, renters who experienced a forced move are expected to have amoving rate 1.3 times greater than those who avoided involuntary dis-placement. The picture that emerges from model 3 is almost a mirrorimage of the picture presented in model 1. Our full model implies thatinvoluntary displacement helps to explain why the poorest renters in oursample move more than their better-off counterparts.
We also find that older renters experienced less residential mobility.Renters with a criminal record experienced more residential mobility, butthis association becomes insignificant once we control for involuntary dis-placement. And model 3 finds that renters who experienced relationshiptermination 13–24 months prior to being interviewed had a higher movingrate, net of other factors.
In figure 2, the lifting of the estimation line for each subsequent modelrepresents the estimated effect of income on residential mobility becomingless acute as more controls are introduced. Note that only in model 3 do wesee an incidence rate ratio above 1.This suggests that if it were not for forcedmoves, financially secure renters would move more often than financiallyinsecure renters.
If experiencing a forced move is associated with increased levels ofresidential mobility, there are two ways of interpreting this finding. Thispattern could reflect the fact that many moves among low-income rentersare forced and/or that forced mobility itself increases subsequent mobility.Our findings up to this point support the former interpretation that manymoves among low-income households are forced.We now turn to matchingmodels to test the latter interpretation: that forced moves increase subse-quent mobility.
the estimated effect of forced mobility
on housing qualityTable 5 displays the results of two models estimating the effect of forcedmobility on housing quality. A regressionmodel fit on the full sample ðmodel1Þ shows that an involuntary move in year 1 significantly increases the
This content downloaded from 128.103.149.52 on Tue, 19 May 2015 08:31:52 AMAll use subject to JSTOR Terms and Conditions

likelihood that a renter will experience long-term housing problems such
table 5. Logistic Regression Modeling Housing Problems in Unmatched and Matched Samples
ð1Þ ð2Þ ð3ÞCoefficient SE Coefficient SE Coefficient SE
Forced move .902 .404* 3.024 1.139** 2.901 1.028**Annual household income ð$10,000sÞ .048 .101 22.491 2.595 23.861 4.399Annual household income squared 2.002 .010 .606 .389 1.035 .940Black renter .611 .192** 5.483 5.470 22.584 4.552Hispanic renter .284 .243 7.891 6.925 21.676 4.604Other race renter .371 .384Less than high school .653 .214** 22.712 2.445 22.115 2.900Some college .314 .184 2.107 1.153 2.396 2.084Bachelor’s degree or more .054 .258Female renter .410 .170* 2.916 1.333 2.768 1.380Married 2.049 .210 21.544 2.214Children in the household 2.155 .197 21.191 2.166 24.404 2.262Age 2.015 .006* 2.029 .065 2.181 .120Criminal record .221 .209 24.452 1.844* 27.020 1.878***Rental asistance 2.274 .270 21.453 0.931 22.761 1.421Job loss in previous 13–24 months .199 .239 2.789 1.479 5.237 1.241***Breakup in previous 13–24 months 2.171 .214 .796 1.401 2.856 1.158Tenure before move ðmonthsÞ 2.002 .001 .045 .023 .089 .033**Months in current home .032 .014* 2.245 .127 2.457 .143**Constant 2.269 .379 22.026 6.362 14.894 10.663N 796 68 54Pseudo R2 .050 .530 .680Sample L1 .982 .655 .600
Note.—The model 1 sample uses the full sample; models 2 and 3 are fit on matched samples. Some var-
iables were dropped from models 2 and 3 due to multicollinearity. Robust standard errors are displayed.* p < .05.
** p < .01.
*** p < .001 ðtwo-tailedÞ.
250 | Social Service Review
as broken appliances, exposed wires, or no heat. For ease of interpretation,we estimate the average marginal effect of forced removal on unforcedmobility. To estimate an average marginal effect, the probability of experi-encing housing problems is calculated twice for each respondent: oncewhile assuming he or she has experienced a preceding forced move, andagain while assuming he or she has not. The difference between these twoestimates is the individual-level marginal effect of involuntary mobility onhousing problems. The average marginal effect is then calculated by averag-ing the individual-level marginal effect across all respondents ðBartus 2005Þ.The estimated average marginal effect here is roughly 20 percentage points.Marginal effects are additive, so interpretation of their magnitude is inde-pendent of base rates. For example, in our sample the average renter has a
This content downloaded from 128.103.149.52 on Tue, 19 May 2015 08:31:52 AMAll use subject to JSTOR Terms and Conditions
50 percent chance of experiencing lasting housing problems. Our findings
Forced Relocation and Residential Instability | 251
suggest that after experiencing a forced move, the chance that a renterwill experience housing problems in the next residence increases by atleast 20 percentage points to around 70 percent.
To reduce bias in the estimation of the effect of a forced move, we usedata balanced with respect to forced moves. Matching creates a sample thatis suited for estimating the effect of a single variable but not for simulta-neously adjudicating among the importance of multiple variables ðHolland1986Þ. Accordingly, only the forced move coefficient is substantively mean-ingful in models 2 and 3 of table 5. These models also document a large andsignificant association between forced mobility and housing problems.Themarginal effects for these estimates correspond to involuntarily displacedrenters being 25–35 percentage points more likely to experience long-term housing problems.When we use linear regression to estimate the as-sociation of forcedmoves with the number of housing problems,we find thatrenters whose last move was forced reported experiencing around .6 ad-ditional long-term housing problems in the last year, compared to otherrenters ðmodels available upon requestÞ. Together, these findings lendsupport to hypothesis 3. Urban renters whose last move was forced live inlower-quality housing than urban renters whose last move was unforced.16
the estimated effect of forced mobility
on residential instabilityTable 6 displays results from our regression models estimating the effectof forced mobility on subsequent unforced mobility. Model 1, a logisticregression model applied to the full sample, shows a large and strong pos-itive association between involuntary housing loss and a subsequent un-forced move. For model 1, the estimated average marginal effect of experi-encing a forcedmove is a 14 percentage point increase in a renter’s chance ofexperiencing an unforcedmove the following year.That is,while the averagerenter in our sample has around a 26 percent chance of moving in a given
16. Like many other American cities, Milwaukee offers little by the way of relocation
assistance for the involuntarily displaced. This is particularly true for the informally evicted,
who have no proof of their eviction. Unsurprisingly, then, supplemental analyses found that
relying on an agency to locate housing ðe.g., the Housing Authority, a community-based
organizationÞ had no effect on the association of forced moves with housing problems.
This content downloaded from 128.103.149.52 on Tue, 19 May 2015 08:31:52 AMAll use subject to JSTOR Terms and Conditions

year, that chance increases 14 percentage points to around 40 percent after
table 6. Logistic Regression Modeling Unforced Mobility in Unmatched and Matched Samples
ð1Þ ð2Þ ð3ÞCoefficient SE Coefficient SE Coefficient SE
Forced move 1.220 .367** 2.899 1.197* 2.636 1.239*Annual household income ð$10,000sÞ .048 .149 1.978 .876* 1.959 1.438Annual household income squared .010 .013 2.130 .075 2.147 .114Black renter 2.242 .336 4.211 2.664 6.651 7.807Hispanic renter 2.674 .502 11.002 5.271*Other race renter .699 .622Less than high school 1.069 .387** 4.280 2.147*Some college 2.119 .346 2.371 1.656 1.825 3.781Bachelor’s degree or more .177 .420 8.644 4.638Female renter .110 .294 27.789 3.534* 224.739 6.029***Married 2.030 .399 29.734 4.090* 27.912 6.049Children in the household 2.378 .324 2.291 1.842 17.196 2.078***Age 2.028 .015 2.046 .096 .119 .171Criminal record .532 .331 2.028 1.340 215.743 2.229***Rental assistance .225 .483 .823 1.600Job loss in previous 13–24 months 2.825 .497 .258 .857 22.140 2.494Breakup in previous 13–24 months .631 .351 .110 1.267 21.778 1.730Tenure before move ðmonthsÞ 2.029 .009** 2.182 .093* 2.161 .148Constant 2.616 .648 21.953 3.748 27.880 9.113N 679 92 39Pseudo R2 .189 .482 .449Sample L1 .967 .622 .382
Note.—The model 1 sample uses the full sample; models 2 and 3 are fit on matched samples. Some var-iables were dropped from models 2 and 3 due to multicollinearity. Robust standard errors are displayed.
* p < .05.
** p < .01.
*** p < .001 ðtwo-tailedÞ.
252 | Social Service Review
experiencing a forced move.Two doubly robust regressions using data processed and weighted by
coarsened exact matching ðmodels 2 and 3Þ estimate that an involuntarymove in year one increases a renter’s chance of experiencing an unforcedmove in the following year by an average marginal effect of 23–26 percent-age points.17 These estimates are statistically significant and substantivelylarge despite considerable conservative bias built into our estimates and theset of covariates for which we have controlled.
By indicating that renters who experienced a forced move were signif-icantly more likely to undertake an unforced move the following year,
17. The estimated average marginal effect is dependent not just on the size of the
estimated model coefficients but also on the probability that each respondent experience
housing problems. Because each model is fit on a different sample, the probabilities used in
calculating the estimated average marginal effect differ across models.
This content downloaded from 128.103.149.52 on Tue, 19 May 2015 08:31:52 AMAll use subject to JSTOR Terms and Conditions
s
compared to matched renters who avoided involuntary displacement, these
Forced Relocation and Residential Instability | 253
results lend support to hypothesis 4. We hypothesize that one possiblemechanism for this relationship has to dowith housing quality: namely, thatmany renters who experienced an involuntary move relocated to worsehousing units. Our analyses presented above support this hypothesis. Butare those housing problems enough to motivate a subsequent, unforcedmove? To gain some purchase on this question, we examined in detail thereasons renters cited for their moves. We focused on two sorts of renters:those who voluntarily moved and then voluntarily moved again and thosewho involuntarily moved and then later moved by choice. In a weightedsample, we find that 53 percent of renters who experienced a forced movefollowed by an unforced move attributed their latest move to a desire tomove to a better housing unit or neighborhood, while only 34 percent ofrenters with two consecutive unforced moves reported having done so forthese reasons. This difference is statistically significant ðp 5 .04Þ. Unforcedmovers whose previous move was involuntary were far more likely to citehousing or neighborhood problems as the reason for their relocation thanunforced movers whose previous move was also unforced. These descrip-tive findings lend support to our argument that housing problems are amechanism that helps explain the link between involuntary displacementand residential mobility.
Subgroup analyses ðnot shownÞ suggested two important additionalfindings. First, our main results from the logistic regressions appear to bedriven primarily by families with children. This suggests that householdswith children face unique obstacles when attempting to find subsequenthousing after experiencing a forced move—frommaximum occupancy lim-its and family discrimination to pressure to rehouse minors as quickly aspossible—and are particularly compelled to accept substandard conditions.It further suggests that parents or caretakers feel an extra measure of ur-gency to move their children away from degrading and dangerous hous-ing conditions. Second, analyses applied to a subsample of Hispanic rentersfind the estimated effects of involuntary mobility on our two outcomes to besubstantially larger than those reported for the full sample. Perhaps owingto the condition of the housing stock in Milwaukee’s predominantly His-panic Near South Side, Hispanic renters who experience involuntary dis-placement appear to be more likely to relocate to substandard housing andto undertake an unforced move from those conditions soon thereafter,compared to white and black renters.
This content downloaded from 128.103.149.52 on Tue, 19 May 2015 08:31:52 AMAll use subject to JSTOR Terms and Conditions

discussion
254 | Social Service Review
Residential stability begets a kind of psychological stability, which allowspeople to place an emotional investment in their home, social relationships,and community and promotes subjective well-being based on empathy andreciprocity ðEvans 2004; Oishi 2010Þ, begets school stability,which increasesthe chances that children will excel in their studies and graduate ðTempleand Reynolds 1999Þ, and begets community stability, which increases thechances for neighbors to form strong bonds and to invest in their blockðSampson 2012Þ. Residential stability is crucial to the life chances of chil-dren, adults, and communities. Butmany low-income families enjoy little ofit.When it comes to residential instability among poor households, docu-mentation outpaces explanation. High mobility rates among low-incomehouseholds largely have gone unexplained.
This study directly investigates the patterns and mechanisms of residen-tial mobility among urban renters, amongwhom themajority of low-incomecity-dwellers count themselves. It finds, first, that involuntary displacementdrives heightened mobility rates among the most financially insecure rent-ers in Milwaukee. This finding lends support to our conceptual model pos-tulating three archetypes of residential mobility involving the involuntar-ily mobile, financially insecure households who move frequently becausethey are forced to; the purposefully mobile, financially secure householdswho move frequently because they want to; and, in between, the immobile,renters who move infrequently, being neither so destitute as to regularlyexperience eviction nor so financially advantaged as to relocate to a nicerhome or better neighborhood.18 Our emphasis on the immobile recognizesthat residential stability is not universally optimal, especially for familiesresiding in disadvantaged neighborhoods. The lack of affordable housingnot only contributes to high rates of forced displacement among the in-voluntarily mobile, it also prevents the immobile from leaving resource-deprived and dangerous neighborhoods ðSampson 2012; Sharkey 2013Þ.
Oncewe accounted for involuntary displacement,which is overlooked inmost research on residential mobility,we find that income was no longer as-sociated with rates of mobility among urban renters. This finding is drivenby two independent yet reinforcing processes. The first is that the moves of
18. Households that relocate voluntarily on average experience a significant improve-
ment in neighborhood quality, but those that experience involuntary dislocation relocate to
neighborhoods with higher poverty and crime rates ðDesmond and Shollenberger 2013Þ.
This content downloaded from 128.103.149.52 on Tue, 19 May 2015 08:31:52 AMAll use subject to JSTOR Terms and Conditions
very poor renters are disproportionately forced: almost a quarter of recent
Forced Relocation and Residential Instability | 255
moves undertaken by Milwaukee’s poorest renters ðwith household in-comes below $12,204Þ were involuntary dislocations. The second processhas to do with heightened levels of unforced mobility that regularly followsa forced move. A forced move often compels renters to move into a subparapartment, which in turn compels them soon thereafter to undertake anintentional move to find better housing. Our study shows that renters whorecently experienced a forcedmove weremore likely to live in lower-qualityhousing units than matched renters who did not; and it shows that renterswho were forced from their previous dwellings had a significantly higherlikelihood of undertaking an unforced move in the period following theirinvoluntary displacement thanmatched renters whowere not. Renters whorecently experienced a forced move followed by an unforced move weremuch more likely to cite housing problems or neighborhood dissatisfactionas the motivation for the latter relocation than renters who recently expe-rienced an unforced move followed by another unforced move. These find-ings indicate that forced relocation not only accounts for a significant por-tion of moves experienced by poor renters, but is itself associated withheightened residential mobility among low-income renters.
By showing that involuntary displacement is fairly common among low-income renters, this study underscores the need for policy makers to ded-icate attention and resources to this issue. Policy makers should recognizethe importance of informal evictions, found here to be the most commontype of forcedmove renters experience.The findings of this study imply thatany estimate of the prevalence of involuntary displacement that neglectsinformal evictions, be it based on administrative data ðe.g., eviction records,social service filesÞ or conventional surveys ðe.g., the AmericanHousing Sur-veyÞ, is a significant underestimate. Although renters who are informallyevicted are denied due process, initiatives aimed at formalizing displace-ment may increase their hardship because, should those renters be evicted,they will be marked with a record. Policy makers should recognize the po-tential negative consequences of encouraging landlords or tenants to settletheir disputes in civil court; and if they wish to extend eviction preventionassistance to households facing informal eviction, they should reconsiderthe rules of such programs, which typically require households to exhibit acourt summons or other legal documentation. Perhaps most important, law-makers should investigate how open records laws, which allow civil courtfiles to be accessed easily, may contribute to the proliferation of informal
This content downloaded from 128.103.149.52 on Tue, 19 May 2015 08:31:52 AMAll use subject to JSTOR Terms and Conditions

evictions, as many tenants may know their rights but have good reason not
256 | Social Service Review
to assert them.In attempting to identify the mechanisms of residential mobility among
urban renters, this study identifies two previously undocumented conse-quences of involuntary displacement. First,we find that forced relocation isassociated with increases in residential instability. Residential instability notonly can adversely affect families, it can also destabilize both sending andreceiving neighborhoods. Since, as we have demonstrated, a forced reloca-tion increases the likelihood of not one but two moves, a single eviction maydestabilize multiple city blocks: the street from which a family was evicted,the street to which the family then temporarily moves, and the street towhich the family moves again, seeking better conditions. Forced displace-ment can thus contribute to what Jane Jacobs ð1961, 271Þ calls “perpetualslums,” or churning environments where people are forever on the go andnothing appears nailed down. Perpetual slums are the enemy of civic en-gagement, neighborly trust, and local community and are an incubator ofcrime ðSampson 2012Þ. The relationship between involuntary displacementand residential instability is therefore concerning not only from the per-spective of low-income renters but also from the perspective of low-incomecommunities.
Second, we find that forced relocation increases the chances of rentersrelocating to low-quality housing. Housing has been shown to be a key socialdeterminant of health ðWilkinson andMarmot 2003Þ, and inadequate hous-ing has a direct relationship to a myriad of acute problems, from asthma,developmental delays, and lead poisoning in children to heart disease andpoor mental health in adults ðEvans and Kantrowitz 2002; Shaw 2004Þ. Itcan also bring about broader social ills. For example, overcrowding leaveschildren with limited opportunity to concentrate on homework or enjoy anuninterrupted night’s sleep, which can in turn affect their school perfor-mance ðReady, Lee, andWeiner 2004Þ. Although involuntarily displaced fam-ilies often subsequently move away from the run-down units they acceptafter experiencing a forced move, it may take them several months to do so.It took the Hinkston family a year to move from the indecent and over-crowded apartment they accepted following their eviction. Of the house-holds who experienced a forced move 13–24 months prior to being inter-viewed, 43 percent did not experience an unforced move the following year.Moreover, research has shown that even limited exposure to substandardhousing conditions can have lasting effects, especially on children’s health
This content downloaded from 128.103.149.52 on Tue, 19 May 2015 08:31:52 AMAll use subject to JSTOR Terms and Conditions
ðMorgan et al. 2004Þ. Our findings suggest that if we wish to understand
Forced Relocation and Residential Instability | 257
why some low-income families live in decidedly worse housing units thanothers and potentially suffer the consequences that come with that, a sig-nificant part of the answer may lie in the reasons they relocated in the firstplace.
These findings suggest that an effective way to decrease residentialinstability among poor families and to prevent them from moving intosubstandard housing would be to lower the incidence of forced displace-ment. Providing indigent tenants in housing court with free legal counsel isan effective way to prevent displacement. Randomized experiments ðe.g.,Seron et al. 2001; Greiner, Pattanayak, and Hennessy 2013Þ find that tenantsrepresented by lawyers are much more likely to avoid eviction, irrespectiveof the merits of their case. However effective legal aid might be, thisinitiative would not benefit families displaced beyond the purview of thecourt ðthe informally evictedÞ. If most evictions are attributed to nonpay-ment of rent, which itself is largely attributed to the extreme housing bur-den of poor renting households, then the most effective policy interventionaimed at decreasing involuntary displacement would involve increasing thesupply of affordable housing ðDiPasquale 2011Þ.This could be accomplishedby expanding opportunities for low-income home ownership, building morepublic housing, increasing affordable housing requirements for local devel-opers, or encouraging landlords to offer fixed-rent, long-term leases.
When interpreting the findings of this study, it is important to note itslimitations. First, because this study was restricted to renters’ residentialhistories,we did not observe transitions into homeownership. Some higher-income renters in our sample presumably went on to become homeowners.If we were able to observe these transitions over an extended time period,we likely would have recorded lower rates of residential mobility amongbetter-off respondents, as homeownership typically promotes residentialstability.19 Second, as noted above, we observed household income only atthe time of the interview. Although our models include additional measuresof socioeconomic status ðe.g., educationÞ and controls for financial shocksðe.g., job lossÞ, our analysis would have benefited from a reliable incomevariable measured over the entire duration of the study period.This limita-
19. That said, Thomas Boehm and Alan Schlottmann ð2004Þ find that low-income
inority households have a higher likelihood of transitioning from first-time homeowner-
hip to renting than from renting to first-time home ownership.
m
s
This content downloaded from 128.103.149.52 on Tue, 19 May 2015 08:31:52 AMAll use subject to JSTOR Terms and Conditions
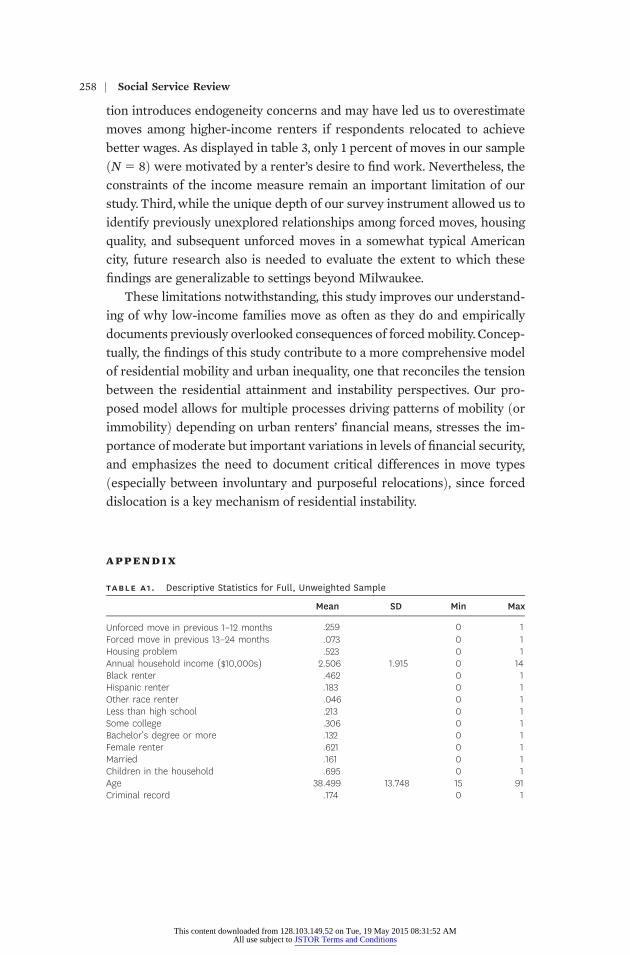
tion introduces endogeneity concerns and may have led us to overestimate
258 | Social Service Review
moves among higher-income renters if respondents relocated to achievebetter wages. As displayed in table 3, only 1 percent of moves in our sampleðN5 8Þ were motivated by a renter’s desire to find work. Nevertheless, theconstraints of the income measure remain an important limitation of ourstudy.Third,while the unique depth of our survey instrument allowed us toidentify previously unexplored relationships among forced moves, housingquality, and subsequent unforced moves in a somewhat typical Americancity, future research also is needed to evaluate the extent to which thesefindings are generalizable to settings beyond Milwaukee.
These limitations notwithstanding, this study improves our understand-ing of why low-income families move as often as they do and empiricallydocuments previously overlooked consequences of forcedmobility.Concep-tually, the findings of this study contribute to a more comprehensive modelof residential mobility and urban inequality, one that reconciles the tensionbetween the residential attainment and instability perspectives. Our pro-posed model allows for multiple processes driving patterns of mobility ðorimmobilityÞ depending on urban renters’ financial means, stresses the im-portance of moderate but important variations in levels of financial security,and emphasizes the need to document critical differences in move typesðespecially between involuntary and purposeful relocationsÞ, since forceddislocation is a key mechanism of residential instability.
appendix
table a1. Descriptive Statistics for Full, Unweighted Sample
Mean SD Min Max
Unforced move in previous 1–12 months .259 0 1
Forced move in previous 13–24 months HousAnnuBlackHispOtheLessSomBachFemaMarrChildAgeCrimThis content downloaded from 128.103.1All use subject to JSTO
.073
49.52 on Tue, 19 MR Terms and Condi
ay 2015 08:31:52 Ations
0
M
1
ing problemal household income ð$10,000sÞ.5232.506
1.91500
114
renter
.462 0 1 anic renter .183 0 1 r race renter .046 0 1 than high school .213 0 1 e college .306 0 1 elor’s degree or more .132 0 1 le renter .621 0 1 ied .161 0 1 ren in the household .695 0 138.499
13.748 15 91 inal record .174 0 1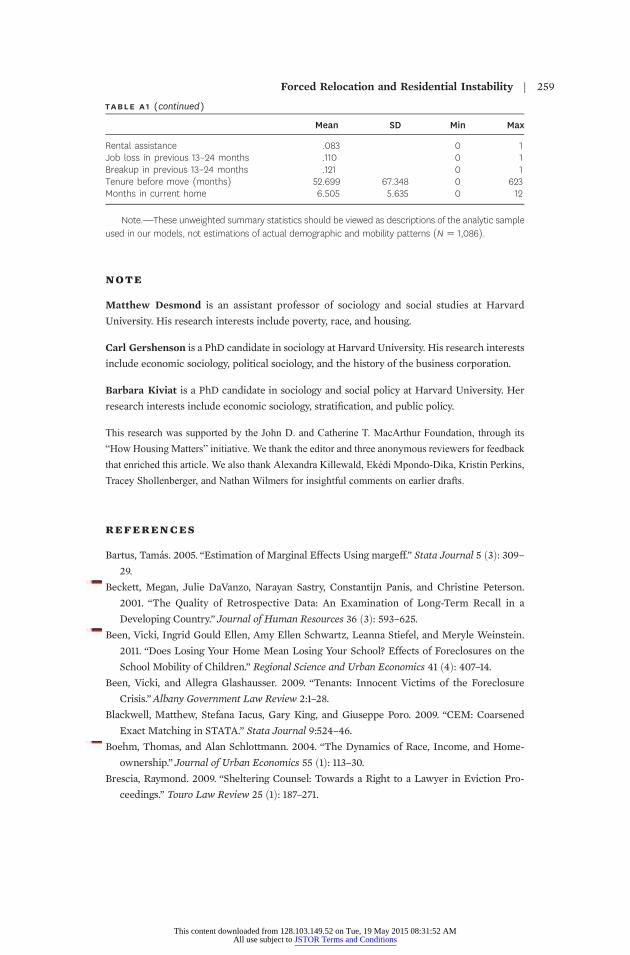
table a1 (continued )
Forced Relocation and Residential Instability | 259
Mean SD Min Max
Rental assistance .083 0 1
Job loss in previous 13–24 months BreaTenuMonN tistics sh
used al demo
note
references
This content downloaded from 128.103.All use subject to JSTO
.110
.121
viewed a
nd mob
149.52 on Tue, 19 MR Terms and Cond
tions of
erns ðN
ay 2015 08:31:52 Aitions
00
alytic sa
6Þ.
M
11
kup in previous 13–24 monthsre before move ðmonthsÞ
52.699 67.348 0 623 ths in current home 6.505 5.635 0 12ote.—These unweighted summary sta
ould be s descrip the an mplein our models, not estimations of actu
graphic a ility patt 5 1,08Matthew Desmond is an assistant professor of sociology and social studies at Harvard
University. His research interests include poverty, race, and housing.
Carl Gershenson is a PhD candidate in sociology at Harvard University. His research interests
include economic sociology, political sociology, and the history of the business corporation.
Barbara Kiviat is a PhD candidate in sociology and social policy at Harvard University. Her
research interests include economic sociology, stratification, and public policy.
This research was supported by the John D. and Catherine T. MacArthur Foundation, through its
“How Housing Matters” initiative. We thank the editor and three anonymous reviewers for feedback
that enriched this article. We also thank Alexandra Killewald, Ekédi Mpondo-Dika, Kristin Perkins,
Tracey Shollenberger, and Nathan Wilmers for insightful comments on earlier drafts.
Bartus, Tamás. 2005. “Estimation of Marginal Effects Using margeff.” Stata Journal 5 ð3Þ: 309–29.
Beckett, Megan, Julie DaVanzo, Narayan Sastry, Constantijn Panis, and Christine Peterson.
2001. “The Quality of Retrospective Data: An Examination of Long-Term Recall in a
Developing Country.” Journal of Human Resources 36 ð3Þ: 593–625.Been, Vicki, Ingrid Gould Ellen, Amy Ellen Schwartz, Leanna Stiefel, and Meryle Weinstein.
2011. “Does Losing Your Home Mean Losing Your School? Effects of Foreclosures on the
School Mobility of Children.” Regional Science and Urban Economics 41 ð4Þ: 407–14.Been, Vicki, and Allegra Glashausser. 2009. “Tenants: Innocent Victims of the Foreclosure
Crisis.”Albany Government Law Review 2:1–28.
Blackwell, Matthew, Stefana Iacus, Gary King, and Giuseppe Poro. 2009. “CEM: Coarsened
Exact Matching in STATA.” Stata Journal 9:524–46.
Boehm, Thomas, and Alan Schlottmann. 2004. “The Dynamics of Race, Income, and Home-
ownership.” Journal of Urban Economics 55 ð1Þ: 113–30.Brescia, Raymond. 2009. “Sheltering Counsel: Towards a Right to a Lawyer in Eviction Pro-
ceedings.” Touro Law Review 25 ð1Þ: 187–271.
Burt, Martha. 2001. “Homeless Families, Singles, and Others: Findings from the 1996 National
Survey of Homeless Assistance Providers and Clients.”Housing Policy Debate 12 ð4Þ: 737–80.Co
De
De
——
——
De
De
De
DiP
Du
Ev
Ev
Go
Gr
Ha
Ha
Ho
Iac
Ihr
Jac
260 | Social Service Review
ulton, Claudia, Brett Theodos, and Margery Turner. 2012. “Residential Mobility and Neigh-
borhood Change: Real Neighborhoods under the Microscope.” Cityscape 14 ð3Þ: 55–89.Luca, Stefanie, Philip Garboden, and Peter Rosenblatt. 2013. “Segregating Shelter: How
Housing Policies Shape the Residential Locations of Low-Income Minority Families.”
Annals of the American Academy of Political and Social Science 647 ð1Þ: 268–99.smond, Matthew. 2012a. “Disposable Ties and the Urban Poor.” American Journal of So-
ciology 117 ð5Þ: 1295–335.—. 2012b. “Eviction and the Reproduction of Urban Poverty.”American Journal of Sociol-
ogy 118 ð1Þ: 88–133.—. 2015. “Unaffordable America: Poverty, Housing, and Eviction.” Fast Focus, Institute for
Research on Poverty 22.
smond, Matthew, Weihua An, Richelle Winkler, and Thomas Ferriss. 2013. “Evicting Chil-
dren.” Social Forces 92 ð1Þ: 303–27.smond, Matthew, and Carl Gershenson. 2015. “Housing and Employment Insecurity among
the Working Poor.” Unpublished manuscript, Harvard University.
smond,Matthew, and Tracey Shollenberger. 2013.“Poverty, Housing, and theMechanisms of
Neighborhood Selection.” Paper presented at the American Sociological Association Annual
Meeting, New York, August 9–13.
asquale, Denise. 2011. “Rental Housing: Current Market Conditions and the Role of Federal
Policy.” Cityscape 13 ð2Þ: 57–70.ncan, Greg, and Sandra Newman. 2007. “Expected and Actual Residential Mobility.” Journal
of the American Institute of Planners 42 ð2Þ: 174–86.ans, Gary. 2004.“TheEnvironment of ChildhoodPoverty.”AmericanPsychologist 59 ð2Þ: 77–92.ans, Gary, and ElyseKantrowitz. 2002.“Socioeconomic Status andHealth: The Potential Role
of Environmental Risk Exposure.”Annual Review of Public Health 23:303–31.
ffman, Alice. 2009. “On the Run: Wanted Men in a Philadelphia Ghetto.”American Sociolog-
ical Review 74 ð3Þ: 339–57.einer, D. James, Cassandra Wolos Pattanayak, and Jonathan Hennessy. 2013. “The Limits of
Unbundled Legal Assistance: A Randomized Study in a Massachusetts District Court and
Prospects for the Future.” Harvard Law Review 126:901–89.
rtman, Chester, and David Robinson. 2003. “Evictions: The Hidden Housing Problem.”
Housing Policy Debate 14 ð4Þ: 461–501.ynie, Dana, and Scott South. 2005. “Residential Mobility and Adolescent Violence.” Social
Forces 84:361–74.
lland, Paul. 1986. “Statistics and Causal Inference.” Journal of the American Statistical
Association 81:945–70.
us, Stefano, Gary King, and Giuseppe Porro. 2012. “Causal Inference without Balance
Checking: Coarsened Exact Matching.” Political Analysis 20:1–24.
ke, David K., and Carol S. Faber. 2012. Geographical Mobility: 2005 to 2010.Washington, DC:
US Census Bureau.
obs, Jane. 1961. The Death and Life of Great American Cities. New York: Random House.
This content downloaded from 128.103.149.52 on Tue, 19 May 2015 08:31:52 AMAll use subject to JSTOR Terms and Conditions

Jelleyman, T., and N. Spencer. 2008. “Residential Mobility in Childhood and Health Outcomes:
A Systematic Review.” Journal of Epidemiology and Community Health 62 ð7Þ: 584–592.Lo
Ma
Ma
Mo
Mo
Na
Ois
Pa
Ph
Re
Re
Ro
Sam
Say
Sc
Se
Se
Sh
Forced Relocation and Residential Instability | 261
gan, John, andRichard Alba. 1993.“Locational Returns toHumanCapital:Minority Access to
Suburban Community Resources.” Demography 30 ð2Þ: 243–68.nheim, Karl. 1989. “Tenant Eviction Protection and the Takings Clause.” Wisconsin Law
Review 1989:925–1019.
nzo, Lynne, Rachel Kleit, and Dawn Couch. 2008. “ ‘Moving Three Times Is Like Having
Your House on Fire Once’: The Experience of Place and Impending Displacement among
Public Housing Residents.” Urban Studies 45 ð9Þ: 1855–78.rgan, Stephen, and ChristopherWinship. 2007. Counterfactuals and Causal Inference: Meth-
ods and Principles for Social Research. Cambridge: Cambridge University Press.
rgan, Wayne, J., Ellen F. Crain, Rebecca S. Gruchalla, George T. O’Connor, Meyer Kattan,
Richard Evans, James Stout, George Malindzak, Ernestine Smartt, Marshall Plaut, Michelle
Walter, Benjamin Vaughn, and Herman Mitchell. 2004. “Results of a Home-Based Environ-
mental Intervention among Urban Children with Asthma.” New England Journal of Medi-
cine 351:1068–80.
tional Multi Housing Council. 2009. Quick Facts: Resident Demographics. Washington, DC:
National Multi House Council.
hi, Shigehiro. 2010. “The Psychology of Residential Mobility: Implications for the Self, So-
cial Relationships, and Well-Being.” Perspectives on Psychological Science 5 ð1Þ: 5–21.bst, Georgia. 2013. “Waiting Lists Soar for Public Housing, Rent Assistance.” Milwaukee
Journal Sentinel, August 10.
inney, Robin. 2013. “Exploring Residential Mobility among Low-Income Families.” Social
Service Review 87 ð4Þ: 780–815.ady, Douglas, Valerie Lee, and Kevin Welner. 2004. “Educational Equity and School Struc-
ture: School Size, Overcrowding, and Schools-Within-Schools.” The Teachers College Record
106 ð10Þ: 1989–2014.tsinas, Nicolas, and Eric Belsky. 2008. Revisiting Rental Housing.Washington, DC: Brookings
Institution Press and the Harvard University Joint Center for Housing Studies.
ssi, Peter. ½1955� 1980.Why Families Move, 2nd ed. Beverly Hills: Sage.
pson, Robert. 2012. Great American City: Chicago and the Enduring Neighborhood Effect.
Chicago: University of Chicago Press.
les, Harlan, Robert Belli, and Emilio Serrano. 2010. “Interviewer Variance between Event
History Calendar and Conventional Questionnaire Interviews.” Public Opinion Quarterly
74 ð1Þ: 140–53.hwartz, Alex. 2010. Housing Policy in the United States, 2nd ed. New York: Routledge.
rby, Michael, David Brody, Shetal Amin, and Philip Yanowitch. 2006. “Eviction as a Risk
Factor for Suicide.” Psychiatric Services 57 ð2Þ: 273–74.ron, Carroll, Martin Frankel, Gregg Van Ryzin, and Jean Kovath. 2001. “The Impact of Le-
gal Counsel on Outcomes for Poor Tenants in New York City’s Housing Court: Results of a
Randomized Experiment.” Law and Society Review 35 ð2Þ: 419–34.arkey, Patrick. 2013. Stuck in Place: Urban Neighborhoods and the End of Progress toward
Racial Equality. Chicago: University of Chicago Press.
This content downloaded from 128.103.149.52 on Tue, 19 May 2015 08:31:52 AMAll use subject to JSTOR Terms and Conditions
Sharkey, Patrick, and Robert Sampson. 2010. “Destination Effects: Residential Mobility and
Trajectories of Adolescent Violence in a Stratified Metropolis.” Criminology 48 ð3Þ: 639–81.
262 | Social Service Review
Shaw, Mary. 2004. “Housing and Public Health.”Annual Review of Public Health 25:397–418.
Small, Mario Luis. 2007. “Is There Such a Thing as ‘the Ghetto’? The Perils of Assuming That
the South Side of Chicago Represents Poor Black Neighborhoods.” City 11 ð3Þ: 413–21.South, Scott, and Kyle Crowder. 1997. “Escaping Distressed Neighborhoods: Individual, Com-
munity, and Metropolitan Influences.”American Journal of Sociology 102 ð4Þ: 1040–84.Stuart, Elizabeth A. 2010. “Matching Methods for Causal Inference: A Review and a Look
Forward.” Statistical Science 25 ð1Þ: 1–21.Temple, Judy, and Arthur Reynolds. 1999. “School Mobility and Achievement: Longitudinal
Findings from an Urban Cohort.” Journal of School Psychology 37 ð4Þ: 355–77.US Department of Housing and Urban Development. 2009. 50th Percentile Rent Estimates for
2010.Washington, DC: US Department of Housing and Urban Development.
Western, Bruce. 2006. Punishment and Inequality in America. New York: Russell Sage
Foundation.
Wilkinson, Richard, and M. G. Marmot. 2003. Social Determinants of Health: The Solid Facts.
Geneva: World Health Organization.
Wood, David, Neal Halfon, Debra Scarlata, Paul Newacheck, and Sharon Nessim. 1993. “Impact
of Family Relocation on Children’s Growth, Development, School Function, and Behavior.”
Journal of the American Medical Association 270 ð11Þ: 1334–38.Wood, Holly. 2014. “When Only a House Makes a Home: How Home Selection Matters in the
Residential Mobility Decisions of Lower-Income, Inner-City African American Families.”
Social Service Review 88 ð2Þ: 264–94.
This content downloaded from 128.103.149.52 on Tue, 19 May 2015 08:31:52 AMAll use subject to JSTOR Terms and Conditions