Embed Size (px)
Citation preview

May 2012
Forced displacement linked to transnational organised crime in Mexico

Table of contents
Executive summary 3
1 Introduction 4
2 Research goals 5
3 Methods and data sources 5
4 Key findings 6
5 The impact of violence on displacement: national-level mapping 8
6 Case study: Ciudad Juárez 16
7 Vulnerability after displacement: interpreting the data 18
8 A closer look at vulnerability: qualitative research in three selected locations 19
9 Government response to displacement to date: the basis for a future response 21
10 Towards an effective response: a framework for action 25
11 Study limitations and areas for further work 27
Acknowledgements 28
Annex I: Statistical correlations
Annex II: Tables
3Forced displacement linked to transnational organised crime in Mexico
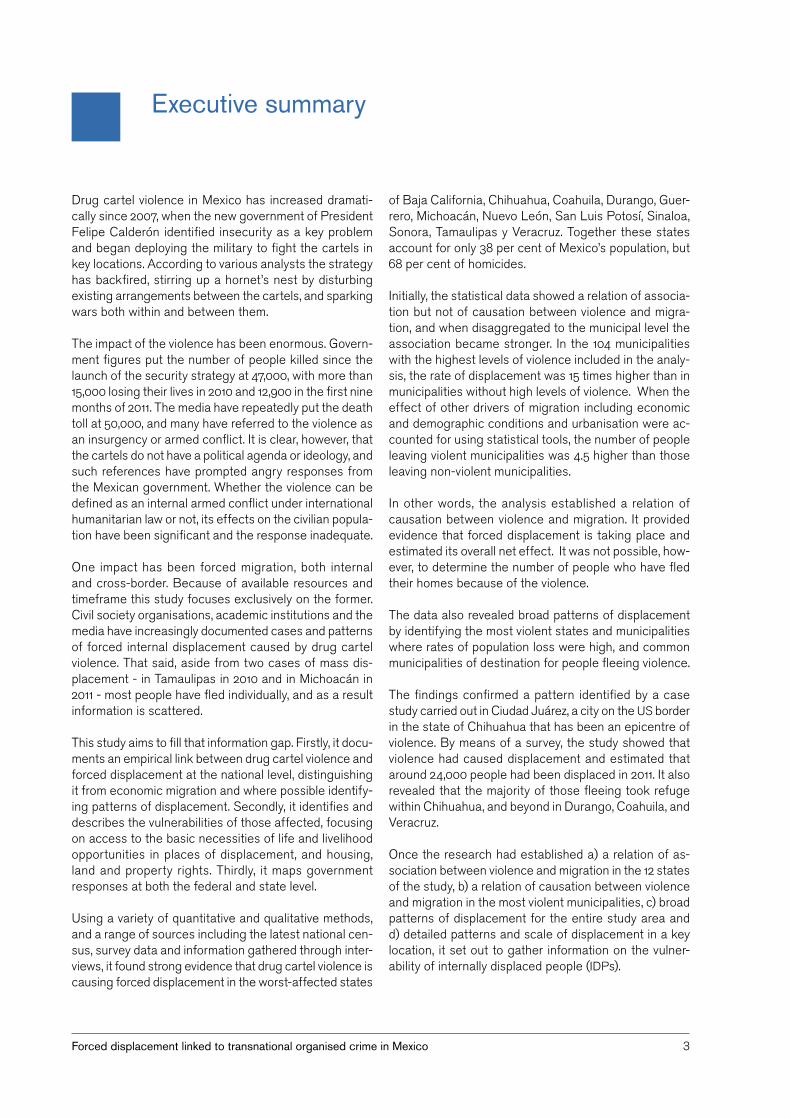
Executive summary
Drug cartel violence in Mexico has increased dramati-cally since 2007, when the new government of President Felipe Calderón identified insecurity as a key problem and began deploying the military to fight the cartels in key locations According to various analysts the strategy has backfired, stirring up a hornet’s nest by disturbing existing arrangements between the cartels, and sparking wars both within and between them
The impact of the violence has been enormous Govern-ment figures put the number of people killed since the launch of the security strategy at 47,000, with more than 15,000 losing their lives in 2010 and 12,900 in the first nine months of 2011 The media have repeatedly put the death toll at 50,000, and many have referred to the violence as an insurgency or armed conflict It is clear, however, that the cartels do not have a political agenda or ideology, and such references have prompted angry responses from the Mexican government Whether the violence can be defined as an internal armed conflict under international humanitarian law or not, its effects on the civilian popula-tion have been significant and the response inadequate
One impact has been forced migration, both internal and cross-border Because of available resources and timeframe this study focuses exclusively on the former Civil society organisations, academic institutions and the media have increasingly documented cases and patterns of forced internal displacement caused by drug cartel violence That said, aside from two cases of mass dis-placement - in Tamaulipas in 2010 and in Michoacán in 2011 - most people have fled individually, and as a result information is scattered
This study aims to fill that information gap Firstly, it docu-ments an empirical link between drug cartel violence and forced displacement at the national level, distinguishing it from economic migration and where possible identify-ing patterns of displacement Secondly, it identifies and describes the vulnerabilities of those affected, focusing on access to the basic necessities of life and livelihood opportunities in places of displacement, and housing, land and property rights Thirdly, it maps government responses at both the federal and state level
Using a variety of quantitative and qualitative methods, and a range of sources including the latest national cen-sus, survey data and information gathered through inter-views, it found strong evidence that drug cartel violence is causing forced displacement in the worst-affected states
of Baja California, Chihuahua, Coahuila, Durango, Guer-rero, Michoacán, Nuevo León, San Luis Potosí, Sinaloa, Sonora, Tamaulipas y Veracruz Together these states account for only 38 per cent of Mexico’s population, but 68 per cent of homicides
Initially, the statistical data showed a relation of associa-tion but not of causation between violence and migra-tion, and when disaggregated to the municipal level the association became stronger In the 104 municipalities with the highest levels of violence included in the analy-sis, the rate of displacement was 15 times higher than in municipalities without high levels of violence When the effect of other drivers of migration including economic and demographic conditions and urbanisation were ac-counted for using statistical tools, the number of people leaving violent municipalities was 4 5 higher than those leaving non-violent municipalities
In other words, the analysis established a relation of causation between violence and migration It provided evidence that forced displacement is taking place and estimated its overall net effect It was not possible, how-ever, to determine the number of people who have fled their homes because of the violence
The data also revealed broad patterns of displacement by identifying the most violent states and municipalities where rates of population loss were high, and common municipalities of destination for people fleeing violence
The findings confirmed a pattern identified by a case study carried out in Ciudad Juárez, a city on the US border in the state of Chihuahua that has been an epicentre of violence By means of a survey, the study showed that violence had caused displacement and estimated that around 24,000 people had been displaced in 2011 It also revealed that the majority of those fleeing took refuge within Chihuahua, and beyond in Durango, Coahuila, and Veracruz
Once the research had established a) a relation of as-sociation between violence and migration in the 12 states of the study, b) a relation of causation between violence and migration in the most violent municipalities, c) broad patterns of displacement for the entire study area and d) detailed patterns and scale of displacement in a key location, it set out to gather information on the vulner-ability of internally displaced people (IDPs)

4 Internal Displacement Monitoring Centre | May 2012
IntroductionIt found that people who move from violent to non-violent municipalities – that is, people who presumably flee vio-lence and are therefore IDPs rather than migrants - have less access to livelihood opportunities, education and housing than the local population The Ciudad Juárez survey showed that IDPs from the city also have protec-tion needs related to the property they leave behind
In-depth interviews in three localities revealed that IDPs face difficulties in finding enough work and in exercising their housing and property rights Most interviewees said they were employed in the informal labour market, barely earned the minimum wage and needed to work more hours to meet their basic needs They said that where possible they had sold or rented their property, and if not they had abandoned it - in which case the authorities offered no specific support to protect their rights - and that upon arrival in their places of refuge they had been housed by family members, where they experienced over-crowding and inadequate living conditions
Their situation in terms of access to health care and education was more encouraging Most interviewees said their children had been enrolled in school, and that medical care - albeit not always timely - was available at local health centres
The government's response to displacement caused by drug cartel violence has been limited In the two cases of mass displacement in Tamaulipas and Michoacán, and in the case of displacements to Veracruz, local authori-ties have provided some support At the federal level, however, the government has not acknowledged that displacement is taking place and has either ignored or played down information about it
Both executive and legislative bodies have tried in the past to set up a framework for IDPs' protection, but these efforts were in response to displacement caused by the Zapatista uprising in Chiapas and not the more recent phenomenon of drug cartel violence The state of Chia-pas adopted a law on internal displacement in February 2012 which incorporates the definition of displacement included in the Guiding Principles, and includes various norms ranging from prevention to humanitarian assist-ance
Within the federal administration, the agencies responsi-ble for coordinating a response to displacement are the Ministry of Interior and the National Population Coun-cil The recently-created Office for the Victims of Crime (Províctima) is mandated to document displacement and help IDPs access services provided by other government agencies
Drug cartel violence in Mexico has increased dramati-cally since 2007 Government figures put the number of people killed since then at 47,000, with 15,000 lives lost in 2010 alone and 12,900 in the first nine months of 2011 The violence has been most prevalent in the northern states of Tamaulipas, Chihuahua, Nuevo León and Durango, but it has also taken place in other areas where the cartels operate, including Baja California, Coahuila, Guerrero, Michoacán, San Luis Potosí, Sinaloa, Sonora and Ver-acruz There are also widespread reports of journalists, politicians and human rights activists being harassed, persecuted or killed, and of some 25 assassinations of small town mayors between 2008 and 2011 1
Forced displacement has been an unseen and undocu-mented outcome of this violence No government institu-tion has systematically tracked the extent of the phenom-enon Academic institutions, particularly in Ciudad Juárez, have conducted studies which show that up to 230,000 people have fled the area because of the violence since 2007, roughly half of whom remain displaced within the country
1 By November 2011, 25 mayors had been killed:(4 in Michoacán, 1 in Zacatecas, 4 in Oaxaca, 4 in Durango, 2 in Guerrero, 1 in Estado de México, 2 in Nuevo León, 1 in San Luis Potosí, 1 in Tamaulipas, 3 in Chihuahua, 1 in Morelos, and 1 in Coahuila) For list, names and counties of jurisdiction see: www terra com mx/noticias/articulo/965621/

5Forced displacement linked to transnational organised crime in Mexico
Research goals
The research project had four main goals:
a) To determine whether there was an empirical link between drug cartel violence and forced displacement, and if so to describe the patterns of displacement Given that forced displacement happens alongside flows of economic and other migration, the research sought to distinguish be-tween the various phenomena as much as pos-sible
b) To identify and describe the vulnerabilities of those displaced by drug cartel violence, focusing on ac-cess to the basic necessities of life, livelihood op-portunities in places of displacement and housing, land and property rights
c) To identify and map existing government respons-es at the federal level and to identify the institu-tions which, given their mandates, should work to address internal displacement
d) To provide a framework for action that might guide next the steps in setting up a response to internal displacement
Methods and data sources
The study used a combination of quantitative and quali-tative research methods and data sources to document and describe forced displacement and ensuing protection needs To establish a link of causation between violence and human migration in affected states and municipali-ties, on the one hand it used statistics on homicides and violent crimes, and on the other data from the Mexican national census, the results of which were published in 2011 A variety of statistical tools were used in the data analysis, including causal inference, propensity score matching and linear regression modelling
The vulnerability of internally displaced people (IDPs) was inferred by comparing indicators of their access to health care, education, housing and labour markets in their places of displacement with those of the local population
To describe the impact of violence on displacement in more detail, a case study of one key location, Ciudad Juárez in Chihuahua state, was carried out A probability, multi-stage, stratified survey was conducted among 1,874 respondents in the city and its surroundings, providing results with a 95 per cent confidence margin and 0 5 per cent p and q values
To gather qualitative information on IDPs' vulnerabilities and protection needs, face-to-face, in-depth interviews were carried out in three localities The sample for the interviews was a non-probability sample; interviewees were identified through local contacts and then through snowball sampling
Finally, a variety of policies and laws were examined to identify and describe the Mexican state’s response to dis-placement caused by drug cartel violence Face-to-face interviews were conducted with various state officials, civil society organisations and academics

6 Internal Displacement Monitoring Centre | May 2012
Key findings
1 In 2010, 68 per cent of the country’s homicides were committed within the 12 states this study focused on - Baja California, Chihuahua, Coahuila, Durango, Guerrero, Michoacán, Nuevo León, San Luis Potosí, Sinaloa, Sonora, Tamaulipas and Veracruz – which together account for only 38 per cent of the popula-tion The study concentrated on these states as they have high levels of violence
2 Of the 12 states, eight have a net migration rate of zero or a negative figure, meaning their population is in decline as emigration outstrips immigration Greater Mexico City, the Distrito Federal, was found to be los-ing the highest percentage of its population, which has been the case for roughly two decades because of socio-economic factors and population redistribu-tion The next four states in terms of percentage of population lost are all on the list of those experienc-ing the worst violence: Guerrero, Sinaloa, Chihuahua and Durango
3 In the 12 states covered, an association was found between violence - defined for this study as homi-cides, threats, extortion and a general atmosphere of violence - and a net migration rate This was the first indication that the significant population loss taking place might be connected to violence perpetrated by organised crime groups
4 This relationship of association, together with the fact that many of those who relocate do so within the same state so as not to lose their support networks, made it clear that the situation required analysis at a more local, i e municipal level
5 Within the 12 states, violence was found to be concen-trated in a relatively small number of municipalities The municipalities of Ciudad Juárez, Tijuana, Chihua-hua, Culiacán and Acapulco have the highest number of reported homicides in Mexico Together they ac-count for 29 per cent of the country's homicides
6 The study analysed the 104 municipalities with the highest rates of violence Results showed the propor-tion of emigrants from these municipalities to be 15 times that of municipalities with less violence It was possible, however, that a large part of this difference was the result of other factors in the most violent municipalities, where socio-economics, demographics and urbanisation increase the likelihood of emigra-
tion This showed the need to control for the effects of these factors in order to isolate and measure the effect of violence alone
7 Once the effect of socio-economic conditions nor-mally associated with internal migration in Mexico was controlled for, violence related to organised crime was found to be associated with ongoing emigration from the most violent municipalities regardless of their economic situation The proportion of emigrants from the most violent municipalities was found to be 4 5 times higher than in municipalities with similar conditions but with lower levels of violence This dif-ference represents the net effect of violence related to organised crime on migration
8 The analysis provided statistical evidence that vio-lence causes forced displacement in the worst-af-fected municipalities
9 In terms of displacement patterns, much of the migra-tion is taking place within rather than between states
10 Of the most violent municipalities included in the study, roughly 70 per cent have lost population These constitute the main areas of expulsion and should be the focus of further research and response The mu-nicipalities with the highest rates of violence are Tijua-na (Baja California), Chihuahua (Chihuahua), Juárez (Chihuahua), Monterrey (Nuevo León) and Culiacán (Sinaloa), and these all have net migration rates The most popular municipalities of destination for people leaving the three most violent municipalities (Tijuana, Chihuahua, and Juárez) are Matamoros (Tamaulipas), Tepic (Nayarit), and Alvaro Obregón (Distrito Federal) respectively These municipalities too should be the focus of further research
11 The data and analysis found no significant link at the national level between the presence of violence and the thousands of empty homes identified in various states across the country, which might have indicated that those fleeing were abandoning their property regardless of the economic loss Rather, demographic and socio-economic factors such as the oversupply of housing in some areas are most likely behind the number of empty homes
12 The Ciudad Juárez case study found that 24,416 peo-ple left the city in 2011 because of violence Of them,

7Forced displacement linked to transnational organised crime in Mexico
50 per cent moved to the United States, with 18 per cent settling in El Paso, Texas Of those who fled within Mexico, 9 6 per cent moved to Durango, 9 4 per cent to Coahuila and nine per cent to Veracruz These findings support data gathered between 2007 and 2009
13 The main causes of displacement from Juárez in 2011 were the climate of violence and insecurity (26 per cent) and extortion (24 per cent) The survey also found that 80 2 per cent of those who left the city had a job This supports the hypothesis that violence and insecurity rather than economic concerns are causing displacement from Juárez
14 The survey revealed that 72 per cent of IDPs left be-hind some type of property in Juárez, with a house or residence being the most common (64 7 per cent) Almost a third (32 3 per cent) of those who fled in 2011 abandoned their property as opposed to selling it, leaving it in someone’s care or giving it away
15 After establishing a) the relationship of association between violence and displacement in the 12 states, b) the relationship of causation between violence and migration, and the net effect of violence on displace-ment in the most violent municipalities, and c) the patterns and scale of displacement in Ciudad Juárez, census data was interpreted to distil information on IDPs' vulnerability in terms of access to health care, education, housing and labour markets It became clear that migrants were worse off than local residents in terms of access to education and home ownership The comparison did not, however, distinguish between economic migrants and IDPs
16 To determine whether those who moved to a new area because of violence faced specific vulnerabilities, the same indicators were examined for emigrants from the three municipalities with the highest number of homicides to the three most popular municipali-ties of destination This was done on the assumption that those undertaking such displacement did so in order to escape violence In other words, they were very likely to be IDPs The analysis revealed that they faced three major problems compared with the local resident population: less access to the labour market, the difficulty of children and adolescents in access-ing and remaining in education, and less access to adequate housing
17 Qualitative research in the states of Durango, Coa-huila and Veracruz largely confirmed these findings, showing that IDPs face difficulties in finding employ-ment and exercising their housing and property rights Most interviewees said they were employed in the
informal labour market, barely earned the minimum wage and needed to work more hours to meet their basic needs They said that where possible they had sold or rented their property and if not they had aban-doned it - in which case the authorities offered no specific support to protect their rights - and that upon arrival in their places of refuge they had been housed by family members, where they experienced over-crowding and inadequate living conditions Contrary to the census data, interviewees said they generally did not face obstacles in registering their children at school
18 The federal government has to date undertaken a number initiatives in response to displacement caused by drug cartel violence, but in the absence of an IDP law or policy, there has been no coordination or harmonisation across agencies Various legislative proposals have failed for reasons including a lack of political agreement and technical arguments over the definition of terms and responsibilities in addressing the issue
19 Local authorities have provided support to those flee-ing violence, particularly in cases of mass displace-ment, and in the case of people going to Veracruz from the Juárez area The recent adoption in Chiapas of a law on internal displacement is encouraging, but this was driven by protracted displacement caused by the Zapatista uprising rather than the more recent phenomenon of drug cartel violence
20 The National System for Civil Protection (SINAPROC), which is part of the Ministry of Interior, has played no role in helping those displaced by violence as its cur-rent mandate focuses on people affected by natural disasters

8 Internal Displacement Monitoring Centre | May 2012
The impact of violence on displacement: national-level mapping
To provide a national-level description of the impact of drug cartel violence on forced displacement, an analysis of violence indicators and migration flows was conducted at state and municipal levels in the 12 states covered by study
As part of this analysis, the total number of homicides reported in each state and municipality were collected and ratios were calculated with respect to national totals The net migration rate (calculated as the total number of immigrants minus the total number of emigrants) was also estimated for the period of 2005 to 2010, and an indicator of the net migration rate was calculated rela-tive to the state or municipality’s total population in 2010 in order to control for the effect of population volume Finally, correlation coefficients were estimated between the percentage of homicides committed in each munici-pality and the percentage net migration rate to confirm statistically that a negative relationship exists between the two in which high homicide levels drive people away
Map 1 illustrates the percentage of homicides committed in each of Mexico's administrative entities There were 25,757 homicides registered in the country as a whole in 2010, of which 17,633 (or 68 per cent) took place in the 12 states with the most violence (but which account for only 38 per cent of the population)
The state with the highest number of homicides in 2010 was Chihuahua, with 6,421 or an average of 18 a day Risk was disproportionate throughout the state, even though just two cities - Ciudad Juárez and Chihuahua - accounted for 70 per cent of the homicides (see Map 2)
After Chihuahua, the nine most violent states were: Si-naloa (2,397 homicides), Estado de México (2,114), Guer-rero (1,567), Baja California (1,525), Durango (1,112), Jalisco (1,081), Distrito Federal (1,078), Tamaulipas (963) and Nuevo León (928) Together these 10 states (including Chihuahua) registered a total of 19,186 homicides, mean-ing that three quarters of the country’s homicides took place in only ten states As in Chihuahua, there was a significant concentration of homicides in a small number of municipalities in both Baja California and Nuevo León The majority in Baja California were committed in Ti-juana, while in Nuevo León 344 of the state’s 928 homi-cides took place in Monterrey (the city as opposed to the greater metropolitan area)
In four other states - Coahuila, Michoacán, San Luis Potosí and Veracruz - a total of 1,980 homicides were
reported This may seem a relatively low figure compared with the ten most violent states, but still represents an average of more than one a day
In order to determine whether there was a relationship between violence and migration trends in the 12 states, their net migration rate was calculated and then divided by their population in 2010 As illustrated by Map 3, eight states have a net migration rate of zero or a negative figure, which indicates that the population is in decline as emigration outstrips immigration The state losing the highest percentage of its population is the Federal District, which is an exception with its own migratory patterns The next four states in terms of percentage population loss (Guerrero, Sinaloa, Chihuahua and Du-rango) are all on the list of most violent states Consid-ered together, the 12 most violent states had a negative net migration rate of 55,700 people, and the correlation coefficient between homicides and net migration rate is negative (-0 27) This is evidence that they are experienc-ing a significant loss of population which may be linked to drug cartel violence
Given that many of those fleeing violence and insecurity are probably doing so within the same state so as not to lose their support networks, the scale of displacement may be far greater, making it necessary to analyse mi-gration and homicide rates and the connection between them at municipal as well as state level
Analysis of the proportion of homicides committed in each of the municipalities within the 12 states revealed a highly uneven distribution of violence
In most states the majority of homicides were concen-trated in a small number of municipalities, while others reported far fewer2 This discrepancy is more prominent in states with higher homicide numbers In Baja California the majority of homicides are concentrated in Tijuana, which reported 4 9 per cent of homicides nationwide and 82 4 per cent of those in the state The other four municipalities in the state only accounted for one per cent of the country’s homicides The situation is similar in Chihuahua, where 75 7 per cent of the state’s homicides took place in Ciudad Juárez and Chihuahua city, the two municipalities alone accounting for nearly 20 per cent of homicides nationwide In Nuevo León, 37 per cent of
2 The only states where this was not the case are Michoacán, San Luis Potosí, Tamaulipas and Veracruz (see Map 4)

9Forced displacement linked to transnational organised crime in Mexico
Map 2. Distribution of homicides at municipal level*
* The states shown, from left to right and beginning at the top, are: Baja California, Chihuahua, Guerrero, Sinaloa and Nuevo León Mu-nicipalities in this map and maps throughout the document are not labeled as they are used to identify patterns of concentration and dispersion of phenomena Source: our own calculations based on official homicide figures from the National Institute of Statistics and Geography (INEGI) 2010
Map 1. Distribution of homicides at state level, Mexico 2010
Source: our own calculations based on official homicide figures from the National Institute of Statistics and Geography (INEGI) 2010

10 Internal Displacement Monitoring Centre | May 2012
the state's homicides were committed in Monterrey; in Sinaloa, just over 60 per cent were committed in Culiacán, Ahome and Mazatlán (see Map 2) The same trends sur-faced in Sonora, Durango, Coahuila and Guerrero, where municipalities such as Nogales, Durango, Gómez Palacio, Torreón and Acapulco stand out (see Map 4)
The study focused on a group of municipalities that seemed to have similar security conditions, and included analysis of crimes that might affect people’s migration decisions These types of crime normally cause popu-lation movements over and above those taking place for socio-economic reasons The statistics complement those related to reported homicides and allow for a more comprehensive view of the intensity of violence in the states covered
In recent years, the media as well as federal and local authorities have reported on the diversification of the drug cartels' criminal activities Kidnappings, extortion, abductions, theft and other crimes have increased as a result of the dismantling or disruption of organised crime structures – a consequence in large part of the federal government's offensive against them3 The study com-pared the levels of kidnapping, theft, break-ins, illegal detention and extortion in the 12 states with national totals4, and found that they accounted for 38 4 per cent of the quoted crimes nationwide The five municipalities with the highest homicide levels were also among the 13 with the highest overall crime rates Of every 1,000 crimes committed in the country, between 12 and 16 took place in the municipalities of Culiacán, Mexicali, Tijuana, Nuevo Laredo, Monterrey and Reynosa
Evidence that homicides and other crimes coincide as indicators of violence at the municipal level was backed up by analysis of the socio-economic and demographic factors as they relate to the violence Based on estimates derived from linear regression modelling5, it was shown that the proportion of homicides at the municipal level is related to quality of labour - the lower the percentage of the working population earning less than double the mini-mum wage, the lower the homicide rate It is also related to employment opportunity - the homicide rate is lower when more women participate in the labour market - and
3 Guerrero, E (2010) Los hoyos negros de la estrategia contra el narco [Black Holes in the Strategy Against Drug Trafficking] Online article: http://www nexos com mx/?P=leerarticulo&Arti-cle=248547
4 Crime figures were obtained from court statistics on defendants under municipal and federal jurisdictions in 2010 It is important to note that these statistics are low estimates, since they depend upon there having been a complaint by the victim as well as identification and prosecution of a suspect Nevertheless, these records come the closest to statistics of complaints, which provide the most realistic overall understanding of crime in Mexico
5 Models not shown
to the population’s level of education It also increases in relation to the municipality’s general economic situation as measured by an indicator of per household income6
The proportion of other crimes was also found to rise according to demographic pressure As the number of adolescents increases, so does competition for assets and opportunities The crime rate rises as economic lev-els improve, but it decreases as education levels improve By combining figures for homicides and other crimes, the study incorporated various socio-economic factors into its analysis of the violence, allowing different sectors of the population to be covered and creating a more realistic overall picture
Analysis of the net migration rate at the municipal level confirmed the importance of conducting the study more locally than at state level Results indicated that popula-tion movements are highly likely to be taking place within each state, and these would be invisible when looking at the net migration rate at state level It was also impor-tant to focus on certain more violent municipalities and contrast them with others with lower levels of violence and migration
While the population decreased in some municipalities between 2005 and 2010, it increased in others Increases at the municipal level in states suffering overall popula-tion decline - Chihuahua, Coahuila, Durango, Guerrero, Michoacán, San Luis Potosí, Sinaloa and Veracruz - can largely be put down to migration within those states The municipalities with the highest homicide figures - Tijuana, Chihuahua, Ciudad Juárez, Monterrey and Culiacán - all had a negative net migration rate
The relationship between homicides, other crimes and migration was confirmed by analysing the simple cor-relation between the net migration rate variable and the percentages of homicides and other crimes at the mu-nicipal level Results suggested: 1) that municipalities with higher levels of violence had a negative net migration rate, meaning that they lost population7; and 2) that violence in Mexico is distributed very unevenly and concentrated in certain municipalities (correlation coefficients are very small and not significant – 0 02 for homicides and 0 03 for other crimes, as the vast majority of municipalities report very low levels of violence)
6 Data from the income component of the Human Development Reports (HDR) They are available for consultation at: http://www undp org mx/desarrollohumano/disco/index html
7 In statistical terms, the relationship between violence and net migration was found to be negative Because more violence brings more emigration, there is a negative net migration rate (violence causes an overall population loss)

11Forced displacement linked to transnational organised crime in Mexico
Map 3. Net migration rate at state level, Mexico 2010
Source: our own calculations based on the population census, National Institute of Statistics and Geography (INEGI) 2010
Map 4. Distribution of homicides at municipal level in the 12 most violent states, Mexico 2010
Source: our own calculations based on official homicide figures from the National Institute of Statistics and Geography (INEGI) 2010

12 Internal Displacement Monitoring Centre | May 2012
The results made it clear that analysis of the effects of violence on population movements had to be based on municipalities with truly violent contexts To this end, the study concentrated on municipalities with a homicide proportion greater than 0 002 or a proportion of other crimes greater than 0 0018 (see Annex II, Table 1 and Map 5), of which 68 per cent reported negative net migration rates and 32 per cent positive (see Table 2)
In order to confirm a connection between violence and migration, causal inference analysis was conducted to ascertain whether the change in emigration ratios in the most violent municipalities was the result of the atmos-phere of violence or whether it could be attributed to other factors such as socio-economics
Violence related to organised crime can lead people to flee to another municipality, especially if they perceive that authorities are not doing enough to protect the lo-
8 The threshold for both homicides and other crimes corresponds to the first quartile of their distribution within the 12 most violent states in the country This means that together, the municipalities with proportions of homicides greater than or equal to 0 002 or proportions of other crimes greater than or equal to 0 001 account for 75 per cent of all the homicides and other crimes in the 12 states
cal population 9 Fear, economic costs (when sales drop because customers are afraid to go out in the street, or when organised crime demand a cut of profits), unem-ployment (when businesses are forced to close) and lack of hope for the future may all influence a decision to leave
Other factors unrelated to violence that drive emigration are employment opportunities and conditions, the eco-nomic situation, population structure and the education level of the population 10 The correlation matrix in Annex 1 shows that all of these variables have been found to affect the proportion of emigrants at the municipal level As such,
9 Empirical literature on criminal activity and population displace-ment in Mexico has yielded contradictory findings about the connection between the two factors The majority of the literature was produced in the United States and is based on the assump-tion that crime in a residential area affects perceptions of security and satisfaction with the neighborhood, thus motivating people to move The few studies that demonstrate a relationship between violence and migration indicate that criminal activity is a much weaker predictor of migration than other variables such as the age of the head of household, home ownership and duration of residence South, Scott J y Steven F Messner 2000 “Crime and Demography” In Annual Review of Sociology Vol 26, pp 83-106
10 See Rivero, Estela 2012 “Beyond Income Inequality: Explaining Migrants’ Destinations in Mexico In Migration and Remittances from Mexico. Trends, Impacts and New Challenges Cuecuecha, Alejandro and Carla Pederzini (Eds ) Lexington Books: Maryland Pp 51-78
Map 5. Municipalities with high rates of homicide or other crimes, Mexico 2010
Source: our own calculations based on the population census, official homicide figures and court statistics from the National Institute of Statistics and Geography (INEGI) 2010

13Forced displacement linked to transnational organised crime in Mexico
Table 2: Relationship between net migration rate and proportion of violence at municipal level*
NMR Violence
Negative Positive Total
Low 363 52 per cent 329 48 per cent 692High 71 68 per cent 34 32 per cent 105
* This table conveys the impact of violence on emigration Of 692 municipalities with low violence levels, 52 per cent lost population (a negative net migration rate) and 48 per cent gained population (a positive net migration rate) Of 105 municipalities with high levels of violence, 68 per cent had a negative net migration rate and 32 per cent had a positive net migration rate harp ation rate 5 municipalities with high levels of violence, 68 per cent had a negative net migration rate and 32 per cent had a positive neSource: our own calculations based on the population census, official homicide figures and court statistics from the National Institute of Statistics and Geography (INEGI) 2010
it is important to control for them before drawing conclu-sions about the relation between violence and emigration
The propensity score matching technique was employed to this end, using the more violent municipalities and their less violent counterparts as contrast groups, the variables that drive emigration as matching criteria, and the proportion of emigrants as the dependent variable
Using one-to-one matching for each of the 105 most vio-lent municipalities, a less violent counterpart was found that was as similar as possible in terms of its labour market, workers' incomes, the labour market's potential for absorption, working conditions for physical labour, demographic pressure, education level and household income (see Annex II, Table 3) Matches were found for all but one municipality, which did not have enough data on household income
As can be seen in Annex II, Table 4, when this matching is not conducted (the complete sample), the socio-eco-nomic characteristics of high-violence and low-violence municipalities are significantly different On average, the more violent municipalities were characterised by more people working in the tertiary sector, better employment opportunities, higher education levels and households with higher incomes 11 These conditions concide with those of urban areas, which have been a significant source of emigration in recent years; emigration in Mexico has become increasingly inter-urban, with people mov-ing from urban areas that have precisely these socio-economic conditions to other urban areas, which could potentially lead to the mistaken conclusion of attributing violence a greater role as a cause of emigration, when in reality emigration could also be these factors
Matching up municipalities of high and low violence of similar socioeconomic factors eliminated the role of said
11 Sobrino, Jaime 2010 Migración Urbana In La Situación Demográ-fica de México [The Demographic Situation in Mexico] CONAPO Pp 155-170
factors and ensured that the only variable to change be-tween them was the degree of violence The effect of the violence could now be calculated in full confidence that only the influence of this variable was being measured
Table 5 shows the average proportion of emigrants from municipalities with high and low levels of violence, both for the complete sample and the matched sample Accord-ing to the results, in the complete sample, the average proportion of emigrants from high-violence municipalities was 0 0023, compared with 0 000149 from low-violence municipalities, that is to say 15 times higher
When the 104 high-violence municipalities are compared with their less violent socio-economic counterparts (matched sample), their proportion of emigrants is on average 0 001783 higher In other words, the proportion of emigrants from more violent municipalities is 4 5 times higher This difference is the net effect that violence related to organised crime has on migration
Does violence account for the high numbers of unoccupied homes?The 2010 census revealed that roughly one in every seven homes in the country was unoccupied, a fact about which there are a number of hypotheses as to the cause12 It has been suggested that it could be the result of de-population in certain parts of the country, especially rural areas, where there is generally more unoccupied housing Miscalculations in the census have also been considered Other possible factors include increased unemployment due to the economic crisis, politics affecting housing construction and the impact of remittances used to build homes owned by people residing abroad
12 Some of these hypotheses were recently tested at the state level in Mexico See Sánchez, Landy and Clara Salazar (2011), "Lo que dicen las viviendas deshabitadas sobre el censo de población 2010 [What Uninhabited Homes Say About the 2010 Popula-tion Census]", in Coyuntura Demográfica [Demographic Circum-stances], no 1, pp 66-72 Online article: http://www somede org/coyuntura-demografica/articulos/sanchez-20111108 pdf

14 Internal Displacement Monitoring Centre | May 2012
In order to determine whether there was a link between unoccupied housing and violence related to organised crime, propensity score matching was used again A link would indicate a process of displacement in which IDPs establish a new residence and abandon their former home regardless of the economic loss In this model, the dependent variable was the change in the ratio of unoccu-pied homes in each municipality between 2005 and 2010 The contrast groups and the variables for the matched sample were the same as in the previous analysis
As seen in the correlation matrix in Annex 1 and as previ-ously established,13 employment, the economic situation, population structure and the education level of the popu-lation have an effect on the number of unoccupied homes at the municipal level, making it necessary to control for this before further analysis
As Table 6 shows, there was a negative change in the proportion of unoccupied homes over the study period, indicating that there were more in both high and low-violence municipalities at the beginning of the study In high-violence municipalities, however, the change was very close to zero, while in low-violence municipalities the proportion of unoccupied homes declined by an average of 0 0166 points The difference of 0 014 is significant, with a p-value of <0 05 14
When propensity score matching was used to control for socio-economic differences, the decline in the proportion of unoccupied homes in the low-violence municipalities of the matched sample is less but still significant, while in their high-violence counterparts the change is negligi-ble The difference between the results of the matched
13 Ibid.14 The p (probability) value is a calculation used to determine if the
results are caused by chance or not, thus providing a measure of the confidence level A p value less than 0 05 is statistically significant, which means that the result is not due to chance
Table 5: Difference in the average proportion of emigrants in high-violence and low-violence municipalities, complete and matched samples*
Variables of Interest
Average Effect Difference t-Statistic SignificanceHigh Violence Low Violence
Complete sample 0 0023 0 000149 0 00218 14 370 0 001Matched sample 0 0023 0 000517 0 00181 4 620 0 001
* The t-statistic or test statistic is a standardised test that comparatively measures the mean (average) values of two samples In the table above, the t-statistic - the proportion of migrants in violent municipalities divided by the proportion of migrants in non-violent municipali-ties - decreases from 14 370 to 4 620 between the complete and matched samples This shows that when other variables or conditions are controlled for (in the matched sample), the average proportion of emigrants decreases but is still 4 5 higher than in the complete sample Source: our own calculations based on the population census, official homicide figures and court statistics from the National Institute of Statistics and Geography (INEGI) 2010
sample is not statistically significant, but still indicates that high-violence municipalities have a persistently high number of unoccupied homes over time, while in their low-violence counterparts the number has decreased, albeit only slightly
This finding indicates that the municipalities’ socio-eco-nomic characteristics - which were adequately controlled for as seen in Annex II, Table 7 - are the cause of the dif-ference in unoccupied housing levels To corroborate this, supplementary models were run15 using the same general technique, but with two different indicators: the relative change in unoccupied housing levels between 2005 and 2010, and the proportion in 2010 These models supported the findings shown in Table 6 - that demographic and socio-economic factors are the cause of changes in un-occupied housing trends in the areas studied
Patterns of displacementThe extent to which the statistical data reveal patterns of displacement is limited to identifying violent states and municipalities which have lost population, and the preferred municipalities of destination for people flee-ing violence More specific surveys are needed to get a clearer picture of displacement patterns
The states of Chihuahua, Durango, Sinaloa and Guerrero have the highest rates of population loss in the country (after the Federal District) and also appear on the list of states with high violence levels Given that many displace-ments take place within states, attention should focus on these four as both areas of origin and destination
Of the most violent municipalities shown on map 5 (where 75 per cent of homicides and crimes in the 12 states ana-lysed take place), roughly 70 per cent have lost population These constitute the main areas of expulsion and should be the focus of further research and response
15 Models not shown

15Forced displacement linked to transnational organised crime in Mexico
The municipalities with the highest violence rates are Tijuana (Baja California), Chihuahua (Chihuahua), Juá-rez (Chihuahua), Monterrey (Nuevo León) and Culiacán (Sinaloa), and they all have negative net migration rates Those leaving generally preferred to go to Culiacán (Si-naloa), Juárez (Chihuahua), Torreón (Coahuila), General Escobedo (Nuevo León) and Tijuana (Baja California) The fact that some of the destinations are themselves violent municipalities might suggest the decision to move was not prompted by violence
The most popular destinations for people leaving the three most violent municipalities (Tijuana, Chihuahua, and Juárez) are Matamoros (Tamaulipas), Tepic (Nayarit) and Alvaro Obregón (Distrito Federal) These were con-sequently chosen to examine vulnerability of people who have recently arrived in comparison to local residents (Section 7 below)
Overall the most popular municipalities of destination for people fleeing violence are Reynosa (Tamaulipas), Tijuana (Baja California), Mexicali (Baja California), Juá-rez (Chihuahua), Hermosillo (Sonora) and Chihuahua (Chihuahua)
The statistical research and the survey conducted in Juá-rez (see next section) both found that the most common pattern of displacement for people leaving the city was to stay within the state, with the municipality of Chihuahua being a popular destination Others went to Durango, Coahuila and Veracruz
Table 6: Change in average proportion of unoccupied homes in high-violence and low-violence municipalities, complete and matched samples
Variables of Interest
Average Effect Difference t-Statistic SignificanceHigh Violence Low Violence
Complete sample -0 0026 -0 0166 0 014028 2 60 0 005Matched sample -0 0026 -0 0121 0 009476 0 93 0 176
Source: our own calculations based on the 2010 population census, the 2005 population count, official homicide figures and court statistics from the National Institute of Statistics and Geography (INEGI) 2010

16 Internal Displacement Monitoring Centre | May 2012
In an effort to gather more detailed information on the impact of violence on displacement, the results of the Third Survey on Citizens’ Perception of Insecurity in Ciu-dad Juárez were analysed The survey was conducted in November 2011 and included a special section on forced internal displacement 16 Ciudad Juárez is a key location because the atmosphere of violence and insecurity there has forced thousands of people to flee Such emigration is unprecedented, given that the city had been growing at a faster rate than the national average (see Table 8)
The survey included specific questions aimed at docu-menting, among other relevant details, the type of crime causing displacement, the assets left behind, the fate of those assets and the type and source of help received during displacement
Multistage stratified probability sampling was used to choose respondents who reflected the city’s social and economic mix A sample size of 2,100 was set, and 1,874 completed questionnaires were received17 The sample size meant that inferences could be made about the city's four geographical zones with a 95 per cent confidence level, a five per cent margin of error and p and q values of 0 5 18
The total number of migrants who fled the city because of violence was estimated based on responses to the following questions: “Did any of your relatives leave (emi-grate from) Ciudad Juárez in 2011 for reasons related to violence and insecurity?” and “How many, and where did they move to?” The respondents were over 18, remained in Juárez and were up to date with their relatives' situation and housing conditions
The survey found that during the first 11 months of 2011, 24,426 people had emigrated from the city as a result of the violence Fifty per cent moved to the US, with many resettling in the neighbouring city of El Paso, Texas Of
16 The Universidad Autónoma de Ciudad Juárez has conducted this survey for the last three years In this year’s survey, specific questions related to displacement were added
17 The main reasons for the non-completion of some surveys – reported by interviewers and field supervisors – were related to the large numbers of unoccupied homes, direct threats made against the interviewers and to the impossibility of gaining ac-cess to certain developments that were closed off and guarded by neighbourhood watch teams
18 As above, note 14 The q values are adjusted p-values found using an optimised approach They also provide a measure of confidence that the results are not due to chance
Case study: Ciudad Juárez
Table 8: Demographic growth rates for Juárez city, Chihuahua state and Mexico nationally, 1960 to 2005
Period Juárez City Chihuahua State
Nationally
1960 - 1970 4 5 2 9 3 41970 - 1980 2 8 2 1 3 21980 - 1990 3 6 2 0 2 01990 - 2000 4 4 2 3 1 82000 - 2005 1 3 1 1 1 0
Source: INEGI, municipal register of statistics, 2000; general popu-lation and housing census, 1990 and 2000; population and housing count, 2005
Table 9: Destination of IDPs who left Ciudad Juárez because of violence and insecurity, 2011
Destination Totals Percentage
Other US cities 7,691 31 5El Paso, Texas (US) 4,517 18 5Durango 2,344 9 6Coahuila 2,295 9 4Veracruz 2,197 9 0Another city in Chihuahua 1,099 4 5Another state in Mexico 4,151 17 0Another country 122 0 5Total 24,416 100.0
Source: CIS-UACJ Survey on Citizens’ Perception of Insecurity in Ciudad Juárez, 2011
those who fled within Mexico, 9 6 per cent moved to Durango, 9 4 per cent to Coahuila and nine per cent to Veracruz (see Table 9)
The findings support data gathered between 2007 and 2009 on migration flows prompted by high levels of in-security and show that IDPs continue to move to the same destinations This is consistent with the behaviour of social groups in that their displacement choices are influenced by existing support networks It is important to note, however, that the amount of time analysed is somewhat short for the observation of any changes in the pattern of population movements

17Forced displacement linked to transnational organised crime in Mexico
Table 10: Type of crime or situation that prompted displacement from Ciudad Juárez in 2011
Crime or Situation Number Percentage
Atmosphere of violence and insecurity 6,348 26 0Extortion 5,860 24 0Theft 2,686 11 0Murder of a relative 2,197 9 0Threat 1,953 8 0I don’t know 1,587 6 5Other 1,343 5 5Loss of job due to business closing 1,465 6 0Kidnapping 977 4 0Total 24,416 100.0
Source: CIS-UACJ Survey on Citizens’ Perception of Insecurity in Ciudad Juárez, EPCIJ- 2011
The main crimes or situations to trigger emigration in 2011 were the atmosphere of violence and insecurity, and extortion (see Table 10) For this indicator, it should be noted that respondents answered not only for relatives who were victims of crime but also for those who decided to move based their awareness of an event As such the figures do not reflect the number of criminal acts

18 Internal Displacement Monitoring Centre | May 2012
In order to collect information about IDPs’ living condi-tions, a matrix of origins and destinations was created for all the high-violence municipalities in the study For each one, the three most common municipalities of destination were established, as shown in Annex 2, Table 11 Indicators were then created to reflect the labour market and work-ing conditions, housing and living conditions and access to health care and education for both migrants and local residents in the destination areas, and comparisons were made between the two
The results are shown in Annex 2, Table 12 Despite the younger age profile of the immigrant population, school attendance was found to lag 10 per cent behind that of local residents This is in part because of a tendency among young immigrants to join the workforce at an earlier age - five per cent more do so as compared with young local residents Lack of opportunity may also be a factor, given that nearly five per cent more immigrants under the age of 24 neither work nor attend school
There was also a significant difference between immi-grants and local residents in terms of home ownership A lower percentage of immigrants were found to own their own home, and a higher percentage to rent or have some other arrangement It may be that they are unable to afford to buy property - whether as a result of costs incurred during their migration or because of difficulty in getting credit - or that they have yet to decide whether or not to settle permanently in the area
No other significant differences were not found, but this could be because the cities were grouped and the as-sumption made that similar processes occurred in all of them when in fact this may not be the case
For this reason, indicators were calculated for emigrants from the three municipalities with the highest number of homicides (Juárez, Tijuana and Chihuahua) who had moved to the most popular low-violence municipalities of destination - and so were most likely to be IDPs (Any decision to migrate from one violent area to another may have had more to do with socio-economic factors than security) Annex 2, Tables 13, 14 and 15 compare the condi-tions of emigrants from Juárez to Matamoros, Tijuana to Tepic, and Chihuahua to the Alvaro Obregón municipality in the Federal District with those of the local populations
Emigrants from Juárez living in Matamoros were found to be more than twice as likely to be unemployed and less
likely to have sufficient access to goods and services or own their own homes The same was true for emigrants from Tijuana living in Tepic, whose unemployment rate is over five per cent This group was also found to differ significantly from local residents in terms of the economic activity of its younger population, which may indicate a greater need to earn income at an early age Emigrants from Chihuahua living in Alvaro Obregón appear to enjoy rather better conditions, probably because the municipal-ity has some of the best economic opportunities in the country
The survey conducted in Ciudad Juárez also revealed that people who flee from violence have protection needs related to their property rights It showed that 72 per cent of IDPs left behind some sort of property, with a house or other type of residence being the most common (64 7 per cent) According to their relatives’ statements, almost a third (32 3 per cent) of those who emigrated in 2011 abandoned their assets, as opposed to selling them or entrusting them to someone else’s care (see Table 5) Given that abandoned homes have deteriorated signifi-cantly and/or have been vandalised throughout the city and especially in the south-east, the need for protection is urgent The vast majority of IDPs who fled Juárez in 2011 (86 5 per cent) received no government help in protecting their property rights
In conclusion, census data and the Juárez survey made it possible to identify four important issues for emigrants from high-violence to low-violence municipalities: 1) they have less access to jobs and the labour market than local residents; 2) their children are less likely stay in school; 3) they have possible difficulties in finding housing and suffer poor access to utilities; and 4) they have property protection needs relating to the homes they left behind when they fled
Vulnerability after displacement: interpreting the data

19Forced displacement linked to transnational organised crime in Mexico
A closer look at vulnerability: qualitative research in three selected locations
In-depth interviews were conducted with IDPs in three locations to complement the information gathered from demographic data They sought to document protection needs, focusing on housing, land and property rights, livelihood opportunities and access to basic necessities of life such as food, shelter and health care As data from previous editions of the Juárez survey showed that most people leaving the area had fled to Coahuila, Du-rango and Veracruz19 these three states were chosen as research sites, along with Chihuahua (where Juárez is located)
An interviewee profile was established beforehand as someone who had left Juárez in the last five years and who had been victim of a crime or threat in the same pe-riod which influenced their decision to flee Researchers’ local contacts were asked to identify potential subjects and check that they fitted the profile The number of interviewees was not set in advance but was determined using the saturation principle, under which the process is stopped when a given interview fails to add any new or relevant information to that gleaned from the previ-ous ones In total, 26 interviews were conducted, seven in Veracruz, nine in Coahuila and ten in Durango Many of the interviewees were not originally from Juárez, but had previously migrated there in search of work This played a role in their decision to leave when confronted with violence
In terms of housing, land and property rights a common pattern emerged The interviews revealed that many IDPs had opted to sell their furniture and cars, but rented their homes, entrusted them to others or as a last resort tem-porarily abandoned them The experience of Fernando in
19 At the end of 2009, a group of people from Veracruz living in Juárez and the surrounding area asked the governor of Veracruz, Fidel Herrera, for support to return because of the violence The state government set up the Programme for the Return of Veracruzanos, which was implemented between March and July 2010 It provided transport home from Juárez, and promised to help them by speeding up registration with the federal social protection scheme Programa Oportunidades, the National Em-ployment Service and the public health system Seguro Popular, and by helping their children enrol at school
Seven flights and 338 overland trips were organised under the programme and as many as 14,000 people were assisted, accord-ing to official figures Interviews and testimonies gathered by local researchers, however, show that many of the pledges were not fulfilled, and that the returnees suffer poverty and discrimination The interviews conducted for this study coincide fully with this finding in terms of access to housing and labour opportunities, but only partially in terms of access to health care and education
Torreón was typical: “I had my car … I had to sell it when I came here, and we only left the store and my wife’s house, which we’re renting out to her niece ” Pablo in Veracruz also had a common story to tell: “I left behind an Infonavit [Institute of the National Fund for Workers’ Housing] house that I had there and had been paying for on a weekly basis … When I came here my wife’s relatives rented it out ”
Interviewees received no special help from authorities to protect their property Genaro in Durango said: “What the government ought to do is provide a little help so that people like me who have lost hope will come back ” Referring to her housing rights, Romana in Veracruz said: “The government should support us … because they’re the ones responsible for this to some extent, and because they’re the ones who manage our tax money ” Lupe in Veracruz said: “They didn’t give me any support What we did was to entrust the house there to someone else and she continues to pay the mortgage … My husband hired a van for the move so we could bring our things … We spent approximately 12,000 or 13,000 pesos [$800 or $900] ”
When asked about the process of integration in their places of refuge and their access to the basic necessi-ties of life, a common response was that family networks played key role in helping IDPs to obtain housing, financial assistance, jobs and economic stability “My husband’s family lives here and we came to live with them ” (Lupe in Veracruz); “I chose this place to live because we had lived here before and it’s where I was born ” (Cata in Coahuila); “I went back because all my family is here I left for a while and went there so I could succeed but then I realised that it was impossible with so much violence ” (Genaro in Durango); “This was my birthplace, and so my roots are here and I have more family here too ” (Marco in Veracruz)
IDPs were found generally to take low-paid, temporary jobs and most had difficulties meeting their basic needs Several interviewees in Veracruz worked as agricultural labour, in contrast to more than a decade of employment in Juárez, where they had been production operators in factories Pablo said: “Now I work in the fields … It took me about two months to find the job ” Manuel said: “Pretty much the only work is in the fields and so that’s where you go … but there was a stretch when work was a little scarce here The very little that there is goes towards putting food on our plates, but it’s very little ” The same was true in Coahuila and Durango, where IDPs entered

20 Internal Displacement Monitoring Centre | May 2012
the labour market through jobs in the cosmetics industry, which is notorious for low pay and a lack of job security and social protection Many work overtime to supplement their income
The majority of IDPs found housing by going to live with close relatives, a further example of the family network providing support Most interviewees, however, said their families needed their own places to live “It wasn’t difficult because we came to live with my husband’s aunt and so there was no need to pay rent, but the house lacked a lot of things … There’s not much room and there’s a lack of privacy ” (Lola in Veracruz); “The house … was very small and had two rooms One was the kitchen, and we lived in a single room with my children and my mother ” (Julia in Coahuila); “I came to live with my parents … [but] the house isn’t big enough … It isn’t a place just for us … I don’t have the things that I’d like ” (Juan in Veracruz)
The interviewees' situation as regards education was more encouraging Displaced parents said they did not have problems enrolling their children in school, prob-ably because the number of school places available in the Mexican education system is generally good “It was no trouble to enrol them in school Because we’re in a village … there’s room in the schools ” (Manuel in Ver-acruz); “I have two children who go to elementary school, and because it’s a small community there aren’t a lot of children and the school always has places available ” (Romana in Veracruz)
In terms of access to medical services, most interviewees relied on the public health insurance scheme Seguro Popular, consultations at the pharmacy chain Farmacias Similares and visits to public health centres “I don’t have any kind of insurance The procedure for Seguro Popular takes too long … we have to go to a private doctor and it costs a lot, like around 150 pesos [$11] plus the medicine ” (Lupe in Veracruz); “God watch over me, but nothing other than Farmacias Similares. It’s the cheapest ” (Cholo in Coahuila); “We go to the Tepatlaxco health centre and they see us and give us a sheet or card for vaccines We also use Seguro Popular, even though they [only] give you appointments after a month or two ” (Pablo in Veracruz) None of the interviewees reported having had access to mental health care
When it came to identity documents, which are needed to obtain credit at some institutions and to access job opportunities, the majority of interviewees said that they had been to the Federal Voting Office after displacement to update their information When proof of residence was required they gave their close relatives’ electricity bills or other similar documents There was no evidence of IDPs facing widespread difficulties in renewing or updating their documentation “I did have a birth certificate, but not
a voting card because I had got it in Juárez … Now I have it again … for the electricity bill I use the one from here where I live with my parents and it hasn’t been a problem ” (Marco in Veracruz); “I had all my papers in order because all the services were set up in my name there … I was the one in charge of the store with my wife and so I had to go back and change everything at the Federal Voting Office, and to get other documents showing that I had no criminal record ” (Fernando in Coahuila)

21Forced displacement linked to transnational organised crime in Mexico
The Mexican government has not explicitly acknowledged that forced internal displacement is taking place as result of drug cartel violence, with one noteworthy exception Following publication of IDMC’s 2010 Global Overview on Internal Displacement, an official at the Ministry of Interior told the Reforma newspaper that such displacement was “a problem that exists in some parts of the country, and we need to work to resolve it” 20 No action, however, has been taken
The government has moved to address displacement in the past, but this has predominantly been in response to that caused by the Zapatista uprising in Chiapas This section will describe and discuss those measures and other initiatives as they could potentially become the foundation for a future response to displacement in gen-eral
The most significant moves have come from the executive branch, and to a lesser extent the legislative branch of government None can be traced back to the judiciary The mandates of some government institutions include assisting victims of forced internal displacement con-sidered members of highly vulnerable groups, but the country lacks a comprehensive and coordinated policy
Efforts to pass federal legislation on displacement have so far failed The recently-enacted law in Chiapas is the first of its kind at state level
Executive branchThe executive branch is known as the Federal Public Administration (Administración Pública Federal, APF) It consists of 18 ministries, the Office of the Attorney General (Procuraduría General de la República), the State Legal Department (Consejería Jurídica del Estado) and autonomous decentralised institutions The following actions have been taken by various APF institutions in response to displacement:
Federal Public Administrationa) Ministry of Foreign Affairs (Secretaría de Relaciones
Exteriores, SRE): Following his 2002 visit to Mexico, Francis Deng, then the UN Special Representative of the Secretary-General for Internally Displaced Persons, gave the government a series of recommendations for attending to IDPs, whose existence was officially
20 http://www reforma com/nacional/articulo/601/1200968/de-fault asp?plazaconsulta=reforma
recognised at this time, albeit only in Chiapas In 2003, Rodolfo Stavenhagen, then the Special Rapporteur on Human Rights and Fundamental Freedoms of Indig-enous People, issued further recommendations after his own visit to Mexico In response, the government promised in 2004 to review IDPs’ situation and look into establishing an office charged with assisting them
Mexico often reiterates its commitment to the UN Guid-ing Principles on Internal Displacement at international forums 21 Ten years after Deng’s visit, however, there has still been no official review of IDPs’ living condi-tions, and no profiling has been done or official statis-tics produced The ministry's October 2011 report on advances and challenges in human rights makes no reference to IDPs except in a footnote mentioning the visits of human rights rapporteurs during the previous administration, which was in power from 2000 to 2006 22 The omission is evidence of the political difficulties the current administration faces in openly acknowledging the consequences of its war against organised crime
b)Ministry of Interior (Secretaría de Gobernación, SEG-OB): SEGOB has more agencies with responsibilities towards displaced communities than any other govern-ment department The current administration, however, has overlooked both the organisations and their man-dates They include the following:
i The Interdepartmental Working Group on Inter-nally Displaced People was created in 2004 as a result of agreements between the government and human rights rapporteurs It is made up of repre-sentatives from SEGOB, the Ministry of Agrarian Reform (Secretaría de la Reforma Agraria, SRA), the Ministry of Defence (Secretaría de Defensa Na-cional, SEDENA), the Ministry of Social Develop-ment (Secretaría de Desarrollo Social, SEDESOL), the Ministry of Environment (Secretaría de Medio Ambiente y Recursos Naturales, SEMARNAT), the Ministry of Foreign Affairs, the Ministry of Health (Secretaría de Salud, SS), the Ministry of Public Education (Secretaría de Educación Pública, SEP), the National Commission for Indigenous Peoples'
21 Typical examples include Mexico’s participation in the 2005 World Summit, where the 156 participating countries reiterated their commitment to the Guiding Principles, and its statements on IDPs' protection at the Organisation of American States
22 The report is available (in Spanish) at: http://www sre gob mx/images/stories/doceventos/2011/octubre/onu061011 pdf
Government response to displacement to date: the basis for a future response

22 Internal Displacement Monitoring Centre | May 2012
Development (Comisión Nacional para el Desarrol-lo de Pueblos Indígenas, CDI), and the Office of the Attorney General Its objectives were to provide IDPs with physical protection, ensure their material well-being, find durable solutions to displacement, develop a legal framework, consult IDPs on all actions and development programmes affecting them, and create a national documentation pro-gramme for them There is no evidence of this group having met regularly since it participated in a forum on IDPs in Tlaxcala in January 2004 It has not taken part in any SEGOB subcommittees, such as those on vulnerable groups and migration, where its ef-forts would have been useful in getting IDPs onto SEGOB's agenda and so presenting the issue to the president
ii The National Commission for the Prevention of Discrimination (Comisión Nacional para Prevenir la Discriminación, CONAPRED) was created by federal act in 2003 and charged with promoting public policies that eradicate discrimination in all settings, including discrimination against IDPs
The commission's first report, for 2004-2005, es-tablished its mandate as “introducing concepts of human rights into the Federal Public Administra-tion’s public policies, with regard to non-discrimi-nation, women’s rights, rights of indigenous people, and rights for children and adolescents, migrants, refugees, and internally displaced persons” 23 Sub-sequent reports, however, have contained nothing on discrimination against IDPs except for two stud-ies, one on internal displacement caused by reli-gious intolerance published in 2007 and the other on policy making to protect IDPs published in 2008 The first was used as a benchmark for CDI’s 2007-2009 programmes, and specifically for its Assist-ance Programme for Displaced Indigenous People (Programa de Atención a Indígenas Desplazados, PAID), which is explained below There is no evi-dence that the second study had any impact Since the appointment of the current commission presi-dent, who took office in 2009, no specific work has been done to protect IDPs’ rights 24
iii The National Population Council (Consejo Nacional de Población, CONAPO) was created in 1974 CO-NAPO's mission is “to regulate issues affecting the population in terms of volume, structure, dynamics
23 http://derechoshumanos-portal segob gob mx/archivos/anexos/Anexos_Primer_Informe/5Cx_CONAPREDfinal pdf
24 Interview with the Adjunct Director of Studies, Legislation and Public Policies Sonia Río Freije, January 2012
and distribution throughout the national territory, with the goal of achieving fair and equitable par-ticipation in the benefits of social and economic development” It is mandated to record and regu-late population movements that influence public order and affect the social fabric of communities
In its report on the implementation of the action plan from the International Conference on Pop-ulation and Development 1994-2009, CONAPO stated that given the lack of a specific legal defi-nition of IDPs, and in recognition of elements of the Mexican constitution, federal legislation on human rights and international instruments such as the Guiding Principles, SEGOB had drafted such a definition in order to standardise concepts within APF25 There is no evidence, however, that it has been disseminated or used In fact, as of 2011 the General Population Law (Ley General de Población) that created CONAPO continued to use the term “internal migration” to describe all popula-tion movements within the country's borders, so failing to differentiate between the reasons behind them CONAPO’s population projections for 2005 to 2050 make no mention of the effect on popula-tion movements of the escalating violence affect-ing a significant portion of the country
iv The National Institute of Statistics and Geography (Instituto Nacional de Estadística, Geografía e In-formática, INEGI) is the country's main institution for documentation and statistics Its entire official data collection system has not, however, integrated any terminology or relevant census questions that could provide information on internal displacement
v The National System for Civil Protection (Sistema Nacional de Protección Civil, SINAPROC) was created to prevent natural disasters and assist and rehabilitate populations endangered or affected by them Its work has mainly been in assisting victims of flooding, earthquakes and droughts, and under the current administration it has been efficient in deploying the armed forces to disaster areas and coordinating government organisations at federal, state and municipal levels This was particularly true in the aftermath of the floods that affected various parts of the country in 2009 and 2010
25 Using the Guiding Principles as a base, the Ministry of the Interior uses the following definition of IDPs: “Any individuals or groups that have been obliged or have been pressured to abandon or flee their places of residence as a result of armed conflicts, religious conflicts, generalised violence, violation of fundamental human rights, construction of infrastructure or natural disasters ” www conapo gob mx/publicaciones/cipd15/Cap09 pdf

23Forced displacement linked to transnational organised crime in Mexico
vi One of the agency's most significant mandates is the protection of housing and infrastructure in disaster areas and the repair of damaged housing Any programme developed to assist IDPs would greatly benefit from close collaboration with SIN-APROC
Decentralised institutionsa) The National Commission for Indigenous Peoples' De-
velopment (Comisión Nacional para el Desarrollo de Pueblos Indígenas, CDI) was created in 2003 to consult on indigenous matters for APF, evaluate government programmes and train federal, state and municipal public servants in order to improve services for the indigenous population
In June 2006, the Assistance Programme for Displaced Indigenous People (PAID) was launched in response to the increased levels of forced internal displacement affecting indigenous communities PAID's objective is to provide indigenous populations displaced by acts of violence, armed conflicts, human rights violations; or religious, political, cultural or ethnic intolerance, with the minimal conditions necessary for material and cultural reproduction in their area of relocation, or area of expul-sion in the case of return This project was viewed from the beginning as a corrective rather than a preventative measure Since its creation, PAID has assisted indig-enous IDPs in 12 municipalities in the states of Chiapas, Nayarit, Hidalgo, Guerrero and Oaxaca
As of December 2010, it had supported 1,306 IDPs with house-building materials (31 5 per cent), urban sites (16 3 per cent) and farmland (5 1 per cent) Of the 467 families that received support and were relocated, 46 per cent were displaced by religious conflicts, 43 8 per cent fled generalised violence and human rights viola-tions and 10 2 per cent were displaced by armed con-flicts 26 PAID has been very beneficial, and has helped to rebuild the social fabric of dozens of families by supporting land acquisition That said, budget cuts in 2010 and 2011 limited its operations and reach The lack of legislation and statistics on internal displacement have also made its work more difficult If the Mexican government were to prioritise it, CDI could play a cen-tral role in supporting indigenous groups displaced by violence related to organised crime
b) The Office for the Victims of Crime (Procuraduría Social de Atención a las Víctimas de Delitos, Províctima) was created by presidential decree in September 2011 Its mission is to coordinate the efforts of various public
26 See CNI Report 2010 (in Spanish) at: http://www cdi gob mx/index php?option=com_docman&task=cat_view&gid=18&limit=5&limitstart=0&order=name&dir=ASC&Itemid=18
bodies in helping and protecting people affected by kid-napping, forced disappearance, homicide, extortion and human trafficking Having established that homicide and extortion are significant drivers of displacement, it has proved of great value
Províctima has a staff of 320 spread throughout the Federal District and in 14 states: Baja California, Chia-pas, Chihuahua, Coahuila, Guanajuato, Guerrero, Jalis-co, Michoacán, Morelos, Nayarit, Nuevo León, Sinaloa, Veracruz and Yucatán The senate has approved around 120 additional positions, which will be filled between February and June of this year
At the time of writing, Províctima had assisted more than 3,500 people face-to-face and a similar number over the phone, and it has taken on the cases of people displaced by one of the five crimes under its mandate In the case of one family displaced from Guerrero to Michoacán it supported the resettlement process, ac-companying them to the appropriate authorities so that they could replace lost documentation, and assisting them in applying for credit to start a new business in their place of refuge It has also helped cases of forced eviction and surrender of property, in which people have been forced by threats and extortion to sign over the deeds to their property or land so it can be appropriated by organised crime groups27
Províctima is mandated to create a specific register for displacement cases, but to date information on the cas-es they have been involved in has not been logged in an organised system There is a degree of uncertainty over the agency's future given the upcoming change in government in December 2012, but the General Law of Protection and Redress for Victims of Human Rights Violations Caused by Violence (Ley General de Protec-ción y Reparación Integral a Víctimas de Violaciones a Derechos Humanos Generados por Violencia) – which was passed on 1 May - will be key to its survival The bill, which was sponsored by civil organisations and the Democratic Revolution Party (Partido de la Revolución Democrática, PRD), enshrines Províctima’s mandate in law, meaning that it should be able to become a key player in protecting and assisting IDPs
c) The 5th Inspection Unit of the National Commission on Human Rights (Comisión Nacional de Derechos Hu-manos) participates in the general complaints process, and is in charge of the Programme for Migrant Assist-ance, the Programme on Offences against Journal-ists and Civil Defenders of Human Rights, and since 2007 the Programme against Human Trafficking It
27 Interview with Irene Herrerías, Special Prosecutor, 24 January 2012

24 Internal Displacement Monitoring Centre | May 2012
took on cases of IDPs for the first time in September 2011 Those suffering forced displacement, however, are not formally recognised as victims and as yet there is no standard protocol for reporting displacement or assisting IDPs
Legislative branchThe first attempts to pass legislation to benefit IDPs took place in 1998 but were unsuccessful Since then, there have been a series of initiatives to reform general laws, draft decrees, order APF institutions to gather informa-tion and present proposals with points of agreement The outcomes are listed below:a) 23 April 1998: Representatives of various parties pro-
posed a general law on IDPs, which was rejected in April 2000 as conceptually vague, and ambiguous in terms of responsibilities and methods for addressing the issue
b) 30 March 2004: PRD representative Emilio Zebadúa presented a draft decree to add a paragraph on the protection of IDPs to Article 4 of the Constitution 28 Because displacement was a local issue to Chiapas at the time, its congress was asked to review the situation and pass legislation on IDPs at the state rather than federal level
c) 11 August 2008: Senator Gloria Lavara Mejía of the Ecol-ogist Green Party (Partido Verde Ecologista) presented a draft decree to reform the General Population Law by including a definition of forced internal displacement to replace the term “internal migration”, which leads to displacement being overlooked or confused with other population movements She also proposed including IDPs as a specific marginalised group in national de-velopment programmes Her proposals were rejected
d) 9 September 2008: Representative Mónica Arriola Gor-dillo of the New Alliance Party (Partido Nueva Alianza) proposed reforming the General Education Law by add-ing a paragraph to Article 32, which would have made it easier for the children of IDPs to enrol in schools in their places of refuge, and enable them to receive credits for studies completed before their displacement 29 Her proposal was not debated
e) 25 October 2010: On behalf of the Minister of Public Security, PRD senators Rubén F Velázquez López and José Luis García Zalvidea called on the president of the National Commission on Human Rights to provide a report on IDPs and the violation of their rights 30 There was no response from the commission
f) 27 July 2011: Representative Claudia Ruiz Massieu of the Institutional Revolutionary Party (Partido Revolu-
28 http://www ordenjuridico gob mx/Publicaciones/CDs2006/CDRefEdo/pdf/REF24 pdf
29 http://sil gobernacion gob mx/Archivos/Documentos/2008/11/asun_2496969_20081104_1225834294 pdf
30 http://sil gobernacion gob mx/Archivos/Documentos/2010/11/asun_2713896_20101126_1290731449 pdf
cionario Institucional) presented a proposal with points of agreement calling for the design and implementation of an IDP policy
g) 23 August 2011: The proposal was brought before the Permanent Commission of Congress It included:
- The design and implementation of a policy to pro-tect IDPs and a proposed solution for them
- A report was requested from the Ministry of Interior on the results of the interdepartmental working group on IDPs
- INEGI and the Ministry of Interior were asked to design uniform indicators and criteria for IDPs for use by federal and state governments and civil society
- The late Interior Secretary Francisco Blake Mora was asked for a report on the implementation of the Guiding Principles
The proposal was approved for inclusion on the agenda, but was not given great priority None of the requests have received a response
At the state level, after 18 years of enduring forced dis-placement, the Chiapas state congress passed legisla-tion on internal displacement (Ley para la Prevención y Atención del Desplazamiento Interno) that incorporates the Guiding Principles and includes various norms rang-ing from prevention to humanitarian assistance The law is the first of its kind in Mexico at any legislative level

25Forced displacement linked to transnational organised crime in Mexico
As this study has shown, both statistical (census) and qualitative data reveal that drug cartel violence is caus-ing internal displacement The evidence has a number of limitations, which are outlined in the next section, but it is strong enough to prompt much more concerted action to address the issue
As set out in the Guiding Principles, national governments have the primary duty and responsibility to protect IDPs and respond to displacement, with international agen-cies playing a subsidiary role This should be particularly true of Mexico, given the country’s significant economic power - it is the world's 14th largest economy in terms of GDP - and its strong institutional capabilities
Despite its strength and resources, however, the Mexican government has not set up mechanisms at the federal level to respond specifically to displacement caused by violence, and the political will to do so appears limited right up to the highest level
In this context, protection agencies should concentrate both on motivating the government to take more robust action on internal displacement, and in the meantime on directing and strengthening its existing capacities to respond Given that the issue of displacement caused by the government's offensive against the drug cartels is a highly sensitive one, the focus of protection agencies should not be the security strategy itself, the political debate about its efficacy or the status of the violence the country is experiencing Rather, it should draw atten-tion to the empirical findings of this study, emphasising that the government's own information (census data) was used to establish elements of them The study’s key findings (see section 4) should be highlighted as a factual point of entry
As described in section 9, all attempts to pass federal legislation on displacement since 1998 have failed The complications associated with political processes at the legislative level suggest the need to pursue a lower-level framework, such as a policy, in order to set up an interim response
Such a policy or framework should:31
1. Be driven and informed by existing normative stand-ards. It should seek to protect IDPs' full range of rights as expressed in the Mexican Constitution and in the various binding international instruments to which Mex-ico is a signatory It should also seek to protect them as set out in the Guiding Principles It should be informed by cross-cutting principles including non-discrimination (both against IDPs as a whole and against specific groups such as women, minorities, children and the elderly), equality before the law, participation and inclu-sion
It should mainstream the definition of internal displace-ment enshrined in the Guiding Principles This definition is incorporated into the one adopted by CONAPO, but it should also be included either in the General Popula-tion Law or in Article 3 of the Migration Law (Ley de Migración), and should be used uniformly throughout the Federal Public Administration
2. Set up a documentation and data-gathering mecha-nism. Conduct studies such as this one to document displacement and IDPs' protection needs, but ultimately only the government is in the position to carry out com-prehensive, sustainable data-gathering at the national level through its own institutions
The inclusion of specific questions in the surveys INEGI uses to gather national statistical information, specifi-cally the 2015 population count and the 2020 census, would do much to help gather information about dis-placement The policy should instruct INEGI to do this
Qualitative profiling of displacement via surveys in the localities identified in this study should also be conduct-ed Ideally, such surveys would be extended nationally This would enable the number of people displaced by violence to be estimated, and their protection needs to be documented in detail Given the cost of such an
31 What follows draws on the standards and benchmarks set out in the Framework for National Responsibility (available at http://www brookings edu/~/media/Files/rc/reports/2005/04_nation-al_responsibility_framework/04_national_responsibility_frame-work_Eng pdf) and the Manual for Law and Policy Makers for the Protection of IDPs (available at http://www brookings edu/~/media/Files/rc/papers/2008/1016_internal_displacement/10_in-ternal_displacement_manual pdf) Both publications should be consulted as guidance
Towards an effective response: a framework for action

26 Internal Displacement Monitoring Centre | May 2012
undertaking, it should be led by the government with technical assistance from relevant international and national agencies
3. Establish an institutional focal point. The Ministry of Interior should take the political lead on displacement, and within it - given its mandate - CONAPO should be the institutional focal point, charged with leading and coordinating the government's response to displace-ment and providing accountability for it
4.Create a forum for institutional coordination. CONAPO should provide leadership in its role as the institutional focal point, but a thematic forum should also be estab-lished to bring all agencies and ministries involved in responding to displacement together The focus should be on the accountability of their actions Such a forum might have a structure and mandate similar to the In-terdepartmental Working Group on Internally Displaced People described in section 9, which has been inactive since 2004
5. Create a mechanism for humanitarian assistance and IDPs' integration. This mechanism should draw on existing structures set up to provide emergency as-sistance, notably SINAPROC As described in section 9, to date the agency has responded specifically (and successfully) to natural disasters, so its mandate would have to be expanded to include assistance to victims of violence, including IDPs
An effective mechanism would also have to include state and local authorities The states on which this study focused, those worst-affected by violence, should be prioritised
6. Create a national federal fund. Such a fund would provide financial support to protection programmes It should be established with an initial lump sum and then subsequently topped up
7. Document abuses and punish perpetrators. Inde-pendent of the normal channels available to prosecute crimes that lead to displacement, Províctima should be charged with registering and documenting cases of abuses against IDPs, and referring them to the ap-propriate judicial authorities for prosecution The 5th Inspection Unit of the National Commission on Human Rights, which currently focuses on human mobility, should expand its work to document cases of displace-ment, and the government should give its recommenda-tions due weight
8. Seek to promote durable solutions. Special attention should be given to the protection gaps identified in this study, notably access to livelihoods, education, health
care and adequate housing, all of which are obstacles to IDPs achieving durable solutions
9. Create channels for cooperation. The government should cooperate with international agencies, drawing on their in-depth experience of providing technical as-sistance and setting up protection programmes world-wide

27Forced displacement linked to transnational organised crime in Mexico
The study and its findings have a number of limitations as result of its timeframe, and the resources and data available:
1) It did not establish IDPs' vulnerability in the 12 states covered, as the available data did not enable it to do so The census data used did not include information on displacement, so an inference was built around in-formation about people who have changed their place of residence This group, however, is likely to include migrants other than IDPs 32
2) It did not determine the current number of people displaced by violence in Mexico, again because the available data did not enable it to do so
3) It did not research cross-border displacement caused by drug cartel violence, as it had neither the time nor the resources to do so
These limitations point to key areas for further work:
1) Surveys should be conducted in specific locations to collect detailed information about the displaced popu-lation's access to services and rights, ideally at the national level
2) As mentioned above, work should be done with INEGI to develop questions targeted specifically at document-ing forced displacement caused by violence for inclu-sion in its data-gathering
3) Research should be conducted into displacement pat-terns to the US, asylum requests and the response of US authorities to people crossing the border as a result of violence in Mexico
32 Note, however, that information on vulnerabilities specific to IDPs was gleaned from census data in three locations, and in more detail from the qualitative part of the research
Study limitations and areas for further work
IDMC would like to thank the consultants who contributed to this study: Laura Rubio of the Instituto Tecnológico Autónomo de México, who coordinated the study in Mex-ico and contributed the section on the government's re-sponse; Edith Gutiérrez and Estela Rivero of the Colegio de México, who designed and conducted the statistical analysis based on census data; Socorro Velásquez and Wilebaldo Martínez, who designed and conducted the survey in Ciudad Juárez and the qualitative research in Durango, Coahuila, and Veracruz The overall planning, design and coordination of the study was done by Se-bastián Albuja of IDMC
IDMC would also like to thank the Joint IDP Profiling Service for its input during the development phase of this study
Acknowledgements

28 Internal Displacement Monitoring Centre | May 2012
Annexes I: Statistical correlations
Homicidios Correlación de Pearson 1 .446(**) 0.063 .084(*) -.166(**) .111(**) .149(**) -.140(**) -.135(**) 0.033 .178(**) -0.003 -.196(**) -.173(**) .176(**) .437(**)
Sig. (bilateral) 0 0.074 0.018 0 0.002 0 0 0 0.352 0 0.929 0 0 0 0 N 797 797 797 797 797 797 797 797 797 797 797 797 797 797 784 797Delitos Correlación de
Pearson .446(**) 1 0.024 .094(**) -.321(**) .116(**) .367(**) -.290(**) -.203(**) 0.059 .371(**) -0.037 -.449(**) -.371(**) .297(**) .668(**) Sig. (bilateral) 0 0.506 0.008 0 0.001 0 0 0 0.095 0 0.303 0 0 0 0 N 797 797 797 797 797 797 797 797 797 797 797 797 797 797 784 797Vivienda deshabitada
Correlación de Pearson 0.063 0.024 1 .346(**) -.085(*) 0.061 0.035 -.145(**) -.163(**) -.238(**) 0.033 -.075(*) 0.045 0.002 .280(**) -0.016
Sig. (bilateral) 0.074 0.506 0 0.016 0.087 0.326 0 0 0 0.348 0.035 0.203 0.954 0 0.653 N 797 797 797 797 797 797 797 797 797 797 797 797 797 797 784 797Cambio vivienda deshabitada
Correlación de Pearson
.084(*) .094(**) .346(**) 1 -0.031 0.024 0.024 0.005 -.148(**) 0.015 0.008 0.065 -0.056 -0.019 0.012 .096(**) Sig. (bilateral) 0.018 0.008 0 0.381 0.498 0.494 0.879 0 0.678 0.816 0.066 0.117 0.587 0.738 0.006 N 797 797 797 797 797 797 797 797 797 797 797 797 797 797 784 797Sector primario Correlación de
Pearson -.166(**) -.321(**) -.085(*) -0.031 1 -.712(**) -.866(**) .756(**) .193(**) 0.004 -.730(**) .234(**) .765(**) .795(**) -.655(**) -.318(**) Sig. (bilateral) 0 0 0.016 0.381 0 0 0 0 0.908 0 0 0 0 0 0 N 797 797 797 797 797 797 797 797 797 797 797 797 797 797 784 797Sector secundario
Correlación de Pearson .111(**) .116(**) 0.061 0.024 -.712(**) 1 .326(**) -.525(**) -.216(**) .128(**) .369(**) -0.024 -.338(**) -.465(**) .416(**) .131(**)
Sig. (bilateral) 0.002 0.001 0.087 0.498 0 0 0 0 0 0 0.496 0 0 0 0 N 797 797 797 797 797 797 797 797 797 797 797 797 797 797 784 797Sector terciario Correlación de
Pearson .149(**) .367(**) 0.035 0.024 -.866(**) .326(**) 1 -.684(**) -.114(**) 0.058 .815(**) -.294(**) -.844(**) -.786(**) .607(**) .348(**) Sig. (bilateral) 0 0 0.326 0.494 0 0 0 0.001 0.1 0 0 0 0 0 0 N 797 797 797 797 797 797 797 797 797 797 797 797 797 797 784 797Ocupados con menos de 2SM
Correlación de Pearson -.140(**) -.290(**) -.145(**) 0.005 .756(**) -.525(**) -.684(**) 1 .162(**) -.251(**) -.546(**) .337(**) .685(**) .764(**) -.783(**) -.302(**)
Sig. (bilateral) 0 0 0 0.879 0 0 0 0 0 0 0 0 0 0 0 N 797 797 797 797 797 797 797 797 797 797 797 797 797 797 784 797Ocupados sin seguridad social
Correlación de Pearson
-.135(**) -.203(**) -.163(**) -.148(**) .193(**) -.216(**) -.114(**) .162(**) 1 0.03 -.238(**) -.148(**) .310(**) .272(**) -.095(**) -.243(**) Sig. (bilateral) 0 0 0 0 0 0 0.001 0 0.392 0 0 0 0 0.008 0 N 797 797 797 797 797 797 797 797 797 797 797 797 797 797 784 797Participación laboral masculina
Correlación de Pearson
0.033 0.059 -.238(**) 0.015 0.004 .128(**) 0.058 -.251(**) 0.03 1 .124(**) -0.065 -.140(**) -.213(**) .164(**) 0.058 Sig. (bilateral) 0.352 0.095 0 0.678 0.908 0 0.1 0 0.392 0 0.065 0 0 0 0.104 N 797 797 797 797 797 797 797 797 797 797 797 797 797 797 784 797Participación laboral femenina
Correlación de Pearson
.178(**) .371(**) 0.033 0.008 -.730(**) .369(**) .815(**) -.546(**) -.238(**) .124(**) 1 -.109(**) -.761(**) -.679(**) .502(**) .339(**) Sig. (bilateral) 0 0 0.348 0.816 0 0 0 0 0 0 0.002 0 0 0 0 N 797 797 797 797 797 797 797 797 797 797 797 797 797 797 784 797Presión demográfica
Correlación de Pearson -0.003 -0.037 -.075(*) 0.065 .234(**) -0.024 -.294(**) .337(**) -.148(**) -0.065 -.109(**) 1 .318(**) .341(**) -.485(**) -.073(*)
Sig. (bilateral) 0.929 0.303 0.035 0.066 0 0.496 0 0 0 0.065 0.002 0 0 0 0.04 N 797 797 797 797 797 797 797 797 797 797 797 797 797 797 784 797Población menor de 15 con secundaria o menos
Correlación de Pearson
-.196(**) -.449(**) 0.045 -0.056 .765(**) -.338(**) -.844(**) .685(**) .310(**) -.140(**) -.761(**) .318(**) 1 .913(**) -.587(**) -.443(**) Sig. (bilateral) 0 0 0.203 0.117 0 0 0 0 0 0 0 0 0 0 0 N 797 797 797 797 797 797 797 797 797 797 797 797 797 797 784 797Población menor de 15 con primaria o menos
Correlación de Pearson
-.173(**) -.371(**) 0.002 -0.019 .795(**) -.465(**) -.786(**) .764(**) .272(**) -.213(**) -.679(**) .341(**) .913(**) 1 -.659(**) -.371(**) Sig. (bilateral) 0 0 0.954 0.587 0 0 0 0 0 0 0 0 0 0 0 N 797 797 797 797 797 797 797 797 797 797 797 797 797 797 784 797Índice de ingresos de los hogares
Correlación de Pearson
.176(**) .297(**) .280(**) 0.012 -.655(**) .416(**) .607(**) -.783(**) -.095(**) .164(**) .502(**) -.485(**) -.587(**) -.659(**) 1 .300(**) Sig. (bilateral) 0 0 0 0.738 0 0 0 0 0.008 0 0 0 0 0 0 N 784 784 784 784 784 784 784 784 784 784 784 784 784 784 784 784Proporción de emigrantes
Correlación de Pearson .437(**) .668(**) -0.016 .096(**) -.318(**) .131(**) .348(**) -.302(**) -.243(**) 0.058 .339(**) -.073(*) -.443(**) -.371(**) .300(**) 1
Sig. (bilateral) 0 0 0.653 0.006 0 0 0 0 0 0.104 0 0.04 0 0 0 N 797 797 797 797 797 797 797 797 797 797 797 797 797 797 784 797
Presión demográfica
Población menor de 15
con secundaria o menos
Población menor de 15
con primaria o menos
Índice de ingresos de los
hogares
Proporción de emigrantes
Anexo 1. Matriz de correlaciones
Sector secundario
Sector terciario Ocupados con menos de 2SM
Ocupados sin seguridad social
Participación laboral
masculina
Participación laboral
femeninaVariables Homicidios Delitos Vivienda
deshabitada
Cambio vivienda
deshabitadaSector primario

29Forced displacement linked to transnational organised crime in Mexico
Homicidios Correlación de Pearson 1 .446(**) 0.063 .084(*) -.166(**) .111(**) .149(**) -.140(**) -.135(**) 0.033 .178(**) -0.003 -.196(**) -.173(**) .176(**) .437(**)
Sig. (bilateral) 0 0.074 0.018 0 0.002 0 0 0 0.352 0 0.929 0 0 0 0 N 797 797 797 797 797 797 797 797 797 797 797 797 797 797 784 797Delitos Correlación de
Pearson .446(**) 1 0.024 .094(**) -.321(**) .116(**) .367(**) -.290(**) -.203(**) 0.059 .371(**) -0.037 -.449(**) -.371(**) .297(**) .668(**) Sig. (bilateral) 0 0.506 0.008 0 0.001 0 0 0 0.095 0 0.303 0 0 0 0 N 797 797 797 797 797 797 797 797 797 797 797 797 797 797 784 797Vivienda deshabitada
Correlación de Pearson 0.063 0.024 1 .346(**) -.085(*) 0.061 0.035 -.145(**) -.163(**) -.238(**) 0.033 -.075(*) 0.045 0.002 .280(**) -0.016
Sig. (bilateral) 0.074 0.506 0 0.016 0.087 0.326 0 0 0 0.348 0.035 0.203 0.954 0 0.653 N 797 797 797 797 797 797 797 797 797 797 797 797 797 797 784 797Cambio vivienda deshabitada
Correlación de Pearson
.084(*) .094(**) .346(**) 1 -0.031 0.024 0.024 0.005 -.148(**) 0.015 0.008 0.065 -0.056 -0.019 0.012 .096(**) Sig. (bilateral) 0.018 0.008 0 0.381 0.498 0.494 0.879 0 0.678 0.816 0.066 0.117 0.587 0.738 0.006 N 797 797 797 797 797 797 797 797 797 797 797 797 797 797 784 797Sector primario Correlación de
Pearson -.166(**) -.321(**) -.085(*) -0.031 1 -.712(**) -.866(**) .756(**) .193(**) 0.004 -.730(**) .234(**) .765(**) .795(**) -.655(**) -.318(**) Sig. (bilateral) 0 0 0.016 0.381 0 0 0 0 0.908 0 0 0 0 0 0 N 797 797 797 797 797 797 797 797 797 797 797 797 797 797 784 797Sector secundario
Correlación de Pearson .111(**) .116(**) 0.061 0.024 -.712(**) 1 .326(**) -.525(**) -.216(**) .128(**) .369(**) -0.024 -.338(**) -.465(**) .416(**) .131(**)
Sig. (bilateral) 0.002 0.001 0.087 0.498 0 0 0 0 0 0 0.496 0 0 0 0 N 797 797 797 797 797 797 797 797 797 797 797 797 797 797 784 797Sector terciario Correlación de
Pearson .149(**) .367(**) 0.035 0.024 -.866(**) .326(**) 1 -.684(**) -.114(**) 0.058 .815(**) -.294(**) -.844(**) -.786(**) .607(**) .348(**) Sig. (bilateral) 0 0 0.326 0.494 0 0 0 0.001 0.1 0 0 0 0 0 0 N 797 797 797 797 797 797 797 797 797 797 797 797 797 797 784 797Ocupados con menos de 2SM
Correlación de Pearson -.140(**) -.290(**) -.145(**) 0.005 .756(**) -.525(**) -.684(**) 1 .162(**) -.251(**) -.546(**) .337(**) .685(**) .764(**) -.783(**) -.302(**)
Sig. (bilateral) 0 0 0 0.879 0 0 0 0 0 0 0 0 0 0 0 N 797 797 797 797 797 797 797 797 797 797 797 797 797 797 784 797Ocupados sin seguridad social
Correlación de Pearson
-.135(**) -.203(**) -.163(**) -.148(**) .193(**) -.216(**) -.114(**) .162(**) 1 0.03 -.238(**) -.148(**) .310(**) .272(**) -.095(**) -.243(**) Sig. (bilateral) 0 0 0 0 0 0 0.001 0 0.392 0 0 0 0 0.008 0 N 797 797 797 797 797 797 797 797 797 797 797 797 797 797 784 797Participación laboral masculina
Correlación de Pearson
0.033 0.059 -.238(**) 0.015 0.004 .128(**) 0.058 -.251(**) 0.03 1 .124(**) -0.065 -.140(**) -.213(**) .164(**) 0.058 Sig. (bilateral) 0.352 0.095 0 0.678 0.908 0 0.1 0 0.392 0 0.065 0 0 0 0.104 N 797 797 797 797 797 797 797 797 797 797 797 797 797 797 784 797Participación laboral femenina
Correlación de Pearson
.178(**) .371(**) 0.033 0.008 -.730(**) .369(**) .815(**) -.546(**) -.238(**) .124(**) 1 -.109(**) -.761(**) -.679(**) .502(**) .339(**) Sig. (bilateral) 0 0 0.348 0.816 0 0 0 0 0 0 0.002 0 0 0 0 N 797 797 797 797 797 797 797 797 797 797 797 797 797 797 784 797Presión demográfica
Correlación de Pearson -0.003 -0.037 -.075(*) 0.065 .234(**) -0.024 -.294(**) .337(**) -.148(**) -0.065 -.109(**) 1 .318(**) .341(**) -.485(**) -.073(*)
Sig. (bilateral) 0.929 0.303 0.035 0.066 0 0.496 0 0 0 0.065 0.002 0 0 0 0.04 N 797 797 797 797 797 797 797 797 797 797 797 797 797 797 784 797Población menor de 15 con secundaria o menos
Correlación de Pearson
-.196(**) -.449(**) 0.045 -0.056 .765(**) -.338(**) -.844(**) .685(**) .310(**) -.140(**) -.761(**) .318(**) 1 .913(**) -.587(**) -.443(**) Sig. (bilateral) 0 0 0.203 0.117 0 0 0 0 0 0 0 0 0 0 0 N 797 797 797 797 797 797 797 797 797 797 797 797 797 797 784 797Población menor de 15 con primaria o menos
Correlación de Pearson
-.173(**) -.371(**) 0.002 -0.019 .795(**) -.465(**) -.786(**) .764(**) .272(**) -.213(**) -.679(**) .341(**) .913(**) 1 -.659(**) -.371(**) Sig. (bilateral) 0 0 0.954 0.587 0 0 0 0 0 0 0 0 0 0 0 N 797 797 797 797 797 797 797 797 797 797 797 797 797 797 784 797Índice de ingresos de los hogares
Correlación de Pearson
.176(**) .297(**) .280(**) 0.012 -.655(**) .416(**) .607(**) -.783(**) -.095(**) .164(**) .502(**) -.485(**) -.587(**) -.659(**) 1 .300(**) Sig. (bilateral) 0 0 0 0.738 0 0 0 0 0.008 0 0 0 0 0 0 N 784 784 784 784 784 784 784 784 784 784 784 784 784 784 784 784Proporción de emigrantes
Correlación de Pearson .437(**) .668(**) -0.016 .096(**) -.318(**) .131(**) .348(**) -.302(**) -.243(**) 0.058 .339(**) -.073(*) -.443(**) -.371(**) .300(**) 1
Sig. (bilateral) 0 0 0.653 0.006 0 0 0 0 0 0.104 0 0.04 0 0 0 N 797 797 797 797 797 797 797 797 797 797 797 797 797 797 784 797
Presión demográfica
Población menor de 15
con secundaria o menos
Población menor de 15
con primaria o menos
Índice de ingresos de los
hogares
Proporción de emigrantes
Anexo 1. Matriz de correlaciones
Sector secundario
Sector terciario Ocupados con menos de 2SM
Ocupados sin seguridad social
Participación laboral
masculina
Participación laboral
femeninaVariables Homicidios Delitos Vivienda
deshabitada
Cambio vivienda
deshabitadaSector primario

30 Internal Displacement Monitoring Centre | May 2012
Annexes II: Tables
Table 1. Cities with High Rates of Homicides or Other Crimes, Mexico 2010
State City Homicides Crimes SMNBaja California Ensenada 0 003 0 010 0 043Baja California Mexicali 0 005 0 015 0 006Baja California Tecate 0 001 0 003 0 035Baja California Tijuana 0 049 0 015 -0 001Coahuila Saltillo 0 001 0 002 -0 008Coahuila Torreón 0 011 0 003 -0 001Chihuahua Ascensión 0 002 0 000 -0 009Chihuahua Camargo 0 003 0 001 -0 015Chihuahua Cuauhtémoc 0 004 0 001 0 030Chihuahua Chihuahua 0 043 0 005 -0 001Chihuahua Delicias 0 003 0 001 0 018Chihuahua Guachochi 0 003 0 000 -0 031Chihuahua Guadalupe 0 002 0 000 -0 049Chihuahua Guadalupe y Calvo 0 005 0 000 -0 023Chihuahua Hidalgo del Parral 0 005 0 000 -0 022Chihuahua Jiménez 0 002 0 000 0 027Chihuahua Juárez 0 146 0 008 -0 023Chihuahua Meoqui 0 003 0 000 0 008Chihuahua Nuevo Casas Grandes 0 002 0 000 0 001Chihuahua Urique 0 002 0 000 -0 011Durango Durango 0 011 0 001 -0 010Durango Gómez Palacio 0 011 0 003 0 006Durango Lerdo 0 003 0 001 0 034Durango Pueblo Nuevo 0 003 0 000 -0 042Durango Santiago Papasquiaro 0 004 0 000 -0 023Guerrero Acapulco de Juárez 0 018 0 007 -0 025Guerrero Ayutla de los Libres 0 002 0 000 -0 041Guerrero Coyuca de Catalán 0 002 0 001 0 000Guerrero Chilapa de Álvarez 0 001 0 001 -0 025Guerrero Chilpancingo de los Bravo 0 004 0 005 -0 025Guerrero Iguala de la Independencia 0 002 0 001 0 031Guerrero Zihuatanejo de Azueta 0 001 0 001 0 012Guerrero Ometepec 0 001 0 002 -0 013Guerrero Pungarabato 0 002 0 000 -0 064Guerrero Taxco de Alarcón 0 001 0 003 -0 014Guerrero Tecpan de Galeana 0 002 0 000 -0 023Michoacán Apatzingán 0 003 0 001 -0 036

31Forced displacement linked to transnational organised crime in Mexico
Michoacán Maravatío 0 000 0 001 0 017Michoacán Morelia 0 003 0 007 -0 015Michoacán Paracho 0 000 0 001 -0 002Michoacán Tacámbaro 0 000 0 001 -0 013Michoacán Uruapan 0 003 0 003 -0 003Nuevo León San Pedro Garza García 0 001 0 001 -0 046Nuevo León Gral Escobedo 0 001 0 001 0 133Nuevo León Guadalupe 0 002 0 002 -0 107Nuevo León Juárez 0 004 0 000 0 429Nuevo León Monterrey 0 013 0 013 -0 138Nuevo León San Nicolás de los Garza 0 001 0 001 -0 127Nuevo León Santa Catarina 0 001 0 001 -0 055Nuevo León Santiago 0 001 0 001 0 011San Luis Potosí Ciudad Valles 0 003 0 002 -0 006San Luis Potosí Rioverde 0 001 0 001 -0 024San Luis Potosí San Luis Potosí 0 005 0 008 -0 020Sinaloa Ahome 0 010 0 004 -0 011Sinaloa Angostura 0 002 0 002 0 010Sinaloa Badiraguato 0 001 0 001 -0 054Sinaloa Culiacán 0 031 0 015 -0 010Sinaloa El Fuerte 0 004 0 006 0 003Sinaloa Guasave 0 005 0 005 -0 007Sinaloa Mazatlán 0 015 0 002 0 003Sinaloa Mocorito 0 002 0 001 -0 033Sinaloa Salvador Alvarado 0 003 0 002 0 002Sinaloa Sinaloa 0 004 0 002 -0 093Sinaloa Navolato 0 008 0 001 -0 013Sonora Agua Prieta 0 001 0 003 0 017Sonora Caborca 0 001 0 002 0 006Sonora Cajeme 0 003 0 004 0 001Sonora Etchojoa 0 000 0 001 -0 010Sonora Guaymas 0 001 0 002 0 009Sonora Hermosillo 0 003 0 007 0 019Sonora Navojoa 0 001 0 002 -0 011Sonora Nogales 0 009 0 001 -0 026Sonora San Luis Río Colorado 0 001 0 002 0 022Tamaulipas Aldama 0 000 0 001 -0 020Tamaulipas El Mante 0 001 0 001 -0 019Tamaulipas Matamoros 0 004 0 009 -0 012Tamaulipas Miguel Alemán 0 002 0 001 -0 025Tamaulipas Nuevo Laredo 0 006 0 015 0 002Tamaulipas Reynosa 0 003 0 012 0 057Tamaulipas Río Bravo 0 000 0 002 0 013Tamaulipas San Fernando 0 004 0 002 -0 044

32 Internal Displacement Monitoring Centre | May 2012
Tamaulipas Tampico 0 003 0 003 -0 100Tamaulipas Valle Hermoso 0 002 0 001 -0 008Tamaulipas Victoria 0 002 0 005 0 011Veracruz Acayucan 0 000 0 002 -0 073Veracruz Alvarado 0 000 0 001 -0 054Veracruz Boca del Río 0 000 0 001 0 033Veracruz Coatzacoalcos 0 000 0 003 -0 013Veracruz Xalapa 0 001 0 006 -0 014Veracruz Martínez de la Torre 0 000 0 001 -0 021Veracruz Orizaba 0 000 0 004 -0 094Veracruz Pánuco 0 001 0 003 0 005Veracruz Papantla 0 000 0 002 -0 008Veracruz Perote 0 000 0 001 -0 012Veracruz Poza Rica de Hidalgo 0 001 0 002 -0 041Veracruz San Andrés Tuxtla 0 000 0 003 -0 006Veracruz Sayula de Alemán 0 000 0 002 -0 012Veracruz Soteapan 0 000 0 001 0 005Veracruz José Azueta 0 000 0 001 -0 024Veracruz Tierra Blanca 0 000 0 001 -0 005Veracruz Tihuatlán 0 000 0 001 0 028Veracruz Tlapacoyan 0 000 0 001 -0 005Veracruz Tuxpan 0 001 0 003 -0 006Veracruz Ursulo Galván 0 000 0 001 -0 022Veracruz Veracruz 0 001 0 004 -0 051
Source: Our own calculations based on the 2010 population census, official death reports and court statistics, INEGI 2010

33Forced displacement linked to transnational organised crime in Mexico
Table 3. Description and Sources of Information on the Variables Factored Into the Analysis
Aspects of Analysis Variables Description Source
Violence
Homicides Proportion of homicides reported in 2010 that was committed in the area, compared to the total number in the country
INEGI mortality statistics
Other Crimes Proportion of crimes reported in 2010 that were committed in the area, compared to the total number in the country
INEGI court statistics
Socioeconomic Conditions
Employment prospects Proportion of workers between 25 and 64 years of age according to gender
2010 population census, INEGI
Industry sector Proportion of workers per economic sector (primary, secondary, tertiary)
2010 population census, INEGI
Working conditions Proportion of workers with and without social security Proportion of workers earning less than 2 SM
2010 population census, INEGI
Economic aituation Index of household incomes Proportion of the population over 15 years of age with an elementary school education or less
IDH 2000, PNUD
Education opportunities Proportion of the population over 15 years of age with a middle school education or less
2010 population census, INEGI
Demographic Conditions
Demographic pressure Proportion of the population between 14 and 25 years of age compared to the population between 45 and 64
2010 population census, INEGI
Internal Migration
Emigration Proportion of the population that lived in a different city in 2005 than in 2010
2010 population census, INEGI
Net migration rate Difference between the proportion of immigrants and emigrants
2010 population census, INEGI
Unoccupied housing Proportion of unoccupied homes compared to the total number of homes recorded (2005 and 2010) Difference between the proportions of unoccupied homes in 2005 and 2010 (relative and absolute)
2010 population census and 2005 population count, INEGI
Source: Our own calculations based on the sources cited in the table

34 Internal Displacement Monitoring Centre | May 2012
Table 4. Differences in the Characteristics of High-Violence and Low-Violence Cities in the Complete Samples and Matched Samples
Relevant Variables Average Effect Significance
High Violence Low Violence
Population in primary sector Complete sample 0 1754 0 38688 0 000 Matched sample 0 1754 0 16654 0 711
Population in secondary sector Complete sample 0 2268 0 19737 0 003 Matched sample 0 2268 0 23438 0 481Population in tertiary sector Complete sample 0 5362 0 35061 0 000 Matched sample 0 5362 0 53795 0 928Population with low work income Complete sample 0 4057 0 58014 0 000 Matched sample 0 4057 0 42285 0 443Population without social security
Complete sample 0 3134 0 38908 0 000 Matched sample 0 3134 0 31691 0 808
Work situation for men Complete sample 0 4094 0 40095 0 053 Matched sample 0 4094 0 40267 0 076Work situation for women Complete sample 0 2099 0 13688 0 000 Matched sample 0 2099 0 21144 0 848Demographic pressure Complete sample 1 1383 1 1577 0 555 Matched sample 1 1383 1 1596 0 594Population over 15 years old with a middle school education or less
Complete sample 0 6517 0 8007 0 000 Matched sample 0 6517 0 6407 0 537
Population over 15 years old with an elementary school education or less Complete sample 0 3833 0 54372 0 000 Matched sample 0 3833 0 38259 0 971Economic situation of households Complete sample 0 7150 0 62819 0 000 Matched sample 0 7150 0 69838 0 102
Source: Our own calculations based on the 2010 population census, official death reports and court statistics, INEGI 2010

35Forced displacement linked to transnational organised crime in Mexico
Table 7. Differences in the Characteristics of High-Violence and Low-Violence Cities in the Complete Samples and Matched Samples
Relevant Variables Average Effect Significance
High Violence
Low Violence
Population in primary sector Complete sample 0 1754 0 3869 0 000 Matched sample 0 1754 0 1665 0 711Population in secondary sector
Complete sample 0 2268 0 1974 0 003Matched sample 0 2268 0 2344 0 481
Population in tertiary sector Complete sample 0 5362 0 3506 0 000Matched sample 0 5362 0 5380 0 928
Population with low work income Complete sample 0 4057 0 5801 0 000Matched sample 0 4057 0 4229 0 443
Population without social security Complete sample 0 3134 0 3891 0 000Matched sample 0 3134 0 3169 0 808
Work situation for men Complete sample 0 4094 0 4010 0 053Matched sample 0 4094 0 4027 0 076
Work situation for women Complete sample 0 2099 0 1369 0 000Matched sample 0 2099 0 2114 0 848
Demographic pressure Complete sample 1 1383 1 1577 0 555Matched sample 1 1383 1 1596 0 594
Population over 15 years old with a middle school education or less
Complete sample 0 6517 0 8007 0 000Matched sample 0 6517 0 6407 0 537
Population over 15 years old with an elementary school education or less
Complete sample 0 3833 0 5437 0 000Matched sample 0 3833 0 3826 0 971
Economic situation of households Complete sample 0 7150 0 6282 0 000
Matched sample 0 7150 0 6984 0 102
Source: Our own calculations based on the 2010 population census, the 2005 population count, official death reports and court statistics, INEGI 2010

36 Internal Displacement Monitoring Centre | May 2012
Table 11. Matrix of Origins and DestinationsOrigin First Destination Second Destination Third DestinationEnsenada Tijuana Mexicali GuasaveMexicali Ensenada Tijuana San Luis Rio ColoradoTecate Mexicali Tijuana Naucalpan de JuárezTijuana Culiacán Playas De Rosarito EnsenadaSaltillo Ramos Arizpe Monclova ApodacaTorreón Gómez Palacio Juárez LerdoAscensión Nuevo Casas Grandes Juárez MuzquizCamargo Chihuahua Delicias JuárezCuauhtemoc Chihuahua Azcapotzalco JuárezChihuahua Juárez Cuauhtemoc DeliciasDelicias Juárez Chihuahua MéridaGuachochi Chihuahua Juárez CuauhtemocGuadalupe Gómez Palacio Culiacán TlahualiloGuadalupe Y Calvo Chihuahua Hidalgo del Parral DeliciasHidalgo Del Parral Chihuahua Juárez TijuanaJiménez Juárez Chihuahua Playas de RosaritoJuárez Torreón Durango Gómez PalacioMeoqui Delicias Apodaca RosalesNuevo Casas Grandes Cajéeme Juárez GuasaveUrique Guerrero Cuauhtemoc ChihuahuaDurango Juárez Gómez Palacio TorreónGómez Palacio Lerdo Torreón JuárezLerdo Gómez Palacio Torreón JuárezPueblo Nuevo Mazatlán Durango ZapopanSantiago Papasquiaro Durango Culiacán JuárezAcapulco de Juárez Los Cabos Tijuana Benito JuárezAyutla de Los Libres Morelia Acapulco de Juárez JiutepecCoyuca de Catalán Ixtapaluca Mulege Lázaro CárdenasChilapa de Álvarez Los Cabos Acapulco de Juárez HermosilloChilpancingo de Los Bravo Acapulco de Juárez Ecatepec de Morelos CuernavacaIguala de La Independencia Huitzuco de Los Figueroa Puerto Vallarta ColimaJosé Azueta Acapulco de Juárez Morelia Los CabosOmetepec Acapulco de Juárez Culiacán CuajinicuilapaPungarabato Santa Catarina Acapulco de Juárez Chilpancingo de Los BravoTaxco de Alarcón Acapulco de Juárez Temixco CozumelTecpan de Galeana Naucalpan de Juárez José Azueta Acapulco de JuárezApatzingán Mexicali Uruapan Lázaro CárdenasMaravatio Morelia Cuautla TarandacuaoMorelia Tarimbaro Uruapan LeónParacho Morelia Tijuana UruapanTacambaro Morelia Azcapotzalco La PazUruapan Morelia Tijuana Zapopan
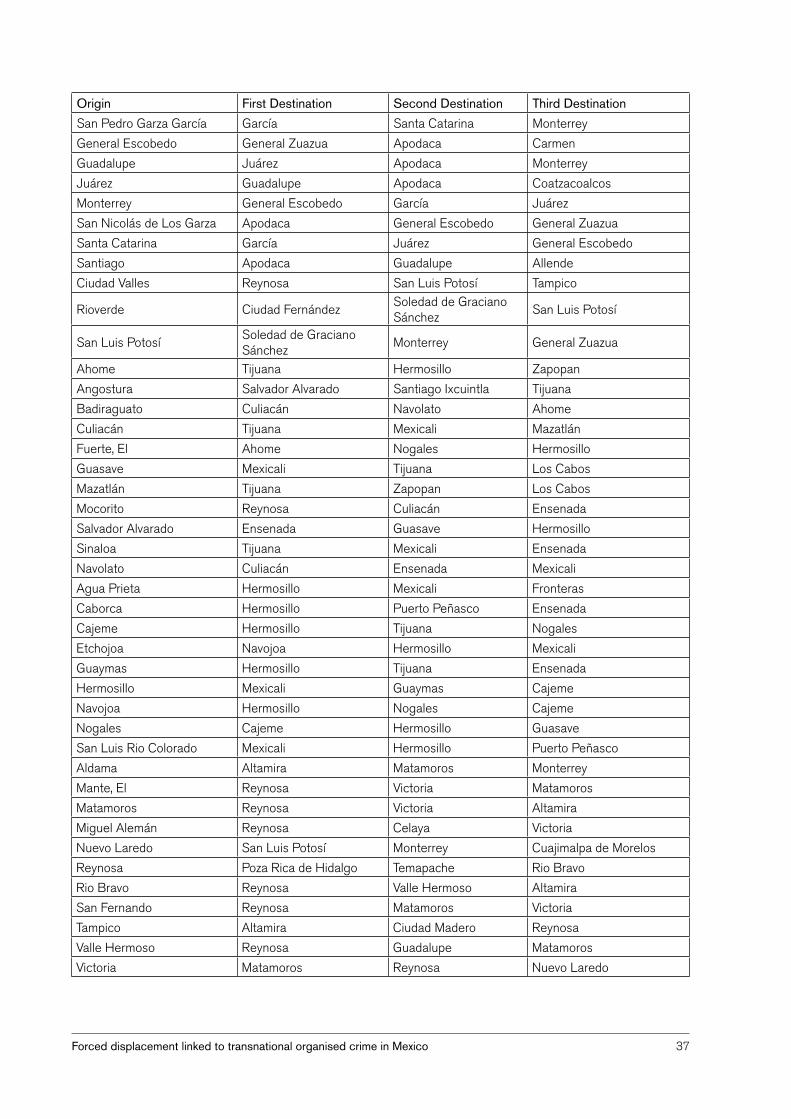
37Forced displacement linked to transnational organised crime in Mexico
Origin First Destination Second Destination Third DestinationSan Pedro Garza García García Santa Catarina MonterreyGeneral Escobedo General Zuazua Apodaca CarmenGuadalupe Juárez Apodaca MonterreyJuárez Guadalupe Apodaca CoatzacoalcosMonterrey General Escobedo García JuárezSan Nicolás de Los Garza Apodaca General Escobedo General ZuazuaSanta Catarina García Juárez General EscobedoSantiago Apodaca Guadalupe AllendeCiudad Valles Reynosa San Luis Potosí Tampico
Rioverde Ciudad Fernández Soledad de Graciano Sánchez San Luis Potosí
San Luis Potosí Soledad de Graciano Sánchez Monterrey General Zuazua
Ahome Tijuana Hermosillo ZapopanAngostura Salvador Alvarado Santiago Ixcuintla TijuanaBadiraguato Culiacán Navolato AhomeCuliacán Tijuana Mexicali MazatlánFuerte, El Ahome Nogales HermosilloGuasave Mexicali Tijuana Los CabosMazatlán Tijuana Zapopan Los CabosMocorito Reynosa Culiacán EnsenadaSalvador Alvarado Ensenada Guasave HermosilloSinaloa Tijuana Mexicali EnsenadaNavolato Culiacán Ensenada MexicaliAgua Prieta Hermosillo Mexicali FronterasCaborca Hermosillo Puerto Peñasco EnsenadaCajeme Hermosillo Tijuana NogalesEtchojoa Navojoa Hermosillo MexicaliGuaymas Hermosillo Tijuana EnsenadaHermosillo Mexicali Guaymas CajemeNavojoa Hermosillo Nogales CajemeNogales Cajeme Hermosillo GuasaveSan Luis Rio Colorado Mexicali Hermosillo Puerto PeñascoAldama Altamira Matamoros MonterreyMante, El Reynosa Victoria MatamorosMatamoros Reynosa Victoria AltamiraMiguel Alemán Reynosa Celaya VictoriaNuevo Laredo San Luis Potosí Monterrey Cuajimalpa de MorelosReynosa Poza Rica de Hidalgo Temapache Rio BravoRio Bravo Reynosa Valle Hermoso AltamiraSan Fernando Reynosa Matamoros VictoriaTampico Altamira Ciudad Madero ReynosaValle Hermoso Reynosa Guadalupe MatamorosVictoria Matamoros Reynosa Nuevo Laredo

38 Internal Displacement Monitoring Centre | May 2012
Origin First Destination Second Destination Third DestinationAcayucan Soconusco Oluta ReynosaAlvarado Tijuana Boca Del Rio VeracruzBoca del Rio Medellín Veracruz PueblaCoatzacoalcos Xalapa Centro Benito JuárezXalapa Emiliano Zapata Banderilla TlalnelhuayocanMartínez de La Torre Atzalán Matamoros ReynosaOrizaba Ixhuatlancillo Mariano Escobedo IxtaczoquitlanPanuco Tampico Altamira MatamorosPapantla Reynosa Xalapa Poza Rica de HidalgoPerote Xalapa Iztapalapa TláhuacPoza Rica de Hidalgo Reynosa Coatzintla TihuatlanSan Andrés Tuxtla Benito Juárez García CatemacoSayula de Alemán San Juan Evangelista Puebla Benito JuárezSoteapan Zapopan Catemaco HidalgotitlanJosé Azueta Loma Bonita Isla Gustavo A Madero
Tierra Blanca San Juan Bautista Tuxtepec Boca del Rio Tijuana
Tihuatlan Reynosa Coatzintla Poza Rica de HidalgoTlapacoyan Xalapa Martínez de La Torre AtzalánTuxpam Reynosa Xalapa TampicoUrsulo Galván Xalapa Tijuana Puente NacionalVeracruz Medellín Boca Del Rio Xalapa

39Forced displacement linked to transnational organised crime in Mexico
Table 12. Living Conditions of the Population in the Three Main Areas of Destination of Emigrants of High-Violence Cities in the Region Studied, According to Migration Status and Various Sociodemographic Characteristics
Relevant Variables Immigrants ResidentsAge structure
0 to 14 years old 63 6 20 2 15 to 29 years old 16 6 28 4 30 to 64 years old 18 4 44 3 65 or older 1 3 7 0
Work situation Employment status
Employed 95 6 95 2Unemployed 4 4 4 8
Industry sector Primary sector 3 8 4 1Secondary sector 27 6 26 2Tertiary sector 68 6 69 7
Access to health care Eligibility for health care services
Private practices 3 7 3 3Public institutions 47 9 52 5Seguro popular [national health insurance] 16 1 13 2Other services 1 8 2 0No access to services 30 5 29 0
Access to education School attendance and employment (5 to 24 years old)
Attends school 60 0 70 7Does not attend school; is employed 20 6 15 5Does not attend school; is seeking employment 1 6 1 8Does not attend school; is not seeking employment 14 6 11 3
Access to housing Construction quality
Low 0 9 0 7Average 7 9 6 1High 43 6 44 3Very high 47 6 48 9
Level of assets and services None 1 3 0 9Very low 5 2 3 5Low 12 7 10 3Average - low 26 0 25 2Average - high 23 6 22 6High 10 7 11 5Very high 20 4 26 1
Home ownership Inhabitant owns the home 61 6 79 5Inhabitant leases the home 26 5 12 3
Other arrangement 10 3 7 7
Source: Our own calculations based on the 2010 population census, INEGI 2010

40 Internal Displacement Monitoring Centre | May 2012
Table 13. Living Conditions of Migrants from Ciudad Juárez to Matamoros Compared to Residents, According to Various Sociodemographic Characteristics
Relevant Variables Immigrants Residents
Age structure 0 a 14 years old 31 1 25 5 15 a 29 years old 34 9 28 4 30 a 64 years old 32 3 40 6 65 or older 1 7 5 5Work situation
Employment status Employed 92 1 96 9Unemployed 7 9 3 1
Industry sector Primary sector 6 9 10 6Secondary sector 15 3 10 6Tertiary sector 14 9 17 0
Access to health care Eligibility for health care services
Private practices 1 4 1 1Public institutions 43 7 53 5Seguro popular [national health insurance] 10 5 12 5Other services 18 2 6 2No access to services 26 2 26 5
Access to education School attendance and employment (5 to 24 years old)
Attends school 64 5 66 1Does not attend school; is employed 12 5 16 2Does not attend school; is seeking employment 3 4 0 9
Does not attend school; is not seeking employment 16 7 16 2
Access to housing Construction quality
Low 0 0 0 0Average 0 0 1 3High 32 7 7 4Very high 67 3 91 3
Level of assets and services None 0 0 0 7Very low 34 3 3 4Low 27 0 13 2Average - low 28 0 33 7Average - high 1 7 31 4High 7 2 8 5Very high 1 7 9 2
Home ownership Inhabitant owns the home 57 3 87 4Inhabitant leases the home 6 9 4 6
Other arrangement 35 8 7 7
Source: Our own calculations based on the 2010 population census, INEGI 2010

41Forced displacement linked to transnational organised crime in Mexico
Table 14. Living Conditions of Migrants from Tijuana to Tepic Compared to Residents, According to Various Sociodemographic Characteristics
Relevant Variables Immigrants ResidentsAge structure 0 to 14 years old 11 0 20 8 15 to 29 years old 37 0 28 9 30 to 64 years old 46 8 42 1 65 or older 5 3 8 3Work situation
Employment status Employed 94 3 96 8Unemployed 5 7 3 2
Industry sector Primary sector 1 8 2 6Secondary sector 13 9 8 9Tertiary sector 53 8 35 0
Access to health care Eligibility for health care services
Private practices 0 3 0 8Public institutions 64 5 63 2Seguro popular [national health insurance] 7 3 15 1Other services 6 8 0 8No access to services 21 0 20 0
Access to education School attendance and employment (5 to 24 years old)
Attends school 50 6 74 0Does not attend school; is employed 34 8 15 0Does not attend school; is seeking employment 7 3 1 3
Does not attend school; is not seeking employment 7 3 9 7
Access to housing Construction quality
Low 0 0 0 0Average 0 0 0 3High 10 4 4 4Very high 89 6 95 3
Level of assets and services None 1 4 0 6Very low 0 3 2 9Low 19 2 10 6Average - low 14 0 19 8Average - high 25 0 24 5High 20 4 12 8Very high 19 8 28 9
Home ownership Inhabitant owns the home 64 5 78 9Inhabitant leases the home 26 3 12 7
Other arrangement 9 2 8 4
Source: Our own calculations based on the 2010 population census, INEGI 2010

42 Internal Displacement Monitoring Centre | May 2012
Table 15. Living Conditions of Migrants from Chihuahua to the Álvaro Obregón Development Compared to Residents, According to Various Sociodemographic Characteristics
Relevant Variables Immigrants ResidentsAge structure 0 to 14 years old 36 3 16 0 15 to 29 years old 39 6 27 4 30 to 64 years old 24 2 48 4 65 or older 0 0 8 2Work situation
Employment status Employed 100 0 95 7Unemployed 0 0 4 3
Industry sector Primary sector 0 0 0 1Secondary sector 19 8 8 5Tertiary sector 12 1 37 9
Access to health care Eligibility for health care services
Private practices 60 4 5 3Public institutions 39 6 49 1Seguro popular [national health insurance] 0 0 10 5Other services 0 0 3 9No access to services 0 0 30 8
Access to education School attendance and employment (5 to 24 years old)
Attends school 100 0 71 9Does not attend school; is employed 0 0 14 8Does not attend school; is seeking employment 0 0 1 8
Does not attend school; is not seeking employment 0 0 10 7
Access to housing Construction quality
Low 0 0 0 0Average 0 0 0 1High 0 0 5 0Very high 100 0 94 9
Level of assets and services None 0 0 0 2Very low 0 0 2 7Low 0 0 8 0Average - low 0 0 25 7Average - high 0 0 18 0High 0 0 13 8Very high 100 0 31 5
Home ownership Inhabitant owns the home 60 4 72 8
Inhabitant leases the home 39 6 14 8 Other arrangement 0 0 11 4
Source: Our own calculations based on the 2010 population census, INEGI 2010