Embed Size (px)
Citation preview

CARNEGIE MELLON
Force Display for a NeurosurgicalProbe-Guide
Brian Bankler
1995

Force Display for a NeurosurgicalProbe-Guide
Brian Bankler
1995
Advisor: Prof. Khosla

Force Display for a NeurosurgicalProbe-Guide
by
B. Bankler
Submitted in partial fulfillment of the requirements
for the Degree of Master of Science
Department of Electrical and Computer Engineering
Carnegie Mellon University
Pittsburgh, Pennsylvania 15213
January 1995
Force Display for a NeurosurgicalProbe-Guide
by
B. BanNer
Submitted to the Department of Electrical and Computer Engineering in partialfulfillment of the requirements for the Degree of Master of Science in Electrical and
Computer Engineering at Carnegie Mellon University
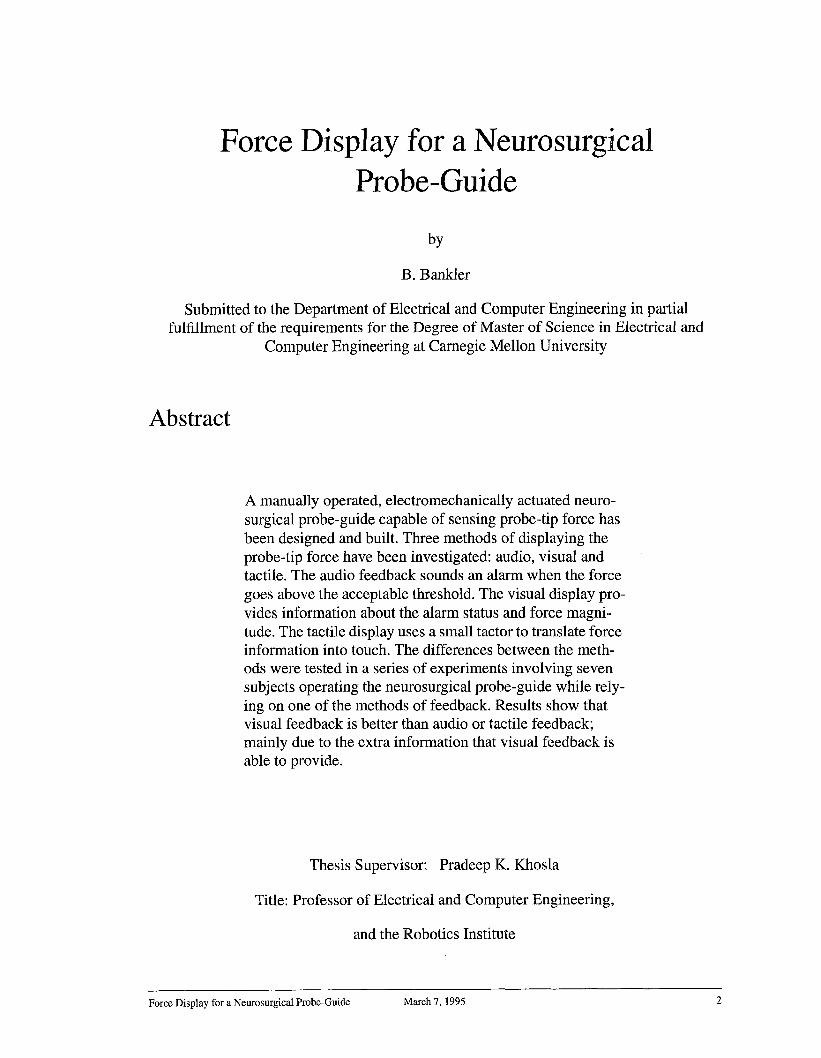
Abstract
A manually operated, electromechanically actuated neuro-surgical probe-guide capable of sensing probe-tip force hasbeen designed and built. Three methods of displaying theprobe-tip force have been investigated: audio, visual andtactile. The audio feedback sounds an alarm when the forcegoes above the acceptable threshold. The visual display pro-vides information about the alarm status and force magni-tude. The tactile display uses a small tactor to translate forceinformation into touch. The differences between the meth-ods were tested in a series of experiments involving sevensubjects operating the neurosurgical probe-guide while rely-ing on one of the methods of feedback. Results show thatvisual feedback is better than audio or tactile feedback;mainly due to the extra information that visual feedback isable to provide.
Thesis Supervisor: Pradeep K. Khosla
Title: Professor of Electrical and Computer Engineering,
and the Robotics Institute
Force Display for a Neurosurgical Probe-Guide March 7, 1995 2

Acknowledgments
First, I would like to thank Karun Shimoga for his input and support, both on this projectand on graduate life in general. I would also like to thank Pradeep Khosla for putting upwith the delays and for his words of advice, and for financial support. Dr. R. J. Sclabassiprovided insight with his expertise in the field of neurosurgery, and contributed his medi-cal expertise to this work. Thanks go to Jeremy York, Rich Voyles and Matt Gertz foranswering technical questions regarding this project and thesis. And a special thanks toChris Paredis and CJ Taylor, my office mates, for keeping me sane in general.
A special thanks to Jacqui, who hasn’t divorced me yet. Finally, I would like to thank bothof our families, who never doubted that I would get this thesis done.
Force Display for a Neurosurgical Probe-Guide March 7, 1995 3
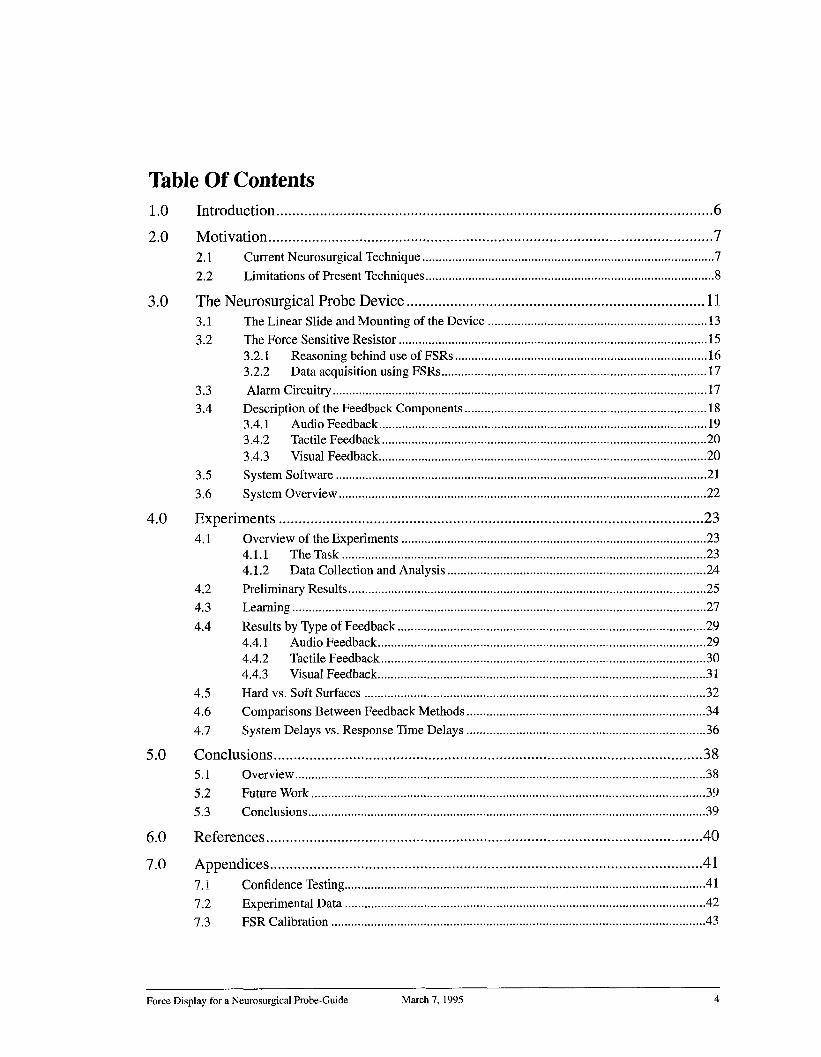
Table Of Contents1.0 Introduction .............................................................................................................. 6
2.0 Motivation ................................................................................................................ 7
2.1 Current Neurosurgical Technique ........................................................................................ 7
2.2 Limitations of Present Techniques ....................................................................................... 8
3.0 The Neurosurgical Probe Device ...........................................................................113.1 The Linear Slide and Mounting of the Device .................................................................. 13
3.2 The Force Sensitive Resistor ............................................................................................. 153.2.1 Reasoning behind use of FSRs ............................................................................ 163.2.2 Data acquisition using FSRs ................................................................................ 17
3.3 Alarm Circuitry .................................................................................................................17
3.4 Description of the Feedback Components ......................................................................... 183.4,1 Audio Feedback ...................................................................................................193.4.2 Tactile Feedback ..................................................................................................203.4.3 Visual Feedback ...................................................................................................20
3.5 System Software ................................................................................................................21
3.6 System Overview ...............................................................................................................22
Experiments ...........................................................................................................234.1 Overview of the Experiments ............................................................................................ 23
4.1.1 The Task ..............................................................................................................234.1.2 Data Collection and Analysis .............................................................................. 24
4.2 Preliminary Results ............................................................................................................254.3 Learning .............................................................................................................................27
4.4 Results by Type of Feedback ............................................................................................. 294.4.1 Audio Feedback ...................................................................................................294.4.2 Tactile Feedback ..................................................................................................304.4.3 Visual Feedback ...................................................................................................31
4.5 Hard vs. Soft Surfaces .......................................................................................................32
4.6 Comparisons Between Feedback Methods ........................................................................ 34
4.7 System Delays vs. Response Time Delays ........................................................................ 36
Conclusions ............................................................................................................385.1 Overview ............................................................................................................................38
5.2 Future Work .......................................................................................................................39
5.3 Conclusions ........................................................................................................................39
References ..............................................................................................................40
Appendices .............................................................................................................417.1 Confidence Testing .............................................................................................................41
7.2 Experimental Data .............................................................................................................42
7.3 FSR Calibration .................................................................................................................43
4.0
5.0
Force Display for a Neurosurgical Probe-Guide March 7, 1995 4
List
Fig 1
Fig2
Fig 3
Fig4
Fig5
Fig6
Fig7
Fig8
Fig7
Fig9
Fig10
Fig11
Fig12
Fig13
Fig14
Fig15
Fig16
Fig17
Fig18
Fig19
Fig20
Fig21
Fig22
Fig23
Fig24
Fig25
Fig26
Fig27
Fig28
Fig29
of Figures and Tables
Conventional Stereotactic Frame Approach to Neurosurgery ................................. 7
Robotic Probe Insertion ........................................................................................... 9
Robotic-Aided Probe Insertion .............................................................................. 10
Proposed Surgical Setup Using the Neurosurgical Probe Insertion Device .......... 11
NPID Positioned for a Simulated Insertion ........................................................... 12
Picture of the NPID ................................................................................................14
Side View of Sensory Housing .............................................................................. I5
Location of FSRs and Screws in Sensor Housing ................................................. 15
Force Data Collection ............................................................................................15
The Force Sensitive Resistor ................................................................................. 16
Force Data Collection ............................................................................................17
Alarm Circuitry ......................................................................................................18
Speaker Driver .......................................................................................................19
Tactor .....................................................................................................................20
Visual Feedback Display ....................................................................................... 21
Software/Hardware Interaction .............................................................................. 22
Top View of Experimental Arrangement ............................................................... 14
Preliminary Results (Hard Contact) ....................................................................... 25
Preliminary Results (Soft Contact) ........................................................................ 26
Learning Curve in Teleoperation ........................................................................... 27
Learning Curve in Sensory Substitution ................................................................ 28
Average Task Completion Time Using Audio Feedback ....................................... 29
Average Task Completion Time Using Tactile Feedback ...................................... 30
Average Task Completion Time Using Visual Feedback ...................................... 31
Modeling Task Completion Time .......................................................................... 33
Average Task Completion Time, Hard Contact ..................................................... 34
Average Task Completion Time, Soft Contact ...................................................... 35
Delays in Visual Feedback ..................................................................................... 36
FSR #1, Increasing and Decreasing Loads ............................................................ 44
FSR Calibration Data .............................................................................................45
Table 1 Results using Audio Feedback .............................................................................. 42
Table 2 Results using Tactile Feedback ............................................................................. 43
Table 3 Results using Visual Feedback .............................................................................. 43
Force Display for a Neurosurgical Probe-Guide March 7, 1995 5

1.0 Introduction
Neurosurgery is a very important, and challenging, field of medicine. Neurosurgeons mustdeal with the difficult task of locating small tumors and excising them without damagingmajor blood vessels and critical tissues within the brain. While various mechanical meth-ods have been used in the past for this purpose, this thesis shows a solution through the useof a robotic device that helps the neurosurgeons in performing the same task withenhanced safety and accuracy.
Stereotactic neurosurgery requires the surgeon to insert a probe-guide through a smallburr-hole in the skull to the predetermined tumor location inside the patient’s head.Because of the small incision and delicate tissues involved, the surgeon is unable todirectly see the tumor. In order to determine if the surgeon has located the tumor, a probeis inserted into the probe guide to take a tissue sample at the end of the guide. Onlythrough testing the tissue is the surgeon certain that he has reached the desired location.
There are two basic problems with current methods. First, the problem of registration.Features in the brain, unlike other parts of the body, are not easily identifiable. It is danger-ous to laterally move probes through the brain in order to attempt to find the tumor. Theonly acceptable method is to insert a probe directly to the final location with no sidewaysmotion. This approach has led to keyhole surgery, where a small incision is made and aprobe pushed to the presumed location of a tumor. Since the surgeon cannot see any differ-ence between the tumor and surrounding tissue, it is very difficult to determine the exactlocation to move the probe to. Even recent advances in medical imaging technologies stillmake this a problem. In order to cope with the difficulties of registration, mechanicalframes are used to position the probe guide’s angle of entry. The frame holds the probe-guide, and it is ’screwed’ into place. The second problem stems from this methodology.The surgeon must use this arrangement to insert the probe, and in doing so loses his senseof touch. This is a situation where the surgeon has no immediate feedback. This could leadto damage, if the surgeon forces the probe through a major blood vessel or other criticaltissue, the position of which may not have been known precisely. However, given the dif-ficulty of locating the tissue to be excised, this was an acceptable trade-off in order toenhance registration.
Robotic technology, however, can easily deal with the problem of registration. Basicrobotics often involves multiple coordinate transforms, moving along a trajectory to adesired location. This will solve the problem of accurate positioning of the probe guide.But, it is undesirable to allow robots to perform in the place of surgeons. So, a force sens-ing Neurosurgical Probe Insertion Device (NPID), teleoperated by the surgeon, has beendeveloped as a tool. The NPID will be carried by a robot to the correct entry location andthen operated by the neurosurgeon. Finally, in order to provide the surgeon with feedback,force information gathered by the NPID will be relayed to the surgeon through sensorysubstitution. The NPID increases the positional precision of the surgeon and allows him to
Force Display for a Neurosurgical Probe-Guide March 7, 1995 6
avoid critical regions in the brain, thereby increasing the safety and accuracy of the neuro-surgical process.
2.0 Motivation
The motivation for this project comes from the goal to improve the safety in neurosurgicalprocedures by introducing new tools into the surgical theater. It is not the goal of thisauthor to displace surgeons with robots. However, robotic techniques do offer a higherdegree of positional accuracy and can help a surgeon better envision the operating envi-ronment. As with any new innovation, the best way to use the tool must also be discov-ered, and determining the best human-computer (or robotic) interface must be considered,once the primary goal of increasing precision is achieved.
2.1 Current Neurosurgical Technique
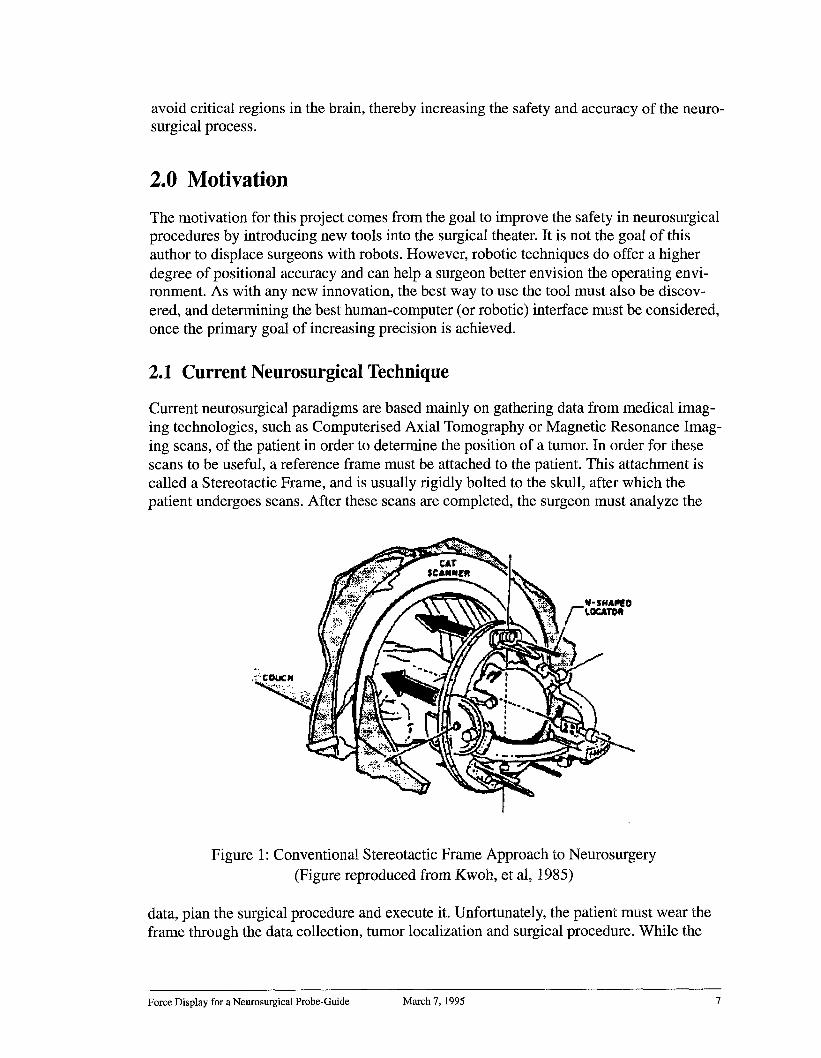
Current neurosurgical paradigms are based mainly on gathering data from medical imag-ing technologies, such as Computerised Axial Tomography or Magnetic Resonance Imag-ing scans, of the patient in order to determine the position of a tumor. In order for thesescans to be useful, a reference frame must be attached to the patient. This attachment iscalled a Stereotactic Frame, and is usually rigidly bolted to the skull, after which thepatient undergoes scans. After these scans are completed, the surgeon must analyze the
Figure 1: Conventional Stereotactic Frame Approach to Neurosurgery(Figure reproduced from Kwoh, et al, 1985)
data, plan the surgical procedure and execute it. Unfortunately, the patient must wear theframe through the data collection, tumor localization and surgical procedure. While the
Force Display for a Neurosurgical Probe-Guide March 7, 1995 7
medical scanning technology has advanced, the design of stereo-tactic frames has stayedbasically the same for approximately 85 years [Galloway, 1992].
Stereotactic frames, apart from their function as a coordinate system, also provide a sys-tem to accurately deliver a probe guide to the correct location. By a series of calculations,the surgeon can determine a surgical trajectory and compute a depth of insertion in orderto locate the end of the probe guide as close as possible to the area to be operated on. Theframe supports the guide, guaranteeing that it stays on the predetermined trajectory. Butthis process is "tedious and error prone when frequent maneuvers are required." [Kwoh,1985]. Also, the guide will typically be held by a rack-and-pinion arrangement, whichmeans that the surgeon cannot feel the forces that he/she is delivering to the patients brainwhen inserting a probe guide. In addition, stereotactic frames, because of their function asa coordinate frame, will sometimes block the surgeon’s optimal entry point and/or surgicaltrajectory during neurosurgery [Friets, 1989]. Since these points cannot be accuratelyknown until the frame is attached (although they can be estimated by scans before theframe is put on), the entire procedure may have to be restarted (with a different model frame). Stereotactic frames are also cumbersome, and uncomfortable to wear.
2.2 Limitations of Present Techniques
In the past, the benefits of the frames outweighed these problems. Without the frames, itwould be very difficult for the surgeon to accurately place the position of the tumor. He/She would have to study a series of images, reconstruct those images to a model of theinterior of the patients skull, calculate the best possible surgical trajectory, which is notonly a function of the desired position of the end-effector, but also of the functionality ofthe regions of the brain and the location of major blood vessels, which should be avoided.
Current methods, using stereotactic frames, have several limitations. The stereotacticframe is cumbersome and may put the patient in considerable pain. The frame must beworn for some time before the surgery, and may interfere with the optimal surgical techni-que.The brain is not a rigid organ, and may shift slightly between the scanning and theoperation. In addition, currently the surgeon’s only measure of the depth of insertion is touse a probe that is marked, and the stereotactic frame may make reading these markingsdifficult. Even if that is not the case, the markings must be read off of a fairly small probeguide. The rack and pinion arrangement of some stereotactic frames may prevent the sur-geon from having a good sense of feel, since forces are not transmitted through the frameto the surgeon’s hands.
Current robotic technology, however, can overcome those problems. As computer powercontinues to grow, it is possible for the computer to build a 3-Dimensional model of thepatient’s brain, and provide the surgeon with any viewpoint desired. In addition, it is a rel-atively simple to obtain a correct coordinate transform between the base of a robot and anyfixed point in space (using forward and inverse kinematics). A less-invasive method canbe used, such as fiducial markers, which are attached to the skin. A robotic arm canquickly and accurately determine the position of the tumor in the operating theater and thesurgeon’s planned trajectory, given the 3-Dimensional model of the patients brain and theposition of the fiducial markers with respect to the robots base coordinate frame.
Force Display for a Neurosurgical Probe-Guide March 7, 1995 8

Robot arms can provide the surgeon with a stable coordinate system and can move alongwell-defined trajectories. Introducing robots into the surgical theater would eliminate theneed for stereotactic frames and would improve surgical technique. Once the idea of usingrobots is accepted, there are three possible methods to use the robots:
¯ Human Insertion. In this case, the robot merely points to the correct location or holdsthe tool, much like a clamp, while the surgeon performs the surgery. This method hasthe benefit that it only uses well established technology, as much of current and pastrobotics research deals with moving to a well defined position and non-contact motion.Human Insertion systems have been in use in clinical applications for over 5 years suchas the system at the Centre Hospitalier Regional Universitaire de Grenoble [Lavallee,1992] and the ’Long Beach’ system [Kwoh, 1988].
¯ Robotic Insertion. Here the robot would move the tool to the correct approach positionand then maneuver the desired position inside the patient. There are several problems
Figure 2: Robotic Probe Insertion
with this paradigm, including questions about reliability (both of the hardware and soft-ware of the system) and dealing with unexpected external occurrences (medical com-plications). The major concern, however, is the problem of force control Force controlin robotics is a difficult problem, as is reconciling position and force information toproduce a stable algorithm. This is especially true for the neurosurgical case, where theforce and position information both follow the same degree of freedom, making con-trolling both independently impossible. In addition, unlike standard force/positionproblems, the robot must have several constrained degrees of freedom. Robotic inser-tion may yet become the standard, but many problems must be dealt with before all ofthe safety issues are answered. Apart from the technical considerations, there are seri-ous ethical and legal issues that need to be dealt with. 1 The role of autonomous robotsin the operating theater is still being debated.
Force Display for a Neurosurgical Probe-Guide March 7, 1995 9

Robot Assisted Insertion. In this case, the robot moves to the correct approach posi-tion and then the surgeon gives the robot (or the surgical tool) directions concerningmotion. In this approach, the accuracy and precision of a robot are combined with theknowledge and decision-making ability of the surgeon. Under the RAI paradigm, therobot may be considered to be a very complicated tool under the control of the surgeon.
Figure 3: Robot-Aided Probe Insertion
Another limitation that also occurs in today’s methods is that the surgeon is required to bepresent at the operation. This is not currently considered a limitation; however, as the toolsof surgery become more powerful, it may be possible to allow surgeon’s to operate onpatients while being in a different location. Telesurgery (telesurgical operation) is cur-rently being developed, in methods such as the Green Telepresence Surgical System, as away of allowing surgeon’s to operate on patients in hazardous environments [Satava,1994]. In addition, a supply of surgical robots could be kept by organizations dealing withdisaster relief, and could be flown to the locations of disasters (earthquakes, terroristattack sites, or any situation where there is a high patient to doctor ratio). This wouldprovide the additional benefit that one telesurgical robot could be operated by various sur-geons, and could be operated in an around-the-clock fashion, as surgeons from variouslocations simply take shifts (each one performing one operation, then switching surgeonsbetween operations).
1. "It is important to point out immediately, however, that the surgeon should never give up his/her fullresponsibility in performing intervention. In fact autonomous robots could not be realized technologically atthis moment, and perhaps should not be conceived for microsurgical applications." [Sabatini. 1989]
Force Display for a Neurosurgical Probe-Guide March 7, 1995 10

3.0 The Neurosurgical Probe Device
A Neurosurgical Probe Device (NPID) has been designed and built in this thesis workwith the goal of dealing with the problems discussed in the previous section. The NPID isa 1 Degree of Freedom device that is meant to be mounted on the end of a standard 6 DOFrobot, as shown in Figure 4.
Sensor Housing~ ~lotor (Controlled by Surgeon)
Hollow Probe G~de
NPID Syste~~ ~~
Industrial
~B Robot ~
,,,, Patien urr Hole
Tumor(Robot Fixed During Surgery)
Figure 4a: Proposed Surgical set up Using the NPID
Probe Guide
(Hollow Tube)
SensorHousing I
Motor
Slide
Figure 4b: The Neurosurgical Probe Insertion Device
Force Display for a Neurosurgical Probe-Guide March 7, 1995 11

A picture of the NPID, mounted with a clamp instead of on a robot arm, is shown in Fig-ure 5.1
Figure 5: NPID Positioned for a Simulated Insertion
This type of device arrangement has been recommended in the neurosurgical literature[Benabid. 1991].2 The positioning of a the NPID would be based on a model of thepatient’s brain. This model would be designed after taking in data previously acquiredfrom Computer Aided Tomographic and Magnetic Resonance Imaging scans of thepatient. From successive two dimensional MRI and CAT data, a three-dimensional modelof the patient’s brain that includes the location of the tumor and important obstacles to beavoided can be built. The surgeon uses this model to determine the entry point and angleof approach.
Once the patient’s head is rigidly attached to the bed, a coordinate transformation deter-mines the relationship between the model and the robot. The robot will then maneuver theNPID so that it is placed at the correct position and angle of attack. Then all joint brakesare enabled, so that the arm does not move or shift during the procedure. The NPID canthen be extended or retracted under the control of the surgeon.
A computer controller can be used to monitor the position of the end effector of the NPID.This is a simple calculation that depends only on counting the number of times the motorhas rotated and the ’basic configuration’ of the system. The basic configuration is the
1. Given design constraints, the current NPID prototype is too cumbersome to be carried safely by a PUMA.2. Benabid writes that "Dangerous steps such as drilling the skull or introduction and advancement of a toolinto the brain can theoretically be performed by combined six axes movements of the robot" but then goeson to state that "it is safer to use a seventh axis driven by a linear motor."
Force Display for a Neurosurgical Probe-Guide March 7, 1995 12

transformation between the home position of the Neurosurgical Probe Device and thepositioning of the patient. This computer controller can accurately move the end effectorof the NPID to the expected position of the tumor (robotic-insertion). However, this has allof the drawbacks mentioned above. When using the robotic assisted insertion paradigm,the computer positioning algorithm merely measures the position of the end effector andrelays that information to the surgeon.
The position of the end-effector, however, is not the most critical information during mostof the insertion. The surgeon is interested in position information, but because of the non-rigid nature of the system, the exact position of the tumor may change. When the surgeonsuspects that he has encountered the tumor, he will use the probe guide to maneuver theprobe so as to get a tissue sample at the end-effector. This sample will provide the correctdetermination, and is the only true way to test whether or not the tumor has been encoun-tered.
The information that is of more pressing importance to the surgeon is the force encoun-tered by the NPID. This will inform him if he is passing through soft brain tissue or hasencountered a major vein, which is hard, that has shifted position from where it wasexpected. In order to measure that, the NPID must have a method of determining the forcethat is being encountered in the environment. This is accomplished by having four (4)Force Sensitive Resistors in the probe guide housing. The NPID must also have a methodof sending that information to the surgeon. While force-feedback is a possibility, currentarrangements would require encasing the surgeon’s hands in a mechanism that would pro-vide the feedback, which is not an acceptable solution. Applying a force to the controlmechanism of the probe guide would result in a closed loop teleoperated system withsome delays, which could easily become unstable, even with interactive human control[Massimino and Sheridan, 1992]. Sensory substitution is the only method left to relay thatinformation and the current study has explored three modes of sensory substitution:Audio, Visual and Tactile. These are discussed in more detail in Section 3.4.
3.1 The Linear Slide and Mounting of the Device
A linear slide is a platform attached to a lead screw, which is in turn attached to a motor.When the motor is active, the screw rotates and the platform ’slides’ along the screw. Alinear slide allows for one degree-of-freedom positioning of the probe guide, and providesa base one which to support it. Figure 4b shows a sketch of the slide.
The entire ’gantry’ of the FSRs and probe guide is mounted on a Techno-Isel linear slide°The slide has a travel of approximately 18 inches, and weighs approximately 10 kilo-grams1 and is 27 inches long with motor, 3 inches wide and 3.5 inches tall. The base plateof the linear slide, that is, the plate that travels the length of the slide, carries the sensoryhousing, through which the probe guide passes. The probe guide is a cylinder 19" long,
1. For budgetary reasons, the NPID prototype was developed with a slide that is, under current technologies,too heavy to be easily carried around by a PUMA 500 or other standard robotic arm. However, it is possible
to miniaturize the device by improved design (at a greater expense).
Force Display for a Neurosurgical Probe-Guide March 7, 1995 13

with 12.5" of the guide being in front of the housing, and 5.5" being behind the housing.The probe guide is 1/3" in diameter. The sensor housing is approximately 1" thick, andstands about3.5" above the base plate. The device is shown in Figure 6.
Figure 6: Picture of the NPID
The linear slide is controlled by a simple control box which has a switch to move the slideforwards or backwards.The slide is carried and positioned by the robot. After a hole isdrilled in the skull, which may either be done by the surgeon by hand or by mounting adrill onto the linear slide, the probe guide is advanced (by the surgeon controlling themotor of the slide). The linear slide being used in the current design of the NPID is drivenby a stepper motor and a stepper motor controller. A linear motor, or servo motor, wouldbe required for the final design, but cost and time constraints forced the current designdecision. The motor drives the probe guide through the burr-hole and into the brain tissue.When the tissue is encountered, the probe guide will experience a force, which will betransmitted to the force sensors (FSRs) in the sensor housing (see Figures 7 and 1
The probe guide is attached to the coupling plate, but passes through the back plate, whichkeeps the probe guide straight. When the guide encounters a force, distance between thecoupling plate and back plate will be decreased. This will apply pressure on the FSRs,which can then be read to determine the magnitude of the force (see next section). Thecompression between the two plates is approximately 3mm at most.
1. Screws and wires not shown in the side view for the sake of clarity. The wires run from the FSRs to thecircuitry, and the screws connect the Coupling Plate to the Back plate. Not to scale. The gap between the
contact block and FSR has been exaggerated.
Force Display for a Neurosurgical Probe-Guide March 7, 1995 14

Probe Guide I ~ IRubUer¯ . ~ FSR 7’Direction ot Contact Block /
Forward MotionI
/ Springs
Back Plate(No connection)
Base Connected to Linear Slide
Figure 7: Side View of Sensor Housing
FSR ~~j_Probe Guide
Screw
Figure 8: Location of FSRs and Screws
The rubber bushings are used to spread to force applied to the force sensors evenly overthe contact surface, and the wooden contact blocks have been used to support the back ofthe FSRs. Metal blocks can be used in place of wood, and should be used in a true operat-ing theater. The purpose of the mountings, instead of merely attaching the sensors to thebackplate, is to ensure that all of the force is transmitted through the FSR, and to increasethe ’resting distance’ of the sensor housing. The springs are there both as a method ofincreasing compliance and to make sure that the housing decompresses after the tip forceis removed.
3.2 The Force Sensitive Resistor
The NPID is equipped with four Force Sensitive Resistors (FSRs). The FSR is a polymerthick film device which has a resistance that decreases as the force applied to the FSRincreases. One polymer sheet has a set of interdigitating electrodes, and the other has asemiconductive polymer. When there is no applied force, the resistance between the elec-trodes is in the range of 1 Megaohm. The resistance drops as a logarithmic function offorce over a range of about 3 decades. [Interlink Electronics, 1939].
Force Display for a Neurosurgical Probe-Guide March 7, 1995 15

3.2.1
(A) Figure 9: The FSRA) Side View
B) Closeup of Head
Reasoning behind use of FSRs
(B)
The FSR was used instead of a ’standard’ force sensor (such as the Lord or AssuranceTechnologies Force/Torque Transducer) for a variety of reasons, including mechanicaldesign, application requirements, interfacing issues, weight, and size. Mechanical designis the most important of the reasons. The standard F/T transducer measures the force in 3directions and torque in three directions. In order to achieve this measurement, the trans-ducer is fairly large cylinder of about 8cm diameter and 4cm tall, weighing approximatelya quarter of a kilogram. For the NPID, only the force along the degree of freedom isimportant, since there will only be one degree of motion. The FSRs are a one degree offreedom device and are fiat circles of 2cm diameter, with a ’tail’ of about 5cm. Figure 9shows an FSR. Since the NPID must push a probe guide through soft tissue, it must alsosurround the guide in order to provide support and stability. The probe guide is itself hol-low, since the probe must be inserted into it. That means that any force sensor must notobstruct the entrance to the probe guide. Since the six degrees of measurement F/T trans-ducers are not hollow, the only possibly arrangement would be to either have thembetween the robotic arm and the mechanical mounting, or to use multiple F/T transducersmounted around the probe guide. Mounting multiple transducers onto the NPID itself isimpractical, as it would greatly increase the size and weight of the NPID, and setting onebetween the robotic arm and the NPID would have several problems. First, the forceencountered by the NPID would be off-axis, as measured by the F/T transducer, andwould be interpreted as several forces and torques; the measured force would have to becalculated and this calculation may be expensive. Second, the F/T transducer is not com-pliant enough to give safely when critical forces are encountered, and building a compli-ance method for the transducer would be difficult, since compliance is only needed ordesired in one degree of freedom.
Multiple FSRs mounted around the probe guide housing so as to measure the force weighless than a single F/T transducer, and the entire set of FSRs, including springs and pads toprovide compliance, are approximately the same size as a F/T transducer. Additionally,analog circuits to provide the warning signals are easily built, and the entire system of theNPID may be run without a computer if desired.
Force Display for a Neurosurgical Probe-Guide March 7, 1995 16

3.2.2 Data acquisition using FSRs
The forces encountered by the FSRs were converted to a voltage using the circuit shownin Figure 10.
FSR
~Rref=27.4k Ohm~
Vout
Figure 10: Force Data Collection
Four identical circuits were used, one for each FSR. The output of each voltage dividerwas buffered and lead to the input of the alarm circuit. A non-linear design was chosen sothat the change in voltage per unit change in force would be increased in the region ofinterest and decreased once the tolerable force level had already been exceeded. This wasdone so that A/D discretization error would be minimized. 1
3.3 Alarm Circuitry
Once the probe guide encounters a force, a determination has to be made as to whether ornot this exceeds a predefined threshold force. This determination can be made by a num-ber of different ways, both hardware and software. For the NPID, this determination ismade by hardware. A hardware determination is analog and faster than a determinationmade by software (even running a dedicated machine). Some types of feedback (audio)may not require a computer to be in the operating theater. Even if a computer is requiredfor the feedback (which is true for complex visual and for the tactile feedback presentedhere), the computer may simply read the value of the alarm circuit instead of reading thevalue of the data points and then computing the alarm itself. The alarm circuit is shown inFigure 11.
The inputs from the 4 FSRs (which are buffered) go into the summing amplifier. The out-. 0.5
put of stage 1 is equal to rout = -(-f-5)~.,Fsr. This voltage, which will be or_ your_ -sv,compared to a threshold voltage in iSrder to determine if the alarm signal should be sent.
This circuit is very simple and can be extended to include any number of FSRs. The forcethreshold can be set to whatever value is desired. Note, however, that this circuit may latchup if the difference between the threshold voltage and that ’typical’ output of the first stagediffer by too much. The threshold voltage should be somewhere in the range of 1-2 Voltsbelow ground (0V) so as to prevent this. Also, increasing or decreasing the number
1. More reasons for using this circuit design and the calibration are discussed in Appendix 3.
Force Display for a Neurosurgical Probe-Guide March 7, 1995 17

R1FSR1 ~
R1FSR2
R1FSR3
R1FSR4 __~/~
R2
~~~/~ /~utput of Stage 1
__~ [,/~~> Alarm
OpAmps are LM348 powered by +5 V and -5V
Ra RbvtR1 = 1.2kOhm, R2 = 500 Ohm, Ra = 8.2 kOhm, Rb=6.8 KOhm.
FIGURE 11: Alarm Circuitry
FSRs would require changing the scaling ratio of the summing amplifier. The typical val-ues used in the experiments are shown in the figure; however, by changing the values ofthe resistors R2, Ra and Rb, the force scale and threshold level of the entire circuit can beeasily changed.
3.4 Description of the Feedback Components
The NPID can be hooked up to a variety of feedback components, including audio (aspeaker), tactile (a shaped memory alloy) and visual (a computer program) in order to vide the surgeon with the force information obtained from the FSRs. All of the FSRs areconnected to the alarm circuit as shown in the previous section. The output of the alarmcircuit can then be connected to the appropriate type of feedback (either directly or via computer.) The audio, visual and tactile feedback were developed since direct force feed-back to the surgeon or to the teleoperation control module are both unavailable as options.This is due to the possibility of introducing oscillations into the system and, (in the case offorce feedback to the surgeon), the necessity of attaching bulky and constraining equip-ment to the surgeon.
Sensory substitution has been used in the past in order to deal with the problems of forcefeedback. The basic idea is to provide a ’cue’ to the information that is normally registeredthrough the sense of pressure on the skin. These cues have been shown to be effective forthe standard methods1.
1. ([Bejczy, 1981], [Wiker, 1990] and [Mitsuishi, 94] are examples of visual, tactile andauditory feedback, respectively.)
Force Display for a Neurosurgical Probe-Guide March 7, 1995 18

Since sensory substitution involves using a different cue than expected; it must be’learned.’ The amount of time required for learning will depend on the subject and thecomplexity of the substitution being done. For fairly simple tasks, this can be a very shorttime, or very few trials. As will be seen in the experimental results, there was almost no/earning time required for the various types of feedback in operating the NPID.
3.4.1 Audio Feedback
Audio Feedback was accomplished by connecting the alarm signal to a circuit controllinga Metas MP11 speaker. (See Figure 12). When the Alarm signal is on, then the controlvoltage (pin 8) is sent above the ground of -5V and turns the LM566CN Voltage Con-trolled Oscillator on. The 15kOhm resistor and the 1 microfarad capacitor set the fre-quency of the oscillations The l0 nanofarad capacitor between pins 5 and 6 preventsparasitic oscillations that may occur during the switching of the ALARM signal. The tim-ing capacitor and resistor of this circuit have been chosen to produce a square wave with aperiod of 30 ms. The input signal of 33.3 Hz into the speaker produces a higher frequencyclicking noise that is comfortable to listen to, as compared with the shrill shrieking noiseproduced when DC voltage is applied to the speaker. The frequency of the speaker (and itsvolume, etc.) can be modified by using different speakers or controlling circuits if laterpsychophysiology experiments discover a sound that better alerts the user to the alarm sig-nal. However, such experiments are beyond the scope of this thesis.
Speaker
-5 V1 8
+5 V
NC 2 ~ 7 ~__~n 15kOhms~ lmicroF
3 (’~ 6
NC 4 5Vcontrol
10nanoF
ALARM
820 Ohms
Figure 12: Speaker Driver
3.32KOhms
Force Display for a Neurosurgical Probe-Guide March 7, 1995 19

3.4.2 Tactile Feedback
Tactile Feedback is provided by using Tactors, which are small Shaped Memory Alloy(SMA) devices acquired commercially (TiNi Alloy Corporation). SMAs change theirshape depending on their electrothermal stimuli. Providing current to a SMA results in anincrease in temperature, which causes a bending or expansion. The SMA protrudes out
Shaped _.____MemoryAlloy I : I On
Top View Side View
Off
Figure 13: Tactor (Not to Scale)
from a casing. If the subject rests his/her finger on the tactor, this will be felt as a smallpoke. The tactor is shown in Figure 13.
Tactile feedback could be provided by the same type of circuit as used for audio feedback.The speaker circuit could be adjust to a lower frequency, approximately 2-4 Hz, that ismore appropriate for an SMA1. However, since no specifications for operating the tactorssafely were provided by the company, a tactor controller box was obtained and usedinstead of a circuit identical to the speaker.
3.4.3 Visual Feedback
Visual feedback was provided by running a graphics program on a Sun SPARCstation 10,in conjunction with the Chimera Real Time Operating System (described in the next sec-tion). The visual feedback consists of a color bargraph inside the window on a monitorrunning XWindows. The color of the bargraph shows the condition of the alarm (red if thealarm signal was on, green if the alarm signal was off and the force was low, and yellow ifthe alarm was off but the force was close to the threshold. This cautionary force was
1. Because of the thermal nature of shaped memory alloys, they cannot be operated atmore than 3-4 hertz.
Force Display for a Neurosurgical Probe-Guide March 7, 1995 20

defined as greater than 75% of the threshold value). The bargraph’s y axis was labelledwith the percentage of maximum tolerable force.
90%-
80%---
70%--
60%--
50%--
40%-
30%,
20%,
10%--
Warning(Yellow) 90%-
80%--
70%--
Alarm-- (Red)
FIGURE 14: Visual Feedback Display
Figure 14 shows a representation of the bargraphs used. The bargraph outline is darker tomake it clearly visible in this picture. In the actual program, the color is enough to distin-guish the bargraph from the background axis. The visual feedback system presents moreinformation to the operator than the audio or tactile systems. This was done to test the ben-efit of additional information to see if it would affect the operator.
Because the graphical display program is on a Sparcstation using XWindows, and the datathat the program needs is stored on a processing board running under Chimera, an ethernetconnection between the two programs is created to transfer the data and to insure that thedata was received.
3.5 System Software
Apart from the visual feedback program, described in the last section, other software wasrequired. While the Neurosurgical Probe Insertion Device can run some feedback modeswithout the use of a computer, in order to run the experiments it was necessary to interfacethe FSRs and alarm circuit from the NPID with a computer to collect and store data inreal-time during the experiments.
The 4 FSR output voltages and Alarm signal were taken from the Alarm circuit and readinto an Ironics IV-3220 Single Board Computer via the Trident Robotics TRC004 PUMAInterface board [Trident Robotics and Research, 1994]. The Trident Robotics Board wasused because the same board can be used to control the linear slide, and a UnimatePUMA, in the future. The TRC004, the IV-3220, the computer storing the data, the link tothe graphics program and the link to the tactor controller were all running under the Chi-
Force Display for a Neurosurgical Probe-Guide March 7, 1995 21

mera Real-Time Operating System [Stewart and Khosla, 1993]. Chimera was used to con-trol the entire system, except for the actual graphics program itself, since Chimera andXwindows are incompatible. Most of the software for the system dealt solely with han-dling the flow of data from the alarm circuit, logging the data for the experiments, and pro-viding the data to the graphical feedback program. A small part of the system controlledthe tactor controller box, by sending commands ordering it to turn the tactor on and off.
3.6 System Overview
The overall system is schematically represented in Figure 15.
Force/AlarmData
~Socket
~TRC004
_~ Speaker [~
k~xperiment~/
I/O"- Roulines ~ -Data Log
Figure 15: Software/Hardware Interaction
Visual
Feedback I ]
Experiment 3~
The force data came from the output voltages of the FSR circuits, which was read into thealarm circuit, summed, and compared to a threshold. The alarm signal was sent to thespeaker controller circuit, which modulates the speaker. Both the force and alarm datawere sent into Chimera via the Trident Robotics PUMA Interface board, which ran at 25HZ (40 ms between sample times). This data was logged at 50 Hz, both to prevent aliasingand to provide redundancy. Depending on what feedback modality was used, Chimerathen sent out a control signal to the Tactor Controller or provided the visual feedback pro-gram with the alarm and force data. The Tactor Controller information was sent out at 25Hz as part of the I/O routine. The tactor itself however, only operates around 3-4 Hz. Theorders were sent at high frequency in order to decrease the delay to the tactor system. Thetactor controller box received the ’on’ signal (with a maximum delay of 40 ms) and startedoscillating the tactor immediately.
Force Display for a Neurosurgical Probe-Guide March 7, 1995 22
Likewise, the ethernet socket module sent the data out to the visual feedback program at25 Hz. However, in order to prevent any mis-communication between the programs, thesocket module typically operated at approximately 10 Hz, which is the fastest speed thatthe graphics program could update the window that it was operating in.
The NPID is a reconfigurable system, although the modularity comes in various group-ings. The basic system can be run simply as a circuit board, requiring nothing more thanthe FSRs, the speakers (or tactors, if a suitable model of shaped memory alloy is acquired)and a power supply (and connecting ribbon cable). The visual feedback system can added in, at the cost of requiring computer hardware and computer programs. However,once the cost of the computer systems is accepted (in terms of space requirements, delaytimes, and the like) a variety of feedback systems can be run through the computer, includ-ing various changes to the current feedback system, out of the box tactor controllers, orany technology that can be controlled by a Digital (or D/A) output channel.
Because of this feature, the NPID may be considered an expandable system, able to pro-vide the surgeon with additional feedback modalities as they are acquired.
4.0 Experiments
4.1 Overview of the Experiments
Once the Neurosurgical Probe Insertion Device was completed and tested, a set of experi-ments were conducted in order to determine which of the three available methods of sen-sory substitution is best suited to the application. This was done by running a series ofseven subjects through six different conditions. The subjects ranged in age from 19-27.
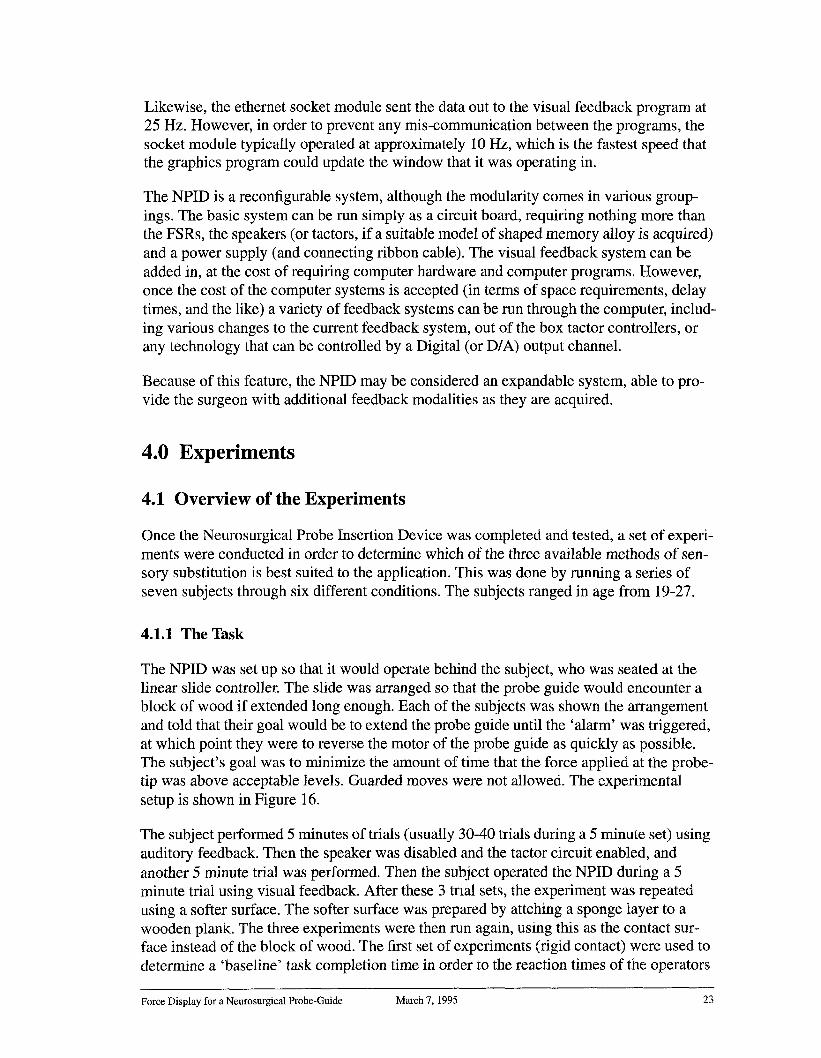
4.1.1 The Task
The NPID was set up so that it would operate behind the subject, who was seated at thelinear slide controller. The slide was arranged so that the probe guide would encounter ablock of wood if extended long enough. Each of the subjects was shown the arrangementand told that their goal would be to extend the probe guide until the ’alarm’ was triggered,at which point they were to reverse the motor of the probe guide as quickly as possible.The subject’s goal was to minimize the amount of time that the force applied at the probe-tip was above acceptable levels. Guarded moves were not allowed. The experimentalsetup is shown in Figure 16.
The subject performed 5 minutes of trials (usually 30-40 trials during a 5 minute set) usingauditory feedback. Then the speaker was disabled and the tactor circuit enabled, andanother 5 minute trial was performed. Then the subject operated the NPID during a 5minute trial using visual feedback. After these 3 trial sets, the experiment was repeatedusing a softer surface. The softer surface was prepared by attching a sponge layer to awooden plank. The three experiments were then run again, using this as the contact sur-face instead of the block of wood. The first set of experiments (rigid contact) were used determine a ’baseline’ task completion time in order to the reaction times of the operators
Force Display for a Neurosurgical Probe-Guide March 7, 1995 23

Obstacle NPID
Force Data
Subject’s View of NPID Blocked
Subject/
MotorController
Force
Display
Figure 16: Top View of Experimental Arrangement
when using the various feedback methods. The second set of experiments (soft contact)are more similar to what a neurosurgeon would encounter when operating the NPID in asurgical environment.
During all six trials, when the motor was reversed the base distance between the linearslide and the contact object would be changed to prevent the subjects from timing orguessing when the contact would occur. The subjects also did not receive any practice tri-als before starting the experiments, so that information on the amount of time necessary tobecome acclimated to sensory substitution could be studied.
4.1.2 Data Collection and Analysis
While the subjects were performing the experiments, the software was saving the forceand alarm data (either ON or OFF), which was sampled at 25 Hz, but saved at 50 Hz order to minimize errors caused by differences in scheduling the modules° After the exper-iments, the data was filtered using a program that would detect when the probe guideencountered the object, how long it took before the contact force was below the alarmthreshold, and what the maximum force applied to the probe guide was. This amounted toone data point. Each subject had approximately 30-40 data points for each of the six trials.
There are two possible criteria that can be analyzed in this set of experiments: force andtime. The main criteria for the experiments was task completion time, where the taskinvolved withdrawing the probe guide to a safe force level. This was chosen for a few rea-sons. First, since the velocity of the probe guide was constant, the force should be thesame for the same task completion time. Second, the linear slide was not allowed to movebackwards (instead of the probe guide moving forwards) in order to prevent any damage
Force Display for a Neurosurgical Probe-Guide March 7, 1995 24

to the system, and to avoid placing any excess force on the contact block. Force data wasstill acquired and was used as a secondary criteria.
The linear slide was operating at a higher speed than would be expected in a surgical the-ater, where the arrangement would, of necessity, be much more careful. The final design ofthe NPID would use a slower, weaker motor. However, in order to determine the impact ofvarious types of sensory substitution when encountering unexpected forces, such as obsta-cles that were missed in pre-operative planning, or that have shifted into the path of theprobe guide, for example, this approach was necessary.
4.2 Preliminary Results
The mean task completion times when encountering hard objects is shown in Figure 171.
Audio
500 Tactile
Visual
@
1 2 3 4 5 6 7Subjects
Figure 17: Preliminary Results, Hard Surface
It can be seen from the figure that audio feedback was faster than visual or tactile feedbackin each subject except subject #1, where tactile feedback was slightly faster than audio.Tactile feedback usually was the next best, except for subject #2, and visual feedback was
1. The visual data for Subject #7 was lost due to a memory overflow. Three data points were recovered480ms, 520ms and 640ms (in that order). Those points are shown in the figure; however, they are not enoughdata points to judge that result significant. Data from Subject #7’s visual trial is not used in any of the fol-lowing analysis.
Force Display for a Neurosurgical Probe-Guide March 7, 1995 25

the worst of the modalities examined. The standard deviations for the individual datapoints was quite large (typically around 100 milliseconds, although occasionally as muchas 200ms). However, the standard deviation from the mean was usually around 15-30msfor each trial.
There are two main reasons for high standard deviations in the individual trials. First,human reaction is erratic. During a session, a subject’s attention may drift during the 30minutes of experiments. Second, because of the sampling frequency of 25 Hz, discretiza-tion of up to 40ms will occur. Obviously, it would be impossible to get less than 40ms ofstandard deviation between individual samples. However, the large (usually greater than25) number of trials run for each subject at each condition allow the mean to be placedwith greater accuracy. Since these problems occurred in all six of the trials, and therewere over 1000 trials spread over the experiments, it may be assumed that the discretiza-tion error, being essentially a random delay of up to 40ms, did not effect the data.
The data from the soft contact experiments is shown in Figure 18.1
Audio
Tactile
Visual
1 2 3 4 5 6 7Subjects
Figure 18: Preliminary Results (Soft Contact)
The results for the soft surface show that the visual feedback led to faster task completiontimes than other methods for most subjects. Audio feedback is the next fastest for most
1. There is no tactor data for subject #5, as the tactor had burned out at the end of that subjects hard contactsession and no replacement was available at the time.
Force Display for a Neurosurgical Probe-Guide March 7, 1995 26
subjects, and the best for some. Tactile feedback was the slowest method for all seven sub-jects. Standard deviations of the means tended to be the same for audio and tactile feed-back, although for the visual surface, the standard deviations typically fell from 25-30 msto 10-15 ms.1 The task completion times for both audio and tactile feedback have gottenlonger, whereas it takes less time to complete the task when using visual feedback.
4.3 Learning
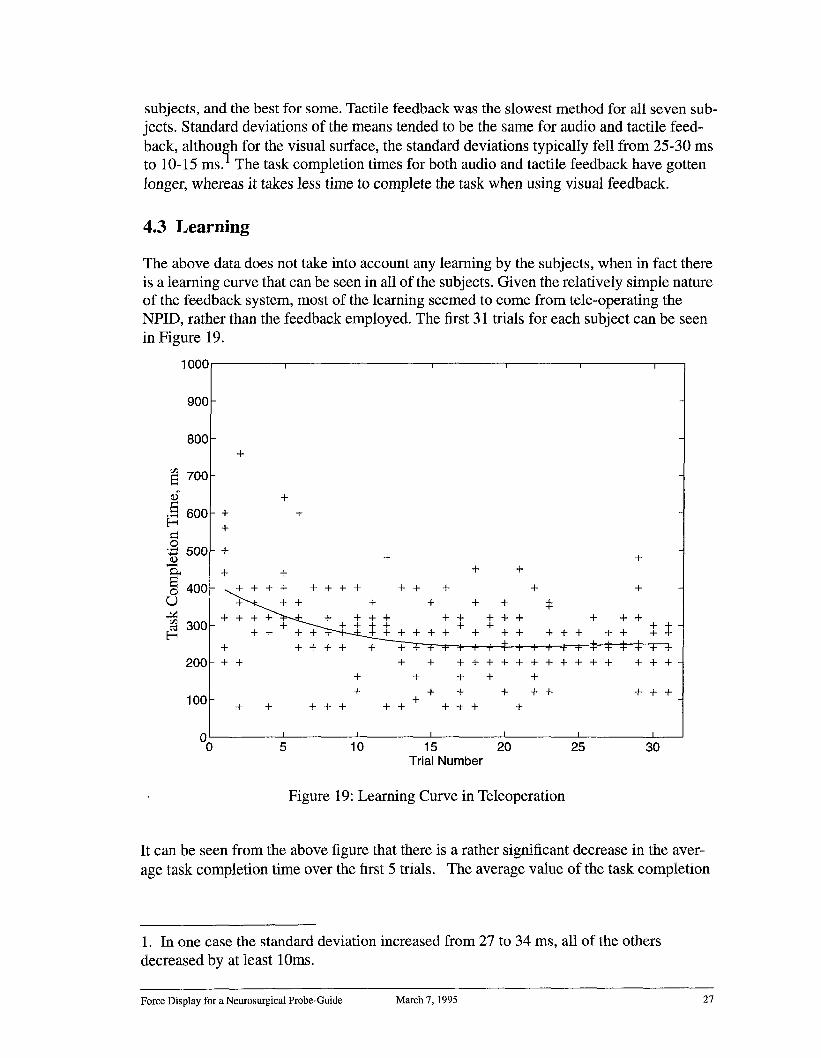
The above data does not take into account any learning by the subjects, when in fact thereis a learning curve that can be seen in all of the subjects. Given the relatively simple natureof the feedback system, most of the learning seemed to come from tele-operating theNPID, rather than the feedback employed. The first 31 trials for each subject can be seenin Figure 19.
lO00
900
800
700
600
500
400
300
200
100
++
+
++
+ +
~+++ ++++ ++ + + +
+~+ T + + + +~
++ ~++ ++ +++ + +++ + ++ + + +++ + ÷ + -F~+--.~. + + + + + + + + + + + + + + + +
+ ++++ ~++++~+++++*¢4~+++ + + + + + + + + + + + + + + + + +
+ + + + +
+ + + + ++ ++++
+ + +++ ++ +++ +
0 I I I I I I
0 5 10 15 20 25 30Trial Number
Figure 19: Learning Curve in Teleoperation
It can be seen from the above figure that there is a rather significant decrease in the aver-age task completion time over the first 5 trials. The average value of the task completion
1. In one case the standard deviation increased from 27 to 34 ms, all of the othersdecreased by at least lOms.
Force Display for a Neurosurgical Probe-Guide March 7, 1995 27

time reveals that the during the 6 trials, 5 of them are at least 25% slower than the averagetime over the first 31 trials.
However, there doesn’t seem to be any significant learning in the next five trials. In four ofthem, both of the first two results were within 25% of the average, and in the fifth (the trialusing visual feedback when encountering a hard surface), only the first data point was out-side of the 25% range. The data from the trial involving visual feedback when contacting arigid obstacle is shown as an example in Figure 20.
I oo0
900
800
700
600
500
4001
300
200
100
00
++ + ++++
+ + +++++
+ +
++++ +++++ + +++ ++
+ +++ +++
+++ +++ ++
+ +++ + + ++ + + +
+ + + + ++
+ +++
++++++÷++++ +
+ ++++
+ +
+
++
++ +
+ + ++++ + + ++++ + + + + ++ +
I I ~ i 1 I5 10 15 20 25 30 35
Trial Number
Figure 20: Learning Curve in Sensory Substitution
The learning curve is certainly much more shallow, and the entire polynomial fit neverdrifts more than 50ms or so. This drift keeps the curve within one or two standard devia-tions from the mean.
Some learning is certainly occurring. The first datapoint even the fastest time was abovethe mean for the entire test, the only trial for which that is true. However, the time it takesto adapt to a new method of sensory substitution is not nearly as significant as the learningcurve that result from dealing with a new form of teleoperation.
In order to insure that the learning curve had no effect on the studies to determine the bestmethod of feedback, the initial trials of each experiment were examined until two datapoints had fallen with 25% of the mean. All data before the second reasonable point were
Force Display for a Neurosurgical Probe-Guide March 7, 1995 28

removed. This was done in order to prevent a possible lucky result from influencing wherethe learning curve was set, since individual data points have a standard deviation ofapproximately 100 ms.
4.4 Results by Type of Feedback
The individual differences between the systems play a part in the different resultsobtained. Apart from the fact that the subjects responded differently to the different typesof feedback, there are also key hardware differences.
4.4.1 Audio Feedback
The results for each subject when using auditory feedback are shown in Figure 211.
I00[] Rigid Contact (7 Subjects,
22-40 Trials / Subject)
INI Soft Contact (7 Subjects
~34-45 Trials / Subject)
..~
Fig 21: Average Task Completion Time using Audio Feedback
In all 7 subjects, it took longer to safely retreat the probe guide when dealing with a com-pliant obstacle than with a non-compliant obstacle, on average over 50% longer. Whendealing with a compliant surface, which better approximates surgical conditions, the meantask completion times ranged from 312ms to 472ms. The average time for the seven sub-jects was 388 + 6 ms. With a rigid surface, the times ranged from 212ms to 320ms andaveraged 251 + 7 ms. The full data for each subject is shown in the appendices.
1. Subject #1 had 3 extra minutes of data taken, a total of 68 trials, in order to determine the amount of timeeach experiment should take.
Force Display for a Neurosurgical Probe-Guide March 7, 1995 29

4.4.2 Tactile Feedback
The mean task completion time when using tactile feedback is shown in Figure 22.
[] Rigid Contact (7 Subjects,24 - 41 Trials / Subject)
Soft Contact (6 Subjects,I~1 26 - 40 Trials / Subject)
Fig 22: Average Task Completion Time using Tactile Feedback
As when employing auditory feedback, the rigid contact task was completed faster thanthe soft contact task. When tested with a rigid obstacle, the mean task completion timesranged from 246ms to 414ms, with an average of 338ms. When the rigid obstacle wasreplaced with a compliant obstacle, the average task completion time rose to 554ms, over60% longer than the rigid task. The full data is given in the appendices.
Force Display for a Neurosurgical Probe-Guide March 7, 1995 30

4.4.3 Visual Feedback
The mean task completion times when using visual feedback is shown in Figure 23.1
Rigid Contact (6 Subjects,32 - 50 Trials / Subject)
Soft Contact (7 Subjects14 - 37 Trials/Subject)
Fig 23: Average Task Completion Time using Visual Feedback
It can be seen that, in the case of visual feedback, the mean task time was faster when theobstacle was soft rather than a rigid contact. However, the data is very close, showing amean of 428 + 13ms for the hard contact and 365 + 8ms for the soft contact. And this factwas only true for four of the subjects. For two of the other subjects, the mean task comple-tion time was faster for the rigid obstacle; however, the means are very close (in each casethe average for one trial falls within one standard deviation of the other mean). For subject#7, the data recorded during the rigid contact experiment was lost due to a unexpected dataoverflow.2
For the subjects that went counter to the average, testing revealed that the confidence thatthe rigid mean was faster than the compliant mean gave slightly less than a 75% confi-dence level for the one subject and closer to 70% confidence for the other. Subject #5, theclosest of the subjects who demonstrates the more usual result of soft obstacle task corn-
1. Full data in Appendix 6.2 For the soft contact data, 6 of the subjects had 31-37 trials, one subject only had14 trials.2. The first three data points were recovered, and where 480ms, 520ms and 640ms. Foran average of 547ms.It is reasonable to assume that subject #7’s task completion time for rigid contacts would follow. In fact, aconfidence test of the data gives t test result of 1.93 with over 30 trials, which is a 98% confidence that themean task completion time for the compliant obstacles would be less than the mean task completion time forthe rigid contact. However, given the 40ms discretization, this result may have been good fortune and is dis-carded.
Force Display for a Neurosurgical Probe-Guide March 7, 1995 31
pletion time being faster than rigid obstacle task completion time, has just under a 95%confidence level. The confidence levels for the other three subjects are over 97.5%, over99.5% and over 99.95% that the mean task completion time for the soft trial is faster thanfor the hard trial.1
4.5 Hard vs. Soft Surfaces
For both the auditory and tactile feedback, the mean task completion time for each subjectincreased, on average by 50%, with the introduction of compliance. Since the method offeedback stayed the same, this should not be the result of differences in reaction time. Theexplanation lies in the fact that once the probe guide retreat has started, when dealing witha rigid obstacle, the excess force has been removed and the alarm circuit turns off within 1to 2 ms. This is show schematically in Figure 24a. However, with a compliant surface,when the direction of the probe guide is reversed, there are still forces encountered by theend-effector, as the obstacle pushes back against the probe tip. So, while the time it takesthe surgeon to reverse the direction of the NPID’s motion is the same, the time it takes forthe force to fall below the alarm threshold is longer.
By looking at the soft obstacle model (Figure 24b) this should become clear. The reactiontime of the operator is exactly the same. However, the task completion time, which wasdefined as the amount of time to reduce the force being applied by the end-effector to thelevel below the threshold, has increased. When looking at the data of the individual sub-jects for both audio and tactile feedback, these increases in mean task completion time canbe easily seen. The effect is so drastic, that it can even be seen when looking at the averageover all of the subjects. A confidence test shows 100% certainty that the mean task timefor tactile feedback is increased by increasing compliance. For audio feedback, there is95.35% certainty.
However, the task completion time using visual feedback decreased. This is because thevisual feedback system allowed the operator to react before the alarm threshold wasreached. Both the audio and tactile system contain only one bit of information (Alarm On/Off). The visual system, in addition to the alarm information (which was presented color) also had the force information (presented as the size of the bargraph). This amountsto 6 extra bits of information.2 This means that the operator will react, not when the alarmoccurs, but at some point before it. (Figure 24c) The extra information decreases the taskcompletion time by the above model, assuming that the surgeon decides to act before thealarm goes off. A side benefit of this ’anticipation’ of the alarm is that, even under theassumption that the operator does not react until it is just before the alarm is going to gooff, the excessive force will decrease, because there will be less compression of the obsta-cle.
1. See Appendix 6.1 for confidence testing and a sample calculation.
2. The force information ranged from 0-100, which is technically 7 bits, however, whenthe force is above 50% the alarm is on, so only the first 6 bits give any predictive ability tothe operator.
Force Display for a Neurosurgical Probe-Guide March 7, 1995 32

So, when dealing with a simple teleoperation, apart from simple contact/no contact infor-mation, extra information allows the user to make anticipatory reactions, and this leads toa decrease in the task completion time.
Human Reaction Time
Alarm Threshold(A)
(B)
(c)
ObstacleEncountered
Time
~ Surgeon Reacts
Task Completion Time
Alarm Off
Surge°n Reacts -~-’~N~’~ ~ Excessive
-- /_. ~~ / Force
_~__t!on _Time .........
Task Completion Time
ObstacleEncountered
Time
Surgeon Surgeon Reacts ExcessiveDecides to ~ Force withoutReact Excessive Additional
Force Information
Task Completion q~e
Reaction Time~
ObstacleEncountered
TimeFigure 24: Modeling Task Completion Time
A) Rigid ContactB) Soft ContactC) Soft Contact, Additional Information
Force Display for a Neurosurgical Probe-Guide March 7, 1995 33

4.6 Comparisons Between Feedback Methods
When dealing with a hard surface (where anticipatory knowledge is of little use), audiofeedback yields faster times than tactile or visual.The mean task completion time bymethod is shown in Figure 25.
Audio
Tactile
Visual
Figure 25: Average Task Completion Time, Hard Contact
It has been shown that for six of the subjects, audio feedback is at least slightly faster thanthe time for tactile feedback, although the averages where within one standard deviation.Averaged over the all of the trials, the mean task completion time was 252ms, with a stan-dard deviation of under 7ms. Tactile Feedback was, by comparison, 338 + 11 ms andvisual feedback was the slowest with a an average task completion time of 428 + 13 ms. 1Confidence testing reveals 100% confidence that audio feedback is better than tactile orvisual feedback. Arbitrary bounds may be set for determining the conservative upperbound of auditory feedback mean task completion times, but it is definitely under 275ms,which is over 3 standard deviations away.2
1. When looking at the mean weighing each subject equally, the times are within 1 ms for audio and tactile,but the mean visual time drops to 419ms.
2. The ages of the subjects should be recalled to be relatively young. Obviously this number may changebased on differing subject age, health and hearing conditions.
Force Display for a Neurosurgical Probe-Guide March 7, 1995 34

However, the soft contact model is closer to what would be encountered in an operatingenvironment. The results are shown in Figure 26.
~00Audio
N Tactile
Visual
Figure 26: Average Task Completion Time, Soft Contact
The averages over all of the trials are365 + 8ms for visual, 388 + 6ms for audio and533 + 12ms for tactile feedback1. Discounting tactile feedback, visual feedback seemsslightly better than audio. However, a confidence test gives only a 60% confidence thatvisual is faster than audio feedback.
Using the baseline hard contact data, it would appear that audio feedback is initially thebetter mode. However, when the obstacle becomes more and more compliant, the ’antici-patory knowledge’ that the extra bits of information give the operator allow visual feed-back to improve, whereas the single-bit feedback modes become worse. The data bearsthis model out. However, these models do not completely analyze the specifics of theexperiment, and assume that all of the feedback types have the same delays caused by thehardware, when in fact this is not the case. Analyzing the delays caused by the system, andtheir impact, will allow for a final determination to be made.
1. Averaged by subject average, not by trial, gives the following results: Visual 366ms, Audio 390ms, and
Tactile 554ms.
Force Display for a Neurosurgical Probe-Guide March 7, 1995 35

4.7 System Delays vs. Response Time Delays
Because of the different hardware requirements, each type of feedback has its own intrin-sic delay. An analysis of the system delay times will clarify the situation. Once the alarmcircuit determines an excessive force has been encountered, the alarm signal goes high.When using audio feedback, this turns the speaker on within 1-2ms. This delay is practi-cally non-existent when compared to human response time. However, when dealing withthe visual feedback, once the alarm goes high, then that information must propagate to thegraphical display program, a three step process, shown in Figure 27. First the alarm signalmust be read into the computer. The sampling rate is 25 Hz, which means that the delaycould be 0-40ms. On average, the delay will be 20ms. Once the data is read into the Chi-mera, it must be passed to the graphical program. Since the fastest rate that informationcould be passed is 10 Hz, this leads to an average delay of 50ms. Finally, once the data isinserted into the ethernet socket, it must travel to the graphical program, and be updatedon the screen. This value is more difficult to estimate, but a screen refresh rate of 24 Hzadds approximately 20ms. If the ethernet delay is assumed to be 10ms, this leads to atotal 100ms delay (on average).
Speaker Sounds
50mSI II ,
t=0 Alarm Signal High
Data inserted into packet
Alarm Value Enters Computer
lOOmSI
TIME
Graphics Alarm Sounds
Data Arrives
50mS lOOmS
Figure 27: Delays in Visual Feedback
Force Display for a Neurosurgical Probe-Guide March 7, 1995 36

When looking at the difference between audio and visual feedback in a hard surface envi-ronment (where anticipatory knowledge does not enter into the model), the difference task completion times was approximately 176 ms.
Obviously, if this extra delays did not exist for the visual feedback, it would have it’s aver-age completion time decreased to 265ms. This would give a confidence level of 91.15%.However, the delays do exist, and cannot be removed (although, of course, faster hardwareand possibly a dedicated visual display could greatly reduce these delays).
However, referring to the anticipatory model, a delay can be inserted into the model asmerely changing the time at which a decision is made to reverse the NPID. Using thisassumption, even if the task completion time is about the same (due to delays), the exces-sive force on the patient should be reduced. During the experiments, the excessive forcewas measured during both the visual and audio feedback tests, with respective results of723 milliNewtons with a standard deviation of 30 mN and 865 milliNewtons with a stan-dard deviation of 26mN, respectively. This gives a confidence of over 99% that less exces-sive forces were caused when using visual feedback. 1
When looking at the three individual subjects who reacted faster when using audio feed-back2, the force information reveals that two of them still put less excessive force on theobstacle. For the three subjects, the confidence that they put less excessive force whenusing visual feedback is 0%3,84.85%, and 99.99%. So, while the results are not definitive,they do show that even when it takes the surgeon longer (which may be caused by differ-ences in how fast information is processed), they apply less force when using visual feed-back.
Tactile Feedback also suffers a delay due to the system. The tactor data does not have totravel over an ethernet link, as the tactor system is integrated into CHIMERA’s Input/Out-put routines. The data delay is only the approximate 20ms in order to read the data. Oncethe data is read, the alarm signal is converted in the I/O routine to an output signal to thetactor controller. However, since the tactor is a mechanical system, it can only operate ataround 4 Hz, so there is a delay of approximately 120ms between when the alarm signalreaches the tactor controller box and when the tactor is first fully extended, for a totaldelay of approximately 150 ms (allowing for the tactor controller box to have some delay).The actual difference between tactile and auditory feedback is 86ms for the hard surfaceand 145ms for the soft surface.4 As avoiding damage to the patient is the main criteria, it
1. It should be remembered that the force information is not entirely reliable, as force readings have a max-imum level (unlike the time readings). However, even assuming that the standard deviations are doubled, theconfidence level remains above 93%. This number is approximately the same as assuming a 100ms delay.2. See appendix 6.2.3. 0% means that there is 100% confidence that the opposite statement is true, i.e. subject #4 applied moreforce when using visual feedback.
4. The difference between estimated and actual may be due to the fact that the tactor canbe felt when only partial extended, and in differences in human reaction times when dif-ferent senses are stimulated.
Force Display for a Neurosurgical Probe-Guide March 7, 1995 37

may safely be stated that the visual feedback is better at reducing the excessive force dur-ing neurosurgery. During an actual neurosurgery, the linear slide will be operated at aslower speed than during the experiments, and the role of anticipatory information willbecome even greater.
5.0 Conclusions
5.1 Overview
The Neurosurgical Probe Insertion Device allows for robotic assisted neurosurgery andeliminates the need for a stereotactic frame. Three types of sensory substitution, visual,audio and tactile, were explored for use in providing the surgeon with critical force infor-mation. Despite the delays associated with visual feedback, the additional information thatcould be displayed allowed subjects during obstacle avoidance sessions to react faster, anddecrease the excessive forces imposed on an obstacle.
The contributions of this thesis are:
¯ A Force-Sensing Neurosurgical Probe Insertion Device has been designed, built andtested. Subjects were able to respond to obstacles in its path, despite being unable to seethe motion of the probe guide.
¯ Three modes of force displays, audio, visual and tactile, were tested and evaluatedusing seven subjects. When dealing with conditions analogous to neurosurgery, visualfeedback was found to be better than audio feedback, which in turn was better than tac-tile feedback.
The main conclusions of this thesis are as follows:
¯ There is learning over the first few attempts at teleoperation. However, for the rela-tively simple task considered in this work, the learning is significant for only the first 4-6 trials.
¯ The learning that occurs when a new type of sensory substitution is used is much lesssignificant, and in most cases non-existent.
¯ Audio feedback allows for the fastest reaction time, because it has the shortest hard-ware delays.
¯ When dealing with a soft obstacle (as in neurosurgery), only having one bit of informa-tion leads to a significant increase in task completion time, whereas having additionalbits of information leads to a significant decrease in task completion time.
¯ For most subjects, visual feedback is the fastest method of the three methods tested torespond to soft obstacles, because of anticipatory knowledge caused by the extra bits ofinformation.1
¯ Even when visual feedback is slower than audio feedback (because of hardwaredelays), anticipatory knowledge usually results in a decrease in the amount of timerequired to correct a potentially dangerous situation.
Force Display for a Neurosurgical Probe-Guide March 7, 1995 38

¯ As the speed of the NPID decreases, the importance of anticipatory knowledgeincreases.
The above conclusions all point to the fact that visual feedback was the best of the threemethods studied.
5.2 Future Work
The NPID is a part of an envisioned system to coordinate medical imaging technologies,robotics and telepresence in order to enhance surgical performance and enable tele-surgi-cal procedures. In order to progress, integration of this work with existing systems (ordevelopment of new systems) that convert raw medical imaging data to robotic trajecto-ries must be done in order to finalize the system.
In addition, the NPID is a proto-type device. A smaller, more lightweight model (or stron-ger robotic systems) must be developed, although a reduction of scale, or changing ofmaterials should accomplish that goal. While the hardware used for the computer I/Oworked perfectly well, the TRC004 has a disclaimer against using it in high-risk medicalconditions [Trident Robotics, 1994]. The reliability of all of the hardware would have toundergo rigorous testing before being operated under medical conditions.
Finally, the medical community must supply the exact specifications the NPID should fol-low. Critical measurements need to be made to determine the "maximum force" that maybe applied during the insertion without fear of damaging any tissues. The decision as towhether to allow a computer (to allow visual feedback) in the operating theater must made by surgeons.
The NPID, while specifically dedicated to neurosurgical procedures, does show that tele-operation is a viable approach that should be considered by the medical community. Asless invasive techniques are developed (such as endoscopy, laproscopy and other forms ofteleoperation) that continue to require more and more surgical dexterity and force the sur-geon to envision, rather than see, what he/she is doing, the need for better interfacesbecomes more necessary. The paramount goal of decreasing the risks associated with sur-gery should see the ever-increasing use of robotic and telepresence technologies in themedical community.
While this work is intended for use with neurosurgery, it can be applied to other taskswhere the force that an operator applies cannot be reflected. In such cases, displaying theforce through one of the sensory modes investigated here should yield similar results.Additional information will result in better task performance, assuming that the task is notsufficiently complicated that all of the information would confuse the operator. Since addi-tional information is beneficial to the operator, visual feedback should be considered as theprimary method of force displays.
1. This is true for the experiments presented here. Audio feedback with mutliple bits of information hasbeen tried, and tactile feedback could presumably by likewise tested. These results apply for the hardwareschemes tested in this thesis.
Force Display for a Neurosurgical Probe-Guide March 7, 1995 39

6.0 References
[1] Bejczy, A.K., and Handlykken, M. "Experimental Results with a Six Degree of Free-dom Force-Reflecting Hand Controller" in Proceedings of the 1982 IEEE InternationalConference on Cybernetics and Society, 691-698, 1982.
[2] Benabid, A.L. et al, "Is There any Future for Robots in Neurosurgery?" in Advancesand Technical Standards in Neurosurgery. Edited by Symon, Let al. Vol 18. 1991.
[3] Friets, E.M. et al, "A Frameless Stereotaxic Operating Microscope for Neurosurgery,"in IEEE Transactions on Biomedical Engineering 36 (6): 608-617, 1989.
[4] Galloway, R.L., Maciunas, R.J. and Edwards II, C.E., "Interactive Image Guided Neu-rosurgery," in IEEE Transactions on Biomedical Engineering 39 (12): 1226-1231,1992.
[5] Interlink Electronics. Touch the Future Through Force Sensing Resistors from InterlinkElectronics. Interlink Electronics, Santa Barbara, CA. 1989.
[6] Interlink Electronics. Tech Notes. Interlink Electronics, Santa Barbara, CA. 1990.
[7] Kosugi, Y. et al., "An Articulated Neurosurgical Navigation System Using MRI and CTImages," in IEEE Transactions on Biomedical Engineering 35 (2): 147-152, 1988.
[8] Kwoh, Y.S. et al. "A New Computerized Tomographic Aided Robotic Stereotaxis Sys-tem." in Robotics Age, 17-22, June 1985.
[9] Kwoh, Y.S., Hou, J., Jonckheere, E.A., and Hayati, S. "A Robot with Improved Abso-lute Positioning Accuracy for CT Guided Stereotactic Brain Surgery" in IEEE Transac-tions on Biomedical Engineering 35 (2): 153-160,1988.
[ 10] Lavallee, S. et al. "Image guided operating robot: a clinical application in stereotacticneurosurgery" in Proceedings of the 1992 IEEE International Conference on Roboticsand Automation, 618-624, 1992.
[11] Massimino, M.J. Sensory Substitution for Force Feedback in Space Teleoperation.MIT Ph.D. Thesis, Department of Mechanical Engineering, June 1992.
[ 12] Mitsuishi, M., et al. "Towards transmission of operational environment informationfor tele-micro-surgery" in Proceedings of the First International Symposium on Medi-cal Robotics and Computer Assisted Surgery, 190-5, 1994.
[13] Peters, T.M. et al. "Integration of Stereoscopic DSA with Three-Dimensional ImageReconstruction for Stereotactic Planning" in Proceedings of the Xth Meeting of theWorm Society for Stereotactic and Functional Neurosurgery, 475-476, 1989
[ 14] S abatini, A.M, Bergamasca, M., and Dario, P. "Force Feedback-Based Telemicroman-ipulation for Robot Surgery on Soft Tissues" in IEEE 11th International Conference onEngineering in Medicine and Biology, 890-891. 1989.
[15] Satava, R.M. "The Modern Medical Battlefield: Sequitur on Advanced Medical Tech-nology" in IEEE Robotics and Automation Magazine, 21-5, September 1994.
Force Display for a Neurosurgical Probe-Guide March 7, 1995 40

[ 16] Shimoga, K.B. "Perceptual feedback issues in dexterous telemanipulation: Part I. Fin-ger force feedback; Part II. Finger touch feedback" in Proc. IEEE International Sympo-sium on Virtual Reality, Seattle, WA, Sept 18-22, pp. 263-279, 1993.
[17] Shimoga, K.B., Bankler, B., Khosla, P.K., Sclabassi, R.J. "Teleneurosurgery: AnApproach to Enhance the Dexterity of Neurosurgeons," Poster Presentation at Proceed-ings of the First International Conference on Medical Robotics and Computer AssistedSurgery, Pittsburgh, PA, Sept. 1994.
[18] Stewart, D.B, and Khosla, P.K. "Chimera 3.0, The Real-Time Operating System forReconfigurable Sensor-Based Control Systems, Program Documentation," ECEDepartment, Carnegie Mellon University, Pittsburgh, PA., 15213, 1993.
[19] Trident Robotics and Research. TRC004 PUMA Interface Card. Wexford, PA. 1994.
[20] Wiker, S.F., Duffle, N., Yen, T.Y., and Gale, K. "Comparison of Force and TactileFeedback for Grasp Force Control in Telemanipulation" in Annual NASA & USAFSpace Operations Automation and Robotics Conference, 1990.
7.0 Appendices
7.1 Appendix A -- Confidence Testing
The confidence testing done at various points in this thesis is based on the standard 2-sam-ple t-test, which is:
ml -m2t=
J __l)s2(Tj- + n2
where
nl-1 n2-1S2 = s12(nlqSn--22.~) +s22(nl ~ff-2-2)
and m is mean (average), s is the standard deviation (of the individual data points, not the mean) and n is the number of data points. The value of t is then used (either by tablelook-up or calculation) to get a confidence level that the mean of dataset 1 is greater thanthe mean of dataset 2. The table (or calculation) used depends on nl+n2. When nl+n2 relatively small (such as when two individual subject’s data is compared) then a student’st-distribution is used to determine the confidence level. When the data set is relativelylarger (such as when all of the data for two trials was compared), a normal distribution wasused.
As an example, consider the confidence that Subject #3’s task completion times for visualfeedback. He had 442ms +- 26ms for the hard contact and 270 +- 15 ms for the soft con-tact, with 34 and 37 trials, respectively. Remembering that the standard deviations given
Force Display for a Neurosurgical Probe-Guide March 7, 1995 41

are the standard deviations for the mean, they can be converted to individual standarddeviations by
= Smean~r~S iZn ,~ 2
Which leads to Standard Deviations of 151 and 911. Plugging into the formula yields
33 36S2 = 1512x ~ + 912x ~-~ = 15225.3
This leads to the result
442 - 270t = = 5.87
15225.3 (~-~ + ~-~)
which, when looking up on the t-distribution table, gives over a 99.95% degree of confi-dence in the statement "Soft contact mean task completion time is faster than hard contactmean task completion time for subject #3"
7.2 Appendix B -- Experimental Data
The data for each subject is shown in the Tables 1-3.
Subject Hard Std. Dev # Trials Soft Std Dev # Trials
1 295 9 68a 408 15 37
2 320 12 22 472 9 34
3 212 10 33 431 11 34
4 273 11 40 312 19 45
5 207 12 39 337 7 39
6 216 15 39 383 9 39
7 235 10 37 388 10 43
TABLE 1. Results using Auditory Feedback
a. Subject #1 had three extra minutes of time during this trial, in order to get a prelimi-nary learning curve so that the amount of time necessary for each experiment could bedetermined.
1. This example uses the rounded numbers found in the table. The actual numbers are slightly different.
Force Display for a Neurosurgical Probe-Guide March 7, 1995 42
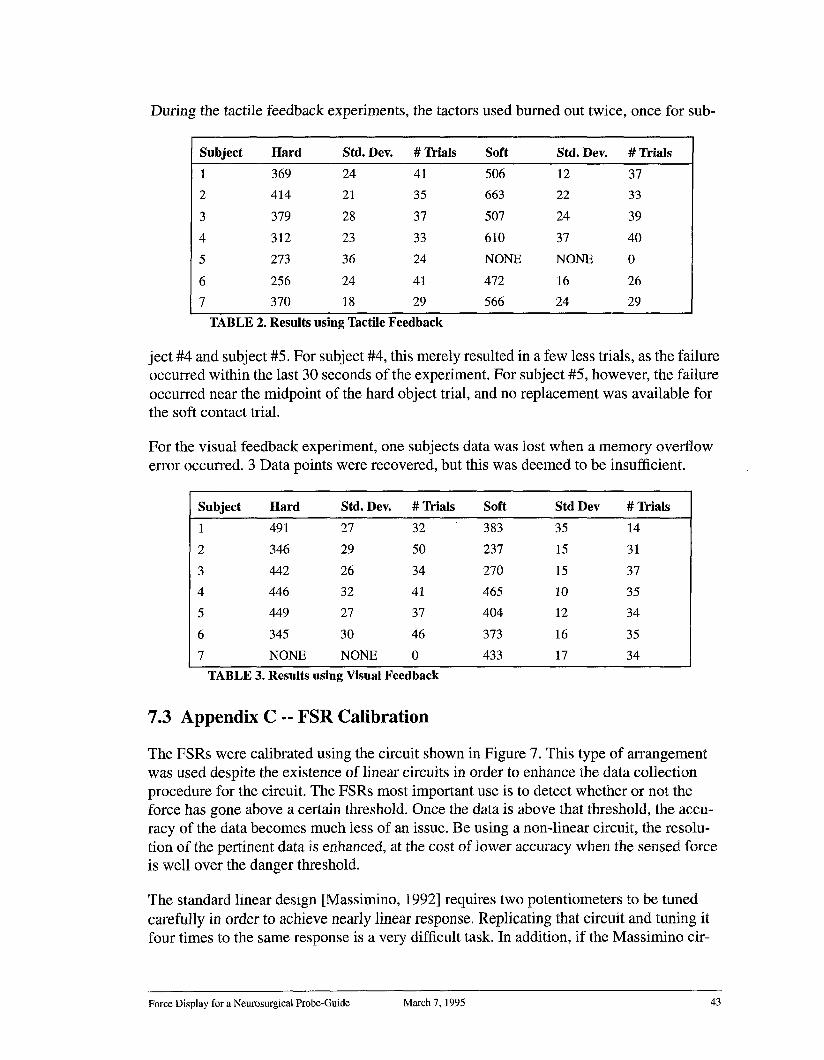
During the tactile feedback experiments, the tactors used burned out twice, once for sub-
Subject Hard Std. Dev. # Trials Soft Std. Dev. # Trials
1 369 24 41 506 12 37
2 414 21 35 663 22 33
3 379 28 37 507 24 39
4 312 23 33 610 37 40
5 273 36 24 NONE NONE 0
6 256 24 41 472 16 26
7 370 18 29 566 24 29
TABLE 2. Results using Tactile Feedback
ject #4 and subject #5. For subject #4, this merely resulted in a few less trials, as the failureoccurred within the last 30 seconds of the experiment. For subject #5, however, the failureoccurred near the midpoint of the hard object trial, and no replacement was available forthe soft contact trial.
For the visual feedback experiment, one subjects data was lost when a memory overflowerror occurred. 3 Data points were recovered, but this was deemed to be insufficient.
Subject Hard Std. Dev. # Trials Soft Std Dev # Trials
1 491 27 32 383 35 14
2 346 29 50 237 15 31
3 442 26 34 270 15 37
4 446 32 41 465 10 35
5 449 27 37 404 12 34
6 345 30 46 373 16 35
7 NONE NONE 0 433 17 34
TABLE 3. Results using Visual Feedback
7.3 Appendix C -- FSR Calibration
The FSRs were calibrated using the circuit shown in Figure 7. This type of arrangementwas used despite the existence of linear circuits in order to enhance the data collectionprocedure for the circuit. The FSRs most important use is to detect whether or not theforce has gone above a certain threshold. Once the data is above that threshold, the accu-racy of the data becomes much less of an issue. Be using a non-linear circuit, the resolu-tion of the pertinent data is enhanced, at the cost of lower accuracy when the sensed forceis well over the danger threshold.
The standard linear design [Massimino, 1992] requires two potentiometers to be tunedcarefully in order to achieve nearly linear response. Replicating that circuit and tuning itfour times to the same response is a very difficult task. In addition, if the Massimino cir-
Force Display for a Neurosurgical Probe-Guide March 7, 1995 43

cuit were converted to the voltage range necessary for the NPID, it would have approxi-mately a 2 Volt working range, as compared to a 3 V working range in the above circuit.
Data was collected for 4 separate FSRs using the circuit shown. The FSR was placed on atable and a piece of rubber placed over it (to evenly spread out the force over the entirearea. Weight was added to a stand that was placed on the FSR. The weight started at 0grams and was added in units of 5 grams up to 50 grams. Then the increase in weight wasmade 10 grams, up to 100 grams. After 100 grams, the unit increase was 20 grams up until200 grams. Finally, the voltage was measured at 250 and 300 grams.
Then, the weights were removed one at a time and the voltage measured. This was tocheck for any hysteresis in the FSR. This loading and unloading was done 3 times for eachof 4 FSRs, providing 24 data sets once it was apparent that there was very little hysteresisin the system, as shown in Figure 28.
3.5 ......
2.5
2
0.5
1 O0 150 200 250 300mass (g)
Figure 28 FSR #1, Increasing and Decreasing Loads
)50
1. The circuit used by Massimino apparently used a much larger FSR, given that his circuit measures up toapproximately 4 lbs. The FSRs used in this circuit have little change in value over 0.5 lbs.
Force Display for a Neurosurgical Probe-Guide March 7, 1995 44
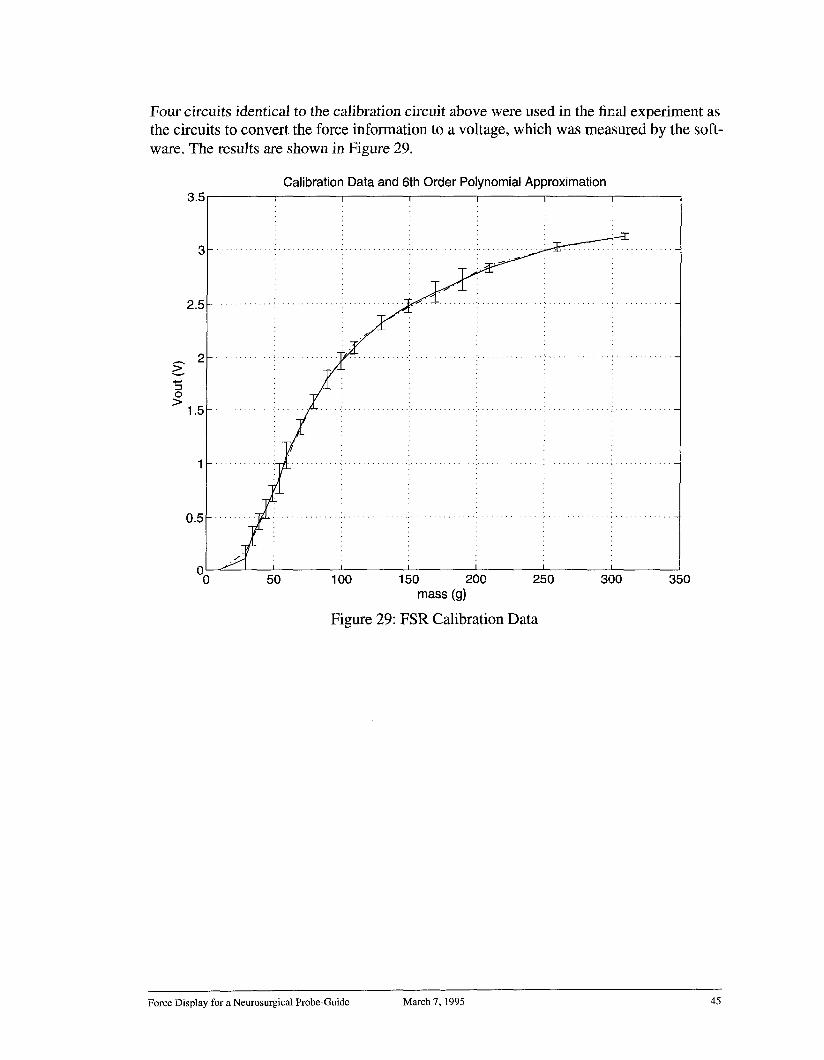
Four circuits identical to the calibration circuit above were used in the final experiment asthe circuits to convert the force information to a voltage, which was measured by the soft-ware. The results are shown in Figure 29.
2
Calibration Data and 6th Order Polynomial Approximation
00 50 1 O0 150 200 250
mass (g)
Figure 29: FSR Calibration Data
I
300 35O
Force Display for a Neurosurgical Probe-Guide March 7, 1995 45