Embed Size (px)
Citation preview

267Northwest Science, Vol. 87, No. 4, 2013
John F. Lehmkuhl1, U.S. Forest Service, Pacific Northwest Research Station, 1133 N. Western Avenue, Wenatchee, Washington 98801,
Andrea L. Lyons, Okanogan-Wenatchee National Forest, 215 Melody Lane, Wenatchee, Washington 98801,
Edd Bracken2, Washington Department of Fish and Wildlife, 201 N. Pearl Street, Ellensburg, Washington 98926,
Jodi Leingang, Okanogan-Wenatchee National Forest, 10237 U.S. Highway 12, Naches, Washington 98937,
William L. Gaines3, Okanogan-Wenatchee National Forest, 215 Melody Lane, Wenatchee, Washington 98801,
Erich K. Dodson4, U.S. Forest Service, Pacific Northwest Research Station, 1133 N. Western Avenue, Wenatchee, Washington 98801,
and
Peter H. Singleton, U.S. Forest Service, Pacific Northwest Research Station, 1133 N. Western Avenue, Wenatchee, Washington 98801
Forage Composition, Productivity, and Utilization in the Eastern Washington Cascade Range
1 Author to whom correspondence should be addressed. Email: [email protected] Current address: 4211 Sorenson Road, Ellensburg, WA 989263 Current address: Washington Conservation Science Institute, 12725 Wilson St., Leavenworth, WA 988264 Current address: Department of Forest Ecosystems and Society, 321 Richardson Hall, Oregon State University, Corvallis, OR 97331
Abstract
Provision of forage for wild and domestic ungulates, and the associated impacts of their herbivory, are contentious issues for wildland management in western North America. We quantified the composition, above-ground net production (ANP), and utilization of herbaceous and shrub vegetation in five non-forest and seven forest cover types across the core spring-summer-fall range of the Yakima elk herd in the eastern Washington Cascade Range. We randomly sampled each cover type along three elevational transects during a two-year period. Riparian/meadow was the most productive cover type (2,752 kg ha-1 ANP). High-productivity forest at low to high elevations produced 900-1200 kg ha-1 ANP. High-elevation forest and grassland, shrubland, and shrub-steppe produced 600-700 kg ha-1 ANP. The low-productivity forest cover types and parkland produced 100-400 kg ha-1 ANP. Utilization of forbs, grasses, and shrubs combined averaged 47% of ANP across all cover types, ranging from 26% in high-elevation forest to 63% in shrub-steppe. Grasses and forbs were equally utilized at about 57% of ANP, whereas shrubs were utilized at only 4% of ANP. Twenty-two of 55 shrub species accounted for the majority of shrub productivity and showed little to no long-term browsing; but, several shrub species were moderately to severely hedged. Moderate to high levels of ungulate utilization indicate potentially strong impacts of ungulate herbivory on pattern and process in eastern Cascades forests. Dry forest restoration management to reduce fuel loads and restore resiliency to disturbance likely will increase forage for ungulates, especially in closed-canopy true fir and Douglas-fir stands.
Keywords: ungulates, forage, grazing, exotic species, Washington
Introduction
The compatible provision of forage for wild and domestic ungulates, and the associated impacts of their herbivory, have long been important and
contentious issues for wildland management in western North America (Wisdom and Thomas 1996, Belsky and Blumenthal 1997, Vavra 2005) and northern Europe (Kuiters et al.1996, Gordon et al. 2004). In the Pacific Northwest, those issues also have been critical for population and habitat management of the Yakima elk herd (Mitchell and Lauckhart 1948, Gossett 1964), which is one of the largest elk herds in the state of Washington (WDFW 2002). Populations of native elk were largely decimated in eastern Washington during the latter half of the 19th century from hunting by Native Americans and a burgeoning Euroamerican

268 Lehmkuhl et al.
population (McCorquodale 1985, Dixon and Ly-man 1996). Elk rapidly became reestablished in the Yakima area from an initial reintroduction of 13 Yellowstone elk during 1913, and by the 1930’s the estimated population of 3,000 elk was considered to be significantly contributing, along with heavy and extensive livestock grazing, to near total utilization of forage across the upper Yakima River basin (WDFW 2002).
Grazing of domestic livestock (cattle, sheep, and horses) had been extensive and heavy since the mid-1800s in the Yakima area, which was among the first and most important centers of livestock production in Washington (Wissmar et al. 1994, OWNF 2007). When grazing management was initiated in the new Forest Reserves around 1905, about 260,000 sheep were recorded grazing in the upper Yakima basin, which supported 55% of the sheep and 83% of the cattle and horse graz-ing in the Yakima valley (Wissmar et al. 1994). Concerns were raised over the condition of the summer ranges as early as 1938, with Forest Service managers blaming poor range conditions on high numbers of elk and sportsmen demand-ing that all livestock be removed (Mitchell and Lauckhart 1948).
Livestock grazing has been drastically reduced through the twentieth century, but livestock and elk grazing in forested ranges continues to be an issue of forest ecosystem integrity (e.g. over-grazing, exotic species) and a source of conflict among ranchers, farmers adjacent to elk winter range, wildlife managers, and elk enthusiasts (e.g., hunters) (WDFW 2002). Regulated livestock grazing continues to be an important economic use of National Forest lands in the Yakima River drainage (OWNF 2007), and public demand to maintain high elk populations to maximize hunting opportunity or other social values (e.g., viewing) remains high (Vavra et al. 2007, WDFW 2010). However, livestock and elk both are supported by a spring and summer forage base that has declined since the early 1900s with meadow shrinkage (R. Everett, U.S. Forest Service, Wenatchee, WA, un-published data; see Haugo and Halpern 2007 for general trends in the Cascade Range), development of dense forests due to fire suppression (Everett
et al. 2000, Wright and Agee 2004, Hessburg et al. 2005), regrowth of old burns and pre-1990 clearcuts, and little forest clearcut harvesting as a result of regulatory changes during the last 20 years (Miller and Halpern 1998, Lehmkuhl et al. 2001). There are concerns that sustaining livestock and elk on a shrinking habitat base may have increased or sustained historical degradation of sensitive meadow and riparian habitats (OWNF 2007). The potential effects on elk habitat of dry forest thinning and prescribed burning for new fuels management programs designed to reduce catastrophic fires and restore forest health also are at issue (OWNF 2002).
Knowledge of forage composition, productiv-ity, and utilization (i.e., herbivory) is essential not only for informing wildland management (Hobbs 1996, Lyon and Christensen 2002, Wisdom et al. 2006), but also for understanding animal resource selection (Boyce and McDonald 1999), fitness (Cook et al. 2004), population ecology (Raedeke et al. 2002), and management (Lyon and Chris-tensen 2002). Composition is relatively easy to measure in broad vegetation classes via remote sensing or more finely by field measurement; but, measuring forage productivity remotely or in the field is complicated and difficult because of inherent variability of vegetation, and herbivory can remove forage or stimulate compensatory growth before measurement (e.g., McNaughton et al. 1996). Wildlife resource selection analysis has conventionally used infrared remote-sensing “greenness” indices (Todd et al. 1998, Paruelo and Lauenroth 1998) or field-based standing biomass estimates (e.g., Merrill 1994, Beck and Peek 2004, Anderson et al. 2005) as proxies for habitat productivity. The critical assumption for using either proxy is that consumption by wild and domestic herbivores is inconsequential (Singh et al. 1975); yet, it is well documented that wild herbivore consumption can be substantial (Frank and McNaughton 1993, Frank et al. 1998, Frank et al. 2002) and consumption by domestic livestock is easily estimated from known stocking rates. The failure to measure and adjust for consump-tion underestimates productivity and its variation among vegetation types (Sala et al. 1988, Biondini and Manske 1996, McNaughton et al. 1996) and
269Forage Dynamics in Eastern Cascades
introduces bias from uncorrected forage produc-tivity estimates in resource selection analysis.
Our goal was to develop baseline data that quantifies the composition and production dynam-ics of herbaceous and woody forage resources within the spring-summer-fall range of the Yakima elk herd. Our objectives were to quantify forage composition (especially exotic and elk-forage species), diversity, and above-ground production and utilization; and, to assess the potential bias in using standing biomass as a proxy for forage productivity or abundance.
Study Area
The Yakima elk herd uses a broad and well-defined area of the high Cascades as summer range, and winters primarily along the lower east slopes of the Cascade Range. The 4,300 km2 herd range is bounded by Interstate 90, the Yakima River, the northern boundary of the Yakama Reser-vation, and the crest of the Cascade Range in south-central Washington. Forested summer and spring-fall transition ranges are mainly on the Naches and Cle Elum Ranger Districts of the Okanogan-Wenatchee National Forest (OWNF). Our study area comprised a 2,500 km2 core area of the spring-summer-fall range on the Naches Ranger District.
Low- and mid-montane forests are dominated by open-grown ponderosa pine (Pinus ponderosa) at the lowest elevations (600 m), with increasing dominance of Douglas-fir (Pseudotsuga menziesii [PSME]) and grand fir (Abies grandis [ABGR]) as elevation increases up to about 1200 m. Upper montane forest dominated by subalpine fir (A. lasiocarpa [ABLA]), with silver fir (A. amabilis) and mountain hemlock (Tsuga mertensiana), occur up to the crest of the Cascade Range at about 1500 m elevation. Parklands, a mosaic of subalpine fir and dry meadows, and steep rocky areas are common at high elevations (1700 m). Winter range is mostly on Washington State lands in shrub-steppe or dry grassland vegetation at about 300 m elevation. Shrub-steppe and dry grasslands are dominated by native bunchgrasses, exotic annual grasses (Bromus tectorum), and big sagebrush (Artemisia tridentata tridentata). The
herd range is typical of many elk ranges in the interior Pacific Northwest.
In recent years, the Yakima elk herd has ranged from an uncertain high of 15,036 elk in 1999 to 8,589 in 2010 (WDFW 2010). The estimated elk population size during the study (2005-2006) was 8,851-9,589 elk, co-occurring with roughly 5,300 mule deer (Odocoileus hemionus) (WDFW 2010). The ecological density of elk on the summer range was approximately 3.3 elk km-2 based on an average population of 9,220 elk during the study period and an estimated 2,800 km2 of habitat that includes 95% of elk radiotelemetry locations re-corded in a separate study (P. Singleton, US Forest Service, Wenatchee, WA, unpublished data). The similarly approximated winter range density is 4.6 elk km-2. Assuming similar summer and winter ranges for the mule deer herd, the summer-range density of deer is roughly 1.9 deer km-2 and the winter-range density is 2.6 deer km-2. Thus, the total wild ungulate density is about 5.2 animals km-2 on the summer range and 7.2 animals km-2 on the winter range.
During the study period a combined 2,667 cow/calf (567 [21%]) and ewe/lamb (2,100 [79%]) pairs were grazed annually on Forest Service lands in five separate grazing allotments over an average 78-day (sheep) to 117-day (cattle) period from about June 1 to September 30. The stock-ing rate totaled 7,487 “head-months”: 30% from cow/calf pairs and 70% from ewe/lamb pairs. A head-month is the Forest Service equivalent of an animal-unit-month (AUM), which is defined as the amount of forage required by a standardized animal unit for one month. The standard animal unit is a 455 kg (1,000 lb.) mature cow with a consumption rate of 9.1kg (20 lb.) forage day-1, or 372 kg (820 lb.) month-1 (Holechek et al. 1995). Stocking rates (head-months) for other classes of livestock (e.g., cow/calf or ewe/lamb pairs) and wild ungulates are estimated as a propor-tion of that standard based on unit (individual animal) body weights, forage consumption rates, and local forage productivity (i.e., quantity and quality). In the study area, forage requirements used to manage grazing are: cow/calf pair, 455 kg (1,000 lb.) forage month-1; ewe/lamb pair, 90

270 Lehmkuhl et al.
kg (200 lb.) forage month-1; elk, 225 kg (500 lb.) forage month-1; and deer, 100 kg (222 lb.) forage month-1 (OWNF 2007). The total annual stocking rate (livestock plus wild ungulates) of the study area is estimated at 78,103 head-months, based on 55,320 elk head-months (71%), 15,296 mule deer head-months (19%), and 7,487 head-months of domestic livestock (10%).
Climate in the study area is continental with cold snowy winters and warm dry summers. Mean cumulative precipitation for the water years (October-September) from 1988 through 2005 was 162 cm (NRCS 2008). Mean minimum temperature for that period was -5.6 °C during February, and mean maximum temperature was 22 °C during August. Climate during the study year 2006 was similar to the 1988-2005 17-year average in terms of cumulative precipitation (161 cm) and mean daily temperatures. The study year 2005 was dryer and warmer than 2006 and the 17-year average. Precipitation during the 2005 water year was 70% (114 cm) of the long-term average and about half the 2006 precipitation. Mean daily temperature during winter through April 2005 consistently was ~3 °C warmer than during 2006. Summer temperatures were similar during 2005 and 2006.
Methods
Field Sampling
Cover Type Definition—We initially mapped 19 non-forest and forest cover types for field sam-pling from existing GIS (Geographic Information System) map data (Table 1). We based our initial cover type classes on a preliminary analysis of elk use from telemetry relocations and availability. Mapped cover types were designed to typify elk habitat in a classification that was feasible for replicated field sampling over the large study land-scape. The Yakima elk herd ranges over numerous jurisdictions, so we combined maps of existing vegetation from an existing elk habitat assessment (P. Singleton, US Forest Service, Wenatchee WA, unpublished report), the Naches Ranger District, the Washington Dept. of Natural Resources, the Yakama Nation, the Washington Department of Fish and Wildlife, and private landowners.
We defined the initial 12 forest cover types based on three dominant forest cover types, open (≤40%) or closed (>40%) forest canopy, and north vs. south aspects (Table 1). Forest cover types were: 1) lower montane ponderosa pine, Douglas-fir, and dry grand fir forests (designated as PSME cover types), 2) mid-montane mesic grand fir and western hemlock forests (designated as ABGR cover types), and 3) upper montane silver fir, mountain hemlock, and subalpine fir forests (designated as ABLA cover types). Our canopy-cover threshold is somewhat arbitrary and may encompass a wide range of understory production, if production is a linear function of canopy cover (McConnel and Smith 1970); but, Young et al. (1967) found a strong 36-50% canopy cover threshold defining low vs. high herbaceous and shrub production in mixed-conifer forests of the similar nearby Blue Mountains. We mapped seven non-forest cover types: riparian areas, mesic mid-elevation meadows, dry steppe grassland, alpine parkland, mid- and high-elevation shrub-lands, rock fields in shrublands, and low-elevation shrub-steppe.
We measured a stratified random sample of each initial cover type along each of three elevational corridors (strata) to yield at least three replicate sample sites per initial cover type. We chose sample locations for each cover type randomly from the pool of mapped stands located within 1.5 km of three primary highways (i.e., the corridors) that transect the study area from east to west. We also sampled species composition at a selection of random sites away from corridors to boost sample size of riparian, meadow, and grassland cover types, especially in high-elevation wilderness areas and portions of the low-elevation winter range. Many sample locations outside wilderness areas were near roads, which might be expected to depress elk use (Rowland et al. 2000), hence underestimate utilization; however, the managed portion of the study area is highly roaded and separate analysis of extensive radio-telemetry data showed no ef-fect of distance from road on elk site selection (P. Singleton, US Forest Service, unpublished data). Our samples were on lands managed by the US Forest Service (nearly all the summer range) and the WDFW (mostly winter range).
271Forage Dynamics in Eastern Cascades
After completing field work and a preliminary floristic analysis we used hierarchical cluster analysis of floristics and results from preliminary analysis of understory productivity to group the initial 19 cover types into seven forest and five non-forest cover types, characterized by dominance of PSME, ABGR, or ABLA and low (< 400 kg ha-1), moderate (400-900 kg ha-1), or high (>900 kg ha-1) understory primary productivity (Table 1). This allowed us to create a smaller analysis set and pool similar samples to increase sample size for each cover type (Table 1).
Understory Composition and Productivity—At each sample site, we defined a 30 x 35 m “macro-plot” that contained three parallel 30-m transects.
We sampled plots at the beginning of the growing season in spring (May, June) and at the end of the growing season (August, September, October) during 2005 and 2006. The timing of sampling visits varied by cover type to coincide with snow melt, green-up, and vegetation dormancy. For example, we sampled low-elevation sites in hot-dry shrub-steppe during August after dormancy, but sampled high-elevation meadows at the end of the summer growing season during October. We estimated percent cover of each plant species < 1m tall as the average vertical projection of the plant crown, or area, in nine 0.5-m2 quadrats (3 per transect). Shrubs and trees >1 m tall were measured with the shrub protocol (below). We measured annual herbaceous above-ground net
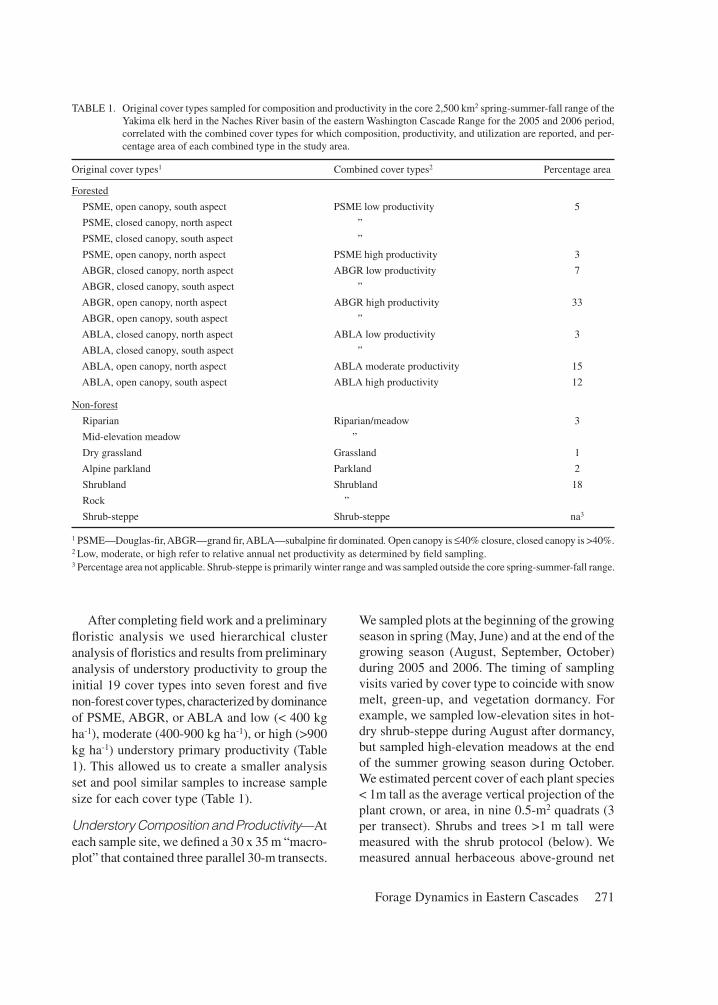
TABLE 1. Original cover types sampled for composition and productivity in the core 2,500 km2 spring-summer-fall range of the Yakima elk herd in the Naches River basin of the eastern Washington Cascade Range for the 2005 and 2006 period, correlated with the combined cover types for which composition, productivity, and utilization are reported, and per-centage area of each combined type in the study area.
Original cover types1 Combined cover types2 Percentage area
Forested
PSME, open canopy, south aspect PSME low productivity 5
PSME, closed canopy, north aspect ”
PSME, closed canopy, south aspect ”
PSME, open canopy, north aspect PSME high productivity 3
ABGR, closed canopy, north aspect ABGR low productivity 7
ABGR, closed canopy, south aspect ”
ABGR, open canopy, north aspect ABGR high productivity 33
ABGR, open canopy, south aspect ”
ABLA, closed canopy, north aspect ABLA low productivity 3
ABLA, closed canopy, south aspect ”
ABLA, open canopy, north aspect ABLA moderate productivity 15
ABLA, open canopy, south aspect ABLA high productivity 12
Non-forest
Riparian Riparian/meadow 3
Mid-elevation meadow ”
Dry grassland Grassland 1
Alpine parkland Parkland 2
Shrubland Shrubland 18
Rock ”
Shrub-steppe Shrub-steppe na3
1 PSME—Douglas-fir, ABGR—grand fir, ABLA—subalpine fir dominated. Open canopy is ≤40% closure, closed canopy is >40%.2 Low, moderate, or high refer to relative annual net productivity as determined by field sampling. 3 Percentage area not applicable. Shrub-steppe is primarily winter range and was sampled outside the core spring-summer-fall range.

272 Lehmkuhl et al.
production (ANP) and utilization from three caged-plot pairs per macroplot during 2005 and 2006. We clipped samples within 1 cm of the ground surface from 0.5-m2 plots located inside and outside movable grazing cages (1.5 m x 1.5 m) (Frank et al. 2002) placed on the site the pre-vious autumn. We pooled clipped biomass into graminoid and forb categories. We bagged and dried samples at 60 °C for 24-48 hours prior to obtaining dry matter weights.
Shrub Productivity—We estimated annual shrub production and utilization at the end of the growing season in late summer or early fall, depending on phenology at different elevations. We used the non-destructive weight-unit (also called reference-unit) method (Bonham 1989, BLM 1996) for sampling shrub production on the permanent macroplots. We measured only current-year growth that was considered forage and within reach of elk (≤ 2.3 m above ground on the upslope side). We defined forage as new twigs and leaves, but not old wood. We considered conifers ≤ 2.3 m tall as shrubs if designated as elk or deer browse.
We measured shrubs in four 3 x 13.5 m per-manent rectangular plots (40.4 m2) at each corner of the macroplot. We recorded the number of weight-units for each species, the percent of cur-rent year weight-units that had been browsed, and the average percent of a weight-unit removed by browsing. We classified shrub hedging and age (seedling, young, mature, decadent), and esti-mated a growth adjustment factor to adjust for sampling before peak production at a site (BLM 1996). The growth adjustment factor measured the cumulative percent of the potential annual growth attained at the time of measurement (scale 1-10 with 1 = 10% and 10 = 100% of potential annual growth for that year). We then clipped a reference set of weight-units for that macroplot from 2 destructive-sampling plots adjacent to the macroplot. We harvested the first six weight-units encountered on different plants in each of two plots for a total sample of up to 12 weight-units for each species. We collected only current-year forage from a weight unit. We bagged and dried samples at 60 °C for 24-48 hours prior to obtain-ing dry weights.
Analysis
Floristic Analysis—We summarized the mean composition and species richness of cover types by dominant and forage species across locations and two sampling years. We developed a list of 20 primary herbaceous and shrub forage species used by deer and elk based on Cook (2002), local expertise of wildlife biologists, and a preliminary analysis of plant parts in fecal samples (A. Lyons, Okanogan-Wenatchee National Forest, Wenatchee, WA, unpublished data). Elk diets are notori-ously variable among locations, seasons and years (Cook 2002), so our short list is not exhaustive. We characterized the floristic similarity among vegetation cover types, excluding rare species (< 5% frequency), by ordination with non-metric multidimensional scaling (NMS). We used Indica-tor Species Analysis (ISA) to identify indicator, or characteristic, species found mostly in a single cover type and present in the majority of the sites belonging to that cover type (Dufrêne and Legendre 1997). Such indicator species might be of par-ticular interest to managers attempting to manage particular cover types or species. ISA combined information on both species relative abundance (cover) and constancy to estimate indicator value for each species in each group. The maximum indicator value of a species within our 12 cover types was tested for statistical significance (P ≤ 0.05) against the random expectation calculated by 1,000 Monte Carlo permutations. All floristic analyses were done in Program PC-ORD version 5.0 (MjM Software, Gleneden Beach, OR, USA).
Productivity—We estimated graminoid and forb ANP and utilization at each sample location from the paired caged-plot data using Method 1 of McNaughton et al. (1996):
ANP = (utilization t1 + utilization t2) + outbiomass t2 Utilization = utilization t1 + utilization t2
where utilization t was the mean difference between inside cage biomass and outside cage biomass for the three paired caged-plots, and outbiomass t2 was the mean biomass outside cages at the second sample period. We adjusted negative utilization values (i.e., when outside-cage grazed biomass was greater than ungrazed biomass inside the cage due
273Forage Dynamics in Eastern Cascades
to sampling variation) by setting utilization to zero. Mean and standard error of ANP and utilization were estimated separately for 2005 and 2006. The proportion of ANP consumed was calculated as the ratio of mean utilization and mean ANP for each year. Annual production and utilization for the study period was estimated as the mean of both years, and percentage utilization as the ratio of mean utilization and production.
We estimated shrub production and utilization for individual shrub species at each sample location as the mean value of the four subplots. Production and utilization for a cover type were the sum of species values. Production was first calculated by multiplying the number of weight units by the mean dry weight of individual weight units and the growth adjustment factor. We then added the estimated utilization, which was calculated as the product of the proportion of stems browsed and the proportion of individual stems removed. This might have resulted in end-of-growing sea-son estimates that underestimated utilization for some species browsed during the winter; but, we felt that over-winter utilization estimates were problematic because we could not account for variable winter weather and its effects on ungulate herbivore distribution and browsing pressure during two years of sampling. We estimated long-term browsing pressure on species as the proportion of plants of a species in different form classes (BLM 1996) to estimate long-term browsing impacts. We made only one estimate of total shrub production for the study (i.e., not annual estimates) because some cover types were sampled in only one year for logistical reasons.
Results
Composition
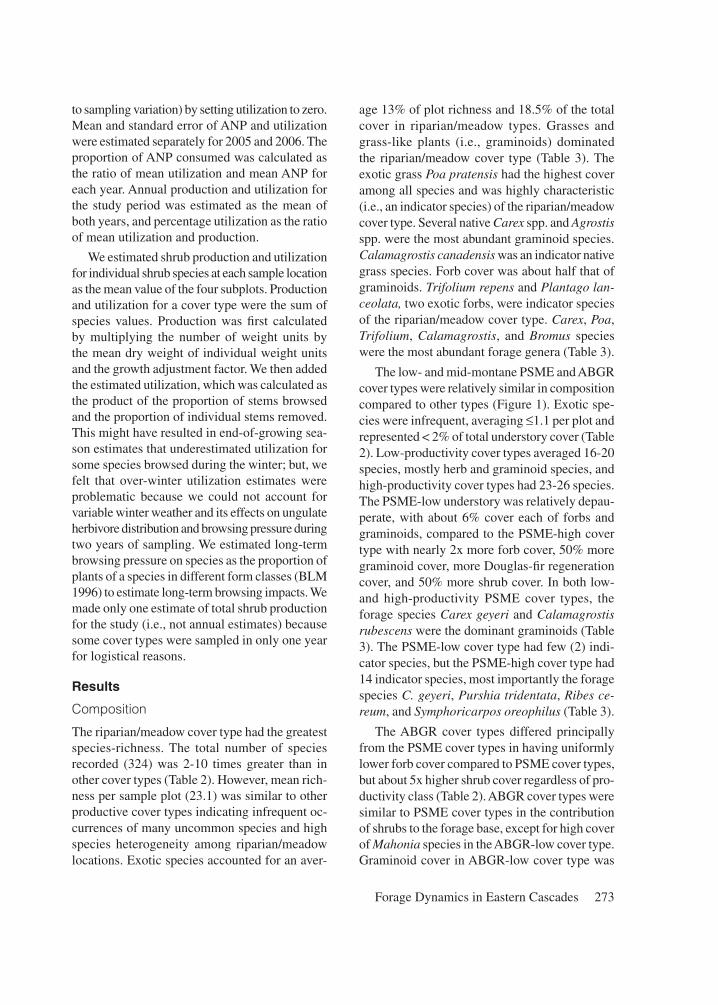
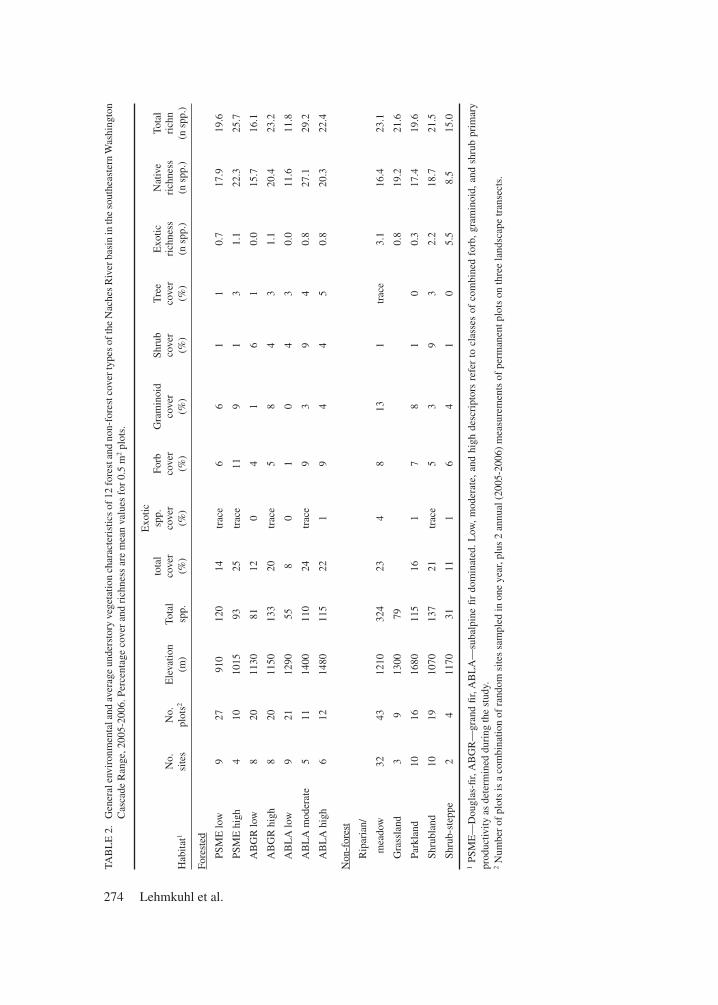
The riparian/meadow cover type had the greatest species-richness. The total number of species recorded (324) was 2-10 times greater than in other cover types (Table 2). However, mean rich-ness per sample plot (23.1) was similar to other productive cover types indicating infrequent oc-currences of many uncommon species and high species heterogeneity among riparian/meadow locations. Exotic species accounted for an aver-
age 13% of plot richness and 18.5% of the total cover in riparian/meadow types. Grasses and grass-like plants (i.e., graminoids) dominated the riparian/meadow cover type (Table 3). The exotic grass Poa pratensis had the highest cover among all species and was highly characteristic (i.e., an indicator species) of the riparian/meadow cover type. Several native Carex spp. and Agrostis spp. were the most abundant graminoid species. Calamagrostis canadensis was an indicator native grass species. Forb cover was about half that of graminoids. Trifolium repens and Plantago lan-ceolata, two exotic forbs, were indicator species of the riparian/meadow cover type. Carex, Poa, Trifolium, Calamagrostis, and Bromus species were the most abundant forage genera (Table 3).
The low- and mid-montane PSME and ABGR cover types were relatively similar in composition compared to other types (Figure 1). Exotic spe-cies were infrequent, averaging ≤1.1 per plot and represented < 2% of total understory cover (Table 2). Low-productivity cover types averaged 16-20 species, mostly herb and graminoid species, and high-productivity cover types had 23-26 species. The PSME-low understory was relatively depau-perate, with about 6% cover each of forbs and graminoids, compared to the PSME-high cover type with nearly 2x more forb cover, 50% more graminoid cover, more Douglas-fir regeneration cover, and 50% more shrub cover. In both low- and high-productivity PSME cover types, the forage species Carex geyeri and Calamagrostis rubescens were the dominant graminoids (Table 3). The PSME-low cover type had few (2) indi-cator species, but the PSME-high cover type had 14 indicator species, most importantly the forage species C. geyeri, Purshia tridentata, Ribes ce-reum, and Symphoricarpos oreophilus (Table 3).
The ABGR cover types differed principally from the PSME cover types in having uniformly lower forb cover compared to PSME cover types, but about 5x higher shrub cover regardless of pro-ductivity class (Table 2). ABGR cover types were similar to PSME cover types in the contribution of shrubs to the forage base, except for high cover of Mahonia species in the ABGR-low cover type. Graminoid cover in ABGR-low cover type was
274 Lehmkuhl et al.
TAB
LE
2.
Gen
eral
env
iron
men
tal a
nd a
vera
ge u
nder
stor
y ve
geta
tion
char
acte
rist
ics
of 1
2 fo
rest
and
non
-for
est c
over
type
s of
the
Nac
hes
Riv
er b
asin
in th
e so
uthe
aste
rn W
ashi
ngto
n C
asca
de R
ange
, 200
5-20
06. P
erce
ntag
e co
ver
and
rich
ness
are
mea
n va
lues
for
0.5
m2
plot
s.
Exo
tic
tota
l sp
p.
Forb
G
ram
inoi
d Sh
rub
Tre
e E
xotic
N
ativ
e To
tal
N
o.
No.
E
leva
tion
Tota
l co
ver
cove
r co
ver
cove
r co
ver
cove
r ri
chne
ss
rich
ness
ri
chn
Hab
itat1
si
tes
plot
s2 (m
) sp
p.
(%)
(%)
(%)
(%)
(%)
(%)
(n s
pp.)
(n
spp
.)
(n s
pp.)
Fore
sted
PS
ME
low
9
27
910
120
14
trac
e 6
6 1
1 0.
7 17
.9
19.6
PS
ME
hig
h
4 10
10
15
93
25
trac
e 11
9
1 3
1.1
22.3
25
.7
A
BG
R lo
w
8 20
11
30
81
12
0 4
1 6
1 0.
0 15
.7
16.1
A
BG
R h
igh
8 20
11
50
133
20
trac
e 5
8 4
3 1.
1 20
.4
23.2
A
BL
A lo
w
9 21
12
90
55
8 0
1 0
4 3
0.0
11.6
11
.8
A
BL
A m
oder
ate
5 11
14
00
110
24
trac
e 9
3 9
4 0.
8 27
.1
29.2
A
BL
A h
igh
6 12
14
80
115
22
1 9
4 4
5 0.
8 20
.3
22.4
Non
-for
est
R
ipar
ian/
m
eado
w
32
43
1210
32
4 23
4
8 13
1
trac
e 3.
1 16
.4
23.1
G
rass
land
3
9 13
00
79
0.8
19.2
21
.6
Pa
rkla
nd
10
16
1680
11
5 16
1
7 8
1 0
0.3
17.4
19
.6
Sh
rubl
and
10
19
1070
13
7 21
tr
ace
5 3
9 3
2.2
18.7
21
.5
Sh
rub-
step
pe
2 4
1170
31
11
1
6 4
1 0
5.5
8.5
15.0
1 PS
ME
—D
ougl
as-fi
r, A
BG
R—
gran
d fir
, AB
LA
—su
balp
ine
fir d
omin
ated
. Low
, mod
erat
e, a
nd h
igh
desc
ript
ors
refe
r to
cla
sses
of
com
bine
d fo
rb, g
ram
inoi
d, a
nd s
hrub
pri
mar
y pr
oduc
tivity
as
dete
rmin
ed d
urin
g th
e st
udy.
2
Num
ber
of p
lots
is a
com
bina
tion
of r
ando
m s
ites
sam
pled
in o
ne y
ear,
plus
2 a
nnua
l (20
05-2
006)
mea
sure
men
ts o
f pe
rman
ent p
lots
on
thre
e la
ndsc
ape
tran
sect
s.

275Forage Dynamics in Eastern Cascades
TAB
LE
3.
Mea
n pe
rcen
tage
cov
er a
nd to
tal l
ife-
form
cov
er o
f el
k fo
rage
gen
era
in 1
2 co
ver
type
s of
the
Nac
hes
Riv
er b
asin
in th
e so
uthe
aste
rn W
ashi
ngto
n C
asca
de R
ange
, 200
5-20
06.
PSM
E
PSM
E
AB
GR
A
BG
R
AB
LA
A
BL
A
AB
LA
R
ipar
ian/
G
rass
- Pa
rk-
Shru
b-
Shru
b-L
ife-
form
G
enus
lo
w1
high
lo
w
high
lo
w
mod
. hi
gh
mea
dow
la
nd
land
la
nd
step
pe
Mea
n
Forb
B
alsa
mor
hiza
(2)
2
trac
e2
trac
e
trac
e
trac
e
Eri
ogon
um (
7)
tr
ace
trac
e 4
trac
e tr
ace 4
tr
ace
trac
e
Lup
inus
(4)
tr
ace
trac
e tr
ace
trac
e
2 1
trac
e
1 4
1 tr
ace
1
Sene
cio
(3)
tr
ace
tr
ace
trac
e 4
trac
e tr
ace
tr
ace
tr
ace
Tr
ifol
ium
(4)
1
trac
e tr
ace
1 4
trac
e 4
trac
e tr
ace
tr
ace
subt
otal
1
1 tr
ace
trac
e
2 1
1 tr
ace
2 1
trac
e 1
Gra
min
oid
Bro
mus
(9)
tr
ace
trac
e tr
ace
trac
e
trac
e tr
ace
1 1
trac
e 1
1 4
trac
e
Cal
amag
rost
is (
3)
2 4
trac
e 5 4
tr
ace
trac
e tr
ace
1 4
tr
ace
1
Car
ex (
24)
3 4 4
1
2
2 4
3 6 4
1 tr
ace
2
Fe
stuc
a (5
) tr
ace
trac
e tr
ace
trac
e
trac
e tr
ace
trac
e 2 4
0.
8 tr
ace
tr
ace
Ju
ncus
(7)
trac
e
trac
e
trac
e
tr
ace
Po
a (7
) 1 4
tr
ace
tr
ace
trac
e 2 4
1
2
2 4
1
Pse
udor
oegn
eria
(1)
tr
ace
tr
ace
trac
e
1
3 4
1
Stip
a/A
chna
ther
um (
2)
trac
e tr
ace
tr
ace
tr
ace
tr
ace
5
1
1
su
btot
al
6 9
1 8
trac
e 2
3 2
7 2
4 7
5
Shru
b A
cer
(1)
tr
ace
trac
e
Am
elan
chie
r (1
) tr
ace
trac
e tr
ace
tr
ace
C
eano
thus
(1)
trac
e
tr
ace
C
hrys
otha
mnu
s (2
) tr
ace
tr
ace
tr
ace
H
olod
iscu
s (1
)
tr
ace
tr
ace
M
ahon
ia (
2)
trac
e tr
ace
2 4
trac
e tr
ace
trac
e tr
ace
trac
e
tr
ace
P
runu
s (1
)
tr
ace
P
ursh
ia (
1)
trac
e tr
ace 4
tr
ace
tr
ace
R
ibes
(5)
trac
e 4
trac
e 1
4 4
trac
e
1
R
osa
(2)
trac
e tr
ace
1 4
1 tr
ace
1
trac
e
tr
ace
Sa
lix
(2)
tr
ace
tr
ace
trac
e
Spir
aea
(2)
trac
e tr
ace
trac
e 1 4
tr
ace
trac
e
trac
e
tr
ace
Sy
mph
oric
arpo
s (3
) tr
ace
1 4
1 tr
ace
tr
ace
tr
ace
trac
e
trac
e
su
btot
al
1 1
4 1
trac
e 2
4 1
tr
ace
trac
e
1
Tota
l
8 1
5 9
trac
e 6
8 12
7
4 5
7 7
1 PS
ME
—D
ougl
as-fi
r, A
BG
R—
gran
d fir
, AB
LA
—su
balp
ine
fir d
omin
ated
. Low
, mod
erat
e, a
nd h
igh
desc
ript
ors
refe
r to
cla
sses
of
forb
, gra
min
oid,
and
shr
ub p
rim
ary
prod
uctiv
ity
as d
eter
min
ed d
urin
g th
e st
udy.
2
Num
ber
of s
peci
es w
ithin
gen
era
enco
unte
red
in s
ampl
e pl
ots.
3 T
race
< 1
% c
over
. 4
Gen
era
with
one
or
mor
e in
dica
tor
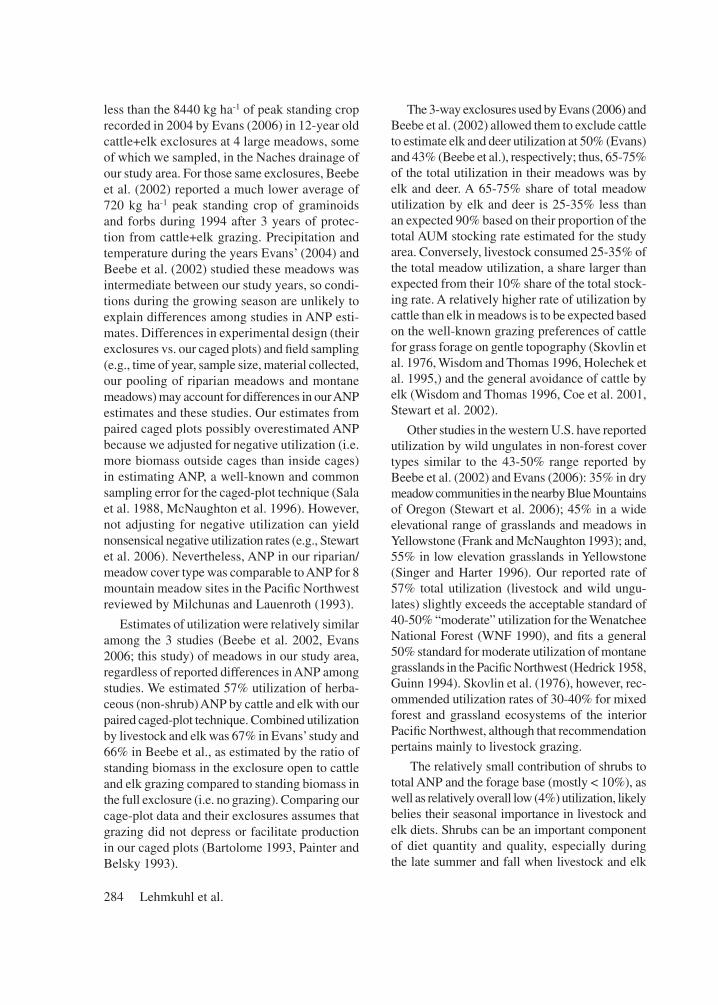
spec
ies
in th
e co
ver
type
. See
text
for
spe
cies
nam
e.

276 Lehmkuhl et al.
markedly low (1.25%), whereas graminoid cover in ABGR-high cover type (8.09%) was comparable to PSME-high cover type (8.61%), mostly Carex geyeri and Calamagrostis rubescens. C. rubescens also was strong indicator species of the ABGR-high cover type, i.e., cover was consistently high and constant among sample plots.
High-elevation parkland was floristically similar to the ABLA cover types (Figure 1, Table 2). Carex and Festuca graminoids and the Lupinus forb species contributed most to forage species cover.
The low-montane grassland and shrubland cover types and shrub-steppe were very similar floristically (Figure 1). Grassland was moderately rich in total species (79) with few exotic species. Achnatherum lemmonii (formerly Stipa) and Festuca idahoensis dominated graminoid cover and were the primary forage species. Grasslands were floristically unique in having among the highest number (11) of indicator forbs.
Shrub-steppe and montane shrubland were floristically similar primarily in the high cover of the grasses Pseudoroegneria spicata, Poa secunda, and Bromus tectorum; yet, shrub-steppe differed from shrubland in several important ways. Shrub-
steppe was the most species poor (31 spp.) of all cover types and had the second-highest number of exotic species (Table 2). Although shrub-steppe had slightly fewer exotic species than the riparian/meadow cover type, exotic species strongly char-acterized the shrub-steppe plant community: eight (57%) of the 14 indicator species in shrub-steppe were exotic forbs (5) and graminoids (3) compared to three exotic species (38%) among eight indi-cator species in the riparian/meadow cover type. Exotic intermediate wheatgrass (Thinopyrum intermedium) and native bluebunch wheatgrass (P. spicatum) were the dominant grasses in shrub-steppe. Grasses had relatively higher cover than forbs in shrub-steppe compared to shrublands (Table 2), and sagebrush (Artemisia tridentata) was the dominant shrub in shrub-steppe.
Productivity
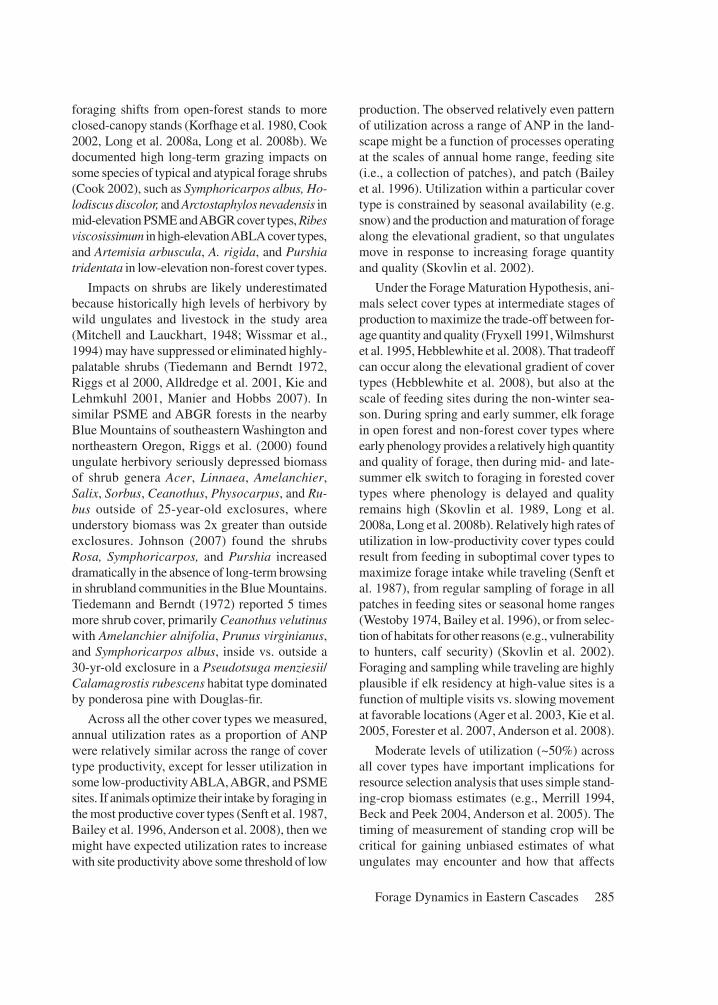
Riparian/meadow was the most productive cover type, with more than 2x greater herbaceous and shrub production than other cover types, producing an average 2,752 kg ha-1 over both years of the study (Figure 2). The high-productivity PSME, ABGR and ABLA forest cover types as a group
Figure 1. Ordination of cover types and important environmental variables by non-metric multidi-mensional scaling of floristic composition in the Naches River basin in the southeastern Washington Cascade Range, 2005-2006.

277Forage Dynamics in Eastern Cascades
ranked second in productivity, producing from about 900-1200 kg ha-1 understory biomass. The ABLA-moderate and non-forest grassland, shru-bland, and shrub-steppe cover types as a group ranked third in understory productivity, produc-ing 600-700 kg ha-1 herbaceous and forage shrub biomass. The low-productivity PSME, ABGR and ABLA forest cover types and parkland ranked fourth in productivity, producing 100-400 kg ha-1 herbaceous and shrub biomass.
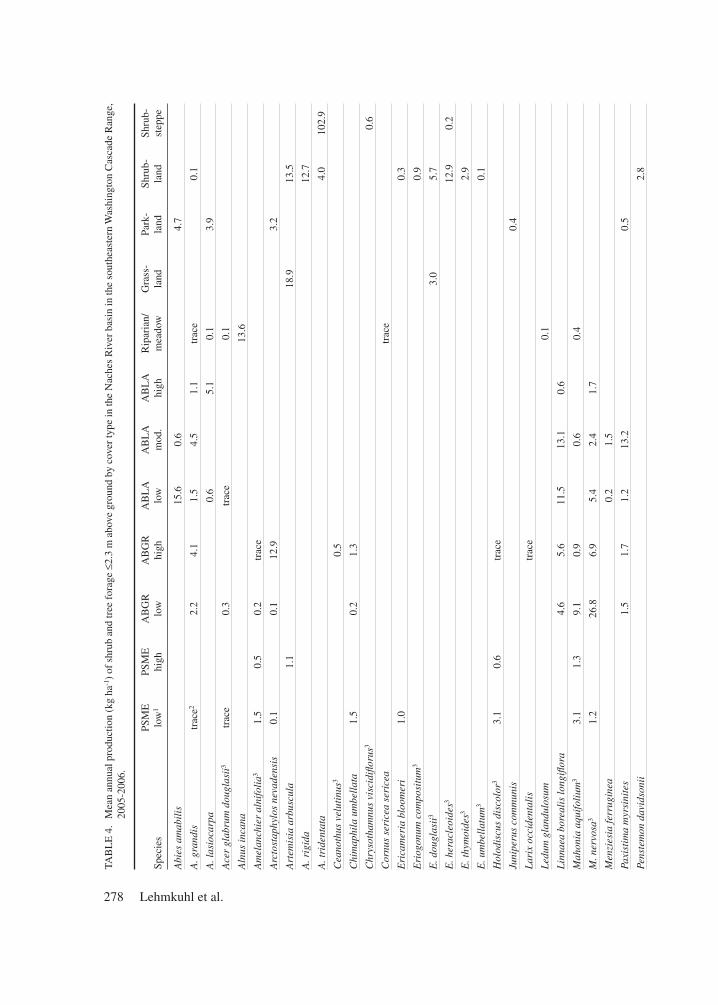
In the riparian/meadow cover type, graminoids constituted 65% (1796 kg ha-1) of the annual pro-duction (Figure 2). Carex, Poa, and Calamagrostis genera had the greatest cover among the forage graminoid genera (Table 3). The remainder of production was from forbs (34%, 932 kg ha-1), and a minor contribution from shrubs (1%, 24 kg ha-1). T. repens was the most abundant forage forb in terms of cover. Alnus incana was the most productive shrub, followed by the Salix spp. and Symphoricarpos albus (Table 4), both identified forage species.
Among the other non-forest cover types, an-nual productivity of montane grassland (723 kg ha-1), shrubland (722 kg ha-1), and shrub-steppe (673 kg ha-1) were similar, with grasses account-ing for 51% (shrubland, shrub-steppe) to 62% (grassland) of the production (Figure 2). The shrub component of production was greatest in shrub-steppe (16%), followed by shrubland (10%), and grasslands (3%). Artemisia tridentata dominated shrub-steppe shrub production, whereas forage spe-cies Chrysothamnus viscidiflorus and Eriogonum heracleoides contributed a small amount of forage (Table 4). In shrublands, Artemisia arbuscula and Arctostaphylos nevadensis, Eriogonum spp., and Purshia tridentata, the latter two both forage species, were the main producers. In grassland, A. arbuscula dominated shrub production, with Eriogonum douglasii producing a small amount of forage. Alpine parkland produced the least among the non-forest cover types (324 kg ha-1). Forbs dominated (67%) parkland production, followed by shrubs (19%) and grasses (15%). Lupinus,
Figure 2. Mean contributions of forbs, graminoids, and shrubs to total above-ground net primary production in cover types in the Naches River basin in the southeastern Washington Cascade Range, 2005-2006. The numbers of sample locations follows cover type names in parentheses.
278 Lehmkuhl et al.
TAB
LE
4.
Mea
n an
nual
pro
duct
ion
(kg
ha-1
) of
shr
ub a
nd tr
ee f
orag
e ≤2
.3 m
abo
ve g
roun
d by
cov
er ty
pe in
the
Nac
hes
Riv
er b
asin
in th
e so
uthe
aste
rn W
ashi
ngto
n C
asca
de R
ange
, 20
05-2
006.
PS
ME
PS
ME
A
BG
R
AB
GR
A
BL
A
AB
LA
A
BL
A
Rip
aria
n/
Gra
ss-
Park
- Sh
rub-
Sh
rub-
Spec
ies
low
1 hi
gh
low
hi
gh
low
m
od.
high
m
eado
w
land
la
nd
land
st
eppe
Abi
es a
mab
ilis
15
.6
0.6
4.
7
A. g
rand
is
trac
e2
2.2
4.1
1.5
4.5
1.1
trac
e
0.
1
A. l
asio
carp
a
0.6
5.
1 0.
1
3.9
Ace
r gl
abru
m d
ougl
asii
3 tr
ace
0.
3
trac
e
0.
1
Aln
us in
cana
13.6
Am
elan
chie
r al
nifo
lia3
1.
5 0.
5 0.
2 tr
ace
Arc
tost
aphy
los
neva
dens
is
0.1
0.
1 12
.9
3.
2
Art
emis
ia a
rbus
cula
1.1
18.9
13.5
A. r
igid
a
12.7
A. t
ride
ntat
a
4.0
102.
9
Cea
noth
us v
elut
inus
3
0.
5
Chi
map
hila
um
bell
ata
1.
5
0.2
1.3
Chr
ysot
ham
nus
visc
idifl
orus
3
0.
6
Cor
nus
seri
cea
seri
cea
trac
e
Eri
cam
eria
blo
omer
i 1.
0
0.3
Eri
ogon
um c
ompo
situ
m3
0.
9
E. d
ougl
asii
3
3.0
5.
7
E. h
erac
leoi
des3
12
.9
0.2
E. t
hym
oide
s3
2.9
E. u
mbe
llat
um3
0.
1
Hol
odis
cus
disc
olor
3
3.1
0.6
tr
ace
Juni
peru
s co
mm
unis
0.4
Lar
ix o
ccid
enta
lis
trac
e
Led
um g
land
ulos
um
0.
1
Lin
naea
bor
eali
s lo
ngifl
ora
4.
6 5.
6 11
.5
13.1
0.
6
Mah
onia
aqu
ifol
ium
3
3.1
1.3
9.1
0.9
0.
6
0.4
M. n
ervo
sa3
1.
2
26.8
6.
9 5.
4 2.
4 1.
7
Men
zies
ia fe
rrug
inea
0.
2 1.
5
Paxi
stim
a m
yrsi
nite
s
1.5
1.7
1.2
13.2
0.5
Pens
tem
on d
avid
soni
i
2.
8

279Forage Dynamics in Eastern Cascades
PS
ME
PS
ME
A
BG
R
AB
GR
A
BL
A
AB
LA
A
BL
A
Rip
aria
n/
Gra
ss-
Park
- Sh
rub-
Sh
rub-
Spec
ies
low
1 hi
gh
low
hi
gh
low
m
od.
high
m
eado
w
land
la
nd
land
st
eppe
Phi
lade
lphu
s le
wis
ii
0.8
Phl
ox d
iffus
a
3.7
P. lo
ngif
olia
3.0
Pic
ea e
ngel
man
nii
tr
ace
0.1
5.
2
Pin
us a
lbic
auli
s
0.
1
P. c
onto
rta
8.7
0.
1
trac
e
P. m
onti
cola
0.
1
P. p
onde
rosa
tr
ace
5.2
1.
0
Pse
udot
suga
men
zies
ii
trac
e tr
ace
0.1
0.6
0.3
0.5
0.7
0.
1
Pur
shia
trid
enta
ta3
0.
5 0.
7
9.
1
Rib
es la
cust
re3
0.2
trac
e 2.
2 0.
1 1.
7
R. v
isco
siss
imum
3
1.
7 31
.7
R. w
atso
nian
um3
0.7
0.1
Ros
a gy
mno
carp
a3
1.1
0.2
3.0
2.9
0.2
9.6
0.5
1.2
Rub
us le
ucod
erm
is
tr
ace
0.2
Sam
bucu
s ce
rule
a
tr
ace
Sali
x sp
p.3
6.
3
Sali
x sc
oule
rian
a3
2.
8
Shep
herd
ia c
anad
ensi
s
tr
ace
Spir
aea
betu
lifo
lia
luci
da3
1.8
0.3
1.3
3.3
0.1
3.6
Sym
phor
icar
pos
albu
s3
16.0
5.
8 1.
4 0.
5
0.2
trac
e 2.
3
0.
1
Tsu
ga h
eter
ophy
lla
tr
ace
Vacc
iniu
m m
embr
anac
eum
1.
5 1.
3 6.
3 14
.3
1.3
2.5
V. m
yrti
llus
0.
2
V. s
copa
rium
0.
8 3.
2 21
.5
8.0
1.2
61.0
Tota
l 31
.8
15.8
53
.3
58.5
64
.5
76.0
49
.4
26.6
21
.9
76.3
69
.0
106.
6
1 PS
ME
—D
ougl
as-fi
r, A
BG
R—
gran
d fir
, AB
LA
—su
balp
ine
fir d
omin
ated
. Low
, mod
erat
e, a
nd h
igh
desc
ript
ors
refe
r to
cla
sses
of
forb
, gra
min
oid,
and
shr
ub p
rim
ary
prod
uctiv
ity
as d
eter
min
ed d
urin
g th
e st
udy.
2 T
race
is <
0.1
kg/h
a3 E
lk k
ey f
orag
e sp
ecie
s in
stu
dy a
rea.

280 Lehmkuhl et al.
Carex, and Festuca spp. were the primary forage taxa (Table 3).
Open-canopy, south-facing subalpine fir stands (ABLA-high) were the most productive (1215 kg ha-1) of the forested cover types (Figure 2). Forbs constituted most (58%) of the production, followed by grasses (38%). Among the forage species, Lupinus spp. had the highest forb cover, and Carex spp. had the highest graminoid forage cover. The most productive forage shrub was Ribes viscosissimum (Table 4). Subalpine fir stands with open canopies on north aspects (ABLA-moderate) produced less than half the biomass of ABLA-high stands. Carex was the most important forage graminoid in terms of cover, and Rosa gymnocarpa and Ribes spp. produced the most shrub forage (Table 4). Closed-canopy subalpine fir stands on all aspects (ABLA-low) were the lowest producing cover type (107 kg ha-1) measured, with produc-tion mostly (60%) from shrubs followed by forbs (39%). Mahonia spp. were the highest producing shrubs, and no single forage forb was identified from cover data (Table 3).
Low- and mid-elevation PSME-high stands with open canopies on north aspects and ABGR-high stands with open canopies on all aspects were nearly as productive as ABLA-high stands, annually producing 1030 kg ha-1 and 899 kg ha-1, respectively (Figure 2). In contrast to forb-rich ABLA stands, graminoids dominated the pro-duction of PSME-high (82%) and ABGR-high (67%) stands, mostly the forage genera Carex and Calamagrostis (Table 3). Symphoricarpos albus and Mahonia spp. provided the most forage shrub biomass in PSME-high, whereas Mahonia nervosa, Spiraea betulifolia, Rosa gymnocarpa, and Salix scouleriana were the most productive shrubs in ABGR-high. Carex and Calamagrostis graminoid forage also dominated (72%) the relatively low production (384 kg ha-1) of PSME-low stands with closed canopies on all aspects and open canopies on south aspects. S. albus was the dominant shrub forage (Table 4). ABGR-low stands with closed canopies on all aspects stands had low productivity (225 kg ha-1), and were notable for a mix of for-age groups. Mahonia nervosa was the dominant shrub forage at those sites (Table 4).
Utilization
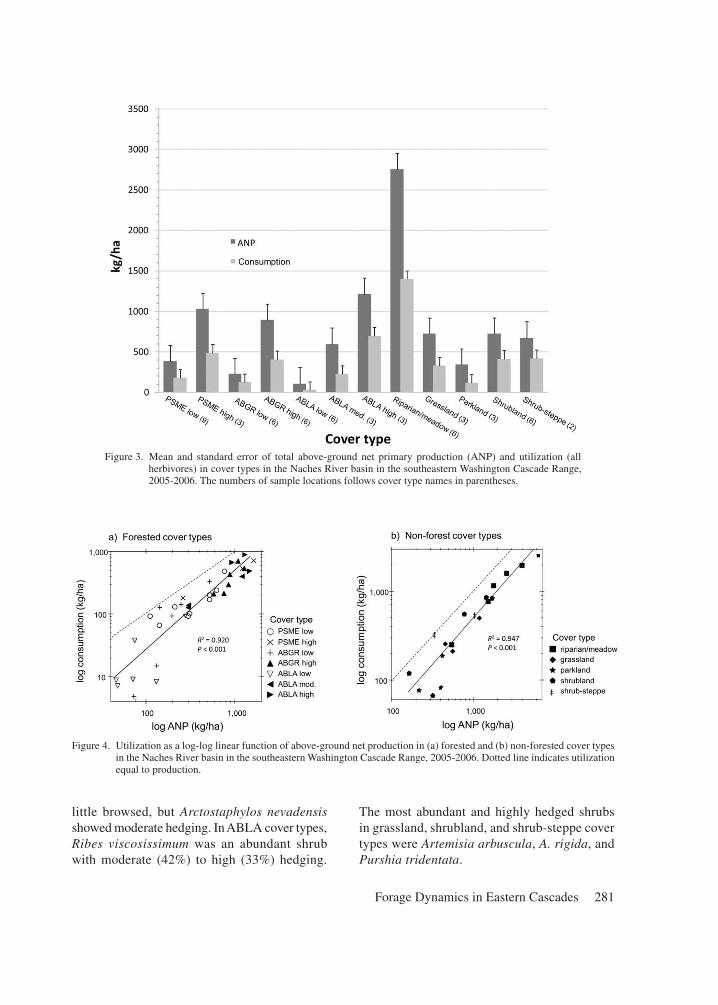
Utilization by all herbivores of combined forb, graminoid, and shrub ANP averaged 47%, rang-ing from 26% in the ABLA-low cover type to 63% in shrub-steppe (Figure 3). Across all cover types, graminoids and forbs were equally utilized at about 57% utilization, whereas shrubs overall showed only about 4% average utilization. Across all sample locations, utilization was strongly (R2 ≥ 0.92) and linearly predicted by ANP (P < 0.001), but utilization varied more (i.e. deviated from the mean relationship with ANP) among sample locations with low ANP (PSME-low, ABGR-low, ABLA-low) compared to sites with high ANP (Figure 4). A quadratic relationship between utilization and ANP in forested cover types was not significant (P = 0.121). Among forested cover types, utilization at low-productivity ABLA sites and some low-productivity ABGR sites was far less than predicted by ANP, and utilization as a percentage of ANP tended to be lower than in high-productivity forest cover types (Figure 4A). In contrast, utilization at relatively low-productivity sites in the PSME and ABGR series tended to be higher than predicted, but relatively similar to the highest productivity sites.
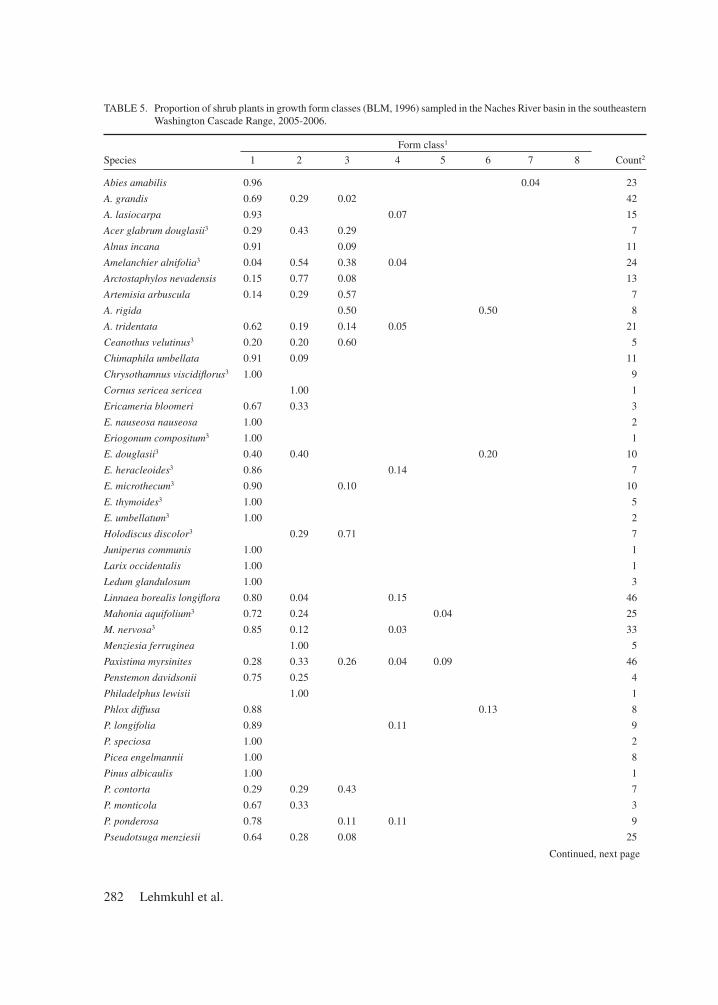
Twenty-two of the 55 shrub species recorded accounted for the majority of shrub productivity among cover types (Table 4). Many of those major-ity species showed little to no long-term hedging (i.e. browsing), as shown by form class (Table 5). For example, Artemisia tridentata was the most productive shrub in the area and produced 96% of the shrub-steppe shrub biomass, yet only one third of the 21 plants sampled showed moderate-high levels of hedging. High-elevation Vaccinium scoparium was the second most productive shrub recorded and was the dominant shrub in ABLA forest understories and parkland, yet showed moderate (46%) to high (17%) hedging. In riparian and meadow areas, 51% of the shrub biomass was produced by Alnus incana, which showed little to no browsing effects.
In the PSME cover types, S. albus and Holo-discus discolor were highly productive shrubs that were severely hedged (Table 4, Table 5). In ABGR stands, the dominant Mahonia spp. were
281Forage Dynamics in Eastern Cascades
little browsed, but Arctostaphylos nevadensis showed moderate hedging. In ABLA cover types, Ribes viscosissimum was an abundant shrub with moderate (42%) to high (33%) hedging.
The most abundant and highly hedged shrubs in grassland, shrubland, and shrub-steppe cover types were Artemisia arbuscula, A. rigida, and Purshia tridentata.
Figure 4. Utilization as a log-log linear function of above-ground net production in (a) forested and (b) non-forested cover types in the Naches River basin in the southeastern Washington Cascade Range, 2005-2006. Dotted line indicates utilization equal to production.
Figure 3. Mean and standard error of total above-ground net primary production (ANP) and utilization (all herbivores) in cover types in the Naches River basin in the southeastern Washington Cascade Range, 2005-2006. The numbers of sample locations follows cover type names in parentheses.
282 Lehmkuhl et al.
Continued, next page
TABLE 5. Proportion of shrub plants in growth form classes (BLM, 1996) sampled in the Naches River basin in the southeastern Washington Cascade Range, 2005-2006.
Form class1
Species 1 2 3 4 5 6 7 8 Count2
Abies amabilis 0.96 0.04 23
A. grandis 0.69 0.29 0.02 42
A. lasiocarpa 0.93 0.07 15
Acer glabrum douglasii3 0.29 0.43 0.29 7
Alnus incana 0.91 0.09 11
Amelanchier alnifolia3 0.04 0.54 0.38 0.04 24
Arctostaphylos nevadensis 0.15 0.77 0.08 13
Artemisia arbuscula 0.14 0.29 0.57 7
A. rigida 0.50 0.50 8
A. tridentata 0.62 0.19 0.14 0.05 21
Ceanothus velutinus3 0.20 0.20 0.60 5
Chimaphila umbellata 0.91 0.09 11
Chrysothamnus viscidiflorus3 1.00 9
Cornus sericea sericea 1.00 1
Ericameria bloomeri 0.67 0.33 3
E. nauseosa nauseosa 1.00 2
Eriogonum compositum3 1.00 1
E. douglasii3 0.40 0.40 0.20 10
E. heracleoides3 0.86 0.14 7
E. microthecum3 0.90 0.10 10
E. thymoides3 1.00 5
E. umbellatum3 1.00 2
Holodiscus discolor3 0.29 0.71 7
Juniperus communis 1.00 1
Larix occidentalis 1.00 1
Ledum glandulosum 1.00 3
Linnaea borealis longiflora 0.80 0.04 0.15 46
Mahonia aquifolium3 0.72 0.24 0.04 25
M. nervosa3 0.85 0.12 0.03 33
Menziesia ferruginea 1.00 5
Paxistima myrsinites 0.28 0.33 0.26 0.04 0.09 46
Penstemon davidsonii 0.75 0.25 4
Philadelphus lewisii 1.00 1
Phlox diffusa 0.88 0.13 8
P. longifolia 0.89 0.11 9
P. speciosa 1.00 2
Picea engelmannii 1.00 8
Pinus albicaulis 1.00 1
P. contorta 0.29 0.29 0.43 7
P. monticola 0.67 0.33 3
P. ponderosa 0.78 0.11 0.11 9
Pseudotsuga menziesii 0.64 0.28 0.08 25

283Forage Dynamics in Eastern Cascades
Purshia tridentata3 0.20 0.40 0.40 10
Ribes lacustre3 0.20 0.40 0.30 0.10 10
R. viscosissimum3 0.25 0.42 0.33 12
R. watsonianum3 0.25 0.50 0.25 4
Rosa gymnocarpa3 0.20 0.56 0.22 0.03 79
Rubus leucodermis 0.67 0.33 3
Sambucus cerulea 1.00 1
Salix spp.3 0.63 0.38 8
Salix scouleriana3 0.50 0.50 4
Shepherdia canadensis 1.00 1
Spiraea betulifolia lucida3 0.34 0.50 0.13 0.02 0.02 56
Symphoricarpos albus3 0.19 0.25 0.49 0.03 0.02 0.02 59
Tsuga heterophylla 1.00 1
Vaccinium membranaceum 0.10 0.50 0.35 0.02 0.02 48
V. myrtillus 0.67 0.17 0.17 6
V. scoparium 0.33 0.46 0.17 0.04 24
All species 0.46 0.30 0.18 0.03 0.01 0.02 0.00 0.00 807
1 Form class: 1—All available (≤2.3 m above ground), little or no hedging.; 2—All available, moderately hedged; 3—All available, severely hedged.; 4—Partially available, little or no hedging; 5—Partially available, moderately hedged; 6—Partially available, severely hedged; 7—Unavailable; 8—Dead. Available forage was <2.3 m above ground.2 The number of recorded shrub plants.3 Elk key forage species in the study area.
Form class1
Species 1 2 3 4 5 6 7 8 Count
Discussion
Several cautions about our data and results are ap-propriate. Sample sizes in cover types are not large, particularly for the shrub-steppe type, considering the extent and variability the landscape we tried to characterize; however, variability in production and utilization, in particular, is a common issue for range management (Holechek et al. 1995). We do not know the relative importance of specific herbivores (vertebrate or invertebrate) to apportion the observed utilization; but, we did not observe large numbers of invertebrate herbivores (e.g. grasshoppers), and among vertebrates elk likely were the main herbivore. We somewhat traded off a large spatial sample for repeated temporal replicates of the sample sites to estimate annual variation in habitat characteristics. We measured a suite of floristic and productivity variables to broadly characterize habitats vs. single-mindedly sampling production at more sample sites. We used two broad canopy-cover classes to characterize
the gradient of canopy cover found in nature; hence, our broad cover classes may simplify the variability of understory cover and production in relation to canopy cover. We have only 2 years of data: a “normal” temperature-moisture year and a somewhat dryer-than-normal year. Nevertheless, the data appeared to present a good first approxi-mation of floristics, productivity, and utilization for the study area, as discussed below.
Forage Utilization
We found riparian and montane meadow cover types were the most important foraging habitats in our study area. Across all vegetation types, they were the most productive, supported the highest level of herbivory, and were the most species-rich cover types accounting for 29% of total production and an equal amount (29%) of the total herbaceous and shrub utilization, yet representing only 3% of the landscape. Our es-timated ANP (2752 kg ha-1) in this type was far
284 Lehmkuhl et al.
less than the 8440 kg ha-1 of peak standing crop recorded in 2004 by Evans (2006) in 12-year old cattle+elk exclosures at 4 large meadows, some of which we sampled, in the Naches drainage of our study area. For those same exclosures, Beebe et al. (2002) reported a much lower average of 720 kg ha-1 peak standing crop of graminoids and forbs during 1994 after 3 years of protec-tion from cattle+elk grazing. Precipitation and temperature during the years Evans’ (2004) and Beebe et al. (2002) studied these meadows was intermediate between our study years, so condi-tions during the growing season are unlikely to explain differences among studies in ANP esti-mates. Differences in experimental design (their exclosures vs. our caged plots) and field sampling (e.g., time of year, sample size, material collected, our pooling of riparian meadows and montane meadows) may account for differences in our ANP estimates and these studies. Our estimates from paired caged plots possibly overestimated ANP because we adjusted for negative utilization (i.e. more biomass outside cages than inside cages) in estimating ANP, a well-known and common sampling error for the caged-plot technique (Sala et al. 1988, McNaughton et al. 1996). However, not adjusting for negative utilization can yield nonsensical negative utilization rates (e.g., Stewart et al. 2006). Nevertheless, ANP in our riparian/meadow cover type was comparable to ANP for 8 mountain meadow sites in the Pacific Northwest reviewed by Milchunas and Lauenroth (1993).
Estimates of utilization were relatively similar among the 3 studies (Beebe et al. 2002, Evans 2006; this study) of meadows in our study area, regardless of reported differences in ANP among studies. We estimated 57% utilization of herba-ceous (non-shrub) ANP by cattle and elk with our paired caged-plot technique. Combined utilization by livestock and elk was 67% in Evans’ study and 66% in Beebe et al., as estimated by the ratio of standing biomass in the exclosure open to cattle and elk grazing compared to standing biomass in the full exclosure (i.e. no grazing). Comparing our cage-plot data and their exclosures assumes that grazing did not depress or facilitate production in our caged plots (Bartolome 1993, Painter and Belsky 1993).
The 3-way exclosures used by Evans (2006) and Beebe et al. (2002) allowed them to exclude cattle to estimate elk and deer utilization at 50% (Evans) and 43% (Beebe et al.), respectively; thus, 65-75% of the total utilization in their meadows was by elk and deer. A 65-75% share of total meadow utilization by elk and deer is 25-35% less than an expected 90% based on their proportion of the total AUM stocking rate estimated for the study area. Conversely, livestock consumed 25-35% of the total meadow utilization, a share larger than expected from their 10% share of the total stock-ing rate. A relatively higher rate of utilization by cattle than elk in meadows is to be expected based on the well-known grazing preferences of cattle for grass forage on gentle topography (Skovlin et al. 1976, Wisdom and Thomas 1996, Holechek et al. 1995,) and the general avoidance of cattle by elk (Wisdom and Thomas 1996, Coe et al. 2001, Stewart et al. 2002).
Other studies in the western U.S. have reported utilization by wild ungulates in non-forest cover types similar to the 43-50% range reported by Beebe et al. (2002) and Evans (2006): 35% in dry meadow communities in the nearby Blue Mountains of Oregon (Stewart et al. 2006); 45% in a wide elevational range of grasslands and meadows in Yellowstone (Frank and McNaughton 1993); and, 55% in low elevation grasslands in Yellowstone (Singer and Harter 1996). Our reported rate of 57% total utilization (livestock and wild ungu-lates) slightly exceeds the acceptable standard of 40-50% “moderate” utilization for the Wenatchee National Forest (WNF 1990), and fits a general 50% standard for moderate utilization of montane grasslands in the Pacific Northwest (Hedrick 1958, Guinn 1994). Skovlin et al. (1976), however, rec-ommended utilization rates of 30-40% for mixed forest and grassland ecosystems of the interior Pacific Northwest, although that recommendation pertains mainly to livestock grazing.
The relatively small contribution of shrubs to total ANP and the forage base (mostly < 10%), as well as relatively overall low (4%) utilization, likely belies their seasonal importance in livestock and elk diets. Shrubs can be an important component of diet quantity and quality, especially during the late summer and fall when livestock and elk
285Forage Dynamics in Eastern Cascades
foraging shifts from open-forest stands to more closed-canopy stands (Korfhage et al. 1980, Cook 2002, Long et al. 2008a, Long et al. 2008b). We documented high long-term grazing impacts on some species of typical and atypical forage shrubs (Cook 2002), such as Symphoricarpos albus, Ho-lodiscus discolor, and Arctostaphylos nevadensis in mid-elevation PSME and ABGR cover types, Ribes viscosissimum in high-elevation ABLA cover types, and Artemisia arbuscula, A. rigida, and Purshia tridentata in low-elevation non-forest cover types.
Impacts on shrubs are likely underestimated because historically high levels of herbivory by wild ungulates and livestock in the study area (Mitchell and Lauckhart, 1948; Wissmar et al., 1994) may have suppressed or eliminated highly-palatable shrubs (Tiedemann and Berndt 1972, Riggs et al 2000, Alldredge et al. 2001, Kie and Lehmkuhl 2001, Manier and Hobbs 2007). In similar PSME and ABGR forests in the nearby Blue Mountains of southeastern Washington and northeastern Oregon, Riggs et al. (2000) found ungulate herbivory seriously depressed biomass of shrub genera Acer, Linnaea, Amelanchier, Salix, Sorbus, Ceanothus, Physocarpus, and Ru-bus outside of 25-year-old exclosures, where understory biomass was 2x greater than outside exclosures. Johnson (2007) found the shrubs Rosa, Symphoricarpos, and Purshia increased dramatically in the absence of long-term browsing in shrubland communities in the Blue Mountains. Tiedemann and Berndt (1972) reported 5 times more shrub cover, primarily Ceanothus velutinus with Amelanchier alnifolia, Prunus virginianus, and Symphoricarpos albus, inside vs. outside a 30-yr-old exclosure in a Pseudotsuga menziesii/Calamagrostis rubescens habitat type dominated by ponderosa pine with Douglas-fir.
Across all the other cover types we measured, annual utilization rates as a proportion of ANP were relatively similar across the range of cover type productivity, except for lesser utilization in some low-productivity ABLA, ABGR, and PSME sites. If animals optimize their intake by foraging in the most productive cover types (Senft et al. 1987, Bailey et al. 1996, Anderson et al. 2008), then we might have expected utilization rates to increase with site productivity above some threshold of low
production. The observed relatively even pattern of utilization across a range of ANP in the land-scape might be a function of processes operating at the scales of annual home range, feeding site (i.e., a collection of patches), and patch (Bailey et al. 1996). Utilization within a particular cover type is constrained by seasonal availability (e.g. snow) and the production and maturation of forage along the elevational gradient, so that ungulates move in response to increasing forage quantity and quality (Skovlin et al. 2002).
Under the Forage Maturation Hypothesis, ani-mals select cover types at intermediate stages of production to maximize the trade-off between for-age quantity and quality (Fryxell 1991, Wilmshurst et al. 1995, Hebblewhite et al. 2008). That tradeoff can occur along the elevational gradient of cover types (Hebblewhite et al. 2008), but also at the scale of feeding sites during the non-winter sea-son. During spring and early summer, elk forage in open forest and non-forest cover types where early phenology provides a relatively high quantity and quality of forage, then during mid- and late-summer elk switch to foraging in forested cover types where phenology is delayed and quality remains high (Skovlin et al. 1989, Long et al. 2008a, Long et al. 2008b). Relatively high rates of utilization in low-productivity cover types could result from feeding in suboptimal cover types to maximize forage intake while traveling (Senft et al. 1987), from regular sampling of forage in all patches in feeding sites or seasonal home ranges (Westoby 1974, Bailey et al. 1996), or from selec-tion of habitats for other reasons (e.g., vulnerability to hunters, calf security) (Skovlin et al. 2002). Foraging and sampling while traveling are highly plausible if elk residency at high-value sites is a function of multiple visits vs. slowing movement at favorable locations (Ager et al. 2003, Kie et al. 2005, Forester et al. 2007, Anderson et al. 2008).
Moderate levels of utilization (~50%) across all cover types have important implications for resource selection analysis that uses simple stand-ing-crop biomass estimates (e.g., Merrill 1994, Beck and Peek 2004, Anderson et al. 2005). The timing of measurement of standing crop will be critical for gaining unbiased estimates of what ungulates may encounter and how that affects

286 Lehmkuhl et al.
resource selection and animal fitness. Typical measurement of peak biomass at the end of the summer growing season will underestimate the value of cover types with an early phenology and utilization period by a factor comparable to the utilization rate.
Exotic Species
Despite estimated moderate utilization, riparian/meadow cover types supported the highest cover (18.5%) and richness (13%) of exotic species among cover types. The exotic grass Poa pra-tensis had the highest cover among all riparian/meadow species and was an indicator species in our riparian/meadow cover types along with the exotic forb species Plantago lanceolata and Trifolium repens. Poa pratensis is known to be a highly invasive and grazing-resistant rhizomatous grass in meadows (Mack and Thompson 1982, Frank and McNaughton 1993, Singer 1995) that persists long after grazing ceases (Daubenmire 1988, Singer 1995, Stohlgren et al. 1999). After three years of protection in the Naches three-way exclosures (cattle+elk, elk-only, no grazing), Evans (2006) and Beebe et al. (2002) found that Poa pratensis remained the dominant meadow species with importance values three times higher than the second-ranked species. Evans reported percent cover of exotic species (4-26%) in three of four meadows with elk and cattle+elk grazing that was roughly comparable to our estimate, but 65% cover of exotic species (mostly Cichorium intybus, Plantago lanceolata, Poa pratensis, Bromus hordeaceus) in a fourth meadow.
The presence of these exotic species in grazing lands is a legacy of heavy historical grazing by domestic and wild ungulates (Wissmar et al. 1994, Mitchell and Lauckhart 1948) that can be sustained by moderate wild ungulate grazing (Frank and McNaughton 1993, Singer 1995, Rexroad et al. 2007), and by recent managed livestock grazing. That also seems to be the case in our meadows and for dry grasslands and shrub-steppe where exotic Bromus tectorum was an important species that has persisted long after the cessation of heavy grazing on dry sites (Mack and Thompson 1982, Dauben-mire 1988). Evans (2006) found little significant
difference in exotic cover between Naches-area meadows grazed by cattle+elk and elk-only. One might hypothesize that complete protection from grazing could result in restoration of dominance by native species and the reduction of exotic and other species richness in relatively productive mesic, but not dry, cover types (Olff and Ritchie 1998, Proulx and Mazumder 1998, Osem et al. 2002, Bakker et al. 2006). For example, Johnson (2007) reported P. pratensis declined in meadows protected from grazing for about 50 years in the Blue Mountains of Oregon. However, both com-plete short-term (3-year) (Beebe et al. 2002) and longer-term (12 years) (Evans 2006) exclusion of grazing in 4 large Naches meadows showed the predicted response in only 1 meadow where exotic species dominated the site (65% of the plant cover). Evans found the response varied in the other 3 meadows where native species dominated plant cover: exotic cover increased and exceeded native cover; both exotic and native species cover increased equally; and, exotic cover increased 5x compared to grazed conditions while native cover did not change. Thus, exotic species can persist long after the primary grazing impacts (Keeley et al. 2003), and response to protection from grazing can be highly idiosyncratic depending on local species composition, environmental conditions, and scale of measurement (Stohlgren et al. 1999, Collins et al. 2002).
Forest Restoration
Proposed forest restoration management (mainly our PSME and dry ABGR types) to reduce un-characteristic fuel loads and restore resilient stand structures and processes (Agee and Skinner 2005, Noss et al. 2006, Collins et al. 2010) likely will increase the forage base for ungulates by opening the canopy to <40%, as shown by our data, and stimulating understory development (Hedrick et al. 1968, Skovlin et al. 1989, Lyon and Christensen 2002, Vavra et al. 2005, Long et al. 2008b; but, see Sutherland and Nelson 2010). Opening the canopy of long-closed stands with diminished seed banks of herbaceous species might increase invasive species cover (McGlone et al. 2009, Sabo et al. 2009; but see Wienk et al. 2004); however, responses of invasive species can vary consider-

287Forage Dynamics in Eastern Cascades
ably due to site conditions (Sutherland and Nelson 2010) and can be mitigated by management (e.g., weed control along roads). Locally in dry forests of eastern Washington State, Nelson et al. (2008) reported only a small (2%) increase in cover of exotic species in a large retrospective sample of thinned and burned stands.
The spatial arrangement of treatments across the landscape might strive to replicate the patchy mosaic of stand structure created by environmen-tal and disturbance-caused heterogeneity (Agee 2003, Brown et al. 2004, Hessburg et al. 2005) and to maximize the seasonal abundance of for-age in open- and closed-canopy forests (Skovlin et al. 1989, Skovlin et al. 2002, Long et al. 2008a, Long et al. 2008b). An implication of our finding that most forest and non-forest cover types are utilized is that treatment in any type likely will increase the utilized forage base, depending on the inherent productivity of the site (Vavra et al. 2005). The best options for increasing production appear to be closed-canopy conditions on aspects that had the highest production: ABLA stands on south-aspects, PSME stands on north-aspects, and ABGR stands on all aspects. ABGR stands, in particular could be expected to produce abundant shrub forage because high-productivity in ABGR stands was primarily a function of open canopy alone, not the interaction of canopy cover and aspect as with PSME and ABLA types (Table 1).
Dry forest restoration could be spatially al-located in several ways to either increase the forage base or reduce utilization in some locations (Wisdom and Thomas 1996, Gordon et al. 2004), contingent on maintaining elk populations at the same level relative to carrying capacity (Kie et al. 2003) and providing adequate security cover (Lyon and Christensen 2002). One objective may be to reduce utilization of particular locations where high site fidelity may result in persistent use (e.g. Kaufmann et al. 2010), primarily, meadows with high exotic cover that are targeted for restoration. Forest restoration treatments might be placed in the vicinity of target sites to increase the surrounding forage base, because elk residency in a particular location is a function of many separate visits to the site, the frequency of which is a function of both
the location’s forage availability and the ability of the surrounding area to support other activities (e.g. resting) (Forester et al. 2007, Anderson et al. 2008). Another option is to target suspected travel routes where elk are most likely to encoun-ter and use restored sites. Kie et al. (2005) found strong directionality of elk movements parallel to ridgelines along hill slopes and along lower slopes adjacent to highly productive and utilized riparian areas. A final consideration is the temporal spacing of treatments across the landscape due to the relatively short-term (~5 years) spike in nutritional value of forage in thinned and burned areas (Skovlin et al. 1989, Long et al. 2008b).
This paper presented a broad survey of for-age dynamics across a large and heterogeneous landscape, and discussed implications for un-gulate resource selection analyses and forest restoration. Additional research might focus on intensive sampling of composition, production, and utilization of the most productive forest cover types, and winter range, to better document that variability and provide more exacting estimates of production for estimation of carrying capacity. Establishment of a network of forest and range exclosures would allow exacting quantification of the impacts of herbivory on herbaceous and shrub species. Exclosures would provide forest and wildlife managers with data on the potential impacts of changing patterns of herbivory from altered numbers or distribution ungulates stemming from management or by a likely recolonization by wolves (Canis lupus) from a breeding pack 15 km northeast of the study area (WDFW 2012). Our results and the discussion of potential effects of forest restoration treatments serve as hypotheses for testing in studies of stand- and landscape-scale treatment effects and ungulate resource selection and productivity.
Acknowledgments
Our research was funded by the Okanogan-Wenatchee National Forest, the Rocky Moun-tain Elk Foundation, the U.S. Forest Service, Pacific Northwest Research Station’s National Fire Plan research project on “Fuel reduction and forest restoration strategies that also sustain

288 Lehmkuhl et al.
key habitats, species, and ecological processes in fire-prone ecosystems in the interior Northwest” (01.PNW.C.2), and the Washington Department of Fish and Wildlife. The Yakama Indian Nation provided data to map vegetation on the Yakama Reservation. We thank D. Ianni, J. Wheeler, C.
Jaeger, and J. Lanoye for their significant contribu-tion to field work and data management. A draft of the manuscript was reviewed by M. Vavra, M. Rowland, and S. McCorquodale. We thank the journal’s anonymous reviewers for their many insightful and useful comments.
Literature Cited
Agee, J. K. 2003. Historical range of variability in eastern Cascades forests, Washington, USA. Landscape Ecology 18:725-740.
Agee, J. K., and C. N. Skinner. 2005. Basic principles of forest fuel reduction treatments. Forest Ecology and Management 211:83-96.
Ager, A. A., B. K. Johnson, J. W. Kern, and J. G. Kie. 2003. Daily and seasonal movements and habtiat use by female Rocky mountain elk and mule deer. Journal of Mammalogy 84:1076-1088.
Alldredge, M. W., J. M. Peek, and W. A. Wall. 2001. Altera-tions of shrub communities in relation to herbivory in northern Idaho. Northwest Science 75:137-144.
Anderson D. P., J. D. Forester, and M. G. Turner. 2008. When to slow down: elk residency rates on a heterogeneous landscape. Journal of Mammalogy 89:105-114.
Anderson, D. P., M. G. Turner, J. D. Forester, J. Zhu, M. S. Boyce, H. Beyer, and L. Stowell. 2005. Scale-dependent summer resource selection by reintro-duced elk in Wisconsin, USA. Journal of Wildlife Management 69:298-310.
Bailey, D. W., J. E. Gross, E. A. Laca, L. R. Rittenhouse, M. B. Coughenour, D. M. Swift, and P. L. Sims. 1996. Mechanisms that result in large herbivore grazing distribution patterns. Journal of Range Management 49:386-400.
Bakker, E. S., M. E. Ritchie, H. Olff, D. G. Milchunas, and J. M. H. Knops. 2006. Herbivore impact on grass-land plant diversity depends on habitat productivity and herbivore size. Ecology Letters 9:780-788.
Bartolome, J. W. 1993. Application of herbivore optimi-zation theory to rangelands of the western United States. Ecological Applications 3:27-29.
Beck, J. L., and J. M. Peek. 2004. Herbage productivity and ungulate use of northeastern Nevada mountain meadows. Journal of Range Management 57: 376-383.
Beebe, J., R. Everett, G. Scherer, and C. Davis. 2002. Effect of fertilizer applications and grazing exclusion on species composition and biomass in wet meadow restoration in eastern Washington. U.S. Forest Ser-vice Research Paper PNW-RP-542, Portland, OR.
Belsky, A. J., and D. M. Blumenthal. 1997. Effects of livestock grazing on stand dynamics and soils in upland forests of the interior West. Conservation Biology 11:315-327.
Biondini, M. E., and L. Manske. 1996. Grazing frequency and ecosystem processes in a northern mixed prairie, USA. Ecological Applications 6:239-256.
BLM (Bureau of Land Management). 1996. Utilization studies and residual measurements. Bureau of Land Management report BLM/RS/ST-96/004+1730, Denver, CO.
Bonham, C. D. 1989. Measurements for Terrestrial Vegeta-tion. John Wiley and Sons, New York, NY.
Boyce, M. S., and L. L. McDonald. 1999. Relating popula-tions to habitats using resource selection functions. Trends in Ecology and Evolution 14:268-272.
Brown, R. T., J. K. Agee, and J. F. Franklin. 2004. Forest restoration and fire: principles in the context of place. Conservation Biology 18:903-912.
Coe P. K., B. K. Johnson, J. W. Kern, S. L. Finholt, J. G. Kie, and M. J. Wisdom. 2001. Responses of elk and mule deer to cattle in summer. Journal of Range Management 54:51-76.
Collins, B. M., S. L. Stephens, J. J. Moghaddas, and J. Battles. 2010. Challenges and approaches in plan-ning fuel treatments across fire-excluded forested landscapes. Journal of Forestry 108:24-31.
Collins, S. L., S. M. Glenn, and J. M. Briggs. 2002. Effect of local and regional processes on plant species richness in tallgrass prairie. Oikos 99:571-579.
Cook, J. G. 2002. Nutrition and food. In D. E. Toweill, and J. W. Thomas (editors), North American Elk: Ecology and Management. Wildlife Management Institute, Washington, DC. Pp. 259-349.
Cook, J. G., B. K. Johnson, R. C. Cook, R. A. Riggs, T. Delcurto, L. D. Bryant, and L. L. Irwin. 2004. Ef-fects of summer-autumn nutrition and parturition date on reproduction and survival of elk. Wildlife Monographs 151:1-61.
Cook, R. C., D. L. Murray, J. G. Cook, P. Zager, and S. L. Monfort. 2001. Nutritional influences on breed-ing dynamics in elk. Canadian Journal of Zoology 79:845-853.
Daubenmire, R. 1988. Steppe Vegetation of Washington. Washington State University Cooperative Exten-sion, Pullman.
Dixon, S. L., and R. L. Lyman. 1996. On the Holocene his-tory of elk (Cervus elaphus) in eastern Washington. Northwest Science 70:262-272.
Dufrêne M., and P. Legendre. 1997. Species assem-blages and indicator species: the need for a flexible asymmetrical approach. Ecological Monographs 67:345-366.
Evans, K. 2006. Plant community response to grazing in four Washington meadow exclosures. Thesis, Central Washington University, Ellensburg.
Everett, R. L., R. Schellhaas, D. Keenum, D. Spurbeck, and P. Ohlson. 2000. Fire history in the ponderosa

289Forage Dynamics in Eastern Cascades
pine/Douglas-fir forests on the east slope of the Washington Cascades. Forest Ecology and Manage-ment 129:207-225.
Forester, J. D., A. R. Ives, M. G. Turner, D. P. Anderson, D. Fortin, H. L. Beyer, D. W. Smith, and M. S. Boyce. 2007. State-space models link elk movement patterns to landscape characteristics in Yellowstone National Park. Ecological Monographs 77:285-299.
Frank, D. A., and S. J. McNaughton. 1993. Evidence for the promotion of aboveground grassland production by native large herbivores in Yellowstone National Park. Oecologia 96:157-161.
Frank, D. A., and S. J. McNaughton, and B. F. Tracy. 1998. The ecology of the Earth’s grazing ecosystems. BioScience 48:513-521.
Frank, D. A., M. M. Kuns, and D. R. Guido. 2002. Consumer control of grassland plant production. Ecology 83:602-606.
Fryxell, J. M. 1991. Forage quality and aggregation by large herbivores. American Naturalist 138:478-498.
Gordon, I. J., A. J. Hester, and M. Festa-Bianchet. 2004. The management of wild large herbivores to meet economic, conservation and environmental objec-tives. Journal of Applied Ecology 41:1021-1031.
Gossett, G. 1964. Stock grazing in Washington’s Nile Val-ley. The Pacific Northwest Quarterly 55:119-127.
Guinn, K. 1994. Grazing Management Guidelines. U.S. Department of Agriculture, Soil Conservation Service. Spokane, WA.
Haugo, R. D., and C. B. Halpern. 2007. Vegetation re-sponses to conifer encroachment in a western Cascade meadow: a chronosequence approach. Canadian Journal of Botany 85:285-298.
Hebblewhite, M., E. Merrill, and G. McDermid. 2008. A multi-scale test of the forage maturation hypoth-esis in a partially migratory ungulate population. Ecological Monographs 78:141-166.
Hedrick, D. W. 1958. Proper utilization: a problem in evaluating the physiological response of plants to grazing use: a review. Journal of Range Manage-ment 11:34-43.
Hedrick, D. W., J. Young, J. McArthur, and R. Keniston. 1968. Effects of forest and grazing practices on mixed coniferous forests of northeastern Oregon. Oregon State University Agricultural Experiment Station Technical Bulletin 103, Corvallis.
Hessburg, P. F., J. K. Agee, and J. F. Franklin. 2005. Dry forests and wildland fires of the inland Northwest USA: contrasting the landscape ecology of the pre-settlement and modem eras. Forest Ecology and Management 211:117-139.
Hobbs, N. T. 1996. Modification of ecosystems by ungu-lates. Journal of Wildlife Management 60:695-713.
Holechek, J. L., R. D. Pieper, and C. H. Herbel. 1995. Range Management: Principles and Practices, Sec-ond Edition. Prentice Hall, Englewood Cliffs, NJ.
Johnson, C. 2007. Rangeland exclosures of northeastern Oregon: stories they tell (1936-2004). U.S. Forest Service General Technical Report PNW-GTR-724, Portland, OR.
Kauffman M. J., J. F. Brodie, and E. S. Jules. 2010. Are wolves saving Yellowstone’s aspen? A landscape-level test of a behaviorally mediated trophic cas-cade. Ecology 91:2742-2755.
Keeley, J. E., D. Lubin, and C. J. Fotheringham. 2003. Fire and grazing impacts on plant diversity and alien plant invasions in the southern Sierra Nevada. Ecological Applications 13:1355-1374.
Kie, J. G., A. A. Ager, and R. T. Bowyer. 2005. Landscape-level movements of North American elk (Cervus elaphus): effects of habitat patch structure and topography. Landscape Ecology 20:289-300.
Kie, J. G., and J. F. Lehmkuhl. 2001. Herbivory by wild and domestic ungulates in the Intermountain West. Northwest Science 75:55-61.
Kie, J., T. Bowyer, and K. Stewart. 2003. Ungulates in western coniferous forests: habitat relationships, population dynamics, and ecosystem processes. In C. Zabel, and R. Anthony (editors), Mammal Community Dynamics: Management and Conser-vation in the Coniferous Forests of Western North America. Cambridge University Press, Cambridge, U.K. Pp. 296-340.
Korfhage, R. C., J. R. Nelson, and Skovlin, J. M. 1980. Summer diets of Rocky Mountain elk in Northeast-ern Oregon. The Journal of Wildlife Management 44:746-750.
Kuiters, A. T., G. M. J. Mohren, and S. E. Van Wieren, 1996. Ungulates in temperate forest ecosystems. Forest Ecology and Management 88:1-5.
Lehmkuhl, J. F., J. G. Kie, L. C. Bender, G. Servheen, and H. Nyberg. 2001. Evaluating the effects of ecosystem management alternatives on elk, mule deer, and white-tailed deer in the interior Columbia River basin, USA. Forest Ecology and Management 153:89-104.
Long, R. A., J. L. Rachlow, and J. G. Kie. 2008a. Effects of season and scale on response of elk and mule deer to habitat manipulation. Journal of Wildlife Management 72:1133-1142.
Long, R. A., J. L. Rachlow, J. G. Kie, and M. Vavra. 2008b. Fuels reduction in a western coniferous forest: Effects on quantity and quality of forage for elk. Rangeland Ecology & Management 61:302-313.
Lyon, L., and A. G. Christensen. 2002. Elk and land management. In D. E. Toweill, and J. W. Thomas (editors), North American Elk: Ecology and Man-agement. Wildlife Management Institute, Wash-ington, DC. Pp. 531-556.
Mack, R. N., and J. N. Thompson. 1982. Evolution in steppe with few large, hoofed mammals. American Naturalist 119:757-773.
Manier, D. J., and N. T. Hobbs. 2007. Large herbivores in sagebrush steppe ecosystems: livestock and wild ungulates influence structure and function. Oecologia 152:739-750.
McConnel B. R., and J. G. Smith. 1970. Response of understory vegetation to ponderosa pine thinning in eastern Washington. Journal of Range Manage-ment, 23:208-212.

290 Lehmkuhl et al.
McCorquodale, S. M. 1985. Archaeological evidence of elk in the Columbia Basin. Northwest Science 59:192-197.
McGlone, C. M., J. D. Springer, and D. C. Laughlin. 2009. Can pine forest restoration promote a diverse and abundant understory and simultaneously resist non-native invasion? Forest Ecology and Management 258:2638-2646.
McNaughton, S. J., D. G. Milchunas, and D. A. Frank. 1996. How can net primary productivity be mea-sured in grazing ecosystems? Ecology 77:974-977.
Merrill, E. H. 1994. Summer foraging ecology of wa-piti (Cervus elaphus roosevelti) in the Mount St. Helens blast zone. Canadian Journal of Zoology 72:303-311.
Milchunas, D. G., and W. K. Lauenroth. 1993. Quanti-tative effects of grazing on vegetation and soils over a global range of environments. Ecological Monographs 63:327-366.
Miller, E. A., and C. B. Halpern. 1998. Effects of environ-ment and grazing disturbance on tree establishment in meadows of the central Cascade Range, Oregon, USA. Journal of Vegetation Science 9:265-282.
Mitchell, G., and J. Lauckhart. 1948. Management of the Yakima Rocky Mountain elk herd. Transac-tions of the North American Wildlife Conference 13:401-409.
Nelson, C. R., C. B. Halpern, and J. K. Agee. 2008. Thinning and burning result in low-level invasion by nonnative plants but neutral effects on natives. Ecological Applications 18:762-770.
Noss, R. F., P. Beier, W. W. Covington, R. E. Grumbine, D. B. Lindenmayer, J. W. Prather, F. Schmiegelow, T. D. Sisk, and D. J. Vosick. 2006. Recommendations for integrating restoration ecology and conservation biology in ponderosa pine forests of the southwest-ern United States. Restoration Ecology 14:4-10.
NRCS (Natural Resources Conservation Service). 2008. Bumping Ridge SNOTEL weather data. Avail-able online at http://www3.wcc.nrcs.usda.gov/nwcc/site?sitenum=375&state=wa (accessed 31 December 2008).
Olff, H., and M. E. Ritchie. 1998. Effects of herbivores on grassland plant diversity. Trends in Ecology & Evolution 13:261-265.
Osem, Y., A. Perevolotsky, and J. Kigel. 2002. Grazing effect on diversity of annual plant communities in a semi-arid rangeland: interactions with small-scale spatial and temporal variation in primary productiv-ity. Journal of Ecology 90:936-946.
OWNF (Okanogan-Wenatchee National Forest). 2002. Strategy for management of dry forest vegeta-tion, Okanogan and Wenatchee National Forests. Okanogan-Wenatchee National Forest, Wenatchee, WA. Available online at http://www.fs.fed.us/r6/wenatchee/publications/dry-site-strategy.pdf (ac-cessed 3 February 2011).
OWNF (Okanogan-Wenatchee National Forest). 2007. Tieton Complex Allotment Management Plan
Environmental Assessment. Document on file at Naches Ranger Station, 10237 U.S. Highway 12, Naches, WA.
Painter, E. L., and A. J. Belsky. 1993. Application of herbivore optimization theory to rangelands of the Western United States. Ecological Applica-tions 3:2-9.
Paruelo, J. M., and W. K. Lauenroth. 1998. Interannual variability of NDVI and its relationship to climate for North American shrublands and grasslands. Journal of Biogeography 25:721-733.
Proulx, M., and A. Mazumder. 1998. Reversal of grazing impact on plant species richness in nutrient-poor vs. nutrient-rich ecosystems. Ecology 79:2581-2592.
Raedeke, K. J., J. J. Millspaugh, and P. E. Clark. 2002. Population characteristics. In D. E. Toweill, and J. W. Thomas (editors), North American Elk: Ecol-ogy and Management. Wildlife Management Insti-tute, Washington, DC. Pp. 449-492.
Rexroad, E. A., K. H. Beard, and A. Kulmatiski. 2007. Vegetation responses to 35 and 55 years of native ungulate grazing in shrubsteppe communities. Western North American Naturalist 67:16-25.
Riggs, R. A., A. R. Tiedemann, J. G. Cook, T. M. Ballard, P. J. Edgerton, M. Vavra, W. C. Krueger, F. C. Hall, L. D. Bryant, L. L. Irwin, and T. Delcurto. 2000. Modification of mixed-conifer forests by ruminant herbivores in the blue mountains ecologi-cal province. U.S. Forest Service Research Paper PNW-RP-527, Portland, OR.
Rowland M. M., M. J. Wisdom, B. K. Johnson, and J. G. Kie. 2000. Elk distribution and modeling in rela-tion to roads. Journal of Wildlife Management, 64:672-684.
Sabo, K. E., C. H. Sieg, S. C. Hart, and J. D. Bailey. 2009. The role of disturbance severity and canopy closure on standing crop of understory plant species in ponderosa pine stands in northern Arizona, USA. Forest Ecology and Management 257:1656-1662.
Sala, O. E., M. E. Biondini, and W. K. Lauenroth. 1988. Bias in estimates of primary production—an ana-lytical solution. Ecological Modelling 44:43-55.
Senft, R. L., M. B. Coughnenour, D. W. Bailey, L. R. Rittenhouse, O. E. Sala, and D. M. Swift. 1987. Large herbivore foraging and ecological hierarchies. BioScience 37:789-799.
Singer, F. J. 1995. Effects of grazing by ungulates on upland bunchgrass communities of the northern winter range of Yellowstone National Park. Northwest Science 69:191-203.
Singer, F. J., and M. K. Harter. 1996. Comparative ef-fects of elk herbivory and 1988 fires on northern Yellowstone National Park grasslands. Ecological Applications 6:185-199.
Singh, J. S., W. K. Lauenroth, and R. K. Steinhorst. 1975. Review and assesment of various techniques for estimating net aerial primary production in grass-lands from harvest data. The Botanical Review 41:181-232.
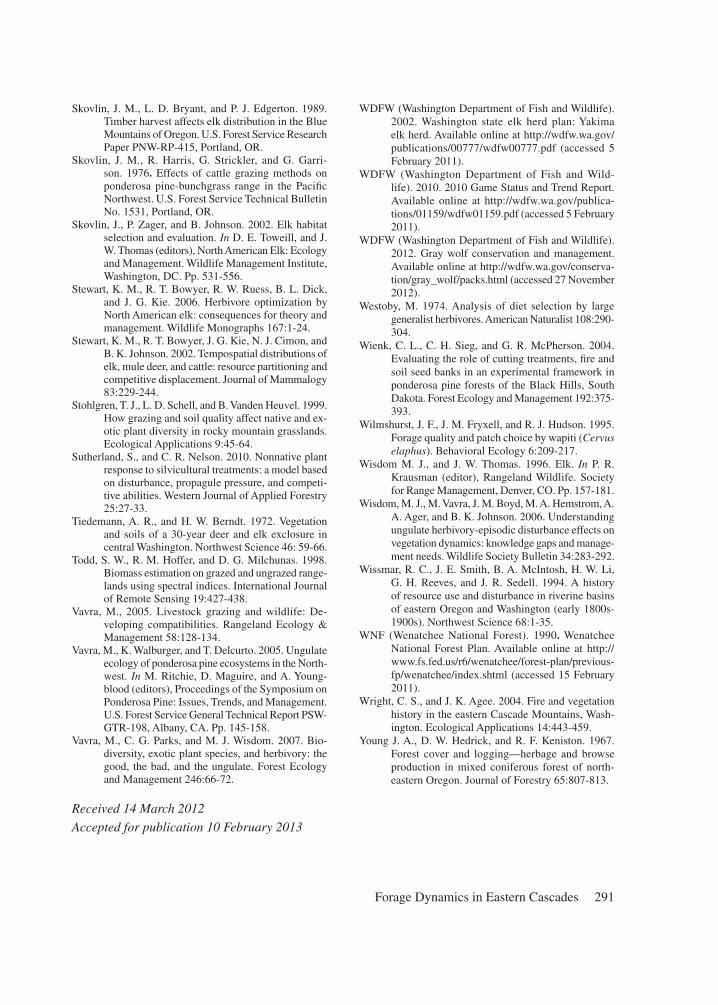
291Forage Dynamics in Eastern Cascades
Skovlin, J. M., L. D. Bryant, and P. J. Edgerton. 1989. Timber harvest affects elk distribution in the Blue Mountains of Oregon. U.S. Forest Service Research Paper PNW-RP-415, Portland, OR.
Skovlin, J. M., R. Harris, G. Strickler, and G. Garri-son. 1976. Effects of cattle grazing methods on ponderosa pine-bunchgrass range in the Pacific Northwest. U.S. Forest Service Technical Bulletin No. 1531, Portland, OR.
Skovlin, J., P. Zager, and B. Johnson. 2002. Elk habitat selection and evaluation. In D. E. Toweill, and J. W. Thomas (editors), North American Elk: Ecology and Management. Wildlife Management Institute, Washington, DC. Pp. 531-556.
Stewart, K. M., R. T. Bowyer, R. W. Ruess, B. L. Dick, and J. G. Kie. 2006. Herbivore optimization by North American elk: consequences for theory and management. Wildlife Monographs 167:1-24.
Stewart, K. M., R. T. Bowyer, J. G. Kie, N. J. Cimon, and B. K. Johnson. 2002. Tempospatial distributions of elk, mule deer, and cattle: resource partitioning and competitive displacement. Journal of Mammalogy 83:229-244.
Stohlgren, T. J., L. D. Schell, and B. Vanden Heuvel. 1999. How grazing and soil quality affect native and ex-otic plant diversity in rocky mountain grasslands. Ecological Applications 9:45-64.
Sutherland, S., and C. R. Nelson. 2010. Nonnative plant response to silvicultural treatments: a model based on disturbance, propagule pressure, and competi-tive abilities. Western Journal of Applied Forestry 25:27-33.
Tiedemann, A. R., and H. W. Berndt. 1972. Vegetation and soils of a 30-year deer and elk exclosure in central Washington. Northwest Science 46: 59-66.
Todd, S. W., R. M. Hoffer, and D. G. Milchunas. 1998. Biomass estimation on grazed and ungrazed range-lands using spectral indices. International Journal of Remote Sensing 19:427-438.
Vavra, M., 2005. Livestock grazing and wildlife: De-veloping compatibilities. Rangeland Ecology & Management 58:128-134.
Vavra, M., K. Walburger, and T. Delcurto. 2005. Ungulate ecology of ponderosa pine ecosystems in the North-west. In M. Ritchie, D. Maguire, and A. Young-blood (editors), Proceedings of the Symposium on Ponderosa Pine: Issues, Trends, and Management. U.S. Forest Service General Technical Report PSW-GTR-198, Albany, CA. Pp. 145-158.
Vavra, M., C. G. Parks, and M. J. Wisdom. 2007. Bio-diversity, exotic plant species, and herbivory: the good, the bad, and the ungulate. Forest Ecology and Management 246:66-72.
WDFW (Washington Department of Fish and Wildlife). 2002. Washington state elk herd plan: Yakima elk herd. Available online at http://wdfw.wa.gov/publications/00777/wdfw00777.pdf (accessed 5 February 2011).
WDFW (Washington Department of Fish and Wild-life). 2010. 2010 Game Status and Trend Report. Available online at http://wdfw.wa.gov/publica-tions/01159/wdfw01159.pdf (accessed 5 February 2011).
WDFW (Washington Department of Fish and Wildlife). 2012. Gray wolf conservation and management. Available online at http://wdfw.wa.gov/conserva-tion/gray_wolf/packs.html (accessed 27 November 2012).
Westoby, M. 1974. Analysis of diet selection by large generalist herbivores. American Naturalist 108:290-304.
Wienk, C. L., C. H. Sieg, and G. R. McPherson. 2004. Evaluating the role of cutting treatments, fire and soil seed banks in an experimental framework in ponderosa pine forests of the Black Hills, South Dakota. Forest Ecology and Management 192:375-393.
Wilmshurst, J. F., J. M. Fryxell, and R. J. Hudson. 1995. Forage quality and patch choice by wapiti (Cervus elaphus). Behavioral Ecology 6:209-217.
Wisdom M. J., and J. W. Thomas. 1996. Elk. In P. R. Krausman (editor), Rangeland Wildlife. Society for Range Management, Denver, CO. Pp. 157-181.
Wisdom, M. J., M. Vavra, J. M. Boyd, M. A. Hemstrom, A. A. Ager, and B. K. Johnson. 2006. Understanding ungulate herbivory-episodic disturbance effects on vegetation dynamics: knowledge gaps and manage-ment needs. Wildlife Society Bulletin 34:283-292.
Wissmar, R. C., J. E. Smith, B. A. McIntosh, H. W. Li, G. H. Reeves, and J. R. Sedell. 1994. A history of resource use and disturbance in riverine basins of eastern Oregon and Washington (early 1800s-1900s). Northwest Science 68:1-35.
WNF (Wenatchee National Forest). 1990. Wenatchee National Forest Plan. Available online at http://www.fs.fed.us/r6/wenatchee/forest-plan/previous-fp/wenatchee/index.shtml (accessed 15 February 2011).
Wright, C. S., and J. K. Agee. 2004. Fire and vegetation history in the eastern Cascade Mountains, Wash-ington. Ecological Applications 14:443-459.
Young J. A., D. W. Hedrick, and R. F. Keniston. 1967. Forest cover and logging—herbage and browse production in mixed coniferous forest of north-eastern Oregon. Journal of Forestry 65:807-813.
Received 14 March 2012
Accepted for publication 10 February 2013