Embed Size (px)
Citation preview

For Want of a Cup: The Rise of Tea in England andthe Impact of Water Quality on Economic
Development �
Francisca M. Antmany
Department of Economics, University of Colorado Boulder
February 10, 2016
Abstract
This paper explores the impact of water quality on long-run economic develop-ment by exploiting a natural experiment� the rise of tea consumption in 18th centuryEngland. This resulted in an unintentional increase in consumption of boiled water,thereby reducing mortality rates. The methodology uses two identi�cation strategiestying areas with lower initial water quality to larger declines in mortality rates aftertea drinking became widespread and following larger volumes of tea imports. Resultsare robust to the inclusion of controls for income and access to trade. The hypothesis isfurther bolstered by evidence from cause-speci�c deaths and early childhood mortality.
JEL classi�cation: N33, I15, Q25, Q56Keywords: tea, water quality, mortality, Industrial Revolution
�I thank Marcella Alsan, David Atkin, Tania Barham, Howard Bodenhorn, Brian Cadena, Ann Carlos,Gregory Clark, Karen Clay, William Collins, Melissa Dell, Thomas Dickinson, Erica Field, Andrew Foster,Claudia Goldin, Jonathan Hughes, Lakshmi Iyer, Robert Jensen, Trevon Logan, Wolfgang Keller, Victor H.Mair, Craig McIntosh, Terra McKinnish, Nathan Nunn, Matthew Ruther, Carol Shiue, Duncan Thomas,Werner Troesken, Marianne Wanamaker, and Shuang Zhang for their feedback. Tim Larsen, Peter Graca,Isaac Kaplan, Priti Kalsi, and Eric Penner provided excellent research assistance. Seminar and confer-ence participants at the NBER DAE Summer Institute, NBER/BREAD Development Fall Meeting, OhioState University, Duke University, Case Western Reserve University, University of New Mexico, University ofTennessee, Broom Center for Demography Workshop, Northeast Universities Development Consortium Con-ference, Population Association of America annual meeting, and Western Economic Association Internationalmeeting also o¤ered useful feedback. Any errors are my own.
yContact: [email protected], Department of Economics, University of Colorado Boulder,256 UCB, Boulder, CO 80309.
1

1 Introduction
The importance of access to clean water for economic development has recently received
considerable attention among researchers and policy makers alike. While United Nations
leaders declared victory in meeting the Millennium Development Goal of expanding access
to safe drinking water, more than 700 million people still lack access to an improved drinking
water source (WHO and UNICEF 2014). The fact that the majority of these people live in
the developing world has stimulated substantial research in developing countries to estimate
the impact of water interventions on health, mortality, and quality of life (Kremer et al. 2011,
Galiani et al. 2005, Devoto et al. 2012). Although these studies highlight the role that
access to clean water can play in economic development today, evaluating the importance
of clean water to the development of the now-rich world can help illuminate the long-run
impacts of clean water for economic development. This paper adds to both the historical
and development literature by exploiting a natural experiment into the e¤ects of water
quality on mortality that occurred prior to the understanding that water contamination
could compromise health, namely, the advent of tea consumption in 18th century England.
Since brewing tea would have required boiling water, and boiling water is now recognized as
a method of water puri�cation, the rise of tea consumption in 18th century England would
have resulted in an accidental improvement in the relatively poor quality of water available
during the Industrial Revolution. To what extent can this explain the drop in mortality
rates seen over this important period in economic development?
While there are now several historical studies of the relationship between water quality
and mortality, they have largely focused on the U.S. experience, and in particular, the
2

impacts of public health interventions targeted at improving drinking water sources and
sewage systems in the late 19th and early 20th centuries (Alsan and Goldin 2015; Beach et
al. 2014; Ferrie and Troesken 2008; Cutler and Miller 2005; Troesken 2004). By this time
period, as with the water impact studies that take place in developing countries today, clean
water and sanitation are widely understood to have a direct impact on health, thus raising the
possibility that treatment estimates may su¤er from endogeneity bias and be confounded with
correlated e¤ects (Currie et al. 2013). Although current development projects employing
randomized controlled trials may avoid selection bias, an important policy question concerns
how to ensure that the population adopts the intervention after the experimenters are gone,
particularly if it represents a change in custom imposed from without. In contrast, the
entirety of the period examined in this paper occurs prior to the widespread acceptance
of the germ theory of disease and prior to major public health interventions. Thus, it
also constitutes an important distinction from the historical and development literatures,
as it concerns a change in culture and custom that occurred without any concerted policy
intervention. While the link between increased tea consumption, population, and growth
has been hypothesized by some historians (MacFarlane 1997; Mair and Hoh 2009; Standage
2006), to my knowledge this is the �rst paper to provide quantitative evidence on this
relationship.
I put forth two identi�cation strategies to estimate the causal relationship between tea
consumption and mortality rates in England. The �rst is a di¤erence-in-di¤erences style
model that compares the period before and after the widespread adoption of tea in England
across areas that vary in their initial levels of water quality. Proxies for initial water quality
come from geographical features of local communities as well as initial population density
3

measures, and it is their interaction with variation in tea adoption over time that represents
the independent variable of interest. Importantly, this allows for me to control for parish
and year �xed e¤ects separately and thus net out time-invariant di¤erences across parishes
as well as changes over time that are common to all parishes from the estimated impact of
tea on mortality. This is similar to the approach used by Nunn and Qian (2011), who exploit
regional variation in the suitability of land for potato cultivation to estimate the impact of
the introduction of the potato on population.
The second identi�cation strategy modi�es this strategy to exploit actual tea import
data at the national level interacted with the water quality measures. Here, I investigate
whether positive shocks to tea imports resulted in larger declines in mortality rates in areas
where water quality was initially worse. As expected, both sets of results suggest that tea
was associated with larger declines in mortality rates in areas that had worse water quality
to begin with. These results are robust to controlling for wages and interacted variables
capturing distance to market and alternative imports, thus suggesting the results are not
driven by economic factors such as rising incomes and access to trade. I provide further
support for the boiled water mechanism with analyses of cause-speci�c death data that show
increased tea imports resulted in fewer contemporaneous deaths from water-borne diseases,
but no similar decline in contemporaneous deaths from non-water-borne diseases. Additional
analyses linking tea imports with infant and early childhood mortality rates suggest that
young children did not bene�t from tea shocks, which is as expected if they were not major
consumers of tea. All together, the totality of the results points to the importance of tea,
and in particular the boiling of water, in reducing mortality rates across England during this
important period in economic development.
4

The remainder of this paper is organized as follows. Section 2 provides some background
on the historical context surrounding the introduction of tea to England. Section 3 presents
the empirical strategy including the two identi�cation strategies described above. Section
4 describes the data used in the analysis. Section 5 presents the results, robustness checks,
and empirical support for the mechanism using cause-speci�c death and early childhood
mortality data. Section 6 concludes.
2 Historical Background
Tea was �rst imported to England from China in 1689 (Mair and Hoh, 2009) and like most
newly imported goods, at the outset, tea was regarded as a luxury good enjoyed by the
elite. By the end of the 18th century, however, a consumer revolution was taking place in
which broad social groups were able to purchase newly available goods, such as tea (Allen
2009, p.49-50). As such, historical evidence indicates that even the humblest peasant drank
tea twice a day (MacFarlane p.144-48). The rapid and wide acceptance of tea throughout
the population was likely due to the distinct properties of tea that made it accessible to
all social classes. In particular, only a few leaves are necessary to make a decent pot
and tea leaves can be reused, such that boiling water can be poured over already-used tea
leaves (MacFarlane and MacFarlane 2003), thus decoupling the link between income and
tea consumption. While this production process would have produced weaker tea, it also
suggests that the main health improvement associated with tea would be related to the
properties of boiled water, as opposed to any particular property of the tea leaf itself.
Why then did tea emerge as the English national beverage? One important factor is
5

the prominent role of the English East India Company (EIC) which had a long-running
monopoly over trade with the Far East until 1834. Through its dominance in international
markets, the EIC was able to bring so much tea into England that it was able to push other
beverages such as co¤ee, out of the market (Mair and Hoh 2009, p.176). Another cultural
feature that helped solidify England as a nation of tea drinkers was the advent of tea houses,
where, unlike all-male co¤ee houses, women could purchase their own tea. This ensured
that tea would become a more accessible beverage, available to a wider population, and thus
solidify its dominance as the country�s national beverage. Tea gardens, which could be
enjoyed by men, women, and families together, also enshrined tea as a cultural custom, as
did the worker�s tea break (Mair and Hoh 2009 p.186, MacFarlane and MacFarlane p.80-94).
The relative cost of tea, further diminished by the ability to reuse tea leaves, was also an
important feature in establishing tea�s dominance over alternative beverages. For instance,
the consumption of alcoholic beverages, such as ale and beer, had a long history in England
prior to the introduction of tea. Although these beverages would also have represented
improvements over plain water, they were costly in comparison, in part due to the high
costs of inputs involved in producing them, as well as the malt tax which further raised
consumption costs. Thus, while "small beer" was at one point the usual beverage in England,
by 1680, the malt tax had risen so considerably that it became necessary to �nd an alternative
beverage (MacFarlane, p.151; Clark 1998, ch.1). While there are no widespread data on
beverage consumption to document this trend, to the extent that some individuals were
substituting tea for beer as opposed to water, it is important to note that this would only
mean that the estimates here could be interpreted as lower bounds on the true impact of
water quality on health outcomes. Like beer, other beverages that may have provided an
6
improvement in water quality, such as co¤ee, chocolate, wine, and whiskey, would also have
been less suitable as a national beverage due to the high costs of inputs involved in production
and unpleasant side e¤ects from large-scale consumption (MacFarlane and MacFarlane,
p.283). Raw milk, on the other hand, would have been contaminated with bacteria until
pasteurization began around 1890 (MacFarlane 125-26). In contrast, tea was a relatively
cheap, accessible, and safe beverage that was mild enough to be drunk throughout the day
by the entire population (MacFarlane and MacFarlane p.31-39).
At the time that tea was sweeping across England, the methods for disposing human
waste in England were still very primitive. Far too few privies existed and householders
were known to accumulate their excrement and dispose of them in streets and rivers (MacFar-
lane 1997, p176). This made cities, with rising population densities, particularly dangerous,
and may explain why urban men were substantially shorter than rural men over this period
of rapid urbanization (Steckel 2005). At this time, however, the critical importance of prop-
erly separating human excrement from drinking water sources was not understood and thus
typhoid and later cholera outbreaks were common. This may have been in part due to the
fact that the germ theory of disease was in its very infancy and unknown to more than a
handful of people worldwide. Prevailing views on the causes of mortality crises focused on
miasmas, clouds of noxious gases that moved indiscriminately across the population spread-
ing illness and death. It was not until the 1840s that William Budd (MacFarlane p.110)
and John Snow (Johnson 2006, p. 74) argued that typhoid and cholera were spread through
contaminated water, and their hypotheses continued to be hotly debated until John Snow�s
pioneering epidemiological study of the London cholera outbreak of 1854 publicly demon-
strated the link between water and disease (Johnson 2006). This discovery fueled the public
7
health movement that emphasized the need to separate drinking water sources and sewage
infrastructure. Nevertheless, public interventions were poorly funded and it was not until
the late 19th and early 20th centuries, well beyond the period studied here, that signi�cant
improvements were made in public sanitation and environmental health (Harris et al. 2010).
Thus, the fact that people were ignorant of the dangers of contaminated water during the rise
of tea consumption, coupled with evidence that people were not motivated to drink tea for
its health bene�ts (MacFarlane 1997, p.149) and actually debated the merits of tea-drinking,
(Mair and Hoh p.178-80), all suggest that tea drinking was likely to be independent of the
types of unobserved variables that might present a challenge for identi�cation.
While some might be concerned that estimating the relationship between tea and mor-
tality over this period is actually driven by rising wages, there is considerable evidence to
suggest that although English wages were high relative to other countries, they rose very
little over this period (Allen, 2009, p.41-42). Others have also suggested that however much
real wages rose over this period, living standards did not rise (Mokyr 1993). What then can
explain the dramatic drop in mortality seen over this period that has continued to be the
subject of considerable historical debate (Johnson 1993)? While some have argued that it
stemmed from nutritional improvements which allowed for a reduced incidence of infectious
disease (McKeown 1983; Fogel 1989), still others have disputed this hypothesis (Scho�eld
1984; Lee 1981), and others have argued that nutrition actually declined over at least part of
this period (MacFarlane 1997, ch.21). The decline of beer in the late 17th century owing to
the high malt tax would certainly have meant a decline in nutritional quality of beverages,
as tea is less nutritionally useful than beer. Thus the paradox of why England experienced
a decline in mortality over this period without an increase in wages, living standards, or nu-
8

trition can be explained in part by the widespread adoption of tea as the national beverage
and the commensurate increased consumption of boiled water (MacFarlane 1997, p. 150).
While this paper represents the �rst quantitative examination of this hypothesis, it should
be noted that several historians have suggested that the custom of tea drinking was instru-
mental in curbing deaths from water-borne diseases and thus sowing the seeds for economic
growth. MacFarlane (1997) draws comparisons between the experiences of England and
Japan in this respect, concluding that �tea caused boiled water to be used, which caused
dysentery to be minimized� (MacFarlane 1997, p.379). Mair and Hoh (2009, p.198) write
that without �boiled beverages such as tea, the crowding together in immense cities...would
have unleashed devastating epidemics.� Similarly, Standage (2006, p.201) writes that the
popularity of tea �allowed the workforce to be more densely packed in their living quarters
around factories in the industrial cities. . . without risk of disease.�This view is echoed by
Johnson (2006, p. 95), who writes that �largely freed from waterborne disease agents, the
tea-drinking population began to swell in number, ultimately supplying a larger labor pool
to the emerging factory towns....�
3 Empirical Methods
3.1 First Identi�cation Strategy
To measure the e¤ect of tea drinking on mortality rates in England, I begin by comparing
mortality across areas that varied in initial water quality before and after tea consumption
became popular. This is estimated via the following regression model:
9
Deathsit = a1 + 1WaterQualityi � PostTeat +Xit�1 + �i + �t + "it , (1)
where the dependent variable is the natural log of the number of deaths in parish i in year
t. The independent variable of interest, WaterQualityi � PostTeat, is an interaction term
between the initial water quality in parish i and a dummy variable indicating the period is
after tea drinking was widespread among the broader population of England. As discussed
above, although tea �rst came to England just prior to 1700, very little tea consumption
was occurring very early in the period and thus could not have had an appreciable e¤ect
on death rates at that time. Instead, I date the widespread adoption of tea to the Tea
and Window Act of 1784 which reduced the tea tax from 119 to 12.5 percent at one stroke
(Mair and Hoh, p.187-88). This is further supported by Figure 1 which shows national
tea imports over time, smoothed to a 3-year moving average in order to highlight breaks in
trend. As can be seen from the �gure, 1785 appears to be a clear dividing line in the time
series of imports, with a substantial rise in tea imports occurring thereafter. In light of this,
I de�ne PostTeat to be an indicator for years 1785 or later. In subsequent speci�cations,
I also introduce lead indicators for the periods immediately preceding 1785 interacted with
water quality measures to show that the results are robust to concerns regarding pre-existing
trends prior to 1785.
All regressions include parish �xed e¤ects (�i) which control for all time-invariant factors
at the parish level such as geographical features of the parishes themselves. Importantly,
this will absorb any correlation between parish elevation and parish deaths that is �xed over
time, and thus mitigate concerns that the coe¢ cient of interest is driven by factors purely
10
related to elevation. At the same time, year �xed e¤ects (�t) are included in all speci�cations
to control for time-varying factors that are common to all parishes, such as the national-level
changes in income associated with the Industrial Revolution, as well as any national events
such as wars. Xit includes controls for other parish characteristics that vary over time, such
as population measures which will be discussed below, and later wages as well. Standard
errors are clustered at the parish level. Equation (1) is estimated on the years 1700-1839 to
more closely surround the rise of widespread tea adoption in England.
3.2 Second Identi�cation Strategy
To provide further evidence of the impact that tea consumption had on mortality rates, I
utilize actual tea import data to compare the impact of national tea imports on mortality
rates in areas that varied in their level of initial water quality:
Deathsit = a2 + 2WaterQualityi � Tea Im portst�1 +Xit�2 + �i + �t + "it , (2)
where the independent variable of interest, WaterQualityi � Tea Im portst�1, is the in-
teraction term between initial water quality in parish i and national-level tea imports in year
t-1. The use of lagged tea imports re�ects the fact that tea imports arriving in London may
not have reached the �nal consumer until the following year. All remaining variables are
as speci�ed above, where again year �xed e¤ects and parish �xed e¤ects provide important
means of controlling for unobservables that otherwise might bias the coe¢ cient of interest.
The raw relationship between tea imports and mortality rates is documented in Figure
2 which shows per capita tea imports and the English crude death rate over the period in
11
which tea import data are available. Apart from the overall rise in tea imports that is
clearly correlated with the drop in mortality rates over the period as a whole, there is also
substantial variation in the tea series to be exploited by the identi�cation strategy used
here. In particular, it is expected that a substantial portion of the volatility in tea imports
is driven by supply-side determinants such as weather shocks in China, thus producing
exogenous variation in the supply of tea to England. As a robustness check to ensure
that the estimated e¤ects are not simply driven by changes in income or economic factors,
subsequent speci�cations control for wages as well as interacted variables measuring access
to trade and other imported goods. This adds weight to the causal interpretation for the
special role that tea played in decreasing mortality.
3.3 Support for the Mechanism
To further bolster the evidence that the mechanism behind these results was the improve-
ment in water quality, I also use cause-speci�c death data over this time period available in
Marshall (1832) to show that higher tea imports curbed deaths from water-borne diseases
such as dysentery, commonly described as �ux or bloody �ux (Wrigley and Scho�eld 1981).
At the same time, falsi�cation tests show that shocks to tea imports did not signi�cantly
a¤ect contemporaneous deaths from air-borne diseases such as tuberculosis and smallpox.
Unfortunately, cause-speci�c death data are only available for London prior to the middle of
the 19th century, and thus the identi�cation strategy here relies on linking variation in tea
imports with variation in cause-speci�c deaths:
12
CAUSE_Specific_Deathsit = a3 + 3Tea Im portst + �3t+ �3t2 + "it , (3)
where current year�s tea imports are included in the speci�cation due to the fact that
London would have been the main port of entry and also the site of the mortality measure-
ments in this speci�cation. A linear and quadratic time trend are also included as controls.
This is similar to the approach used by Galiani et al. (2005), with the obvious drawback
that cause-speci�c mortality rates are not available across parishes, thus eliminating the
possibility of a di¤erence-in-di¤erences strategy here.
As an extension, I also use data on infant and child mortality from London available
in Marshall (1832) to run a similar speci�cation to investigate whether infant and early
childhood deaths can be linked to variation in tea consumption. In the context of childhood
deaths, however, it is important to note that although infants and children may have been
less likely to consume tea, they are also thought to be more sensitive to water-borne diseases,
and thus they may have indirectly bene�ted from a lower incidence of these diseases among
the tea-drinking population (MacFarlane 1997). Regardless, we should expect that the
magnitude of the impact of tea on infants and young children should at the very least be
more muted, if not statistically insigni�cant.
13

4 Data Sources
4.1 Mortality Data
The mortality rates and parish characteristics used in the analysis are constructed from
Scho�eld and Wrigley�s (2003) collection of records on burials, baptisms, and marriages for
404 English parishes over the years 1538-1849. To limit the focus to the years in which
tea was introduced, this paper focuses on the sample starting in 1700. While Wrigley and
Scho�eld (1981) use these data to recover population estimates for England as a whole, they
do not provide population estimates for the parishes individually. Since it is important
to scale deaths by the relative size of the parishes, I follow Wachter (1998) in constructing
the following measure of parish population based on a weighted average of past measures of
parish-speci�c burials, baptisms, and marriages:
Populationit = 0:4� smooth(Baptismsit�20)0:03
+ 0:4� smooth(Burialsit�20)0:025
+
+0:2� smooth(Marriagesit�20)0:008
, (4)
where Populationit is the constructed measure of population for parish i in year t and
smooth(xit�20) is the average of x over the past 20 years. As there may be some concern over
the use of this constructed measure and the degree of measurement error it may include, I
report speci�cations with the natural log of Populationit on the right-hand side, as opposed
to scaling the dependent variable by the constructed population measure. For comparison,
I also present results with the measure of births (Baptismsit) and marriages (Marriagesit)
14

on the right-hand side instead of the constructed population measure.1
4.2 Water Quality Measures
The water quality measures used in the analysis are based on the average elevation within
a parish, as well as initial population density in the parish at a point in time prior to the
rise of tea consumption.2 It is believed that parish elevation should be positively correlated
with water quality because parishes at higher elevation would have been less likely to be
subjected to water contamination from surrounding areas. The measures of the average
elevation (in meters) in the parish are constructed from Shuttle Radar Topography images
(Jarvis, et al. 2008 ) based on historical parish boundaries (Southall and Burton 2004). A
map of parish locations is provided in Figure 3, which shows that parishes are dispersed
throughout England. Further analysis indicates that relatively high elevation parishes are
not geographically concentrated either.
1An earlier version of this paper also presented estimates using the control for marriages alone and found
substantially similar results.2An earlier version of this paper also used average slope as a water quality proxy, under the hypothesis
that water would have been less likely to pool in steeper parishes. Since running water is generally higher
quality than standing water, this would mean that steeper parishes would have had better water quality
than parishes that were relatively �at. The entirety of the historical results, including robustness checks, is
statistically signi�cant and consistent with this hypothesis. However, subsequent analysis of the correlation
between slope and fecal coliform levels in present-day Africa and India yields a statistically insigni�cant
relationship between average slope and fecal coliform levels. While this may re�ect the fact that the
relationship between slope and fecal coliform in present-day India and Africa is not similar to that in 18th
century England, I omit those speci�cations from the main results due to insu¢ cient support for the use of
slope as a water quality proxy.
15

The other proxy for water quality is population density, but here the correlation is thought
to be negative as a denser parish would have posed greater challenges for disposing of human
waste and thus provided greater sources for contamination. This is particularly true for this
period prior to the widespread acceptance of the germ theory of disease and the public health
movement that began later in the 19th century (Johnson 2006). To avoid inherent corre-
lation between the dependent variable and the constructed measure of population density, I
construct a measure of initial population density in 1700 using the calculation in equation
(4) divided by parish area. While the use of a lagged measure of population density may
result in a reduction in statistical precision, the argument here is that there are likely to be
structural reasons determining population density that are likely to be �xed over time, and
thus captured by this measure.
While it is not possible to test the hypothesized correlations between the water quality
proxies and explicit water quality levels in the 18th century, I provide empirical support for
these measures from present-day settings that arguably most closely approximate the period
under study. To do this, I focus on Africa and India, as these are recognized as two areas
with some of the worst access to sanitation facilities (WHO and UNICEF 2014, p.17), and
thus present the greatest chance for water contamination. For these areas, I obtain data
on fecal coliform levels from the United Nations Global Environment Management System
Water Programme which include latitude and longitude coordinates at select water quality
sites sampled over time. I then construct 3 kilometer bu¤er zones around these sites to
re�ect the average distance traveled to collect water in the developing world (Ure 2011).
Appendix Figure 1 shows a map of the bu¤er zones surrounding these water quality sites.
These bu¤er zones are then matched with Shuttle Radar Topography images (USGS 2015) for
16
the relevant areas and population density data from 1990 Gridded Population of the World
Version 3 (GPWv3): Population Density Grids (CIESIN and CIAT 2005). This exercise
produces a data set with fecal coliform levels and associated elevation and population density
data for 87 water quality sites in Africa and India over time.
Appendix Table 1 shows that, even after including country and year �xed e¤ects, the
relationship between fecal coliform levels and elevation is especially robust: locations at
higher elevation are exposed to lower levels of fecal coliform. There is less support for
the population density measure, owing in particular to large standard errors. This weaker
relationship may stem from the fact that in the present day, when water quality is understood
to be an important determinant of public health, o¢ cials are more likely to improve water
sources in higher density areas. Regardless, the sign of the coe¢ cient suggests that higher
density areas have higher levels of fecal coliform and is thus consistent with the hypothesis
that water quality and population density are inversely related.
4.3 Tea Imports
The data on national-level tea imports come from the East India Company records available
from Bowen (2007) and cover the years 1761-1834. Unfortunately, the data on tea are not
available at the parish level, thus requiring the more subtle empirical strategy discussed
above. Figure 1 shows a dramatic rise in tea imports from China over the years 1761-1834,
going from around 5 tons at the beginning of the period to over 30 tons at the end.3 At
the national level, there is a clear negative correlation between tea imports and mortality
3In response to increased competition, the East India Company began to shift production and exportation
of tea to India, but not until the late 1830s (Mair and Hoh, p.212-13).
17
rates (Wrigley and Scho�eld 1981, p.531-534), illustrated in Figure 2. Over this period,
mortality rates fell from around 29 to 24 deaths per 1,000 people. At the same time, there
appears to be substantial year-to-year variation in tea imports and mortality rates which
will prove useful in the second identi�cation strategy used here.
4.4 Descriptive statistics
Table 1 presents descriptive statistics for the data sources used in the analysis. Panel A
includes means and standard deviations for the two measures of water quality used here:
parish elevation and parish population density in 1700. Table 1, Panel B describes the
demographic data that vary over time which are used in the �rst identi�cation strategy over
the years 1700-1839. Finally, Table 1, Panel C describes the data on tea imports for the
years 1761-1834 which are used in the second identi�cation strategy outlined above.
The descriptive statistics might better illustrate the spirit of the identi�cation strategy
in graphical form. To this end, Figures 4 and 5 graph death rates against tea imports for
the three measures of water quality used in the analysis. Figure 4 graphs the death rates
against tea imports distinguished by whether the parishes were in high elevation (better
water quality) versus low elevation (worse water quality) areas. The �tted line for the low
water quality areas appears to be steeper than that for high water quality areas, suggesting
that increased tea consumption had a bigger impact on lowering mortality rates in areas
where water quality was worse. In Figure 5, where population density in 1700 is used as the
measure of water quality, worse water quality (higher population density) again appears to be
linked with a bigger decline in death rates relative to areas with better water quality (lower
18

population density), and thus produces a steeper �tted line for higher density parishes.
5 Results
5.1 First Identi�cation Strategy
5.1.1 Main Results
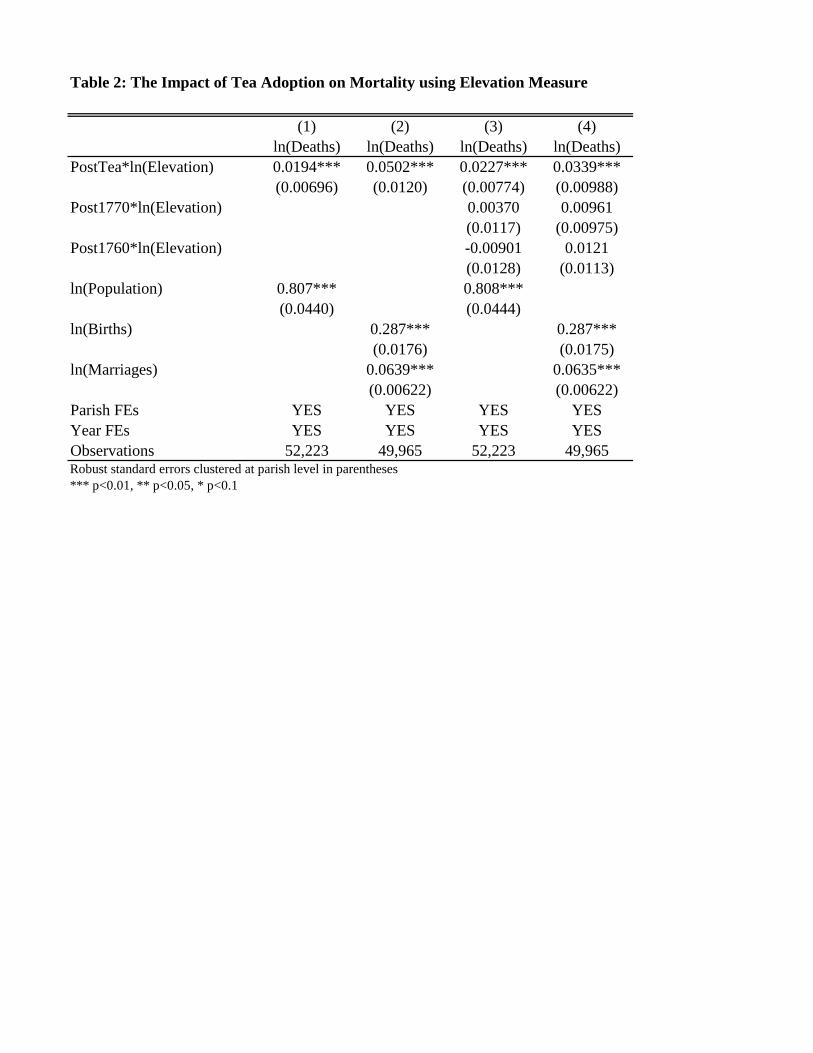
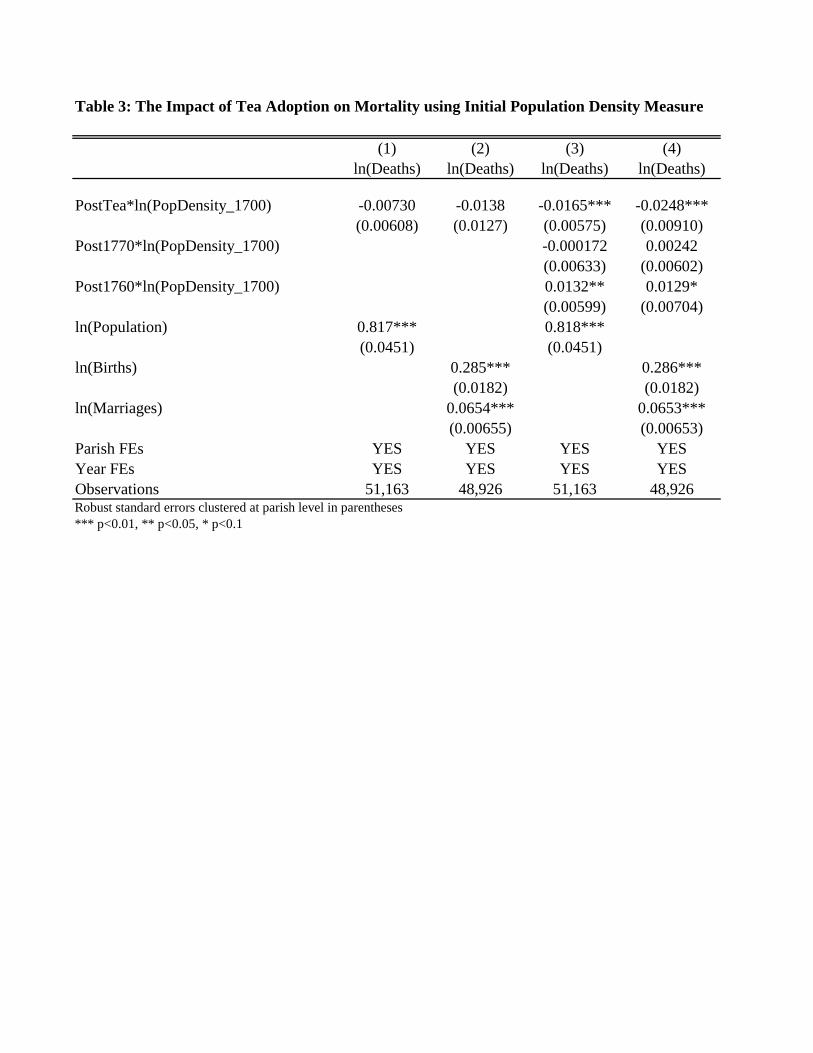
Tables 2 and 3 presents the main results using the �rst identi�cation strategy relying on the
interaction between parish water quality measures and an indicator for the post-tea-drinking
era which coincided with the dramatic drop in the tea tari¤ in 1785 (equation 1). Table 2
focuses on the elevation measure while Table 3 shows the results using initial population
density. Both tables present results with the constructed population measure as well as
the alternative speci�cation where births and marriages are used as controls. Across both
tables, the coe¢ cients of interest on the interaction between the post-1785 indicator and
the water quality variables all have the anticipated signs. The coe¢ cient on the interaction
term between elevation and post-tea indicator in Table 2 is positive, suggesting that a lower
elevation (worse water quality) is associated with a bigger decline in deaths after tea drinking
became widespread. The magnitude of the coe¢ cient under both sets of controls (columns 1
and 2) ranges from 0.019 to 0.050. This suggests that after tea became widespread, parishes
with 10 percent lower water quality saw a drop in deaths on the order of 0.2 to 0.5 percent.
To provide further interpretation of this magnitude, I use this estimate to determine
how much of the decline in mortality over this period can be attributed to the adoption of
tea. This approach is analogous to that used by Nunn and Qian (2011). I �rst construct
19

a counterfactual estimate of parish-level deaths by multiplying the estimated coe¢ cient of
interest and the water quality measure for each parish and add that to the dependent variable
observed at the end of the period (ln deathsi;1839 + b� ln elevationi). I then average this
estimate over all parishes to construct a nation-wide estimate of the counterfactual ln deaths
that would have occurred at the end of the period had tea not been introduced. Comparing
this with the actual change in average ln deaths observed over this period indicates that the
ratio of actual to counterfactual deaths was approximately 88 percent, indicating that tea
was responsible for about 12 percent of the change in mortality observed over this period,
according to the estimate in column (1) of Table 2.
Although the coe¢ cients on the interaction between initial population density and the
post-tea indicator (columns 1 and 2 of Table 3) are not statistically signi�cant in these
speci�cations, their signs are nevertheless consistent with the above interpretation. That
is, since population density is negatively correlated with water quality, these estimates also
suggest that worse water quality (higher initial population density) is associated with a drop
in mortality after tea drinking became widespread.
5.1.2 Robustness
One common feature of di¤erence-in-di¤erences strategies is the parallel trends assumption
that requires that the treated and control groups would have maintained parallel trends in
the absence of treatment. While this assumption is ultimately untestable, a common method
of bolstering the case for this assumption is to show that there were no pre-existing trends
prior to treatment. Thus, to demonstrate the robustness of the �rst identi�cation strategy,
columns 3 and 4 of Tables 2 and 3 present the analogous results from equation (1) after
20

including two pre-trend indicators interacted with the respective water quality measures.
These include lead variables for the post-1760 era as well as the post-1770 era.
In Table 2, where elevation is the proxy for water quality, all coe¢ cients on lead indicators
interacted with water quality are statistically insigni�cant, indicating that the impact of tea
on mortality is concentrated in the expected period. There is also little change in the
magnitude of the coe¢ cient of interest, ranging from 0.023 to 0.034. In Table 3, where
population density is the water quality measure, the coe¢ cients on the lead periods are
statistically insigni�cant with the exceptions of the interactions with the 1760 indicator.
The latter estimates, however, are in the opposite direction of the coe¢ cient of interest,
suggesting that the estimated impact of tea is not driven by a pre-existing trend. At the
same time, it should be noted that the coe¢ cient of interest based on population density in
Table 3 is statistically signi�cant with the anticipated sign. Parishes that had a ten percent
higher initial population density experienced a decline in deaths between 0.17 and 0.25
percent after tea drinking became widespread. Overall, this evidence mitigates concerns
over whether pre-existing changes in mortality rates are driving the e¤ects of interest and
supports the notion that areas with worse water quality had greater declines in mortality
after tea drinking became widespread in 1785.
5.2 Second Identi�cation Strategy
5.2.1 Main Results
Table 4 present the main results using the second identi�cation strategy relying on actual
shocks to tea imports (equation 2), with both measures of water quality and both population
21
controls. The coe¢ cients on the interaction terms between water quality and lagged tea
imports suggest the same pattern that was observed in Figures 4 and 5. First, the inter-
action term between tea imports and elevation has a positive coe¢ cient (columns 1 and 3)
with a magnitude ranging from 0.011 to 0.013. This suggests that lower elevation parishes
(with worse water quality) had relatively larger declines in mortality rates when England
experienced a positive shock to tea imports. In particular, the magnitudes suggest that for
a parish with a one standard deviation lower elevation (worse water quality), a 10 percent
increase in tea imports would have implied a 0.1 percent drop in deaths (10*0.011*0.907),
based on the estimate in column (1). Note that this is similar to the magnitude observed
in the �rst identi�cation strategy.
The results using the population density measure (columns 2 and 3 of Table 4) produce
negative coe¢ cient estimates of interest, but a similar pattern of results since population
density is negatively correlated with water quality. The similarity of coe¢ cient estimates in
the range of -0.006 to -0.010 is also reassuring. The fact that the coe¢ cients of interest
are statistically signi�cant at the 1 percent level (elevation measure) or 5 percent level
(population density measure) also lends credence to the results. Moreover, these results
validate those from the �rst identi�cation strategy and again indicate that tea reduced
mortality rates more in areas with worse initial water quality.
5.2.2 Robustness
One concern with these interpretations is whether the coe¢ cients of interest are picking up
correlations between the independent variables of interest and some unobserved variables that
are actually driving the results. While the complexity of the identi�cation strategy relying
22

on the interaction between the water quality measures and the tea imports, as well as the
inclusion of year and parish �xed e¤ects may mitigate some of these concerns, additional
controls may lend further support for the interpretation. Arguably, the primary concern
is that the interaction term may be correlated with changes in income. While there are
few comprehensive sources of data that vary across parishes over time during this period in
history, I turn to economic historians that have constructed their own data sets to bridge
the gap. In particular, I use regional wage data by quinquennia available in Clark (2000).
While these are described as daily farm wages, it is likely that competitive pressures would
have worked to equilibrate wages across sectors and thus represent a reasonable proxy for
income.
The results from the second identi�cation strategy (equation 2) after controlling for wages
can be found in Table 5, for both measures of water quality as well as both population-level
controls. Somewhat paradoxically, the coe¢ cient on wages is positive suggesting areas with
higher growth rates experienced greater mortality. This likely indicates that local economic
growth was also correlated with factors detrimental to human health and is thus also serving
as a further control for those factors. Nevertheless, the primary interest is in exploring the
impact on the coe¢ cients of interest and here we see that they are very close in magnitude
to the results from Table 4, and are all still statistically signi�cant at the 5 percent level.
Table 6 goes on to include the wage measures as controls in the estimation of equation (1),
again for both measures of water quality as well as both population-level controls. Again
similar results are obtained, compared with the results without controlling for wages from
Tables 2 and 3, columns 1 and 2. Overall, these results mitigate concerns that the results
are driven purely by region-speci�c variation in economic growth.
23

To further address concerns that the measures of water quality are actually picking up
some underlying wealth distributions or proximity to trade routes that are actually driving
the correlation with mortality rates, I include additional parish-level controls interacted with
variables that vary over time. These include parish characteristics such as the distance to
the nearest market town in 1700 (in km) and a variable indicating that the parish is within
10 km of the coast, interacted with tea imports. A related concern is that the tea import
data might be re�ecting changes in income over time across parishes and these changes had
a di¤erential impact on mortality across di¤erent types of parishes. To address this, I make
use of the East India Company�s records on other (miscellaneous) imports and interact them
with the measures of water quality.
Table 7 reports the results from these regressions. While the coe¢ cient on the distance to
market town interaction term is statistically signi�cant across all speci�cations, almost all of
the interaction terms using miscellaneous imports or the indicator for proximity to the coast
are not. More importantly, Table 7 shows that the inclusion of these additional controls
does not substantially a¤ect the pattern of results. Coe¢ cient estimates on the interaction
term between elevation and tea are in a very similar range as was observed in Table 4 (0.009
to 0.012), and statistically signi�cant at the 5 and 1 percent levels, respectively. While the
population density measure is no longer statistically signi�cant, it is still negative in sign,
suggesting that parishes with higher initial population density, and correspondingly worse
water quality, saw a bigger decrease in mortality when there were larger tea imports.
24

5.3 Cause-Speci�c and Early Childhood Mortality
To provide further support that these estimates are driven by increased consumption of
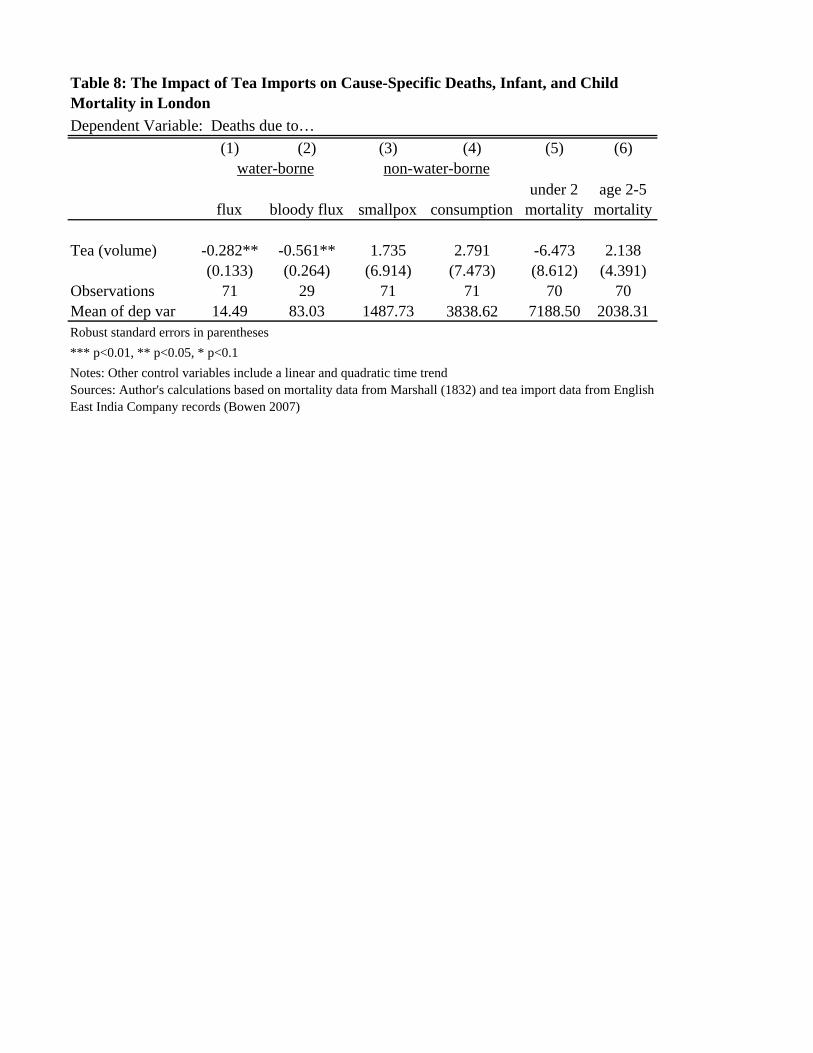
boiled water, as opposed to any properties of the tea itself, Table 8 shows the results from
equation (3). Here, I investigate whether variation in tea imports can explain variation
in cause-speci�c mortality rates and infant and child mortality rates in London speci�cally.
Columns (1) and (2) show that higher tea volumes are associated with lower deaths from �ux
and bloody �ux, two diseases most clearly identi�ed with dysentery and diarrhea speci�cally.4
First, it should be noted that the average number of deaths due to both �ux and bloody
�ux look small, particularly in comparison with those due to smallpox and consumption
(tuberculosis). This is likely due to the di¢ culty in classifying cause of death during this
period of time prior to modern medicine. In particular, it is likely that diarrheal diseases
were misclassi�ed, owing to symptoms such as fevers and abdominal pains that may have
been confused with other diseases. Thus, although deaths due to intestinal infections are
found to account for 8 percent of all deaths around the mid-19th century, it is reasonable to
presume that actual rates were higher (Wrigley and Scho�eld 1981, p. 659). Thus, while we
can conclude from columns (1) and (2) of Table 8 that higher tea volumes are associated with
fewer deaths from �ux and bloody �ux (coe¢ cient estimates -0.282 and -0.561, respectively),
we should be more cautious in interpreting the relative impact implied by these estimates.
Nevertheless, we can compare the sign and absolute magnitude of these results with those
suggested by falsi�cation tests where contemporaneous non-water-borne related deaths are
used as dependent variables (columns 3 and 4 of Table 8). The choice of consumption and
4A separate diagnosis for bloody �ux appears in the middle of this period, explaining the smaller sample
size in column (2).
25
smallpox are used in light of the greater likelihood that these diseases would not have been
confused with dysentery, in particular smallpox which was "clearly recognizable" (Wrigley
and Scho�eld 1981, p.688). Columns (3) and (4) show that the coe¢ cients on smallpox and
consumption are positive in sign and statistically insigni�cant, with much larger magnitudes
(1.735 and 2.791, respectively), in part owing to the much larger number of deaths due to
these diseases over this period. This suggests that while tea drinking was associated with a
decline in water-borne diseases, no similar decline in non-water-borne diseases was observed.
This adds credence to the hypothesis that the mechanism by which tea reduced mortality
was through the boiling of water.
As mentioned above, it is less clear whether tea should have had a noticeable impact
on the mortality rates of infants and children, since children are more susceptible to water-
borne diseases and may have bene�ted indirectly from a lower incidence of these diseases
among the tea-drinking population. At the very least, however, we should expect that the
impact would likely have been less important than for adults. As shown in Table 8, the
evidence here does not point to any statistically signi�cant relationship between tea imports
and either infant (under 2 years old) or child (2 to 5 years old) deaths. Estimates are also
small in magnitude (-6.74 and 2.138, respectively) relative to the large average number of
deaths per year for these age groups (7189 and 2038, respectively). This may re�ect the
possibility that infants and children were less likely to drink tea, implying they did not see
as much bene�t to increases in tea volumes.
26

6 Conclusion
Overall, evidence presented in this paper suggests that the rise of tea consumption in 18th
century England had an important impact on the drop in mortality rates observed during
this important period in economic development. Two identi�cation strategies, relying on
the argument that areas that had worse initial water quality levels should have experienced
larger declines in mortality rates, produce estimates that support this view and are further
bolstered by several robustness checks that rule out the possibility that this relationship is
purely driven by rising incomes or access to trade. Additional evidence using cause of death
and early childhood mortality data also support the interpretation and are consistent with
the hypothesized mechanism, namely, the increased consumption in boiled water required to
make tea. The fact that these results are supported by two identi�cation strategies using
di¤erent sources of variation as well as two proxies for water quality also add credence to
the results. While the magnitudes of the estimates can be interpreted to suggest that tea
was responsible for about 12 percent of the decline in death rates observed over this period,
it is important to note that this is almost certainly underestimated because tea would have
reduced mortality rates in parishes with relatively good water quality over this period as
well.
Although the broader impact of tea consumption on mortality rates at the dawn of the
Industrial Revolution has been hypothesized by some historians, this paper provides the �rst
quantitative evidence on this relationship. Consequently, the empirical relationship uncov-
ered here makes a signi�cant contribution to the literature on the origins of the Industrial
Revolution as well as the �eld of economic development which has recently seen a surge in
27

attention devoted to improvements in water quality in currently developing countries. While
that literature has primarily focused on evaluations of policy interventions and randomized
trials, this paper presents an important exception. In this case water quality was improved
without design or concerted intervention, but instead through a change in culture and custom
that ultimately looks to have proven critical for long-run economic development.
28
References
Allen, Robert C. 2009. The British Industrial Revolution in Global Perspective. New York:
Cambridge University Press.
Alsan, Marcella and Claudia Goldin. 2015. �Watersheds in Infant Mortality: The Role
of E¤ective Water and Sewerage Infrastructure, 1880 to 1915.�NBER Working Paper No.
21263.
Beach, Brian, Joseph Ferrie, Martin Saavedra and Werner Troesken. 2014. �Typhoid Fever,
Water Quality and Human Capital Formation.�NBER Working Paper No. 20279.
Bowen, H.. 2007. East India Company: Trade and Domestic Financial Statistics, 1755-
1838 [computer �le]. Colchester, Essex: UK Data Archive [distributor], September 2007.
SN: 5690, http://dx.doi.org/10.5255/UKDA-SN-5690-1.
Clark, Christine. 1998. The British Malt-making Industry Since 1830. London: The Ham-
bledon Press.
Clark, Gregory. 2000. "Farm Wages and Living Standards in the Industrial Revolution:
England, 1670-1850." University of California, Davis. Available at http://www.econ.ucdavis.edu/
faculty/gclark/data.html
Center for International Earth Science Information Network (CIESIN), Columbia Univer-
sity; and Centro Internacional de Agricultura Tropical (CIAT). 2005. Gridded Popula-
tion of the World Version 3 (GPWv3): Population Density Grids. Palisades, NY: So-
cioeconomic Data and Applications Center (SEDAC), Columbia University. Available at
http://sedac.ciesin.columbia.edu/gpw. (Downloaded May 20, 2015).
Currie, Janet, Joshua S. Gra¤ Zivin, Katherine Meckel, Matthew J. Neidell, and Wolfram
Schlenker. 2013. �Something in the Water: Contaminated Drinking Water and Infant
Health.�NBER Working Paper No. 18876.
29
Cutler, David and Grant Miller. 2005. �The Role of Public Health Improvements in Health
Advances: The Twentieth-Century United States.�Demography, 42 (1): 1-22.
Devoto, Florencia, Esther Du�o, Pascaline Dupas, William Parienté, and Vincent Pons.
2012. �Happiness on Tap: Piped Water Adoption in Urban Morocco.�American Economic
Journal: Economic Policy, 4(4): 68�99.
Ferrie, Joseph P. and Werner Troesken. 2008. �Water and Chicago�s Mortality Transition,
1850-1925,�Explorations in Economic History, 45:1-16.
Fogel, R. 1989. �Second thoughts on the European escape from hunger: famines, price
elasticities, entitlements, chronic malnutrition, and mortality rates.�NBER Working Paper
Series on Historical Factors in Long-Run Growth.
Galiani, Sebastian, Paul Gertler and Ernesto Schargrodsky. 2005. �Water for Life: The
Impact of Privatization of Water Services on Child Mortality.� The Journal of Political
Economy, 113(1): 83-120.
Harris, Bernard, Roderick Floud, Robert W. Fogel, and Sok Chul Hong. 2010. �Diet, Health,
and Work Intensity in England and Wales, 1700-1914.�NBER Working Paper No. 15875.
Jarvis, A., H.I. Reuter, A. Nelson, E. Guevara. 2008. Hole-�lled seamless SRTM data V4. In-
ternational Centre for Tropical Agriculture (CIAT). Available from http://srtm.csi.cgiar.org.
(Downloaded February 17, 2013.)
Johnson, Steven. 2006. The Ghost Map. New York: Penguin Group.
Kremer, Michael, Jessica Leino, Edward Miguel, and Alix Peterson Zwane. 2011. �Spring
Cleaning: Rural Water Impacts, Valuation, and Property Rights Institutions.�The Quarterly
Journal of Economics, 126(1): 145-205.
Lee, Ronald. 1981. �Short-term variation: Vital Rates, Prices, and Weather� In: The
Population History of England 1541-1871: A Reconstruction. By E.A. Wrigley and R.S.
30

Scho�eld.
Mair, Victor H. and Erling Hoh. 2009. The True History of Tea. London: Thames and
Hudson.
MacFarlane, Alan. 1997. The Savage Wars of Peace: England, Japan, and the Malthusian
Trap. Cambridge, MA: Blackwell.
MacFarlane, Alan and Iris MacFarlane. 2003. The Empire of Tea: The Remarkable History
of the Plant that Overtook the World. New York: The Overlook Press.
Marshall, J. 1832. Mortality of the Metropolis. London: J. Haddon.
Mokyr, Joel. 1993. �Editor�s Introduction: The New Economic History and the Industrial
Revolution� in The British Industrial Revolution: An Economic Perspective. Ed. Joel
Mokyr. Boulder, CO: Westview Press.
McKeown, Thomas. 1983. �Food, Infection, and Population.�The Journal of Interdiscipli-
nary History 14(2): 227-47.
Nunn, Nathan and Nancy Qian. 2011. �The Potato�s Contribution to Population and
Urbanization: Evidence from a Historical Experiment.�The Quarterly Journal of Economics,
126(2): 593-650.
Scho�eld, Roger. 1994. 2nd edition. �British Population Change, 1700-1871� In: The
Economic History of Britain Since 1700. Eds. Roderick Floud and Donald McCloskey. 2nd
ed.
Scho�eld, R.S. and Wrigley, E.A. 2003. Parish Register Aggregate Analyses, 1662-1811; 404
Data [computer �le]. Colchester, Essex: UK Data Archive [distributor], April 2003. SN:
4491, http://dx.doi.org/10.5255/UKDA-SN-4491-1.
Southall, H.R. Burton, N. 2004. �GIS of the Ancient Parishes of England and Wales, 1500-
1850.� UKDA study number: 4828.
31
Standage, Tom. 2006. A History of the World in Six Glasses. New York: Walker Publishing.
Steckel, Richard H. 2005. �Health and Nutrition in the Pre-Industrial Era: Insights from a
Millennium of Average Heights in Northern Europe.�In: Living Standards in the Past: New
Perspectives on Well-being in Asia and Europe. New York: Oxford University Press.
Stevenson, John. 1993. �Social Aspects of the Industrial Revolution.� In: The Industrial
Revolution and British Society. Eds. Patrick O�Brien and Roland Quinault. (ch.10). New
York: Cambridge University Press.
Troesken, Werner. 2004. Water, Race and Disease. NBER Series on Long-term Factors in
Economic Development. Massachusetts Institute of Technology.
United Nations Environment Programme Global Environment Monitoring System (GEMS)
Water Programme. GlobalWater Quality Data and Statistics. Available at http://www.gemstat.org/.
(Downloaded May 21, 2015.)
Ure, Laurie. 2011. "For Nearly a Billion People, a Glass of Water Means Miles to Walk."
http://www.cnn.com/2011/HEALTH/04/29/drinking.water/
U.S. Geogological Survey (USGS). Shuttle Radar TopographyMission (SRTM) 1 Arc-Second
Global Digital Elevation �les. Available at http://earthexplorer.usgs.gov/. (Downloaded
August 12, 2015.)
WHO and UNICEF Joint Monitoring Programme for Water Supply and Sanitation. 2014.
�Progress on Drinking Water and Sanitation: 2014 Update.�UNICEF and World Health
Organization.
Wachter, Kenneth. 1998. �Levels of Demographic Randomness: Evidence from the Wrigley
and Scho�eld Parish Series.�University of California Berkeley.
Wrigley, E.A. and R.S. Scho�eld. 1981. The Population History of England, 1541-1871: A
Reconstruction. Cambridge, MA: Harvard University Press.
32

Table 1: Descriptive StatisticsPanel A: Parish Characteristics Mean Std Dev Median NParish on coast or within 10 km of coast 0.267 0.443 0 404Distance to Nearest Market Town in 1700 (km) 4.433 3.534 4 404Area (acres) 5750.579 5348.921 4237 394Population Density in 1700 (Pop_Constructed_1700/Area) 1.916 19.367 0.144 394Parish elevation (meters) 83.502 60.246 76.6166 402ln(elevation) 4.112 0.907 4.33881 402
Panel B: Parish-year characteristics, 1700-1839 Mean Std Dev Median NDeaths (burials) 31.438 43.998 20 52516ln(Deaths) 2.963 0.993 2.996 52516Births (baptisms) 41.029 60.276 27 52637ln(Births) 3.253 0.958 3.296 52637Marriages 11.558 20.553 7 50662ln(Marriages) 1.911 0.997 1.946 50662Population (Constructed Measure) 1247.764 1648.759 839.614 52849ln(Population, Constructed) 6.735 0.852 6.733 52849
Panel C: Annual Imports, 1761-1834 Mean Std Dev Median NTea Imports, millions of pounds, lagged 18.005 11.778 17.324 74ln(Tea), lagged 2.590 0.878 2.851 74
(1) (2) (3) (4)ln(Deaths) ln(Deaths) ln(Deaths) ln(Deaths)
PostTea*ln(Elevation) 0.0194*** 0.0502*** 0.0227*** 0.0339***(0.00696) (0.0120) (0.00774) (0.00988)
Post1770*ln(Elevation) 0.00370 0.00961(0.0117) (0.00975)
Post1760*ln(Elevation) -0.00901 0.0121(0.0128) (0.0113)
ln(Population) 0.807*** 0.808***(0.0440) (0.0444)
ln(Births) 0.287*** 0.287***(0.0176) (0.0175)
ln(Marriages) 0.0639*** 0.0635***(0.00622) (0.00622)
Parish FEs YES YES YES YESYear FEs YES YES YES YESObservations 52,223 49,965 52,223 49,965Robust standard errors clustered at parish level in parentheses*** p<0.01, ** p<0.05, * p<0.1
Table 2: The Impact of Tea Adoption on Mortality using Elevation Measure
(1) (2) (3) (4)ln(Deaths) ln(Deaths) ln(Deaths) ln(Deaths)
PostTea*ln(PopDensity_1700) -0.00730 -0.0138 -0.0165*** -0.0248***(0.00608) (0.0127) (0.00575) (0.00910)
Post1770*ln(PopDensity_1700) -0.000172 0.00242(0.00633) (0.00602)
Post1760*ln(PopDensity_1700) 0.0132** 0.0129*(0.00599) (0.00704)
ln(Population) 0.817*** 0.818***(0.0451) (0.0451)
ln(Births) 0.285*** 0.286***(0.0182) (0.0182)
ln(Marriages) 0.0654*** 0.0653***(0.00655) (0.00653)
Parish FEs YES YES YES YESYear FEs YES YES YES YESObservations 51,163 48,926 51,163 48,926Robust standard errors clustered at parish level in parentheses *** p<0.01, ** p<0.05, * p<0.1
Table 3: The Impact of Tea Adoption on Mortality using Initial Population Density Measure
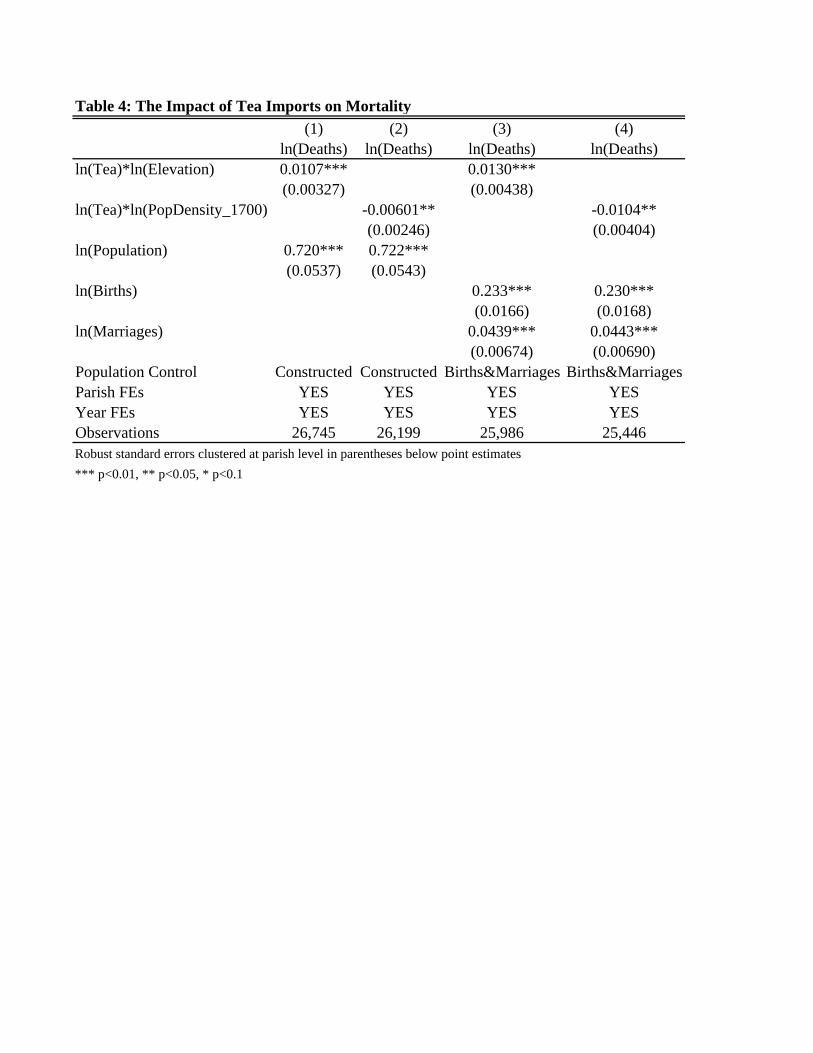
Table 4: The Impact of Tea Imports on Mortality(1) (2) (3) (4)
ln(Deaths) ln(Deaths) ln(Deaths) ln(Deaths)ln(Tea)*ln(Elevation) 0.0107*** 0.0130***
(0.00327) (0.00438)ln(Tea)*ln(PopDensity_1700) -0.00601** -0.0104**
(0.00246) (0.00404)ln(Population) 0.720*** 0.722***
(0.0537) (0.0543)ln(Births) 0.233*** 0.230***
(0.0166) (0.0168)ln(Marriages) 0.0439*** 0.0443***
(0.00674) (0.00690)Population Control Constructed Constructed Births&Marriages Births&MarriagesParish FEs YES YES YES YESYear FEs YES YES YES YESObservations 26,745 26,199 25,986 25,446Robust standard errors clustered at parish level in parentheses below point estimates*** p<0.01, ** p<0.05, * p<0.1

Table 5: The Impact of Tea Imports on Mortality, Controlling for Wages (1) (2) (3) (4)
ln(Deaths) ln(Deaths) ln(Deaths) ln(Deaths)ln(Tea)*ln(Elevation) 0.00882*** 0.00936**
(0.00326) (0.00417)ln(Tea)*ln(PopDensity_1700) -0.00545** -0.00918**
(0.00236) (0.00369)ln(wage) 0.174*** 0.169*** 0.331*** 0.331***
(0.0497) (0.0495) (0.0658) (0.0671)Population Control Constructed Constructed Births&Marriages Births&MarriagesParish FEs YES YES YES YESYear FEs YES YES YES YESObservations 26,745 26,199 25,986 25,446
*** p<0.01, ** p<0.05, * p<0.1Robust standard errors, clustered at parish level, in parentheses

Table 6: The Impact of Tea Adoption on Mortality, Controlling for Wages (1) (2) (3) (4)
ln(Deaths) ln(Deaths) ln(Deaths) ln(Deaths)PostTea*ln(Elevation) 0.0166** 0.0436***
(0.00700) (0.0117)PostTea*ln(PopDensity_1700) -0.00566 -0.00988
(0.00572) (0.0117)ln(wage) 0.160*** 0.165*** 0.304*** 0.329***
(0.0380) (0.0375) (0.0610) (0.0631)Population Control Constructed Constructed Births&Marriages Births&MarriagesParish FEs YES YES YES YESYear FEs YES YES YES YESObservations 51,874 50,814 49,629 48,590Robust standard errors, clustered at parish level, in parentheses*** p<0.01, ** p<0.05, * p<0.1

Table 7: The Impact of Tea Imports on Mortality with Additional Controls(1) (2) (3) (4)
ln(Deaths) ln(Deaths) ln(Deaths) ln(Deaths)ln(Tea)*ln(Elevation) 0.00908** 0.0122***
(0.00425) (0.00455)ln(MiscImports)*ln(Elevation) 0.00496 0.00737
(0.00660) (0.00609)ln(Tea)*ln(PopDensity_1700) -0.000801 -0.00299
(0.00256) (0.00319)ln(MiscImports)*ln(PopDensity_1700) -0.00719 -0.00987*
(0.00458) (0.00568)ln(Tea)*NearCoast -0.000552 -0.00701 0.00789 -0.00190
(0.00717) (0.00686) (0.00981) (0.00941)ln(Tea)*DistanceToMarket 0.00269*** 0.00181* 0.00399*** 0.00275**
(0.000842) (0.000947) (0.00122) (0.00135)Population Control Constructed Constructed Births&MarriagesBirths&MarriagesParish FEs YES YES YES YESYear FEs YES YES YES YESObservations 26,745 26,199 25,986 25,446p p pestimates*** p<0.01, ** p<0.05, * p<0.1
Dependent Variable: Deaths due to…(1) (2) (3) (4) (5) (6)
flux bloody flux smallpox consumptionunder 2
mortalityage 2-5
mortality
Tea (volume) -0.282** -0.561** 1.735 2.791 -6.473 2.138(0.133) (0.264) (6.914) (7.473) (8.612) (4.391)
Observations 71 29 71 71 70 70Mean of dep var 14.49 83.03 1487.73 3838.62 7188.50 2038.31
Table 8: The Impact of Tea Imports on Cause-Specific Deaths, Infant, and Child Mortality in London
Robust standard errors in parentheses*** p<0.01, ** p<0.05, * p<0.1Notes: Other control variables include a linear and quadratic time trendSources: Author's calculations based on mortality data from Marshall (1832) and tea import data from English East India Company records (Bowen 2007)
water-borne non-water-borne

Figure 1: Smoothed annual tea imports (3 year moving average)
010
20
30
40
Nat
iona
l tea
impor
ts
1760 1780 1800 1820 1840Year
3-Year Moving Average of Tea Imports Over Time

Figure 2: Tea Imports and the English Crude Death Rate
20
25
30
35
crude
dea
th rate
01
23
45
tea p
ound
s per
per
son
1760 1780 1800 1820 1840year
tea pounds per person crude death rate
Tea Imports and the English Crude Death Rate

Figure 3: Parish Locations
Overlaid on ESRI Basemap of England
Source: Southall, H.R. Burton, N. GIS of the Ancient Parishes of England and Wales, 1500-1850, UKDA study number: 4828.
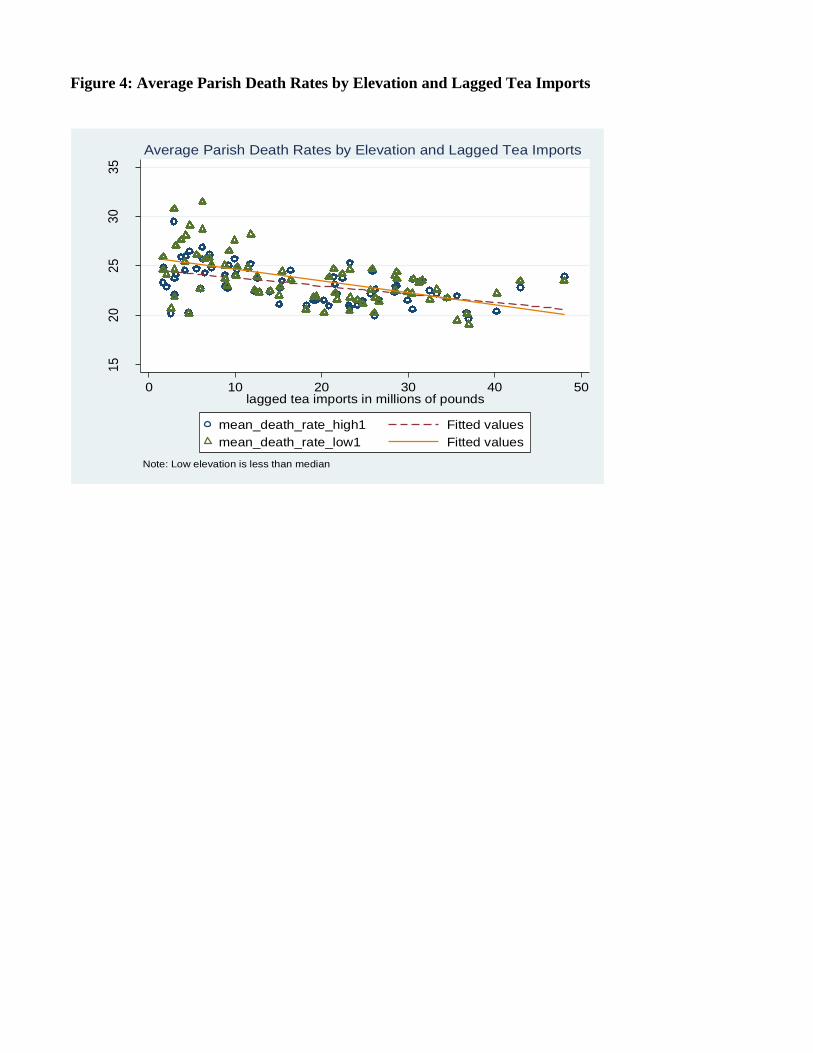
Figure 4: Average Parish Death Rates by Elevation and Lagged Tea Imports
15
20
25
30
35
dea
ths
per
thou
san
d p
eop
le
0 10 20 30 40 50lagged tea imports in millions of pounds
mean_death_rate_high1 Fitted values
mean_death_rate_low1 Fitted values
Note: Low elevation is less than median
Average Parish Death Rates by Elevation and Lagged Tea Imports

Figure 5: Average Parish Death Rates by Population Density in 1700 and Lagged Tea
Imports15
20
25
30
35
de
ath
s pe
r th
ousa
nd
pe
op
le
0 10 20 30 40 50lagged tea imports in millions of pounds
mean_death_rate_dense1 Fitted values
mean_death_rate_sparse1 Fitted values
Note: Low density is less than median in 1700
Average Parish Death Rates by Pop Density in 1700 and Lagged Tea Imports

Source: United Nations Global Environment Management System Water ProgrammeOverlaid over ESRI Generalized World Countries Map.
Appendix Figure 1: Locations of Water Quality Monitoring Sites in Africa and India

Appendix Table 1: Supporting Evidence for Water Quality Measures(1) (2)
ln(FecalColiform) ln(FecalColiform)
ln(Elevation) -0.345**(0.171)
ln(PopulationDensity) 0.446(0.395)
Country FEs YES YESYear FEs YES YESObservations 1,008 1,008Robust standard errors, clustered at 87 station sites in parentheses*** p<0.01, ** p<0.05, * p<0.1


![A Corpus Study of Cup of [tea] and Mug of [tea] · “A Corpus Study of ‘Cup of [tea] ... Labov was able to come up with a mathematical definition of „cup‟ as: Figure 1: Labov’s](https://img.dokumen.tips/doc/110x75/5c5cad1d09d3f2f0498bb83d/a-corpus-study-of-cup-of-tea-and-mug-of-tea-a-corpus-study-of-cup.jpg)