Embed Size (px)
Citation preview

iMosflm Tutorial
fileUsersandrewg4MOSFLMnewgui_tutorialiMosflm_tutorial_720_ver3html[29052015 105311]
iMosflm Tutorialfor version 720 May 2015
Table of Contents1 Introduction
11 Background12 Installation13 Documentation14 Aims of the tutorial15 Mouse and key functions
2 Overview of iMosflm21 Drop Down menus
3 Adding images to a session4 Image Display
41 Display Icons411 Masked areas - circular backstop shadow412 Masked areas - general exclusions413 Spot search area414 Resolution limits415 Zooming and Panning416 Circle fitting
5 Spot finding indexing and mosaicity estimation51 Spot Finding
511 If the spot finding has not worked well52 Indexing
521 If the indexing fails - Direct beam search522 If the indexing fails - Other parameters
53 Indexing multiple lattices simultaneously531 Practical Tips
54 Known cell option55 Space group selection56 Mosaicity estimation
561 The mosaic block size6 Saving and recovering a session7 Data collection strategy
71 Evaluating completeness manually72 Calculating a strategy automatically73 Calculating a strategy using multiple crystals
731 Calculating a strategy when some data have already been collected and processed74 Calculating a suitable oscillation angle
8 Cell refinement81 Selecting the images
811 Manual selection812 Automatic selection813 Graphical selection (Not recommended)
82 Integrating the images and refining the cell821 The detector parameters window822 The crystal parameters window823 The central spot profile824 The summary window825 The final results
83 Refining cell parameters for multiple lattices84 If the prediction for the first image of a segment is poor
9 Integration91 Image selection92 Setting the MTZ filename and controlling updating of the image display93 Integrating the images94 Parameter display windows95 Integrating the whole dataset
951 Parallel Integration Using multiple cores952 Integrating as a background job
96 Checking the integration97 Advanced features for integration98 Integrating multiple lattices
10 Running Pointless to check the symmetry11 Running Aimless to scale and merge the data12 History and mosflm log file
iMosflm Tutorial
fileUsersandrewg4MOSFLMnewgui_tutorialiMosflm_tutorial_720_ver3html[29052015 105311]
13 Warning Messages14 Useful command line options
141 The site file15 The mosflm SUMMARY file16 Scaling data with CCP4i
161 Looking at the AIMLESS output17 Changing the symmetry18 Looking at the CTRUNCATE output19 If you have time
191 Different mosaic spreads192 Checking up on outliers193 How accurate does the unit cell have to be
20 TipsAppendix I
1 Introduction11 Background
MOSFLM can process diffraction images from a wide range of detectors and produces as output an MTZ file of reflection indices withtheir intensities and standard deviations (and other parameters) This MTZ file is passed onto other programs of the CCP4 program suite(POINTLESS SORTMTZ AIMLESS CTRUNCATE) for further data reduction
The MOSFLM program was originally written to process data collected on film It was then modified to process data collected using theimage plate detector developed at the EMBL outstation in Hamburg by Jules Hendrix and Arno Lentfer and the name was changed toipmosflm This is the current version of the program which will also process data from CCD and pixel detectors
12 Installation
The new GUI (iMosflm) is currently available for Windows Mac OSX and Linux platforms For details of installation visit httpwwwmrc-lmbcamacukharryimosflm
13 Documentation
There are two distinct sources of documentation for MOSFLM although neither of these currently makes any reference to the new GUIAt present this document is the only documentation available for iMosflm
Also only this document is updated for new features of MOSFLM since version 709 (June 2012)
1 The MOSFLM user guide This is available as a plain text file (mosflm_user_guidetxt) or on the web (wwwmrc-lmbcamacukharrymosflm) as a PDF or HTML document This contains considerably more detail about how ipmosflm processesdiffraction images than this tutorial does It is a very good idea to look through this guide before starting serious data processingwith MOSFLM although you do not need it for this tutorial This has not been updated since version 709 (June 2012)
2 The on-line help If you type help at the MOSFLM =gt prompt (after starting the program ipmosflm) all possible keywords arelisted with information on each keyword This information is stored in an ASCII file (mosflmhlp) which can also be read (andsearched) with an editor This relies on having the environment variable CCP4_HELPDIR set to the directory containing this fileThis is also available on the MOSFLM web pages under keyword synopses
See also Battye TGG Kontogiannis L Johnson O Powell HR amp Leslie AGW 2011 iMosflm a new graphical interface fordiffraction image processing with MOSFLM Acta Cryst D67 271-281
14 Aims of the tutorial
Your task is to process 84 images hg_001mar1600 to hg_084mar1600 collected on a Mar345 image plate detector at a synchrotronbeamline These are crystals of a small domain (91 amino acids) that have been soaked in a mercury compound resulting in a datasetwith a strong anomalous signal which can easily be used to solve the structure These images have kindly been provided by CamilloRosano
Note You can equally well choose to process your own diffraction images if you wish
15 Mouse and key functions
For simplicity the mouse and key functions are all described here although they will also be referred to at various points in the tutorial
When positioned over the image right mouse button will return the display to the full size image if it has been zoomed Scrolling middlemouse will zoomshrink the imageHolding down the Ctrl key (or Alt or Cmd (for Macs)) will display the resolution and the current mouse position on the image in mm
iMosflm Tutorial
fileUsersandrewg4MOSFLMnewgui_tutorialiMosflm_tutorial_720_ver3html[29052015 105311]
and pixels If positioned over a found spot the spot coordinates and Iσ(I) will be given If positioned over a predicted spot position thehkl indices will be shownHolding down the Shift key while the Zoom icon in the image is selected will show the image within the small dotted square zoomedwithin the solid square
2 Overview of iMosflmStart the program by typing imosflm After a brief pause the following window will appear (note the date and version will bedifferent)
The basic operations listed down the left hand side (Images Indexing Strategy Cell Refinement Integration History) can be selected byclicking on the appropriate icon but those that are not appropriate will be greyed-out and cannot be selected
21 Drop Down menus
Clicking on Session will result in a drop-down menu that allows you to save the current session or reload a previously saved session(or readsave a site file (see sect141) or add images or since 720 write a spots file)
iMosflm Tutorial
fileUsersandrewg4MOSFLMnewgui_tutorialiMosflm_tutorial_720_ver3html[29052015 105311]
Clicking on Settings will allow you to see (and modify) Experiment settings Processing options and Environment variables
The Experiment settings option has two tabs Experiment and Detector
In the Experiment tab experimental parameters (beam position detector distance beam divergence and polarisation wavelength anddetector Two Theta angle can be modified There is also a tick box to deal with beamlines where the phi rotation is in the oppositesense to the conventional one These parameters are read from the image header but if they are wrong they can be corrected here
The Detector tab lists the current values of the refineable detector parameters the detector gain ADC offset and pixel size (in mm)There is a Reset button that will reset all refineable detector parameters to their initial values This should be used if parameters haverefined to unreasonable values either because they are poorly defined or because an incorrect indexing soltuion has been used tointegrate images A pop-up warning message will be given in such cases and parameters can also be reset from this pop-up window
Processing options will open a window with six tabs Spot finding Indexing Processing Advanced refinement Advanced integrationand Sort Scale and Merge This allows parameters associated with these processing steps to be changed and provides additional optionssuch as pattern matching orientation refinement (see 84) addition of Pilatus images to assist in detector parameter refinement and
iMosflm Tutorial
fileUsersandrewg4MOSFLMnewgui_tutorialiMosflm_tutorial_720_ver3html[29052015 105311]
smoothing of missetting angles (see 96) Situations in which it may be useful to modify these parameters will be described in theappropriate section of the tutorial A summary is provided in the Tips section
Environment variableswill not normally require any changes
The three small icons below Session allow you to start a new session open a saved session or save the current session Moving themouse over these icons will result in display of a tooltip describing the action taken if the icon is clicked
3 Adding images to a sessionTo add images to a session use the Add images icon
Select the correct directory from the pop-up Add Images window (the default is the directory in which iMosflm was launched) All fileswith an appropriate extension (which can be selected from the File type) will be displayed
Note that for images where the image number is given as the extension (eg my_xtal001) you will need to select Numbered files as theFile type
Double-clicking on any file will result in all images with the same template being added to the session The template is the whole partof the filename prefix except the number field which specifies the image number An alternative is to single-click on one imagefilename and then click on Open
To open one or several images only check the Selected images only box and then use click followed by Shift+click to select a range ofimages or Control+click to select individual image files as required
Loaded images will be displayed in the Images window with the start amp end phi values displayed (as read from the image header)
iMosflm Tutorial
fileUsersandrewg4MOSFLMnewgui_tutorialiMosflm_tutorial_720_ver3html[29052015 105311]
All images with the same template belong to the same Sector of data
Multiple sectors can be read into the same session Each sector can have a different crystal orientation
Note that a Warning has appeared Click anywhere on the ldquowarnings 1rdquo text to get a brief description of the warning In this case it isbecause the direct beam coordinates stored in the MAR image plate images are not trusted by MOSFLM and the direct beam coordinateshave been set to the physical centre of the image Click on the X on the right hand side to dismiss this warning click anywhere outsidethe warning box to collapse the box double-click the warning text itself and more details hints and notes may be available fromMOSFLM
The direct beam coordinates (read from the image header or set by MOSFLM) and crystal to detector distance are displayed Thesevalues can be edited if they are not correct
iMosflm Tutorial
fileUsersandrewg4MOSFLMnewgui_tutorialiMosflm_tutorial_720_ver3html[29052015 105311]
Advanced Usage
1 The phi values of images can be edited in the Image window First click on the Image line to highlight it then click with the mouseover the phi values to make them editable allowing new values to be given These new values are propagated for all followingimages in the same sector Starting values for the three missetting angles (PHIX PHIY PHIZ) may also be entered following theimage phi values
2 To delete a sector click on the sector name to select it (it turns blue) then use the right mouse button on the sector to bring up adelete button Move the mouse over the delete button (it turns blue) and click to delete the sector and its images Individualimages can be deleted from the Images pane in the same way
3 If one sector is added and used for indexing and then a second sector from the same crystal is added the matrix for the secondsector will not be defined To define it double-click on the matrix name for the first sector save it to a file double-click on thematrix name (Unknown) for the new sector and read the matrix file written for the first sector Alternatively it is possible to dragand drop the matrix from the first sector onto the second sector (drop onto the sector itself not the Matrix for the secondsector)
4 Image DisplayWhen images are added to a session the first image of the sector is displayed in a separate display window
iMosflm Tutorial
fileUsersandrewg4MOSFLMnewgui_tutorialiMosflm_tutorial_720_ver3html[29052015 105311]
The Image drop-down menu allows display of the previous or next image in the series (but this is easier to perform using the bluearrows displayed before the image name)
The View drop-down menu allows the image to be displayed in different sizes (related by scale factors of two) based on the imagesize and the resolution of the monitor
iMosflm Tutorial
fileUsersandrewg4MOSFLMnewgui_tutorialiMosflm_tutorial_720_ver3html[29052015 105311]
The Settings drop-down menu allows the colour of the predictions to be changed (see Indexing sect52 for the default colours) and thesize of the Pick box to be changed The third option (image summation) determines whether summed images are calculated byaddition or by taking the maximum or minimum values Only addition is implemented
The line below allows selection of different images either using right and left arrow or selecting one from the drop-down list of allimages in that sector Alternatively the image number can be typed into the Go to entry box
For Pilatus images only the Sum entry box will allow the display of the sum of several images the number (up to 20) can be chosenfrom the drop-down list
The image being displayed can also be changed by double-clicking on an image name in the Images pane of the main iMosflmwindow This will also re-active the image window if it has been closed
+ and - will zoom the image without changing the centre The Fit image icon will restore the image to its original size (right mousebutton will have the same effect) The Contrast icon will give a histogram of pixel values Use the mouse to drag the vertical dottedline to the right to lighten the image to the left to darken it Try adjusting the contrast The Lattice entry window can be used whenprocessing images with multiple lattices present see multiple lattices sect53
The reverse video icon allows an image to be rendered as light spots on a dark background that can help visualise small diffractionspots (eg for data collected using a Pilatus detector)
41 Display Icons
The eight icons on the left control the display of the direct beam position (since 720 a magenta cross not a green one) spots foundfor indexing bad spots predicted spots masked areas spot-finding search area resolution limits and display of the active mask forRigaku detectors respectively Clicking on these items will turn their display on or off
These are followed by icons for Zoom Pan and Selection tools and tools for adding spots manually (for indexing) editing masks circlefitting and erasing spots or masks
Next on this toolbar are the entry boxes for h k amp l and a button to search for this hkl among the predicted spots displayed on theimage The button resembles a warning sign if the given hkl cannot be found but a green tick if it is found The final icon relates toprocessing images with multiple lattices (see multiple lattices sect53) and is not described here
411 Masked areas - circular backstop shadow
Select the masked area icon A green circle will be displayed showing the default position and size of the backstop shadow
Make sure that the Zoom icon (magnifying glass) is selected and use the left-mouse-button (abbreviated to LMB in following text) todrag out a rectangle around the centre of the image The inner dotted yellow rectangle will show the part of the image that will actuallyappear in the zoomed area
iMosflm Tutorial
fileUsersandrewg4MOSFLMnewgui_tutorialiMosflm_tutorial_720_ver3html[29052015 105311]
Choose the Selection Tool When placed over the perimeter of the circle the radius of the circular backstop shadow will be displayedUse the LMB to drag the circle to increase its diameter to that of the actual shadow on the image The position of the circle can beadjusted with LMB placed on the cross that appears in the centre of the green circle Adjust the size and position of the circle so that itmatches the shadow
412 Masked areas - general exclusions
Choose the Masking tool Any existing masked areas will automatically be displayed Use LMB to define the four corners of the region tobe masked When the fourth position is given the masked region will be shaded This region will be excluded from spot finding andintegration This provides a powerful way of dealing with backstop shadows To edit an existing mask choose the Selection tool and usethe LMB to drag any of the four vertices to a new position
To delete a mask choose the Spot and mask eraser tool Place the mouse anywhere within the shaded masked area and use LMB todelete the mask Delete any masks that you have created
413 Spot search area
Select the Show spotfinding search area icon The inner and outer radii for the spot search will be displayed as shown below If theimages are very weak the spot finding radius will automatically be reduced but this provides additional control
Either can be changed by dragging with the LMB Do not change the radii for these images
iMosflm Tutorial
fileUsersandrewg4MOSFLMnewgui_tutorialiMosflm_tutorial_720_ver3html[29052015 105311]
Advanced Usage
The red rectangle displays the area used to determine an initial estimate of the background of the image It is important that this doesnot overlap significant shadows on the image It can be shifted laterally or changed in orientation (in 90deg steps) by dragging with theLMB
414 Resolution limits
Select the Show resolution limits icon The low and high resolution limits will be displayed The resolution limits can be changed bydragging the perimeter of the circle with LMB (make sure that the Selection Tool has been chosen) The resolution limits will affectStrategy Cell refinement and Integration but not spot finding or indexing The low resolution is not strictly correct (it falls within thebackstop shadow) but does not need to be changed because spots within the backstop shadow will be rejected
415 Zooming and Panning
First select a region of the image to be zoomed with the Zoom tool
Select the Pan tool and pan the displayed area by holding down LMB and moving the mouse This is very rapid on a local machine butmay be slow if run on a remote machine over a network
416 Circle fitting
The circle fitting tool can be used to determine the direct beam position by fitting a circle to a set of points on a powder diffraction ringon the image (typically due to icing) or to fit a circular backstop shadow (although using the masking tool is probably easier)
Select the circle fitting tool Three new icons will appear in the image display area There are two (faint) ice rings visible on the image at391Aring and 367Aring Click with LMB on several positions (6-8) on the outer ring (as it is slightly stronger) Then click on the top circularicon
A circle that best fits the selected points (displayed as yellow crosses) will be drawn and the direct beam position at the centre of thiscircle will be indicated with a green cross The direct beam coordinates will be updated to reflect this new position
iMosflm Tutorial
fileUsersandrewg4MOSFLMnewgui_tutorialiMosflm_tutorial_720_ver3html[29052015 105311]
5 Spot finding indexing and mosaicity estimationWhen images have been added the Indexing operation becomes accessible (it is no longer greyed-out)
Click on Indexing This will bring up the major Indexing window in place of the Images window
51 Spot Finding
By default the first image and a second image 90 degrees away in phi (or as close to 90 as possible) will be selected and a spot searchcarried out on both images (This is controlled by the Automatically find spots on entering Autoindexing tick box in the Spot finding tabof Processing options)
Found spots will be displayed as crosses in the Image Display window (red for those above the intensity threshold yellow for thosebelow) Only those above the threshold will be used in indexing The intensity threshold normally defaults to 20 but will beautomatically reduced to 10 or 5 for weak images The threshold is determined by the last image to be processed
The number of spots found together with any manual additions or deletions are also given
Images to be searched for spots can be specified in several ways
1 Simply type in the numbers of the images (eg 1 84 above)
iMosflm Tutorial
fileUsersandrewg4MOSFLMnewgui_tutorialiMosflm_tutorial_720_ver3html[29052015 105311]
2 Use the Pick first image icon (single blue circle)
3 Use the Pick two images ~90 apart icon (two blue circles) This is the default behaviour
4 Use the Select images icon (multiple circles) If selected all images in the sector are displayed in a drop-down list Click on aimage to select it then double-click on the search icon (resembling a target in the colum headed Find) for that image to run thespot search The image will move to the top of the list (together with other images that have been searched)
Images to be used for indexing can be selected from those that have been searched by clicking on the Use button If this box waspreviously checked then clicking will remove this image from those to be used for indexing It can be added again by clicking theSelect images icon and clicking on the Use box
Before indexing always check by looking at the image display that the spot finding has worked correctly ie that most spots thatyou can see have been found that multiple crosses have not been drawn over the same spot that spots have not been placedover ice rings or ice spots Check all images that will be used in indexing
511 If the spot finding has not worked well
Parameters affecting the spot search can be modified by selecting the Settings drop-down window and selecting Processing optionsThe resulting new window contains six tabs relating to Spot finding Indexing Processing Advanced refinement Advanced integrationand Sort Scale and Merge
The Spot finding tab allows the Search area Spot discrimination parameters Spot size parameters Minimum spot separation andMaximum peak separation within spots (to deal with split spots) to be reset It also allows the choice between a local backgrounddetermination (preferred) and a radial background determination The local background method also uses an improved procedure forrecognising closely spaced spots The only parameters commonly changed are
1 Minimum spot separation This should be the size (in mm) of an average spot (not a very strong spot) If there are badly split spotsthe spot finding may place two (or more) crosses for a single diffraction spot To avoid this happening set the minimumseparation in X and Y to values equal to the spot size in mm This can be found by zooming the image and counting the number ofpixels across the spot horizontally (X) and vertically (Y) To convert this to mm use the pixel size as given in Settings -gtExperiment settings -gt Detector This separation parameter is very important when spots are very close but usually the programwill determine a suitable value
2 Minimum pixels per spot Default value 6 but this should be reduced automatically if spots are very small (eg when using in situscreening and microfocus beam) If there clearly are spots present and the spot size is very small try reducing this parameter to 3or 2
3 Local background box size Reducing this from 50 to (say) 20 can reduce the number of false spots found near any sharp shadowon the image (or tile boundaries for tiled detectors) Normally these false spots are weak (and will be drawn as yellow crosses) inwhich case they will not affect the indexing
For data collected in-house the spots can be quite large and rather weak In such cases the spot finding parameters are automaticallychanged but some improvement may still be obtained by the following
1 Reduce the spot finding threshold (default 35) eg to 2
2 Change the minimum number of pixels per spot (default 30) to 20 or 40
3 Set the minimum spot separation to a sensible value eg 15mm see above
52 Indexing
Providing there are no errors during spot finding indexing will be carried out automatically after spot finding (This is controlled by theAutomatically index after spot finding tick box in the Indexing tab of Processing options) If the image selection or indexingparameters are changed the Index button must be used to carry out the indexing
iMosflm Tutorial
fileUsersandrewg4MOSFLMnewgui_tutorialiMosflm_tutorial_720_ver3html[29052015 105311]
Autoindexing will be carried out by MOSFLM using spots (above the threshold) from the selected images The threshold is set byMOSFLM but can be changed using the entry box in the toolbar The list of solutions sorted by increasing penalty score will appear inthe lower part of the window The preferred solution will be highlighted in blue There will usually be a set of solutions with lowpenalties (0-20) followed by other solutions with significantly higher penalties The preferred solution is that with the highest symmetryfrom the group with low penalty values
Note that all these solutions are really the same P1 solution transformed to the 44 characteristic lattices with lattice symmetryconstraints applied Therefore if the P1 solution is wrong then all the others are wrong as well
For solutions with a penalty less than 50 the refined cell parameters (ref) will be shown This can be expanded (click on the + sign) toshow the reg unrefined but regularised cell (symmetry constraints applied) and the raw cell (no symmetry constraints applied)
The rms deviation (rmsd) or error in predicted spots positions (σ(xy) in mm) and the number of spots used to refine the solution aregiven for each solution
Usually the penalty will be less than 20 for the correct solution although it could be higher if there is an error in the direct beamcoordinates (or distancewavelength) The rmsd (error in spot positions) will typically be 01-02mm for a correct solution but if thespots are split or very elongated it can be as high as 1mm or higher
The predicted spot positions for the highlighted solution will be shown on the image display with the following default colour codes
Blue Fully recorded reflectionYellow (orange for Pilatus) Partially recorded reflection
iMosflm Tutorial
fileUsersandrewg4MOSFLMnewgui_tutorialiMosflm_tutorial_720_ver3html[29052015 105311]
Red Spatially overlapped reflection these will NOT be integratedGreen Reflection width too large (more than 5 degrees) not integrated
These colours may be adjusted via the Settings -gt Prediction colour item in the Image display window
Providing there are no errors in the indexing MOSFLM will automatically estimate the mosaic spread (mosaicity) based on the preferredsolution
Select other solutions with a higher penalty and see how well the predicted patterns match the diffraction image
The rmsd and visual inspection of the predicted pattern are the best ways of checking if a solution is correct If the agreement is notgood then the autoindexing has probably failed
It is often worth repeating the indexing (once) as the refined direct beam coordinates from the first indexing may give animproved solution (lower rmsd)
521 If the indexing fails - Direct beam search
The indexing is very sensitive to errors in the direct beam coordinates For a correct indexing solution the error should be less than halfthe minimum spot separation Check for example that the current direct beam position is behind the backstop If there are any icerings these can be used to determine the direct beam position (see Circle fitting sect416 )
If the accuracy of the direct beam coordinates (generally read from the image header) is uncertain the program can perform a gridsearch around the input coordinates The number and the size of the steps can be set from the Indexing tab of the Processing optionsmenu (see Settings - Processing options sect21) but defaults to two steps of 05mm on each side of the input coordinates The directbeam search is started by clicking on the Start beam search button in the Indexing pane While in progress it can be stopped byclicking the Abort beam search button
The indexing will be carried out for each set of starting coordinates (Beam x and Beam y in the table which appears) and if a solution isfound the refined beam coordinates (Beam x ref Beam y ref) the unit cell parameters of the triclinic solution and the rmsd error in spotcoordinates and in phi will be listed The correct solution will generally be the one with the smallest rms error in spot positions (σ(xy))To make it simpler to identify the correct solution once the grid search has finished the solutions will be sorted on σ(xy) so the correctsolution will be at the top of the list When sorting the solutions those which have smaller cell parameters will be listed first as it ispossible to have a small σ(xy) value for an incorrect solution with a much larger unit cell Beware of solutions at the top of the list wherethe cell is clearly too small (only happens rarely)
Note that only the triclinic (P1) solution will be listed
If there is now a solution with a smaller rmsd value than before and especially if more than one set of starting beam coordinates has thesame refined coordinates this is a good indication that the beam search has worked Note that if the initial beam coordinates werewrong by more than ~15mm the search may not work In this case either select a new starting position for the direct beam or changethe number of steps
To complete the indexing double-click on the chosen solution and the full indexing will carried out for these beam coordinates withthe solutions appearing in the upper window The results of the direct beam search can be hidden (collapsed) by clicking on the Hidebutton and recovered by clicking on the Show button
iMosflm Tutorial
fileUsersandrewg4MOSFLMnewgui_tutorialiMosflm_tutorial_720_ver3html[29052015 105311]
522 If the indexing fails - Other parameters
Errors in other physical parameters (wavelength crystal to detector distance) can also result in failure All these parameters should bechecked
Several parameters used in autoindexing can also be adjusted using entry fields and buttons that appear in the Indexing toolbar
Weak images
1 MOSFLM automatically reduces the Iσ(I) threshold for weak images and it may also reduce the resolution to 4Å but lower valuescan be tried It is important not to include spots that are not real - a small number of false spots can prevent the indexing fromworking
2 Try changing parameters for spot finding (see If the spot finding has not worked well sect511)
Multiple lattices
1 Try increasing the Iσ(I) threshold (default 20) for example to 40 or 60 so that only spots from the stronger lattice are selectedThis can be done by entering a new value in the leftmost of the circled icons above (and also via the Indexing tab of Processingoptions)
All cases
1 Include more images in the indexing Select images that are widely spaced in phi not close together2 Select images that show the clearest lunes andor have the best spot shape3 In case the crystal orientation has changed or if you are unsure of the direction of positive rotation in phi try indexing using only
one image4 Make sure that the Max cell edge value is not too small If in doubt set to 200 Aring (or more if the cell is expected to be large)5 If the cell parameters are known reduce the maximum allowed cell edge to the known maximum cell edge This can sometimes
help filter incorrect solutions but use with caution as often this needs to be ~twice the largest cell for successful indexingAlternatively try the known cell option
6 If the detector distance is uncertain and the images are high resolution (eg 2Å) allow the detector distance to refine during cellrefinement Use with caution
53 Indexing multiple lattices simultaneously
This is a new feature and is still undergoing development It is most likely to succeed when the different lattices are clearly separated atleast at higher resolution If the images shows badly split spots with several components (each arising from a sub-crystal with a slightlydifferent orientation) then indexing may well still be impossible
After spot finding examine the image to ensure that spots that are close to each other but belong to different lattices have beenidentified as separate spots and not treated as a single split spot (in which case the red cross will lie midway between the two spots)Adjusting the minimum spot separation (Settings -gt Processing options -gt Spot finding) can help in resolving close spots It may alsohelp to increase the inner radius of the spot search region (see Spot search area sect413) so that low resolution reflections where the
iMosflm Tutorial
fileUsersandrewg4MOSFLMnewgui_tutorialiMosflm_tutorial_720_ver3html[29052015 105311]
spots are not really separated are excluded from the search
The following procedure usually provides the best chance of success
1 Select appropriate images for use in indexing The separation of the lattices can be clearer on some images than others Ideallychoose several images widely separated in phi
2 Do a normal (single lattice) indexing first This will usually work but will give a high positional rmsd because of the presence of morethan one lattice This step is important because it will result in more accurate direct beam coordinates which are crucial for multi-lattice indexing
3 Select the ldquoIndex multiple latticesrdquo icon (next to the Index button) the Index button will change to Index multiple
The indexing results for different lattices will be presented in different tabs while the selected solution for each lattice will be shown inthe lower Summary window Currently a maximum of 5 lattices can be handled The figure below shows a case where 3 differentlattices were found
4 Judge the success of indexing by examining the lattice type and the cell parameters obtained for the different lattices (the cellsshould be very similar) and checking that the predictions match the observed spots The rmsd values for correct lattices should also besignificantly smaller than the value obtained in the initial (single lattice) indexing It may be necessary to manually select a differentautoindexing solution for some lattices in order to get the same lattice type (eg oP) for the different lattices
The Split column in the lower pane indicates the angle between the reference lattice (with value -) and the other lattices This is onlycalculated when the lattices have the same lattice type In this case the angles between lattice 1 and lattices 2 amp 3 are 34 and 16degrees
If a lattice is clearly incorrect it can be deleted by highlighting that lattice (in the lower pane that summarises the results) and using theright mouse button to select ldquodeleterdquo
The predictions for different lattices can be displayed either by highlighting the lattice in the Summary window or by using the latticeselector in the image display pane
iMosflm Tutorial
fileUsersandrewg4MOSFLMnewgui_tutorialiMosflm_tutorial_720_ver3html[29052015 105311]
In the image display spots in different lattices that overlap with each other are shown in magenta Only the summed intensity will bemeasured for these reflections
The predictions for all lattices can be shown by selecting the ldquomerge latticesrdquo icon in the image display
This can be useful to check if all the lattices have been successfully indexed because all spots in the image should then be predicted Inthe display predictions from lattice 12345 are shown in blue yellow red green and magenta with no distinction made between fullyand partially recorded reflections or spatial overlaps
iMosflm Tutorial
fileUsersandrewg4MOSFLMnewgui_tutorialiMosflm_tutorial_720_ver3html[29052015 105311]
531 Practical Tips
Beware of solutions where the lattices only vary in orientation by a small angle (less than 1 degree) as these are often different solutionsfor the same lattice The difference in orientation between lattices is given by the ldquosplitrdquo column in the Summary window but this is onlycalculated if the lattices have the same lattice type Differences are all relative to one lattice which will display a split angle as ldquo-ldquo Tocalculate the angles relative to a different lattice open the tab for that lattice select a different solution to that currently selected andthen select the original solution ndash this will trigger recalculation of the split angles relative to that lattice
Other parameters that can influence the indexing are the rdquoMaximum deviation from integral hklrdquo (default 02 when indexing multiplelattices otherwise 03) and ldquoNumber of vectors to find for indexingrdquo (default 30) These can be changed via the Indexing tab of theldquoProcessing Optionsrdquo that can be selected from the ldquoSettingsrdquo menu item Values between 015 and 025 might be helpful for the firstparameter and increasing the number of vectors from 30 to 50 can also help At present there is no defined protocol for changing thedefault parameter values for particular cases it has to be done by trial and error
Experience so far has shown that selecting appropriate images and adjusting the maximum cell length used in indexing have the biggesteffect The optimum value for the maximum cell length will normally lie between one and three times the largest cell dimension but it isworth varying this in steps of between 25 and 50 Aring as the indexing can be very sensitive to this parameter
For a more complete discussion of multiple lattice indexing see Powell HR Johnson O amp Leslie AGW 2013 Autoindexingdiffraction images with iMosflm Acta Cryst D69 1195-1203
54 Known cell option
For images that are very difficult to index if the cell parameters are known the known cell option can be usedSelect the ldquoKnown cellrdquo icon (next to the Multiple lattices icon) Enter the cell parameters in the Input known cell pop-up window andselect OK when all 6 parameters have been provided Then select the Index Cell button
To revert to normal indexing select the ldquoKnown cellrdquo icon and then select Clear in the Input known cell pop-up window
55 Space group selection
Note that the indexing is based solely on information about the unit cell parameters It will therefore be very difficult (or impossible) todetermine the correct Laue group in the presence of pseudosymmetry For example a monoclinic space group with β ~ 90deg will appearto be orthorhombic an orthorhombic space group with very similar a and b cell parameters will appear to be tetragonal These can onlybe distinguished when intensities are available (ie after integration) by running POINTLESS (QuickSymm) (see Running Pointless to check the
iMosflm Tutorial
fileUsersandrewg4MOSFLMnewgui_tutorialiMosflm_tutorial_720_ver3html[29052015 105311]
symmetry sect10)
In addition it is not possible to distinguish between Laue Groups 4m and 4mmm 3 and 3m 6m and 6mmm m3 and m3m Thiswill not affect integration of the images but it will affect the strategy calculation In the absence of additional information the lowersymmetry should be chosen for the strategy calculation to ensure that a complete dataset is collected
The presence of screw axes also cannot be detected so there is no basis on which to distinguish P21 from P2 etc This does not affectany aspect of data collection or processing and can be chosen (on the basis of systematic absences) after integration by runningPOINTLESS
In this example there is no way of knowing at this stage if the space group is h3 or h32 so leave it as h3
56 Mosaicity estimation
If the Automatically index after spot finding option has been chosen (Indexingtab of Processing Options) the mosaicity (mosaic spread) will be estimatedautomatically for the preferred solution However if another solution is chosenthe mosaicity should be estimated again
Click on the Estimate button to estimate the mosaicity
A window will appear which plots the total predicted intensity as a function ofmosaic spread from which an estimate is determined
The predictions displayed on the image will be updated Entering different valuesof mosaic spread in the box (followed by return) will allow a visual estimate of theeffect of changing the mosaic spread
The mosaic spread can also be entered in the Images pane by clicking once on theMosaicity line and once again on the value displayed
561 The mosaic block size
In some cases the apparent mosaic spread is much larger at low resolution than at high resolution so that if it is set to a value thatresults in all the low resolution spots being predicted many more spots are predicted than are visible at high resolution This effect isbest dealt with by adjusting the Mosaic block size which is also displayed in the Images pane This is modelling the size in microns ofthe individual mosaic blocks in the crystal Decreasing this to values of 05-5 microns (say) from the default of 100 microns will resultin predicting more spots at low resolution but have virtually no effect at high resolution This parameter is not refined (at present) andso the best value must be determined by trial and error
6 Saving and recovering a sessionThe session can be saved at any time using the Session drop-down menu referred to in sect21 The first time that a session is saved youwill be prompted for a filename The filename convention for saved session files is that the extension is mos
Save the current session Then exit from iMosflm (using the Session drop-down menu) restart iMosflm and read in the saved session
If the program crashes it should be possible to recover all but the latest actions as a temporary copy of the session file is continuallysaved to the directory mosflm in the users home directory
Restart iMosflm and it will pop up a Recover session window
Selecting the Recover button will restore the session as far as possible
iMosflm Tutorial
fileUsersandrewg4MOSFLMnewgui_tutorialiMosflm_tutorial_720_ver3html[29052015 105311]
7 Data collection strategyOnce the crystal orientation and (probable) Laue group have been determined it is possible to calculate a data collection strategy andthe Strategy icon is no longer greyed-out (in fact all other operations Strategy Cell Refinement and Integration become possible at thispoint)
Select the Strategy icon This will open the Strategy window
The statistics initially presented in the window are based on the images read in to the current session If only two (or more) references
iMosflm Tutorial
fileUsersandrewg4MOSFLMnewgui_tutorialiMosflm_tutorial_720_ver3html[29052015 105311]
images have been read in no statistics will be presented
When the Strategy option is used after two initial images (typically 90deg apart in φ) have been collected a complete shaded segment willnot be shown in the lower part of the screen rather an empty circle will be shown with the matrix label beneath it Click the Auto-complete button and in the pop-up menu that appears select a rotation angle or sweep of data to collect - or leave the Rotationsetting as Auto for a calculation of maximum completeness for this crystal orientation Click on Ok and the completeness results willbe presented
The orientation of the crystal expressed as the angles between the abc unit cell axes and the XYZ coordinate frame is given X isalong the X-ray beam Z is the rotation axis A warning will be given if the unique axis is so close to the rotation axis that there will bemissing cusp data
71 Evaluating completeness manually
The completeness of any given segment of data can be determined manually using the circle at the bottom left of the window Click onthe red segment shown in this circle
This will result in small black boxes being drawn on the circumference at the start and end of the red sector
Use the LMB to click on the black box at 0 and drag this around the circle
When the LMB is released the statistics for that sector will be displayed The statistics are presented in two ways Near the top right ofthe window the overall completeness is shown as red circles for unique data and anomalous pairs The average multiplicity is givenbeneath these circles
More detailed statistics (such as completeness as a function of resolution) are given in a series of histograms that can be selected by adrop-down menu
72 Calculating a strategy automatically
Uncheck the Use checkbox at the right side of the hg_001 line listed in the sector list near the top of the Strategy pane This means
iMosflm Tutorial
fileUsersandrewg4MOSFLMnewgui_tutorialiMosflm_tutorial_720_ver3html[29052015 105311]
that the 84 images used thus far will not be included in the completeness calculation only the matrix derived from indexing them willbe used Select the Auto-complete button to calculate a strategy automatically
A strategy calculation data pop-up window will appear
If multiple matrices have been defined (for different sectors of data) then the appropriate one can be selected (if there is only one sectorthis has no effect)
The total φ rotation to be used is normally calculated by MOSFLM based on the Laue group and the crystal orientation (the Auto setting)However it is sometimes possible to achieve a high completeness with a significantly smaller total rotation (eg 60deg in two 30degsegments will typically give gt94 completeness for orthorhombic space groups) and this can sometimes be useful if radiation damage isa serious problem although when using hybrid pixel detectors it is better to use a very conservative exposure time and collect a wide φrotation
Total rotation angles of between 5deg and 90deg can be selected from the drop-down list The number of segments to be used can be setbetween 1 and 3
If the check box is checked data completeness will be calculated to optimize the proportion of anomalous data collected
THIS IS IMPORTANT The optimum strategy is often different when maximising completeness of the anomalous data
Choose the default values (Rotation Auto Segments 1) but check the anomalous data box then click on Ok Look at the variousstatistics presented as bar charts
In space group H3 if rotating around the c axis a total rotation of 120deg would be required to collect a complete dataset (ignoring anydata lost in the cusp) Because the c axis is 22deg away from the rotation axis in this case it is possible to collect very high completeness(for unique data) with a rotation much smaller than this
Try to find the minimum total rotation that will give a dataset that is gt95 complete for the unique data Now do the same butrequiring gt95 completeness for the anomalous data
SKIP OVER SECTION 73 IF DOING THE NORMAL TUTORIAL
73 Calculating a strategy using multiple crystals
The Strategy pane may also be used when due to radiation damage many crystals are required to collect a complete dataset
IMPORTANT This procedure will only work correctly for space groups where there is no indexing ambiguity For those spacegroups where there is an indexing ambiguity( see httpwwwccp4acukdisthtmlreindexinghtml for a complete list) it isnecessary to integrate images to determine whether different crystals have been indexed in the same way This is not achievablewithin the Strategy option at present
Suppose the first crystal has been indexed from the reference images
Enter the Strategy pane an empty circle is displayed in the bottom part of the screen and click on the Auto-complete button nearthe top-right of the pane In the Auto-complete window that appears choose a suitable Rotation angle for the amount of datathat can be collected from one crystal say 20 degrees for this example Leave Segments set to 1 and do not check Optimize foranomalous data
Click the Ok button and the completeness of the data will be displayed The matrix name start and end phi values and the phiextent will be displayed in the top area of the pane with a checkbox ticked under the Use column This means this segment will beused in further strategy calculations
Accept and save this result by clicking on the yellow hatched segment displayed in the large circle near the bottom of the paneClick once and the segment will be outlined in black (you can adjust the start or end phi value calculated in one degree incrementsby click+dragging the respective black square) click again this time on the black square denoting the start or end phi (or release ifyou have adjusted by click+dragging) and the segment will turn red The segment will not be saved unless it has turned red
This result will be saved if you leave this pane (eg to load more images) and return later in this session The strategy file can alsobe saved to a permanent file using the Save button on the tool-bar This is highly recommended when working with many crystals
Return to the Strategy pane when you have loaded and indexed the reference image(s) from the second crystal and repeat the procedureabove You will see the calculated segment from the first matrix displayed at the bottom-left of the screen The optimum phi range for
iMosflm Tutorial
fileUsersandrewg4MOSFLMnewgui_tutorialiMosflm_tutorial_720_ver3html[29052015 105311]
the second crystal will be displayed Save this in the same way as for the first crystal (clicking twice) Repeat this procedure for anysubsequent crystals and in each case the optimum phi range will be calculated for the latest crystal taking into account the data fromprevious crystals
It is a good idea to save the strategy to a file as each new crystal is added in case the program crashes and this information is lost
In practice it is probably safest to have a separate iMosflm session that is reserved for the strategy calculations and not used to processany data The strategy for each new crystal can be calculated as described above If there is a problem and the session is corrupted or ifiMosflm is closed down for any reason it is straightforward to restore the status of the session providing the strategy has been savedThe following steps should be taken
1 Read in the reference images for the latest crystal and index them
2 Select the Strategy pane
3 Read in the optimised strategy for all previous crystals using the ldquoAddrdquo button and giving the appropriate filename
4 Making sure that the circle for the latest crystal is highlighted in the lower left window click on lsquoAuto-completersquo and follow the stepsdescribed above
Advanced Usage
The startend phi values for each crystalmatrix can be updated This might be required if for example only 10 degrees of useful datawere collected from a particular crystal instead of the anticipated 20 degrees To change the phi values click either on the matrix namein the top pane or on the circle showing the segment of data in the lower left pane (these are highlighted in a blue box as the mousemoves over them) The corresponding segment will now be displayed in the larger circle Click on the red segment so that a blacksquare appears at the startend phi values Then simply drag the appropriate phi to the desired value The completeness willautomatically be updated (but the strategy calculation for the latest crystal will not be repeated to do this the current segment must bedeleted by highlighting the matrix name and using right click and then repeating the Auto-complete step)
If matrix files saved from iMosflm are available from crystals for which data have been collected in previous sessions these can beadded into the calculation using the Add matrix button on the tool-bar
If the saved strategy result has become complicated or is incorrect and you wish to restart the calculations afresh there is a tool-barbutton Reload sectors from session This will remove any calculated sectors while leaving any known matrices listed at the bottom-leftof the Strategy pane
If you have saved a strategy file from a previous session this can be used to re-initialize the Strategy pane using the Load button onthe tool-bar
A Spacegroup pull-down menu has been added to the tool-bar to permit different choices of space group to be used in thecalculations (eg H3 and H32) This menu is populated from the list offered on the Indexing pane However the space group symboltext is editable Any space group symbol entered will be validated by Mosflm together with the current cell parameters
As a calculator for a multi-segment strategy the Strategy pane is reasonably flexible you can Save or Delete highlighted matrix lines byright-clicking As you highlight different matrix lines the orientation of the crystal expressed as the angles between the abc unit cellaxes and the XYZ coordinate frame is re-displayed in the centre of the pane
The following screen shot shows the cumulative results in the Strategy pane after this procedure has been followed for four crystals(ignore the iMosflm version number)
iMosflm Tutorial
fileUsersandrewg4MOSFLMnewgui_tutorialiMosflm_tutorial_720_ver3html[29052015 105311]
731 Calculating a strategy when some data have already been collected and processed
This option is not yet implemented If data have already been processed (to give an MTZ file) but the images are not currently available (eg they were collected on a previoussynchrotron trip possibly at a different synchrotron) then the MTZ file containing this data can be read and used to calculate a strategyfor data collection from new crystalsThe MTZ icon in the tool bar is used to read the MTZ file
74 Calculating a suitable oscillation angle
To calculate the maximum possible oscillation angle while avoiding spatial overlaps click on the Check for overlaps button A pop-upwindow will appear from which the option to calculate the maximum oscillation angle (as a function of φ) or check how many overlapswill occur for different (user selected) oscillation angles The results are plotted in the same pane as the histograms for the strategycalculations Note that the overlap calculation is based on the current values for the mosaic spread and spot separation and can be verysensitive to these values Note also that these are maximum and not necessarily recommended oscillation angles
iMosflm Tutorial
fileUsersandrewg4MOSFLMnewgui_tutorialiMosflm_tutorial_720_ver3html[29052015 105311]
8 Cell refinementIt is important to determine the cell parameters accurately before integrating the images Although the unit cell is refined as part of theautoindexing providing the diffraction extends beyond ~35Å resolution it is possible to obtain more accurate cell parameters using aprocedure known as post-refinement This procedure requires the integration of a series of images in ideally two or more separatesegments at widely different φ values The distribution of the intensity of partially recorded reflections over the images on which theyoccur is used to refine the unit cell crystal orientation and mosaic spread
Select the Cell Refinement icon
81 Selecting the images
iMosflm Tutorial
fileUsersandrewg4MOSFLMnewgui_tutorialiMosflm_tutorial_720_ver3html[29052015 105311]
There are several ways to select the images to be used in cell refinement Whichever method is used the image numbers will bedisplayed in the Images entry field iMosflm will automatically select appropriate images but these can be changed
811 Manual selection
A list of images can simply be typed into this box An image series can be specified as n-m where n and m are the first and last imagesDifferent series must be separated by white space or comma
For orthorhombic or higher symmetries two segments should be given approximately 90deg apart in φ For monoclinic or triclinic datathree or four segments are best (eg φ = 04590135)
The number of images that should be included in each segment depends on the mosaic spread and oscillation angle A reasonablenumber is 2(mosaic spreadoscillation angle +1) MOSFLM will automatically select two or more segments as appropriate Note thatthere is a limit on the total number of images that can be used
812 Automatic selection
Selecting the Automatically select images icon will select a suitable set of images
813 Graphical selection (Not recommended)
Selecting this icon will give a new window
Images can be selected by clicking in the Use check-box in the list of images or by using the mouse to drag a selection of imagesfrom the sector displayed The other icons allow the sector to be zoomed in or out and the viewed area to be moved to make theselection easier The final two icons on the tool-bar switch the segment display to fit the display space as either a full circle or aquadrant This Image palette can be closed by clicking outside its area but will close after 60 seconds anyway
82 Integrating the images and refining the cell
Use one of the methods above to select images to use in cell refinement and click on the Process button Before starting cell refinementcheck that the prediction for the first image in each segment to be used is good The majority of the spot positions must be correctlypredicted for the first image in each segment or else the refinement will not work
The selected images will be integrated and following integration the cell parameters are refined Selectable refined detector parameters
iMosflm Tutorial
fileUsersandrewg4MOSFLMnewgui_tutorialiMosflm_tutorial_720_ver3html[29052015 105311]
will be plotted as will the changes in crystal orientation and (if selected) mosaic spread If the shift in cell parameters is greater than 25standard deviations another cycle of integration and cell refinement is carried out Typically two or three cycles are required forconvergence Note that the current program activity is shown in the bottom left-hand corner of the window in the status message area
The different windows are explained below Moving the mouse over any parameter or plotted graph point will give a full description ofit
821 The detector parameters window
The values of the refined detector parameters are displayed for each image as it is integratedThere is the option to fix any of the parameters during integration by checking the Fix box onthe right The positional residuals (overall central and weighted) are also listed
Any of these parameters can be selected for plotting on the graph that appears to the right ofthis box by simply clicking on that parameter (which is then highlighted in blue as shown herefor Beam x and Beam y)
Check the stability of the refined parameters by displaying the appropriate graphs To getsensible scaling of the graphs only parameters with similar numerical values should be plottedtogether
For weak images (ie few visible spots in the outer regions of the image) the tilt and twistmay not be well defined and might refine to large values (greater than one degree) Insuch cases these parameters should be fixed It is not generally recommended to fix any
iMosflm Tutorial
fileUsersandrewg4MOSFLMnewgui_tutorialiMosflm_tutorial_720_ver3html[29052015 105311]
other detector parameters
For very weak fine sliced images (Pilatus only) there is the option to sum images when findingsuitable spots for refinement see Settings -gt Processing Options -gt Advanced refinementwhich can in some cases make the refinement more stable
822 The crystal parameters window
The values of the refined crystal missetting angles φ(x) φ(y) φ(z) the unit cell parameters andmosaic spread for the current image are displayed in the table Selected parameters will beplotted as for the detector parameters Specific unit cell parameters can also be fixed
If more than one segment of data is being used for cell refinement it is not unusual to see achange in orientation of the crystal between the two segments
Observe how the crystal orientation is different for images in the two segments See how themosaic spread varies during refinement
823 The central spot profile
The average spot profile for the central region of the detector is plotted for eachimage This confirms that the spot prediction is good If the profile is not welldefined and central in the box or if the blue border for the peak region of the spot ismuch larger than the apparent spots size it suggests a problem with the integrationand the initial prediction should be checked In some cases it may be necessary toincrease or decrease the Profile Tolerance parameters to ensure that the blue boxfits the spot To do this select the Advanced integration tab of Processing optionsCheck the central spot profiles for the images used in the cell refinement
824 The summary window
This window presents a summary of how selected parameters have changed indifferent cycles of the cell refinement The behaviour of these parameters gives agood indication of whether the cell refinement has been successful
If the refinement has been successful the RMS residual should be lower for thefinal cycle than in previous cycles However errors in the cell can be compensatedquite well by changing the crystal to detector distance so the differences are notalways dramatic
The other parameters that can be plotted from the pull-down list are the detectordistance and the Pixel ratio (Yscale)
The detector distance should be the same for all images in the refinement If the original indexing was based on auto-indexing a singleimage (say the first) then the detector distance might change for images from the second segment to compensate for an error in theoriginal cell If the variation in distance for different images increases with the cycle number this indicates that the refinement is notstable
The Pixel ratio (Yscale) parameter may also show an initial variation for images in different segments because refining Yscale (whichshould be 10000 for all except Raxis II and Raxis HTC detectors) can compensate for errors in cell dimensions in the same way that thedistance can The final values (last cycle) should be very close to identical for all images and should also be very close to unity (to within00010)
Cell refinement can be unstable if the data do not extend to at least 35 Aring If it appears unstable use the cell derived from auto-indexing a series of images well spaced in φ instead
iMosflm Tutorial
fileUsersandrewg4MOSFLMnewgui_tutorialiMosflm_tutorial_720_ver3html[29052015 105311]
Examine the plots to see if the parameters are stable and correct (Yscale)
825 The final results
When refinement has converged (or after 5 cycles) the initial and final cell parameters and the estimated errors (std dev) are listed
If time is available make a note of the std dev values and repeat the cell refinement using a larger number of images in each segmentAre the standard deviations smaller when using more images
83 Refining cell parameters for multiple lattices
Providing the resolution is high enough (generally better than ~35-32 Aring) and not too many of the spots in the different lattices areoverlapped it is possible to refine the cell parameters for each lattice individually The lattice to be refined is selected from the Latticeselector
This selector will be grayed out when processing a single lattice
84 If the prediction for the first image of a segment is poor
In some cases depending on how the indexing has been carried out or if the diffraction is poor or there has been a large change incrystal orientation during the data collection the prediction for one or more of the segments (the first image) may be poor In suchcases the integration and hence the cell refinement may fail It may be possible to successfully process the images after an initialrefinement of the crystal orientation using a pattern matching algorithm To select this option got to the Advanced refinement tab ofProcessing options and select the tick box for Refine orientation of first image in any run by pattern matching and for Integrate allimages Then refine the cell in the usual way During integration the orientation will be refined for the first image of each segmentoutput for this additional refinement will be written to the logfile but is not shown in the GUI
9 IntegrationThe accurate cell parameters are now used in the integration Note that although the images are integrated during the cell refinementthe intensities are not saved and no MTZ file is generated at that stage
It is good practice to start by integrating a block of images corresponding to a few degrees of data to check that the parameters do notneed further adjustment MOSFLM will generate warning messages after integration if there are any difficulties and it may be possibleto improve the situation by changing some of the default parameters (see Warning messages sect13)
Before integration ensure that the backstop shadow has been defined (see Masked areas backstop sect411 and Masked areas generalsect412)
91 Image selection
Image selection is performed in exactly the same way as in the cell refinement In this case the Automatic selection will simply includeall images in the current sector
Select images 1-10
92 Setting the MTZ filename and controlling updating of the image display
Two icons appear when the integration option is chosen
If the Show predictions icon is clicked the display window will be updated as eachimage is processed This will slow down the processing but allows the accuracy of theprediction to be checked for each image
iMosflm Tutorial
fileUsersandrewg4MOSFLMnewgui_tutorialiMosflm_tutorial_720_ver3html[29052015 105311]
Click on this icon so that the display will be updatedThe filename of the MTZ file containing the results of the integration is generatedautomatically but can be edited manually
93 Integrating the images
Click on the Process button to start integration
Integration of the images occurs in two passes In the first pass for each block of images (a number corresponding to a few degrees ofdata selected automatically by MOSFLM) the detector and crystal parameters are refined for each image in turn and the measurementboxes for all predicted spots are written to a file for use in the second pass In the second pass the standard profiles are formed fromreflections present on all of the images in this block and each image is then integrated and the results written to the MTZ file Thedisplay is not updated during the second pass and will remain on the last image of the block (assuming image updating has beenselected)
Note that the unit cell dimensions are normally fixed during integration and only the crystal orientation and mosaic spread are refinedCrystal parameter refinement only starts when a sufficient number of images have been integrated to provide data for the post-refinement typically after ~05-1 degree (more for high mosaicity)
94 Parameter display windows
As described in sect82 the refined detector and crystal parameters will be displayed in tables and selected parameters will be plotted ingraphs The average spot profile for each image will also be displayed
The size of these graphs (and the profile) can be expanded to fill the whole window by holding down Shift and clicking LMB anywherein the graph window A second Shift+click will revert the graph to the original size
In addition to these windows there are windows that tabulate and plot (as a function of image number) the mean Iσ(I) for profile fittedand summation integration intensities The overall values and the values for the highest resolution bin are given
The number of overloaded reflections Bad spots (ie those that fail certain tests see mosflm SUMMARY file sect15) Spatial overlaps andif processing multi-lattice images the number of lattice overlaps is listed for each image and can be plotted by highlighting thatparameter When processing data from crystals with large unit cells it is important to watch out for spatial overlaps (see sect97 for tips onhow to reduce the number of spatial overlaps if this is a problem)
A display of the standard profiles for different regions of the detector is also provided Poor profiles are averaged by includingreflections from inner regions of the detector Averaged profiles are indicated by a red line around the spot (rather than blue) Theoriginal unaveraged profile can be viewed a clicking on the profile (providing there were sufficient spots in that region to allowformation of a profile)
The profiles should be checked to see that they are well defined and centred within the box Poorly-defined diffuse or non-centredprofiles may suggest that the prediction is not very good in which case this should be checked on the corresponding image(s)
It may be useful to expand the standard profiles to fill the window using Shift + click in the profiles window
Finally the lower left window plots Iσ(I) as a function of resolution for any selected image
iMosflm Tutorial
fileUsersandrewg4MOSFLMnewgui_tutorialiMosflm_tutorial_720_ver3html[29052015 105311]
Different parameters can be plotted by selecting the small right- or left-pointing arrows on the title line above the plot
95 Integrating the whole datasetAssuming that everything looks OK the entire dataset can now be integrated However it is strongly recommended thatProjectCrystalDataset names are assigned first These are written to the output MTZ file and used by downstream programs inparticular AIMLESS will use this information when deciding which images belong to the same dataset
Select Experiment settings from the Settings drop-down menu (see Drop down menus sect21) to enter these names and optionally givea title for the MTZ file
Select images 1-84 and click on Process
951 Parallel Integration Using multiple cores
An option is available on the pull-down menu (next to the Process button in the Integration task) which splits up the integration jobover available cores on the local machine All aspects are currently determined automatically at present user-configurable options willbe available in a later version The algorithm used is as follows
iMosflm determines the number of cores available on the local machineIf the number of cores (N) is greater than 2 iMosflm splits the integration run into N-1 batches (up to a maximum of 16) containingapproximately the same number of images If N le 2 iMosflm splits the run into N batches
If the total number of images in each batch is less than 32 the number of batches is decreased until this condition is satisfied
The first batch is submitted as a background task consisting of a refinement stage and an integration stage with its input and outputfiles (including the MTZ file) in a new directory its name being determined from the number of segments of data being integrated andthe lattice number (if the sample has been determined to contain multiple lattices) If the directories exist already they are all movedinto a newly-created directory with a time-stamped name the files from the most recent integration run are thus in directories withnames following the pattern described above Once the refinement stage is complete the refined parameters are written to a file
The launch of subsequent batches are delayed until the corresponding preceding batch has written its refined parameters This file isread and the new batch is launched again with a refinement stage and integration stage
At present the job cannot be aborted once it has started
952 Integrating as a background job
By selecting Batch in the drop-down menu adjacent to the Process button the integration can be run as a background job rather thaninteractively and the GUI can be used to look at a different dataset
Selecting Batch from the drop-down menu will display a new window showing the script that will be used to process the images alongwith a number of processing options The script can be edited if additional keywords are required or if some parameters are to bechanged and can also be copied and pasted into a file for off-line processing
By default the job is divided into batches across multiple cores as determined for the parallel integration described in sect951 but thenumber of cores can be chosen by the user from a drop-down menu in this case the size of each batch is determined by the interface
Plotting the results of the integration can be turned off this can make processing much faster
iMosflm Tutorial
fileUsersandrewg4MOSFLMnewgui_tutorialiMosflm_tutorial_720_ver3html[29052015 105311]
It is possible to configure job submission for remote machines (which can be added by depressing the add host button) Ensure youhave enabled passwordless logins for all the remote machines you enter and that you specify the full path to the Mosflm executable inthe Batch destinations window The remote working directory (in which the log and MTZ files are written) and the remote imagedirectory must both be specified with their full path names Any required parameter fields that are not completed by the user arehighlighted in orange if the user tries to submit a job without completing these fields a new window containing only those fields (againhighlighted in orange) pops up with a request to do so
The number of cores available on the selected host can be determined by depressing the apple core button on the Batch destinationsconfiguration window
The log file for batch submission jobs the MTZ and SUMMARY files are written to the directory in which iMosflm was launched
96 Checking the integration
iMosflm Tutorial
fileUsersandrewg4MOSFLMnewgui_tutorialiMosflm_tutorial_720_ver3html[29052015 105311]
The detector and crystal parameter plots should be examined carefully to check for any instability in the refinement If there are largeand random variations in some parameters (eg the detector twist and tilt) then it may be better to fix them and repeat the integration
For cases (eg very small unit cells) where there are very few suitable reflections on each image the refinement of the missetting anglesmay show significant variations from one image to the next In such cases it is best to apply smoothing to the missetting angles usingthe tick box in Settings -gt Processing options -gt Advanced Refinement
Discontinuities due to blank images should also show up and the offending images should be removed from the scaling run
If adjacent spots are incompletely resolved on the detector it may be possible to improve the processing by increasing the PROFILETOLERANCE parameters by 1-2 These parameters can be set in the Advanced integration tab of the Processing options menu (useSettings)
97 Advanced features for integration
The Settings -gt Processing options menu allows additional control over the integration Parameters such as the minimum spotseparation resolution limits excluded resolution ranges block size MTZ filename and BATCH ADD can be changed in the Processingtab
Manually decreasing the minimum spot separation can help if a large number of reflections are flagged as spatially overlapped (redboxes) The prediction must be updated to see the effect of changing the separation this can be done either by displaying the next orprevious image or double clicking on the blue circle next to the image currently displayed in the Images pane
In the Advanced integration tab the measurement box parameters profile tolerance and profile averaging parameters can be set
The measurement box parameters can be adjusted for rare cases where the estimation of the spot size has not worked correctlyresulting in a box that is too small or too large The optimisation of the background rim and corner cutoff parameters that determinewhich pixels are used for the background and which pixels for the peak can also be turned off but this is generally not recommended
Increasing the profile tolerance can help in cases where adjacent spots are not completely resolved this can be judged by examining thestandard profiles By default the profile tolerance is automatically increased if there are a large number of spatial overlaps as this hasthe effect of reducing the minimum spot separation A message will be written to the logfile if this has happened This option can beturned off using the tick box Optimise profile tolerance values to avoid spot overlap
The profile outlier exclusion parameters control the exclusion of ice spots or hot pixels which could otherwise corrupt the standardprofiles
Pixels with a value less than the Null pixel threshold are considered to belong to inactive regions of the detector
The pixel saturation value determines when a reflection is considered to be an overload The intensity of overloaded reflections isestimated by profile fitting but these reflections are rejected by the scaling program AIMLESS by default
Increasing the Maximum reflection width in φ from the default value of 5deg will reduce the number of rejected reflections (green boxes)and is worthwhile when the mosaicity is very high or the mosaic block size is very small As with the minimum spot separation theimage must be refreshed to see the effect of changing this parameter
The rejection criteria will reject reflections with too much variation in the background (BGRATIO) or where the gradient of thebackground plane is too large These should only be changed if many reflections are being rejected PKRATIO only applies to fullyrecorded reflections and reflects a very poor profile fit With current data collection protocols there will be very few (if any) fullyrecorded reflections
Additional MOSFLM parameters will be added based on user requests
98 Integrating multiple lattices
When multiple lattices have been successfully indexed each lattice can be integrated individually by selecting the appropriate latticenumber
Reflections in the chosen lattice that are overlapped by a reflection from another lattice will be integrated but the measurement box willbe expanded so that the total intensity of the two (or more) reflections is measured These reflections will be flagged for specialtreatment Reflections that are not overlapped are referred to as singletons They will be dealt with in the normal way by POINTLESSand AIMLESS
NOTE If more than one lattice has been indexed and the results of integrating just ONE of the lattices are to be checked byrunning QuickSymm or QuickScale then the multi-lattice icon in the Integration pane must be turned off otherwise an error
iMosflm Tutorial
fileUsersandrewg4MOSFLMnewgui_tutorialiMosflm_tutorial_720_ver3html[29052015 105311]
message will be given saying that all lattices must be integrated
It is often the case that by measuring both lattices (in separate integration runs) and inputting both MTZ files to QuickScale the overallcompleteness is high using ONLY the singletons To use this option ensure that the multi-lattice icon is off
To make use of the intensity estimates for overlapped reflections MTZ files for all lattices must be input to the program FECKLESSwhich will derive the best estimate of the summed intensity This is the default option if more than one lattice has been indexed and itrequires that all lattices have been integrated (in separate runs) prior to running QuickSymm or QuickScale (FECKLESS will be runautomatically)
At this time no downstream programs can make use of the summed intensities of overlapping reflections but in the future it should bepossible to use this data in REFMAC
Currently it is recommended to use only singletons from all the lattices FECKLESS is not required in this case
The MTZ filename is automatically updated to reflect which lattice has been chosen to avoid overwriting the MTZ file of the first latticewhen integrating the second one FECKLESS when run from iMosflm relies on this naming convention so do not change it
10 Running Pointless to check the symmetryOnce the images have been integrated (even a few degrees of data in many cases) the program POINTLESS can be run to determine thetrue Laue symmetry and try to determine the space group using the QuickSymm button
iMosflm Tutorial
fileUsersandrewg4MOSFLMnewgui_tutorialiMosflm_tutorial_720_ver3html[29052015 105311]
Select the QuickSymm button
A summary of the Pointless results as shown below will appear in a qtRView window
Various graphs (L test for twinning ViewHKL to view the reciprocal lattice) can also be viewed in this window
Various options for POINTLESS such as a reference MTZ file forcing the symmetry selected in iMosflm and specifying multiple input MTZfiles can be selected from the Settings -gt Processing options -gt Sort Scale and Merge tab (see below)
iMosflm Tutorial
fileUsersandrewg4MOSFLMnewgui_tutorialiMosflm_tutorial_720_ver3html[29052015 105311]
Caution The results can be ambiguous if run with a partial dataset Look in the logfile to see how many relfections are used totest each possible symmetry operator
11 Running Aimless to scale and merge the dataSelect the QuickScale button
This will first run POINTLESS then change the space group for the data to that selected by POINTLESS (unless the iMosflm symmetry isset to override POINTLESS) run AIMLESS to scale and merge the data in that space group and then run CTRUNCATE which calculates anumber of statistics from the intensity data The CCP4 UNIQUEIFY script will then be run which generates all the unique reflections forthat spacegroup to the resolution of the measured data and will flag reflections (5 by default but this can be changed) for use as theRfree set
AIMLESS can be run from the QuickScale button either treating anomalous data (the default) or ignoring anomalous data If onlyprocessing a few degrees of data it is usually better to ignore anomalous because especially for low symmetry cases no mergingstatistics may be given in AIMLESS
SCALA can be selected as an alternative to AIMLESS for scaling (not recommended)
There is limited control over running AIMLESS (see figure above) including re-setting resolution limits rejecting batches (images)changing the treatment for accepting partials changing the rejection criterion and changing the procedure for updating the standarddeviation estimates
iMosflm Tutorial
fileUsersandrewg4MOSFLMnewgui_tutorialiMosflm_tutorial_720_ver3html[29052015 105311]
The AIMLESS results will be displayed in the qtRView as shown below along with graphical output (see below) and the full log file canalso be examined
Aimless summary file
iMosflm Tutorial
fileUsersandrewg4MOSFLMnewgui_tutorialiMosflm_tutorial_720_ver3html[29052015 105311]
An example of the Aimless graphical output
The AIMLESS logfile can also be examined by selecting the Log File tab
12 History and mosflm log fileSelecting History allows the history of the session to be examined or by selecting the Log tab the full mosflmlp file can be viewed Themosflmlp file is also available in a time-stamped file mosflm_yyyymmdd_hhmmsslp (eg mosflm_20100518_131019lp) and can beread with a text editor
The History has a tree structure and will show when various parameters have been changed This has not been fully implemented and isnot generally useful
The logfile may provide useful clues when processing has failed
13 Warning MessagesAs already mentioned in Adding images sect3 and Integration sect9 warning messages are generated by MOSFLM during processing Atraffic light colour coding has now been assigned based on the warnings and is shown next to the Warnings box
A Red status implies a serious problem that will affect data quality and should be addressed
An Orange status implies minor issues that should be checked to see if things can be improved
A Green status means no significant problems messages are for information only
iMosflm Tutorial
fileUsersandrewg4MOSFLMnewgui_tutorialiMosflm_tutorial_720_ver3html[29052015 105311]
Abbreviated messages can be obtained by clicking on the Warnings icon The full warning Details together with Hints amp Notes text (ifany are available) can be obtained by double-clicking the relevant warning Details are displayed in a pop-up text box which willdisappear with the next click outside the box The same full details and suggestions are of course available in the mosflmlp files whereeven more information may be available
NOTE This is the end of the part of the tutorial which deals directly with iMosflm but see sect19 which has some suggestions forfurther work if you have time The remainder of this document deals with integrating and scaling data with MOSFLM andAimless via the CCP4i user interface examining the traditional mosflm SUMMARY file with the CCP4 utility loggraph
The Appendix contains a shell script for running MOSFLM as a traditional batch job
14 Useful command line optionsiMosflm has a number of command line options and these can be listed by typingimosflm --helpCurrent options are
--allimages -a ltfilenamegt Starts mosflm loading all files that match the template generated from ltfilenamegt--ccp4i2 Autosaves an iMosflm session file upon exit with an XML list of all iMosflm output files--debug -d Creates a large output file for debugging purposes Dont use this unless asked to by a developer--expert -e Permits access to advanced detector settings This should not normally be required--fastload -f Attempt to speed loading of many images offline while indexing two default images separated by 90 degrees--help -h Displays this message then exits--imagedir -I ltdirectorygt Starts the image browser in this directory if ltdirectorygt is given as an environment variable it will be expanded to its full value--init -i ltfilenamegt Starts Mosflm and reads from the given saved session file--startdir -S ltdirectorygt Starts mosflm in directory ltstartdirgt rather than the current directory This will only work if the directory exists and you have write permission to it otherwise iMosflm will exit All the normal mosflm output files will be in this directory--singleimage -s ltfilenamegt Starts mosflm loading only the image from ltfilenamegt--site -X ltfilenamegt Reads anyall of the following lines from the file given WAVELENGTH ltxgt DISPERSION ltxgt POLARISATION [PINHOLE | MIRRORS | MONOCHROMATOR | SYNCHROTRON ltxgt] DIVERGENCE ltxh xvgt BEAM ltbeamx beamygt DISTANCE ltxgt DISTORTION TILT ltxgt DISTORTION TWIST ltxgt GAIN ltxgt DETECTOR REVERSEPHI DETECTOR OMEGA ltxgt--version -v Displays the program version and required Mosflm version then exits
These can be abbreviated to the shortest unambiguous string
141 The site fileimosflm --site ltsitefilegt will read keywords from the file ltsitefilegt that will overwrite incorrect information in image headers Thissaves having to manually correct values in every iMosflm session The site file can also be read or written as an option from the Sessionmenu (see Drop down menus sect21) Allowed keywords areWAVELENGTH ltxgt
iMosflm Tutorial
fileUsersandrewg4MOSFLMnewgui_tutorialiMosflm_tutorial_720_ver3html[29052015 105311]
DISPERSION ltxgtPOLARISATION [PINHOLE | MIRRORS | MONO | SYNCHROTRON ltxgt]DIVERGENCE ltxh xvgtBEAM ltbeamx beamygtDISTANCE ltxgtDISTORTION TILT ltxgtDISTORTION TWIST ltxgtGAIN ltxgtDETECTOR REVERSEPHIDETECTOR OMEGA ltxgt
15 The mosflm SUMMARY fileMOSFLM produces a summary file listing refined parameters for each image and when using iMosflm this file will be date- amp time-stamped and have a name such as mosflm_20100518_131019sum This contains the same information as the plots produced by theiMOSFLM GUI which now also include the number of bad spots and overloads
This can be inspected graphically from the CCP4i GUI using the program loggraph Select the pull down menu View Files from Job andunder Output files select Additional log graphs where the _SUMMARYloggraph file will be listed Select this file to display its tablesin loggraph
This is very useful to identify rogue images (with unusually high positional residual or low Iσ(I)) If you find any read that image intoMOSFLM and see what is wrong with it
If you have done more than one integration run during your MOSFLM session you will find multiple entries of the tables Look at the lastset for integration of the 84 images
Click on the Refined detector parameter tables and check on the stability of parameters like the TILT and TWIST of the detector (unitsare hundredths of a degree) and for Mar Research (or DIP) image plate data the distortion parameters ROFF and TOFF (units are mm) Ifthey are varying a lot (more than 20 for TWISTTILT) or 015 for ROFFTOFF then it is probably a good idea to fix these parameters atthe average value (or the known values for this detector if they are available) (see Detector parameters sect821)
Click on the Post refinement table and check the missets It does not matter if they change slowly and by an amount (per image) that isless than 01mosaic spread If they are changing more than this then there could be a problem with processing the data (there is notmuch you can do about this)
Check how the mosaic spread is changing If it is unstable or if you think it is not refining to sensible values (as judged by looking atthe prediction) then you can fix the input value in the same way as the detector parameters (see Crystal parameters sect822)
BADSPOTS AND OVERLOADS
The program will set a rejection flag for those reflections that fail certain tests for example too much variation in the background levela poor profile fit an intensity that is very negative (more than 5 standard deviations) a very high gradient for the background planeThese reflections are called Bad spots and they are listed individually for each image in the mosflmlp file together with the reason forflagging them The number of bad spots is also written to the summary file Generally there should be very few (5-10) bad spots oneach image If there are more it could be because the backstop shadow is not correctly allowed for (consider using the NULLPIXkeyword)
There should also be very few overloaded reflections on each image If there are a lot then a separate low resolution data collectionpass should be made with a much shorter exposure time
IMPORTANT Both Bad spots and Overloads are written to the output MTZ file but will be rejected by default by AIMLESS Theintensity of overloaded reflections is estimated by profile fitting that part of the spot that is not saturated To include these reflections inthe final merged data use the ACCEPT keyword in AIMLESS
16 Scaling data with CCP4i ccp4i
Select Directories amp ProjectDir (top right)
In the new window select Add project
Enter the project name in the Project field and the full directory path in the uses directory field Default values may have been enteredalready here Select this project from Project for this session
Select Apply and Exit Dismiss the warning message that comes up
Select Data reduction from the pull down menu of modules (orange bar at top left)
iMosflm Tutorial
fileUsersandrewg4MOSFLMnewgui_tutorialiMosflm_tutorial_720_ver3html[29052015 105311]
Select Symmetry Scale Merge (Aimless)
In the window that appears do the following
Give a job title (top line)
Click on the box next to Separate anomalous pairs for outlier rejection amp merging statistics (the crystals have been soaked in a mercurycompound)
In the next orange bar (line starts HKLIN 1) select Browse and select the MTZ file output by MOSFLM (probably called hg_001mtz)Select OK
If you did not supply the Project name Crystal name or Dataset name to Mosflm fill in the boxes for these now
Under Scaling Protocol
From the pull-down menu on the line starting Scale select with automatic default settings
At the bottom of window from the pull-down menu named Run select RunampView Com File
This will display a new window showing the command file for running the POINTLESS step select Continue After a brief pause it willshow the command file for running AIMLESS (This can be edited before submitting the job) Select Continue
In the main window it will show that the AIMLESS job is running
When AIMLESS has finished the command file for running the CTRUNCATE step will appearselect Continue
When CTRUNCATE has run the main window will say FINISHED
At that point select the pull-down menu View Files from Job and select View Log Graphs This will give you the same graphs asrunning loggraph on the AIMLESS log file they are also the same as those that appeared in IMOSFLMs QuickScale task To look at thelog file itself (eg the overall merging statistics) select View Log File and it will appear in a new window
161 Looking at the AIMLESS output
The simplest way to look at the output from AIMLESS is to use loggraph on the AIMLESS log file (or via the CCP4i GUI) This can displaymany different graphs
Use Scales vs rotation range to check for smooth variation in the scale factor Check the variation in B factor with image and if there isno real variation it is best to turn off the B-factor refinement
Use the Analysis against all Batches for all runs to detect bad images (high R-factor large number of rejected spots)
Check the Analysis against resolution Fractional bias to see if there is any indication of Partial bias (A negative partial bias will resultif the mosaic spread is underestimated or if there is a lot of diffuse scatter
The Fractional bias should be less than 1-2 although it will often exceed this for weak data (eg in the high resolution bins)
The Axial reflections graphs in AIMLESS are useful for detecting systematic absences which can be used to identify the true spacegroup However the detection of screw axes is thought to be sufficiently robust in POINTLESS that these graphs are no longer necessary
It can also be useful to look at the AIMLESS log file itself in particular the table giving statistics as a function of resolution The effectiveresolution limit of the data can be estimated by looking at the Mn(I)sd column (this is the mean Iσ(I) AFTER merging symmetry matesand is the best indicator of data quality) This table also shows shell and cumulative R-factors
The Mn(I)sd values depend on having realistic values of the standard deviations (errors) in the intensities As the values that come fromMOSFLM are always underestimates of the true error these values are scaled up in AIMLESS using a three-term correction
sdcorrected = SdFac Sqrt[sd(I)2 + SdBLPI + (SdAddI)2]
Here SdFac is an overall scale factor and SdB and SdAdd are intensity dependent factors
AIMLESS will automatically work out a suitable value for all three parameters in order to make the mean value of (observedscatter)(sdestimate) equal to 10 where observed scatter is the difference between an individual estimate of intensity and the mean ofall other estimates (from symmetry mates)
Probably the best estimate of the true high resolution limit of the data can be obtained from the CC(12) values these are thecorrelations between equivalent observations that have been divided randomly into two half-datasets The resolution limit is foundwhen the CC drops below ~ 05 - 03
This table comes under the heading
ANALYSIS OF STANDARD DEVIATIONS
iMosflm Tutorial
fileUsersandrewg4MOSFLMnewgui_tutorialiMosflm_tutorial_720_ver3html[29052015 105311]
in the AIMLESS log file and Run n standard deviation v Intensity test (where n is 1 or more) in the CCP4i GUI View Files from Job -View Log Graphs display
Can you identify a bad image in this dataset Can you work out why it is bad
(Cluethe image headers contain quite a lot of information that is not used by MOSFLM including the date and time that the image wascollected)
You can exclude a given batch from the scaling using the EXCLUDE keyword
RUN ALL EXCLUDE imagenumber
In this case run number will be 1
Rerun the scaling SENDING THE OUTPUT TO A NEW LOGFILE excluding this image and see the effect on the heights in the anomalousPatterson (in the log file) DO NOT repeat the integration In the command file uncomment the line (near the top) goto aimless so itskips the integration part
In the CCP4i GUI click to highlight the AIMLESS job which is listed as FINISHED and select ldquoReRun Jobrdquo from the control buttons downthe right-hand side of the main interface window Under ldquoExcluded Datardquo in the window that appears check the box next to Excludeselected batches and pull-down on the menu button to exclude a range Give the start amp end range to exclude (eg 74 to 74) Rerunthe job as before
17 Changing the symmetryFrom the list of options at the left hand side of the main window select ldquoUtilitiesrdquo and under that SortModifyCombine MTZ Files
In the new window give a new title eg reindex as H32
Click on the Box Change space group andor reindex reflections
Use the browse option to select the input MTZ file (First orange bar) the output filename will be generated automatically (but you canchange it)
Under Reindex details
In the last option check the box next to ldquoChange space group tordquo and enter H32 in the box This is above the final item Reducereflections to the asymmetric unit which is checked by default
Select Run from the Run option button
Then go back to the scaling window and select the new MTZ file (reindexed) as the input for scaling (use Browse) CHANGE THE JOBTITLE
Then select RUN
The scaling will now be performed in space group H32 Look at the merging statistics in the log file in particular the multiplicityweighted R-factor called Rmeas in the log file
18 Looking at the CTRUNCATE outputThe CTRUNCATE program converts intensities to amplitudes and also compiles some useful statistics The LTEST and the cumulativeintensity statistics tabulated by CTRUNCATE (and plotted by loggraph) provide the only point at which you will be able to detectmerohedral twinning (when the two lattices of the twin components exactly overlap and every measured intensity is actually the sum oftwo intensities)
For a good dataset the observed distribution should be within 1 of the theoretical distribution Is this the case for this data
19 If you have time 191 Different mosaic spreads
Try repeating the processing with the mosaic spread set to a value 25 smaller than the refined one and fix it by checking the Fix boxin the Integration window in iMosflm
Can you tell from the merging statistics if this data is better
192 Checking up on outliers
iMosflm Tutorial
fileUsersandrewg4MOSFLMnewgui_tutorialiMosflm_tutorial_720_ver3html[29052015 105311]
AIMLESS writes a file called ROGUES which lists reflections which show very poor agreement between symmetry mates or which areimplausibly large
Look in this file (it is ASCII) and try to work out why this has happened The ROGUES file gives you the image (Batch) on which thereflections have been recorded (for partials this is the image nearest the centre of the reflection so you may need to look on thepreceding and following image as well) Select a reflection which shows very poor agreement with its symmetry mates (A value greaterthan 10 in the DelIsd column in the ROGUES file)
Select the offending image by double-clicking it in the Images pane of the iMosflm main window Predict the reflections then enter thehkl values into the boxes and hit Return (or click the red warning button following the entry box for l) to locate the offending reflectionin the image You must give the measured indices - the first set of values in the ROGUES file - when doing this See if there is anythingodd about the spot Remember to check adjacent images for partials
193 How accurate does the unit cell have to be
Try changing the cell parameters by (say) 10 and integrate the images again What is the effect on the merging statistics
20 Tips1 When reading images into a session DO NOT attempt to carry out any other task until ALL the images have been read2 It is often worth repeating the indexing (usually only once) as the refined direct beam coordinates from the first indexing may give
an improved solution when the indexing is repeated (lower rmsd)3 Always integrate a few degrees of data before integrating the whole dataset (see sect9) If the space group is not known in advance
run Quicksymm with a few degrees of data to check that the correct indexing solution has been chosen4 For difficult images do not attempt to refine the unit cell initially once an indexing solution has been obtained try integrating a
few images to ensure that the integration is stable If then going on to refine the cell check that the prediction looks OK for thefirst image of every segment included in the refinement If it does not look very good consider using the pattern matching(Settings -gt Processing options -gt Advanced refinement see sect84)
5 If the resolution of the data is less than 35 Aring do not use the ldquoRefine Cellrdquo task Instead use several images in indexing and use thecell that comes from the indexing
6 If iMosflm gets into a state where the activity icon(upper right) is spinning but nothing seems to be happening click on the activityicon to stop it spinning and see if the session can be continued DO NOT click on the activity icon simply to abort a task this willgive unpredictable results Use the Abort button for cell refinement or integration There is no defined way to abort indexing
7 Use the image summation option (see sect4) to get a better impression of the diffraction for very low exposure Pilatus images8 Use image summation for detector parameter refinement for fine sliced very weak Pilatus images (Settings -gt Processing options -
gt Advanced refinement see sect821)9 For large mosaic spread values (gt 10deg) or small mosaic block sizes (lt10) consider increasing the maximum allowed reflection
width to avoid having too many green predicted reflections (Settings -gt Processing options -gt Advanced integration see sect97)10 By default on selecting the Indexing task iMosflm will find spots index and (assuming a solution has been found) estimate the
mosaicity For difficult cases it is more useful to restrict this to simply finding spots and then do the indexing and mosaicityestimation by clicking the appropriate buttons To do this change the check box Automatically index after spot finding inSettings -gt Processing options -gt Indexing
11 See sect521 and sect522 for advice if the indexing fails Also consider the possibility of a reversed phi rotation direction if you arenot familiar with the beamline (Settings -gt Experiment settings -gt Experiment see sect21)
12 If the detector parameters have refined to physically unreasonable values (eg because cell refinement or integration has beencarried out using an incorrect indexing solution) be sure to reset the detector parameters before attempting further processing(Settings -gt Experiment settings -gt Detector see sect21)
13 Always set the resolution limit slightly beyond the point at which any spots are visible (see sect414 ) For very weak fine-sliceddata it can be very difficult to estimate the resolution visually so integrate to the maximum resolution (inscribed circle) and usethe merging results to set the final resolution There should be no problems integrating to a resolution ~03-05 Aring beyond theactual resolution limit but for example integrating to 3 Aring when the true resolution limit is 5-6 Aring may cause problems and theintegration should then be repeated with a more realistic resolution limit
14 Use the site file sect141 if repeatedly processing data where the direct beam position is wrong or if the phi direction is reversed etcto save having to correct this for every session
Appendix IA command script for running MOSFLM using the keywords copied from the Batch processing window of the new GUI (see Integratingas a background job sect952) Note that keyworded input for MOSFLM and other CCP4 programs is case-insensitive apart from file anddirectory names
bincsh -fv Set a unique identifier for filenames for this job
set ident = x89_mos07_blk3_smallsep
iMosflm Tutorial
fileUsersandrewg4MOSFLMnewgui_tutorialiMosflm_tutorial_720_ver3html[29052015 105311]
$ipmosflm COORDS $identcoords SUMMARY $identsummary ltlt eof-ip Insert keywords copied from iMosflm batch window here
Keywords for this run For example could involve trying different values for mosaic spread or not integrating all images etc etchklout $identmtzgenfile $identgenprocess 1 1000 goeof-ip
pointlesspointless hklin $identmtz hklout $ident_pointlessmtz
aimlessaimless hklin $ident_pointlessmtz hklout $ident_aimless_partmtz ROGUES $identrogues ltlt eof-aimless Use all default options for aimlesseof-aimless
ctruncate hklin $ident_aimlessmtz hklout $ident_truncatemtz
Harry Powell Andrew Leslie and Owen Johnson

iMosflm Tutorial
fileUsersandrewg4MOSFLMnewgui_tutorialiMosflm_tutorial_720_ver3html[29052015 105311]
13 Warning Messages14 Useful command line options
141 The site file15 The mosflm SUMMARY file16 Scaling data with CCP4i
161 Looking at the AIMLESS output17 Changing the symmetry18 Looking at the CTRUNCATE output19 If you have time
191 Different mosaic spreads192 Checking up on outliers193 How accurate does the unit cell have to be
20 TipsAppendix I
1 Introduction11 Background
MOSFLM can process diffraction images from a wide range of detectors and produces as output an MTZ file of reflection indices withtheir intensities and standard deviations (and other parameters) This MTZ file is passed onto other programs of the CCP4 program suite(POINTLESS SORTMTZ AIMLESS CTRUNCATE) for further data reduction
The MOSFLM program was originally written to process data collected on film It was then modified to process data collected using theimage plate detector developed at the EMBL outstation in Hamburg by Jules Hendrix and Arno Lentfer and the name was changed toipmosflm This is the current version of the program which will also process data from CCD and pixel detectors
12 Installation
The new GUI (iMosflm) is currently available for Windows Mac OSX and Linux platforms For details of installation visit httpwwwmrc-lmbcamacukharryimosflm
13 Documentation
There are two distinct sources of documentation for MOSFLM although neither of these currently makes any reference to the new GUIAt present this document is the only documentation available for iMosflm
Also only this document is updated for new features of MOSFLM since version 709 (June 2012)
1 The MOSFLM user guide This is available as a plain text file (mosflm_user_guidetxt) or on the web (wwwmrc-lmbcamacukharrymosflm) as a PDF or HTML document This contains considerably more detail about how ipmosflm processesdiffraction images than this tutorial does It is a very good idea to look through this guide before starting serious data processingwith MOSFLM although you do not need it for this tutorial This has not been updated since version 709 (June 2012)
2 The on-line help If you type help at the MOSFLM =gt prompt (after starting the program ipmosflm) all possible keywords arelisted with information on each keyword This information is stored in an ASCII file (mosflmhlp) which can also be read (andsearched) with an editor This relies on having the environment variable CCP4_HELPDIR set to the directory containing this fileThis is also available on the MOSFLM web pages under keyword synopses
See also Battye TGG Kontogiannis L Johnson O Powell HR amp Leslie AGW 2011 iMosflm a new graphical interface fordiffraction image processing with MOSFLM Acta Cryst D67 271-281
14 Aims of the tutorial
Your task is to process 84 images hg_001mar1600 to hg_084mar1600 collected on a Mar345 image plate detector at a synchrotronbeamline These are crystals of a small domain (91 amino acids) that have been soaked in a mercury compound resulting in a datasetwith a strong anomalous signal which can easily be used to solve the structure These images have kindly been provided by CamilloRosano
Note You can equally well choose to process your own diffraction images if you wish
15 Mouse and key functions
For simplicity the mouse and key functions are all described here although they will also be referred to at various points in the tutorial
When positioned over the image right mouse button will return the display to the full size image if it has been zoomed Scrolling middlemouse will zoomshrink the imageHolding down the Ctrl key (or Alt or Cmd (for Macs)) will display the resolution and the current mouse position on the image in mm
iMosflm Tutorial
fileUsersandrewg4MOSFLMnewgui_tutorialiMosflm_tutorial_720_ver3html[29052015 105311]
and pixels If positioned over a found spot the spot coordinates and Iσ(I) will be given If positioned over a predicted spot position thehkl indices will be shownHolding down the Shift key while the Zoom icon in the image is selected will show the image within the small dotted square zoomedwithin the solid square
2 Overview of iMosflmStart the program by typing imosflm After a brief pause the following window will appear (note the date and version will bedifferent)
The basic operations listed down the left hand side (Images Indexing Strategy Cell Refinement Integration History) can be selected byclicking on the appropriate icon but those that are not appropriate will be greyed-out and cannot be selected
21 Drop Down menus
Clicking on Session will result in a drop-down menu that allows you to save the current session or reload a previously saved session(or readsave a site file (see sect141) or add images or since 720 write a spots file)
iMosflm Tutorial
fileUsersandrewg4MOSFLMnewgui_tutorialiMosflm_tutorial_720_ver3html[29052015 105311]
Clicking on Settings will allow you to see (and modify) Experiment settings Processing options and Environment variables
The Experiment settings option has two tabs Experiment and Detector
In the Experiment tab experimental parameters (beam position detector distance beam divergence and polarisation wavelength anddetector Two Theta angle can be modified There is also a tick box to deal with beamlines where the phi rotation is in the oppositesense to the conventional one These parameters are read from the image header but if they are wrong they can be corrected here
The Detector tab lists the current values of the refineable detector parameters the detector gain ADC offset and pixel size (in mm)There is a Reset button that will reset all refineable detector parameters to their initial values This should be used if parameters haverefined to unreasonable values either because they are poorly defined or because an incorrect indexing soltuion has been used tointegrate images A pop-up warning message will be given in such cases and parameters can also be reset from this pop-up window
Processing options will open a window with six tabs Spot finding Indexing Processing Advanced refinement Advanced integrationand Sort Scale and Merge This allows parameters associated with these processing steps to be changed and provides additional optionssuch as pattern matching orientation refinement (see 84) addition of Pilatus images to assist in detector parameter refinement and
iMosflm Tutorial
fileUsersandrewg4MOSFLMnewgui_tutorialiMosflm_tutorial_720_ver3html[29052015 105311]
smoothing of missetting angles (see 96) Situations in which it may be useful to modify these parameters will be described in theappropriate section of the tutorial A summary is provided in the Tips section
Environment variableswill not normally require any changes
The three small icons below Session allow you to start a new session open a saved session or save the current session Moving themouse over these icons will result in display of a tooltip describing the action taken if the icon is clicked
3 Adding images to a sessionTo add images to a session use the Add images icon
Select the correct directory from the pop-up Add Images window (the default is the directory in which iMosflm was launched) All fileswith an appropriate extension (which can be selected from the File type) will be displayed
Note that for images where the image number is given as the extension (eg my_xtal001) you will need to select Numbered files as theFile type
Double-clicking on any file will result in all images with the same template being added to the session The template is the whole partof the filename prefix except the number field which specifies the image number An alternative is to single-click on one imagefilename and then click on Open
To open one or several images only check the Selected images only box and then use click followed by Shift+click to select a range ofimages or Control+click to select individual image files as required
Loaded images will be displayed in the Images window with the start amp end phi values displayed (as read from the image header)
iMosflm Tutorial
fileUsersandrewg4MOSFLMnewgui_tutorialiMosflm_tutorial_720_ver3html[29052015 105311]
All images with the same template belong to the same Sector of data
Multiple sectors can be read into the same session Each sector can have a different crystal orientation
Note that a Warning has appeared Click anywhere on the ldquowarnings 1rdquo text to get a brief description of the warning In this case it isbecause the direct beam coordinates stored in the MAR image plate images are not trusted by MOSFLM and the direct beam coordinateshave been set to the physical centre of the image Click on the X on the right hand side to dismiss this warning click anywhere outsidethe warning box to collapse the box double-click the warning text itself and more details hints and notes may be available fromMOSFLM
The direct beam coordinates (read from the image header or set by MOSFLM) and crystal to detector distance are displayed Thesevalues can be edited if they are not correct
iMosflm Tutorial
fileUsersandrewg4MOSFLMnewgui_tutorialiMosflm_tutorial_720_ver3html[29052015 105311]
Advanced Usage
1 The phi values of images can be edited in the Image window First click on the Image line to highlight it then click with the mouseover the phi values to make them editable allowing new values to be given These new values are propagated for all followingimages in the same sector Starting values for the three missetting angles (PHIX PHIY PHIZ) may also be entered following theimage phi values
2 To delete a sector click on the sector name to select it (it turns blue) then use the right mouse button on the sector to bring up adelete button Move the mouse over the delete button (it turns blue) and click to delete the sector and its images Individualimages can be deleted from the Images pane in the same way
3 If one sector is added and used for indexing and then a second sector from the same crystal is added the matrix for the secondsector will not be defined To define it double-click on the matrix name for the first sector save it to a file double-click on thematrix name (Unknown) for the new sector and read the matrix file written for the first sector Alternatively it is possible to dragand drop the matrix from the first sector onto the second sector (drop onto the sector itself not the Matrix for the secondsector)
4 Image DisplayWhen images are added to a session the first image of the sector is displayed in a separate display window
iMosflm Tutorial
fileUsersandrewg4MOSFLMnewgui_tutorialiMosflm_tutorial_720_ver3html[29052015 105311]
The Image drop-down menu allows display of the previous or next image in the series (but this is easier to perform using the bluearrows displayed before the image name)
The View drop-down menu allows the image to be displayed in different sizes (related by scale factors of two) based on the imagesize and the resolution of the monitor
iMosflm Tutorial
fileUsersandrewg4MOSFLMnewgui_tutorialiMosflm_tutorial_720_ver3html[29052015 105311]
The Settings drop-down menu allows the colour of the predictions to be changed (see Indexing sect52 for the default colours) and thesize of the Pick box to be changed The third option (image summation) determines whether summed images are calculated byaddition or by taking the maximum or minimum values Only addition is implemented
The line below allows selection of different images either using right and left arrow or selecting one from the drop-down list of allimages in that sector Alternatively the image number can be typed into the Go to entry box
For Pilatus images only the Sum entry box will allow the display of the sum of several images the number (up to 20) can be chosenfrom the drop-down list
The image being displayed can also be changed by double-clicking on an image name in the Images pane of the main iMosflmwindow This will also re-active the image window if it has been closed
+ and - will zoom the image without changing the centre The Fit image icon will restore the image to its original size (right mousebutton will have the same effect) The Contrast icon will give a histogram of pixel values Use the mouse to drag the vertical dottedline to the right to lighten the image to the left to darken it Try adjusting the contrast The Lattice entry window can be used whenprocessing images with multiple lattices present see multiple lattices sect53
The reverse video icon allows an image to be rendered as light spots on a dark background that can help visualise small diffractionspots (eg for data collected using a Pilatus detector)
41 Display Icons
The eight icons on the left control the display of the direct beam position (since 720 a magenta cross not a green one) spots foundfor indexing bad spots predicted spots masked areas spot-finding search area resolution limits and display of the active mask forRigaku detectors respectively Clicking on these items will turn their display on or off
These are followed by icons for Zoom Pan and Selection tools and tools for adding spots manually (for indexing) editing masks circlefitting and erasing spots or masks
Next on this toolbar are the entry boxes for h k amp l and a button to search for this hkl among the predicted spots displayed on theimage The button resembles a warning sign if the given hkl cannot be found but a green tick if it is found The final icon relates toprocessing images with multiple lattices (see multiple lattices sect53) and is not described here
411 Masked areas - circular backstop shadow
Select the masked area icon A green circle will be displayed showing the default position and size of the backstop shadow
Make sure that the Zoom icon (magnifying glass) is selected and use the left-mouse-button (abbreviated to LMB in following text) todrag out a rectangle around the centre of the image The inner dotted yellow rectangle will show the part of the image that will actuallyappear in the zoomed area
iMosflm Tutorial
fileUsersandrewg4MOSFLMnewgui_tutorialiMosflm_tutorial_720_ver3html[29052015 105311]
Choose the Selection Tool When placed over the perimeter of the circle the radius of the circular backstop shadow will be displayedUse the LMB to drag the circle to increase its diameter to that of the actual shadow on the image The position of the circle can beadjusted with LMB placed on the cross that appears in the centre of the green circle Adjust the size and position of the circle so that itmatches the shadow
412 Masked areas - general exclusions
Choose the Masking tool Any existing masked areas will automatically be displayed Use LMB to define the four corners of the region tobe masked When the fourth position is given the masked region will be shaded This region will be excluded from spot finding andintegration This provides a powerful way of dealing with backstop shadows To edit an existing mask choose the Selection tool and usethe LMB to drag any of the four vertices to a new position
To delete a mask choose the Spot and mask eraser tool Place the mouse anywhere within the shaded masked area and use LMB todelete the mask Delete any masks that you have created
413 Spot search area
Select the Show spotfinding search area icon The inner and outer radii for the spot search will be displayed as shown below If theimages are very weak the spot finding radius will automatically be reduced but this provides additional control
Either can be changed by dragging with the LMB Do not change the radii for these images
iMosflm Tutorial
fileUsersandrewg4MOSFLMnewgui_tutorialiMosflm_tutorial_720_ver3html[29052015 105311]
Advanced Usage
The red rectangle displays the area used to determine an initial estimate of the background of the image It is important that this doesnot overlap significant shadows on the image It can be shifted laterally or changed in orientation (in 90deg steps) by dragging with theLMB
414 Resolution limits
Select the Show resolution limits icon The low and high resolution limits will be displayed The resolution limits can be changed bydragging the perimeter of the circle with LMB (make sure that the Selection Tool has been chosen) The resolution limits will affectStrategy Cell refinement and Integration but not spot finding or indexing The low resolution is not strictly correct (it falls within thebackstop shadow) but does not need to be changed because spots within the backstop shadow will be rejected
415 Zooming and Panning
First select a region of the image to be zoomed with the Zoom tool
Select the Pan tool and pan the displayed area by holding down LMB and moving the mouse This is very rapid on a local machine butmay be slow if run on a remote machine over a network
416 Circle fitting
The circle fitting tool can be used to determine the direct beam position by fitting a circle to a set of points on a powder diffraction ringon the image (typically due to icing) or to fit a circular backstop shadow (although using the masking tool is probably easier)
Select the circle fitting tool Three new icons will appear in the image display area There are two (faint) ice rings visible on the image at391Aring and 367Aring Click with LMB on several positions (6-8) on the outer ring (as it is slightly stronger) Then click on the top circularicon
A circle that best fits the selected points (displayed as yellow crosses) will be drawn and the direct beam position at the centre of thiscircle will be indicated with a green cross The direct beam coordinates will be updated to reflect this new position
iMosflm Tutorial
fileUsersandrewg4MOSFLMnewgui_tutorialiMosflm_tutorial_720_ver3html[29052015 105311]
5 Spot finding indexing and mosaicity estimationWhen images have been added the Indexing operation becomes accessible (it is no longer greyed-out)
Click on Indexing This will bring up the major Indexing window in place of the Images window
51 Spot Finding
By default the first image and a second image 90 degrees away in phi (or as close to 90 as possible) will be selected and a spot searchcarried out on both images (This is controlled by the Automatically find spots on entering Autoindexing tick box in the Spot finding tabof Processing options)
Found spots will be displayed as crosses in the Image Display window (red for those above the intensity threshold yellow for thosebelow) Only those above the threshold will be used in indexing The intensity threshold normally defaults to 20 but will beautomatically reduced to 10 or 5 for weak images The threshold is determined by the last image to be processed
The number of spots found together with any manual additions or deletions are also given
Images to be searched for spots can be specified in several ways
1 Simply type in the numbers of the images (eg 1 84 above)
iMosflm Tutorial
fileUsersandrewg4MOSFLMnewgui_tutorialiMosflm_tutorial_720_ver3html[29052015 105311]
2 Use the Pick first image icon (single blue circle)
3 Use the Pick two images ~90 apart icon (two blue circles) This is the default behaviour
4 Use the Select images icon (multiple circles) If selected all images in the sector are displayed in a drop-down list Click on aimage to select it then double-click on the search icon (resembling a target in the colum headed Find) for that image to run thespot search The image will move to the top of the list (together with other images that have been searched)
Images to be used for indexing can be selected from those that have been searched by clicking on the Use button If this box waspreviously checked then clicking will remove this image from those to be used for indexing It can be added again by clicking theSelect images icon and clicking on the Use box
Before indexing always check by looking at the image display that the spot finding has worked correctly ie that most spots thatyou can see have been found that multiple crosses have not been drawn over the same spot that spots have not been placedover ice rings or ice spots Check all images that will be used in indexing
511 If the spot finding has not worked well
Parameters affecting the spot search can be modified by selecting the Settings drop-down window and selecting Processing optionsThe resulting new window contains six tabs relating to Spot finding Indexing Processing Advanced refinement Advanced integrationand Sort Scale and Merge
The Spot finding tab allows the Search area Spot discrimination parameters Spot size parameters Minimum spot separation andMaximum peak separation within spots (to deal with split spots) to be reset It also allows the choice between a local backgrounddetermination (preferred) and a radial background determination The local background method also uses an improved procedure forrecognising closely spaced spots The only parameters commonly changed are
1 Minimum spot separation This should be the size (in mm) of an average spot (not a very strong spot) If there are badly split spotsthe spot finding may place two (or more) crosses for a single diffraction spot To avoid this happening set the minimumseparation in X and Y to values equal to the spot size in mm This can be found by zooming the image and counting the number ofpixels across the spot horizontally (X) and vertically (Y) To convert this to mm use the pixel size as given in Settings -gtExperiment settings -gt Detector This separation parameter is very important when spots are very close but usually the programwill determine a suitable value
2 Minimum pixels per spot Default value 6 but this should be reduced automatically if spots are very small (eg when using in situscreening and microfocus beam) If there clearly are spots present and the spot size is very small try reducing this parameter to 3or 2
3 Local background box size Reducing this from 50 to (say) 20 can reduce the number of false spots found near any sharp shadowon the image (or tile boundaries for tiled detectors) Normally these false spots are weak (and will be drawn as yellow crosses) inwhich case they will not affect the indexing
For data collected in-house the spots can be quite large and rather weak In such cases the spot finding parameters are automaticallychanged but some improvement may still be obtained by the following
1 Reduce the spot finding threshold (default 35) eg to 2
2 Change the minimum number of pixels per spot (default 30) to 20 or 40
3 Set the minimum spot separation to a sensible value eg 15mm see above
52 Indexing
Providing there are no errors during spot finding indexing will be carried out automatically after spot finding (This is controlled by theAutomatically index after spot finding tick box in the Indexing tab of Processing options) If the image selection or indexingparameters are changed the Index button must be used to carry out the indexing
iMosflm Tutorial
fileUsersandrewg4MOSFLMnewgui_tutorialiMosflm_tutorial_720_ver3html[29052015 105311]
Autoindexing will be carried out by MOSFLM using spots (above the threshold) from the selected images The threshold is set byMOSFLM but can be changed using the entry box in the toolbar The list of solutions sorted by increasing penalty score will appear inthe lower part of the window The preferred solution will be highlighted in blue There will usually be a set of solutions with lowpenalties (0-20) followed by other solutions with significantly higher penalties The preferred solution is that with the highest symmetryfrom the group with low penalty values
Note that all these solutions are really the same P1 solution transformed to the 44 characteristic lattices with lattice symmetryconstraints applied Therefore if the P1 solution is wrong then all the others are wrong as well
For solutions with a penalty less than 50 the refined cell parameters (ref) will be shown This can be expanded (click on the + sign) toshow the reg unrefined but regularised cell (symmetry constraints applied) and the raw cell (no symmetry constraints applied)
The rms deviation (rmsd) or error in predicted spots positions (σ(xy) in mm) and the number of spots used to refine the solution aregiven for each solution
Usually the penalty will be less than 20 for the correct solution although it could be higher if there is an error in the direct beamcoordinates (or distancewavelength) The rmsd (error in spot positions) will typically be 01-02mm for a correct solution but if thespots are split or very elongated it can be as high as 1mm or higher
The predicted spot positions for the highlighted solution will be shown on the image display with the following default colour codes
Blue Fully recorded reflectionYellow (orange for Pilatus) Partially recorded reflection
iMosflm Tutorial
fileUsersandrewg4MOSFLMnewgui_tutorialiMosflm_tutorial_720_ver3html[29052015 105311]
Red Spatially overlapped reflection these will NOT be integratedGreen Reflection width too large (more than 5 degrees) not integrated
These colours may be adjusted via the Settings -gt Prediction colour item in the Image display window
Providing there are no errors in the indexing MOSFLM will automatically estimate the mosaic spread (mosaicity) based on the preferredsolution
Select other solutions with a higher penalty and see how well the predicted patterns match the diffraction image
The rmsd and visual inspection of the predicted pattern are the best ways of checking if a solution is correct If the agreement is notgood then the autoindexing has probably failed
It is often worth repeating the indexing (once) as the refined direct beam coordinates from the first indexing may give animproved solution (lower rmsd)
521 If the indexing fails - Direct beam search
The indexing is very sensitive to errors in the direct beam coordinates For a correct indexing solution the error should be less than halfthe minimum spot separation Check for example that the current direct beam position is behind the backstop If there are any icerings these can be used to determine the direct beam position (see Circle fitting sect416 )
If the accuracy of the direct beam coordinates (generally read from the image header) is uncertain the program can perform a gridsearch around the input coordinates The number and the size of the steps can be set from the Indexing tab of the Processing optionsmenu (see Settings - Processing options sect21) but defaults to two steps of 05mm on each side of the input coordinates The directbeam search is started by clicking on the Start beam search button in the Indexing pane While in progress it can be stopped byclicking the Abort beam search button
The indexing will be carried out for each set of starting coordinates (Beam x and Beam y in the table which appears) and if a solution isfound the refined beam coordinates (Beam x ref Beam y ref) the unit cell parameters of the triclinic solution and the rmsd error in spotcoordinates and in phi will be listed The correct solution will generally be the one with the smallest rms error in spot positions (σ(xy))To make it simpler to identify the correct solution once the grid search has finished the solutions will be sorted on σ(xy) so the correctsolution will be at the top of the list When sorting the solutions those which have smaller cell parameters will be listed first as it ispossible to have a small σ(xy) value for an incorrect solution with a much larger unit cell Beware of solutions at the top of the list wherethe cell is clearly too small (only happens rarely)
Note that only the triclinic (P1) solution will be listed
If there is now a solution with a smaller rmsd value than before and especially if more than one set of starting beam coordinates has thesame refined coordinates this is a good indication that the beam search has worked Note that if the initial beam coordinates werewrong by more than ~15mm the search may not work In this case either select a new starting position for the direct beam or changethe number of steps
To complete the indexing double-click on the chosen solution and the full indexing will carried out for these beam coordinates withthe solutions appearing in the upper window The results of the direct beam search can be hidden (collapsed) by clicking on the Hidebutton and recovered by clicking on the Show button
iMosflm Tutorial
fileUsersandrewg4MOSFLMnewgui_tutorialiMosflm_tutorial_720_ver3html[29052015 105311]
522 If the indexing fails - Other parameters
Errors in other physical parameters (wavelength crystal to detector distance) can also result in failure All these parameters should bechecked
Several parameters used in autoindexing can also be adjusted using entry fields and buttons that appear in the Indexing toolbar
Weak images
1 MOSFLM automatically reduces the Iσ(I) threshold for weak images and it may also reduce the resolution to 4Å but lower valuescan be tried It is important not to include spots that are not real - a small number of false spots can prevent the indexing fromworking
2 Try changing parameters for spot finding (see If the spot finding has not worked well sect511)
Multiple lattices
1 Try increasing the Iσ(I) threshold (default 20) for example to 40 or 60 so that only spots from the stronger lattice are selectedThis can be done by entering a new value in the leftmost of the circled icons above (and also via the Indexing tab of Processingoptions)
All cases
1 Include more images in the indexing Select images that are widely spaced in phi not close together2 Select images that show the clearest lunes andor have the best spot shape3 In case the crystal orientation has changed or if you are unsure of the direction of positive rotation in phi try indexing using only
one image4 Make sure that the Max cell edge value is not too small If in doubt set to 200 Aring (or more if the cell is expected to be large)5 If the cell parameters are known reduce the maximum allowed cell edge to the known maximum cell edge This can sometimes
help filter incorrect solutions but use with caution as often this needs to be ~twice the largest cell for successful indexingAlternatively try the known cell option
6 If the detector distance is uncertain and the images are high resolution (eg 2Å) allow the detector distance to refine during cellrefinement Use with caution
53 Indexing multiple lattices simultaneously
This is a new feature and is still undergoing development It is most likely to succeed when the different lattices are clearly separated atleast at higher resolution If the images shows badly split spots with several components (each arising from a sub-crystal with a slightlydifferent orientation) then indexing may well still be impossible
After spot finding examine the image to ensure that spots that are close to each other but belong to different lattices have beenidentified as separate spots and not treated as a single split spot (in which case the red cross will lie midway between the two spots)Adjusting the minimum spot separation (Settings -gt Processing options -gt Spot finding) can help in resolving close spots It may alsohelp to increase the inner radius of the spot search region (see Spot search area sect413) so that low resolution reflections where the
iMosflm Tutorial
fileUsersandrewg4MOSFLMnewgui_tutorialiMosflm_tutorial_720_ver3html[29052015 105311]
spots are not really separated are excluded from the search
The following procedure usually provides the best chance of success
1 Select appropriate images for use in indexing The separation of the lattices can be clearer on some images than others Ideallychoose several images widely separated in phi
2 Do a normal (single lattice) indexing first This will usually work but will give a high positional rmsd because of the presence of morethan one lattice This step is important because it will result in more accurate direct beam coordinates which are crucial for multi-lattice indexing
3 Select the ldquoIndex multiple latticesrdquo icon (next to the Index button) the Index button will change to Index multiple
The indexing results for different lattices will be presented in different tabs while the selected solution for each lattice will be shown inthe lower Summary window Currently a maximum of 5 lattices can be handled The figure below shows a case where 3 differentlattices were found
4 Judge the success of indexing by examining the lattice type and the cell parameters obtained for the different lattices (the cellsshould be very similar) and checking that the predictions match the observed spots The rmsd values for correct lattices should also besignificantly smaller than the value obtained in the initial (single lattice) indexing It may be necessary to manually select a differentautoindexing solution for some lattices in order to get the same lattice type (eg oP) for the different lattices
The Split column in the lower pane indicates the angle between the reference lattice (with value -) and the other lattices This is onlycalculated when the lattices have the same lattice type In this case the angles between lattice 1 and lattices 2 amp 3 are 34 and 16degrees
If a lattice is clearly incorrect it can be deleted by highlighting that lattice (in the lower pane that summarises the results) and using theright mouse button to select ldquodeleterdquo
The predictions for different lattices can be displayed either by highlighting the lattice in the Summary window or by using the latticeselector in the image display pane
iMosflm Tutorial
fileUsersandrewg4MOSFLMnewgui_tutorialiMosflm_tutorial_720_ver3html[29052015 105311]
In the image display spots in different lattices that overlap with each other are shown in magenta Only the summed intensity will bemeasured for these reflections
The predictions for all lattices can be shown by selecting the ldquomerge latticesrdquo icon in the image display
This can be useful to check if all the lattices have been successfully indexed because all spots in the image should then be predicted Inthe display predictions from lattice 12345 are shown in blue yellow red green and magenta with no distinction made between fullyand partially recorded reflections or spatial overlaps
iMosflm Tutorial
fileUsersandrewg4MOSFLMnewgui_tutorialiMosflm_tutorial_720_ver3html[29052015 105311]
531 Practical Tips
Beware of solutions where the lattices only vary in orientation by a small angle (less than 1 degree) as these are often different solutionsfor the same lattice The difference in orientation between lattices is given by the ldquosplitrdquo column in the Summary window but this is onlycalculated if the lattices have the same lattice type Differences are all relative to one lattice which will display a split angle as ldquo-ldquo Tocalculate the angles relative to a different lattice open the tab for that lattice select a different solution to that currently selected andthen select the original solution ndash this will trigger recalculation of the split angles relative to that lattice
Other parameters that can influence the indexing are the rdquoMaximum deviation from integral hklrdquo (default 02 when indexing multiplelattices otherwise 03) and ldquoNumber of vectors to find for indexingrdquo (default 30) These can be changed via the Indexing tab of theldquoProcessing Optionsrdquo that can be selected from the ldquoSettingsrdquo menu item Values between 015 and 025 might be helpful for the firstparameter and increasing the number of vectors from 30 to 50 can also help At present there is no defined protocol for changing thedefault parameter values for particular cases it has to be done by trial and error
Experience so far has shown that selecting appropriate images and adjusting the maximum cell length used in indexing have the biggesteffect The optimum value for the maximum cell length will normally lie between one and three times the largest cell dimension but it isworth varying this in steps of between 25 and 50 Aring as the indexing can be very sensitive to this parameter
For a more complete discussion of multiple lattice indexing see Powell HR Johnson O amp Leslie AGW 2013 Autoindexingdiffraction images with iMosflm Acta Cryst D69 1195-1203
54 Known cell option
For images that are very difficult to index if the cell parameters are known the known cell option can be usedSelect the ldquoKnown cellrdquo icon (next to the Multiple lattices icon) Enter the cell parameters in the Input known cell pop-up window andselect OK when all 6 parameters have been provided Then select the Index Cell button
To revert to normal indexing select the ldquoKnown cellrdquo icon and then select Clear in the Input known cell pop-up window
55 Space group selection
Note that the indexing is based solely on information about the unit cell parameters It will therefore be very difficult (or impossible) todetermine the correct Laue group in the presence of pseudosymmetry For example a monoclinic space group with β ~ 90deg will appearto be orthorhombic an orthorhombic space group with very similar a and b cell parameters will appear to be tetragonal These can onlybe distinguished when intensities are available (ie after integration) by running POINTLESS (QuickSymm) (see Running Pointless to check the
iMosflm Tutorial
fileUsersandrewg4MOSFLMnewgui_tutorialiMosflm_tutorial_720_ver3html[29052015 105311]
symmetry sect10)
In addition it is not possible to distinguish between Laue Groups 4m and 4mmm 3 and 3m 6m and 6mmm m3 and m3m Thiswill not affect integration of the images but it will affect the strategy calculation In the absence of additional information the lowersymmetry should be chosen for the strategy calculation to ensure that a complete dataset is collected
The presence of screw axes also cannot be detected so there is no basis on which to distinguish P21 from P2 etc This does not affectany aspect of data collection or processing and can be chosen (on the basis of systematic absences) after integration by runningPOINTLESS
In this example there is no way of knowing at this stage if the space group is h3 or h32 so leave it as h3
56 Mosaicity estimation
If the Automatically index after spot finding option has been chosen (Indexingtab of Processing Options) the mosaicity (mosaic spread) will be estimatedautomatically for the preferred solution However if another solution is chosenthe mosaicity should be estimated again
Click on the Estimate button to estimate the mosaicity
A window will appear which plots the total predicted intensity as a function ofmosaic spread from which an estimate is determined
The predictions displayed on the image will be updated Entering different valuesof mosaic spread in the box (followed by return) will allow a visual estimate of theeffect of changing the mosaic spread
The mosaic spread can also be entered in the Images pane by clicking once on theMosaicity line and once again on the value displayed
561 The mosaic block size
In some cases the apparent mosaic spread is much larger at low resolution than at high resolution so that if it is set to a value thatresults in all the low resolution spots being predicted many more spots are predicted than are visible at high resolution This effect isbest dealt with by adjusting the Mosaic block size which is also displayed in the Images pane This is modelling the size in microns ofthe individual mosaic blocks in the crystal Decreasing this to values of 05-5 microns (say) from the default of 100 microns will resultin predicting more spots at low resolution but have virtually no effect at high resolution This parameter is not refined (at present) andso the best value must be determined by trial and error
6 Saving and recovering a sessionThe session can be saved at any time using the Session drop-down menu referred to in sect21 The first time that a session is saved youwill be prompted for a filename The filename convention for saved session files is that the extension is mos
Save the current session Then exit from iMosflm (using the Session drop-down menu) restart iMosflm and read in the saved session
If the program crashes it should be possible to recover all but the latest actions as a temporary copy of the session file is continuallysaved to the directory mosflm in the users home directory
Restart iMosflm and it will pop up a Recover session window
Selecting the Recover button will restore the session as far as possible
iMosflm Tutorial
fileUsersandrewg4MOSFLMnewgui_tutorialiMosflm_tutorial_720_ver3html[29052015 105311]
7 Data collection strategyOnce the crystal orientation and (probable) Laue group have been determined it is possible to calculate a data collection strategy andthe Strategy icon is no longer greyed-out (in fact all other operations Strategy Cell Refinement and Integration become possible at thispoint)
Select the Strategy icon This will open the Strategy window
The statistics initially presented in the window are based on the images read in to the current session If only two (or more) references
iMosflm Tutorial
fileUsersandrewg4MOSFLMnewgui_tutorialiMosflm_tutorial_720_ver3html[29052015 105311]
images have been read in no statistics will be presented
When the Strategy option is used after two initial images (typically 90deg apart in φ) have been collected a complete shaded segment willnot be shown in the lower part of the screen rather an empty circle will be shown with the matrix label beneath it Click the Auto-complete button and in the pop-up menu that appears select a rotation angle or sweep of data to collect - or leave the Rotationsetting as Auto for a calculation of maximum completeness for this crystal orientation Click on Ok and the completeness results willbe presented
The orientation of the crystal expressed as the angles between the abc unit cell axes and the XYZ coordinate frame is given X isalong the X-ray beam Z is the rotation axis A warning will be given if the unique axis is so close to the rotation axis that there will bemissing cusp data
71 Evaluating completeness manually
The completeness of any given segment of data can be determined manually using the circle at the bottom left of the window Click onthe red segment shown in this circle
This will result in small black boxes being drawn on the circumference at the start and end of the red sector
Use the LMB to click on the black box at 0 and drag this around the circle
When the LMB is released the statistics for that sector will be displayed The statistics are presented in two ways Near the top right ofthe window the overall completeness is shown as red circles for unique data and anomalous pairs The average multiplicity is givenbeneath these circles
More detailed statistics (such as completeness as a function of resolution) are given in a series of histograms that can be selected by adrop-down menu
72 Calculating a strategy automatically
Uncheck the Use checkbox at the right side of the hg_001 line listed in the sector list near the top of the Strategy pane This means
iMosflm Tutorial
fileUsersandrewg4MOSFLMnewgui_tutorialiMosflm_tutorial_720_ver3html[29052015 105311]
that the 84 images used thus far will not be included in the completeness calculation only the matrix derived from indexing them willbe used Select the Auto-complete button to calculate a strategy automatically
A strategy calculation data pop-up window will appear
If multiple matrices have been defined (for different sectors of data) then the appropriate one can be selected (if there is only one sectorthis has no effect)
The total φ rotation to be used is normally calculated by MOSFLM based on the Laue group and the crystal orientation (the Auto setting)However it is sometimes possible to achieve a high completeness with a significantly smaller total rotation (eg 60deg in two 30degsegments will typically give gt94 completeness for orthorhombic space groups) and this can sometimes be useful if radiation damage isa serious problem although when using hybrid pixel detectors it is better to use a very conservative exposure time and collect a wide φrotation
Total rotation angles of between 5deg and 90deg can be selected from the drop-down list The number of segments to be used can be setbetween 1 and 3
If the check box is checked data completeness will be calculated to optimize the proportion of anomalous data collected
THIS IS IMPORTANT The optimum strategy is often different when maximising completeness of the anomalous data
Choose the default values (Rotation Auto Segments 1) but check the anomalous data box then click on Ok Look at the variousstatistics presented as bar charts
In space group H3 if rotating around the c axis a total rotation of 120deg would be required to collect a complete dataset (ignoring anydata lost in the cusp) Because the c axis is 22deg away from the rotation axis in this case it is possible to collect very high completeness(for unique data) with a rotation much smaller than this
Try to find the minimum total rotation that will give a dataset that is gt95 complete for the unique data Now do the same butrequiring gt95 completeness for the anomalous data
SKIP OVER SECTION 73 IF DOING THE NORMAL TUTORIAL
73 Calculating a strategy using multiple crystals
The Strategy pane may also be used when due to radiation damage many crystals are required to collect a complete dataset
IMPORTANT This procedure will only work correctly for space groups where there is no indexing ambiguity For those spacegroups where there is an indexing ambiguity( see httpwwwccp4acukdisthtmlreindexinghtml for a complete list) it isnecessary to integrate images to determine whether different crystals have been indexed in the same way This is not achievablewithin the Strategy option at present
Suppose the first crystal has been indexed from the reference images
Enter the Strategy pane an empty circle is displayed in the bottom part of the screen and click on the Auto-complete button nearthe top-right of the pane In the Auto-complete window that appears choose a suitable Rotation angle for the amount of datathat can be collected from one crystal say 20 degrees for this example Leave Segments set to 1 and do not check Optimize foranomalous data
Click the Ok button and the completeness of the data will be displayed The matrix name start and end phi values and the phiextent will be displayed in the top area of the pane with a checkbox ticked under the Use column This means this segment will beused in further strategy calculations
Accept and save this result by clicking on the yellow hatched segment displayed in the large circle near the bottom of the paneClick once and the segment will be outlined in black (you can adjust the start or end phi value calculated in one degree incrementsby click+dragging the respective black square) click again this time on the black square denoting the start or end phi (or release ifyou have adjusted by click+dragging) and the segment will turn red The segment will not be saved unless it has turned red
This result will be saved if you leave this pane (eg to load more images) and return later in this session The strategy file can alsobe saved to a permanent file using the Save button on the tool-bar This is highly recommended when working with many crystals
Return to the Strategy pane when you have loaded and indexed the reference image(s) from the second crystal and repeat the procedureabove You will see the calculated segment from the first matrix displayed at the bottom-left of the screen The optimum phi range for
iMosflm Tutorial
fileUsersandrewg4MOSFLMnewgui_tutorialiMosflm_tutorial_720_ver3html[29052015 105311]
the second crystal will be displayed Save this in the same way as for the first crystal (clicking twice) Repeat this procedure for anysubsequent crystals and in each case the optimum phi range will be calculated for the latest crystal taking into account the data fromprevious crystals
It is a good idea to save the strategy to a file as each new crystal is added in case the program crashes and this information is lost
In practice it is probably safest to have a separate iMosflm session that is reserved for the strategy calculations and not used to processany data The strategy for each new crystal can be calculated as described above If there is a problem and the session is corrupted or ifiMosflm is closed down for any reason it is straightforward to restore the status of the session providing the strategy has been savedThe following steps should be taken
1 Read in the reference images for the latest crystal and index them
2 Select the Strategy pane
3 Read in the optimised strategy for all previous crystals using the ldquoAddrdquo button and giving the appropriate filename
4 Making sure that the circle for the latest crystal is highlighted in the lower left window click on lsquoAuto-completersquo and follow the stepsdescribed above
Advanced Usage
The startend phi values for each crystalmatrix can be updated This might be required if for example only 10 degrees of useful datawere collected from a particular crystal instead of the anticipated 20 degrees To change the phi values click either on the matrix namein the top pane or on the circle showing the segment of data in the lower left pane (these are highlighted in a blue box as the mousemoves over them) The corresponding segment will now be displayed in the larger circle Click on the red segment so that a blacksquare appears at the startend phi values Then simply drag the appropriate phi to the desired value The completeness willautomatically be updated (but the strategy calculation for the latest crystal will not be repeated to do this the current segment must bedeleted by highlighting the matrix name and using right click and then repeating the Auto-complete step)
If matrix files saved from iMosflm are available from crystals for which data have been collected in previous sessions these can beadded into the calculation using the Add matrix button on the tool-bar
If the saved strategy result has become complicated or is incorrect and you wish to restart the calculations afresh there is a tool-barbutton Reload sectors from session This will remove any calculated sectors while leaving any known matrices listed at the bottom-leftof the Strategy pane
If you have saved a strategy file from a previous session this can be used to re-initialize the Strategy pane using the Load button onthe tool-bar
A Spacegroup pull-down menu has been added to the tool-bar to permit different choices of space group to be used in thecalculations (eg H3 and H32) This menu is populated from the list offered on the Indexing pane However the space group symboltext is editable Any space group symbol entered will be validated by Mosflm together with the current cell parameters
As a calculator for a multi-segment strategy the Strategy pane is reasonably flexible you can Save or Delete highlighted matrix lines byright-clicking As you highlight different matrix lines the orientation of the crystal expressed as the angles between the abc unit cellaxes and the XYZ coordinate frame is re-displayed in the centre of the pane
The following screen shot shows the cumulative results in the Strategy pane after this procedure has been followed for four crystals(ignore the iMosflm version number)
iMosflm Tutorial
fileUsersandrewg4MOSFLMnewgui_tutorialiMosflm_tutorial_720_ver3html[29052015 105311]
731 Calculating a strategy when some data have already been collected and processed
This option is not yet implemented If data have already been processed (to give an MTZ file) but the images are not currently available (eg they were collected on a previoussynchrotron trip possibly at a different synchrotron) then the MTZ file containing this data can be read and used to calculate a strategyfor data collection from new crystalsThe MTZ icon in the tool bar is used to read the MTZ file
74 Calculating a suitable oscillation angle
To calculate the maximum possible oscillation angle while avoiding spatial overlaps click on the Check for overlaps button A pop-upwindow will appear from which the option to calculate the maximum oscillation angle (as a function of φ) or check how many overlapswill occur for different (user selected) oscillation angles The results are plotted in the same pane as the histograms for the strategycalculations Note that the overlap calculation is based on the current values for the mosaic spread and spot separation and can be verysensitive to these values Note also that these are maximum and not necessarily recommended oscillation angles
iMosflm Tutorial
fileUsersandrewg4MOSFLMnewgui_tutorialiMosflm_tutorial_720_ver3html[29052015 105311]
8 Cell refinementIt is important to determine the cell parameters accurately before integrating the images Although the unit cell is refined as part of theautoindexing providing the diffraction extends beyond ~35Å resolution it is possible to obtain more accurate cell parameters using aprocedure known as post-refinement This procedure requires the integration of a series of images in ideally two or more separatesegments at widely different φ values The distribution of the intensity of partially recorded reflections over the images on which theyoccur is used to refine the unit cell crystal orientation and mosaic spread
Select the Cell Refinement icon
81 Selecting the images
iMosflm Tutorial
fileUsersandrewg4MOSFLMnewgui_tutorialiMosflm_tutorial_720_ver3html[29052015 105311]
There are several ways to select the images to be used in cell refinement Whichever method is used the image numbers will bedisplayed in the Images entry field iMosflm will automatically select appropriate images but these can be changed
811 Manual selection
A list of images can simply be typed into this box An image series can be specified as n-m where n and m are the first and last imagesDifferent series must be separated by white space or comma
For orthorhombic or higher symmetries two segments should be given approximately 90deg apart in φ For monoclinic or triclinic datathree or four segments are best (eg φ = 04590135)
The number of images that should be included in each segment depends on the mosaic spread and oscillation angle A reasonablenumber is 2(mosaic spreadoscillation angle +1) MOSFLM will automatically select two or more segments as appropriate Note thatthere is a limit on the total number of images that can be used
812 Automatic selection
Selecting the Automatically select images icon will select a suitable set of images
813 Graphical selection (Not recommended)
Selecting this icon will give a new window
Images can be selected by clicking in the Use check-box in the list of images or by using the mouse to drag a selection of imagesfrom the sector displayed The other icons allow the sector to be zoomed in or out and the viewed area to be moved to make theselection easier The final two icons on the tool-bar switch the segment display to fit the display space as either a full circle or aquadrant This Image palette can be closed by clicking outside its area but will close after 60 seconds anyway
82 Integrating the images and refining the cell
Use one of the methods above to select images to use in cell refinement and click on the Process button Before starting cell refinementcheck that the prediction for the first image in each segment to be used is good The majority of the spot positions must be correctlypredicted for the first image in each segment or else the refinement will not work
The selected images will be integrated and following integration the cell parameters are refined Selectable refined detector parameters
iMosflm Tutorial
fileUsersandrewg4MOSFLMnewgui_tutorialiMosflm_tutorial_720_ver3html[29052015 105311]
will be plotted as will the changes in crystal orientation and (if selected) mosaic spread If the shift in cell parameters is greater than 25standard deviations another cycle of integration and cell refinement is carried out Typically two or three cycles are required forconvergence Note that the current program activity is shown in the bottom left-hand corner of the window in the status message area
The different windows are explained below Moving the mouse over any parameter or plotted graph point will give a full description ofit
821 The detector parameters window
The values of the refined detector parameters are displayed for each image as it is integratedThere is the option to fix any of the parameters during integration by checking the Fix box onthe right The positional residuals (overall central and weighted) are also listed
Any of these parameters can be selected for plotting on the graph that appears to the right ofthis box by simply clicking on that parameter (which is then highlighted in blue as shown herefor Beam x and Beam y)
Check the stability of the refined parameters by displaying the appropriate graphs To getsensible scaling of the graphs only parameters with similar numerical values should be plottedtogether
For weak images (ie few visible spots in the outer regions of the image) the tilt and twistmay not be well defined and might refine to large values (greater than one degree) Insuch cases these parameters should be fixed It is not generally recommended to fix any
iMosflm Tutorial
fileUsersandrewg4MOSFLMnewgui_tutorialiMosflm_tutorial_720_ver3html[29052015 105311]
other detector parameters
For very weak fine sliced images (Pilatus only) there is the option to sum images when findingsuitable spots for refinement see Settings -gt Processing Options -gt Advanced refinementwhich can in some cases make the refinement more stable
822 The crystal parameters window
The values of the refined crystal missetting angles φ(x) φ(y) φ(z) the unit cell parameters andmosaic spread for the current image are displayed in the table Selected parameters will beplotted as for the detector parameters Specific unit cell parameters can also be fixed
If more than one segment of data is being used for cell refinement it is not unusual to see achange in orientation of the crystal between the two segments
Observe how the crystal orientation is different for images in the two segments See how themosaic spread varies during refinement
823 The central spot profile
The average spot profile for the central region of the detector is plotted for eachimage This confirms that the spot prediction is good If the profile is not welldefined and central in the box or if the blue border for the peak region of the spot ismuch larger than the apparent spots size it suggests a problem with the integrationand the initial prediction should be checked In some cases it may be necessary toincrease or decrease the Profile Tolerance parameters to ensure that the blue boxfits the spot To do this select the Advanced integration tab of Processing optionsCheck the central spot profiles for the images used in the cell refinement
824 The summary window
This window presents a summary of how selected parameters have changed indifferent cycles of the cell refinement The behaviour of these parameters gives agood indication of whether the cell refinement has been successful
If the refinement has been successful the RMS residual should be lower for thefinal cycle than in previous cycles However errors in the cell can be compensatedquite well by changing the crystal to detector distance so the differences are notalways dramatic
The other parameters that can be plotted from the pull-down list are the detectordistance and the Pixel ratio (Yscale)
The detector distance should be the same for all images in the refinement If the original indexing was based on auto-indexing a singleimage (say the first) then the detector distance might change for images from the second segment to compensate for an error in theoriginal cell If the variation in distance for different images increases with the cycle number this indicates that the refinement is notstable
The Pixel ratio (Yscale) parameter may also show an initial variation for images in different segments because refining Yscale (whichshould be 10000 for all except Raxis II and Raxis HTC detectors) can compensate for errors in cell dimensions in the same way that thedistance can The final values (last cycle) should be very close to identical for all images and should also be very close to unity (to within00010)
Cell refinement can be unstable if the data do not extend to at least 35 Aring If it appears unstable use the cell derived from auto-indexing a series of images well spaced in φ instead
iMosflm Tutorial
fileUsersandrewg4MOSFLMnewgui_tutorialiMosflm_tutorial_720_ver3html[29052015 105311]
Examine the plots to see if the parameters are stable and correct (Yscale)
825 The final results
When refinement has converged (or after 5 cycles) the initial and final cell parameters and the estimated errors (std dev) are listed
If time is available make a note of the std dev values and repeat the cell refinement using a larger number of images in each segmentAre the standard deviations smaller when using more images
83 Refining cell parameters for multiple lattices
Providing the resolution is high enough (generally better than ~35-32 Aring) and not too many of the spots in the different lattices areoverlapped it is possible to refine the cell parameters for each lattice individually The lattice to be refined is selected from the Latticeselector
This selector will be grayed out when processing a single lattice
84 If the prediction for the first image of a segment is poor
In some cases depending on how the indexing has been carried out or if the diffraction is poor or there has been a large change incrystal orientation during the data collection the prediction for one or more of the segments (the first image) may be poor In suchcases the integration and hence the cell refinement may fail It may be possible to successfully process the images after an initialrefinement of the crystal orientation using a pattern matching algorithm To select this option got to the Advanced refinement tab ofProcessing options and select the tick box for Refine orientation of first image in any run by pattern matching and for Integrate allimages Then refine the cell in the usual way During integration the orientation will be refined for the first image of each segmentoutput for this additional refinement will be written to the logfile but is not shown in the GUI
9 IntegrationThe accurate cell parameters are now used in the integration Note that although the images are integrated during the cell refinementthe intensities are not saved and no MTZ file is generated at that stage
It is good practice to start by integrating a block of images corresponding to a few degrees of data to check that the parameters do notneed further adjustment MOSFLM will generate warning messages after integration if there are any difficulties and it may be possibleto improve the situation by changing some of the default parameters (see Warning messages sect13)
Before integration ensure that the backstop shadow has been defined (see Masked areas backstop sect411 and Masked areas generalsect412)
91 Image selection
Image selection is performed in exactly the same way as in the cell refinement In this case the Automatic selection will simply includeall images in the current sector
Select images 1-10
92 Setting the MTZ filename and controlling updating of the image display
Two icons appear when the integration option is chosen
If the Show predictions icon is clicked the display window will be updated as eachimage is processed This will slow down the processing but allows the accuracy of theprediction to be checked for each image
iMosflm Tutorial
fileUsersandrewg4MOSFLMnewgui_tutorialiMosflm_tutorial_720_ver3html[29052015 105311]
Click on this icon so that the display will be updatedThe filename of the MTZ file containing the results of the integration is generatedautomatically but can be edited manually
93 Integrating the images
Click on the Process button to start integration
Integration of the images occurs in two passes In the first pass for each block of images (a number corresponding to a few degrees ofdata selected automatically by MOSFLM) the detector and crystal parameters are refined for each image in turn and the measurementboxes for all predicted spots are written to a file for use in the second pass In the second pass the standard profiles are formed fromreflections present on all of the images in this block and each image is then integrated and the results written to the MTZ file Thedisplay is not updated during the second pass and will remain on the last image of the block (assuming image updating has beenselected)
Note that the unit cell dimensions are normally fixed during integration and only the crystal orientation and mosaic spread are refinedCrystal parameter refinement only starts when a sufficient number of images have been integrated to provide data for the post-refinement typically after ~05-1 degree (more for high mosaicity)
94 Parameter display windows
As described in sect82 the refined detector and crystal parameters will be displayed in tables and selected parameters will be plotted ingraphs The average spot profile for each image will also be displayed
The size of these graphs (and the profile) can be expanded to fill the whole window by holding down Shift and clicking LMB anywherein the graph window A second Shift+click will revert the graph to the original size
In addition to these windows there are windows that tabulate and plot (as a function of image number) the mean Iσ(I) for profile fittedand summation integration intensities The overall values and the values for the highest resolution bin are given
The number of overloaded reflections Bad spots (ie those that fail certain tests see mosflm SUMMARY file sect15) Spatial overlaps andif processing multi-lattice images the number of lattice overlaps is listed for each image and can be plotted by highlighting thatparameter When processing data from crystals with large unit cells it is important to watch out for spatial overlaps (see sect97 for tips onhow to reduce the number of spatial overlaps if this is a problem)
A display of the standard profiles for different regions of the detector is also provided Poor profiles are averaged by includingreflections from inner regions of the detector Averaged profiles are indicated by a red line around the spot (rather than blue) Theoriginal unaveraged profile can be viewed a clicking on the profile (providing there were sufficient spots in that region to allowformation of a profile)
The profiles should be checked to see that they are well defined and centred within the box Poorly-defined diffuse or non-centredprofiles may suggest that the prediction is not very good in which case this should be checked on the corresponding image(s)
It may be useful to expand the standard profiles to fill the window using Shift + click in the profiles window
Finally the lower left window plots Iσ(I) as a function of resolution for any selected image
iMosflm Tutorial
fileUsersandrewg4MOSFLMnewgui_tutorialiMosflm_tutorial_720_ver3html[29052015 105311]
Different parameters can be plotted by selecting the small right- or left-pointing arrows on the title line above the plot
95 Integrating the whole datasetAssuming that everything looks OK the entire dataset can now be integrated However it is strongly recommended thatProjectCrystalDataset names are assigned first These are written to the output MTZ file and used by downstream programs inparticular AIMLESS will use this information when deciding which images belong to the same dataset
Select Experiment settings from the Settings drop-down menu (see Drop down menus sect21) to enter these names and optionally givea title for the MTZ file
Select images 1-84 and click on Process
951 Parallel Integration Using multiple cores
An option is available on the pull-down menu (next to the Process button in the Integration task) which splits up the integration jobover available cores on the local machine All aspects are currently determined automatically at present user-configurable options willbe available in a later version The algorithm used is as follows
iMosflm determines the number of cores available on the local machineIf the number of cores (N) is greater than 2 iMosflm splits the integration run into N-1 batches (up to a maximum of 16) containingapproximately the same number of images If N le 2 iMosflm splits the run into N batches
If the total number of images in each batch is less than 32 the number of batches is decreased until this condition is satisfied
The first batch is submitted as a background task consisting of a refinement stage and an integration stage with its input and outputfiles (including the MTZ file) in a new directory its name being determined from the number of segments of data being integrated andthe lattice number (if the sample has been determined to contain multiple lattices) If the directories exist already they are all movedinto a newly-created directory with a time-stamped name the files from the most recent integration run are thus in directories withnames following the pattern described above Once the refinement stage is complete the refined parameters are written to a file
The launch of subsequent batches are delayed until the corresponding preceding batch has written its refined parameters This file isread and the new batch is launched again with a refinement stage and integration stage
At present the job cannot be aborted once it has started
952 Integrating as a background job
By selecting Batch in the drop-down menu adjacent to the Process button the integration can be run as a background job rather thaninteractively and the GUI can be used to look at a different dataset
Selecting Batch from the drop-down menu will display a new window showing the script that will be used to process the images alongwith a number of processing options The script can be edited if additional keywords are required or if some parameters are to bechanged and can also be copied and pasted into a file for off-line processing
By default the job is divided into batches across multiple cores as determined for the parallel integration described in sect951 but thenumber of cores can be chosen by the user from a drop-down menu in this case the size of each batch is determined by the interface
Plotting the results of the integration can be turned off this can make processing much faster
iMosflm Tutorial
fileUsersandrewg4MOSFLMnewgui_tutorialiMosflm_tutorial_720_ver3html[29052015 105311]
It is possible to configure job submission for remote machines (which can be added by depressing the add host button) Ensure youhave enabled passwordless logins for all the remote machines you enter and that you specify the full path to the Mosflm executable inthe Batch destinations window The remote working directory (in which the log and MTZ files are written) and the remote imagedirectory must both be specified with their full path names Any required parameter fields that are not completed by the user arehighlighted in orange if the user tries to submit a job without completing these fields a new window containing only those fields (againhighlighted in orange) pops up with a request to do so
The number of cores available on the selected host can be determined by depressing the apple core button on the Batch destinationsconfiguration window
The log file for batch submission jobs the MTZ and SUMMARY files are written to the directory in which iMosflm was launched
96 Checking the integration
iMosflm Tutorial
fileUsersandrewg4MOSFLMnewgui_tutorialiMosflm_tutorial_720_ver3html[29052015 105311]
The detector and crystal parameter plots should be examined carefully to check for any instability in the refinement If there are largeand random variations in some parameters (eg the detector twist and tilt) then it may be better to fix them and repeat the integration
For cases (eg very small unit cells) where there are very few suitable reflections on each image the refinement of the missetting anglesmay show significant variations from one image to the next In such cases it is best to apply smoothing to the missetting angles usingthe tick box in Settings -gt Processing options -gt Advanced Refinement
Discontinuities due to blank images should also show up and the offending images should be removed from the scaling run
If adjacent spots are incompletely resolved on the detector it may be possible to improve the processing by increasing the PROFILETOLERANCE parameters by 1-2 These parameters can be set in the Advanced integration tab of the Processing options menu (useSettings)
97 Advanced features for integration
The Settings -gt Processing options menu allows additional control over the integration Parameters such as the minimum spotseparation resolution limits excluded resolution ranges block size MTZ filename and BATCH ADD can be changed in the Processingtab
Manually decreasing the minimum spot separation can help if a large number of reflections are flagged as spatially overlapped (redboxes) The prediction must be updated to see the effect of changing the separation this can be done either by displaying the next orprevious image or double clicking on the blue circle next to the image currently displayed in the Images pane
In the Advanced integration tab the measurement box parameters profile tolerance and profile averaging parameters can be set
The measurement box parameters can be adjusted for rare cases where the estimation of the spot size has not worked correctlyresulting in a box that is too small or too large The optimisation of the background rim and corner cutoff parameters that determinewhich pixels are used for the background and which pixels for the peak can also be turned off but this is generally not recommended
Increasing the profile tolerance can help in cases where adjacent spots are not completely resolved this can be judged by examining thestandard profiles By default the profile tolerance is automatically increased if there are a large number of spatial overlaps as this hasthe effect of reducing the minimum spot separation A message will be written to the logfile if this has happened This option can beturned off using the tick box Optimise profile tolerance values to avoid spot overlap
The profile outlier exclusion parameters control the exclusion of ice spots or hot pixels which could otherwise corrupt the standardprofiles
Pixels with a value less than the Null pixel threshold are considered to belong to inactive regions of the detector
The pixel saturation value determines when a reflection is considered to be an overload The intensity of overloaded reflections isestimated by profile fitting but these reflections are rejected by the scaling program AIMLESS by default
Increasing the Maximum reflection width in φ from the default value of 5deg will reduce the number of rejected reflections (green boxes)and is worthwhile when the mosaicity is very high or the mosaic block size is very small As with the minimum spot separation theimage must be refreshed to see the effect of changing this parameter
The rejection criteria will reject reflections with too much variation in the background (BGRATIO) or where the gradient of thebackground plane is too large These should only be changed if many reflections are being rejected PKRATIO only applies to fullyrecorded reflections and reflects a very poor profile fit With current data collection protocols there will be very few (if any) fullyrecorded reflections
Additional MOSFLM parameters will be added based on user requests
98 Integrating multiple lattices
When multiple lattices have been successfully indexed each lattice can be integrated individually by selecting the appropriate latticenumber
Reflections in the chosen lattice that are overlapped by a reflection from another lattice will be integrated but the measurement box willbe expanded so that the total intensity of the two (or more) reflections is measured These reflections will be flagged for specialtreatment Reflections that are not overlapped are referred to as singletons They will be dealt with in the normal way by POINTLESSand AIMLESS
NOTE If more than one lattice has been indexed and the results of integrating just ONE of the lattices are to be checked byrunning QuickSymm or QuickScale then the multi-lattice icon in the Integration pane must be turned off otherwise an error
iMosflm Tutorial
fileUsersandrewg4MOSFLMnewgui_tutorialiMosflm_tutorial_720_ver3html[29052015 105311]
message will be given saying that all lattices must be integrated
It is often the case that by measuring both lattices (in separate integration runs) and inputting both MTZ files to QuickScale the overallcompleteness is high using ONLY the singletons To use this option ensure that the multi-lattice icon is off
To make use of the intensity estimates for overlapped reflections MTZ files for all lattices must be input to the program FECKLESSwhich will derive the best estimate of the summed intensity This is the default option if more than one lattice has been indexed and itrequires that all lattices have been integrated (in separate runs) prior to running QuickSymm or QuickScale (FECKLESS will be runautomatically)
At this time no downstream programs can make use of the summed intensities of overlapping reflections but in the future it should bepossible to use this data in REFMAC
Currently it is recommended to use only singletons from all the lattices FECKLESS is not required in this case
The MTZ filename is automatically updated to reflect which lattice has been chosen to avoid overwriting the MTZ file of the first latticewhen integrating the second one FECKLESS when run from iMosflm relies on this naming convention so do not change it
10 Running Pointless to check the symmetryOnce the images have been integrated (even a few degrees of data in many cases) the program POINTLESS can be run to determine thetrue Laue symmetry and try to determine the space group using the QuickSymm button
iMosflm Tutorial
fileUsersandrewg4MOSFLMnewgui_tutorialiMosflm_tutorial_720_ver3html[29052015 105311]
Select the QuickSymm button
A summary of the Pointless results as shown below will appear in a qtRView window
Various graphs (L test for twinning ViewHKL to view the reciprocal lattice) can also be viewed in this window
Various options for POINTLESS such as a reference MTZ file forcing the symmetry selected in iMosflm and specifying multiple input MTZfiles can be selected from the Settings -gt Processing options -gt Sort Scale and Merge tab (see below)
iMosflm Tutorial
fileUsersandrewg4MOSFLMnewgui_tutorialiMosflm_tutorial_720_ver3html[29052015 105311]
Caution The results can be ambiguous if run with a partial dataset Look in the logfile to see how many relfections are used totest each possible symmetry operator
11 Running Aimless to scale and merge the dataSelect the QuickScale button
This will first run POINTLESS then change the space group for the data to that selected by POINTLESS (unless the iMosflm symmetry isset to override POINTLESS) run AIMLESS to scale and merge the data in that space group and then run CTRUNCATE which calculates anumber of statistics from the intensity data The CCP4 UNIQUEIFY script will then be run which generates all the unique reflections forthat spacegroup to the resolution of the measured data and will flag reflections (5 by default but this can be changed) for use as theRfree set
AIMLESS can be run from the QuickScale button either treating anomalous data (the default) or ignoring anomalous data If onlyprocessing a few degrees of data it is usually better to ignore anomalous because especially for low symmetry cases no mergingstatistics may be given in AIMLESS
SCALA can be selected as an alternative to AIMLESS for scaling (not recommended)
There is limited control over running AIMLESS (see figure above) including re-setting resolution limits rejecting batches (images)changing the treatment for accepting partials changing the rejection criterion and changing the procedure for updating the standarddeviation estimates
iMosflm Tutorial
fileUsersandrewg4MOSFLMnewgui_tutorialiMosflm_tutorial_720_ver3html[29052015 105311]
The AIMLESS results will be displayed in the qtRView as shown below along with graphical output (see below) and the full log file canalso be examined
Aimless summary file
iMosflm Tutorial
fileUsersandrewg4MOSFLMnewgui_tutorialiMosflm_tutorial_720_ver3html[29052015 105311]
An example of the Aimless graphical output
The AIMLESS logfile can also be examined by selecting the Log File tab
12 History and mosflm log fileSelecting History allows the history of the session to be examined or by selecting the Log tab the full mosflmlp file can be viewed Themosflmlp file is also available in a time-stamped file mosflm_yyyymmdd_hhmmsslp (eg mosflm_20100518_131019lp) and can beread with a text editor
The History has a tree structure and will show when various parameters have been changed This has not been fully implemented and isnot generally useful
The logfile may provide useful clues when processing has failed
13 Warning MessagesAs already mentioned in Adding images sect3 and Integration sect9 warning messages are generated by MOSFLM during processing Atraffic light colour coding has now been assigned based on the warnings and is shown next to the Warnings box
A Red status implies a serious problem that will affect data quality and should be addressed
An Orange status implies minor issues that should be checked to see if things can be improved
A Green status means no significant problems messages are for information only
iMosflm Tutorial
fileUsersandrewg4MOSFLMnewgui_tutorialiMosflm_tutorial_720_ver3html[29052015 105311]
Abbreviated messages can be obtained by clicking on the Warnings icon The full warning Details together with Hints amp Notes text (ifany are available) can be obtained by double-clicking the relevant warning Details are displayed in a pop-up text box which willdisappear with the next click outside the box The same full details and suggestions are of course available in the mosflmlp files whereeven more information may be available
NOTE This is the end of the part of the tutorial which deals directly with iMosflm but see sect19 which has some suggestions forfurther work if you have time The remainder of this document deals with integrating and scaling data with MOSFLM andAimless via the CCP4i user interface examining the traditional mosflm SUMMARY file with the CCP4 utility loggraph
The Appendix contains a shell script for running MOSFLM as a traditional batch job
14 Useful command line optionsiMosflm has a number of command line options and these can be listed by typingimosflm --helpCurrent options are
--allimages -a ltfilenamegt Starts mosflm loading all files that match the template generated from ltfilenamegt--ccp4i2 Autosaves an iMosflm session file upon exit with an XML list of all iMosflm output files--debug -d Creates a large output file for debugging purposes Dont use this unless asked to by a developer--expert -e Permits access to advanced detector settings This should not normally be required--fastload -f Attempt to speed loading of many images offline while indexing two default images separated by 90 degrees--help -h Displays this message then exits--imagedir -I ltdirectorygt Starts the image browser in this directory if ltdirectorygt is given as an environment variable it will be expanded to its full value--init -i ltfilenamegt Starts Mosflm and reads from the given saved session file--startdir -S ltdirectorygt Starts mosflm in directory ltstartdirgt rather than the current directory This will only work if the directory exists and you have write permission to it otherwise iMosflm will exit All the normal mosflm output files will be in this directory--singleimage -s ltfilenamegt Starts mosflm loading only the image from ltfilenamegt--site -X ltfilenamegt Reads anyall of the following lines from the file given WAVELENGTH ltxgt DISPERSION ltxgt POLARISATION [PINHOLE | MIRRORS | MONOCHROMATOR | SYNCHROTRON ltxgt] DIVERGENCE ltxh xvgt BEAM ltbeamx beamygt DISTANCE ltxgt DISTORTION TILT ltxgt DISTORTION TWIST ltxgt GAIN ltxgt DETECTOR REVERSEPHI DETECTOR OMEGA ltxgt--version -v Displays the program version and required Mosflm version then exits
These can be abbreviated to the shortest unambiguous string
141 The site fileimosflm --site ltsitefilegt will read keywords from the file ltsitefilegt that will overwrite incorrect information in image headers Thissaves having to manually correct values in every iMosflm session The site file can also be read or written as an option from the Sessionmenu (see Drop down menus sect21) Allowed keywords areWAVELENGTH ltxgt
iMosflm Tutorial
fileUsersandrewg4MOSFLMnewgui_tutorialiMosflm_tutorial_720_ver3html[29052015 105311]
DISPERSION ltxgtPOLARISATION [PINHOLE | MIRRORS | MONO | SYNCHROTRON ltxgt]DIVERGENCE ltxh xvgtBEAM ltbeamx beamygtDISTANCE ltxgtDISTORTION TILT ltxgtDISTORTION TWIST ltxgtGAIN ltxgtDETECTOR REVERSEPHIDETECTOR OMEGA ltxgt
15 The mosflm SUMMARY fileMOSFLM produces a summary file listing refined parameters for each image and when using iMosflm this file will be date- amp time-stamped and have a name such as mosflm_20100518_131019sum This contains the same information as the plots produced by theiMOSFLM GUI which now also include the number of bad spots and overloads
This can be inspected graphically from the CCP4i GUI using the program loggraph Select the pull down menu View Files from Job andunder Output files select Additional log graphs where the _SUMMARYloggraph file will be listed Select this file to display its tablesin loggraph
This is very useful to identify rogue images (with unusually high positional residual or low Iσ(I)) If you find any read that image intoMOSFLM and see what is wrong with it
If you have done more than one integration run during your MOSFLM session you will find multiple entries of the tables Look at the lastset for integration of the 84 images
Click on the Refined detector parameter tables and check on the stability of parameters like the TILT and TWIST of the detector (unitsare hundredths of a degree) and for Mar Research (or DIP) image plate data the distortion parameters ROFF and TOFF (units are mm) Ifthey are varying a lot (more than 20 for TWISTTILT) or 015 for ROFFTOFF then it is probably a good idea to fix these parameters atthe average value (or the known values for this detector if they are available) (see Detector parameters sect821)
Click on the Post refinement table and check the missets It does not matter if they change slowly and by an amount (per image) that isless than 01mosaic spread If they are changing more than this then there could be a problem with processing the data (there is notmuch you can do about this)
Check how the mosaic spread is changing If it is unstable or if you think it is not refining to sensible values (as judged by looking atthe prediction) then you can fix the input value in the same way as the detector parameters (see Crystal parameters sect822)
BADSPOTS AND OVERLOADS
The program will set a rejection flag for those reflections that fail certain tests for example too much variation in the background levela poor profile fit an intensity that is very negative (more than 5 standard deviations) a very high gradient for the background planeThese reflections are called Bad spots and they are listed individually for each image in the mosflmlp file together with the reason forflagging them The number of bad spots is also written to the summary file Generally there should be very few (5-10) bad spots oneach image If there are more it could be because the backstop shadow is not correctly allowed for (consider using the NULLPIXkeyword)
There should also be very few overloaded reflections on each image If there are a lot then a separate low resolution data collectionpass should be made with a much shorter exposure time
IMPORTANT Both Bad spots and Overloads are written to the output MTZ file but will be rejected by default by AIMLESS Theintensity of overloaded reflections is estimated by profile fitting that part of the spot that is not saturated To include these reflections inthe final merged data use the ACCEPT keyword in AIMLESS
16 Scaling data with CCP4i ccp4i
Select Directories amp ProjectDir (top right)
In the new window select Add project
Enter the project name in the Project field and the full directory path in the uses directory field Default values may have been enteredalready here Select this project from Project for this session
Select Apply and Exit Dismiss the warning message that comes up
Select Data reduction from the pull down menu of modules (orange bar at top left)
iMosflm Tutorial
fileUsersandrewg4MOSFLMnewgui_tutorialiMosflm_tutorial_720_ver3html[29052015 105311]
Select Symmetry Scale Merge (Aimless)
In the window that appears do the following
Give a job title (top line)
Click on the box next to Separate anomalous pairs for outlier rejection amp merging statistics (the crystals have been soaked in a mercurycompound)
In the next orange bar (line starts HKLIN 1) select Browse and select the MTZ file output by MOSFLM (probably called hg_001mtz)Select OK
If you did not supply the Project name Crystal name or Dataset name to Mosflm fill in the boxes for these now
Under Scaling Protocol
From the pull-down menu on the line starting Scale select with automatic default settings
At the bottom of window from the pull-down menu named Run select RunampView Com File
This will display a new window showing the command file for running the POINTLESS step select Continue After a brief pause it willshow the command file for running AIMLESS (This can be edited before submitting the job) Select Continue
In the main window it will show that the AIMLESS job is running
When AIMLESS has finished the command file for running the CTRUNCATE step will appearselect Continue
When CTRUNCATE has run the main window will say FINISHED
At that point select the pull-down menu View Files from Job and select View Log Graphs This will give you the same graphs asrunning loggraph on the AIMLESS log file they are also the same as those that appeared in IMOSFLMs QuickScale task To look at thelog file itself (eg the overall merging statistics) select View Log File and it will appear in a new window
161 Looking at the AIMLESS output
The simplest way to look at the output from AIMLESS is to use loggraph on the AIMLESS log file (or via the CCP4i GUI) This can displaymany different graphs
Use Scales vs rotation range to check for smooth variation in the scale factor Check the variation in B factor with image and if there isno real variation it is best to turn off the B-factor refinement
Use the Analysis against all Batches for all runs to detect bad images (high R-factor large number of rejected spots)
Check the Analysis against resolution Fractional bias to see if there is any indication of Partial bias (A negative partial bias will resultif the mosaic spread is underestimated or if there is a lot of diffuse scatter
The Fractional bias should be less than 1-2 although it will often exceed this for weak data (eg in the high resolution bins)
The Axial reflections graphs in AIMLESS are useful for detecting systematic absences which can be used to identify the true spacegroup However the detection of screw axes is thought to be sufficiently robust in POINTLESS that these graphs are no longer necessary
It can also be useful to look at the AIMLESS log file itself in particular the table giving statistics as a function of resolution The effectiveresolution limit of the data can be estimated by looking at the Mn(I)sd column (this is the mean Iσ(I) AFTER merging symmetry matesand is the best indicator of data quality) This table also shows shell and cumulative R-factors
The Mn(I)sd values depend on having realistic values of the standard deviations (errors) in the intensities As the values that come fromMOSFLM are always underestimates of the true error these values are scaled up in AIMLESS using a three-term correction
sdcorrected = SdFac Sqrt[sd(I)2 + SdBLPI + (SdAddI)2]
Here SdFac is an overall scale factor and SdB and SdAdd are intensity dependent factors
AIMLESS will automatically work out a suitable value for all three parameters in order to make the mean value of (observedscatter)(sdestimate) equal to 10 where observed scatter is the difference between an individual estimate of intensity and the mean ofall other estimates (from symmetry mates)
Probably the best estimate of the true high resolution limit of the data can be obtained from the CC(12) values these are thecorrelations between equivalent observations that have been divided randomly into two half-datasets The resolution limit is foundwhen the CC drops below ~ 05 - 03
This table comes under the heading
ANALYSIS OF STANDARD DEVIATIONS
iMosflm Tutorial
fileUsersandrewg4MOSFLMnewgui_tutorialiMosflm_tutorial_720_ver3html[29052015 105311]
in the AIMLESS log file and Run n standard deviation v Intensity test (where n is 1 or more) in the CCP4i GUI View Files from Job -View Log Graphs display
Can you identify a bad image in this dataset Can you work out why it is bad
(Cluethe image headers contain quite a lot of information that is not used by MOSFLM including the date and time that the image wascollected)
You can exclude a given batch from the scaling using the EXCLUDE keyword
RUN ALL EXCLUDE imagenumber
In this case run number will be 1
Rerun the scaling SENDING THE OUTPUT TO A NEW LOGFILE excluding this image and see the effect on the heights in the anomalousPatterson (in the log file) DO NOT repeat the integration In the command file uncomment the line (near the top) goto aimless so itskips the integration part
In the CCP4i GUI click to highlight the AIMLESS job which is listed as FINISHED and select ldquoReRun Jobrdquo from the control buttons downthe right-hand side of the main interface window Under ldquoExcluded Datardquo in the window that appears check the box next to Excludeselected batches and pull-down on the menu button to exclude a range Give the start amp end range to exclude (eg 74 to 74) Rerunthe job as before
17 Changing the symmetryFrom the list of options at the left hand side of the main window select ldquoUtilitiesrdquo and under that SortModifyCombine MTZ Files
In the new window give a new title eg reindex as H32
Click on the Box Change space group andor reindex reflections
Use the browse option to select the input MTZ file (First orange bar) the output filename will be generated automatically (but you canchange it)
Under Reindex details
In the last option check the box next to ldquoChange space group tordquo and enter H32 in the box This is above the final item Reducereflections to the asymmetric unit which is checked by default
Select Run from the Run option button
Then go back to the scaling window and select the new MTZ file (reindexed) as the input for scaling (use Browse) CHANGE THE JOBTITLE
Then select RUN
The scaling will now be performed in space group H32 Look at the merging statistics in the log file in particular the multiplicityweighted R-factor called Rmeas in the log file
18 Looking at the CTRUNCATE outputThe CTRUNCATE program converts intensities to amplitudes and also compiles some useful statistics The LTEST and the cumulativeintensity statistics tabulated by CTRUNCATE (and plotted by loggraph) provide the only point at which you will be able to detectmerohedral twinning (when the two lattices of the twin components exactly overlap and every measured intensity is actually the sum oftwo intensities)
For a good dataset the observed distribution should be within 1 of the theoretical distribution Is this the case for this data
19 If you have time 191 Different mosaic spreads
Try repeating the processing with the mosaic spread set to a value 25 smaller than the refined one and fix it by checking the Fix boxin the Integration window in iMosflm
Can you tell from the merging statistics if this data is better
192 Checking up on outliers
iMosflm Tutorial
fileUsersandrewg4MOSFLMnewgui_tutorialiMosflm_tutorial_720_ver3html[29052015 105311]
AIMLESS writes a file called ROGUES which lists reflections which show very poor agreement between symmetry mates or which areimplausibly large
Look in this file (it is ASCII) and try to work out why this has happened The ROGUES file gives you the image (Batch) on which thereflections have been recorded (for partials this is the image nearest the centre of the reflection so you may need to look on thepreceding and following image as well) Select a reflection which shows very poor agreement with its symmetry mates (A value greaterthan 10 in the DelIsd column in the ROGUES file)
Select the offending image by double-clicking it in the Images pane of the iMosflm main window Predict the reflections then enter thehkl values into the boxes and hit Return (or click the red warning button following the entry box for l) to locate the offending reflectionin the image You must give the measured indices - the first set of values in the ROGUES file - when doing this See if there is anythingodd about the spot Remember to check adjacent images for partials
193 How accurate does the unit cell have to be
Try changing the cell parameters by (say) 10 and integrate the images again What is the effect on the merging statistics
20 Tips1 When reading images into a session DO NOT attempt to carry out any other task until ALL the images have been read2 It is often worth repeating the indexing (usually only once) as the refined direct beam coordinates from the first indexing may give
an improved solution when the indexing is repeated (lower rmsd)3 Always integrate a few degrees of data before integrating the whole dataset (see sect9) If the space group is not known in advance
run Quicksymm with a few degrees of data to check that the correct indexing solution has been chosen4 For difficult images do not attempt to refine the unit cell initially once an indexing solution has been obtained try integrating a
few images to ensure that the integration is stable If then going on to refine the cell check that the prediction looks OK for thefirst image of every segment included in the refinement If it does not look very good consider using the pattern matching(Settings -gt Processing options -gt Advanced refinement see sect84)
5 If the resolution of the data is less than 35 Aring do not use the ldquoRefine Cellrdquo task Instead use several images in indexing and use thecell that comes from the indexing
6 If iMosflm gets into a state where the activity icon(upper right) is spinning but nothing seems to be happening click on the activityicon to stop it spinning and see if the session can be continued DO NOT click on the activity icon simply to abort a task this willgive unpredictable results Use the Abort button for cell refinement or integration There is no defined way to abort indexing
7 Use the image summation option (see sect4) to get a better impression of the diffraction for very low exposure Pilatus images8 Use image summation for detector parameter refinement for fine sliced very weak Pilatus images (Settings -gt Processing options -
gt Advanced refinement see sect821)9 For large mosaic spread values (gt 10deg) or small mosaic block sizes (lt10) consider increasing the maximum allowed reflection
width to avoid having too many green predicted reflections (Settings -gt Processing options -gt Advanced integration see sect97)10 By default on selecting the Indexing task iMosflm will find spots index and (assuming a solution has been found) estimate the
mosaicity For difficult cases it is more useful to restrict this to simply finding spots and then do the indexing and mosaicityestimation by clicking the appropriate buttons To do this change the check box Automatically index after spot finding inSettings -gt Processing options -gt Indexing
11 See sect521 and sect522 for advice if the indexing fails Also consider the possibility of a reversed phi rotation direction if you arenot familiar with the beamline (Settings -gt Experiment settings -gt Experiment see sect21)
12 If the detector parameters have refined to physically unreasonable values (eg because cell refinement or integration has beencarried out using an incorrect indexing solution) be sure to reset the detector parameters before attempting further processing(Settings -gt Experiment settings -gt Detector see sect21)
13 Always set the resolution limit slightly beyond the point at which any spots are visible (see sect414 ) For very weak fine-sliceddata it can be very difficult to estimate the resolution visually so integrate to the maximum resolution (inscribed circle) and usethe merging results to set the final resolution There should be no problems integrating to a resolution ~03-05 Aring beyond theactual resolution limit but for example integrating to 3 Aring when the true resolution limit is 5-6 Aring may cause problems and theintegration should then be repeated with a more realistic resolution limit
14 Use the site file sect141 if repeatedly processing data where the direct beam position is wrong or if the phi direction is reversed etcto save having to correct this for every session
Appendix IA command script for running MOSFLM using the keywords copied from the Batch processing window of the new GUI (see Integratingas a background job sect952) Note that keyworded input for MOSFLM and other CCP4 programs is case-insensitive apart from file anddirectory names
bincsh -fv Set a unique identifier for filenames for this job
set ident = x89_mos07_blk3_smallsep
iMosflm Tutorial
fileUsersandrewg4MOSFLMnewgui_tutorialiMosflm_tutorial_720_ver3html[29052015 105311]
$ipmosflm COORDS $identcoords SUMMARY $identsummary ltlt eof-ip Insert keywords copied from iMosflm batch window here
Keywords for this run For example could involve trying different values for mosaic spread or not integrating all images etc etchklout $identmtzgenfile $identgenprocess 1 1000 goeof-ip
pointlesspointless hklin $identmtz hklout $ident_pointlessmtz
aimlessaimless hklin $ident_pointlessmtz hklout $ident_aimless_partmtz ROGUES $identrogues ltlt eof-aimless Use all default options for aimlesseof-aimless
ctruncate hklin $ident_aimlessmtz hklout $ident_truncatemtz
Harry Powell Andrew Leslie and Owen Johnson
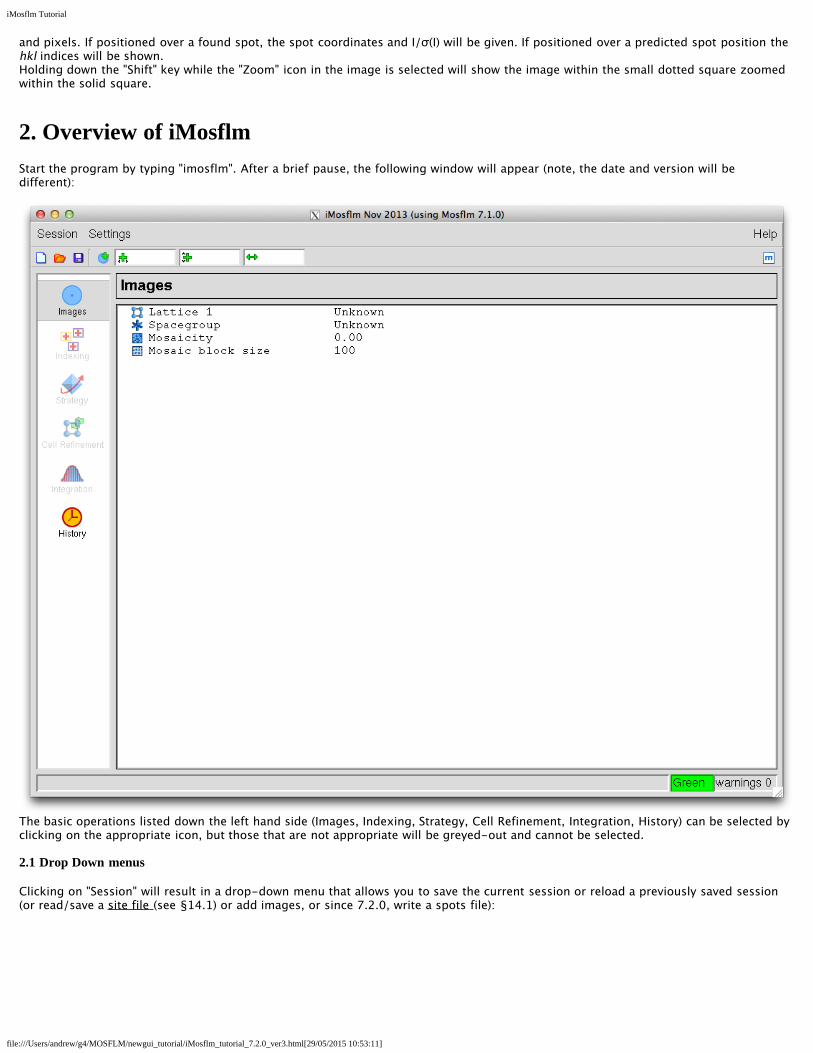
iMosflm Tutorial
fileUsersandrewg4MOSFLMnewgui_tutorialiMosflm_tutorial_720_ver3html[29052015 105311]
smoothing of missetting angles (see 96) Situations in which it may be useful to modify these parameters will be described in theappropriate section of the tutorial A summary is provided in the Tips section
Environment variableswill not normally require any changes
The three small icons below Session allow you to start a new session open a saved session or save the current session Moving themouse over these icons will result in display of a tooltip describing the action taken if the icon is clicked
3 Adding images to a sessionTo add images to a session use the Add images icon
Select the correct directory from the pop-up Add Images window (the default is the directory in which iMosflm was launched) All fileswith an appropriate extension (which can be selected from the File type) will be displayed
Note that for images where the image number is given as the extension (eg my_xtal001) you will need to select Numbered files as theFile type
Double-clicking on any file will result in all images with the same template being added to the session The template is the whole partof the filename prefix except the number field which specifies the image number An alternative is to single-click on one imagefilename and then click on Open
To open one or several images only check the Selected images only box and then use click followed by Shift+click to select a range ofimages or Control+click to select individual image files as required
Loaded images will be displayed in the Images window with the start amp end phi values displayed (as read from the image header)
iMosflm Tutorial
fileUsersandrewg4MOSFLMnewgui_tutorialiMosflm_tutorial_720_ver3html[29052015 105311]
All images with the same template belong to the same Sector of data
Multiple sectors can be read into the same session Each sector can have a different crystal orientation
Note that a Warning has appeared Click anywhere on the ldquowarnings 1rdquo text to get a brief description of the warning In this case it isbecause the direct beam coordinates stored in the MAR image plate images are not trusted by MOSFLM and the direct beam coordinateshave been set to the physical centre of the image Click on the X on the right hand side to dismiss this warning click anywhere outsidethe warning box to collapse the box double-click the warning text itself and more details hints and notes may be available fromMOSFLM
The direct beam coordinates (read from the image header or set by MOSFLM) and crystal to detector distance are displayed Thesevalues can be edited if they are not correct
iMosflm Tutorial
fileUsersandrewg4MOSFLMnewgui_tutorialiMosflm_tutorial_720_ver3html[29052015 105311]
Advanced Usage
1 The phi values of images can be edited in the Image window First click on the Image line to highlight it then click with the mouseover the phi values to make them editable allowing new values to be given These new values are propagated for all followingimages in the same sector Starting values for the three missetting angles (PHIX PHIY PHIZ) may also be entered following theimage phi values
2 To delete a sector click on the sector name to select it (it turns blue) then use the right mouse button on the sector to bring up adelete button Move the mouse over the delete button (it turns blue) and click to delete the sector and its images Individualimages can be deleted from the Images pane in the same way
3 If one sector is added and used for indexing and then a second sector from the same crystal is added the matrix for the secondsector will not be defined To define it double-click on the matrix name for the first sector save it to a file double-click on thematrix name (Unknown) for the new sector and read the matrix file written for the first sector Alternatively it is possible to dragand drop the matrix from the first sector onto the second sector (drop onto the sector itself not the Matrix for the secondsector)
4 Image DisplayWhen images are added to a session the first image of the sector is displayed in a separate display window
iMosflm Tutorial
fileUsersandrewg4MOSFLMnewgui_tutorialiMosflm_tutorial_720_ver3html[29052015 105311]
The Image drop-down menu allows display of the previous or next image in the series (but this is easier to perform using the bluearrows displayed before the image name)
The View drop-down menu allows the image to be displayed in different sizes (related by scale factors of two) based on the imagesize and the resolution of the monitor
iMosflm Tutorial
fileUsersandrewg4MOSFLMnewgui_tutorialiMosflm_tutorial_720_ver3html[29052015 105311]
The Settings drop-down menu allows the colour of the predictions to be changed (see Indexing sect52 for the default colours) and thesize of the Pick box to be changed The third option (image summation) determines whether summed images are calculated byaddition or by taking the maximum or minimum values Only addition is implemented
The line below allows selection of different images either using right and left arrow or selecting one from the drop-down list of allimages in that sector Alternatively the image number can be typed into the Go to entry box
For Pilatus images only the Sum entry box will allow the display of the sum of several images the number (up to 20) can be chosenfrom the drop-down list
The image being displayed can also be changed by double-clicking on an image name in the Images pane of the main iMosflmwindow This will also re-active the image window if it has been closed
+ and - will zoom the image without changing the centre The Fit image icon will restore the image to its original size (right mousebutton will have the same effect) The Contrast icon will give a histogram of pixel values Use the mouse to drag the vertical dottedline to the right to lighten the image to the left to darken it Try adjusting the contrast The Lattice entry window can be used whenprocessing images with multiple lattices present see multiple lattices sect53
The reverse video icon allows an image to be rendered as light spots on a dark background that can help visualise small diffractionspots (eg for data collected using a Pilatus detector)
41 Display Icons
The eight icons on the left control the display of the direct beam position (since 720 a magenta cross not a green one) spots foundfor indexing bad spots predicted spots masked areas spot-finding search area resolution limits and display of the active mask forRigaku detectors respectively Clicking on these items will turn their display on or off
These are followed by icons for Zoom Pan and Selection tools and tools for adding spots manually (for indexing) editing masks circlefitting and erasing spots or masks
Next on this toolbar are the entry boxes for h k amp l and a button to search for this hkl among the predicted spots displayed on theimage The button resembles a warning sign if the given hkl cannot be found but a green tick if it is found The final icon relates toprocessing images with multiple lattices (see multiple lattices sect53) and is not described here
411 Masked areas - circular backstop shadow
Select the masked area icon A green circle will be displayed showing the default position and size of the backstop shadow
Make sure that the Zoom icon (magnifying glass) is selected and use the left-mouse-button (abbreviated to LMB in following text) todrag out a rectangle around the centre of the image The inner dotted yellow rectangle will show the part of the image that will actuallyappear in the zoomed area
iMosflm Tutorial
fileUsersandrewg4MOSFLMnewgui_tutorialiMosflm_tutorial_720_ver3html[29052015 105311]
Choose the Selection Tool When placed over the perimeter of the circle the radius of the circular backstop shadow will be displayedUse the LMB to drag the circle to increase its diameter to that of the actual shadow on the image The position of the circle can beadjusted with LMB placed on the cross that appears in the centre of the green circle Adjust the size and position of the circle so that itmatches the shadow
412 Masked areas - general exclusions
Choose the Masking tool Any existing masked areas will automatically be displayed Use LMB to define the four corners of the region tobe masked When the fourth position is given the masked region will be shaded This region will be excluded from spot finding andintegration This provides a powerful way of dealing with backstop shadows To edit an existing mask choose the Selection tool and usethe LMB to drag any of the four vertices to a new position
To delete a mask choose the Spot and mask eraser tool Place the mouse anywhere within the shaded masked area and use LMB todelete the mask Delete any masks that you have created
413 Spot search area
Select the Show spotfinding search area icon The inner and outer radii for the spot search will be displayed as shown below If theimages are very weak the spot finding radius will automatically be reduced but this provides additional control
Either can be changed by dragging with the LMB Do not change the radii for these images
iMosflm Tutorial
fileUsersandrewg4MOSFLMnewgui_tutorialiMosflm_tutorial_720_ver3html[29052015 105311]
Advanced Usage
The red rectangle displays the area used to determine an initial estimate of the background of the image It is important that this doesnot overlap significant shadows on the image It can be shifted laterally or changed in orientation (in 90deg steps) by dragging with theLMB
414 Resolution limits
Select the Show resolution limits icon The low and high resolution limits will be displayed The resolution limits can be changed bydragging the perimeter of the circle with LMB (make sure that the Selection Tool has been chosen) The resolution limits will affectStrategy Cell refinement and Integration but not spot finding or indexing The low resolution is not strictly correct (it falls within thebackstop shadow) but does not need to be changed because spots within the backstop shadow will be rejected
415 Zooming and Panning
First select a region of the image to be zoomed with the Zoom tool
Select the Pan tool and pan the displayed area by holding down LMB and moving the mouse This is very rapid on a local machine butmay be slow if run on a remote machine over a network
416 Circle fitting
The circle fitting tool can be used to determine the direct beam position by fitting a circle to a set of points on a powder diffraction ringon the image (typically due to icing) or to fit a circular backstop shadow (although using the masking tool is probably easier)
Select the circle fitting tool Three new icons will appear in the image display area There are two (faint) ice rings visible on the image at391Aring and 367Aring Click with LMB on several positions (6-8) on the outer ring (as it is slightly stronger) Then click on the top circularicon
A circle that best fits the selected points (displayed as yellow crosses) will be drawn and the direct beam position at the centre of thiscircle will be indicated with a green cross The direct beam coordinates will be updated to reflect this new position
iMosflm Tutorial
fileUsersandrewg4MOSFLMnewgui_tutorialiMosflm_tutorial_720_ver3html[29052015 105311]
5 Spot finding indexing and mosaicity estimationWhen images have been added the Indexing operation becomes accessible (it is no longer greyed-out)
Click on Indexing This will bring up the major Indexing window in place of the Images window
51 Spot Finding
By default the first image and a second image 90 degrees away in phi (or as close to 90 as possible) will be selected and a spot searchcarried out on both images (This is controlled by the Automatically find spots on entering Autoindexing tick box in the Spot finding tabof Processing options)
Found spots will be displayed as crosses in the Image Display window (red for those above the intensity threshold yellow for thosebelow) Only those above the threshold will be used in indexing The intensity threshold normally defaults to 20 but will beautomatically reduced to 10 or 5 for weak images The threshold is determined by the last image to be processed
The number of spots found together with any manual additions or deletions are also given
Images to be searched for spots can be specified in several ways
1 Simply type in the numbers of the images (eg 1 84 above)
iMosflm Tutorial
fileUsersandrewg4MOSFLMnewgui_tutorialiMosflm_tutorial_720_ver3html[29052015 105311]
2 Use the Pick first image icon (single blue circle)
3 Use the Pick two images ~90 apart icon (two blue circles) This is the default behaviour
4 Use the Select images icon (multiple circles) If selected all images in the sector are displayed in a drop-down list Click on aimage to select it then double-click on the search icon (resembling a target in the colum headed Find) for that image to run thespot search The image will move to the top of the list (together with other images that have been searched)
Images to be used for indexing can be selected from those that have been searched by clicking on the Use button If this box waspreviously checked then clicking will remove this image from those to be used for indexing It can be added again by clicking theSelect images icon and clicking on the Use box
Before indexing always check by looking at the image display that the spot finding has worked correctly ie that most spots thatyou can see have been found that multiple crosses have not been drawn over the same spot that spots have not been placedover ice rings or ice spots Check all images that will be used in indexing
511 If the spot finding has not worked well
Parameters affecting the spot search can be modified by selecting the Settings drop-down window and selecting Processing optionsThe resulting new window contains six tabs relating to Spot finding Indexing Processing Advanced refinement Advanced integrationand Sort Scale and Merge
The Spot finding tab allows the Search area Spot discrimination parameters Spot size parameters Minimum spot separation andMaximum peak separation within spots (to deal with split spots) to be reset It also allows the choice between a local backgrounddetermination (preferred) and a radial background determination The local background method also uses an improved procedure forrecognising closely spaced spots The only parameters commonly changed are
1 Minimum spot separation This should be the size (in mm) of an average spot (not a very strong spot) If there are badly split spotsthe spot finding may place two (or more) crosses for a single diffraction spot To avoid this happening set the minimumseparation in X and Y to values equal to the spot size in mm This can be found by zooming the image and counting the number ofpixels across the spot horizontally (X) and vertically (Y) To convert this to mm use the pixel size as given in Settings -gtExperiment settings -gt Detector This separation parameter is very important when spots are very close but usually the programwill determine a suitable value
2 Minimum pixels per spot Default value 6 but this should be reduced automatically if spots are very small (eg when using in situscreening and microfocus beam) If there clearly are spots present and the spot size is very small try reducing this parameter to 3or 2
3 Local background box size Reducing this from 50 to (say) 20 can reduce the number of false spots found near any sharp shadowon the image (or tile boundaries for tiled detectors) Normally these false spots are weak (and will be drawn as yellow crosses) inwhich case they will not affect the indexing
For data collected in-house the spots can be quite large and rather weak In such cases the spot finding parameters are automaticallychanged but some improvement may still be obtained by the following
1 Reduce the spot finding threshold (default 35) eg to 2
2 Change the minimum number of pixels per spot (default 30) to 20 or 40
3 Set the minimum spot separation to a sensible value eg 15mm see above
52 Indexing
Providing there are no errors during spot finding indexing will be carried out automatically after spot finding (This is controlled by theAutomatically index after spot finding tick box in the Indexing tab of Processing options) If the image selection or indexingparameters are changed the Index button must be used to carry out the indexing
iMosflm Tutorial
fileUsersandrewg4MOSFLMnewgui_tutorialiMosflm_tutorial_720_ver3html[29052015 105311]
Autoindexing will be carried out by MOSFLM using spots (above the threshold) from the selected images The threshold is set byMOSFLM but can be changed using the entry box in the toolbar The list of solutions sorted by increasing penalty score will appear inthe lower part of the window The preferred solution will be highlighted in blue There will usually be a set of solutions with lowpenalties (0-20) followed by other solutions with significantly higher penalties The preferred solution is that with the highest symmetryfrom the group with low penalty values
Note that all these solutions are really the same P1 solution transformed to the 44 characteristic lattices with lattice symmetryconstraints applied Therefore if the P1 solution is wrong then all the others are wrong as well
For solutions with a penalty less than 50 the refined cell parameters (ref) will be shown This can be expanded (click on the + sign) toshow the reg unrefined but regularised cell (symmetry constraints applied) and the raw cell (no symmetry constraints applied)
The rms deviation (rmsd) or error in predicted spots positions (σ(xy) in mm) and the number of spots used to refine the solution aregiven for each solution
Usually the penalty will be less than 20 for the correct solution although it could be higher if there is an error in the direct beamcoordinates (or distancewavelength) The rmsd (error in spot positions) will typically be 01-02mm for a correct solution but if thespots are split or very elongated it can be as high as 1mm or higher
The predicted spot positions for the highlighted solution will be shown on the image display with the following default colour codes
Blue Fully recorded reflectionYellow (orange for Pilatus) Partially recorded reflection
iMosflm Tutorial
fileUsersandrewg4MOSFLMnewgui_tutorialiMosflm_tutorial_720_ver3html[29052015 105311]
Red Spatially overlapped reflection these will NOT be integratedGreen Reflection width too large (more than 5 degrees) not integrated
These colours may be adjusted via the Settings -gt Prediction colour item in the Image display window
Providing there are no errors in the indexing MOSFLM will automatically estimate the mosaic spread (mosaicity) based on the preferredsolution
Select other solutions with a higher penalty and see how well the predicted patterns match the diffraction image
The rmsd and visual inspection of the predicted pattern are the best ways of checking if a solution is correct If the agreement is notgood then the autoindexing has probably failed
It is often worth repeating the indexing (once) as the refined direct beam coordinates from the first indexing may give animproved solution (lower rmsd)
521 If the indexing fails - Direct beam search
The indexing is very sensitive to errors in the direct beam coordinates For a correct indexing solution the error should be less than halfthe minimum spot separation Check for example that the current direct beam position is behind the backstop If there are any icerings these can be used to determine the direct beam position (see Circle fitting sect416 )
If the accuracy of the direct beam coordinates (generally read from the image header) is uncertain the program can perform a gridsearch around the input coordinates The number and the size of the steps can be set from the Indexing tab of the Processing optionsmenu (see Settings - Processing options sect21) but defaults to two steps of 05mm on each side of the input coordinates The directbeam search is started by clicking on the Start beam search button in the Indexing pane While in progress it can be stopped byclicking the Abort beam search button
The indexing will be carried out for each set of starting coordinates (Beam x and Beam y in the table which appears) and if a solution isfound the refined beam coordinates (Beam x ref Beam y ref) the unit cell parameters of the triclinic solution and the rmsd error in spotcoordinates and in phi will be listed The correct solution will generally be the one with the smallest rms error in spot positions (σ(xy))To make it simpler to identify the correct solution once the grid search has finished the solutions will be sorted on σ(xy) so the correctsolution will be at the top of the list When sorting the solutions those which have smaller cell parameters will be listed first as it ispossible to have a small σ(xy) value for an incorrect solution with a much larger unit cell Beware of solutions at the top of the list wherethe cell is clearly too small (only happens rarely)
Note that only the triclinic (P1) solution will be listed
If there is now a solution with a smaller rmsd value than before and especially if more than one set of starting beam coordinates has thesame refined coordinates this is a good indication that the beam search has worked Note that if the initial beam coordinates werewrong by more than ~15mm the search may not work In this case either select a new starting position for the direct beam or changethe number of steps
To complete the indexing double-click on the chosen solution and the full indexing will carried out for these beam coordinates withthe solutions appearing in the upper window The results of the direct beam search can be hidden (collapsed) by clicking on the Hidebutton and recovered by clicking on the Show button
iMosflm Tutorial
fileUsersandrewg4MOSFLMnewgui_tutorialiMosflm_tutorial_720_ver3html[29052015 105311]
522 If the indexing fails - Other parameters
Errors in other physical parameters (wavelength crystal to detector distance) can also result in failure All these parameters should bechecked
Several parameters used in autoindexing can also be adjusted using entry fields and buttons that appear in the Indexing toolbar
Weak images
1 MOSFLM automatically reduces the Iσ(I) threshold for weak images and it may also reduce the resolution to 4Å but lower valuescan be tried It is important not to include spots that are not real - a small number of false spots can prevent the indexing fromworking
2 Try changing parameters for spot finding (see If the spot finding has not worked well sect511)
Multiple lattices
1 Try increasing the Iσ(I) threshold (default 20) for example to 40 or 60 so that only spots from the stronger lattice are selectedThis can be done by entering a new value in the leftmost of the circled icons above (and also via the Indexing tab of Processingoptions)
All cases
1 Include more images in the indexing Select images that are widely spaced in phi not close together2 Select images that show the clearest lunes andor have the best spot shape3 In case the crystal orientation has changed or if you are unsure of the direction of positive rotation in phi try indexing using only
one image4 Make sure that the Max cell edge value is not too small If in doubt set to 200 Aring (or more if the cell is expected to be large)5 If the cell parameters are known reduce the maximum allowed cell edge to the known maximum cell edge This can sometimes
help filter incorrect solutions but use with caution as often this needs to be ~twice the largest cell for successful indexingAlternatively try the known cell option
6 If the detector distance is uncertain and the images are high resolution (eg 2Å) allow the detector distance to refine during cellrefinement Use with caution
53 Indexing multiple lattices simultaneously
This is a new feature and is still undergoing development It is most likely to succeed when the different lattices are clearly separated atleast at higher resolution If the images shows badly split spots with several components (each arising from a sub-crystal with a slightlydifferent orientation) then indexing may well still be impossible
After spot finding examine the image to ensure that spots that are close to each other but belong to different lattices have beenidentified as separate spots and not treated as a single split spot (in which case the red cross will lie midway between the two spots)Adjusting the minimum spot separation (Settings -gt Processing options -gt Spot finding) can help in resolving close spots It may alsohelp to increase the inner radius of the spot search region (see Spot search area sect413) so that low resolution reflections where the
iMosflm Tutorial
fileUsersandrewg4MOSFLMnewgui_tutorialiMosflm_tutorial_720_ver3html[29052015 105311]
spots are not really separated are excluded from the search
The following procedure usually provides the best chance of success
1 Select appropriate images for use in indexing The separation of the lattices can be clearer on some images than others Ideallychoose several images widely separated in phi
2 Do a normal (single lattice) indexing first This will usually work but will give a high positional rmsd because of the presence of morethan one lattice This step is important because it will result in more accurate direct beam coordinates which are crucial for multi-lattice indexing
3 Select the ldquoIndex multiple latticesrdquo icon (next to the Index button) the Index button will change to Index multiple
The indexing results for different lattices will be presented in different tabs while the selected solution for each lattice will be shown inthe lower Summary window Currently a maximum of 5 lattices can be handled The figure below shows a case where 3 differentlattices were found
4 Judge the success of indexing by examining the lattice type and the cell parameters obtained for the different lattices (the cellsshould be very similar) and checking that the predictions match the observed spots The rmsd values for correct lattices should also besignificantly smaller than the value obtained in the initial (single lattice) indexing It may be necessary to manually select a differentautoindexing solution for some lattices in order to get the same lattice type (eg oP) for the different lattices
The Split column in the lower pane indicates the angle between the reference lattice (with value -) and the other lattices This is onlycalculated when the lattices have the same lattice type In this case the angles between lattice 1 and lattices 2 amp 3 are 34 and 16degrees
If a lattice is clearly incorrect it can be deleted by highlighting that lattice (in the lower pane that summarises the results) and using theright mouse button to select ldquodeleterdquo
The predictions for different lattices can be displayed either by highlighting the lattice in the Summary window or by using the latticeselector in the image display pane
iMosflm Tutorial
fileUsersandrewg4MOSFLMnewgui_tutorialiMosflm_tutorial_720_ver3html[29052015 105311]
In the image display spots in different lattices that overlap with each other are shown in magenta Only the summed intensity will bemeasured for these reflections
The predictions for all lattices can be shown by selecting the ldquomerge latticesrdquo icon in the image display
This can be useful to check if all the lattices have been successfully indexed because all spots in the image should then be predicted Inthe display predictions from lattice 12345 are shown in blue yellow red green and magenta with no distinction made between fullyand partially recorded reflections or spatial overlaps
iMosflm Tutorial
fileUsersandrewg4MOSFLMnewgui_tutorialiMosflm_tutorial_720_ver3html[29052015 105311]
531 Practical Tips
Beware of solutions where the lattices only vary in orientation by a small angle (less than 1 degree) as these are often different solutionsfor the same lattice The difference in orientation between lattices is given by the ldquosplitrdquo column in the Summary window but this is onlycalculated if the lattices have the same lattice type Differences are all relative to one lattice which will display a split angle as ldquo-ldquo Tocalculate the angles relative to a different lattice open the tab for that lattice select a different solution to that currently selected andthen select the original solution ndash this will trigger recalculation of the split angles relative to that lattice
Other parameters that can influence the indexing are the rdquoMaximum deviation from integral hklrdquo (default 02 when indexing multiplelattices otherwise 03) and ldquoNumber of vectors to find for indexingrdquo (default 30) These can be changed via the Indexing tab of theldquoProcessing Optionsrdquo that can be selected from the ldquoSettingsrdquo menu item Values between 015 and 025 might be helpful for the firstparameter and increasing the number of vectors from 30 to 50 can also help At present there is no defined protocol for changing thedefault parameter values for particular cases it has to be done by trial and error
Experience so far has shown that selecting appropriate images and adjusting the maximum cell length used in indexing have the biggesteffect The optimum value for the maximum cell length will normally lie between one and three times the largest cell dimension but it isworth varying this in steps of between 25 and 50 Aring as the indexing can be very sensitive to this parameter
For a more complete discussion of multiple lattice indexing see Powell HR Johnson O amp Leslie AGW 2013 Autoindexingdiffraction images with iMosflm Acta Cryst D69 1195-1203
54 Known cell option
For images that are very difficult to index if the cell parameters are known the known cell option can be usedSelect the ldquoKnown cellrdquo icon (next to the Multiple lattices icon) Enter the cell parameters in the Input known cell pop-up window andselect OK when all 6 parameters have been provided Then select the Index Cell button
To revert to normal indexing select the ldquoKnown cellrdquo icon and then select Clear in the Input known cell pop-up window
55 Space group selection
Note that the indexing is based solely on information about the unit cell parameters It will therefore be very difficult (or impossible) todetermine the correct Laue group in the presence of pseudosymmetry For example a monoclinic space group with β ~ 90deg will appearto be orthorhombic an orthorhombic space group with very similar a and b cell parameters will appear to be tetragonal These can onlybe distinguished when intensities are available (ie after integration) by running POINTLESS (QuickSymm) (see Running Pointless to check the
iMosflm Tutorial
fileUsersandrewg4MOSFLMnewgui_tutorialiMosflm_tutorial_720_ver3html[29052015 105311]
symmetry sect10)
In addition it is not possible to distinguish between Laue Groups 4m and 4mmm 3 and 3m 6m and 6mmm m3 and m3m Thiswill not affect integration of the images but it will affect the strategy calculation In the absence of additional information the lowersymmetry should be chosen for the strategy calculation to ensure that a complete dataset is collected
The presence of screw axes also cannot be detected so there is no basis on which to distinguish P21 from P2 etc This does not affectany aspect of data collection or processing and can be chosen (on the basis of systematic absences) after integration by runningPOINTLESS
In this example there is no way of knowing at this stage if the space group is h3 or h32 so leave it as h3
56 Mosaicity estimation
If the Automatically index after spot finding option has been chosen (Indexingtab of Processing Options) the mosaicity (mosaic spread) will be estimatedautomatically for the preferred solution However if another solution is chosenthe mosaicity should be estimated again
Click on the Estimate button to estimate the mosaicity
A window will appear which plots the total predicted intensity as a function ofmosaic spread from which an estimate is determined
The predictions displayed on the image will be updated Entering different valuesof mosaic spread in the box (followed by return) will allow a visual estimate of theeffect of changing the mosaic spread
The mosaic spread can also be entered in the Images pane by clicking once on theMosaicity line and once again on the value displayed
561 The mosaic block size
In some cases the apparent mosaic spread is much larger at low resolution than at high resolution so that if it is set to a value thatresults in all the low resolution spots being predicted many more spots are predicted than are visible at high resolution This effect isbest dealt with by adjusting the Mosaic block size which is also displayed in the Images pane This is modelling the size in microns ofthe individual mosaic blocks in the crystal Decreasing this to values of 05-5 microns (say) from the default of 100 microns will resultin predicting more spots at low resolution but have virtually no effect at high resolution This parameter is not refined (at present) andso the best value must be determined by trial and error
6 Saving and recovering a sessionThe session can be saved at any time using the Session drop-down menu referred to in sect21 The first time that a session is saved youwill be prompted for a filename The filename convention for saved session files is that the extension is mos
Save the current session Then exit from iMosflm (using the Session drop-down menu) restart iMosflm and read in the saved session
If the program crashes it should be possible to recover all but the latest actions as a temporary copy of the session file is continuallysaved to the directory mosflm in the users home directory
Restart iMosflm and it will pop up a Recover session window
Selecting the Recover button will restore the session as far as possible
iMosflm Tutorial
fileUsersandrewg4MOSFLMnewgui_tutorialiMosflm_tutorial_720_ver3html[29052015 105311]
7 Data collection strategyOnce the crystal orientation and (probable) Laue group have been determined it is possible to calculate a data collection strategy andthe Strategy icon is no longer greyed-out (in fact all other operations Strategy Cell Refinement and Integration become possible at thispoint)
Select the Strategy icon This will open the Strategy window
The statistics initially presented in the window are based on the images read in to the current session If only two (or more) references
iMosflm Tutorial
fileUsersandrewg4MOSFLMnewgui_tutorialiMosflm_tutorial_720_ver3html[29052015 105311]
images have been read in no statistics will be presented
When the Strategy option is used after two initial images (typically 90deg apart in φ) have been collected a complete shaded segment willnot be shown in the lower part of the screen rather an empty circle will be shown with the matrix label beneath it Click the Auto-complete button and in the pop-up menu that appears select a rotation angle or sweep of data to collect - or leave the Rotationsetting as Auto for a calculation of maximum completeness for this crystal orientation Click on Ok and the completeness results willbe presented
The orientation of the crystal expressed as the angles between the abc unit cell axes and the XYZ coordinate frame is given X isalong the X-ray beam Z is the rotation axis A warning will be given if the unique axis is so close to the rotation axis that there will bemissing cusp data
71 Evaluating completeness manually
The completeness of any given segment of data can be determined manually using the circle at the bottom left of the window Click onthe red segment shown in this circle
This will result in small black boxes being drawn on the circumference at the start and end of the red sector
Use the LMB to click on the black box at 0 and drag this around the circle
When the LMB is released the statistics for that sector will be displayed The statistics are presented in two ways Near the top right ofthe window the overall completeness is shown as red circles for unique data and anomalous pairs The average multiplicity is givenbeneath these circles
More detailed statistics (such as completeness as a function of resolution) are given in a series of histograms that can be selected by adrop-down menu
72 Calculating a strategy automatically
Uncheck the Use checkbox at the right side of the hg_001 line listed in the sector list near the top of the Strategy pane This means
iMosflm Tutorial
fileUsersandrewg4MOSFLMnewgui_tutorialiMosflm_tutorial_720_ver3html[29052015 105311]
that the 84 images used thus far will not be included in the completeness calculation only the matrix derived from indexing them willbe used Select the Auto-complete button to calculate a strategy automatically
A strategy calculation data pop-up window will appear
If multiple matrices have been defined (for different sectors of data) then the appropriate one can be selected (if there is only one sectorthis has no effect)
The total φ rotation to be used is normally calculated by MOSFLM based on the Laue group and the crystal orientation (the Auto setting)However it is sometimes possible to achieve a high completeness with a significantly smaller total rotation (eg 60deg in two 30degsegments will typically give gt94 completeness for orthorhombic space groups) and this can sometimes be useful if radiation damage isa serious problem although when using hybrid pixel detectors it is better to use a very conservative exposure time and collect a wide φrotation
Total rotation angles of between 5deg and 90deg can be selected from the drop-down list The number of segments to be used can be setbetween 1 and 3
If the check box is checked data completeness will be calculated to optimize the proportion of anomalous data collected
THIS IS IMPORTANT The optimum strategy is often different when maximising completeness of the anomalous data
Choose the default values (Rotation Auto Segments 1) but check the anomalous data box then click on Ok Look at the variousstatistics presented as bar charts
In space group H3 if rotating around the c axis a total rotation of 120deg would be required to collect a complete dataset (ignoring anydata lost in the cusp) Because the c axis is 22deg away from the rotation axis in this case it is possible to collect very high completeness(for unique data) with a rotation much smaller than this
Try to find the minimum total rotation that will give a dataset that is gt95 complete for the unique data Now do the same butrequiring gt95 completeness for the anomalous data
SKIP OVER SECTION 73 IF DOING THE NORMAL TUTORIAL
73 Calculating a strategy using multiple crystals
The Strategy pane may also be used when due to radiation damage many crystals are required to collect a complete dataset
IMPORTANT This procedure will only work correctly for space groups where there is no indexing ambiguity For those spacegroups where there is an indexing ambiguity( see httpwwwccp4acukdisthtmlreindexinghtml for a complete list) it isnecessary to integrate images to determine whether different crystals have been indexed in the same way This is not achievablewithin the Strategy option at present
Suppose the first crystal has been indexed from the reference images
Enter the Strategy pane an empty circle is displayed in the bottom part of the screen and click on the Auto-complete button nearthe top-right of the pane In the Auto-complete window that appears choose a suitable Rotation angle for the amount of datathat can be collected from one crystal say 20 degrees for this example Leave Segments set to 1 and do not check Optimize foranomalous data
Click the Ok button and the completeness of the data will be displayed The matrix name start and end phi values and the phiextent will be displayed in the top area of the pane with a checkbox ticked under the Use column This means this segment will beused in further strategy calculations
Accept and save this result by clicking on the yellow hatched segment displayed in the large circle near the bottom of the paneClick once and the segment will be outlined in black (you can adjust the start or end phi value calculated in one degree incrementsby click+dragging the respective black square) click again this time on the black square denoting the start or end phi (or release ifyou have adjusted by click+dragging) and the segment will turn red The segment will not be saved unless it has turned red
This result will be saved if you leave this pane (eg to load more images) and return later in this session The strategy file can alsobe saved to a permanent file using the Save button on the tool-bar This is highly recommended when working with many crystals
Return to the Strategy pane when you have loaded and indexed the reference image(s) from the second crystal and repeat the procedureabove You will see the calculated segment from the first matrix displayed at the bottom-left of the screen The optimum phi range for
iMosflm Tutorial
fileUsersandrewg4MOSFLMnewgui_tutorialiMosflm_tutorial_720_ver3html[29052015 105311]
the second crystal will be displayed Save this in the same way as for the first crystal (clicking twice) Repeat this procedure for anysubsequent crystals and in each case the optimum phi range will be calculated for the latest crystal taking into account the data fromprevious crystals
It is a good idea to save the strategy to a file as each new crystal is added in case the program crashes and this information is lost
In practice it is probably safest to have a separate iMosflm session that is reserved for the strategy calculations and not used to processany data The strategy for each new crystal can be calculated as described above If there is a problem and the session is corrupted or ifiMosflm is closed down for any reason it is straightforward to restore the status of the session providing the strategy has been savedThe following steps should be taken
1 Read in the reference images for the latest crystal and index them
2 Select the Strategy pane
3 Read in the optimised strategy for all previous crystals using the ldquoAddrdquo button and giving the appropriate filename
4 Making sure that the circle for the latest crystal is highlighted in the lower left window click on lsquoAuto-completersquo and follow the stepsdescribed above
Advanced Usage
The startend phi values for each crystalmatrix can be updated This might be required if for example only 10 degrees of useful datawere collected from a particular crystal instead of the anticipated 20 degrees To change the phi values click either on the matrix namein the top pane or on the circle showing the segment of data in the lower left pane (these are highlighted in a blue box as the mousemoves over them) The corresponding segment will now be displayed in the larger circle Click on the red segment so that a blacksquare appears at the startend phi values Then simply drag the appropriate phi to the desired value The completeness willautomatically be updated (but the strategy calculation for the latest crystal will not be repeated to do this the current segment must bedeleted by highlighting the matrix name and using right click and then repeating the Auto-complete step)
If matrix files saved from iMosflm are available from crystals for which data have been collected in previous sessions these can beadded into the calculation using the Add matrix button on the tool-bar
If the saved strategy result has become complicated or is incorrect and you wish to restart the calculations afresh there is a tool-barbutton Reload sectors from session This will remove any calculated sectors while leaving any known matrices listed at the bottom-leftof the Strategy pane
If you have saved a strategy file from a previous session this can be used to re-initialize the Strategy pane using the Load button onthe tool-bar
A Spacegroup pull-down menu has been added to the tool-bar to permit different choices of space group to be used in thecalculations (eg H3 and H32) This menu is populated from the list offered on the Indexing pane However the space group symboltext is editable Any space group symbol entered will be validated by Mosflm together with the current cell parameters
As a calculator for a multi-segment strategy the Strategy pane is reasonably flexible you can Save or Delete highlighted matrix lines byright-clicking As you highlight different matrix lines the orientation of the crystal expressed as the angles between the abc unit cellaxes and the XYZ coordinate frame is re-displayed in the centre of the pane
The following screen shot shows the cumulative results in the Strategy pane after this procedure has been followed for four crystals(ignore the iMosflm version number)
iMosflm Tutorial
fileUsersandrewg4MOSFLMnewgui_tutorialiMosflm_tutorial_720_ver3html[29052015 105311]
731 Calculating a strategy when some data have already been collected and processed
This option is not yet implemented If data have already been processed (to give an MTZ file) but the images are not currently available (eg they were collected on a previoussynchrotron trip possibly at a different synchrotron) then the MTZ file containing this data can be read and used to calculate a strategyfor data collection from new crystalsThe MTZ icon in the tool bar is used to read the MTZ file
74 Calculating a suitable oscillation angle
To calculate the maximum possible oscillation angle while avoiding spatial overlaps click on the Check for overlaps button A pop-upwindow will appear from which the option to calculate the maximum oscillation angle (as a function of φ) or check how many overlapswill occur for different (user selected) oscillation angles The results are plotted in the same pane as the histograms for the strategycalculations Note that the overlap calculation is based on the current values for the mosaic spread and spot separation and can be verysensitive to these values Note also that these are maximum and not necessarily recommended oscillation angles
iMosflm Tutorial
fileUsersandrewg4MOSFLMnewgui_tutorialiMosflm_tutorial_720_ver3html[29052015 105311]
8 Cell refinementIt is important to determine the cell parameters accurately before integrating the images Although the unit cell is refined as part of theautoindexing providing the diffraction extends beyond ~35Å resolution it is possible to obtain more accurate cell parameters using aprocedure known as post-refinement This procedure requires the integration of a series of images in ideally two or more separatesegments at widely different φ values The distribution of the intensity of partially recorded reflections over the images on which theyoccur is used to refine the unit cell crystal orientation and mosaic spread
Select the Cell Refinement icon
81 Selecting the images
iMosflm Tutorial
fileUsersandrewg4MOSFLMnewgui_tutorialiMosflm_tutorial_720_ver3html[29052015 105311]
There are several ways to select the images to be used in cell refinement Whichever method is used the image numbers will bedisplayed in the Images entry field iMosflm will automatically select appropriate images but these can be changed
811 Manual selection
A list of images can simply be typed into this box An image series can be specified as n-m where n and m are the first and last imagesDifferent series must be separated by white space or comma
For orthorhombic or higher symmetries two segments should be given approximately 90deg apart in φ For monoclinic or triclinic datathree or four segments are best (eg φ = 04590135)
The number of images that should be included in each segment depends on the mosaic spread and oscillation angle A reasonablenumber is 2(mosaic spreadoscillation angle +1) MOSFLM will automatically select two or more segments as appropriate Note thatthere is a limit on the total number of images that can be used
812 Automatic selection
Selecting the Automatically select images icon will select a suitable set of images
813 Graphical selection (Not recommended)
Selecting this icon will give a new window
Images can be selected by clicking in the Use check-box in the list of images or by using the mouse to drag a selection of imagesfrom the sector displayed The other icons allow the sector to be zoomed in or out and the viewed area to be moved to make theselection easier The final two icons on the tool-bar switch the segment display to fit the display space as either a full circle or aquadrant This Image palette can be closed by clicking outside its area but will close after 60 seconds anyway
82 Integrating the images and refining the cell
Use one of the methods above to select images to use in cell refinement and click on the Process button Before starting cell refinementcheck that the prediction for the first image in each segment to be used is good The majority of the spot positions must be correctlypredicted for the first image in each segment or else the refinement will not work
The selected images will be integrated and following integration the cell parameters are refined Selectable refined detector parameters
iMosflm Tutorial
fileUsersandrewg4MOSFLMnewgui_tutorialiMosflm_tutorial_720_ver3html[29052015 105311]
will be plotted as will the changes in crystal orientation and (if selected) mosaic spread If the shift in cell parameters is greater than 25standard deviations another cycle of integration and cell refinement is carried out Typically two or three cycles are required forconvergence Note that the current program activity is shown in the bottom left-hand corner of the window in the status message area
The different windows are explained below Moving the mouse over any parameter or plotted graph point will give a full description ofit
821 The detector parameters window
The values of the refined detector parameters are displayed for each image as it is integratedThere is the option to fix any of the parameters during integration by checking the Fix box onthe right The positional residuals (overall central and weighted) are also listed
Any of these parameters can be selected for plotting on the graph that appears to the right ofthis box by simply clicking on that parameter (which is then highlighted in blue as shown herefor Beam x and Beam y)
Check the stability of the refined parameters by displaying the appropriate graphs To getsensible scaling of the graphs only parameters with similar numerical values should be plottedtogether
For weak images (ie few visible spots in the outer regions of the image) the tilt and twistmay not be well defined and might refine to large values (greater than one degree) Insuch cases these parameters should be fixed It is not generally recommended to fix any
iMosflm Tutorial
fileUsersandrewg4MOSFLMnewgui_tutorialiMosflm_tutorial_720_ver3html[29052015 105311]
other detector parameters
For very weak fine sliced images (Pilatus only) there is the option to sum images when findingsuitable spots for refinement see Settings -gt Processing Options -gt Advanced refinementwhich can in some cases make the refinement more stable
822 The crystal parameters window
The values of the refined crystal missetting angles φ(x) φ(y) φ(z) the unit cell parameters andmosaic spread for the current image are displayed in the table Selected parameters will beplotted as for the detector parameters Specific unit cell parameters can also be fixed
If more than one segment of data is being used for cell refinement it is not unusual to see achange in orientation of the crystal between the two segments
Observe how the crystal orientation is different for images in the two segments See how themosaic spread varies during refinement
823 The central spot profile
The average spot profile for the central region of the detector is plotted for eachimage This confirms that the spot prediction is good If the profile is not welldefined and central in the box or if the blue border for the peak region of the spot ismuch larger than the apparent spots size it suggests a problem with the integrationand the initial prediction should be checked In some cases it may be necessary toincrease or decrease the Profile Tolerance parameters to ensure that the blue boxfits the spot To do this select the Advanced integration tab of Processing optionsCheck the central spot profiles for the images used in the cell refinement
824 The summary window
This window presents a summary of how selected parameters have changed indifferent cycles of the cell refinement The behaviour of these parameters gives agood indication of whether the cell refinement has been successful
If the refinement has been successful the RMS residual should be lower for thefinal cycle than in previous cycles However errors in the cell can be compensatedquite well by changing the crystal to detector distance so the differences are notalways dramatic
The other parameters that can be plotted from the pull-down list are the detectordistance and the Pixel ratio (Yscale)
The detector distance should be the same for all images in the refinement If the original indexing was based on auto-indexing a singleimage (say the first) then the detector distance might change for images from the second segment to compensate for an error in theoriginal cell If the variation in distance for different images increases with the cycle number this indicates that the refinement is notstable
The Pixel ratio (Yscale) parameter may also show an initial variation for images in different segments because refining Yscale (whichshould be 10000 for all except Raxis II and Raxis HTC detectors) can compensate for errors in cell dimensions in the same way that thedistance can The final values (last cycle) should be very close to identical for all images and should also be very close to unity (to within00010)
Cell refinement can be unstable if the data do not extend to at least 35 Aring If it appears unstable use the cell derived from auto-indexing a series of images well spaced in φ instead
iMosflm Tutorial
fileUsersandrewg4MOSFLMnewgui_tutorialiMosflm_tutorial_720_ver3html[29052015 105311]
Examine the plots to see if the parameters are stable and correct (Yscale)
825 The final results
When refinement has converged (or after 5 cycles) the initial and final cell parameters and the estimated errors (std dev) are listed
If time is available make a note of the std dev values and repeat the cell refinement using a larger number of images in each segmentAre the standard deviations smaller when using more images
83 Refining cell parameters for multiple lattices
Providing the resolution is high enough (generally better than ~35-32 Aring) and not too many of the spots in the different lattices areoverlapped it is possible to refine the cell parameters for each lattice individually The lattice to be refined is selected from the Latticeselector
This selector will be grayed out when processing a single lattice
84 If the prediction for the first image of a segment is poor
In some cases depending on how the indexing has been carried out or if the diffraction is poor or there has been a large change incrystal orientation during the data collection the prediction for one or more of the segments (the first image) may be poor In suchcases the integration and hence the cell refinement may fail It may be possible to successfully process the images after an initialrefinement of the crystal orientation using a pattern matching algorithm To select this option got to the Advanced refinement tab ofProcessing options and select the tick box for Refine orientation of first image in any run by pattern matching and for Integrate allimages Then refine the cell in the usual way During integration the orientation will be refined for the first image of each segmentoutput for this additional refinement will be written to the logfile but is not shown in the GUI
9 IntegrationThe accurate cell parameters are now used in the integration Note that although the images are integrated during the cell refinementthe intensities are not saved and no MTZ file is generated at that stage
It is good practice to start by integrating a block of images corresponding to a few degrees of data to check that the parameters do notneed further adjustment MOSFLM will generate warning messages after integration if there are any difficulties and it may be possibleto improve the situation by changing some of the default parameters (see Warning messages sect13)
Before integration ensure that the backstop shadow has been defined (see Masked areas backstop sect411 and Masked areas generalsect412)
91 Image selection
Image selection is performed in exactly the same way as in the cell refinement In this case the Automatic selection will simply includeall images in the current sector
Select images 1-10
92 Setting the MTZ filename and controlling updating of the image display
Two icons appear when the integration option is chosen
If the Show predictions icon is clicked the display window will be updated as eachimage is processed This will slow down the processing but allows the accuracy of theprediction to be checked for each image
iMosflm Tutorial
fileUsersandrewg4MOSFLMnewgui_tutorialiMosflm_tutorial_720_ver3html[29052015 105311]
Click on this icon so that the display will be updatedThe filename of the MTZ file containing the results of the integration is generatedautomatically but can be edited manually
93 Integrating the images
Click on the Process button to start integration
Integration of the images occurs in two passes In the first pass for each block of images (a number corresponding to a few degrees ofdata selected automatically by MOSFLM) the detector and crystal parameters are refined for each image in turn and the measurementboxes for all predicted spots are written to a file for use in the second pass In the second pass the standard profiles are formed fromreflections present on all of the images in this block and each image is then integrated and the results written to the MTZ file Thedisplay is not updated during the second pass and will remain on the last image of the block (assuming image updating has beenselected)
Note that the unit cell dimensions are normally fixed during integration and only the crystal orientation and mosaic spread are refinedCrystal parameter refinement only starts when a sufficient number of images have been integrated to provide data for the post-refinement typically after ~05-1 degree (more for high mosaicity)
94 Parameter display windows
As described in sect82 the refined detector and crystal parameters will be displayed in tables and selected parameters will be plotted ingraphs The average spot profile for each image will also be displayed
The size of these graphs (and the profile) can be expanded to fill the whole window by holding down Shift and clicking LMB anywherein the graph window A second Shift+click will revert the graph to the original size
In addition to these windows there are windows that tabulate and plot (as a function of image number) the mean Iσ(I) for profile fittedand summation integration intensities The overall values and the values for the highest resolution bin are given
The number of overloaded reflections Bad spots (ie those that fail certain tests see mosflm SUMMARY file sect15) Spatial overlaps andif processing multi-lattice images the number of lattice overlaps is listed for each image and can be plotted by highlighting thatparameter When processing data from crystals with large unit cells it is important to watch out for spatial overlaps (see sect97 for tips onhow to reduce the number of spatial overlaps if this is a problem)
A display of the standard profiles for different regions of the detector is also provided Poor profiles are averaged by includingreflections from inner regions of the detector Averaged profiles are indicated by a red line around the spot (rather than blue) Theoriginal unaveraged profile can be viewed a clicking on the profile (providing there were sufficient spots in that region to allowformation of a profile)
The profiles should be checked to see that they are well defined and centred within the box Poorly-defined diffuse or non-centredprofiles may suggest that the prediction is not very good in which case this should be checked on the corresponding image(s)
It may be useful to expand the standard profiles to fill the window using Shift + click in the profiles window
Finally the lower left window plots Iσ(I) as a function of resolution for any selected image
iMosflm Tutorial
fileUsersandrewg4MOSFLMnewgui_tutorialiMosflm_tutorial_720_ver3html[29052015 105311]
Different parameters can be plotted by selecting the small right- or left-pointing arrows on the title line above the plot
95 Integrating the whole datasetAssuming that everything looks OK the entire dataset can now be integrated However it is strongly recommended thatProjectCrystalDataset names are assigned first These are written to the output MTZ file and used by downstream programs inparticular AIMLESS will use this information when deciding which images belong to the same dataset
Select Experiment settings from the Settings drop-down menu (see Drop down menus sect21) to enter these names and optionally givea title for the MTZ file
Select images 1-84 and click on Process
951 Parallel Integration Using multiple cores
An option is available on the pull-down menu (next to the Process button in the Integration task) which splits up the integration jobover available cores on the local machine All aspects are currently determined automatically at present user-configurable options willbe available in a later version The algorithm used is as follows
iMosflm determines the number of cores available on the local machineIf the number of cores (N) is greater than 2 iMosflm splits the integration run into N-1 batches (up to a maximum of 16) containingapproximately the same number of images If N le 2 iMosflm splits the run into N batches
If the total number of images in each batch is less than 32 the number of batches is decreased until this condition is satisfied
The first batch is submitted as a background task consisting of a refinement stage and an integration stage with its input and outputfiles (including the MTZ file) in a new directory its name being determined from the number of segments of data being integrated andthe lattice number (if the sample has been determined to contain multiple lattices) If the directories exist already they are all movedinto a newly-created directory with a time-stamped name the files from the most recent integration run are thus in directories withnames following the pattern described above Once the refinement stage is complete the refined parameters are written to a file
The launch of subsequent batches are delayed until the corresponding preceding batch has written its refined parameters This file isread and the new batch is launched again with a refinement stage and integration stage
At present the job cannot be aborted once it has started
952 Integrating as a background job
By selecting Batch in the drop-down menu adjacent to the Process button the integration can be run as a background job rather thaninteractively and the GUI can be used to look at a different dataset
Selecting Batch from the drop-down menu will display a new window showing the script that will be used to process the images alongwith a number of processing options The script can be edited if additional keywords are required or if some parameters are to bechanged and can also be copied and pasted into a file for off-line processing
By default the job is divided into batches across multiple cores as determined for the parallel integration described in sect951 but thenumber of cores can be chosen by the user from a drop-down menu in this case the size of each batch is determined by the interface
Plotting the results of the integration can be turned off this can make processing much faster
iMosflm Tutorial
fileUsersandrewg4MOSFLMnewgui_tutorialiMosflm_tutorial_720_ver3html[29052015 105311]
It is possible to configure job submission for remote machines (which can be added by depressing the add host button) Ensure youhave enabled passwordless logins for all the remote machines you enter and that you specify the full path to the Mosflm executable inthe Batch destinations window The remote working directory (in which the log and MTZ files are written) and the remote imagedirectory must both be specified with their full path names Any required parameter fields that are not completed by the user arehighlighted in orange if the user tries to submit a job without completing these fields a new window containing only those fields (againhighlighted in orange) pops up with a request to do so
The number of cores available on the selected host can be determined by depressing the apple core button on the Batch destinationsconfiguration window
The log file for batch submission jobs the MTZ and SUMMARY files are written to the directory in which iMosflm was launched
96 Checking the integration
iMosflm Tutorial
fileUsersandrewg4MOSFLMnewgui_tutorialiMosflm_tutorial_720_ver3html[29052015 105311]
The detector and crystal parameter plots should be examined carefully to check for any instability in the refinement If there are largeand random variations in some parameters (eg the detector twist and tilt) then it may be better to fix them and repeat the integration
For cases (eg very small unit cells) where there are very few suitable reflections on each image the refinement of the missetting anglesmay show significant variations from one image to the next In such cases it is best to apply smoothing to the missetting angles usingthe tick box in Settings -gt Processing options -gt Advanced Refinement
Discontinuities due to blank images should also show up and the offending images should be removed from the scaling run
If adjacent spots are incompletely resolved on the detector it may be possible to improve the processing by increasing the PROFILETOLERANCE parameters by 1-2 These parameters can be set in the Advanced integration tab of the Processing options menu (useSettings)
97 Advanced features for integration
The Settings -gt Processing options menu allows additional control over the integration Parameters such as the minimum spotseparation resolution limits excluded resolution ranges block size MTZ filename and BATCH ADD can be changed in the Processingtab
Manually decreasing the minimum spot separation can help if a large number of reflections are flagged as spatially overlapped (redboxes) The prediction must be updated to see the effect of changing the separation this can be done either by displaying the next orprevious image or double clicking on the blue circle next to the image currently displayed in the Images pane
In the Advanced integration tab the measurement box parameters profile tolerance and profile averaging parameters can be set
The measurement box parameters can be adjusted for rare cases where the estimation of the spot size has not worked correctlyresulting in a box that is too small or too large The optimisation of the background rim and corner cutoff parameters that determinewhich pixels are used for the background and which pixels for the peak can also be turned off but this is generally not recommended
Increasing the profile tolerance can help in cases where adjacent spots are not completely resolved this can be judged by examining thestandard profiles By default the profile tolerance is automatically increased if there are a large number of spatial overlaps as this hasthe effect of reducing the minimum spot separation A message will be written to the logfile if this has happened This option can beturned off using the tick box Optimise profile tolerance values to avoid spot overlap
The profile outlier exclusion parameters control the exclusion of ice spots or hot pixels which could otherwise corrupt the standardprofiles
Pixels with a value less than the Null pixel threshold are considered to belong to inactive regions of the detector
The pixel saturation value determines when a reflection is considered to be an overload The intensity of overloaded reflections isestimated by profile fitting but these reflections are rejected by the scaling program AIMLESS by default
Increasing the Maximum reflection width in φ from the default value of 5deg will reduce the number of rejected reflections (green boxes)and is worthwhile when the mosaicity is very high or the mosaic block size is very small As with the minimum spot separation theimage must be refreshed to see the effect of changing this parameter
The rejection criteria will reject reflections with too much variation in the background (BGRATIO) or where the gradient of thebackground plane is too large These should only be changed if many reflections are being rejected PKRATIO only applies to fullyrecorded reflections and reflects a very poor profile fit With current data collection protocols there will be very few (if any) fullyrecorded reflections
Additional MOSFLM parameters will be added based on user requests
98 Integrating multiple lattices
When multiple lattices have been successfully indexed each lattice can be integrated individually by selecting the appropriate latticenumber
Reflections in the chosen lattice that are overlapped by a reflection from another lattice will be integrated but the measurement box willbe expanded so that the total intensity of the two (or more) reflections is measured These reflections will be flagged for specialtreatment Reflections that are not overlapped are referred to as singletons They will be dealt with in the normal way by POINTLESSand AIMLESS
NOTE If more than one lattice has been indexed and the results of integrating just ONE of the lattices are to be checked byrunning QuickSymm or QuickScale then the multi-lattice icon in the Integration pane must be turned off otherwise an error
iMosflm Tutorial
fileUsersandrewg4MOSFLMnewgui_tutorialiMosflm_tutorial_720_ver3html[29052015 105311]
message will be given saying that all lattices must be integrated
It is often the case that by measuring both lattices (in separate integration runs) and inputting both MTZ files to QuickScale the overallcompleteness is high using ONLY the singletons To use this option ensure that the multi-lattice icon is off
To make use of the intensity estimates for overlapped reflections MTZ files for all lattices must be input to the program FECKLESSwhich will derive the best estimate of the summed intensity This is the default option if more than one lattice has been indexed and itrequires that all lattices have been integrated (in separate runs) prior to running QuickSymm or QuickScale (FECKLESS will be runautomatically)
At this time no downstream programs can make use of the summed intensities of overlapping reflections but in the future it should bepossible to use this data in REFMAC
Currently it is recommended to use only singletons from all the lattices FECKLESS is not required in this case
The MTZ filename is automatically updated to reflect which lattice has been chosen to avoid overwriting the MTZ file of the first latticewhen integrating the second one FECKLESS when run from iMosflm relies on this naming convention so do not change it
10 Running Pointless to check the symmetryOnce the images have been integrated (even a few degrees of data in many cases) the program POINTLESS can be run to determine thetrue Laue symmetry and try to determine the space group using the QuickSymm button
iMosflm Tutorial
fileUsersandrewg4MOSFLMnewgui_tutorialiMosflm_tutorial_720_ver3html[29052015 105311]
Select the QuickSymm button
A summary of the Pointless results as shown below will appear in a qtRView window
Various graphs (L test for twinning ViewHKL to view the reciprocal lattice) can also be viewed in this window
Various options for POINTLESS such as a reference MTZ file forcing the symmetry selected in iMosflm and specifying multiple input MTZfiles can be selected from the Settings -gt Processing options -gt Sort Scale and Merge tab (see below)
iMosflm Tutorial
fileUsersandrewg4MOSFLMnewgui_tutorialiMosflm_tutorial_720_ver3html[29052015 105311]
Caution The results can be ambiguous if run with a partial dataset Look in the logfile to see how many relfections are used totest each possible symmetry operator
11 Running Aimless to scale and merge the dataSelect the QuickScale button
This will first run POINTLESS then change the space group for the data to that selected by POINTLESS (unless the iMosflm symmetry isset to override POINTLESS) run AIMLESS to scale and merge the data in that space group and then run CTRUNCATE which calculates anumber of statistics from the intensity data The CCP4 UNIQUEIFY script will then be run which generates all the unique reflections forthat spacegroup to the resolution of the measured data and will flag reflections (5 by default but this can be changed) for use as theRfree set
AIMLESS can be run from the QuickScale button either treating anomalous data (the default) or ignoring anomalous data If onlyprocessing a few degrees of data it is usually better to ignore anomalous because especially for low symmetry cases no mergingstatistics may be given in AIMLESS
SCALA can be selected as an alternative to AIMLESS for scaling (not recommended)
There is limited control over running AIMLESS (see figure above) including re-setting resolution limits rejecting batches (images)changing the treatment for accepting partials changing the rejection criterion and changing the procedure for updating the standarddeviation estimates
iMosflm Tutorial
fileUsersandrewg4MOSFLMnewgui_tutorialiMosflm_tutorial_720_ver3html[29052015 105311]
The AIMLESS results will be displayed in the qtRView as shown below along with graphical output (see below) and the full log file canalso be examined
Aimless summary file
iMosflm Tutorial
fileUsersandrewg4MOSFLMnewgui_tutorialiMosflm_tutorial_720_ver3html[29052015 105311]
An example of the Aimless graphical output
The AIMLESS logfile can also be examined by selecting the Log File tab
12 History and mosflm log fileSelecting History allows the history of the session to be examined or by selecting the Log tab the full mosflmlp file can be viewed Themosflmlp file is also available in a time-stamped file mosflm_yyyymmdd_hhmmsslp (eg mosflm_20100518_131019lp) and can beread with a text editor
The History has a tree structure and will show when various parameters have been changed This has not been fully implemented and isnot generally useful
The logfile may provide useful clues when processing has failed
13 Warning MessagesAs already mentioned in Adding images sect3 and Integration sect9 warning messages are generated by MOSFLM during processing Atraffic light colour coding has now been assigned based on the warnings and is shown next to the Warnings box
A Red status implies a serious problem that will affect data quality and should be addressed
An Orange status implies minor issues that should be checked to see if things can be improved
A Green status means no significant problems messages are for information only
iMosflm Tutorial
fileUsersandrewg4MOSFLMnewgui_tutorialiMosflm_tutorial_720_ver3html[29052015 105311]
Abbreviated messages can be obtained by clicking on the Warnings icon The full warning Details together with Hints amp Notes text (ifany are available) can be obtained by double-clicking the relevant warning Details are displayed in a pop-up text box which willdisappear with the next click outside the box The same full details and suggestions are of course available in the mosflmlp files whereeven more information may be available
NOTE This is the end of the part of the tutorial which deals directly with iMosflm but see sect19 which has some suggestions forfurther work if you have time The remainder of this document deals with integrating and scaling data with MOSFLM andAimless via the CCP4i user interface examining the traditional mosflm SUMMARY file with the CCP4 utility loggraph
The Appendix contains a shell script for running MOSFLM as a traditional batch job
14 Useful command line optionsiMosflm has a number of command line options and these can be listed by typingimosflm --helpCurrent options are
--allimages -a ltfilenamegt Starts mosflm loading all files that match the template generated from ltfilenamegt--ccp4i2 Autosaves an iMosflm session file upon exit with an XML list of all iMosflm output files--debug -d Creates a large output file for debugging purposes Dont use this unless asked to by a developer--expert -e Permits access to advanced detector settings This should not normally be required--fastload -f Attempt to speed loading of many images offline while indexing two default images separated by 90 degrees--help -h Displays this message then exits--imagedir -I ltdirectorygt Starts the image browser in this directory if ltdirectorygt is given as an environment variable it will be expanded to its full value--init -i ltfilenamegt Starts Mosflm and reads from the given saved session file--startdir -S ltdirectorygt Starts mosflm in directory ltstartdirgt rather than the current directory This will only work if the directory exists and you have write permission to it otherwise iMosflm will exit All the normal mosflm output files will be in this directory--singleimage -s ltfilenamegt Starts mosflm loading only the image from ltfilenamegt--site -X ltfilenamegt Reads anyall of the following lines from the file given WAVELENGTH ltxgt DISPERSION ltxgt POLARISATION [PINHOLE | MIRRORS | MONOCHROMATOR | SYNCHROTRON ltxgt] DIVERGENCE ltxh xvgt BEAM ltbeamx beamygt DISTANCE ltxgt DISTORTION TILT ltxgt DISTORTION TWIST ltxgt GAIN ltxgt DETECTOR REVERSEPHI DETECTOR OMEGA ltxgt--version -v Displays the program version and required Mosflm version then exits
These can be abbreviated to the shortest unambiguous string
141 The site fileimosflm --site ltsitefilegt will read keywords from the file ltsitefilegt that will overwrite incorrect information in image headers Thissaves having to manually correct values in every iMosflm session The site file can also be read or written as an option from the Sessionmenu (see Drop down menus sect21) Allowed keywords areWAVELENGTH ltxgt
iMosflm Tutorial
fileUsersandrewg4MOSFLMnewgui_tutorialiMosflm_tutorial_720_ver3html[29052015 105311]
DISPERSION ltxgtPOLARISATION [PINHOLE | MIRRORS | MONO | SYNCHROTRON ltxgt]DIVERGENCE ltxh xvgtBEAM ltbeamx beamygtDISTANCE ltxgtDISTORTION TILT ltxgtDISTORTION TWIST ltxgtGAIN ltxgtDETECTOR REVERSEPHIDETECTOR OMEGA ltxgt
15 The mosflm SUMMARY fileMOSFLM produces a summary file listing refined parameters for each image and when using iMosflm this file will be date- amp time-stamped and have a name such as mosflm_20100518_131019sum This contains the same information as the plots produced by theiMOSFLM GUI which now also include the number of bad spots and overloads
This can be inspected graphically from the CCP4i GUI using the program loggraph Select the pull down menu View Files from Job andunder Output files select Additional log graphs where the _SUMMARYloggraph file will be listed Select this file to display its tablesin loggraph
This is very useful to identify rogue images (with unusually high positional residual or low Iσ(I)) If you find any read that image intoMOSFLM and see what is wrong with it
If you have done more than one integration run during your MOSFLM session you will find multiple entries of the tables Look at the lastset for integration of the 84 images
Click on the Refined detector parameter tables and check on the stability of parameters like the TILT and TWIST of the detector (unitsare hundredths of a degree) and for Mar Research (or DIP) image plate data the distortion parameters ROFF and TOFF (units are mm) Ifthey are varying a lot (more than 20 for TWISTTILT) or 015 for ROFFTOFF then it is probably a good idea to fix these parameters atthe average value (or the known values for this detector if they are available) (see Detector parameters sect821)
Click on the Post refinement table and check the missets It does not matter if they change slowly and by an amount (per image) that isless than 01mosaic spread If they are changing more than this then there could be a problem with processing the data (there is notmuch you can do about this)
Check how the mosaic spread is changing If it is unstable or if you think it is not refining to sensible values (as judged by looking atthe prediction) then you can fix the input value in the same way as the detector parameters (see Crystal parameters sect822)
BADSPOTS AND OVERLOADS
The program will set a rejection flag for those reflections that fail certain tests for example too much variation in the background levela poor profile fit an intensity that is very negative (more than 5 standard deviations) a very high gradient for the background planeThese reflections are called Bad spots and they are listed individually for each image in the mosflmlp file together with the reason forflagging them The number of bad spots is also written to the summary file Generally there should be very few (5-10) bad spots oneach image If there are more it could be because the backstop shadow is not correctly allowed for (consider using the NULLPIXkeyword)
There should also be very few overloaded reflections on each image If there are a lot then a separate low resolution data collectionpass should be made with a much shorter exposure time
IMPORTANT Both Bad spots and Overloads are written to the output MTZ file but will be rejected by default by AIMLESS Theintensity of overloaded reflections is estimated by profile fitting that part of the spot that is not saturated To include these reflections inthe final merged data use the ACCEPT keyword in AIMLESS
16 Scaling data with CCP4i ccp4i
Select Directories amp ProjectDir (top right)
In the new window select Add project
Enter the project name in the Project field and the full directory path in the uses directory field Default values may have been enteredalready here Select this project from Project for this session
Select Apply and Exit Dismiss the warning message that comes up
Select Data reduction from the pull down menu of modules (orange bar at top left)
iMosflm Tutorial
fileUsersandrewg4MOSFLMnewgui_tutorialiMosflm_tutorial_720_ver3html[29052015 105311]
Select Symmetry Scale Merge (Aimless)
In the window that appears do the following
Give a job title (top line)
Click on the box next to Separate anomalous pairs for outlier rejection amp merging statistics (the crystals have been soaked in a mercurycompound)
In the next orange bar (line starts HKLIN 1) select Browse and select the MTZ file output by MOSFLM (probably called hg_001mtz)Select OK
If you did not supply the Project name Crystal name or Dataset name to Mosflm fill in the boxes for these now
Under Scaling Protocol
From the pull-down menu on the line starting Scale select with automatic default settings
At the bottom of window from the pull-down menu named Run select RunampView Com File
This will display a new window showing the command file for running the POINTLESS step select Continue After a brief pause it willshow the command file for running AIMLESS (This can be edited before submitting the job) Select Continue
In the main window it will show that the AIMLESS job is running
When AIMLESS has finished the command file for running the CTRUNCATE step will appearselect Continue
When CTRUNCATE has run the main window will say FINISHED
At that point select the pull-down menu View Files from Job and select View Log Graphs This will give you the same graphs asrunning loggraph on the AIMLESS log file they are also the same as those that appeared in IMOSFLMs QuickScale task To look at thelog file itself (eg the overall merging statistics) select View Log File and it will appear in a new window
161 Looking at the AIMLESS output
The simplest way to look at the output from AIMLESS is to use loggraph on the AIMLESS log file (or via the CCP4i GUI) This can displaymany different graphs
Use Scales vs rotation range to check for smooth variation in the scale factor Check the variation in B factor with image and if there isno real variation it is best to turn off the B-factor refinement
Use the Analysis against all Batches for all runs to detect bad images (high R-factor large number of rejected spots)
Check the Analysis against resolution Fractional bias to see if there is any indication of Partial bias (A negative partial bias will resultif the mosaic spread is underestimated or if there is a lot of diffuse scatter
The Fractional bias should be less than 1-2 although it will often exceed this for weak data (eg in the high resolution bins)
The Axial reflections graphs in AIMLESS are useful for detecting systematic absences which can be used to identify the true spacegroup However the detection of screw axes is thought to be sufficiently robust in POINTLESS that these graphs are no longer necessary
It can also be useful to look at the AIMLESS log file itself in particular the table giving statistics as a function of resolution The effectiveresolution limit of the data can be estimated by looking at the Mn(I)sd column (this is the mean Iσ(I) AFTER merging symmetry matesand is the best indicator of data quality) This table also shows shell and cumulative R-factors
The Mn(I)sd values depend on having realistic values of the standard deviations (errors) in the intensities As the values that come fromMOSFLM are always underestimates of the true error these values are scaled up in AIMLESS using a three-term correction
sdcorrected = SdFac Sqrt[sd(I)2 + SdBLPI + (SdAddI)2]
Here SdFac is an overall scale factor and SdB and SdAdd are intensity dependent factors
AIMLESS will automatically work out a suitable value for all three parameters in order to make the mean value of (observedscatter)(sdestimate) equal to 10 where observed scatter is the difference between an individual estimate of intensity and the mean ofall other estimates (from symmetry mates)
Probably the best estimate of the true high resolution limit of the data can be obtained from the CC(12) values these are thecorrelations between equivalent observations that have been divided randomly into two half-datasets The resolution limit is foundwhen the CC drops below ~ 05 - 03
This table comes under the heading
ANALYSIS OF STANDARD DEVIATIONS
iMosflm Tutorial
fileUsersandrewg4MOSFLMnewgui_tutorialiMosflm_tutorial_720_ver3html[29052015 105311]
in the AIMLESS log file and Run n standard deviation v Intensity test (where n is 1 or more) in the CCP4i GUI View Files from Job -View Log Graphs display
Can you identify a bad image in this dataset Can you work out why it is bad
(Cluethe image headers contain quite a lot of information that is not used by MOSFLM including the date and time that the image wascollected)
You can exclude a given batch from the scaling using the EXCLUDE keyword
RUN ALL EXCLUDE imagenumber
In this case run number will be 1
Rerun the scaling SENDING THE OUTPUT TO A NEW LOGFILE excluding this image and see the effect on the heights in the anomalousPatterson (in the log file) DO NOT repeat the integration In the command file uncomment the line (near the top) goto aimless so itskips the integration part
In the CCP4i GUI click to highlight the AIMLESS job which is listed as FINISHED and select ldquoReRun Jobrdquo from the control buttons downthe right-hand side of the main interface window Under ldquoExcluded Datardquo in the window that appears check the box next to Excludeselected batches and pull-down on the menu button to exclude a range Give the start amp end range to exclude (eg 74 to 74) Rerunthe job as before
17 Changing the symmetryFrom the list of options at the left hand side of the main window select ldquoUtilitiesrdquo and under that SortModifyCombine MTZ Files
In the new window give a new title eg reindex as H32
Click on the Box Change space group andor reindex reflections
Use the browse option to select the input MTZ file (First orange bar) the output filename will be generated automatically (but you canchange it)
Under Reindex details
In the last option check the box next to ldquoChange space group tordquo and enter H32 in the box This is above the final item Reducereflections to the asymmetric unit which is checked by default
Select Run from the Run option button
Then go back to the scaling window and select the new MTZ file (reindexed) as the input for scaling (use Browse) CHANGE THE JOBTITLE
Then select RUN
The scaling will now be performed in space group H32 Look at the merging statistics in the log file in particular the multiplicityweighted R-factor called Rmeas in the log file
18 Looking at the CTRUNCATE outputThe CTRUNCATE program converts intensities to amplitudes and also compiles some useful statistics The LTEST and the cumulativeintensity statistics tabulated by CTRUNCATE (and plotted by loggraph) provide the only point at which you will be able to detectmerohedral twinning (when the two lattices of the twin components exactly overlap and every measured intensity is actually the sum oftwo intensities)
For a good dataset the observed distribution should be within 1 of the theoretical distribution Is this the case for this data
19 If you have time 191 Different mosaic spreads
Try repeating the processing with the mosaic spread set to a value 25 smaller than the refined one and fix it by checking the Fix boxin the Integration window in iMosflm
Can you tell from the merging statistics if this data is better
192 Checking up on outliers
iMosflm Tutorial
fileUsersandrewg4MOSFLMnewgui_tutorialiMosflm_tutorial_720_ver3html[29052015 105311]
AIMLESS writes a file called ROGUES which lists reflections which show very poor agreement between symmetry mates or which areimplausibly large
Look in this file (it is ASCII) and try to work out why this has happened The ROGUES file gives you the image (Batch) on which thereflections have been recorded (for partials this is the image nearest the centre of the reflection so you may need to look on thepreceding and following image as well) Select a reflection which shows very poor agreement with its symmetry mates (A value greaterthan 10 in the DelIsd column in the ROGUES file)
Select the offending image by double-clicking it in the Images pane of the iMosflm main window Predict the reflections then enter thehkl values into the boxes and hit Return (or click the red warning button following the entry box for l) to locate the offending reflectionin the image You must give the measured indices - the first set of values in the ROGUES file - when doing this See if there is anythingodd about the spot Remember to check adjacent images for partials
193 How accurate does the unit cell have to be
Try changing the cell parameters by (say) 10 and integrate the images again What is the effect on the merging statistics
20 Tips1 When reading images into a session DO NOT attempt to carry out any other task until ALL the images have been read2 It is often worth repeating the indexing (usually only once) as the refined direct beam coordinates from the first indexing may give
an improved solution when the indexing is repeated (lower rmsd)3 Always integrate a few degrees of data before integrating the whole dataset (see sect9) If the space group is not known in advance
run Quicksymm with a few degrees of data to check that the correct indexing solution has been chosen4 For difficult images do not attempt to refine the unit cell initially once an indexing solution has been obtained try integrating a
few images to ensure that the integration is stable If then going on to refine the cell check that the prediction looks OK for thefirst image of every segment included in the refinement If it does not look very good consider using the pattern matching(Settings -gt Processing options -gt Advanced refinement see sect84)
5 If the resolution of the data is less than 35 Aring do not use the ldquoRefine Cellrdquo task Instead use several images in indexing and use thecell that comes from the indexing
6 If iMosflm gets into a state where the activity icon(upper right) is spinning but nothing seems to be happening click on the activityicon to stop it spinning and see if the session can be continued DO NOT click on the activity icon simply to abort a task this willgive unpredictable results Use the Abort button for cell refinement or integration There is no defined way to abort indexing
7 Use the image summation option (see sect4) to get a better impression of the diffraction for very low exposure Pilatus images8 Use image summation for detector parameter refinement for fine sliced very weak Pilatus images (Settings -gt Processing options -
gt Advanced refinement see sect821)9 For large mosaic spread values (gt 10deg) or small mosaic block sizes (lt10) consider increasing the maximum allowed reflection
width to avoid having too many green predicted reflections (Settings -gt Processing options -gt Advanced integration see sect97)10 By default on selecting the Indexing task iMosflm will find spots index and (assuming a solution has been found) estimate the
mosaicity For difficult cases it is more useful to restrict this to simply finding spots and then do the indexing and mosaicityestimation by clicking the appropriate buttons To do this change the check box Automatically index after spot finding inSettings -gt Processing options -gt Indexing
11 See sect521 and sect522 for advice if the indexing fails Also consider the possibility of a reversed phi rotation direction if you arenot familiar with the beamline (Settings -gt Experiment settings -gt Experiment see sect21)
12 If the detector parameters have refined to physically unreasonable values (eg because cell refinement or integration has beencarried out using an incorrect indexing solution) be sure to reset the detector parameters before attempting further processing(Settings -gt Experiment settings -gt Detector see sect21)
13 Always set the resolution limit slightly beyond the point at which any spots are visible (see sect414 ) For very weak fine-sliceddata it can be very difficult to estimate the resolution visually so integrate to the maximum resolution (inscribed circle) and usethe merging results to set the final resolution There should be no problems integrating to a resolution ~03-05 Aring beyond theactual resolution limit but for example integrating to 3 Aring when the true resolution limit is 5-6 Aring may cause problems and theintegration should then be repeated with a more realistic resolution limit
14 Use the site file sect141 if repeatedly processing data where the direct beam position is wrong or if the phi direction is reversed etcto save having to correct this for every session
Appendix IA command script for running MOSFLM using the keywords copied from the Batch processing window of the new GUI (see Integratingas a background job sect952) Note that keyworded input for MOSFLM and other CCP4 programs is case-insensitive apart from file anddirectory names
bincsh -fv Set a unique identifier for filenames for this job
set ident = x89_mos07_blk3_smallsep
iMosflm Tutorial
fileUsersandrewg4MOSFLMnewgui_tutorialiMosflm_tutorial_720_ver3html[29052015 105311]
$ipmosflm COORDS $identcoords SUMMARY $identsummary ltlt eof-ip Insert keywords copied from iMosflm batch window here
Keywords for this run For example could involve trying different values for mosaic spread or not integrating all images etc etchklout $identmtzgenfile $identgenprocess 1 1000 goeof-ip
pointlesspointless hklin $identmtz hklout $ident_pointlessmtz
aimlessaimless hklin $ident_pointlessmtz hklout $ident_aimless_partmtz ROGUES $identrogues ltlt eof-aimless Use all default options for aimlesseof-aimless
ctruncate hklin $ident_aimlessmtz hklout $ident_truncatemtz
Harry Powell Andrew Leslie and Owen Johnson
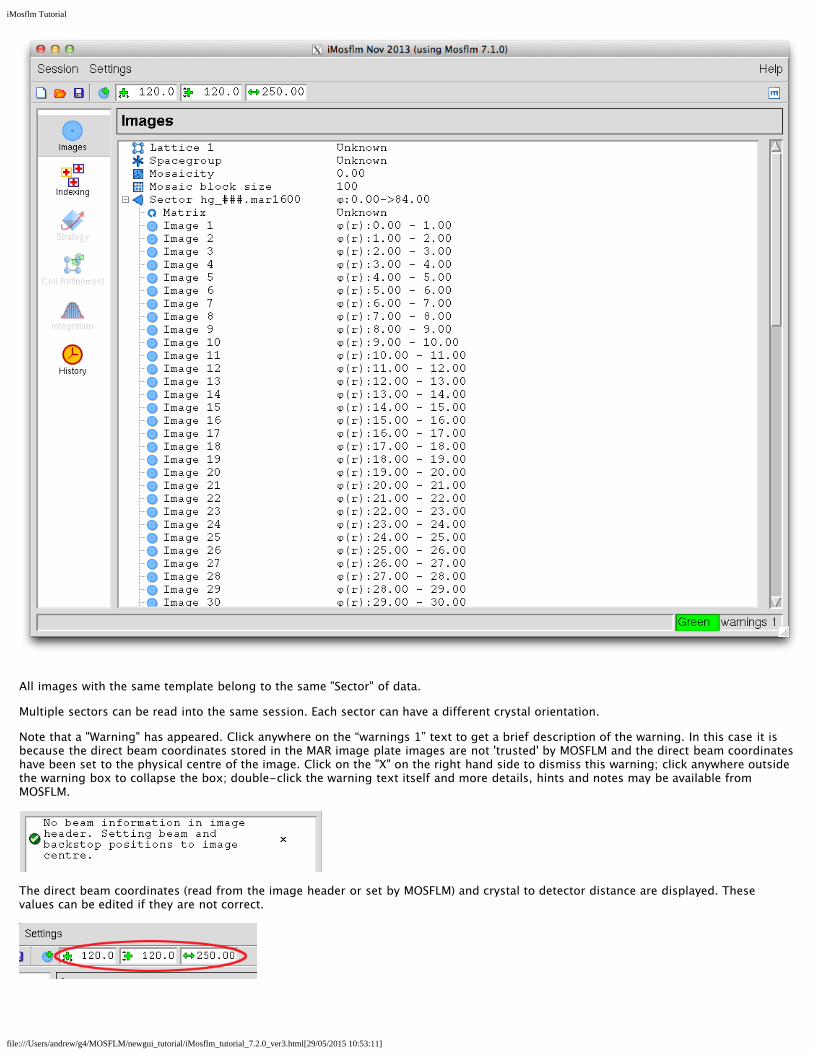
iMosflm Tutorial
fileUsersandrewg4MOSFLMnewgui_tutorialiMosflm_tutorial_720_ver3html[29052015 105311]
All images with the same template belong to the same Sector of data
Multiple sectors can be read into the same session Each sector can have a different crystal orientation
Note that a Warning has appeared Click anywhere on the ldquowarnings 1rdquo text to get a brief description of the warning In this case it isbecause the direct beam coordinates stored in the MAR image plate images are not trusted by MOSFLM and the direct beam coordinateshave been set to the physical centre of the image Click on the X on the right hand side to dismiss this warning click anywhere outsidethe warning box to collapse the box double-click the warning text itself and more details hints and notes may be available fromMOSFLM
The direct beam coordinates (read from the image header or set by MOSFLM) and crystal to detector distance are displayed Thesevalues can be edited if they are not correct
iMosflm Tutorial
fileUsersandrewg4MOSFLMnewgui_tutorialiMosflm_tutorial_720_ver3html[29052015 105311]
Advanced Usage
1 The phi values of images can be edited in the Image window First click on the Image line to highlight it then click with the mouseover the phi values to make them editable allowing new values to be given These new values are propagated for all followingimages in the same sector Starting values for the three missetting angles (PHIX PHIY PHIZ) may also be entered following theimage phi values
2 To delete a sector click on the sector name to select it (it turns blue) then use the right mouse button on the sector to bring up adelete button Move the mouse over the delete button (it turns blue) and click to delete the sector and its images Individualimages can be deleted from the Images pane in the same way
3 If one sector is added and used for indexing and then a second sector from the same crystal is added the matrix for the secondsector will not be defined To define it double-click on the matrix name for the first sector save it to a file double-click on thematrix name (Unknown) for the new sector and read the matrix file written for the first sector Alternatively it is possible to dragand drop the matrix from the first sector onto the second sector (drop onto the sector itself not the Matrix for the secondsector)
4 Image DisplayWhen images are added to a session the first image of the sector is displayed in a separate display window
iMosflm Tutorial
fileUsersandrewg4MOSFLMnewgui_tutorialiMosflm_tutorial_720_ver3html[29052015 105311]
The Image drop-down menu allows display of the previous or next image in the series (but this is easier to perform using the bluearrows displayed before the image name)
The View drop-down menu allows the image to be displayed in different sizes (related by scale factors of two) based on the imagesize and the resolution of the monitor
iMosflm Tutorial
fileUsersandrewg4MOSFLMnewgui_tutorialiMosflm_tutorial_720_ver3html[29052015 105311]
The Settings drop-down menu allows the colour of the predictions to be changed (see Indexing sect52 for the default colours) and thesize of the Pick box to be changed The third option (image summation) determines whether summed images are calculated byaddition or by taking the maximum or minimum values Only addition is implemented
The line below allows selection of different images either using right and left arrow or selecting one from the drop-down list of allimages in that sector Alternatively the image number can be typed into the Go to entry box
For Pilatus images only the Sum entry box will allow the display of the sum of several images the number (up to 20) can be chosenfrom the drop-down list
The image being displayed can also be changed by double-clicking on an image name in the Images pane of the main iMosflmwindow This will also re-active the image window if it has been closed
+ and - will zoom the image without changing the centre The Fit image icon will restore the image to its original size (right mousebutton will have the same effect) The Contrast icon will give a histogram of pixel values Use the mouse to drag the vertical dottedline to the right to lighten the image to the left to darken it Try adjusting the contrast The Lattice entry window can be used whenprocessing images with multiple lattices present see multiple lattices sect53
The reverse video icon allows an image to be rendered as light spots on a dark background that can help visualise small diffractionspots (eg for data collected using a Pilatus detector)
41 Display Icons
The eight icons on the left control the display of the direct beam position (since 720 a magenta cross not a green one) spots foundfor indexing bad spots predicted spots masked areas spot-finding search area resolution limits and display of the active mask forRigaku detectors respectively Clicking on these items will turn their display on or off
These are followed by icons for Zoom Pan and Selection tools and tools for adding spots manually (for indexing) editing masks circlefitting and erasing spots or masks
Next on this toolbar are the entry boxes for h k amp l and a button to search for this hkl among the predicted spots displayed on theimage The button resembles a warning sign if the given hkl cannot be found but a green tick if it is found The final icon relates toprocessing images with multiple lattices (see multiple lattices sect53) and is not described here
411 Masked areas - circular backstop shadow
Select the masked area icon A green circle will be displayed showing the default position and size of the backstop shadow
Make sure that the Zoom icon (magnifying glass) is selected and use the left-mouse-button (abbreviated to LMB in following text) todrag out a rectangle around the centre of the image The inner dotted yellow rectangle will show the part of the image that will actuallyappear in the zoomed area
iMosflm Tutorial
fileUsersandrewg4MOSFLMnewgui_tutorialiMosflm_tutorial_720_ver3html[29052015 105311]
Choose the Selection Tool When placed over the perimeter of the circle the radius of the circular backstop shadow will be displayedUse the LMB to drag the circle to increase its diameter to that of the actual shadow on the image The position of the circle can beadjusted with LMB placed on the cross that appears in the centre of the green circle Adjust the size and position of the circle so that itmatches the shadow
412 Masked areas - general exclusions
Choose the Masking tool Any existing masked areas will automatically be displayed Use LMB to define the four corners of the region tobe masked When the fourth position is given the masked region will be shaded This region will be excluded from spot finding andintegration This provides a powerful way of dealing with backstop shadows To edit an existing mask choose the Selection tool and usethe LMB to drag any of the four vertices to a new position
To delete a mask choose the Spot and mask eraser tool Place the mouse anywhere within the shaded masked area and use LMB todelete the mask Delete any masks that you have created
413 Spot search area
Select the Show spotfinding search area icon The inner and outer radii for the spot search will be displayed as shown below If theimages are very weak the spot finding radius will automatically be reduced but this provides additional control
Either can be changed by dragging with the LMB Do not change the radii for these images
iMosflm Tutorial
fileUsersandrewg4MOSFLMnewgui_tutorialiMosflm_tutorial_720_ver3html[29052015 105311]
Advanced Usage
The red rectangle displays the area used to determine an initial estimate of the background of the image It is important that this doesnot overlap significant shadows on the image It can be shifted laterally or changed in orientation (in 90deg steps) by dragging with theLMB
414 Resolution limits
Select the Show resolution limits icon The low and high resolution limits will be displayed The resolution limits can be changed bydragging the perimeter of the circle with LMB (make sure that the Selection Tool has been chosen) The resolution limits will affectStrategy Cell refinement and Integration but not spot finding or indexing The low resolution is not strictly correct (it falls within thebackstop shadow) but does not need to be changed because spots within the backstop shadow will be rejected
415 Zooming and Panning
First select a region of the image to be zoomed with the Zoom tool
Select the Pan tool and pan the displayed area by holding down LMB and moving the mouse This is very rapid on a local machine butmay be slow if run on a remote machine over a network
416 Circle fitting
The circle fitting tool can be used to determine the direct beam position by fitting a circle to a set of points on a powder diffraction ringon the image (typically due to icing) or to fit a circular backstop shadow (although using the masking tool is probably easier)
Select the circle fitting tool Three new icons will appear in the image display area There are two (faint) ice rings visible on the image at391Aring and 367Aring Click with LMB on several positions (6-8) on the outer ring (as it is slightly stronger) Then click on the top circularicon
A circle that best fits the selected points (displayed as yellow crosses) will be drawn and the direct beam position at the centre of thiscircle will be indicated with a green cross The direct beam coordinates will be updated to reflect this new position
iMosflm Tutorial
fileUsersandrewg4MOSFLMnewgui_tutorialiMosflm_tutorial_720_ver3html[29052015 105311]
5 Spot finding indexing and mosaicity estimationWhen images have been added the Indexing operation becomes accessible (it is no longer greyed-out)
Click on Indexing This will bring up the major Indexing window in place of the Images window
51 Spot Finding
By default the first image and a second image 90 degrees away in phi (or as close to 90 as possible) will be selected and a spot searchcarried out on both images (This is controlled by the Automatically find spots on entering Autoindexing tick box in the Spot finding tabof Processing options)
Found spots will be displayed as crosses in the Image Display window (red for those above the intensity threshold yellow for thosebelow) Only those above the threshold will be used in indexing The intensity threshold normally defaults to 20 but will beautomatically reduced to 10 or 5 for weak images The threshold is determined by the last image to be processed
The number of spots found together with any manual additions or deletions are also given
Images to be searched for spots can be specified in several ways
1 Simply type in the numbers of the images (eg 1 84 above)
iMosflm Tutorial
fileUsersandrewg4MOSFLMnewgui_tutorialiMosflm_tutorial_720_ver3html[29052015 105311]
2 Use the Pick first image icon (single blue circle)
3 Use the Pick two images ~90 apart icon (two blue circles) This is the default behaviour
4 Use the Select images icon (multiple circles) If selected all images in the sector are displayed in a drop-down list Click on aimage to select it then double-click on the search icon (resembling a target in the colum headed Find) for that image to run thespot search The image will move to the top of the list (together with other images that have been searched)
Images to be used for indexing can be selected from those that have been searched by clicking on the Use button If this box waspreviously checked then clicking will remove this image from those to be used for indexing It can be added again by clicking theSelect images icon and clicking on the Use box
Before indexing always check by looking at the image display that the spot finding has worked correctly ie that most spots thatyou can see have been found that multiple crosses have not been drawn over the same spot that spots have not been placedover ice rings or ice spots Check all images that will be used in indexing
511 If the spot finding has not worked well
Parameters affecting the spot search can be modified by selecting the Settings drop-down window and selecting Processing optionsThe resulting new window contains six tabs relating to Spot finding Indexing Processing Advanced refinement Advanced integrationand Sort Scale and Merge
The Spot finding tab allows the Search area Spot discrimination parameters Spot size parameters Minimum spot separation andMaximum peak separation within spots (to deal with split spots) to be reset It also allows the choice between a local backgrounddetermination (preferred) and a radial background determination The local background method also uses an improved procedure forrecognising closely spaced spots The only parameters commonly changed are
1 Minimum spot separation This should be the size (in mm) of an average spot (not a very strong spot) If there are badly split spotsthe spot finding may place two (or more) crosses for a single diffraction spot To avoid this happening set the minimumseparation in X and Y to values equal to the spot size in mm This can be found by zooming the image and counting the number ofpixels across the spot horizontally (X) and vertically (Y) To convert this to mm use the pixel size as given in Settings -gtExperiment settings -gt Detector This separation parameter is very important when spots are very close but usually the programwill determine a suitable value
2 Minimum pixels per spot Default value 6 but this should be reduced automatically if spots are very small (eg when using in situscreening and microfocus beam) If there clearly are spots present and the spot size is very small try reducing this parameter to 3or 2
3 Local background box size Reducing this from 50 to (say) 20 can reduce the number of false spots found near any sharp shadowon the image (or tile boundaries for tiled detectors) Normally these false spots are weak (and will be drawn as yellow crosses) inwhich case they will not affect the indexing
For data collected in-house the spots can be quite large and rather weak In such cases the spot finding parameters are automaticallychanged but some improvement may still be obtained by the following
1 Reduce the spot finding threshold (default 35) eg to 2
2 Change the minimum number of pixels per spot (default 30) to 20 or 40
3 Set the minimum spot separation to a sensible value eg 15mm see above
52 Indexing
Providing there are no errors during spot finding indexing will be carried out automatically after spot finding (This is controlled by theAutomatically index after spot finding tick box in the Indexing tab of Processing options) If the image selection or indexingparameters are changed the Index button must be used to carry out the indexing
iMosflm Tutorial
fileUsersandrewg4MOSFLMnewgui_tutorialiMosflm_tutorial_720_ver3html[29052015 105311]
Autoindexing will be carried out by MOSFLM using spots (above the threshold) from the selected images The threshold is set byMOSFLM but can be changed using the entry box in the toolbar The list of solutions sorted by increasing penalty score will appear inthe lower part of the window The preferred solution will be highlighted in blue There will usually be a set of solutions with lowpenalties (0-20) followed by other solutions with significantly higher penalties The preferred solution is that with the highest symmetryfrom the group with low penalty values
Note that all these solutions are really the same P1 solution transformed to the 44 characteristic lattices with lattice symmetryconstraints applied Therefore if the P1 solution is wrong then all the others are wrong as well
For solutions with a penalty less than 50 the refined cell parameters (ref) will be shown This can be expanded (click on the + sign) toshow the reg unrefined but regularised cell (symmetry constraints applied) and the raw cell (no symmetry constraints applied)
The rms deviation (rmsd) or error in predicted spots positions (σ(xy) in mm) and the number of spots used to refine the solution aregiven for each solution
Usually the penalty will be less than 20 for the correct solution although it could be higher if there is an error in the direct beamcoordinates (or distancewavelength) The rmsd (error in spot positions) will typically be 01-02mm for a correct solution but if thespots are split or very elongated it can be as high as 1mm or higher
The predicted spot positions for the highlighted solution will be shown on the image display with the following default colour codes
Blue Fully recorded reflectionYellow (orange for Pilatus) Partially recorded reflection
iMosflm Tutorial
fileUsersandrewg4MOSFLMnewgui_tutorialiMosflm_tutorial_720_ver3html[29052015 105311]
Red Spatially overlapped reflection these will NOT be integratedGreen Reflection width too large (more than 5 degrees) not integrated
These colours may be adjusted via the Settings -gt Prediction colour item in the Image display window
Providing there are no errors in the indexing MOSFLM will automatically estimate the mosaic spread (mosaicity) based on the preferredsolution
Select other solutions with a higher penalty and see how well the predicted patterns match the diffraction image
The rmsd and visual inspection of the predicted pattern are the best ways of checking if a solution is correct If the agreement is notgood then the autoindexing has probably failed
It is often worth repeating the indexing (once) as the refined direct beam coordinates from the first indexing may give animproved solution (lower rmsd)
521 If the indexing fails - Direct beam search
The indexing is very sensitive to errors in the direct beam coordinates For a correct indexing solution the error should be less than halfthe minimum spot separation Check for example that the current direct beam position is behind the backstop If there are any icerings these can be used to determine the direct beam position (see Circle fitting sect416 )
If the accuracy of the direct beam coordinates (generally read from the image header) is uncertain the program can perform a gridsearch around the input coordinates The number and the size of the steps can be set from the Indexing tab of the Processing optionsmenu (see Settings - Processing options sect21) but defaults to two steps of 05mm on each side of the input coordinates The directbeam search is started by clicking on the Start beam search button in the Indexing pane While in progress it can be stopped byclicking the Abort beam search button
The indexing will be carried out for each set of starting coordinates (Beam x and Beam y in the table which appears) and if a solution isfound the refined beam coordinates (Beam x ref Beam y ref) the unit cell parameters of the triclinic solution and the rmsd error in spotcoordinates and in phi will be listed The correct solution will generally be the one with the smallest rms error in spot positions (σ(xy))To make it simpler to identify the correct solution once the grid search has finished the solutions will be sorted on σ(xy) so the correctsolution will be at the top of the list When sorting the solutions those which have smaller cell parameters will be listed first as it ispossible to have a small σ(xy) value for an incorrect solution with a much larger unit cell Beware of solutions at the top of the list wherethe cell is clearly too small (only happens rarely)
Note that only the triclinic (P1) solution will be listed
If there is now a solution with a smaller rmsd value than before and especially if more than one set of starting beam coordinates has thesame refined coordinates this is a good indication that the beam search has worked Note that if the initial beam coordinates werewrong by more than ~15mm the search may not work In this case either select a new starting position for the direct beam or changethe number of steps
To complete the indexing double-click on the chosen solution and the full indexing will carried out for these beam coordinates withthe solutions appearing in the upper window The results of the direct beam search can be hidden (collapsed) by clicking on the Hidebutton and recovered by clicking on the Show button
iMosflm Tutorial
fileUsersandrewg4MOSFLMnewgui_tutorialiMosflm_tutorial_720_ver3html[29052015 105311]
522 If the indexing fails - Other parameters
Errors in other physical parameters (wavelength crystal to detector distance) can also result in failure All these parameters should bechecked
Several parameters used in autoindexing can also be adjusted using entry fields and buttons that appear in the Indexing toolbar
Weak images
1 MOSFLM automatically reduces the Iσ(I) threshold for weak images and it may also reduce the resolution to 4Å but lower valuescan be tried It is important not to include spots that are not real - a small number of false spots can prevent the indexing fromworking
2 Try changing parameters for spot finding (see If the spot finding has not worked well sect511)
Multiple lattices
1 Try increasing the Iσ(I) threshold (default 20) for example to 40 or 60 so that only spots from the stronger lattice are selectedThis can be done by entering a new value in the leftmost of the circled icons above (and also via the Indexing tab of Processingoptions)
All cases
1 Include more images in the indexing Select images that are widely spaced in phi not close together2 Select images that show the clearest lunes andor have the best spot shape3 In case the crystal orientation has changed or if you are unsure of the direction of positive rotation in phi try indexing using only
one image4 Make sure that the Max cell edge value is not too small If in doubt set to 200 Aring (or more if the cell is expected to be large)5 If the cell parameters are known reduce the maximum allowed cell edge to the known maximum cell edge This can sometimes
help filter incorrect solutions but use with caution as often this needs to be ~twice the largest cell for successful indexingAlternatively try the known cell option
6 If the detector distance is uncertain and the images are high resolution (eg 2Å) allow the detector distance to refine during cellrefinement Use with caution
53 Indexing multiple lattices simultaneously
This is a new feature and is still undergoing development It is most likely to succeed when the different lattices are clearly separated atleast at higher resolution If the images shows badly split spots with several components (each arising from a sub-crystal with a slightlydifferent orientation) then indexing may well still be impossible
After spot finding examine the image to ensure that spots that are close to each other but belong to different lattices have beenidentified as separate spots and not treated as a single split spot (in which case the red cross will lie midway between the two spots)Adjusting the minimum spot separation (Settings -gt Processing options -gt Spot finding) can help in resolving close spots It may alsohelp to increase the inner radius of the spot search region (see Spot search area sect413) so that low resolution reflections where the
iMosflm Tutorial
fileUsersandrewg4MOSFLMnewgui_tutorialiMosflm_tutorial_720_ver3html[29052015 105311]
spots are not really separated are excluded from the search
The following procedure usually provides the best chance of success
1 Select appropriate images for use in indexing The separation of the lattices can be clearer on some images than others Ideallychoose several images widely separated in phi
2 Do a normal (single lattice) indexing first This will usually work but will give a high positional rmsd because of the presence of morethan one lattice This step is important because it will result in more accurate direct beam coordinates which are crucial for multi-lattice indexing
3 Select the ldquoIndex multiple latticesrdquo icon (next to the Index button) the Index button will change to Index multiple
The indexing results for different lattices will be presented in different tabs while the selected solution for each lattice will be shown inthe lower Summary window Currently a maximum of 5 lattices can be handled The figure below shows a case where 3 differentlattices were found
4 Judge the success of indexing by examining the lattice type and the cell parameters obtained for the different lattices (the cellsshould be very similar) and checking that the predictions match the observed spots The rmsd values for correct lattices should also besignificantly smaller than the value obtained in the initial (single lattice) indexing It may be necessary to manually select a differentautoindexing solution for some lattices in order to get the same lattice type (eg oP) for the different lattices
The Split column in the lower pane indicates the angle between the reference lattice (with value -) and the other lattices This is onlycalculated when the lattices have the same lattice type In this case the angles between lattice 1 and lattices 2 amp 3 are 34 and 16degrees
If a lattice is clearly incorrect it can be deleted by highlighting that lattice (in the lower pane that summarises the results) and using theright mouse button to select ldquodeleterdquo
The predictions for different lattices can be displayed either by highlighting the lattice in the Summary window or by using the latticeselector in the image display pane
iMosflm Tutorial
fileUsersandrewg4MOSFLMnewgui_tutorialiMosflm_tutorial_720_ver3html[29052015 105311]
In the image display spots in different lattices that overlap with each other are shown in magenta Only the summed intensity will bemeasured for these reflections
The predictions for all lattices can be shown by selecting the ldquomerge latticesrdquo icon in the image display
This can be useful to check if all the lattices have been successfully indexed because all spots in the image should then be predicted Inthe display predictions from lattice 12345 are shown in blue yellow red green and magenta with no distinction made between fullyand partially recorded reflections or spatial overlaps
iMosflm Tutorial
fileUsersandrewg4MOSFLMnewgui_tutorialiMosflm_tutorial_720_ver3html[29052015 105311]
531 Practical Tips
Beware of solutions where the lattices only vary in orientation by a small angle (less than 1 degree) as these are often different solutionsfor the same lattice The difference in orientation between lattices is given by the ldquosplitrdquo column in the Summary window but this is onlycalculated if the lattices have the same lattice type Differences are all relative to one lattice which will display a split angle as ldquo-ldquo Tocalculate the angles relative to a different lattice open the tab for that lattice select a different solution to that currently selected andthen select the original solution ndash this will trigger recalculation of the split angles relative to that lattice
Other parameters that can influence the indexing are the rdquoMaximum deviation from integral hklrdquo (default 02 when indexing multiplelattices otherwise 03) and ldquoNumber of vectors to find for indexingrdquo (default 30) These can be changed via the Indexing tab of theldquoProcessing Optionsrdquo that can be selected from the ldquoSettingsrdquo menu item Values between 015 and 025 might be helpful for the firstparameter and increasing the number of vectors from 30 to 50 can also help At present there is no defined protocol for changing thedefault parameter values for particular cases it has to be done by trial and error
Experience so far has shown that selecting appropriate images and adjusting the maximum cell length used in indexing have the biggesteffect The optimum value for the maximum cell length will normally lie between one and three times the largest cell dimension but it isworth varying this in steps of between 25 and 50 Aring as the indexing can be very sensitive to this parameter
For a more complete discussion of multiple lattice indexing see Powell HR Johnson O amp Leslie AGW 2013 Autoindexingdiffraction images with iMosflm Acta Cryst D69 1195-1203
54 Known cell option
For images that are very difficult to index if the cell parameters are known the known cell option can be usedSelect the ldquoKnown cellrdquo icon (next to the Multiple lattices icon) Enter the cell parameters in the Input known cell pop-up window andselect OK when all 6 parameters have been provided Then select the Index Cell button
To revert to normal indexing select the ldquoKnown cellrdquo icon and then select Clear in the Input known cell pop-up window
55 Space group selection
Note that the indexing is based solely on information about the unit cell parameters It will therefore be very difficult (or impossible) todetermine the correct Laue group in the presence of pseudosymmetry For example a monoclinic space group with β ~ 90deg will appearto be orthorhombic an orthorhombic space group with very similar a and b cell parameters will appear to be tetragonal These can onlybe distinguished when intensities are available (ie after integration) by running POINTLESS (QuickSymm) (see Running Pointless to check the
iMosflm Tutorial
fileUsersandrewg4MOSFLMnewgui_tutorialiMosflm_tutorial_720_ver3html[29052015 105311]
symmetry sect10)
In addition it is not possible to distinguish between Laue Groups 4m and 4mmm 3 and 3m 6m and 6mmm m3 and m3m Thiswill not affect integration of the images but it will affect the strategy calculation In the absence of additional information the lowersymmetry should be chosen for the strategy calculation to ensure that a complete dataset is collected
The presence of screw axes also cannot be detected so there is no basis on which to distinguish P21 from P2 etc This does not affectany aspect of data collection or processing and can be chosen (on the basis of systematic absences) after integration by runningPOINTLESS
In this example there is no way of knowing at this stage if the space group is h3 or h32 so leave it as h3
56 Mosaicity estimation
If the Automatically index after spot finding option has been chosen (Indexingtab of Processing Options) the mosaicity (mosaic spread) will be estimatedautomatically for the preferred solution However if another solution is chosenthe mosaicity should be estimated again
Click on the Estimate button to estimate the mosaicity
A window will appear which plots the total predicted intensity as a function ofmosaic spread from which an estimate is determined
The predictions displayed on the image will be updated Entering different valuesof mosaic spread in the box (followed by return) will allow a visual estimate of theeffect of changing the mosaic spread
The mosaic spread can also be entered in the Images pane by clicking once on theMosaicity line and once again on the value displayed
561 The mosaic block size
In some cases the apparent mosaic spread is much larger at low resolution than at high resolution so that if it is set to a value thatresults in all the low resolution spots being predicted many more spots are predicted than are visible at high resolution This effect isbest dealt with by adjusting the Mosaic block size which is also displayed in the Images pane This is modelling the size in microns ofthe individual mosaic blocks in the crystal Decreasing this to values of 05-5 microns (say) from the default of 100 microns will resultin predicting more spots at low resolution but have virtually no effect at high resolution This parameter is not refined (at present) andso the best value must be determined by trial and error
6 Saving and recovering a sessionThe session can be saved at any time using the Session drop-down menu referred to in sect21 The first time that a session is saved youwill be prompted for a filename The filename convention for saved session files is that the extension is mos
Save the current session Then exit from iMosflm (using the Session drop-down menu) restart iMosflm and read in the saved session
If the program crashes it should be possible to recover all but the latest actions as a temporary copy of the session file is continuallysaved to the directory mosflm in the users home directory
Restart iMosflm and it will pop up a Recover session window
Selecting the Recover button will restore the session as far as possible
iMosflm Tutorial
fileUsersandrewg4MOSFLMnewgui_tutorialiMosflm_tutorial_720_ver3html[29052015 105311]
7 Data collection strategyOnce the crystal orientation and (probable) Laue group have been determined it is possible to calculate a data collection strategy andthe Strategy icon is no longer greyed-out (in fact all other operations Strategy Cell Refinement and Integration become possible at thispoint)
Select the Strategy icon This will open the Strategy window
The statistics initially presented in the window are based on the images read in to the current session If only two (or more) references
iMosflm Tutorial
fileUsersandrewg4MOSFLMnewgui_tutorialiMosflm_tutorial_720_ver3html[29052015 105311]
images have been read in no statistics will be presented
When the Strategy option is used after two initial images (typically 90deg apart in φ) have been collected a complete shaded segment willnot be shown in the lower part of the screen rather an empty circle will be shown with the matrix label beneath it Click the Auto-complete button and in the pop-up menu that appears select a rotation angle or sweep of data to collect - or leave the Rotationsetting as Auto for a calculation of maximum completeness for this crystal orientation Click on Ok and the completeness results willbe presented
The orientation of the crystal expressed as the angles between the abc unit cell axes and the XYZ coordinate frame is given X isalong the X-ray beam Z is the rotation axis A warning will be given if the unique axis is so close to the rotation axis that there will bemissing cusp data
71 Evaluating completeness manually
The completeness of any given segment of data can be determined manually using the circle at the bottom left of the window Click onthe red segment shown in this circle
This will result in small black boxes being drawn on the circumference at the start and end of the red sector
Use the LMB to click on the black box at 0 and drag this around the circle
When the LMB is released the statistics for that sector will be displayed The statistics are presented in two ways Near the top right ofthe window the overall completeness is shown as red circles for unique data and anomalous pairs The average multiplicity is givenbeneath these circles
More detailed statistics (such as completeness as a function of resolution) are given in a series of histograms that can be selected by adrop-down menu
72 Calculating a strategy automatically
Uncheck the Use checkbox at the right side of the hg_001 line listed in the sector list near the top of the Strategy pane This means
iMosflm Tutorial
fileUsersandrewg4MOSFLMnewgui_tutorialiMosflm_tutorial_720_ver3html[29052015 105311]
that the 84 images used thus far will not be included in the completeness calculation only the matrix derived from indexing them willbe used Select the Auto-complete button to calculate a strategy automatically
A strategy calculation data pop-up window will appear
If multiple matrices have been defined (for different sectors of data) then the appropriate one can be selected (if there is only one sectorthis has no effect)
The total φ rotation to be used is normally calculated by MOSFLM based on the Laue group and the crystal orientation (the Auto setting)However it is sometimes possible to achieve a high completeness with a significantly smaller total rotation (eg 60deg in two 30degsegments will typically give gt94 completeness for orthorhombic space groups) and this can sometimes be useful if radiation damage isa serious problem although when using hybrid pixel detectors it is better to use a very conservative exposure time and collect a wide φrotation
Total rotation angles of between 5deg and 90deg can be selected from the drop-down list The number of segments to be used can be setbetween 1 and 3
If the check box is checked data completeness will be calculated to optimize the proportion of anomalous data collected
THIS IS IMPORTANT The optimum strategy is often different when maximising completeness of the anomalous data
Choose the default values (Rotation Auto Segments 1) but check the anomalous data box then click on Ok Look at the variousstatistics presented as bar charts
In space group H3 if rotating around the c axis a total rotation of 120deg would be required to collect a complete dataset (ignoring anydata lost in the cusp) Because the c axis is 22deg away from the rotation axis in this case it is possible to collect very high completeness(for unique data) with a rotation much smaller than this
Try to find the minimum total rotation that will give a dataset that is gt95 complete for the unique data Now do the same butrequiring gt95 completeness for the anomalous data
SKIP OVER SECTION 73 IF DOING THE NORMAL TUTORIAL
73 Calculating a strategy using multiple crystals
The Strategy pane may also be used when due to radiation damage many crystals are required to collect a complete dataset
IMPORTANT This procedure will only work correctly for space groups where there is no indexing ambiguity For those spacegroups where there is an indexing ambiguity( see httpwwwccp4acukdisthtmlreindexinghtml for a complete list) it isnecessary to integrate images to determine whether different crystals have been indexed in the same way This is not achievablewithin the Strategy option at present
Suppose the first crystal has been indexed from the reference images
Enter the Strategy pane an empty circle is displayed in the bottom part of the screen and click on the Auto-complete button nearthe top-right of the pane In the Auto-complete window that appears choose a suitable Rotation angle for the amount of datathat can be collected from one crystal say 20 degrees for this example Leave Segments set to 1 and do not check Optimize foranomalous data
Click the Ok button and the completeness of the data will be displayed The matrix name start and end phi values and the phiextent will be displayed in the top area of the pane with a checkbox ticked under the Use column This means this segment will beused in further strategy calculations
Accept and save this result by clicking on the yellow hatched segment displayed in the large circle near the bottom of the paneClick once and the segment will be outlined in black (you can adjust the start or end phi value calculated in one degree incrementsby click+dragging the respective black square) click again this time on the black square denoting the start or end phi (or release ifyou have adjusted by click+dragging) and the segment will turn red The segment will not be saved unless it has turned red
This result will be saved if you leave this pane (eg to load more images) and return later in this session The strategy file can alsobe saved to a permanent file using the Save button on the tool-bar This is highly recommended when working with many crystals
Return to the Strategy pane when you have loaded and indexed the reference image(s) from the second crystal and repeat the procedureabove You will see the calculated segment from the first matrix displayed at the bottom-left of the screen The optimum phi range for
iMosflm Tutorial
fileUsersandrewg4MOSFLMnewgui_tutorialiMosflm_tutorial_720_ver3html[29052015 105311]
the second crystal will be displayed Save this in the same way as for the first crystal (clicking twice) Repeat this procedure for anysubsequent crystals and in each case the optimum phi range will be calculated for the latest crystal taking into account the data fromprevious crystals
It is a good idea to save the strategy to a file as each new crystal is added in case the program crashes and this information is lost
In practice it is probably safest to have a separate iMosflm session that is reserved for the strategy calculations and not used to processany data The strategy for each new crystal can be calculated as described above If there is a problem and the session is corrupted or ifiMosflm is closed down for any reason it is straightforward to restore the status of the session providing the strategy has been savedThe following steps should be taken
1 Read in the reference images for the latest crystal and index them
2 Select the Strategy pane
3 Read in the optimised strategy for all previous crystals using the ldquoAddrdquo button and giving the appropriate filename
4 Making sure that the circle for the latest crystal is highlighted in the lower left window click on lsquoAuto-completersquo and follow the stepsdescribed above
Advanced Usage
The startend phi values for each crystalmatrix can be updated This might be required if for example only 10 degrees of useful datawere collected from a particular crystal instead of the anticipated 20 degrees To change the phi values click either on the matrix namein the top pane or on the circle showing the segment of data in the lower left pane (these are highlighted in a blue box as the mousemoves over them) The corresponding segment will now be displayed in the larger circle Click on the red segment so that a blacksquare appears at the startend phi values Then simply drag the appropriate phi to the desired value The completeness willautomatically be updated (but the strategy calculation for the latest crystal will not be repeated to do this the current segment must bedeleted by highlighting the matrix name and using right click and then repeating the Auto-complete step)
If matrix files saved from iMosflm are available from crystals for which data have been collected in previous sessions these can beadded into the calculation using the Add matrix button on the tool-bar
If the saved strategy result has become complicated or is incorrect and you wish to restart the calculations afresh there is a tool-barbutton Reload sectors from session This will remove any calculated sectors while leaving any known matrices listed at the bottom-leftof the Strategy pane
If you have saved a strategy file from a previous session this can be used to re-initialize the Strategy pane using the Load button onthe tool-bar
A Spacegroup pull-down menu has been added to the tool-bar to permit different choices of space group to be used in thecalculations (eg H3 and H32) This menu is populated from the list offered on the Indexing pane However the space group symboltext is editable Any space group symbol entered will be validated by Mosflm together with the current cell parameters
As a calculator for a multi-segment strategy the Strategy pane is reasonably flexible you can Save or Delete highlighted matrix lines byright-clicking As you highlight different matrix lines the orientation of the crystal expressed as the angles between the abc unit cellaxes and the XYZ coordinate frame is re-displayed in the centre of the pane
The following screen shot shows the cumulative results in the Strategy pane after this procedure has been followed for four crystals(ignore the iMosflm version number)
iMosflm Tutorial
fileUsersandrewg4MOSFLMnewgui_tutorialiMosflm_tutorial_720_ver3html[29052015 105311]
731 Calculating a strategy when some data have already been collected and processed
This option is not yet implemented If data have already been processed (to give an MTZ file) but the images are not currently available (eg they were collected on a previoussynchrotron trip possibly at a different synchrotron) then the MTZ file containing this data can be read and used to calculate a strategyfor data collection from new crystalsThe MTZ icon in the tool bar is used to read the MTZ file
74 Calculating a suitable oscillation angle
To calculate the maximum possible oscillation angle while avoiding spatial overlaps click on the Check for overlaps button A pop-upwindow will appear from which the option to calculate the maximum oscillation angle (as a function of φ) or check how many overlapswill occur for different (user selected) oscillation angles The results are plotted in the same pane as the histograms for the strategycalculations Note that the overlap calculation is based on the current values for the mosaic spread and spot separation and can be verysensitive to these values Note also that these are maximum and not necessarily recommended oscillation angles
iMosflm Tutorial
fileUsersandrewg4MOSFLMnewgui_tutorialiMosflm_tutorial_720_ver3html[29052015 105311]
8 Cell refinementIt is important to determine the cell parameters accurately before integrating the images Although the unit cell is refined as part of theautoindexing providing the diffraction extends beyond ~35Å resolution it is possible to obtain more accurate cell parameters using aprocedure known as post-refinement This procedure requires the integration of a series of images in ideally two or more separatesegments at widely different φ values The distribution of the intensity of partially recorded reflections over the images on which theyoccur is used to refine the unit cell crystal orientation and mosaic spread
Select the Cell Refinement icon
81 Selecting the images
iMosflm Tutorial
fileUsersandrewg4MOSFLMnewgui_tutorialiMosflm_tutorial_720_ver3html[29052015 105311]
There are several ways to select the images to be used in cell refinement Whichever method is used the image numbers will bedisplayed in the Images entry field iMosflm will automatically select appropriate images but these can be changed
811 Manual selection
A list of images can simply be typed into this box An image series can be specified as n-m where n and m are the first and last imagesDifferent series must be separated by white space or comma
For orthorhombic or higher symmetries two segments should be given approximately 90deg apart in φ For monoclinic or triclinic datathree or four segments are best (eg φ = 04590135)
The number of images that should be included in each segment depends on the mosaic spread and oscillation angle A reasonablenumber is 2(mosaic spreadoscillation angle +1) MOSFLM will automatically select two or more segments as appropriate Note thatthere is a limit on the total number of images that can be used
812 Automatic selection
Selecting the Automatically select images icon will select a suitable set of images
813 Graphical selection (Not recommended)
Selecting this icon will give a new window
Images can be selected by clicking in the Use check-box in the list of images or by using the mouse to drag a selection of imagesfrom the sector displayed The other icons allow the sector to be zoomed in or out and the viewed area to be moved to make theselection easier The final two icons on the tool-bar switch the segment display to fit the display space as either a full circle or aquadrant This Image palette can be closed by clicking outside its area but will close after 60 seconds anyway
82 Integrating the images and refining the cell
Use one of the methods above to select images to use in cell refinement and click on the Process button Before starting cell refinementcheck that the prediction for the first image in each segment to be used is good The majority of the spot positions must be correctlypredicted for the first image in each segment or else the refinement will not work
The selected images will be integrated and following integration the cell parameters are refined Selectable refined detector parameters
iMosflm Tutorial
fileUsersandrewg4MOSFLMnewgui_tutorialiMosflm_tutorial_720_ver3html[29052015 105311]
will be plotted as will the changes in crystal orientation and (if selected) mosaic spread If the shift in cell parameters is greater than 25standard deviations another cycle of integration and cell refinement is carried out Typically two or three cycles are required forconvergence Note that the current program activity is shown in the bottom left-hand corner of the window in the status message area
The different windows are explained below Moving the mouse over any parameter or plotted graph point will give a full description ofit
821 The detector parameters window
The values of the refined detector parameters are displayed for each image as it is integratedThere is the option to fix any of the parameters during integration by checking the Fix box onthe right The positional residuals (overall central and weighted) are also listed
Any of these parameters can be selected for plotting on the graph that appears to the right ofthis box by simply clicking on that parameter (which is then highlighted in blue as shown herefor Beam x and Beam y)
Check the stability of the refined parameters by displaying the appropriate graphs To getsensible scaling of the graphs only parameters with similar numerical values should be plottedtogether
For weak images (ie few visible spots in the outer regions of the image) the tilt and twistmay not be well defined and might refine to large values (greater than one degree) Insuch cases these parameters should be fixed It is not generally recommended to fix any
iMosflm Tutorial
fileUsersandrewg4MOSFLMnewgui_tutorialiMosflm_tutorial_720_ver3html[29052015 105311]
other detector parameters
For very weak fine sliced images (Pilatus only) there is the option to sum images when findingsuitable spots for refinement see Settings -gt Processing Options -gt Advanced refinementwhich can in some cases make the refinement more stable
822 The crystal parameters window
The values of the refined crystal missetting angles φ(x) φ(y) φ(z) the unit cell parameters andmosaic spread for the current image are displayed in the table Selected parameters will beplotted as for the detector parameters Specific unit cell parameters can also be fixed
If more than one segment of data is being used for cell refinement it is not unusual to see achange in orientation of the crystal between the two segments
Observe how the crystal orientation is different for images in the two segments See how themosaic spread varies during refinement
823 The central spot profile
The average spot profile for the central region of the detector is plotted for eachimage This confirms that the spot prediction is good If the profile is not welldefined and central in the box or if the blue border for the peak region of the spot ismuch larger than the apparent spots size it suggests a problem with the integrationand the initial prediction should be checked In some cases it may be necessary toincrease or decrease the Profile Tolerance parameters to ensure that the blue boxfits the spot To do this select the Advanced integration tab of Processing optionsCheck the central spot profiles for the images used in the cell refinement
824 The summary window
This window presents a summary of how selected parameters have changed indifferent cycles of the cell refinement The behaviour of these parameters gives agood indication of whether the cell refinement has been successful
If the refinement has been successful the RMS residual should be lower for thefinal cycle than in previous cycles However errors in the cell can be compensatedquite well by changing the crystal to detector distance so the differences are notalways dramatic
The other parameters that can be plotted from the pull-down list are the detectordistance and the Pixel ratio (Yscale)
The detector distance should be the same for all images in the refinement If the original indexing was based on auto-indexing a singleimage (say the first) then the detector distance might change for images from the second segment to compensate for an error in theoriginal cell If the variation in distance for different images increases with the cycle number this indicates that the refinement is notstable
The Pixel ratio (Yscale) parameter may also show an initial variation for images in different segments because refining Yscale (whichshould be 10000 for all except Raxis II and Raxis HTC detectors) can compensate for errors in cell dimensions in the same way that thedistance can The final values (last cycle) should be very close to identical for all images and should also be very close to unity (to within00010)
Cell refinement can be unstable if the data do not extend to at least 35 Aring If it appears unstable use the cell derived from auto-indexing a series of images well spaced in φ instead
iMosflm Tutorial
fileUsersandrewg4MOSFLMnewgui_tutorialiMosflm_tutorial_720_ver3html[29052015 105311]
Examine the plots to see if the parameters are stable and correct (Yscale)
825 The final results
When refinement has converged (or after 5 cycles) the initial and final cell parameters and the estimated errors (std dev) are listed
If time is available make a note of the std dev values and repeat the cell refinement using a larger number of images in each segmentAre the standard deviations smaller when using more images
83 Refining cell parameters for multiple lattices
Providing the resolution is high enough (generally better than ~35-32 Aring) and not too many of the spots in the different lattices areoverlapped it is possible to refine the cell parameters for each lattice individually The lattice to be refined is selected from the Latticeselector
This selector will be grayed out when processing a single lattice
84 If the prediction for the first image of a segment is poor
In some cases depending on how the indexing has been carried out or if the diffraction is poor or there has been a large change incrystal orientation during the data collection the prediction for one or more of the segments (the first image) may be poor In suchcases the integration and hence the cell refinement may fail It may be possible to successfully process the images after an initialrefinement of the crystal orientation using a pattern matching algorithm To select this option got to the Advanced refinement tab ofProcessing options and select the tick box for Refine orientation of first image in any run by pattern matching and for Integrate allimages Then refine the cell in the usual way During integration the orientation will be refined for the first image of each segmentoutput for this additional refinement will be written to the logfile but is not shown in the GUI
9 IntegrationThe accurate cell parameters are now used in the integration Note that although the images are integrated during the cell refinementthe intensities are not saved and no MTZ file is generated at that stage
It is good practice to start by integrating a block of images corresponding to a few degrees of data to check that the parameters do notneed further adjustment MOSFLM will generate warning messages after integration if there are any difficulties and it may be possibleto improve the situation by changing some of the default parameters (see Warning messages sect13)
Before integration ensure that the backstop shadow has been defined (see Masked areas backstop sect411 and Masked areas generalsect412)
91 Image selection
Image selection is performed in exactly the same way as in the cell refinement In this case the Automatic selection will simply includeall images in the current sector
Select images 1-10
92 Setting the MTZ filename and controlling updating of the image display
Two icons appear when the integration option is chosen
If the Show predictions icon is clicked the display window will be updated as eachimage is processed This will slow down the processing but allows the accuracy of theprediction to be checked for each image
iMosflm Tutorial
fileUsersandrewg4MOSFLMnewgui_tutorialiMosflm_tutorial_720_ver3html[29052015 105311]
Click on this icon so that the display will be updatedThe filename of the MTZ file containing the results of the integration is generatedautomatically but can be edited manually
93 Integrating the images
Click on the Process button to start integration
Integration of the images occurs in two passes In the first pass for each block of images (a number corresponding to a few degrees ofdata selected automatically by MOSFLM) the detector and crystal parameters are refined for each image in turn and the measurementboxes for all predicted spots are written to a file for use in the second pass In the second pass the standard profiles are formed fromreflections present on all of the images in this block and each image is then integrated and the results written to the MTZ file Thedisplay is not updated during the second pass and will remain on the last image of the block (assuming image updating has beenselected)
Note that the unit cell dimensions are normally fixed during integration and only the crystal orientation and mosaic spread are refinedCrystal parameter refinement only starts when a sufficient number of images have been integrated to provide data for the post-refinement typically after ~05-1 degree (more for high mosaicity)
94 Parameter display windows
As described in sect82 the refined detector and crystal parameters will be displayed in tables and selected parameters will be plotted ingraphs The average spot profile for each image will also be displayed
The size of these graphs (and the profile) can be expanded to fill the whole window by holding down Shift and clicking LMB anywherein the graph window A second Shift+click will revert the graph to the original size
In addition to these windows there are windows that tabulate and plot (as a function of image number) the mean Iσ(I) for profile fittedand summation integration intensities The overall values and the values for the highest resolution bin are given
The number of overloaded reflections Bad spots (ie those that fail certain tests see mosflm SUMMARY file sect15) Spatial overlaps andif processing multi-lattice images the number of lattice overlaps is listed for each image and can be plotted by highlighting thatparameter When processing data from crystals with large unit cells it is important to watch out for spatial overlaps (see sect97 for tips onhow to reduce the number of spatial overlaps if this is a problem)
A display of the standard profiles for different regions of the detector is also provided Poor profiles are averaged by includingreflections from inner regions of the detector Averaged profiles are indicated by a red line around the spot (rather than blue) Theoriginal unaveraged profile can be viewed a clicking on the profile (providing there were sufficient spots in that region to allowformation of a profile)
The profiles should be checked to see that they are well defined and centred within the box Poorly-defined diffuse or non-centredprofiles may suggest that the prediction is not very good in which case this should be checked on the corresponding image(s)
It may be useful to expand the standard profiles to fill the window using Shift + click in the profiles window
Finally the lower left window plots Iσ(I) as a function of resolution for any selected image
iMosflm Tutorial
fileUsersandrewg4MOSFLMnewgui_tutorialiMosflm_tutorial_720_ver3html[29052015 105311]
Different parameters can be plotted by selecting the small right- or left-pointing arrows on the title line above the plot
95 Integrating the whole datasetAssuming that everything looks OK the entire dataset can now be integrated However it is strongly recommended thatProjectCrystalDataset names are assigned first These are written to the output MTZ file and used by downstream programs inparticular AIMLESS will use this information when deciding which images belong to the same dataset
Select Experiment settings from the Settings drop-down menu (see Drop down menus sect21) to enter these names and optionally givea title for the MTZ file
Select images 1-84 and click on Process
951 Parallel Integration Using multiple cores
An option is available on the pull-down menu (next to the Process button in the Integration task) which splits up the integration jobover available cores on the local machine All aspects are currently determined automatically at present user-configurable options willbe available in a later version The algorithm used is as follows
iMosflm determines the number of cores available on the local machineIf the number of cores (N) is greater than 2 iMosflm splits the integration run into N-1 batches (up to a maximum of 16) containingapproximately the same number of images If N le 2 iMosflm splits the run into N batches
If the total number of images in each batch is less than 32 the number of batches is decreased until this condition is satisfied
The first batch is submitted as a background task consisting of a refinement stage and an integration stage with its input and outputfiles (including the MTZ file) in a new directory its name being determined from the number of segments of data being integrated andthe lattice number (if the sample has been determined to contain multiple lattices) If the directories exist already they are all movedinto a newly-created directory with a time-stamped name the files from the most recent integration run are thus in directories withnames following the pattern described above Once the refinement stage is complete the refined parameters are written to a file
The launch of subsequent batches are delayed until the corresponding preceding batch has written its refined parameters This file isread and the new batch is launched again with a refinement stage and integration stage
At present the job cannot be aborted once it has started
952 Integrating as a background job
By selecting Batch in the drop-down menu adjacent to the Process button the integration can be run as a background job rather thaninteractively and the GUI can be used to look at a different dataset
Selecting Batch from the drop-down menu will display a new window showing the script that will be used to process the images alongwith a number of processing options The script can be edited if additional keywords are required or if some parameters are to bechanged and can also be copied and pasted into a file for off-line processing
By default the job is divided into batches across multiple cores as determined for the parallel integration described in sect951 but thenumber of cores can be chosen by the user from a drop-down menu in this case the size of each batch is determined by the interface
Plotting the results of the integration can be turned off this can make processing much faster
iMosflm Tutorial
fileUsersandrewg4MOSFLMnewgui_tutorialiMosflm_tutorial_720_ver3html[29052015 105311]
It is possible to configure job submission for remote machines (which can be added by depressing the add host button) Ensure youhave enabled passwordless logins for all the remote machines you enter and that you specify the full path to the Mosflm executable inthe Batch destinations window The remote working directory (in which the log and MTZ files are written) and the remote imagedirectory must both be specified with their full path names Any required parameter fields that are not completed by the user arehighlighted in orange if the user tries to submit a job without completing these fields a new window containing only those fields (againhighlighted in orange) pops up with a request to do so
The number of cores available on the selected host can be determined by depressing the apple core button on the Batch destinationsconfiguration window
The log file for batch submission jobs the MTZ and SUMMARY files are written to the directory in which iMosflm was launched
96 Checking the integration
iMosflm Tutorial
fileUsersandrewg4MOSFLMnewgui_tutorialiMosflm_tutorial_720_ver3html[29052015 105311]
The detector and crystal parameter plots should be examined carefully to check for any instability in the refinement If there are largeand random variations in some parameters (eg the detector twist and tilt) then it may be better to fix them and repeat the integration
For cases (eg very small unit cells) where there are very few suitable reflections on each image the refinement of the missetting anglesmay show significant variations from one image to the next In such cases it is best to apply smoothing to the missetting angles usingthe tick box in Settings -gt Processing options -gt Advanced Refinement
Discontinuities due to blank images should also show up and the offending images should be removed from the scaling run
If adjacent spots are incompletely resolved on the detector it may be possible to improve the processing by increasing the PROFILETOLERANCE parameters by 1-2 These parameters can be set in the Advanced integration tab of the Processing options menu (useSettings)
97 Advanced features for integration
The Settings -gt Processing options menu allows additional control over the integration Parameters such as the minimum spotseparation resolution limits excluded resolution ranges block size MTZ filename and BATCH ADD can be changed in the Processingtab
Manually decreasing the minimum spot separation can help if a large number of reflections are flagged as spatially overlapped (redboxes) The prediction must be updated to see the effect of changing the separation this can be done either by displaying the next orprevious image or double clicking on the blue circle next to the image currently displayed in the Images pane
In the Advanced integration tab the measurement box parameters profile tolerance and profile averaging parameters can be set
The measurement box parameters can be adjusted for rare cases where the estimation of the spot size has not worked correctlyresulting in a box that is too small or too large The optimisation of the background rim and corner cutoff parameters that determinewhich pixels are used for the background and which pixels for the peak can also be turned off but this is generally not recommended
Increasing the profile tolerance can help in cases where adjacent spots are not completely resolved this can be judged by examining thestandard profiles By default the profile tolerance is automatically increased if there are a large number of spatial overlaps as this hasthe effect of reducing the minimum spot separation A message will be written to the logfile if this has happened This option can beturned off using the tick box Optimise profile tolerance values to avoid spot overlap
The profile outlier exclusion parameters control the exclusion of ice spots or hot pixels which could otherwise corrupt the standardprofiles
Pixels with a value less than the Null pixel threshold are considered to belong to inactive regions of the detector
The pixel saturation value determines when a reflection is considered to be an overload The intensity of overloaded reflections isestimated by profile fitting but these reflections are rejected by the scaling program AIMLESS by default
Increasing the Maximum reflection width in φ from the default value of 5deg will reduce the number of rejected reflections (green boxes)and is worthwhile when the mosaicity is very high or the mosaic block size is very small As with the minimum spot separation theimage must be refreshed to see the effect of changing this parameter
The rejection criteria will reject reflections with too much variation in the background (BGRATIO) or where the gradient of thebackground plane is too large These should only be changed if many reflections are being rejected PKRATIO only applies to fullyrecorded reflections and reflects a very poor profile fit With current data collection protocols there will be very few (if any) fullyrecorded reflections
Additional MOSFLM parameters will be added based on user requests
98 Integrating multiple lattices
When multiple lattices have been successfully indexed each lattice can be integrated individually by selecting the appropriate latticenumber
Reflections in the chosen lattice that are overlapped by a reflection from another lattice will be integrated but the measurement box willbe expanded so that the total intensity of the two (or more) reflections is measured These reflections will be flagged for specialtreatment Reflections that are not overlapped are referred to as singletons They will be dealt with in the normal way by POINTLESSand AIMLESS
NOTE If more than one lattice has been indexed and the results of integrating just ONE of the lattices are to be checked byrunning QuickSymm or QuickScale then the multi-lattice icon in the Integration pane must be turned off otherwise an error
iMosflm Tutorial
fileUsersandrewg4MOSFLMnewgui_tutorialiMosflm_tutorial_720_ver3html[29052015 105311]
message will be given saying that all lattices must be integrated
It is often the case that by measuring both lattices (in separate integration runs) and inputting both MTZ files to QuickScale the overallcompleteness is high using ONLY the singletons To use this option ensure that the multi-lattice icon is off
To make use of the intensity estimates for overlapped reflections MTZ files for all lattices must be input to the program FECKLESSwhich will derive the best estimate of the summed intensity This is the default option if more than one lattice has been indexed and itrequires that all lattices have been integrated (in separate runs) prior to running QuickSymm or QuickScale (FECKLESS will be runautomatically)
At this time no downstream programs can make use of the summed intensities of overlapping reflections but in the future it should bepossible to use this data in REFMAC
Currently it is recommended to use only singletons from all the lattices FECKLESS is not required in this case
The MTZ filename is automatically updated to reflect which lattice has been chosen to avoid overwriting the MTZ file of the first latticewhen integrating the second one FECKLESS when run from iMosflm relies on this naming convention so do not change it
10 Running Pointless to check the symmetryOnce the images have been integrated (even a few degrees of data in many cases) the program POINTLESS can be run to determine thetrue Laue symmetry and try to determine the space group using the QuickSymm button
iMosflm Tutorial
fileUsersandrewg4MOSFLMnewgui_tutorialiMosflm_tutorial_720_ver3html[29052015 105311]
Select the QuickSymm button
A summary of the Pointless results as shown below will appear in a qtRView window
Various graphs (L test for twinning ViewHKL to view the reciprocal lattice) can also be viewed in this window
Various options for POINTLESS such as a reference MTZ file forcing the symmetry selected in iMosflm and specifying multiple input MTZfiles can be selected from the Settings -gt Processing options -gt Sort Scale and Merge tab (see below)
iMosflm Tutorial
fileUsersandrewg4MOSFLMnewgui_tutorialiMosflm_tutorial_720_ver3html[29052015 105311]
Caution The results can be ambiguous if run with a partial dataset Look in the logfile to see how many relfections are used totest each possible symmetry operator
11 Running Aimless to scale and merge the dataSelect the QuickScale button
This will first run POINTLESS then change the space group for the data to that selected by POINTLESS (unless the iMosflm symmetry isset to override POINTLESS) run AIMLESS to scale and merge the data in that space group and then run CTRUNCATE which calculates anumber of statistics from the intensity data The CCP4 UNIQUEIFY script will then be run which generates all the unique reflections forthat spacegroup to the resolution of the measured data and will flag reflections (5 by default but this can be changed) for use as theRfree set
AIMLESS can be run from the QuickScale button either treating anomalous data (the default) or ignoring anomalous data If onlyprocessing a few degrees of data it is usually better to ignore anomalous because especially for low symmetry cases no mergingstatistics may be given in AIMLESS
SCALA can be selected as an alternative to AIMLESS for scaling (not recommended)
There is limited control over running AIMLESS (see figure above) including re-setting resolution limits rejecting batches (images)changing the treatment for accepting partials changing the rejection criterion and changing the procedure for updating the standarddeviation estimates
iMosflm Tutorial
fileUsersandrewg4MOSFLMnewgui_tutorialiMosflm_tutorial_720_ver3html[29052015 105311]
The AIMLESS results will be displayed in the qtRView as shown below along with graphical output (see below) and the full log file canalso be examined
Aimless summary file
iMosflm Tutorial
fileUsersandrewg4MOSFLMnewgui_tutorialiMosflm_tutorial_720_ver3html[29052015 105311]
An example of the Aimless graphical output
The AIMLESS logfile can also be examined by selecting the Log File tab
12 History and mosflm log fileSelecting History allows the history of the session to be examined or by selecting the Log tab the full mosflmlp file can be viewed Themosflmlp file is also available in a time-stamped file mosflm_yyyymmdd_hhmmsslp (eg mosflm_20100518_131019lp) and can beread with a text editor
The History has a tree structure and will show when various parameters have been changed This has not been fully implemented and isnot generally useful
The logfile may provide useful clues when processing has failed
13 Warning MessagesAs already mentioned in Adding images sect3 and Integration sect9 warning messages are generated by MOSFLM during processing Atraffic light colour coding has now been assigned based on the warnings and is shown next to the Warnings box
A Red status implies a serious problem that will affect data quality and should be addressed
An Orange status implies minor issues that should be checked to see if things can be improved
A Green status means no significant problems messages are for information only
iMosflm Tutorial
fileUsersandrewg4MOSFLMnewgui_tutorialiMosflm_tutorial_720_ver3html[29052015 105311]
Abbreviated messages can be obtained by clicking on the Warnings icon The full warning Details together with Hints amp Notes text (ifany are available) can be obtained by double-clicking the relevant warning Details are displayed in a pop-up text box which willdisappear with the next click outside the box The same full details and suggestions are of course available in the mosflmlp files whereeven more information may be available
NOTE This is the end of the part of the tutorial which deals directly with iMosflm but see sect19 which has some suggestions forfurther work if you have time The remainder of this document deals with integrating and scaling data with MOSFLM andAimless via the CCP4i user interface examining the traditional mosflm SUMMARY file with the CCP4 utility loggraph
The Appendix contains a shell script for running MOSFLM as a traditional batch job
14 Useful command line optionsiMosflm has a number of command line options and these can be listed by typingimosflm --helpCurrent options are
--allimages -a ltfilenamegt Starts mosflm loading all files that match the template generated from ltfilenamegt--ccp4i2 Autosaves an iMosflm session file upon exit with an XML list of all iMosflm output files--debug -d Creates a large output file for debugging purposes Dont use this unless asked to by a developer--expert -e Permits access to advanced detector settings This should not normally be required--fastload -f Attempt to speed loading of many images offline while indexing two default images separated by 90 degrees--help -h Displays this message then exits--imagedir -I ltdirectorygt Starts the image browser in this directory if ltdirectorygt is given as an environment variable it will be expanded to its full value--init -i ltfilenamegt Starts Mosflm and reads from the given saved session file--startdir -S ltdirectorygt Starts mosflm in directory ltstartdirgt rather than the current directory This will only work if the directory exists and you have write permission to it otherwise iMosflm will exit All the normal mosflm output files will be in this directory--singleimage -s ltfilenamegt Starts mosflm loading only the image from ltfilenamegt--site -X ltfilenamegt Reads anyall of the following lines from the file given WAVELENGTH ltxgt DISPERSION ltxgt POLARISATION [PINHOLE | MIRRORS | MONOCHROMATOR | SYNCHROTRON ltxgt] DIVERGENCE ltxh xvgt BEAM ltbeamx beamygt DISTANCE ltxgt DISTORTION TILT ltxgt DISTORTION TWIST ltxgt GAIN ltxgt DETECTOR REVERSEPHI DETECTOR OMEGA ltxgt--version -v Displays the program version and required Mosflm version then exits
These can be abbreviated to the shortest unambiguous string
141 The site fileimosflm --site ltsitefilegt will read keywords from the file ltsitefilegt that will overwrite incorrect information in image headers Thissaves having to manually correct values in every iMosflm session The site file can also be read or written as an option from the Sessionmenu (see Drop down menus sect21) Allowed keywords areWAVELENGTH ltxgt
iMosflm Tutorial
fileUsersandrewg4MOSFLMnewgui_tutorialiMosflm_tutorial_720_ver3html[29052015 105311]
DISPERSION ltxgtPOLARISATION [PINHOLE | MIRRORS | MONO | SYNCHROTRON ltxgt]DIVERGENCE ltxh xvgtBEAM ltbeamx beamygtDISTANCE ltxgtDISTORTION TILT ltxgtDISTORTION TWIST ltxgtGAIN ltxgtDETECTOR REVERSEPHIDETECTOR OMEGA ltxgt
15 The mosflm SUMMARY fileMOSFLM produces a summary file listing refined parameters for each image and when using iMosflm this file will be date- amp time-stamped and have a name such as mosflm_20100518_131019sum This contains the same information as the plots produced by theiMOSFLM GUI which now also include the number of bad spots and overloads
This can be inspected graphically from the CCP4i GUI using the program loggraph Select the pull down menu View Files from Job andunder Output files select Additional log graphs where the _SUMMARYloggraph file will be listed Select this file to display its tablesin loggraph
This is very useful to identify rogue images (with unusually high positional residual or low Iσ(I)) If you find any read that image intoMOSFLM and see what is wrong with it
If you have done more than one integration run during your MOSFLM session you will find multiple entries of the tables Look at the lastset for integration of the 84 images
Click on the Refined detector parameter tables and check on the stability of parameters like the TILT and TWIST of the detector (unitsare hundredths of a degree) and for Mar Research (or DIP) image plate data the distortion parameters ROFF and TOFF (units are mm) Ifthey are varying a lot (more than 20 for TWISTTILT) or 015 for ROFFTOFF then it is probably a good idea to fix these parameters atthe average value (or the known values for this detector if they are available) (see Detector parameters sect821)
Click on the Post refinement table and check the missets It does not matter if they change slowly and by an amount (per image) that isless than 01mosaic spread If they are changing more than this then there could be a problem with processing the data (there is notmuch you can do about this)
Check how the mosaic spread is changing If it is unstable or if you think it is not refining to sensible values (as judged by looking atthe prediction) then you can fix the input value in the same way as the detector parameters (see Crystal parameters sect822)
BADSPOTS AND OVERLOADS
The program will set a rejection flag for those reflections that fail certain tests for example too much variation in the background levela poor profile fit an intensity that is very negative (more than 5 standard deviations) a very high gradient for the background planeThese reflections are called Bad spots and they are listed individually for each image in the mosflmlp file together with the reason forflagging them The number of bad spots is also written to the summary file Generally there should be very few (5-10) bad spots oneach image If there are more it could be because the backstop shadow is not correctly allowed for (consider using the NULLPIXkeyword)
There should also be very few overloaded reflections on each image If there are a lot then a separate low resolution data collectionpass should be made with a much shorter exposure time
IMPORTANT Both Bad spots and Overloads are written to the output MTZ file but will be rejected by default by AIMLESS Theintensity of overloaded reflections is estimated by profile fitting that part of the spot that is not saturated To include these reflections inthe final merged data use the ACCEPT keyword in AIMLESS
16 Scaling data with CCP4i ccp4i
Select Directories amp ProjectDir (top right)
In the new window select Add project
Enter the project name in the Project field and the full directory path in the uses directory field Default values may have been enteredalready here Select this project from Project for this session
Select Apply and Exit Dismiss the warning message that comes up
Select Data reduction from the pull down menu of modules (orange bar at top left)
iMosflm Tutorial
fileUsersandrewg4MOSFLMnewgui_tutorialiMosflm_tutorial_720_ver3html[29052015 105311]
Select Symmetry Scale Merge (Aimless)
In the window that appears do the following
Give a job title (top line)
Click on the box next to Separate anomalous pairs for outlier rejection amp merging statistics (the crystals have been soaked in a mercurycompound)
In the next orange bar (line starts HKLIN 1) select Browse and select the MTZ file output by MOSFLM (probably called hg_001mtz)Select OK
If you did not supply the Project name Crystal name or Dataset name to Mosflm fill in the boxes for these now
Under Scaling Protocol
From the pull-down menu on the line starting Scale select with automatic default settings
At the bottom of window from the pull-down menu named Run select RunampView Com File
This will display a new window showing the command file for running the POINTLESS step select Continue After a brief pause it willshow the command file for running AIMLESS (This can be edited before submitting the job) Select Continue
In the main window it will show that the AIMLESS job is running
When AIMLESS has finished the command file for running the CTRUNCATE step will appearselect Continue
When CTRUNCATE has run the main window will say FINISHED
At that point select the pull-down menu View Files from Job and select View Log Graphs This will give you the same graphs asrunning loggraph on the AIMLESS log file they are also the same as those that appeared in IMOSFLMs QuickScale task To look at thelog file itself (eg the overall merging statistics) select View Log File and it will appear in a new window
161 Looking at the AIMLESS output
The simplest way to look at the output from AIMLESS is to use loggraph on the AIMLESS log file (or via the CCP4i GUI) This can displaymany different graphs
Use Scales vs rotation range to check for smooth variation in the scale factor Check the variation in B factor with image and if there isno real variation it is best to turn off the B-factor refinement
Use the Analysis against all Batches for all runs to detect bad images (high R-factor large number of rejected spots)
Check the Analysis against resolution Fractional bias to see if there is any indication of Partial bias (A negative partial bias will resultif the mosaic spread is underestimated or if there is a lot of diffuse scatter
The Fractional bias should be less than 1-2 although it will often exceed this for weak data (eg in the high resolution bins)
The Axial reflections graphs in AIMLESS are useful for detecting systematic absences which can be used to identify the true spacegroup However the detection of screw axes is thought to be sufficiently robust in POINTLESS that these graphs are no longer necessary
It can also be useful to look at the AIMLESS log file itself in particular the table giving statistics as a function of resolution The effectiveresolution limit of the data can be estimated by looking at the Mn(I)sd column (this is the mean Iσ(I) AFTER merging symmetry matesand is the best indicator of data quality) This table also shows shell and cumulative R-factors
The Mn(I)sd values depend on having realistic values of the standard deviations (errors) in the intensities As the values that come fromMOSFLM are always underestimates of the true error these values are scaled up in AIMLESS using a three-term correction
sdcorrected = SdFac Sqrt[sd(I)2 + SdBLPI + (SdAddI)2]
Here SdFac is an overall scale factor and SdB and SdAdd are intensity dependent factors
AIMLESS will automatically work out a suitable value for all three parameters in order to make the mean value of (observedscatter)(sdestimate) equal to 10 where observed scatter is the difference between an individual estimate of intensity and the mean ofall other estimates (from symmetry mates)
Probably the best estimate of the true high resolution limit of the data can be obtained from the CC(12) values these are thecorrelations between equivalent observations that have been divided randomly into two half-datasets The resolution limit is foundwhen the CC drops below ~ 05 - 03
This table comes under the heading
ANALYSIS OF STANDARD DEVIATIONS
iMosflm Tutorial
fileUsersandrewg4MOSFLMnewgui_tutorialiMosflm_tutorial_720_ver3html[29052015 105311]
in the AIMLESS log file and Run n standard deviation v Intensity test (where n is 1 or more) in the CCP4i GUI View Files from Job -View Log Graphs display
Can you identify a bad image in this dataset Can you work out why it is bad
(Cluethe image headers contain quite a lot of information that is not used by MOSFLM including the date and time that the image wascollected)
You can exclude a given batch from the scaling using the EXCLUDE keyword
RUN ALL EXCLUDE imagenumber
In this case run number will be 1
Rerun the scaling SENDING THE OUTPUT TO A NEW LOGFILE excluding this image and see the effect on the heights in the anomalousPatterson (in the log file) DO NOT repeat the integration In the command file uncomment the line (near the top) goto aimless so itskips the integration part
In the CCP4i GUI click to highlight the AIMLESS job which is listed as FINISHED and select ldquoReRun Jobrdquo from the control buttons downthe right-hand side of the main interface window Under ldquoExcluded Datardquo in the window that appears check the box next to Excludeselected batches and pull-down on the menu button to exclude a range Give the start amp end range to exclude (eg 74 to 74) Rerunthe job as before
17 Changing the symmetryFrom the list of options at the left hand side of the main window select ldquoUtilitiesrdquo and under that SortModifyCombine MTZ Files
In the new window give a new title eg reindex as H32
Click on the Box Change space group andor reindex reflections
Use the browse option to select the input MTZ file (First orange bar) the output filename will be generated automatically (but you canchange it)
Under Reindex details
In the last option check the box next to ldquoChange space group tordquo and enter H32 in the box This is above the final item Reducereflections to the asymmetric unit which is checked by default
Select Run from the Run option button
Then go back to the scaling window and select the new MTZ file (reindexed) as the input for scaling (use Browse) CHANGE THE JOBTITLE
Then select RUN
The scaling will now be performed in space group H32 Look at the merging statistics in the log file in particular the multiplicityweighted R-factor called Rmeas in the log file
18 Looking at the CTRUNCATE outputThe CTRUNCATE program converts intensities to amplitudes and also compiles some useful statistics The LTEST and the cumulativeintensity statistics tabulated by CTRUNCATE (and plotted by loggraph) provide the only point at which you will be able to detectmerohedral twinning (when the two lattices of the twin components exactly overlap and every measured intensity is actually the sum oftwo intensities)
For a good dataset the observed distribution should be within 1 of the theoretical distribution Is this the case for this data
19 If you have time 191 Different mosaic spreads
Try repeating the processing with the mosaic spread set to a value 25 smaller than the refined one and fix it by checking the Fix boxin the Integration window in iMosflm
Can you tell from the merging statistics if this data is better
192 Checking up on outliers
iMosflm Tutorial
fileUsersandrewg4MOSFLMnewgui_tutorialiMosflm_tutorial_720_ver3html[29052015 105311]
AIMLESS writes a file called ROGUES which lists reflections which show very poor agreement between symmetry mates or which areimplausibly large
Look in this file (it is ASCII) and try to work out why this has happened The ROGUES file gives you the image (Batch) on which thereflections have been recorded (for partials this is the image nearest the centre of the reflection so you may need to look on thepreceding and following image as well) Select a reflection which shows very poor agreement with its symmetry mates (A value greaterthan 10 in the DelIsd column in the ROGUES file)
Select the offending image by double-clicking it in the Images pane of the iMosflm main window Predict the reflections then enter thehkl values into the boxes and hit Return (or click the red warning button following the entry box for l) to locate the offending reflectionin the image You must give the measured indices - the first set of values in the ROGUES file - when doing this See if there is anythingodd about the spot Remember to check adjacent images for partials
193 How accurate does the unit cell have to be
Try changing the cell parameters by (say) 10 and integrate the images again What is the effect on the merging statistics
20 Tips1 When reading images into a session DO NOT attempt to carry out any other task until ALL the images have been read2 It is often worth repeating the indexing (usually only once) as the refined direct beam coordinates from the first indexing may give
an improved solution when the indexing is repeated (lower rmsd)3 Always integrate a few degrees of data before integrating the whole dataset (see sect9) If the space group is not known in advance
run Quicksymm with a few degrees of data to check that the correct indexing solution has been chosen4 For difficult images do not attempt to refine the unit cell initially once an indexing solution has been obtained try integrating a
few images to ensure that the integration is stable If then going on to refine the cell check that the prediction looks OK for thefirst image of every segment included in the refinement If it does not look very good consider using the pattern matching(Settings -gt Processing options -gt Advanced refinement see sect84)
5 If the resolution of the data is less than 35 Aring do not use the ldquoRefine Cellrdquo task Instead use several images in indexing and use thecell that comes from the indexing
6 If iMosflm gets into a state where the activity icon(upper right) is spinning but nothing seems to be happening click on the activityicon to stop it spinning and see if the session can be continued DO NOT click on the activity icon simply to abort a task this willgive unpredictable results Use the Abort button for cell refinement or integration There is no defined way to abort indexing
7 Use the image summation option (see sect4) to get a better impression of the diffraction for very low exposure Pilatus images8 Use image summation for detector parameter refinement for fine sliced very weak Pilatus images (Settings -gt Processing options -
gt Advanced refinement see sect821)9 For large mosaic spread values (gt 10deg) or small mosaic block sizes (lt10) consider increasing the maximum allowed reflection
width to avoid having too many green predicted reflections (Settings -gt Processing options -gt Advanced integration see sect97)10 By default on selecting the Indexing task iMosflm will find spots index and (assuming a solution has been found) estimate the
mosaicity For difficult cases it is more useful to restrict this to simply finding spots and then do the indexing and mosaicityestimation by clicking the appropriate buttons To do this change the check box Automatically index after spot finding inSettings -gt Processing options -gt Indexing
11 See sect521 and sect522 for advice if the indexing fails Also consider the possibility of a reversed phi rotation direction if you arenot familiar with the beamline (Settings -gt Experiment settings -gt Experiment see sect21)
12 If the detector parameters have refined to physically unreasonable values (eg because cell refinement or integration has beencarried out using an incorrect indexing solution) be sure to reset the detector parameters before attempting further processing(Settings -gt Experiment settings -gt Detector see sect21)
13 Always set the resolution limit slightly beyond the point at which any spots are visible (see sect414 ) For very weak fine-sliceddata it can be very difficult to estimate the resolution visually so integrate to the maximum resolution (inscribed circle) and usethe merging results to set the final resolution There should be no problems integrating to a resolution ~03-05 Aring beyond theactual resolution limit but for example integrating to 3 Aring when the true resolution limit is 5-6 Aring may cause problems and theintegration should then be repeated with a more realistic resolution limit
14 Use the site file sect141 if repeatedly processing data where the direct beam position is wrong or if the phi direction is reversed etcto save having to correct this for every session
Appendix IA command script for running MOSFLM using the keywords copied from the Batch processing window of the new GUI (see Integratingas a background job sect952) Note that keyworded input for MOSFLM and other CCP4 programs is case-insensitive apart from file anddirectory names
bincsh -fv Set a unique identifier for filenames for this job
set ident = x89_mos07_blk3_smallsep
iMosflm Tutorial
fileUsersandrewg4MOSFLMnewgui_tutorialiMosflm_tutorial_720_ver3html[29052015 105311]
$ipmosflm COORDS $identcoords SUMMARY $identsummary ltlt eof-ip Insert keywords copied from iMosflm batch window here
Keywords for this run For example could involve trying different values for mosaic spread or not integrating all images etc etchklout $identmtzgenfile $identgenprocess 1 1000 goeof-ip
pointlesspointless hklin $identmtz hklout $ident_pointlessmtz
aimlessaimless hklin $ident_pointlessmtz hklout $ident_aimless_partmtz ROGUES $identrogues ltlt eof-aimless Use all default options for aimlesseof-aimless
ctruncate hklin $ident_aimlessmtz hklout $ident_truncatemtz
Harry Powell Andrew Leslie and Owen Johnson
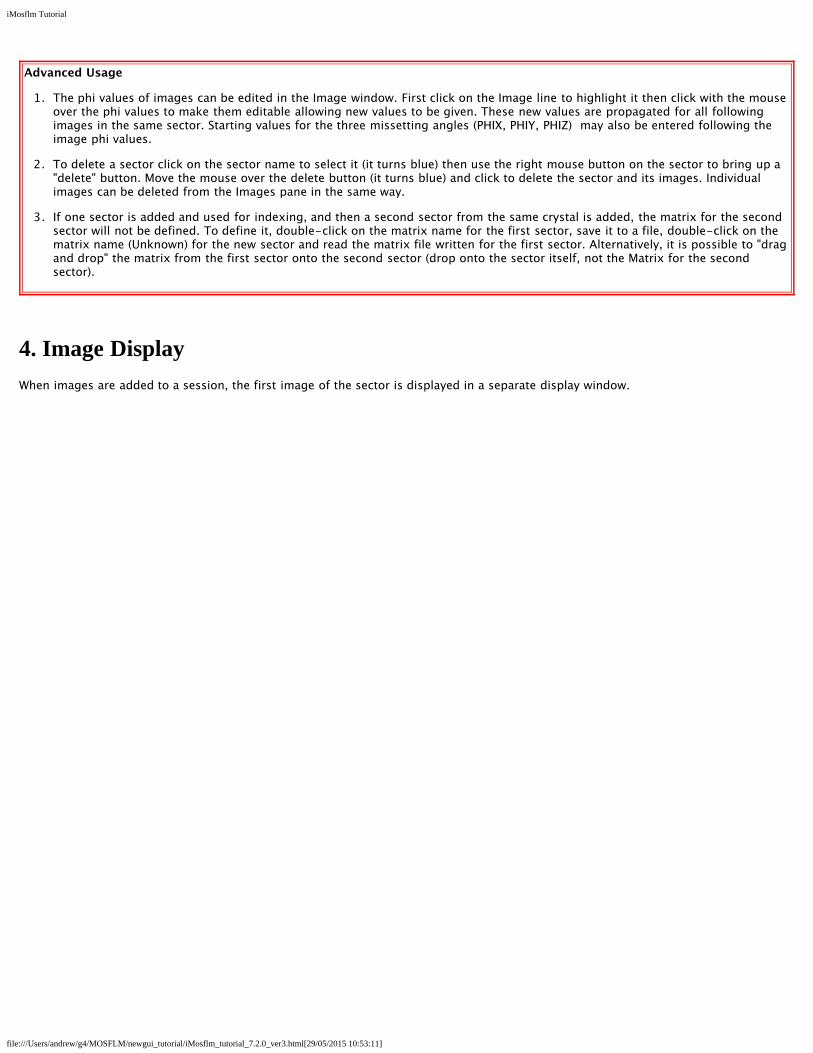
iMosflm Tutorial
fileUsersandrewg4MOSFLMnewgui_tutorialiMosflm_tutorial_720_ver3html[29052015 105311]
Advanced Usage
1 The phi values of images can be edited in the Image window First click on the Image line to highlight it then click with the mouseover the phi values to make them editable allowing new values to be given These new values are propagated for all followingimages in the same sector Starting values for the three missetting angles (PHIX PHIY PHIZ) may also be entered following theimage phi values
2 To delete a sector click on the sector name to select it (it turns blue) then use the right mouse button on the sector to bring up adelete button Move the mouse over the delete button (it turns blue) and click to delete the sector and its images Individualimages can be deleted from the Images pane in the same way
3 If one sector is added and used for indexing and then a second sector from the same crystal is added the matrix for the secondsector will not be defined To define it double-click on the matrix name for the first sector save it to a file double-click on thematrix name (Unknown) for the new sector and read the matrix file written for the first sector Alternatively it is possible to dragand drop the matrix from the first sector onto the second sector (drop onto the sector itself not the Matrix for the secondsector)
4 Image DisplayWhen images are added to a session the first image of the sector is displayed in a separate display window
iMosflm Tutorial
fileUsersandrewg4MOSFLMnewgui_tutorialiMosflm_tutorial_720_ver3html[29052015 105311]
The Image drop-down menu allows display of the previous or next image in the series (but this is easier to perform using the bluearrows displayed before the image name)
The View drop-down menu allows the image to be displayed in different sizes (related by scale factors of two) based on the imagesize and the resolution of the monitor
iMosflm Tutorial
fileUsersandrewg4MOSFLMnewgui_tutorialiMosflm_tutorial_720_ver3html[29052015 105311]
The Settings drop-down menu allows the colour of the predictions to be changed (see Indexing sect52 for the default colours) and thesize of the Pick box to be changed The third option (image summation) determines whether summed images are calculated byaddition or by taking the maximum or minimum values Only addition is implemented
The line below allows selection of different images either using right and left arrow or selecting one from the drop-down list of allimages in that sector Alternatively the image number can be typed into the Go to entry box
For Pilatus images only the Sum entry box will allow the display of the sum of several images the number (up to 20) can be chosenfrom the drop-down list
The image being displayed can also be changed by double-clicking on an image name in the Images pane of the main iMosflmwindow This will also re-active the image window if it has been closed
+ and - will zoom the image without changing the centre The Fit image icon will restore the image to its original size (right mousebutton will have the same effect) The Contrast icon will give a histogram of pixel values Use the mouse to drag the vertical dottedline to the right to lighten the image to the left to darken it Try adjusting the contrast The Lattice entry window can be used whenprocessing images with multiple lattices present see multiple lattices sect53
The reverse video icon allows an image to be rendered as light spots on a dark background that can help visualise small diffractionspots (eg for data collected using a Pilatus detector)
41 Display Icons
The eight icons on the left control the display of the direct beam position (since 720 a magenta cross not a green one) spots foundfor indexing bad spots predicted spots masked areas spot-finding search area resolution limits and display of the active mask forRigaku detectors respectively Clicking on these items will turn their display on or off
These are followed by icons for Zoom Pan and Selection tools and tools for adding spots manually (for indexing) editing masks circlefitting and erasing spots or masks
Next on this toolbar are the entry boxes for h k amp l and a button to search for this hkl among the predicted spots displayed on theimage The button resembles a warning sign if the given hkl cannot be found but a green tick if it is found The final icon relates toprocessing images with multiple lattices (see multiple lattices sect53) and is not described here
411 Masked areas - circular backstop shadow
Select the masked area icon A green circle will be displayed showing the default position and size of the backstop shadow
Make sure that the Zoom icon (magnifying glass) is selected and use the left-mouse-button (abbreviated to LMB in following text) todrag out a rectangle around the centre of the image The inner dotted yellow rectangle will show the part of the image that will actuallyappear in the zoomed area
iMosflm Tutorial
fileUsersandrewg4MOSFLMnewgui_tutorialiMosflm_tutorial_720_ver3html[29052015 105311]
Choose the Selection Tool When placed over the perimeter of the circle the radius of the circular backstop shadow will be displayedUse the LMB to drag the circle to increase its diameter to that of the actual shadow on the image The position of the circle can beadjusted with LMB placed on the cross that appears in the centre of the green circle Adjust the size and position of the circle so that itmatches the shadow
412 Masked areas - general exclusions
Choose the Masking tool Any existing masked areas will automatically be displayed Use LMB to define the four corners of the region tobe masked When the fourth position is given the masked region will be shaded This region will be excluded from spot finding andintegration This provides a powerful way of dealing with backstop shadows To edit an existing mask choose the Selection tool and usethe LMB to drag any of the four vertices to a new position
To delete a mask choose the Spot and mask eraser tool Place the mouse anywhere within the shaded masked area and use LMB todelete the mask Delete any masks that you have created
413 Spot search area
Select the Show spotfinding search area icon The inner and outer radii for the spot search will be displayed as shown below If theimages are very weak the spot finding radius will automatically be reduced but this provides additional control
Either can be changed by dragging with the LMB Do not change the radii for these images
iMosflm Tutorial
fileUsersandrewg4MOSFLMnewgui_tutorialiMosflm_tutorial_720_ver3html[29052015 105311]
Advanced Usage
The red rectangle displays the area used to determine an initial estimate of the background of the image It is important that this doesnot overlap significant shadows on the image It can be shifted laterally or changed in orientation (in 90deg steps) by dragging with theLMB
414 Resolution limits
Select the Show resolution limits icon The low and high resolution limits will be displayed The resolution limits can be changed bydragging the perimeter of the circle with LMB (make sure that the Selection Tool has been chosen) The resolution limits will affectStrategy Cell refinement and Integration but not spot finding or indexing The low resolution is not strictly correct (it falls within thebackstop shadow) but does not need to be changed because spots within the backstop shadow will be rejected
415 Zooming and Panning
First select a region of the image to be zoomed with the Zoom tool
Select the Pan tool and pan the displayed area by holding down LMB and moving the mouse This is very rapid on a local machine butmay be slow if run on a remote machine over a network
416 Circle fitting
The circle fitting tool can be used to determine the direct beam position by fitting a circle to a set of points on a powder diffraction ringon the image (typically due to icing) or to fit a circular backstop shadow (although using the masking tool is probably easier)
Select the circle fitting tool Three new icons will appear in the image display area There are two (faint) ice rings visible on the image at391Aring and 367Aring Click with LMB on several positions (6-8) on the outer ring (as it is slightly stronger) Then click on the top circularicon
A circle that best fits the selected points (displayed as yellow crosses) will be drawn and the direct beam position at the centre of thiscircle will be indicated with a green cross The direct beam coordinates will be updated to reflect this new position
iMosflm Tutorial
fileUsersandrewg4MOSFLMnewgui_tutorialiMosflm_tutorial_720_ver3html[29052015 105311]
5 Spot finding indexing and mosaicity estimationWhen images have been added the Indexing operation becomes accessible (it is no longer greyed-out)
Click on Indexing This will bring up the major Indexing window in place of the Images window
51 Spot Finding
By default the first image and a second image 90 degrees away in phi (or as close to 90 as possible) will be selected and a spot searchcarried out on both images (This is controlled by the Automatically find spots on entering Autoindexing tick box in the Spot finding tabof Processing options)
Found spots will be displayed as crosses in the Image Display window (red for those above the intensity threshold yellow for thosebelow) Only those above the threshold will be used in indexing The intensity threshold normally defaults to 20 but will beautomatically reduced to 10 or 5 for weak images The threshold is determined by the last image to be processed
The number of spots found together with any manual additions or deletions are also given
Images to be searched for spots can be specified in several ways
1 Simply type in the numbers of the images (eg 1 84 above)
iMosflm Tutorial
fileUsersandrewg4MOSFLMnewgui_tutorialiMosflm_tutorial_720_ver3html[29052015 105311]
2 Use the Pick first image icon (single blue circle)
3 Use the Pick two images ~90 apart icon (two blue circles) This is the default behaviour
4 Use the Select images icon (multiple circles) If selected all images in the sector are displayed in a drop-down list Click on aimage to select it then double-click on the search icon (resembling a target in the colum headed Find) for that image to run thespot search The image will move to the top of the list (together with other images that have been searched)
Images to be used for indexing can be selected from those that have been searched by clicking on the Use button If this box waspreviously checked then clicking will remove this image from those to be used for indexing It can be added again by clicking theSelect images icon and clicking on the Use box
Before indexing always check by looking at the image display that the spot finding has worked correctly ie that most spots thatyou can see have been found that multiple crosses have not been drawn over the same spot that spots have not been placedover ice rings or ice spots Check all images that will be used in indexing
511 If the spot finding has not worked well
Parameters affecting the spot search can be modified by selecting the Settings drop-down window and selecting Processing optionsThe resulting new window contains six tabs relating to Spot finding Indexing Processing Advanced refinement Advanced integrationand Sort Scale and Merge
The Spot finding tab allows the Search area Spot discrimination parameters Spot size parameters Minimum spot separation andMaximum peak separation within spots (to deal with split spots) to be reset It also allows the choice between a local backgrounddetermination (preferred) and a radial background determination The local background method also uses an improved procedure forrecognising closely spaced spots The only parameters commonly changed are
1 Minimum spot separation This should be the size (in mm) of an average spot (not a very strong spot) If there are badly split spotsthe spot finding may place two (or more) crosses for a single diffraction spot To avoid this happening set the minimumseparation in X and Y to values equal to the spot size in mm This can be found by zooming the image and counting the number ofpixels across the spot horizontally (X) and vertically (Y) To convert this to mm use the pixel size as given in Settings -gtExperiment settings -gt Detector This separation parameter is very important when spots are very close but usually the programwill determine a suitable value
2 Minimum pixels per spot Default value 6 but this should be reduced automatically if spots are very small (eg when using in situscreening and microfocus beam) If there clearly are spots present and the spot size is very small try reducing this parameter to 3or 2
3 Local background box size Reducing this from 50 to (say) 20 can reduce the number of false spots found near any sharp shadowon the image (or tile boundaries for tiled detectors) Normally these false spots are weak (and will be drawn as yellow crosses) inwhich case they will not affect the indexing
For data collected in-house the spots can be quite large and rather weak In such cases the spot finding parameters are automaticallychanged but some improvement may still be obtained by the following
1 Reduce the spot finding threshold (default 35) eg to 2
2 Change the minimum number of pixels per spot (default 30) to 20 or 40
3 Set the minimum spot separation to a sensible value eg 15mm see above
52 Indexing
Providing there are no errors during spot finding indexing will be carried out automatically after spot finding (This is controlled by theAutomatically index after spot finding tick box in the Indexing tab of Processing options) If the image selection or indexingparameters are changed the Index button must be used to carry out the indexing
iMosflm Tutorial
fileUsersandrewg4MOSFLMnewgui_tutorialiMosflm_tutorial_720_ver3html[29052015 105311]
Autoindexing will be carried out by MOSFLM using spots (above the threshold) from the selected images The threshold is set byMOSFLM but can be changed using the entry box in the toolbar The list of solutions sorted by increasing penalty score will appear inthe lower part of the window The preferred solution will be highlighted in blue There will usually be a set of solutions with lowpenalties (0-20) followed by other solutions with significantly higher penalties The preferred solution is that with the highest symmetryfrom the group with low penalty values
Note that all these solutions are really the same P1 solution transformed to the 44 characteristic lattices with lattice symmetryconstraints applied Therefore if the P1 solution is wrong then all the others are wrong as well
For solutions with a penalty less than 50 the refined cell parameters (ref) will be shown This can be expanded (click on the + sign) toshow the reg unrefined but regularised cell (symmetry constraints applied) and the raw cell (no symmetry constraints applied)
The rms deviation (rmsd) or error in predicted spots positions (σ(xy) in mm) and the number of spots used to refine the solution aregiven for each solution
Usually the penalty will be less than 20 for the correct solution although it could be higher if there is an error in the direct beamcoordinates (or distancewavelength) The rmsd (error in spot positions) will typically be 01-02mm for a correct solution but if thespots are split or very elongated it can be as high as 1mm or higher
The predicted spot positions for the highlighted solution will be shown on the image display with the following default colour codes
Blue Fully recorded reflectionYellow (orange for Pilatus) Partially recorded reflection
iMosflm Tutorial
fileUsersandrewg4MOSFLMnewgui_tutorialiMosflm_tutorial_720_ver3html[29052015 105311]
Red Spatially overlapped reflection these will NOT be integratedGreen Reflection width too large (more than 5 degrees) not integrated
These colours may be adjusted via the Settings -gt Prediction colour item in the Image display window
Providing there are no errors in the indexing MOSFLM will automatically estimate the mosaic spread (mosaicity) based on the preferredsolution
Select other solutions with a higher penalty and see how well the predicted patterns match the diffraction image
The rmsd and visual inspection of the predicted pattern are the best ways of checking if a solution is correct If the agreement is notgood then the autoindexing has probably failed
It is often worth repeating the indexing (once) as the refined direct beam coordinates from the first indexing may give animproved solution (lower rmsd)
521 If the indexing fails - Direct beam search
The indexing is very sensitive to errors in the direct beam coordinates For a correct indexing solution the error should be less than halfthe minimum spot separation Check for example that the current direct beam position is behind the backstop If there are any icerings these can be used to determine the direct beam position (see Circle fitting sect416 )
If the accuracy of the direct beam coordinates (generally read from the image header) is uncertain the program can perform a gridsearch around the input coordinates The number and the size of the steps can be set from the Indexing tab of the Processing optionsmenu (see Settings - Processing options sect21) but defaults to two steps of 05mm on each side of the input coordinates The directbeam search is started by clicking on the Start beam search button in the Indexing pane While in progress it can be stopped byclicking the Abort beam search button
The indexing will be carried out for each set of starting coordinates (Beam x and Beam y in the table which appears) and if a solution isfound the refined beam coordinates (Beam x ref Beam y ref) the unit cell parameters of the triclinic solution and the rmsd error in spotcoordinates and in phi will be listed The correct solution will generally be the one with the smallest rms error in spot positions (σ(xy))To make it simpler to identify the correct solution once the grid search has finished the solutions will be sorted on σ(xy) so the correctsolution will be at the top of the list When sorting the solutions those which have smaller cell parameters will be listed first as it ispossible to have a small σ(xy) value for an incorrect solution with a much larger unit cell Beware of solutions at the top of the list wherethe cell is clearly too small (only happens rarely)
Note that only the triclinic (P1) solution will be listed
If there is now a solution with a smaller rmsd value than before and especially if more than one set of starting beam coordinates has thesame refined coordinates this is a good indication that the beam search has worked Note that if the initial beam coordinates werewrong by more than ~15mm the search may not work In this case either select a new starting position for the direct beam or changethe number of steps
To complete the indexing double-click on the chosen solution and the full indexing will carried out for these beam coordinates withthe solutions appearing in the upper window The results of the direct beam search can be hidden (collapsed) by clicking on the Hidebutton and recovered by clicking on the Show button
iMosflm Tutorial
fileUsersandrewg4MOSFLMnewgui_tutorialiMosflm_tutorial_720_ver3html[29052015 105311]
522 If the indexing fails - Other parameters
Errors in other physical parameters (wavelength crystal to detector distance) can also result in failure All these parameters should bechecked
Several parameters used in autoindexing can also be adjusted using entry fields and buttons that appear in the Indexing toolbar
Weak images
1 MOSFLM automatically reduces the Iσ(I) threshold for weak images and it may also reduce the resolution to 4Å but lower valuescan be tried It is important not to include spots that are not real - a small number of false spots can prevent the indexing fromworking
2 Try changing parameters for spot finding (see If the spot finding has not worked well sect511)
Multiple lattices
1 Try increasing the Iσ(I) threshold (default 20) for example to 40 or 60 so that only spots from the stronger lattice are selectedThis can be done by entering a new value in the leftmost of the circled icons above (and also via the Indexing tab of Processingoptions)
All cases
1 Include more images in the indexing Select images that are widely spaced in phi not close together2 Select images that show the clearest lunes andor have the best spot shape3 In case the crystal orientation has changed or if you are unsure of the direction of positive rotation in phi try indexing using only
one image4 Make sure that the Max cell edge value is not too small If in doubt set to 200 Aring (or more if the cell is expected to be large)5 If the cell parameters are known reduce the maximum allowed cell edge to the known maximum cell edge This can sometimes
help filter incorrect solutions but use with caution as often this needs to be ~twice the largest cell for successful indexingAlternatively try the known cell option
6 If the detector distance is uncertain and the images are high resolution (eg 2Å) allow the detector distance to refine during cellrefinement Use with caution
53 Indexing multiple lattices simultaneously
This is a new feature and is still undergoing development It is most likely to succeed when the different lattices are clearly separated atleast at higher resolution If the images shows badly split spots with several components (each arising from a sub-crystal with a slightlydifferent orientation) then indexing may well still be impossible
After spot finding examine the image to ensure that spots that are close to each other but belong to different lattices have beenidentified as separate spots and not treated as a single split spot (in which case the red cross will lie midway between the two spots)Adjusting the minimum spot separation (Settings -gt Processing options -gt Spot finding) can help in resolving close spots It may alsohelp to increase the inner radius of the spot search region (see Spot search area sect413) so that low resolution reflections where the
iMosflm Tutorial
fileUsersandrewg4MOSFLMnewgui_tutorialiMosflm_tutorial_720_ver3html[29052015 105311]
spots are not really separated are excluded from the search
The following procedure usually provides the best chance of success
1 Select appropriate images for use in indexing The separation of the lattices can be clearer on some images than others Ideallychoose several images widely separated in phi
2 Do a normal (single lattice) indexing first This will usually work but will give a high positional rmsd because of the presence of morethan one lattice This step is important because it will result in more accurate direct beam coordinates which are crucial for multi-lattice indexing
3 Select the ldquoIndex multiple latticesrdquo icon (next to the Index button) the Index button will change to Index multiple
The indexing results for different lattices will be presented in different tabs while the selected solution for each lattice will be shown inthe lower Summary window Currently a maximum of 5 lattices can be handled The figure below shows a case where 3 differentlattices were found
4 Judge the success of indexing by examining the lattice type and the cell parameters obtained for the different lattices (the cellsshould be very similar) and checking that the predictions match the observed spots The rmsd values for correct lattices should also besignificantly smaller than the value obtained in the initial (single lattice) indexing It may be necessary to manually select a differentautoindexing solution for some lattices in order to get the same lattice type (eg oP) for the different lattices
The Split column in the lower pane indicates the angle between the reference lattice (with value -) and the other lattices This is onlycalculated when the lattices have the same lattice type In this case the angles between lattice 1 and lattices 2 amp 3 are 34 and 16degrees
If a lattice is clearly incorrect it can be deleted by highlighting that lattice (in the lower pane that summarises the results) and using theright mouse button to select ldquodeleterdquo
The predictions for different lattices can be displayed either by highlighting the lattice in the Summary window or by using the latticeselector in the image display pane
iMosflm Tutorial
fileUsersandrewg4MOSFLMnewgui_tutorialiMosflm_tutorial_720_ver3html[29052015 105311]
In the image display spots in different lattices that overlap with each other are shown in magenta Only the summed intensity will bemeasured for these reflections
The predictions for all lattices can be shown by selecting the ldquomerge latticesrdquo icon in the image display
This can be useful to check if all the lattices have been successfully indexed because all spots in the image should then be predicted Inthe display predictions from lattice 12345 are shown in blue yellow red green and magenta with no distinction made between fullyand partially recorded reflections or spatial overlaps
iMosflm Tutorial
fileUsersandrewg4MOSFLMnewgui_tutorialiMosflm_tutorial_720_ver3html[29052015 105311]
531 Practical Tips
Beware of solutions where the lattices only vary in orientation by a small angle (less than 1 degree) as these are often different solutionsfor the same lattice The difference in orientation between lattices is given by the ldquosplitrdquo column in the Summary window but this is onlycalculated if the lattices have the same lattice type Differences are all relative to one lattice which will display a split angle as ldquo-ldquo Tocalculate the angles relative to a different lattice open the tab for that lattice select a different solution to that currently selected andthen select the original solution ndash this will trigger recalculation of the split angles relative to that lattice
Other parameters that can influence the indexing are the rdquoMaximum deviation from integral hklrdquo (default 02 when indexing multiplelattices otherwise 03) and ldquoNumber of vectors to find for indexingrdquo (default 30) These can be changed via the Indexing tab of theldquoProcessing Optionsrdquo that can be selected from the ldquoSettingsrdquo menu item Values between 015 and 025 might be helpful for the firstparameter and increasing the number of vectors from 30 to 50 can also help At present there is no defined protocol for changing thedefault parameter values for particular cases it has to be done by trial and error
Experience so far has shown that selecting appropriate images and adjusting the maximum cell length used in indexing have the biggesteffect The optimum value for the maximum cell length will normally lie between one and three times the largest cell dimension but it isworth varying this in steps of between 25 and 50 Aring as the indexing can be very sensitive to this parameter
For a more complete discussion of multiple lattice indexing see Powell HR Johnson O amp Leslie AGW 2013 Autoindexingdiffraction images with iMosflm Acta Cryst D69 1195-1203
54 Known cell option
For images that are very difficult to index if the cell parameters are known the known cell option can be usedSelect the ldquoKnown cellrdquo icon (next to the Multiple lattices icon) Enter the cell parameters in the Input known cell pop-up window andselect OK when all 6 parameters have been provided Then select the Index Cell button
To revert to normal indexing select the ldquoKnown cellrdquo icon and then select Clear in the Input known cell pop-up window
55 Space group selection
Note that the indexing is based solely on information about the unit cell parameters It will therefore be very difficult (or impossible) todetermine the correct Laue group in the presence of pseudosymmetry For example a monoclinic space group with β ~ 90deg will appearto be orthorhombic an orthorhombic space group with very similar a and b cell parameters will appear to be tetragonal These can onlybe distinguished when intensities are available (ie after integration) by running POINTLESS (QuickSymm) (see Running Pointless to check the
iMosflm Tutorial
fileUsersandrewg4MOSFLMnewgui_tutorialiMosflm_tutorial_720_ver3html[29052015 105311]
symmetry sect10)
In addition it is not possible to distinguish between Laue Groups 4m and 4mmm 3 and 3m 6m and 6mmm m3 and m3m Thiswill not affect integration of the images but it will affect the strategy calculation In the absence of additional information the lowersymmetry should be chosen for the strategy calculation to ensure that a complete dataset is collected
The presence of screw axes also cannot be detected so there is no basis on which to distinguish P21 from P2 etc This does not affectany aspect of data collection or processing and can be chosen (on the basis of systematic absences) after integration by runningPOINTLESS
In this example there is no way of knowing at this stage if the space group is h3 or h32 so leave it as h3
56 Mosaicity estimation
If the Automatically index after spot finding option has been chosen (Indexingtab of Processing Options) the mosaicity (mosaic spread) will be estimatedautomatically for the preferred solution However if another solution is chosenthe mosaicity should be estimated again
Click on the Estimate button to estimate the mosaicity
A window will appear which plots the total predicted intensity as a function ofmosaic spread from which an estimate is determined
The predictions displayed on the image will be updated Entering different valuesof mosaic spread in the box (followed by return) will allow a visual estimate of theeffect of changing the mosaic spread
The mosaic spread can also be entered in the Images pane by clicking once on theMosaicity line and once again on the value displayed
561 The mosaic block size
In some cases the apparent mosaic spread is much larger at low resolution than at high resolution so that if it is set to a value thatresults in all the low resolution spots being predicted many more spots are predicted than are visible at high resolution This effect isbest dealt with by adjusting the Mosaic block size which is also displayed in the Images pane This is modelling the size in microns ofthe individual mosaic blocks in the crystal Decreasing this to values of 05-5 microns (say) from the default of 100 microns will resultin predicting more spots at low resolution but have virtually no effect at high resolution This parameter is not refined (at present) andso the best value must be determined by trial and error
6 Saving and recovering a sessionThe session can be saved at any time using the Session drop-down menu referred to in sect21 The first time that a session is saved youwill be prompted for a filename The filename convention for saved session files is that the extension is mos
Save the current session Then exit from iMosflm (using the Session drop-down menu) restart iMosflm and read in the saved session
If the program crashes it should be possible to recover all but the latest actions as a temporary copy of the session file is continuallysaved to the directory mosflm in the users home directory
Restart iMosflm and it will pop up a Recover session window
Selecting the Recover button will restore the session as far as possible
iMosflm Tutorial
fileUsersandrewg4MOSFLMnewgui_tutorialiMosflm_tutorial_720_ver3html[29052015 105311]
7 Data collection strategyOnce the crystal orientation and (probable) Laue group have been determined it is possible to calculate a data collection strategy andthe Strategy icon is no longer greyed-out (in fact all other operations Strategy Cell Refinement and Integration become possible at thispoint)
Select the Strategy icon This will open the Strategy window
The statistics initially presented in the window are based on the images read in to the current session If only two (or more) references
iMosflm Tutorial
fileUsersandrewg4MOSFLMnewgui_tutorialiMosflm_tutorial_720_ver3html[29052015 105311]
images have been read in no statistics will be presented
When the Strategy option is used after two initial images (typically 90deg apart in φ) have been collected a complete shaded segment willnot be shown in the lower part of the screen rather an empty circle will be shown with the matrix label beneath it Click the Auto-complete button and in the pop-up menu that appears select a rotation angle or sweep of data to collect - or leave the Rotationsetting as Auto for a calculation of maximum completeness for this crystal orientation Click on Ok and the completeness results willbe presented
The orientation of the crystal expressed as the angles between the abc unit cell axes and the XYZ coordinate frame is given X isalong the X-ray beam Z is the rotation axis A warning will be given if the unique axis is so close to the rotation axis that there will bemissing cusp data
71 Evaluating completeness manually
The completeness of any given segment of data can be determined manually using the circle at the bottom left of the window Click onthe red segment shown in this circle
This will result in small black boxes being drawn on the circumference at the start and end of the red sector
Use the LMB to click on the black box at 0 and drag this around the circle
When the LMB is released the statistics for that sector will be displayed The statistics are presented in two ways Near the top right ofthe window the overall completeness is shown as red circles for unique data and anomalous pairs The average multiplicity is givenbeneath these circles
More detailed statistics (such as completeness as a function of resolution) are given in a series of histograms that can be selected by adrop-down menu
72 Calculating a strategy automatically
Uncheck the Use checkbox at the right side of the hg_001 line listed in the sector list near the top of the Strategy pane This means
iMosflm Tutorial
fileUsersandrewg4MOSFLMnewgui_tutorialiMosflm_tutorial_720_ver3html[29052015 105311]
that the 84 images used thus far will not be included in the completeness calculation only the matrix derived from indexing them willbe used Select the Auto-complete button to calculate a strategy automatically
A strategy calculation data pop-up window will appear
If multiple matrices have been defined (for different sectors of data) then the appropriate one can be selected (if there is only one sectorthis has no effect)
The total φ rotation to be used is normally calculated by MOSFLM based on the Laue group and the crystal orientation (the Auto setting)However it is sometimes possible to achieve a high completeness with a significantly smaller total rotation (eg 60deg in two 30degsegments will typically give gt94 completeness for orthorhombic space groups) and this can sometimes be useful if radiation damage isa serious problem although when using hybrid pixel detectors it is better to use a very conservative exposure time and collect a wide φrotation
Total rotation angles of between 5deg and 90deg can be selected from the drop-down list The number of segments to be used can be setbetween 1 and 3
If the check box is checked data completeness will be calculated to optimize the proportion of anomalous data collected
THIS IS IMPORTANT The optimum strategy is often different when maximising completeness of the anomalous data
Choose the default values (Rotation Auto Segments 1) but check the anomalous data box then click on Ok Look at the variousstatistics presented as bar charts
In space group H3 if rotating around the c axis a total rotation of 120deg would be required to collect a complete dataset (ignoring anydata lost in the cusp) Because the c axis is 22deg away from the rotation axis in this case it is possible to collect very high completeness(for unique data) with a rotation much smaller than this
Try to find the minimum total rotation that will give a dataset that is gt95 complete for the unique data Now do the same butrequiring gt95 completeness for the anomalous data
SKIP OVER SECTION 73 IF DOING THE NORMAL TUTORIAL
73 Calculating a strategy using multiple crystals
The Strategy pane may also be used when due to radiation damage many crystals are required to collect a complete dataset
IMPORTANT This procedure will only work correctly for space groups where there is no indexing ambiguity For those spacegroups where there is an indexing ambiguity( see httpwwwccp4acukdisthtmlreindexinghtml for a complete list) it isnecessary to integrate images to determine whether different crystals have been indexed in the same way This is not achievablewithin the Strategy option at present
Suppose the first crystal has been indexed from the reference images
Enter the Strategy pane an empty circle is displayed in the bottom part of the screen and click on the Auto-complete button nearthe top-right of the pane In the Auto-complete window that appears choose a suitable Rotation angle for the amount of datathat can be collected from one crystal say 20 degrees for this example Leave Segments set to 1 and do not check Optimize foranomalous data
Click the Ok button and the completeness of the data will be displayed The matrix name start and end phi values and the phiextent will be displayed in the top area of the pane with a checkbox ticked under the Use column This means this segment will beused in further strategy calculations
Accept and save this result by clicking on the yellow hatched segment displayed in the large circle near the bottom of the paneClick once and the segment will be outlined in black (you can adjust the start or end phi value calculated in one degree incrementsby click+dragging the respective black square) click again this time on the black square denoting the start or end phi (or release ifyou have adjusted by click+dragging) and the segment will turn red The segment will not be saved unless it has turned red
This result will be saved if you leave this pane (eg to load more images) and return later in this session The strategy file can alsobe saved to a permanent file using the Save button on the tool-bar This is highly recommended when working with many crystals
Return to the Strategy pane when you have loaded and indexed the reference image(s) from the second crystal and repeat the procedureabove You will see the calculated segment from the first matrix displayed at the bottom-left of the screen The optimum phi range for
iMosflm Tutorial
fileUsersandrewg4MOSFLMnewgui_tutorialiMosflm_tutorial_720_ver3html[29052015 105311]
the second crystal will be displayed Save this in the same way as for the first crystal (clicking twice) Repeat this procedure for anysubsequent crystals and in each case the optimum phi range will be calculated for the latest crystal taking into account the data fromprevious crystals
It is a good idea to save the strategy to a file as each new crystal is added in case the program crashes and this information is lost
In practice it is probably safest to have a separate iMosflm session that is reserved for the strategy calculations and not used to processany data The strategy for each new crystal can be calculated as described above If there is a problem and the session is corrupted or ifiMosflm is closed down for any reason it is straightforward to restore the status of the session providing the strategy has been savedThe following steps should be taken
1 Read in the reference images for the latest crystal and index them
2 Select the Strategy pane
3 Read in the optimised strategy for all previous crystals using the ldquoAddrdquo button and giving the appropriate filename
4 Making sure that the circle for the latest crystal is highlighted in the lower left window click on lsquoAuto-completersquo and follow the stepsdescribed above
Advanced Usage
The startend phi values for each crystalmatrix can be updated This might be required if for example only 10 degrees of useful datawere collected from a particular crystal instead of the anticipated 20 degrees To change the phi values click either on the matrix namein the top pane or on the circle showing the segment of data in the lower left pane (these are highlighted in a blue box as the mousemoves over them) The corresponding segment will now be displayed in the larger circle Click on the red segment so that a blacksquare appears at the startend phi values Then simply drag the appropriate phi to the desired value The completeness willautomatically be updated (but the strategy calculation for the latest crystal will not be repeated to do this the current segment must bedeleted by highlighting the matrix name and using right click and then repeating the Auto-complete step)
If matrix files saved from iMosflm are available from crystals for which data have been collected in previous sessions these can beadded into the calculation using the Add matrix button on the tool-bar
If the saved strategy result has become complicated or is incorrect and you wish to restart the calculations afresh there is a tool-barbutton Reload sectors from session This will remove any calculated sectors while leaving any known matrices listed at the bottom-leftof the Strategy pane
If you have saved a strategy file from a previous session this can be used to re-initialize the Strategy pane using the Load button onthe tool-bar
A Spacegroup pull-down menu has been added to the tool-bar to permit different choices of space group to be used in thecalculations (eg H3 and H32) This menu is populated from the list offered on the Indexing pane However the space group symboltext is editable Any space group symbol entered will be validated by Mosflm together with the current cell parameters
As a calculator for a multi-segment strategy the Strategy pane is reasonably flexible you can Save or Delete highlighted matrix lines byright-clicking As you highlight different matrix lines the orientation of the crystal expressed as the angles between the abc unit cellaxes and the XYZ coordinate frame is re-displayed in the centre of the pane
The following screen shot shows the cumulative results in the Strategy pane after this procedure has been followed for four crystals(ignore the iMosflm version number)
iMosflm Tutorial
fileUsersandrewg4MOSFLMnewgui_tutorialiMosflm_tutorial_720_ver3html[29052015 105311]
731 Calculating a strategy when some data have already been collected and processed
This option is not yet implemented If data have already been processed (to give an MTZ file) but the images are not currently available (eg they were collected on a previoussynchrotron trip possibly at a different synchrotron) then the MTZ file containing this data can be read and used to calculate a strategyfor data collection from new crystalsThe MTZ icon in the tool bar is used to read the MTZ file
74 Calculating a suitable oscillation angle
To calculate the maximum possible oscillation angle while avoiding spatial overlaps click on the Check for overlaps button A pop-upwindow will appear from which the option to calculate the maximum oscillation angle (as a function of φ) or check how many overlapswill occur for different (user selected) oscillation angles The results are plotted in the same pane as the histograms for the strategycalculations Note that the overlap calculation is based on the current values for the mosaic spread and spot separation and can be verysensitive to these values Note also that these are maximum and not necessarily recommended oscillation angles
iMosflm Tutorial
fileUsersandrewg4MOSFLMnewgui_tutorialiMosflm_tutorial_720_ver3html[29052015 105311]
8 Cell refinementIt is important to determine the cell parameters accurately before integrating the images Although the unit cell is refined as part of theautoindexing providing the diffraction extends beyond ~35Å resolution it is possible to obtain more accurate cell parameters using aprocedure known as post-refinement This procedure requires the integration of a series of images in ideally two or more separatesegments at widely different φ values The distribution of the intensity of partially recorded reflections over the images on which theyoccur is used to refine the unit cell crystal orientation and mosaic spread
Select the Cell Refinement icon
81 Selecting the images
iMosflm Tutorial
fileUsersandrewg4MOSFLMnewgui_tutorialiMosflm_tutorial_720_ver3html[29052015 105311]
There are several ways to select the images to be used in cell refinement Whichever method is used the image numbers will bedisplayed in the Images entry field iMosflm will automatically select appropriate images but these can be changed
811 Manual selection
A list of images can simply be typed into this box An image series can be specified as n-m where n and m are the first and last imagesDifferent series must be separated by white space or comma
For orthorhombic or higher symmetries two segments should be given approximately 90deg apart in φ For monoclinic or triclinic datathree or four segments are best (eg φ = 04590135)
The number of images that should be included in each segment depends on the mosaic spread and oscillation angle A reasonablenumber is 2(mosaic spreadoscillation angle +1) MOSFLM will automatically select two or more segments as appropriate Note thatthere is a limit on the total number of images that can be used
812 Automatic selection
Selecting the Automatically select images icon will select a suitable set of images
813 Graphical selection (Not recommended)
Selecting this icon will give a new window
Images can be selected by clicking in the Use check-box in the list of images or by using the mouse to drag a selection of imagesfrom the sector displayed The other icons allow the sector to be zoomed in or out and the viewed area to be moved to make theselection easier The final two icons on the tool-bar switch the segment display to fit the display space as either a full circle or aquadrant This Image palette can be closed by clicking outside its area but will close after 60 seconds anyway
82 Integrating the images and refining the cell
Use one of the methods above to select images to use in cell refinement and click on the Process button Before starting cell refinementcheck that the prediction for the first image in each segment to be used is good The majority of the spot positions must be correctlypredicted for the first image in each segment or else the refinement will not work
The selected images will be integrated and following integration the cell parameters are refined Selectable refined detector parameters
iMosflm Tutorial
fileUsersandrewg4MOSFLMnewgui_tutorialiMosflm_tutorial_720_ver3html[29052015 105311]
will be plotted as will the changes in crystal orientation and (if selected) mosaic spread If the shift in cell parameters is greater than 25standard deviations another cycle of integration and cell refinement is carried out Typically two or three cycles are required forconvergence Note that the current program activity is shown in the bottom left-hand corner of the window in the status message area
The different windows are explained below Moving the mouse over any parameter or plotted graph point will give a full description ofit
821 The detector parameters window
The values of the refined detector parameters are displayed for each image as it is integratedThere is the option to fix any of the parameters during integration by checking the Fix box onthe right The positional residuals (overall central and weighted) are also listed
Any of these parameters can be selected for plotting on the graph that appears to the right ofthis box by simply clicking on that parameter (which is then highlighted in blue as shown herefor Beam x and Beam y)
Check the stability of the refined parameters by displaying the appropriate graphs To getsensible scaling of the graphs only parameters with similar numerical values should be plottedtogether
For weak images (ie few visible spots in the outer regions of the image) the tilt and twistmay not be well defined and might refine to large values (greater than one degree) Insuch cases these parameters should be fixed It is not generally recommended to fix any
iMosflm Tutorial
fileUsersandrewg4MOSFLMnewgui_tutorialiMosflm_tutorial_720_ver3html[29052015 105311]
other detector parameters
For very weak fine sliced images (Pilatus only) there is the option to sum images when findingsuitable spots for refinement see Settings -gt Processing Options -gt Advanced refinementwhich can in some cases make the refinement more stable
822 The crystal parameters window
The values of the refined crystal missetting angles φ(x) φ(y) φ(z) the unit cell parameters andmosaic spread for the current image are displayed in the table Selected parameters will beplotted as for the detector parameters Specific unit cell parameters can also be fixed
If more than one segment of data is being used for cell refinement it is not unusual to see achange in orientation of the crystal between the two segments
Observe how the crystal orientation is different for images in the two segments See how themosaic spread varies during refinement
823 The central spot profile
The average spot profile for the central region of the detector is plotted for eachimage This confirms that the spot prediction is good If the profile is not welldefined and central in the box or if the blue border for the peak region of the spot ismuch larger than the apparent spots size it suggests a problem with the integrationand the initial prediction should be checked In some cases it may be necessary toincrease or decrease the Profile Tolerance parameters to ensure that the blue boxfits the spot To do this select the Advanced integration tab of Processing optionsCheck the central spot profiles for the images used in the cell refinement
824 The summary window
This window presents a summary of how selected parameters have changed indifferent cycles of the cell refinement The behaviour of these parameters gives agood indication of whether the cell refinement has been successful
If the refinement has been successful the RMS residual should be lower for thefinal cycle than in previous cycles However errors in the cell can be compensatedquite well by changing the crystal to detector distance so the differences are notalways dramatic
The other parameters that can be plotted from the pull-down list are the detectordistance and the Pixel ratio (Yscale)
The detector distance should be the same for all images in the refinement If the original indexing was based on auto-indexing a singleimage (say the first) then the detector distance might change for images from the second segment to compensate for an error in theoriginal cell If the variation in distance for different images increases with the cycle number this indicates that the refinement is notstable
The Pixel ratio (Yscale) parameter may also show an initial variation for images in different segments because refining Yscale (whichshould be 10000 for all except Raxis II and Raxis HTC detectors) can compensate for errors in cell dimensions in the same way that thedistance can The final values (last cycle) should be very close to identical for all images and should also be very close to unity (to within00010)
Cell refinement can be unstable if the data do not extend to at least 35 Aring If it appears unstable use the cell derived from auto-indexing a series of images well spaced in φ instead
iMosflm Tutorial
fileUsersandrewg4MOSFLMnewgui_tutorialiMosflm_tutorial_720_ver3html[29052015 105311]
Examine the plots to see if the parameters are stable and correct (Yscale)
825 The final results
When refinement has converged (or after 5 cycles) the initial and final cell parameters and the estimated errors (std dev) are listed
If time is available make a note of the std dev values and repeat the cell refinement using a larger number of images in each segmentAre the standard deviations smaller when using more images
83 Refining cell parameters for multiple lattices
Providing the resolution is high enough (generally better than ~35-32 Aring) and not too many of the spots in the different lattices areoverlapped it is possible to refine the cell parameters for each lattice individually The lattice to be refined is selected from the Latticeselector
This selector will be grayed out when processing a single lattice
84 If the prediction for the first image of a segment is poor
In some cases depending on how the indexing has been carried out or if the diffraction is poor or there has been a large change incrystal orientation during the data collection the prediction for one or more of the segments (the first image) may be poor In suchcases the integration and hence the cell refinement may fail It may be possible to successfully process the images after an initialrefinement of the crystal orientation using a pattern matching algorithm To select this option got to the Advanced refinement tab ofProcessing options and select the tick box for Refine orientation of first image in any run by pattern matching and for Integrate allimages Then refine the cell in the usual way During integration the orientation will be refined for the first image of each segmentoutput for this additional refinement will be written to the logfile but is not shown in the GUI
9 IntegrationThe accurate cell parameters are now used in the integration Note that although the images are integrated during the cell refinementthe intensities are not saved and no MTZ file is generated at that stage
It is good practice to start by integrating a block of images corresponding to a few degrees of data to check that the parameters do notneed further adjustment MOSFLM will generate warning messages after integration if there are any difficulties and it may be possibleto improve the situation by changing some of the default parameters (see Warning messages sect13)
Before integration ensure that the backstop shadow has been defined (see Masked areas backstop sect411 and Masked areas generalsect412)
91 Image selection
Image selection is performed in exactly the same way as in the cell refinement In this case the Automatic selection will simply includeall images in the current sector
Select images 1-10
92 Setting the MTZ filename and controlling updating of the image display
Two icons appear when the integration option is chosen
If the Show predictions icon is clicked the display window will be updated as eachimage is processed This will slow down the processing but allows the accuracy of theprediction to be checked for each image
iMosflm Tutorial
fileUsersandrewg4MOSFLMnewgui_tutorialiMosflm_tutorial_720_ver3html[29052015 105311]
Click on this icon so that the display will be updatedThe filename of the MTZ file containing the results of the integration is generatedautomatically but can be edited manually
93 Integrating the images
Click on the Process button to start integration
Integration of the images occurs in two passes In the first pass for each block of images (a number corresponding to a few degrees ofdata selected automatically by MOSFLM) the detector and crystal parameters are refined for each image in turn and the measurementboxes for all predicted spots are written to a file for use in the second pass In the second pass the standard profiles are formed fromreflections present on all of the images in this block and each image is then integrated and the results written to the MTZ file Thedisplay is not updated during the second pass and will remain on the last image of the block (assuming image updating has beenselected)
Note that the unit cell dimensions are normally fixed during integration and only the crystal orientation and mosaic spread are refinedCrystal parameter refinement only starts when a sufficient number of images have been integrated to provide data for the post-refinement typically after ~05-1 degree (more for high mosaicity)
94 Parameter display windows
As described in sect82 the refined detector and crystal parameters will be displayed in tables and selected parameters will be plotted ingraphs The average spot profile for each image will also be displayed
The size of these graphs (and the profile) can be expanded to fill the whole window by holding down Shift and clicking LMB anywherein the graph window A second Shift+click will revert the graph to the original size
In addition to these windows there are windows that tabulate and plot (as a function of image number) the mean Iσ(I) for profile fittedand summation integration intensities The overall values and the values for the highest resolution bin are given
The number of overloaded reflections Bad spots (ie those that fail certain tests see mosflm SUMMARY file sect15) Spatial overlaps andif processing multi-lattice images the number of lattice overlaps is listed for each image and can be plotted by highlighting thatparameter When processing data from crystals with large unit cells it is important to watch out for spatial overlaps (see sect97 for tips onhow to reduce the number of spatial overlaps if this is a problem)
A display of the standard profiles for different regions of the detector is also provided Poor profiles are averaged by includingreflections from inner regions of the detector Averaged profiles are indicated by a red line around the spot (rather than blue) Theoriginal unaveraged profile can be viewed a clicking on the profile (providing there were sufficient spots in that region to allowformation of a profile)
The profiles should be checked to see that they are well defined and centred within the box Poorly-defined diffuse or non-centredprofiles may suggest that the prediction is not very good in which case this should be checked on the corresponding image(s)
It may be useful to expand the standard profiles to fill the window using Shift + click in the profiles window
Finally the lower left window plots Iσ(I) as a function of resolution for any selected image
iMosflm Tutorial
fileUsersandrewg4MOSFLMnewgui_tutorialiMosflm_tutorial_720_ver3html[29052015 105311]
Different parameters can be plotted by selecting the small right- or left-pointing arrows on the title line above the plot
95 Integrating the whole datasetAssuming that everything looks OK the entire dataset can now be integrated However it is strongly recommended thatProjectCrystalDataset names are assigned first These are written to the output MTZ file and used by downstream programs inparticular AIMLESS will use this information when deciding which images belong to the same dataset
Select Experiment settings from the Settings drop-down menu (see Drop down menus sect21) to enter these names and optionally givea title for the MTZ file
Select images 1-84 and click on Process
951 Parallel Integration Using multiple cores
An option is available on the pull-down menu (next to the Process button in the Integration task) which splits up the integration jobover available cores on the local machine All aspects are currently determined automatically at present user-configurable options willbe available in a later version The algorithm used is as follows
iMosflm determines the number of cores available on the local machineIf the number of cores (N) is greater than 2 iMosflm splits the integration run into N-1 batches (up to a maximum of 16) containingapproximately the same number of images If N le 2 iMosflm splits the run into N batches
If the total number of images in each batch is less than 32 the number of batches is decreased until this condition is satisfied
The first batch is submitted as a background task consisting of a refinement stage and an integration stage with its input and outputfiles (including the MTZ file) in a new directory its name being determined from the number of segments of data being integrated andthe lattice number (if the sample has been determined to contain multiple lattices) If the directories exist already they are all movedinto a newly-created directory with a time-stamped name the files from the most recent integration run are thus in directories withnames following the pattern described above Once the refinement stage is complete the refined parameters are written to a file
The launch of subsequent batches are delayed until the corresponding preceding batch has written its refined parameters This file isread and the new batch is launched again with a refinement stage and integration stage
At present the job cannot be aborted once it has started
952 Integrating as a background job
By selecting Batch in the drop-down menu adjacent to the Process button the integration can be run as a background job rather thaninteractively and the GUI can be used to look at a different dataset
Selecting Batch from the drop-down menu will display a new window showing the script that will be used to process the images alongwith a number of processing options The script can be edited if additional keywords are required or if some parameters are to bechanged and can also be copied and pasted into a file for off-line processing
By default the job is divided into batches across multiple cores as determined for the parallel integration described in sect951 but thenumber of cores can be chosen by the user from a drop-down menu in this case the size of each batch is determined by the interface
Plotting the results of the integration can be turned off this can make processing much faster
iMosflm Tutorial
fileUsersandrewg4MOSFLMnewgui_tutorialiMosflm_tutorial_720_ver3html[29052015 105311]
It is possible to configure job submission for remote machines (which can be added by depressing the add host button) Ensure youhave enabled passwordless logins for all the remote machines you enter and that you specify the full path to the Mosflm executable inthe Batch destinations window The remote working directory (in which the log and MTZ files are written) and the remote imagedirectory must both be specified with their full path names Any required parameter fields that are not completed by the user arehighlighted in orange if the user tries to submit a job without completing these fields a new window containing only those fields (againhighlighted in orange) pops up with a request to do so
The number of cores available on the selected host can be determined by depressing the apple core button on the Batch destinationsconfiguration window
The log file for batch submission jobs the MTZ and SUMMARY files are written to the directory in which iMosflm was launched
96 Checking the integration
iMosflm Tutorial
fileUsersandrewg4MOSFLMnewgui_tutorialiMosflm_tutorial_720_ver3html[29052015 105311]
The detector and crystal parameter plots should be examined carefully to check for any instability in the refinement If there are largeand random variations in some parameters (eg the detector twist and tilt) then it may be better to fix them and repeat the integration
For cases (eg very small unit cells) where there are very few suitable reflections on each image the refinement of the missetting anglesmay show significant variations from one image to the next In such cases it is best to apply smoothing to the missetting angles usingthe tick box in Settings -gt Processing options -gt Advanced Refinement
Discontinuities due to blank images should also show up and the offending images should be removed from the scaling run
If adjacent spots are incompletely resolved on the detector it may be possible to improve the processing by increasing the PROFILETOLERANCE parameters by 1-2 These parameters can be set in the Advanced integration tab of the Processing options menu (useSettings)
97 Advanced features for integration
The Settings -gt Processing options menu allows additional control over the integration Parameters such as the minimum spotseparation resolution limits excluded resolution ranges block size MTZ filename and BATCH ADD can be changed in the Processingtab
Manually decreasing the minimum spot separation can help if a large number of reflections are flagged as spatially overlapped (redboxes) The prediction must be updated to see the effect of changing the separation this can be done either by displaying the next orprevious image or double clicking on the blue circle next to the image currently displayed in the Images pane
In the Advanced integration tab the measurement box parameters profile tolerance and profile averaging parameters can be set
The measurement box parameters can be adjusted for rare cases where the estimation of the spot size has not worked correctlyresulting in a box that is too small or too large The optimisation of the background rim and corner cutoff parameters that determinewhich pixels are used for the background and which pixels for the peak can also be turned off but this is generally not recommended
Increasing the profile tolerance can help in cases where adjacent spots are not completely resolved this can be judged by examining thestandard profiles By default the profile tolerance is automatically increased if there are a large number of spatial overlaps as this hasthe effect of reducing the minimum spot separation A message will be written to the logfile if this has happened This option can beturned off using the tick box Optimise profile tolerance values to avoid spot overlap
The profile outlier exclusion parameters control the exclusion of ice spots or hot pixels which could otherwise corrupt the standardprofiles
Pixels with a value less than the Null pixel threshold are considered to belong to inactive regions of the detector
The pixel saturation value determines when a reflection is considered to be an overload The intensity of overloaded reflections isestimated by profile fitting but these reflections are rejected by the scaling program AIMLESS by default
Increasing the Maximum reflection width in φ from the default value of 5deg will reduce the number of rejected reflections (green boxes)and is worthwhile when the mosaicity is very high or the mosaic block size is very small As with the minimum spot separation theimage must be refreshed to see the effect of changing this parameter
The rejection criteria will reject reflections with too much variation in the background (BGRATIO) or where the gradient of thebackground plane is too large These should only be changed if many reflections are being rejected PKRATIO only applies to fullyrecorded reflections and reflects a very poor profile fit With current data collection protocols there will be very few (if any) fullyrecorded reflections
Additional MOSFLM parameters will be added based on user requests
98 Integrating multiple lattices
When multiple lattices have been successfully indexed each lattice can be integrated individually by selecting the appropriate latticenumber
Reflections in the chosen lattice that are overlapped by a reflection from another lattice will be integrated but the measurement box willbe expanded so that the total intensity of the two (or more) reflections is measured These reflections will be flagged for specialtreatment Reflections that are not overlapped are referred to as singletons They will be dealt with in the normal way by POINTLESSand AIMLESS
NOTE If more than one lattice has been indexed and the results of integrating just ONE of the lattices are to be checked byrunning QuickSymm or QuickScale then the multi-lattice icon in the Integration pane must be turned off otherwise an error
iMosflm Tutorial
fileUsersandrewg4MOSFLMnewgui_tutorialiMosflm_tutorial_720_ver3html[29052015 105311]
message will be given saying that all lattices must be integrated
It is often the case that by measuring both lattices (in separate integration runs) and inputting both MTZ files to QuickScale the overallcompleteness is high using ONLY the singletons To use this option ensure that the multi-lattice icon is off
To make use of the intensity estimates for overlapped reflections MTZ files for all lattices must be input to the program FECKLESSwhich will derive the best estimate of the summed intensity This is the default option if more than one lattice has been indexed and itrequires that all lattices have been integrated (in separate runs) prior to running QuickSymm or QuickScale (FECKLESS will be runautomatically)
At this time no downstream programs can make use of the summed intensities of overlapping reflections but in the future it should bepossible to use this data in REFMAC
Currently it is recommended to use only singletons from all the lattices FECKLESS is not required in this case
The MTZ filename is automatically updated to reflect which lattice has been chosen to avoid overwriting the MTZ file of the first latticewhen integrating the second one FECKLESS when run from iMosflm relies on this naming convention so do not change it
10 Running Pointless to check the symmetryOnce the images have been integrated (even a few degrees of data in many cases) the program POINTLESS can be run to determine thetrue Laue symmetry and try to determine the space group using the QuickSymm button
iMosflm Tutorial
fileUsersandrewg4MOSFLMnewgui_tutorialiMosflm_tutorial_720_ver3html[29052015 105311]
Select the QuickSymm button
A summary of the Pointless results as shown below will appear in a qtRView window
Various graphs (L test for twinning ViewHKL to view the reciprocal lattice) can also be viewed in this window
Various options for POINTLESS such as a reference MTZ file forcing the symmetry selected in iMosflm and specifying multiple input MTZfiles can be selected from the Settings -gt Processing options -gt Sort Scale and Merge tab (see below)
iMosflm Tutorial
fileUsersandrewg4MOSFLMnewgui_tutorialiMosflm_tutorial_720_ver3html[29052015 105311]
Caution The results can be ambiguous if run with a partial dataset Look in the logfile to see how many relfections are used totest each possible symmetry operator
11 Running Aimless to scale and merge the dataSelect the QuickScale button
This will first run POINTLESS then change the space group for the data to that selected by POINTLESS (unless the iMosflm symmetry isset to override POINTLESS) run AIMLESS to scale and merge the data in that space group and then run CTRUNCATE which calculates anumber of statistics from the intensity data The CCP4 UNIQUEIFY script will then be run which generates all the unique reflections forthat spacegroup to the resolution of the measured data and will flag reflections (5 by default but this can be changed) for use as theRfree set
AIMLESS can be run from the QuickScale button either treating anomalous data (the default) or ignoring anomalous data If onlyprocessing a few degrees of data it is usually better to ignore anomalous because especially for low symmetry cases no mergingstatistics may be given in AIMLESS
SCALA can be selected as an alternative to AIMLESS for scaling (not recommended)
There is limited control over running AIMLESS (see figure above) including re-setting resolution limits rejecting batches (images)changing the treatment for accepting partials changing the rejection criterion and changing the procedure for updating the standarddeviation estimates
iMosflm Tutorial
fileUsersandrewg4MOSFLMnewgui_tutorialiMosflm_tutorial_720_ver3html[29052015 105311]
The AIMLESS results will be displayed in the qtRView as shown below along with graphical output (see below) and the full log file canalso be examined
Aimless summary file
iMosflm Tutorial
fileUsersandrewg4MOSFLMnewgui_tutorialiMosflm_tutorial_720_ver3html[29052015 105311]
An example of the Aimless graphical output
The AIMLESS logfile can also be examined by selecting the Log File tab
12 History and mosflm log fileSelecting History allows the history of the session to be examined or by selecting the Log tab the full mosflmlp file can be viewed Themosflmlp file is also available in a time-stamped file mosflm_yyyymmdd_hhmmsslp (eg mosflm_20100518_131019lp) and can beread with a text editor
The History has a tree structure and will show when various parameters have been changed This has not been fully implemented and isnot generally useful
The logfile may provide useful clues when processing has failed
13 Warning MessagesAs already mentioned in Adding images sect3 and Integration sect9 warning messages are generated by MOSFLM during processing Atraffic light colour coding has now been assigned based on the warnings and is shown next to the Warnings box
A Red status implies a serious problem that will affect data quality and should be addressed
An Orange status implies minor issues that should be checked to see if things can be improved
A Green status means no significant problems messages are for information only
iMosflm Tutorial
fileUsersandrewg4MOSFLMnewgui_tutorialiMosflm_tutorial_720_ver3html[29052015 105311]
Abbreviated messages can be obtained by clicking on the Warnings icon The full warning Details together with Hints amp Notes text (ifany are available) can be obtained by double-clicking the relevant warning Details are displayed in a pop-up text box which willdisappear with the next click outside the box The same full details and suggestions are of course available in the mosflmlp files whereeven more information may be available
NOTE This is the end of the part of the tutorial which deals directly with iMosflm but see sect19 which has some suggestions forfurther work if you have time The remainder of this document deals with integrating and scaling data with MOSFLM andAimless via the CCP4i user interface examining the traditional mosflm SUMMARY file with the CCP4 utility loggraph
The Appendix contains a shell script for running MOSFLM as a traditional batch job
14 Useful command line optionsiMosflm has a number of command line options and these can be listed by typingimosflm --helpCurrent options are
--allimages -a ltfilenamegt Starts mosflm loading all files that match the template generated from ltfilenamegt--ccp4i2 Autosaves an iMosflm session file upon exit with an XML list of all iMosflm output files--debug -d Creates a large output file for debugging purposes Dont use this unless asked to by a developer--expert -e Permits access to advanced detector settings This should not normally be required--fastload -f Attempt to speed loading of many images offline while indexing two default images separated by 90 degrees--help -h Displays this message then exits--imagedir -I ltdirectorygt Starts the image browser in this directory if ltdirectorygt is given as an environment variable it will be expanded to its full value--init -i ltfilenamegt Starts Mosflm and reads from the given saved session file--startdir -S ltdirectorygt Starts mosflm in directory ltstartdirgt rather than the current directory This will only work if the directory exists and you have write permission to it otherwise iMosflm will exit All the normal mosflm output files will be in this directory--singleimage -s ltfilenamegt Starts mosflm loading only the image from ltfilenamegt--site -X ltfilenamegt Reads anyall of the following lines from the file given WAVELENGTH ltxgt DISPERSION ltxgt POLARISATION [PINHOLE | MIRRORS | MONOCHROMATOR | SYNCHROTRON ltxgt] DIVERGENCE ltxh xvgt BEAM ltbeamx beamygt DISTANCE ltxgt DISTORTION TILT ltxgt DISTORTION TWIST ltxgt GAIN ltxgt DETECTOR REVERSEPHI DETECTOR OMEGA ltxgt--version -v Displays the program version and required Mosflm version then exits
These can be abbreviated to the shortest unambiguous string
141 The site fileimosflm --site ltsitefilegt will read keywords from the file ltsitefilegt that will overwrite incorrect information in image headers Thissaves having to manually correct values in every iMosflm session The site file can also be read or written as an option from the Sessionmenu (see Drop down menus sect21) Allowed keywords areWAVELENGTH ltxgt
iMosflm Tutorial
fileUsersandrewg4MOSFLMnewgui_tutorialiMosflm_tutorial_720_ver3html[29052015 105311]
DISPERSION ltxgtPOLARISATION [PINHOLE | MIRRORS | MONO | SYNCHROTRON ltxgt]DIVERGENCE ltxh xvgtBEAM ltbeamx beamygtDISTANCE ltxgtDISTORTION TILT ltxgtDISTORTION TWIST ltxgtGAIN ltxgtDETECTOR REVERSEPHIDETECTOR OMEGA ltxgt
15 The mosflm SUMMARY fileMOSFLM produces a summary file listing refined parameters for each image and when using iMosflm this file will be date- amp time-stamped and have a name such as mosflm_20100518_131019sum This contains the same information as the plots produced by theiMOSFLM GUI which now also include the number of bad spots and overloads
This can be inspected graphically from the CCP4i GUI using the program loggraph Select the pull down menu View Files from Job andunder Output files select Additional log graphs where the _SUMMARYloggraph file will be listed Select this file to display its tablesin loggraph
This is very useful to identify rogue images (with unusually high positional residual or low Iσ(I)) If you find any read that image intoMOSFLM and see what is wrong with it
If you have done more than one integration run during your MOSFLM session you will find multiple entries of the tables Look at the lastset for integration of the 84 images
Click on the Refined detector parameter tables and check on the stability of parameters like the TILT and TWIST of the detector (unitsare hundredths of a degree) and for Mar Research (or DIP) image plate data the distortion parameters ROFF and TOFF (units are mm) Ifthey are varying a lot (more than 20 for TWISTTILT) or 015 for ROFFTOFF then it is probably a good idea to fix these parameters atthe average value (or the known values for this detector if they are available) (see Detector parameters sect821)
Click on the Post refinement table and check the missets It does not matter if they change slowly and by an amount (per image) that isless than 01mosaic spread If they are changing more than this then there could be a problem with processing the data (there is notmuch you can do about this)
Check how the mosaic spread is changing If it is unstable or if you think it is not refining to sensible values (as judged by looking atthe prediction) then you can fix the input value in the same way as the detector parameters (see Crystal parameters sect822)
BADSPOTS AND OVERLOADS
The program will set a rejection flag for those reflections that fail certain tests for example too much variation in the background levela poor profile fit an intensity that is very negative (more than 5 standard deviations) a very high gradient for the background planeThese reflections are called Bad spots and they are listed individually for each image in the mosflmlp file together with the reason forflagging them The number of bad spots is also written to the summary file Generally there should be very few (5-10) bad spots oneach image If there are more it could be because the backstop shadow is not correctly allowed for (consider using the NULLPIXkeyword)
There should also be very few overloaded reflections on each image If there are a lot then a separate low resolution data collectionpass should be made with a much shorter exposure time
IMPORTANT Both Bad spots and Overloads are written to the output MTZ file but will be rejected by default by AIMLESS Theintensity of overloaded reflections is estimated by profile fitting that part of the spot that is not saturated To include these reflections inthe final merged data use the ACCEPT keyword in AIMLESS
16 Scaling data with CCP4i ccp4i
Select Directories amp ProjectDir (top right)
In the new window select Add project
Enter the project name in the Project field and the full directory path in the uses directory field Default values may have been enteredalready here Select this project from Project for this session
Select Apply and Exit Dismiss the warning message that comes up
Select Data reduction from the pull down menu of modules (orange bar at top left)
iMosflm Tutorial
fileUsersandrewg4MOSFLMnewgui_tutorialiMosflm_tutorial_720_ver3html[29052015 105311]
Select Symmetry Scale Merge (Aimless)
In the window that appears do the following
Give a job title (top line)
Click on the box next to Separate anomalous pairs for outlier rejection amp merging statistics (the crystals have been soaked in a mercurycompound)
In the next orange bar (line starts HKLIN 1) select Browse and select the MTZ file output by MOSFLM (probably called hg_001mtz)Select OK
If you did not supply the Project name Crystal name or Dataset name to Mosflm fill in the boxes for these now
Under Scaling Protocol
From the pull-down menu on the line starting Scale select with automatic default settings
At the bottom of window from the pull-down menu named Run select RunampView Com File
This will display a new window showing the command file for running the POINTLESS step select Continue After a brief pause it willshow the command file for running AIMLESS (This can be edited before submitting the job) Select Continue
In the main window it will show that the AIMLESS job is running
When AIMLESS has finished the command file for running the CTRUNCATE step will appearselect Continue
When CTRUNCATE has run the main window will say FINISHED
At that point select the pull-down menu View Files from Job and select View Log Graphs This will give you the same graphs asrunning loggraph on the AIMLESS log file they are also the same as those that appeared in IMOSFLMs QuickScale task To look at thelog file itself (eg the overall merging statistics) select View Log File and it will appear in a new window
161 Looking at the AIMLESS output
The simplest way to look at the output from AIMLESS is to use loggraph on the AIMLESS log file (or via the CCP4i GUI) This can displaymany different graphs
Use Scales vs rotation range to check for smooth variation in the scale factor Check the variation in B factor with image and if there isno real variation it is best to turn off the B-factor refinement
Use the Analysis against all Batches for all runs to detect bad images (high R-factor large number of rejected spots)
Check the Analysis against resolution Fractional bias to see if there is any indication of Partial bias (A negative partial bias will resultif the mosaic spread is underestimated or if there is a lot of diffuse scatter
The Fractional bias should be less than 1-2 although it will often exceed this for weak data (eg in the high resolution bins)
The Axial reflections graphs in AIMLESS are useful for detecting systematic absences which can be used to identify the true spacegroup However the detection of screw axes is thought to be sufficiently robust in POINTLESS that these graphs are no longer necessary
It can also be useful to look at the AIMLESS log file itself in particular the table giving statistics as a function of resolution The effectiveresolution limit of the data can be estimated by looking at the Mn(I)sd column (this is the mean Iσ(I) AFTER merging symmetry matesand is the best indicator of data quality) This table also shows shell and cumulative R-factors
The Mn(I)sd values depend on having realistic values of the standard deviations (errors) in the intensities As the values that come fromMOSFLM are always underestimates of the true error these values are scaled up in AIMLESS using a three-term correction
sdcorrected = SdFac Sqrt[sd(I)2 + SdBLPI + (SdAddI)2]
Here SdFac is an overall scale factor and SdB and SdAdd are intensity dependent factors
AIMLESS will automatically work out a suitable value for all three parameters in order to make the mean value of (observedscatter)(sdestimate) equal to 10 where observed scatter is the difference between an individual estimate of intensity and the mean ofall other estimates (from symmetry mates)
Probably the best estimate of the true high resolution limit of the data can be obtained from the CC(12) values these are thecorrelations between equivalent observations that have been divided randomly into two half-datasets The resolution limit is foundwhen the CC drops below ~ 05 - 03
This table comes under the heading
ANALYSIS OF STANDARD DEVIATIONS
iMosflm Tutorial
fileUsersandrewg4MOSFLMnewgui_tutorialiMosflm_tutorial_720_ver3html[29052015 105311]
in the AIMLESS log file and Run n standard deviation v Intensity test (where n is 1 or more) in the CCP4i GUI View Files from Job -View Log Graphs display
Can you identify a bad image in this dataset Can you work out why it is bad
(Cluethe image headers contain quite a lot of information that is not used by MOSFLM including the date and time that the image wascollected)
You can exclude a given batch from the scaling using the EXCLUDE keyword
RUN ALL EXCLUDE imagenumber
In this case run number will be 1
Rerun the scaling SENDING THE OUTPUT TO A NEW LOGFILE excluding this image and see the effect on the heights in the anomalousPatterson (in the log file) DO NOT repeat the integration In the command file uncomment the line (near the top) goto aimless so itskips the integration part
In the CCP4i GUI click to highlight the AIMLESS job which is listed as FINISHED and select ldquoReRun Jobrdquo from the control buttons downthe right-hand side of the main interface window Under ldquoExcluded Datardquo in the window that appears check the box next to Excludeselected batches and pull-down on the menu button to exclude a range Give the start amp end range to exclude (eg 74 to 74) Rerunthe job as before
17 Changing the symmetryFrom the list of options at the left hand side of the main window select ldquoUtilitiesrdquo and under that SortModifyCombine MTZ Files
In the new window give a new title eg reindex as H32
Click on the Box Change space group andor reindex reflections
Use the browse option to select the input MTZ file (First orange bar) the output filename will be generated automatically (but you canchange it)
Under Reindex details
In the last option check the box next to ldquoChange space group tordquo and enter H32 in the box This is above the final item Reducereflections to the asymmetric unit which is checked by default
Select Run from the Run option button
Then go back to the scaling window and select the new MTZ file (reindexed) as the input for scaling (use Browse) CHANGE THE JOBTITLE
Then select RUN
The scaling will now be performed in space group H32 Look at the merging statistics in the log file in particular the multiplicityweighted R-factor called Rmeas in the log file
18 Looking at the CTRUNCATE outputThe CTRUNCATE program converts intensities to amplitudes and also compiles some useful statistics The LTEST and the cumulativeintensity statistics tabulated by CTRUNCATE (and plotted by loggraph) provide the only point at which you will be able to detectmerohedral twinning (when the two lattices of the twin components exactly overlap and every measured intensity is actually the sum oftwo intensities)
For a good dataset the observed distribution should be within 1 of the theoretical distribution Is this the case for this data
19 If you have time 191 Different mosaic spreads
Try repeating the processing with the mosaic spread set to a value 25 smaller than the refined one and fix it by checking the Fix boxin the Integration window in iMosflm
Can you tell from the merging statistics if this data is better
192 Checking up on outliers
iMosflm Tutorial
fileUsersandrewg4MOSFLMnewgui_tutorialiMosflm_tutorial_720_ver3html[29052015 105311]
AIMLESS writes a file called ROGUES which lists reflections which show very poor agreement between symmetry mates or which areimplausibly large
Look in this file (it is ASCII) and try to work out why this has happened The ROGUES file gives you the image (Batch) on which thereflections have been recorded (for partials this is the image nearest the centre of the reflection so you may need to look on thepreceding and following image as well) Select a reflection which shows very poor agreement with its symmetry mates (A value greaterthan 10 in the DelIsd column in the ROGUES file)
Select the offending image by double-clicking it in the Images pane of the iMosflm main window Predict the reflections then enter thehkl values into the boxes and hit Return (or click the red warning button following the entry box for l) to locate the offending reflectionin the image You must give the measured indices - the first set of values in the ROGUES file - when doing this See if there is anythingodd about the spot Remember to check adjacent images for partials
193 How accurate does the unit cell have to be
Try changing the cell parameters by (say) 10 and integrate the images again What is the effect on the merging statistics
20 Tips1 When reading images into a session DO NOT attempt to carry out any other task until ALL the images have been read2 It is often worth repeating the indexing (usually only once) as the refined direct beam coordinates from the first indexing may give
an improved solution when the indexing is repeated (lower rmsd)3 Always integrate a few degrees of data before integrating the whole dataset (see sect9) If the space group is not known in advance
run Quicksymm with a few degrees of data to check that the correct indexing solution has been chosen4 For difficult images do not attempt to refine the unit cell initially once an indexing solution has been obtained try integrating a
few images to ensure that the integration is stable If then going on to refine the cell check that the prediction looks OK for thefirst image of every segment included in the refinement If it does not look very good consider using the pattern matching(Settings -gt Processing options -gt Advanced refinement see sect84)
5 If the resolution of the data is less than 35 Aring do not use the ldquoRefine Cellrdquo task Instead use several images in indexing and use thecell that comes from the indexing
6 If iMosflm gets into a state where the activity icon(upper right) is spinning but nothing seems to be happening click on the activityicon to stop it spinning and see if the session can be continued DO NOT click on the activity icon simply to abort a task this willgive unpredictable results Use the Abort button for cell refinement or integration There is no defined way to abort indexing
7 Use the image summation option (see sect4) to get a better impression of the diffraction for very low exposure Pilatus images8 Use image summation for detector parameter refinement for fine sliced very weak Pilatus images (Settings -gt Processing options -
gt Advanced refinement see sect821)9 For large mosaic spread values (gt 10deg) or small mosaic block sizes (lt10) consider increasing the maximum allowed reflection
width to avoid having too many green predicted reflections (Settings -gt Processing options -gt Advanced integration see sect97)10 By default on selecting the Indexing task iMosflm will find spots index and (assuming a solution has been found) estimate the
mosaicity For difficult cases it is more useful to restrict this to simply finding spots and then do the indexing and mosaicityestimation by clicking the appropriate buttons To do this change the check box Automatically index after spot finding inSettings -gt Processing options -gt Indexing
11 See sect521 and sect522 for advice if the indexing fails Also consider the possibility of a reversed phi rotation direction if you arenot familiar with the beamline (Settings -gt Experiment settings -gt Experiment see sect21)
12 If the detector parameters have refined to physically unreasonable values (eg because cell refinement or integration has beencarried out using an incorrect indexing solution) be sure to reset the detector parameters before attempting further processing(Settings -gt Experiment settings -gt Detector see sect21)
13 Always set the resolution limit slightly beyond the point at which any spots are visible (see sect414 ) For very weak fine-sliceddata it can be very difficult to estimate the resolution visually so integrate to the maximum resolution (inscribed circle) and usethe merging results to set the final resolution There should be no problems integrating to a resolution ~03-05 Aring beyond theactual resolution limit but for example integrating to 3 Aring when the true resolution limit is 5-6 Aring may cause problems and theintegration should then be repeated with a more realistic resolution limit
14 Use the site file sect141 if repeatedly processing data where the direct beam position is wrong or if the phi direction is reversed etcto save having to correct this for every session
Appendix IA command script for running MOSFLM using the keywords copied from the Batch processing window of the new GUI (see Integratingas a background job sect952) Note that keyworded input for MOSFLM and other CCP4 programs is case-insensitive apart from file anddirectory names
bincsh -fv Set a unique identifier for filenames for this job
set ident = x89_mos07_blk3_smallsep
iMosflm Tutorial
fileUsersandrewg4MOSFLMnewgui_tutorialiMosflm_tutorial_720_ver3html[29052015 105311]
$ipmosflm COORDS $identcoords SUMMARY $identsummary ltlt eof-ip Insert keywords copied from iMosflm batch window here
Keywords for this run For example could involve trying different values for mosaic spread or not integrating all images etc etchklout $identmtzgenfile $identgenprocess 1 1000 goeof-ip
pointlesspointless hklin $identmtz hklout $ident_pointlessmtz
aimlessaimless hklin $ident_pointlessmtz hklout $ident_aimless_partmtz ROGUES $identrogues ltlt eof-aimless Use all default options for aimlesseof-aimless
ctruncate hklin $ident_aimlessmtz hklout $ident_truncatemtz
Harry Powell Andrew Leslie and Owen Johnson
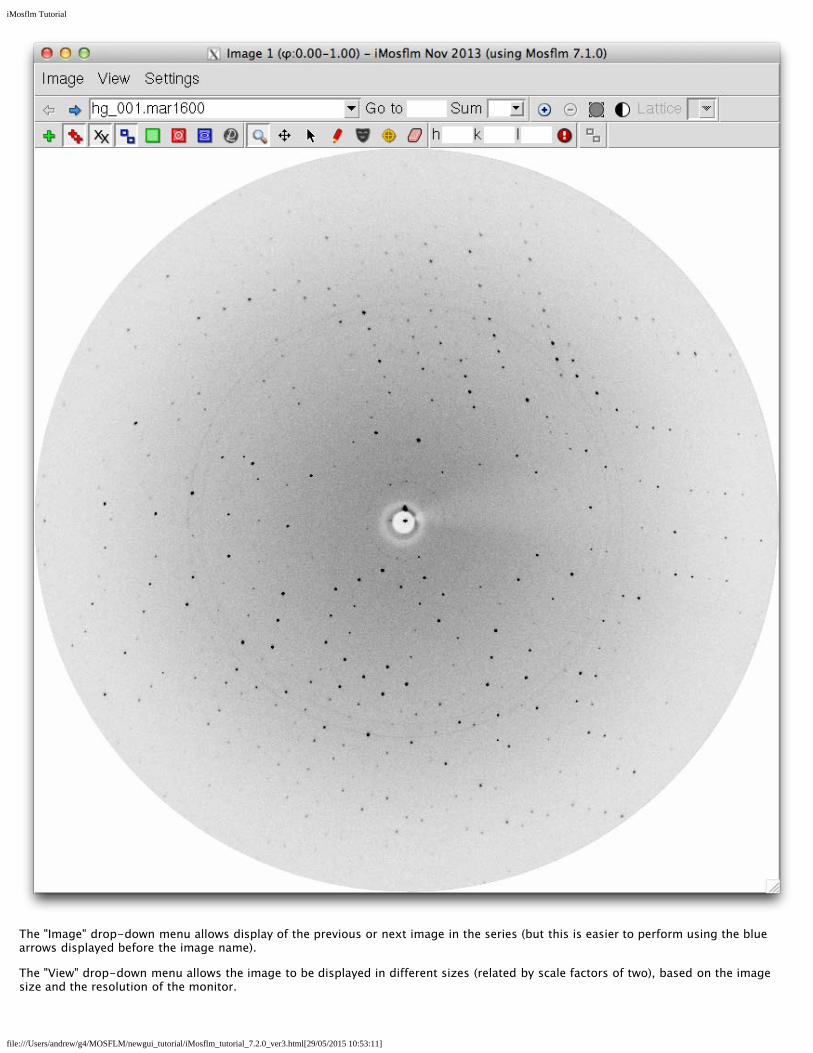
iMosflm Tutorial
fileUsersandrewg4MOSFLMnewgui_tutorialiMosflm_tutorial_720_ver3html[29052015 105311]
The Settings drop-down menu allows the colour of the predictions to be changed (see Indexing sect52 for the default colours) and thesize of the Pick box to be changed The third option (image summation) determines whether summed images are calculated byaddition or by taking the maximum or minimum values Only addition is implemented
The line below allows selection of different images either using right and left arrow or selecting one from the drop-down list of allimages in that sector Alternatively the image number can be typed into the Go to entry box
For Pilatus images only the Sum entry box will allow the display of the sum of several images the number (up to 20) can be chosenfrom the drop-down list
The image being displayed can also be changed by double-clicking on an image name in the Images pane of the main iMosflmwindow This will also re-active the image window if it has been closed
+ and - will zoom the image without changing the centre The Fit image icon will restore the image to its original size (right mousebutton will have the same effect) The Contrast icon will give a histogram of pixel values Use the mouse to drag the vertical dottedline to the right to lighten the image to the left to darken it Try adjusting the contrast The Lattice entry window can be used whenprocessing images with multiple lattices present see multiple lattices sect53
The reverse video icon allows an image to be rendered as light spots on a dark background that can help visualise small diffractionspots (eg for data collected using a Pilatus detector)
41 Display Icons
The eight icons on the left control the display of the direct beam position (since 720 a magenta cross not a green one) spots foundfor indexing bad spots predicted spots masked areas spot-finding search area resolution limits and display of the active mask forRigaku detectors respectively Clicking on these items will turn their display on or off
These are followed by icons for Zoom Pan and Selection tools and tools for adding spots manually (for indexing) editing masks circlefitting and erasing spots or masks
Next on this toolbar are the entry boxes for h k amp l and a button to search for this hkl among the predicted spots displayed on theimage The button resembles a warning sign if the given hkl cannot be found but a green tick if it is found The final icon relates toprocessing images with multiple lattices (see multiple lattices sect53) and is not described here
411 Masked areas - circular backstop shadow
Select the masked area icon A green circle will be displayed showing the default position and size of the backstop shadow
Make sure that the Zoom icon (magnifying glass) is selected and use the left-mouse-button (abbreviated to LMB in following text) todrag out a rectangle around the centre of the image The inner dotted yellow rectangle will show the part of the image that will actuallyappear in the zoomed area
iMosflm Tutorial
fileUsersandrewg4MOSFLMnewgui_tutorialiMosflm_tutorial_720_ver3html[29052015 105311]
Choose the Selection Tool When placed over the perimeter of the circle the radius of the circular backstop shadow will be displayedUse the LMB to drag the circle to increase its diameter to that of the actual shadow on the image The position of the circle can beadjusted with LMB placed on the cross that appears in the centre of the green circle Adjust the size and position of the circle so that itmatches the shadow
412 Masked areas - general exclusions
Choose the Masking tool Any existing masked areas will automatically be displayed Use LMB to define the four corners of the region tobe masked When the fourth position is given the masked region will be shaded This region will be excluded from spot finding andintegration This provides a powerful way of dealing with backstop shadows To edit an existing mask choose the Selection tool and usethe LMB to drag any of the four vertices to a new position
To delete a mask choose the Spot and mask eraser tool Place the mouse anywhere within the shaded masked area and use LMB todelete the mask Delete any masks that you have created
413 Spot search area
Select the Show spotfinding search area icon The inner and outer radii for the spot search will be displayed as shown below If theimages are very weak the spot finding radius will automatically be reduced but this provides additional control
Either can be changed by dragging with the LMB Do not change the radii for these images
iMosflm Tutorial
fileUsersandrewg4MOSFLMnewgui_tutorialiMosflm_tutorial_720_ver3html[29052015 105311]
Advanced Usage
The red rectangle displays the area used to determine an initial estimate of the background of the image It is important that this doesnot overlap significant shadows on the image It can be shifted laterally or changed in orientation (in 90deg steps) by dragging with theLMB
414 Resolution limits
Select the Show resolution limits icon The low and high resolution limits will be displayed The resolution limits can be changed bydragging the perimeter of the circle with LMB (make sure that the Selection Tool has been chosen) The resolution limits will affectStrategy Cell refinement and Integration but not spot finding or indexing The low resolution is not strictly correct (it falls within thebackstop shadow) but does not need to be changed because spots within the backstop shadow will be rejected
415 Zooming and Panning
First select a region of the image to be zoomed with the Zoom tool
Select the Pan tool and pan the displayed area by holding down LMB and moving the mouse This is very rapid on a local machine butmay be slow if run on a remote machine over a network
416 Circle fitting
The circle fitting tool can be used to determine the direct beam position by fitting a circle to a set of points on a powder diffraction ringon the image (typically due to icing) or to fit a circular backstop shadow (although using the masking tool is probably easier)
Select the circle fitting tool Three new icons will appear in the image display area There are two (faint) ice rings visible on the image at391Aring and 367Aring Click with LMB on several positions (6-8) on the outer ring (as it is slightly stronger) Then click on the top circularicon
A circle that best fits the selected points (displayed as yellow crosses) will be drawn and the direct beam position at the centre of thiscircle will be indicated with a green cross The direct beam coordinates will be updated to reflect this new position
iMosflm Tutorial
fileUsersandrewg4MOSFLMnewgui_tutorialiMosflm_tutorial_720_ver3html[29052015 105311]
5 Spot finding indexing and mosaicity estimationWhen images have been added the Indexing operation becomes accessible (it is no longer greyed-out)
Click on Indexing This will bring up the major Indexing window in place of the Images window
51 Spot Finding
By default the first image and a second image 90 degrees away in phi (or as close to 90 as possible) will be selected and a spot searchcarried out on both images (This is controlled by the Automatically find spots on entering Autoindexing tick box in the Spot finding tabof Processing options)
Found spots will be displayed as crosses in the Image Display window (red for those above the intensity threshold yellow for thosebelow) Only those above the threshold will be used in indexing The intensity threshold normally defaults to 20 but will beautomatically reduced to 10 or 5 for weak images The threshold is determined by the last image to be processed
The number of spots found together with any manual additions or deletions are also given
Images to be searched for spots can be specified in several ways
1 Simply type in the numbers of the images (eg 1 84 above)
iMosflm Tutorial
fileUsersandrewg4MOSFLMnewgui_tutorialiMosflm_tutorial_720_ver3html[29052015 105311]
2 Use the Pick first image icon (single blue circle)
3 Use the Pick two images ~90 apart icon (two blue circles) This is the default behaviour
4 Use the Select images icon (multiple circles) If selected all images in the sector are displayed in a drop-down list Click on aimage to select it then double-click on the search icon (resembling a target in the colum headed Find) for that image to run thespot search The image will move to the top of the list (together with other images that have been searched)
Images to be used for indexing can be selected from those that have been searched by clicking on the Use button If this box waspreviously checked then clicking will remove this image from those to be used for indexing It can be added again by clicking theSelect images icon and clicking on the Use box
Before indexing always check by looking at the image display that the spot finding has worked correctly ie that most spots thatyou can see have been found that multiple crosses have not been drawn over the same spot that spots have not been placedover ice rings or ice spots Check all images that will be used in indexing
511 If the spot finding has not worked well
Parameters affecting the spot search can be modified by selecting the Settings drop-down window and selecting Processing optionsThe resulting new window contains six tabs relating to Spot finding Indexing Processing Advanced refinement Advanced integrationand Sort Scale and Merge
The Spot finding tab allows the Search area Spot discrimination parameters Spot size parameters Minimum spot separation andMaximum peak separation within spots (to deal with split spots) to be reset It also allows the choice between a local backgrounddetermination (preferred) and a radial background determination The local background method also uses an improved procedure forrecognising closely spaced spots The only parameters commonly changed are
1 Minimum spot separation This should be the size (in mm) of an average spot (not a very strong spot) If there are badly split spotsthe spot finding may place two (or more) crosses for a single diffraction spot To avoid this happening set the minimumseparation in X and Y to values equal to the spot size in mm This can be found by zooming the image and counting the number ofpixels across the spot horizontally (X) and vertically (Y) To convert this to mm use the pixel size as given in Settings -gtExperiment settings -gt Detector This separation parameter is very important when spots are very close but usually the programwill determine a suitable value
2 Minimum pixels per spot Default value 6 but this should be reduced automatically if spots are very small (eg when using in situscreening and microfocus beam) If there clearly are spots present and the spot size is very small try reducing this parameter to 3or 2
3 Local background box size Reducing this from 50 to (say) 20 can reduce the number of false spots found near any sharp shadowon the image (or tile boundaries for tiled detectors) Normally these false spots are weak (and will be drawn as yellow crosses) inwhich case they will not affect the indexing
For data collected in-house the spots can be quite large and rather weak In such cases the spot finding parameters are automaticallychanged but some improvement may still be obtained by the following
1 Reduce the spot finding threshold (default 35) eg to 2
2 Change the minimum number of pixels per spot (default 30) to 20 or 40
3 Set the minimum spot separation to a sensible value eg 15mm see above
52 Indexing
Providing there are no errors during spot finding indexing will be carried out automatically after spot finding (This is controlled by theAutomatically index after spot finding tick box in the Indexing tab of Processing options) If the image selection or indexingparameters are changed the Index button must be used to carry out the indexing
iMosflm Tutorial
fileUsersandrewg4MOSFLMnewgui_tutorialiMosflm_tutorial_720_ver3html[29052015 105311]
Autoindexing will be carried out by MOSFLM using spots (above the threshold) from the selected images The threshold is set byMOSFLM but can be changed using the entry box in the toolbar The list of solutions sorted by increasing penalty score will appear inthe lower part of the window The preferred solution will be highlighted in blue There will usually be a set of solutions with lowpenalties (0-20) followed by other solutions with significantly higher penalties The preferred solution is that with the highest symmetryfrom the group with low penalty values
Note that all these solutions are really the same P1 solution transformed to the 44 characteristic lattices with lattice symmetryconstraints applied Therefore if the P1 solution is wrong then all the others are wrong as well
For solutions with a penalty less than 50 the refined cell parameters (ref) will be shown This can be expanded (click on the + sign) toshow the reg unrefined but regularised cell (symmetry constraints applied) and the raw cell (no symmetry constraints applied)
The rms deviation (rmsd) or error in predicted spots positions (σ(xy) in mm) and the number of spots used to refine the solution aregiven for each solution
Usually the penalty will be less than 20 for the correct solution although it could be higher if there is an error in the direct beamcoordinates (or distancewavelength) The rmsd (error in spot positions) will typically be 01-02mm for a correct solution but if thespots are split or very elongated it can be as high as 1mm or higher
The predicted spot positions for the highlighted solution will be shown on the image display with the following default colour codes
Blue Fully recorded reflectionYellow (orange for Pilatus) Partially recorded reflection
iMosflm Tutorial
fileUsersandrewg4MOSFLMnewgui_tutorialiMosflm_tutorial_720_ver3html[29052015 105311]
Red Spatially overlapped reflection these will NOT be integratedGreen Reflection width too large (more than 5 degrees) not integrated
These colours may be adjusted via the Settings -gt Prediction colour item in the Image display window
Providing there are no errors in the indexing MOSFLM will automatically estimate the mosaic spread (mosaicity) based on the preferredsolution
Select other solutions with a higher penalty and see how well the predicted patterns match the diffraction image
The rmsd and visual inspection of the predicted pattern are the best ways of checking if a solution is correct If the agreement is notgood then the autoindexing has probably failed
It is often worth repeating the indexing (once) as the refined direct beam coordinates from the first indexing may give animproved solution (lower rmsd)
521 If the indexing fails - Direct beam search
The indexing is very sensitive to errors in the direct beam coordinates For a correct indexing solution the error should be less than halfthe minimum spot separation Check for example that the current direct beam position is behind the backstop If there are any icerings these can be used to determine the direct beam position (see Circle fitting sect416 )
If the accuracy of the direct beam coordinates (generally read from the image header) is uncertain the program can perform a gridsearch around the input coordinates The number and the size of the steps can be set from the Indexing tab of the Processing optionsmenu (see Settings - Processing options sect21) but defaults to two steps of 05mm on each side of the input coordinates The directbeam search is started by clicking on the Start beam search button in the Indexing pane While in progress it can be stopped byclicking the Abort beam search button
The indexing will be carried out for each set of starting coordinates (Beam x and Beam y in the table which appears) and if a solution isfound the refined beam coordinates (Beam x ref Beam y ref) the unit cell parameters of the triclinic solution and the rmsd error in spotcoordinates and in phi will be listed The correct solution will generally be the one with the smallest rms error in spot positions (σ(xy))To make it simpler to identify the correct solution once the grid search has finished the solutions will be sorted on σ(xy) so the correctsolution will be at the top of the list When sorting the solutions those which have smaller cell parameters will be listed first as it ispossible to have a small σ(xy) value for an incorrect solution with a much larger unit cell Beware of solutions at the top of the list wherethe cell is clearly too small (only happens rarely)
Note that only the triclinic (P1) solution will be listed
If there is now a solution with a smaller rmsd value than before and especially if more than one set of starting beam coordinates has thesame refined coordinates this is a good indication that the beam search has worked Note that if the initial beam coordinates werewrong by more than ~15mm the search may not work In this case either select a new starting position for the direct beam or changethe number of steps
To complete the indexing double-click on the chosen solution and the full indexing will carried out for these beam coordinates withthe solutions appearing in the upper window The results of the direct beam search can be hidden (collapsed) by clicking on the Hidebutton and recovered by clicking on the Show button
iMosflm Tutorial
fileUsersandrewg4MOSFLMnewgui_tutorialiMosflm_tutorial_720_ver3html[29052015 105311]
522 If the indexing fails - Other parameters
Errors in other physical parameters (wavelength crystal to detector distance) can also result in failure All these parameters should bechecked
Several parameters used in autoindexing can also be adjusted using entry fields and buttons that appear in the Indexing toolbar
Weak images
1 MOSFLM automatically reduces the Iσ(I) threshold for weak images and it may also reduce the resolution to 4Å but lower valuescan be tried It is important not to include spots that are not real - a small number of false spots can prevent the indexing fromworking
2 Try changing parameters for spot finding (see If the spot finding has not worked well sect511)
Multiple lattices
1 Try increasing the Iσ(I) threshold (default 20) for example to 40 or 60 so that only spots from the stronger lattice are selectedThis can be done by entering a new value in the leftmost of the circled icons above (and also via the Indexing tab of Processingoptions)
All cases
1 Include more images in the indexing Select images that are widely spaced in phi not close together2 Select images that show the clearest lunes andor have the best spot shape3 In case the crystal orientation has changed or if you are unsure of the direction of positive rotation in phi try indexing using only
one image4 Make sure that the Max cell edge value is not too small If in doubt set to 200 Aring (or more if the cell is expected to be large)5 If the cell parameters are known reduce the maximum allowed cell edge to the known maximum cell edge This can sometimes
help filter incorrect solutions but use with caution as often this needs to be ~twice the largest cell for successful indexingAlternatively try the known cell option
6 If the detector distance is uncertain and the images are high resolution (eg 2Å) allow the detector distance to refine during cellrefinement Use with caution
53 Indexing multiple lattices simultaneously
This is a new feature and is still undergoing development It is most likely to succeed when the different lattices are clearly separated atleast at higher resolution If the images shows badly split spots with several components (each arising from a sub-crystal with a slightlydifferent orientation) then indexing may well still be impossible
After spot finding examine the image to ensure that spots that are close to each other but belong to different lattices have beenidentified as separate spots and not treated as a single split spot (in which case the red cross will lie midway between the two spots)Adjusting the minimum spot separation (Settings -gt Processing options -gt Spot finding) can help in resolving close spots It may alsohelp to increase the inner radius of the spot search region (see Spot search area sect413) so that low resolution reflections where the
iMosflm Tutorial
fileUsersandrewg4MOSFLMnewgui_tutorialiMosflm_tutorial_720_ver3html[29052015 105311]
spots are not really separated are excluded from the search
The following procedure usually provides the best chance of success
1 Select appropriate images for use in indexing The separation of the lattices can be clearer on some images than others Ideallychoose several images widely separated in phi
2 Do a normal (single lattice) indexing first This will usually work but will give a high positional rmsd because of the presence of morethan one lattice This step is important because it will result in more accurate direct beam coordinates which are crucial for multi-lattice indexing
3 Select the ldquoIndex multiple latticesrdquo icon (next to the Index button) the Index button will change to Index multiple
The indexing results for different lattices will be presented in different tabs while the selected solution for each lattice will be shown inthe lower Summary window Currently a maximum of 5 lattices can be handled The figure below shows a case where 3 differentlattices were found
4 Judge the success of indexing by examining the lattice type and the cell parameters obtained for the different lattices (the cellsshould be very similar) and checking that the predictions match the observed spots The rmsd values for correct lattices should also besignificantly smaller than the value obtained in the initial (single lattice) indexing It may be necessary to manually select a differentautoindexing solution for some lattices in order to get the same lattice type (eg oP) for the different lattices
The Split column in the lower pane indicates the angle between the reference lattice (with value -) and the other lattices This is onlycalculated when the lattices have the same lattice type In this case the angles between lattice 1 and lattices 2 amp 3 are 34 and 16degrees
If a lattice is clearly incorrect it can be deleted by highlighting that lattice (in the lower pane that summarises the results) and using theright mouse button to select ldquodeleterdquo
The predictions for different lattices can be displayed either by highlighting the lattice in the Summary window or by using the latticeselector in the image display pane
iMosflm Tutorial
fileUsersandrewg4MOSFLMnewgui_tutorialiMosflm_tutorial_720_ver3html[29052015 105311]
In the image display spots in different lattices that overlap with each other are shown in magenta Only the summed intensity will bemeasured for these reflections
The predictions for all lattices can be shown by selecting the ldquomerge latticesrdquo icon in the image display
This can be useful to check if all the lattices have been successfully indexed because all spots in the image should then be predicted Inthe display predictions from lattice 12345 are shown in blue yellow red green and magenta with no distinction made between fullyand partially recorded reflections or spatial overlaps
iMosflm Tutorial
fileUsersandrewg4MOSFLMnewgui_tutorialiMosflm_tutorial_720_ver3html[29052015 105311]
531 Practical Tips
Beware of solutions where the lattices only vary in orientation by a small angle (less than 1 degree) as these are often different solutionsfor the same lattice The difference in orientation between lattices is given by the ldquosplitrdquo column in the Summary window but this is onlycalculated if the lattices have the same lattice type Differences are all relative to one lattice which will display a split angle as ldquo-ldquo Tocalculate the angles relative to a different lattice open the tab for that lattice select a different solution to that currently selected andthen select the original solution ndash this will trigger recalculation of the split angles relative to that lattice
Other parameters that can influence the indexing are the rdquoMaximum deviation from integral hklrdquo (default 02 when indexing multiplelattices otherwise 03) and ldquoNumber of vectors to find for indexingrdquo (default 30) These can be changed via the Indexing tab of theldquoProcessing Optionsrdquo that can be selected from the ldquoSettingsrdquo menu item Values between 015 and 025 might be helpful for the firstparameter and increasing the number of vectors from 30 to 50 can also help At present there is no defined protocol for changing thedefault parameter values for particular cases it has to be done by trial and error
Experience so far has shown that selecting appropriate images and adjusting the maximum cell length used in indexing have the biggesteffect The optimum value for the maximum cell length will normally lie between one and three times the largest cell dimension but it isworth varying this in steps of between 25 and 50 Aring as the indexing can be very sensitive to this parameter
For a more complete discussion of multiple lattice indexing see Powell HR Johnson O amp Leslie AGW 2013 Autoindexingdiffraction images with iMosflm Acta Cryst D69 1195-1203
54 Known cell option
For images that are very difficult to index if the cell parameters are known the known cell option can be usedSelect the ldquoKnown cellrdquo icon (next to the Multiple lattices icon) Enter the cell parameters in the Input known cell pop-up window andselect OK when all 6 parameters have been provided Then select the Index Cell button
To revert to normal indexing select the ldquoKnown cellrdquo icon and then select Clear in the Input known cell pop-up window
55 Space group selection
Note that the indexing is based solely on information about the unit cell parameters It will therefore be very difficult (or impossible) todetermine the correct Laue group in the presence of pseudosymmetry For example a monoclinic space group with β ~ 90deg will appearto be orthorhombic an orthorhombic space group with very similar a and b cell parameters will appear to be tetragonal These can onlybe distinguished when intensities are available (ie after integration) by running POINTLESS (QuickSymm) (see Running Pointless to check the
iMosflm Tutorial
fileUsersandrewg4MOSFLMnewgui_tutorialiMosflm_tutorial_720_ver3html[29052015 105311]
symmetry sect10)
In addition it is not possible to distinguish between Laue Groups 4m and 4mmm 3 and 3m 6m and 6mmm m3 and m3m Thiswill not affect integration of the images but it will affect the strategy calculation In the absence of additional information the lowersymmetry should be chosen for the strategy calculation to ensure that a complete dataset is collected
The presence of screw axes also cannot be detected so there is no basis on which to distinguish P21 from P2 etc This does not affectany aspect of data collection or processing and can be chosen (on the basis of systematic absences) after integration by runningPOINTLESS
In this example there is no way of knowing at this stage if the space group is h3 or h32 so leave it as h3
56 Mosaicity estimation
If the Automatically index after spot finding option has been chosen (Indexingtab of Processing Options) the mosaicity (mosaic spread) will be estimatedautomatically for the preferred solution However if another solution is chosenthe mosaicity should be estimated again
Click on the Estimate button to estimate the mosaicity
A window will appear which plots the total predicted intensity as a function ofmosaic spread from which an estimate is determined
The predictions displayed on the image will be updated Entering different valuesof mosaic spread in the box (followed by return) will allow a visual estimate of theeffect of changing the mosaic spread
The mosaic spread can also be entered in the Images pane by clicking once on theMosaicity line and once again on the value displayed
561 The mosaic block size
In some cases the apparent mosaic spread is much larger at low resolution than at high resolution so that if it is set to a value thatresults in all the low resolution spots being predicted many more spots are predicted than are visible at high resolution This effect isbest dealt with by adjusting the Mosaic block size which is also displayed in the Images pane This is modelling the size in microns ofthe individual mosaic blocks in the crystal Decreasing this to values of 05-5 microns (say) from the default of 100 microns will resultin predicting more spots at low resolution but have virtually no effect at high resolution This parameter is not refined (at present) andso the best value must be determined by trial and error
6 Saving and recovering a sessionThe session can be saved at any time using the Session drop-down menu referred to in sect21 The first time that a session is saved youwill be prompted for a filename The filename convention for saved session files is that the extension is mos
Save the current session Then exit from iMosflm (using the Session drop-down menu) restart iMosflm and read in the saved session
If the program crashes it should be possible to recover all but the latest actions as a temporary copy of the session file is continuallysaved to the directory mosflm in the users home directory
Restart iMosflm and it will pop up a Recover session window
Selecting the Recover button will restore the session as far as possible
iMosflm Tutorial
fileUsersandrewg4MOSFLMnewgui_tutorialiMosflm_tutorial_720_ver3html[29052015 105311]
7 Data collection strategyOnce the crystal orientation and (probable) Laue group have been determined it is possible to calculate a data collection strategy andthe Strategy icon is no longer greyed-out (in fact all other operations Strategy Cell Refinement and Integration become possible at thispoint)
Select the Strategy icon This will open the Strategy window
The statistics initially presented in the window are based on the images read in to the current session If only two (or more) references
iMosflm Tutorial
fileUsersandrewg4MOSFLMnewgui_tutorialiMosflm_tutorial_720_ver3html[29052015 105311]
images have been read in no statistics will be presented
When the Strategy option is used after two initial images (typically 90deg apart in φ) have been collected a complete shaded segment willnot be shown in the lower part of the screen rather an empty circle will be shown with the matrix label beneath it Click the Auto-complete button and in the pop-up menu that appears select a rotation angle or sweep of data to collect - or leave the Rotationsetting as Auto for a calculation of maximum completeness for this crystal orientation Click on Ok and the completeness results willbe presented
The orientation of the crystal expressed as the angles between the abc unit cell axes and the XYZ coordinate frame is given X isalong the X-ray beam Z is the rotation axis A warning will be given if the unique axis is so close to the rotation axis that there will bemissing cusp data
71 Evaluating completeness manually
The completeness of any given segment of data can be determined manually using the circle at the bottom left of the window Click onthe red segment shown in this circle
This will result in small black boxes being drawn on the circumference at the start and end of the red sector
Use the LMB to click on the black box at 0 and drag this around the circle
When the LMB is released the statistics for that sector will be displayed The statistics are presented in two ways Near the top right ofthe window the overall completeness is shown as red circles for unique data and anomalous pairs The average multiplicity is givenbeneath these circles
More detailed statistics (such as completeness as a function of resolution) are given in a series of histograms that can be selected by adrop-down menu
72 Calculating a strategy automatically
Uncheck the Use checkbox at the right side of the hg_001 line listed in the sector list near the top of the Strategy pane This means
iMosflm Tutorial
fileUsersandrewg4MOSFLMnewgui_tutorialiMosflm_tutorial_720_ver3html[29052015 105311]
that the 84 images used thus far will not be included in the completeness calculation only the matrix derived from indexing them willbe used Select the Auto-complete button to calculate a strategy automatically
A strategy calculation data pop-up window will appear
If multiple matrices have been defined (for different sectors of data) then the appropriate one can be selected (if there is only one sectorthis has no effect)
The total φ rotation to be used is normally calculated by MOSFLM based on the Laue group and the crystal orientation (the Auto setting)However it is sometimes possible to achieve a high completeness with a significantly smaller total rotation (eg 60deg in two 30degsegments will typically give gt94 completeness for orthorhombic space groups) and this can sometimes be useful if radiation damage isa serious problem although when using hybrid pixel detectors it is better to use a very conservative exposure time and collect a wide φrotation
Total rotation angles of between 5deg and 90deg can be selected from the drop-down list The number of segments to be used can be setbetween 1 and 3
If the check box is checked data completeness will be calculated to optimize the proportion of anomalous data collected
THIS IS IMPORTANT The optimum strategy is often different when maximising completeness of the anomalous data
Choose the default values (Rotation Auto Segments 1) but check the anomalous data box then click on Ok Look at the variousstatistics presented as bar charts
In space group H3 if rotating around the c axis a total rotation of 120deg would be required to collect a complete dataset (ignoring anydata lost in the cusp) Because the c axis is 22deg away from the rotation axis in this case it is possible to collect very high completeness(for unique data) with a rotation much smaller than this
Try to find the minimum total rotation that will give a dataset that is gt95 complete for the unique data Now do the same butrequiring gt95 completeness for the anomalous data
SKIP OVER SECTION 73 IF DOING THE NORMAL TUTORIAL
73 Calculating a strategy using multiple crystals
The Strategy pane may also be used when due to radiation damage many crystals are required to collect a complete dataset
IMPORTANT This procedure will only work correctly for space groups where there is no indexing ambiguity For those spacegroups where there is an indexing ambiguity( see httpwwwccp4acukdisthtmlreindexinghtml for a complete list) it isnecessary to integrate images to determine whether different crystals have been indexed in the same way This is not achievablewithin the Strategy option at present
Suppose the first crystal has been indexed from the reference images
Enter the Strategy pane an empty circle is displayed in the bottom part of the screen and click on the Auto-complete button nearthe top-right of the pane In the Auto-complete window that appears choose a suitable Rotation angle for the amount of datathat can be collected from one crystal say 20 degrees for this example Leave Segments set to 1 and do not check Optimize foranomalous data
Click the Ok button and the completeness of the data will be displayed The matrix name start and end phi values and the phiextent will be displayed in the top area of the pane with a checkbox ticked under the Use column This means this segment will beused in further strategy calculations
Accept and save this result by clicking on the yellow hatched segment displayed in the large circle near the bottom of the paneClick once and the segment will be outlined in black (you can adjust the start or end phi value calculated in one degree incrementsby click+dragging the respective black square) click again this time on the black square denoting the start or end phi (or release ifyou have adjusted by click+dragging) and the segment will turn red The segment will not be saved unless it has turned red
This result will be saved if you leave this pane (eg to load more images) and return later in this session The strategy file can alsobe saved to a permanent file using the Save button on the tool-bar This is highly recommended when working with many crystals
Return to the Strategy pane when you have loaded and indexed the reference image(s) from the second crystal and repeat the procedureabove You will see the calculated segment from the first matrix displayed at the bottom-left of the screen The optimum phi range for
iMosflm Tutorial
fileUsersandrewg4MOSFLMnewgui_tutorialiMosflm_tutorial_720_ver3html[29052015 105311]
the second crystal will be displayed Save this in the same way as for the first crystal (clicking twice) Repeat this procedure for anysubsequent crystals and in each case the optimum phi range will be calculated for the latest crystal taking into account the data fromprevious crystals
It is a good idea to save the strategy to a file as each new crystal is added in case the program crashes and this information is lost
In practice it is probably safest to have a separate iMosflm session that is reserved for the strategy calculations and not used to processany data The strategy for each new crystal can be calculated as described above If there is a problem and the session is corrupted or ifiMosflm is closed down for any reason it is straightforward to restore the status of the session providing the strategy has been savedThe following steps should be taken
1 Read in the reference images for the latest crystal and index them
2 Select the Strategy pane
3 Read in the optimised strategy for all previous crystals using the ldquoAddrdquo button and giving the appropriate filename
4 Making sure that the circle for the latest crystal is highlighted in the lower left window click on lsquoAuto-completersquo and follow the stepsdescribed above
Advanced Usage
The startend phi values for each crystalmatrix can be updated This might be required if for example only 10 degrees of useful datawere collected from a particular crystal instead of the anticipated 20 degrees To change the phi values click either on the matrix namein the top pane or on the circle showing the segment of data in the lower left pane (these are highlighted in a blue box as the mousemoves over them) The corresponding segment will now be displayed in the larger circle Click on the red segment so that a blacksquare appears at the startend phi values Then simply drag the appropriate phi to the desired value The completeness willautomatically be updated (but the strategy calculation for the latest crystal will not be repeated to do this the current segment must bedeleted by highlighting the matrix name and using right click and then repeating the Auto-complete step)
If matrix files saved from iMosflm are available from crystals for which data have been collected in previous sessions these can beadded into the calculation using the Add matrix button on the tool-bar
If the saved strategy result has become complicated or is incorrect and you wish to restart the calculations afresh there is a tool-barbutton Reload sectors from session This will remove any calculated sectors while leaving any known matrices listed at the bottom-leftof the Strategy pane
If you have saved a strategy file from a previous session this can be used to re-initialize the Strategy pane using the Load button onthe tool-bar
A Spacegroup pull-down menu has been added to the tool-bar to permit different choices of space group to be used in thecalculations (eg H3 and H32) This menu is populated from the list offered on the Indexing pane However the space group symboltext is editable Any space group symbol entered will be validated by Mosflm together with the current cell parameters
As a calculator for a multi-segment strategy the Strategy pane is reasonably flexible you can Save or Delete highlighted matrix lines byright-clicking As you highlight different matrix lines the orientation of the crystal expressed as the angles between the abc unit cellaxes and the XYZ coordinate frame is re-displayed in the centre of the pane
The following screen shot shows the cumulative results in the Strategy pane after this procedure has been followed for four crystals(ignore the iMosflm version number)
iMosflm Tutorial
fileUsersandrewg4MOSFLMnewgui_tutorialiMosflm_tutorial_720_ver3html[29052015 105311]
731 Calculating a strategy when some data have already been collected and processed
This option is not yet implemented If data have already been processed (to give an MTZ file) but the images are not currently available (eg they were collected on a previoussynchrotron trip possibly at a different synchrotron) then the MTZ file containing this data can be read and used to calculate a strategyfor data collection from new crystalsThe MTZ icon in the tool bar is used to read the MTZ file
74 Calculating a suitable oscillation angle
To calculate the maximum possible oscillation angle while avoiding spatial overlaps click on the Check for overlaps button A pop-upwindow will appear from which the option to calculate the maximum oscillation angle (as a function of φ) or check how many overlapswill occur for different (user selected) oscillation angles The results are plotted in the same pane as the histograms for the strategycalculations Note that the overlap calculation is based on the current values for the mosaic spread and spot separation and can be verysensitive to these values Note also that these are maximum and not necessarily recommended oscillation angles
iMosflm Tutorial
fileUsersandrewg4MOSFLMnewgui_tutorialiMosflm_tutorial_720_ver3html[29052015 105311]
8 Cell refinementIt is important to determine the cell parameters accurately before integrating the images Although the unit cell is refined as part of theautoindexing providing the diffraction extends beyond ~35Å resolution it is possible to obtain more accurate cell parameters using aprocedure known as post-refinement This procedure requires the integration of a series of images in ideally two or more separatesegments at widely different φ values The distribution of the intensity of partially recorded reflections over the images on which theyoccur is used to refine the unit cell crystal orientation and mosaic spread
Select the Cell Refinement icon
81 Selecting the images
iMosflm Tutorial
fileUsersandrewg4MOSFLMnewgui_tutorialiMosflm_tutorial_720_ver3html[29052015 105311]
There are several ways to select the images to be used in cell refinement Whichever method is used the image numbers will bedisplayed in the Images entry field iMosflm will automatically select appropriate images but these can be changed
811 Manual selection
A list of images can simply be typed into this box An image series can be specified as n-m where n and m are the first and last imagesDifferent series must be separated by white space or comma
For orthorhombic or higher symmetries two segments should be given approximately 90deg apart in φ For monoclinic or triclinic datathree or four segments are best (eg φ = 04590135)
The number of images that should be included in each segment depends on the mosaic spread and oscillation angle A reasonablenumber is 2(mosaic spreadoscillation angle +1) MOSFLM will automatically select two or more segments as appropriate Note thatthere is a limit on the total number of images that can be used
812 Automatic selection
Selecting the Automatically select images icon will select a suitable set of images
813 Graphical selection (Not recommended)
Selecting this icon will give a new window
Images can be selected by clicking in the Use check-box in the list of images or by using the mouse to drag a selection of imagesfrom the sector displayed The other icons allow the sector to be zoomed in or out and the viewed area to be moved to make theselection easier The final two icons on the tool-bar switch the segment display to fit the display space as either a full circle or aquadrant This Image palette can be closed by clicking outside its area but will close after 60 seconds anyway
82 Integrating the images and refining the cell
Use one of the methods above to select images to use in cell refinement and click on the Process button Before starting cell refinementcheck that the prediction for the first image in each segment to be used is good The majority of the spot positions must be correctlypredicted for the first image in each segment or else the refinement will not work
The selected images will be integrated and following integration the cell parameters are refined Selectable refined detector parameters
iMosflm Tutorial
fileUsersandrewg4MOSFLMnewgui_tutorialiMosflm_tutorial_720_ver3html[29052015 105311]
will be plotted as will the changes in crystal orientation and (if selected) mosaic spread If the shift in cell parameters is greater than 25standard deviations another cycle of integration and cell refinement is carried out Typically two or three cycles are required forconvergence Note that the current program activity is shown in the bottom left-hand corner of the window in the status message area
The different windows are explained below Moving the mouse over any parameter or plotted graph point will give a full description ofit
821 The detector parameters window
The values of the refined detector parameters are displayed for each image as it is integratedThere is the option to fix any of the parameters during integration by checking the Fix box onthe right The positional residuals (overall central and weighted) are also listed
Any of these parameters can be selected for plotting on the graph that appears to the right ofthis box by simply clicking on that parameter (which is then highlighted in blue as shown herefor Beam x and Beam y)
Check the stability of the refined parameters by displaying the appropriate graphs To getsensible scaling of the graphs only parameters with similar numerical values should be plottedtogether
For weak images (ie few visible spots in the outer regions of the image) the tilt and twistmay not be well defined and might refine to large values (greater than one degree) Insuch cases these parameters should be fixed It is not generally recommended to fix any
iMosflm Tutorial
fileUsersandrewg4MOSFLMnewgui_tutorialiMosflm_tutorial_720_ver3html[29052015 105311]
other detector parameters
For very weak fine sliced images (Pilatus only) there is the option to sum images when findingsuitable spots for refinement see Settings -gt Processing Options -gt Advanced refinementwhich can in some cases make the refinement more stable
822 The crystal parameters window
The values of the refined crystal missetting angles φ(x) φ(y) φ(z) the unit cell parameters andmosaic spread for the current image are displayed in the table Selected parameters will beplotted as for the detector parameters Specific unit cell parameters can also be fixed
If more than one segment of data is being used for cell refinement it is not unusual to see achange in orientation of the crystal between the two segments
Observe how the crystal orientation is different for images in the two segments See how themosaic spread varies during refinement
823 The central spot profile
The average spot profile for the central region of the detector is plotted for eachimage This confirms that the spot prediction is good If the profile is not welldefined and central in the box or if the blue border for the peak region of the spot ismuch larger than the apparent spots size it suggests a problem with the integrationand the initial prediction should be checked In some cases it may be necessary toincrease or decrease the Profile Tolerance parameters to ensure that the blue boxfits the spot To do this select the Advanced integration tab of Processing optionsCheck the central spot profiles for the images used in the cell refinement
824 The summary window
This window presents a summary of how selected parameters have changed indifferent cycles of the cell refinement The behaviour of these parameters gives agood indication of whether the cell refinement has been successful
If the refinement has been successful the RMS residual should be lower for thefinal cycle than in previous cycles However errors in the cell can be compensatedquite well by changing the crystal to detector distance so the differences are notalways dramatic
The other parameters that can be plotted from the pull-down list are the detectordistance and the Pixel ratio (Yscale)
The detector distance should be the same for all images in the refinement If the original indexing was based on auto-indexing a singleimage (say the first) then the detector distance might change for images from the second segment to compensate for an error in theoriginal cell If the variation in distance for different images increases with the cycle number this indicates that the refinement is notstable
The Pixel ratio (Yscale) parameter may also show an initial variation for images in different segments because refining Yscale (whichshould be 10000 for all except Raxis II and Raxis HTC detectors) can compensate for errors in cell dimensions in the same way that thedistance can The final values (last cycle) should be very close to identical for all images and should also be very close to unity (to within00010)
Cell refinement can be unstable if the data do not extend to at least 35 Aring If it appears unstable use the cell derived from auto-indexing a series of images well spaced in φ instead
iMosflm Tutorial
fileUsersandrewg4MOSFLMnewgui_tutorialiMosflm_tutorial_720_ver3html[29052015 105311]
Examine the plots to see if the parameters are stable and correct (Yscale)
825 The final results
When refinement has converged (or after 5 cycles) the initial and final cell parameters and the estimated errors (std dev) are listed
If time is available make a note of the std dev values and repeat the cell refinement using a larger number of images in each segmentAre the standard deviations smaller when using more images
83 Refining cell parameters for multiple lattices
Providing the resolution is high enough (generally better than ~35-32 Aring) and not too many of the spots in the different lattices areoverlapped it is possible to refine the cell parameters for each lattice individually The lattice to be refined is selected from the Latticeselector
This selector will be grayed out when processing a single lattice
84 If the prediction for the first image of a segment is poor
In some cases depending on how the indexing has been carried out or if the diffraction is poor or there has been a large change incrystal orientation during the data collection the prediction for one or more of the segments (the first image) may be poor In suchcases the integration and hence the cell refinement may fail It may be possible to successfully process the images after an initialrefinement of the crystal orientation using a pattern matching algorithm To select this option got to the Advanced refinement tab ofProcessing options and select the tick box for Refine orientation of first image in any run by pattern matching and for Integrate allimages Then refine the cell in the usual way During integration the orientation will be refined for the first image of each segmentoutput for this additional refinement will be written to the logfile but is not shown in the GUI
9 IntegrationThe accurate cell parameters are now used in the integration Note that although the images are integrated during the cell refinementthe intensities are not saved and no MTZ file is generated at that stage
It is good practice to start by integrating a block of images corresponding to a few degrees of data to check that the parameters do notneed further adjustment MOSFLM will generate warning messages after integration if there are any difficulties and it may be possibleto improve the situation by changing some of the default parameters (see Warning messages sect13)
Before integration ensure that the backstop shadow has been defined (see Masked areas backstop sect411 and Masked areas generalsect412)
91 Image selection
Image selection is performed in exactly the same way as in the cell refinement In this case the Automatic selection will simply includeall images in the current sector
Select images 1-10
92 Setting the MTZ filename and controlling updating of the image display
Two icons appear when the integration option is chosen
If the Show predictions icon is clicked the display window will be updated as eachimage is processed This will slow down the processing but allows the accuracy of theprediction to be checked for each image
iMosflm Tutorial
fileUsersandrewg4MOSFLMnewgui_tutorialiMosflm_tutorial_720_ver3html[29052015 105311]
Click on this icon so that the display will be updatedThe filename of the MTZ file containing the results of the integration is generatedautomatically but can be edited manually
93 Integrating the images
Click on the Process button to start integration
Integration of the images occurs in two passes In the first pass for each block of images (a number corresponding to a few degrees ofdata selected automatically by MOSFLM) the detector and crystal parameters are refined for each image in turn and the measurementboxes for all predicted spots are written to a file for use in the second pass In the second pass the standard profiles are formed fromreflections present on all of the images in this block and each image is then integrated and the results written to the MTZ file Thedisplay is not updated during the second pass and will remain on the last image of the block (assuming image updating has beenselected)
Note that the unit cell dimensions are normally fixed during integration and only the crystal orientation and mosaic spread are refinedCrystal parameter refinement only starts when a sufficient number of images have been integrated to provide data for the post-refinement typically after ~05-1 degree (more for high mosaicity)
94 Parameter display windows
As described in sect82 the refined detector and crystal parameters will be displayed in tables and selected parameters will be plotted ingraphs The average spot profile for each image will also be displayed
The size of these graphs (and the profile) can be expanded to fill the whole window by holding down Shift and clicking LMB anywherein the graph window A second Shift+click will revert the graph to the original size
In addition to these windows there are windows that tabulate and plot (as a function of image number) the mean Iσ(I) for profile fittedand summation integration intensities The overall values and the values for the highest resolution bin are given
The number of overloaded reflections Bad spots (ie those that fail certain tests see mosflm SUMMARY file sect15) Spatial overlaps andif processing multi-lattice images the number of lattice overlaps is listed for each image and can be plotted by highlighting thatparameter When processing data from crystals with large unit cells it is important to watch out for spatial overlaps (see sect97 for tips onhow to reduce the number of spatial overlaps if this is a problem)
A display of the standard profiles for different regions of the detector is also provided Poor profiles are averaged by includingreflections from inner regions of the detector Averaged profiles are indicated by a red line around the spot (rather than blue) Theoriginal unaveraged profile can be viewed a clicking on the profile (providing there were sufficient spots in that region to allowformation of a profile)
The profiles should be checked to see that they are well defined and centred within the box Poorly-defined diffuse or non-centredprofiles may suggest that the prediction is not very good in which case this should be checked on the corresponding image(s)
It may be useful to expand the standard profiles to fill the window using Shift + click in the profiles window
Finally the lower left window plots Iσ(I) as a function of resolution for any selected image
iMosflm Tutorial
fileUsersandrewg4MOSFLMnewgui_tutorialiMosflm_tutorial_720_ver3html[29052015 105311]
Different parameters can be plotted by selecting the small right- or left-pointing arrows on the title line above the plot
95 Integrating the whole datasetAssuming that everything looks OK the entire dataset can now be integrated However it is strongly recommended thatProjectCrystalDataset names are assigned first These are written to the output MTZ file and used by downstream programs inparticular AIMLESS will use this information when deciding which images belong to the same dataset
Select Experiment settings from the Settings drop-down menu (see Drop down menus sect21) to enter these names and optionally givea title for the MTZ file
Select images 1-84 and click on Process
951 Parallel Integration Using multiple cores
An option is available on the pull-down menu (next to the Process button in the Integration task) which splits up the integration jobover available cores on the local machine All aspects are currently determined automatically at present user-configurable options willbe available in a later version The algorithm used is as follows
iMosflm determines the number of cores available on the local machineIf the number of cores (N) is greater than 2 iMosflm splits the integration run into N-1 batches (up to a maximum of 16) containingapproximately the same number of images If N le 2 iMosflm splits the run into N batches
If the total number of images in each batch is less than 32 the number of batches is decreased until this condition is satisfied
The first batch is submitted as a background task consisting of a refinement stage and an integration stage with its input and outputfiles (including the MTZ file) in a new directory its name being determined from the number of segments of data being integrated andthe lattice number (if the sample has been determined to contain multiple lattices) If the directories exist already they are all movedinto a newly-created directory with a time-stamped name the files from the most recent integration run are thus in directories withnames following the pattern described above Once the refinement stage is complete the refined parameters are written to a file
The launch of subsequent batches are delayed until the corresponding preceding batch has written its refined parameters This file isread and the new batch is launched again with a refinement stage and integration stage
At present the job cannot be aborted once it has started
952 Integrating as a background job
By selecting Batch in the drop-down menu adjacent to the Process button the integration can be run as a background job rather thaninteractively and the GUI can be used to look at a different dataset
Selecting Batch from the drop-down menu will display a new window showing the script that will be used to process the images alongwith a number of processing options The script can be edited if additional keywords are required or if some parameters are to bechanged and can also be copied and pasted into a file for off-line processing
By default the job is divided into batches across multiple cores as determined for the parallel integration described in sect951 but thenumber of cores can be chosen by the user from a drop-down menu in this case the size of each batch is determined by the interface
Plotting the results of the integration can be turned off this can make processing much faster
iMosflm Tutorial
fileUsersandrewg4MOSFLMnewgui_tutorialiMosflm_tutorial_720_ver3html[29052015 105311]
It is possible to configure job submission for remote machines (which can be added by depressing the add host button) Ensure youhave enabled passwordless logins for all the remote machines you enter and that you specify the full path to the Mosflm executable inthe Batch destinations window The remote working directory (in which the log and MTZ files are written) and the remote imagedirectory must both be specified with their full path names Any required parameter fields that are not completed by the user arehighlighted in orange if the user tries to submit a job without completing these fields a new window containing only those fields (againhighlighted in orange) pops up with a request to do so
The number of cores available on the selected host can be determined by depressing the apple core button on the Batch destinationsconfiguration window
The log file for batch submission jobs the MTZ and SUMMARY files are written to the directory in which iMosflm was launched
96 Checking the integration
iMosflm Tutorial
fileUsersandrewg4MOSFLMnewgui_tutorialiMosflm_tutorial_720_ver3html[29052015 105311]
The detector and crystal parameter plots should be examined carefully to check for any instability in the refinement If there are largeand random variations in some parameters (eg the detector twist and tilt) then it may be better to fix them and repeat the integration
For cases (eg very small unit cells) where there are very few suitable reflections on each image the refinement of the missetting anglesmay show significant variations from one image to the next In such cases it is best to apply smoothing to the missetting angles usingthe tick box in Settings -gt Processing options -gt Advanced Refinement
Discontinuities due to blank images should also show up and the offending images should be removed from the scaling run
If adjacent spots are incompletely resolved on the detector it may be possible to improve the processing by increasing the PROFILETOLERANCE parameters by 1-2 These parameters can be set in the Advanced integration tab of the Processing options menu (useSettings)
97 Advanced features for integration
The Settings -gt Processing options menu allows additional control over the integration Parameters such as the minimum spotseparation resolution limits excluded resolution ranges block size MTZ filename and BATCH ADD can be changed in the Processingtab
Manually decreasing the minimum spot separation can help if a large number of reflections are flagged as spatially overlapped (redboxes) The prediction must be updated to see the effect of changing the separation this can be done either by displaying the next orprevious image or double clicking on the blue circle next to the image currently displayed in the Images pane
In the Advanced integration tab the measurement box parameters profile tolerance and profile averaging parameters can be set
The measurement box parameters can be adjusted for rare cases where the estimation of the spot size has not worked correctlyresulting in a box that is too small or too large The optimisation of the background rim and corner cutoff parameters that determinewhich pixels are used for the background and which pixels for the peak can also be turned off but this is generally not recommended
Increasing the profile tolerance can help in cases where adjacent spots are not completely resolved this can be judged by examining thestandard profiles By default the profile tolerance is automatically increased if there are a large number of spatial overlaps as this hasthe effect of reducing the minimum spot separation A message will be written to the logfile if this has happened This option can beturned off using the tick box Optimise profile tolerance values to avoid spot overlap
The profile outlier exclusion parameters control the exclusion of ice spots or hot pixels which could otherwise corrupt the standardprofiles
Pixels with a value less than the Null pixel threshold are considered to belong to inactive regions of the detector
The pixel saturation value determines when a reflection is considered to be an overload The intensity of overloaded reflections isestimated by profile fitting but these reflections are rejected by the scaling program AIMLESS by default
Increasing the Maximum reflection width in φ from the default value of 5deg will reduce the number of rejected reflections (green boxes)and is worthwhile when the mosaicity is very high or the mosaic block size is very small As with the minimum spot separation theimage must be refreshed to see the effect of changing this parameter
The rejection criteria will reject reflections with too much variation in the background (BGRATIO) or where the gradient of thebackground plane is too large These should only be changed if many reflections are being rejected PKRATIO only applies to fullyrecorded reflections and reflects a very poor profile fit With current data collection protocols there will be very few (if any) fullyrecorded reflections
Additional MOSFLM parameters will be added based on user requests
98 Integrating multiple lattices
When multiple lattices have been successfully indexed each lattice can be integrated individually by selecting the appropriate latticenumber
Reflections in the chosen lattice that are overlapped by a reflection from another lattice will be integrated but the measurement box willbe expanded so that the total intensity of the two (or more) reflections is measured These reflections will be flagged for specialtreatment Reflections that are not overlapped are referred to as singletons They will be dealt with in the normal way by POINTLESSand AIMLESS
NOTE If more than one lattice has been indexed and the results of integrating just ONE of the lattices are to be checked byrunning QuickSymm or QuickScale then the multi-lattice icon in the Integration pane must be turned off otherwise an error
iMosflm Tutorial
fileUsersandrewg4MOSFLMnewgui_tutorialiMosflm_tutorial_720_ver3html[29052015 105311]
message will be given saying that all lattices must be integrated
It is often the case that by measuring both lattices (in separate integration runs) and inputting both MTZ files to QuickScale the overallcompleteness is high using ONLY the singletons To use this option ensure that the multi-lattice icon is off
To make use of the intensity estimates for overlapped reflections MTZ files for all lattices must be input to the program FECKLESSwhich will derive the best estimate of the summed intensity This is the default option if more than one lattice has been indexed and itrequires that all lattices have been integrated (in separate runs) prior to running QuickSymm or QuickScale (FECKLESS will be runautomatically)
At this time no downstream programs can make use of the summed intensities of overlapping reflections but in the future it should bepossible to use this data in REFMAC
Currently it is recommended to use only singletons from all the lattices FECKLESS is not required in this case
The MTZ filename is automatically updated to reflect which lattice has been chosen to avoid overwriting the MTZ file of the first latticewhen integrating the second one FECKLESS when run from iMosflm relies on this naming convention so do not change it
10 Running Pointless to check the symmetryOnce the images have been integrated (even a few degrees of data in many cases) the program POINTLESS can be run to determine thetrue Laue symmetry and try to determine the space group using the QuickSymm button
iMosflm Tutorial
fileUsersandrewg4MOSFLMnewgui_tutorialiMosflm_tutorial_720_ver3html[29052015 105311]
Select the QuickSymm button
A summary of the Pointless results as shown below will appear in a qtRView window
Various graphs (L test for twinning ViewHKL to view the reciprocal lattice) can also be viewed in this window
Various options for POINTLESS such as a reference MTZ file forcing the symmetry selected in iMosflm and specifying multiple input MTZfiles can be selected from the Settings -gt Processing options -gt Sort Scale and Merge tab (see below)
iMosflm Tutorial
fileUsersandrewg4MOSFLMnewgui_tutorialiMosflm_tutorial_720_ver3html[29052015 105311]
Caution The results can be ambiguous if run with a partial dataset Look in the logfile to see how many relfections are used totest each possible symmetry operator
11 Running Aimless to scale and merge the dataSelect the QuickScale button
This will first run POINTLESS then change the space group for the data to that selected by POINTLESS (unless the iMosflm symmetry isset to override POINTLESS) run AIMLESS to scale and merge the data in that space group and then run CTRUNCATE which calculates anumber of statistics from the intensity data The CCP4 UNIQUEIFY script will then be run which generates all the unique reflections forthat spacegroup to the resolution of the measured data and will flag reflections (5 by default but this can be changed) for use as theRfree set
AIMLESS can be run from the QuickScale button either treating anomalous data (the default) or ignoring anomalous data If onlyprocessing a few degrees of data it is usually better to ignore anomalous because especially for low symmetry cases no mergingstatistics may be given in AIMLESS
SCALA can be selected as an alternative to AIMLESS for scaling (not recommended)
There is limited control over running AIMLESS (see figure above) including re-setting resolution limits rejecting batches (images)changing the treatment for accepting partials changing the rejection criterion and changing the procedure for updating the standarddeviation estimates
iMosflm Tutorial
fileUsersandrewg4MOSFLMnewgui_tutorialiMosflm_tutorial_720_ver3html[29052015 105311]
The AIMLESS results will be displayed in the qtRView as shown below along with graphical output (see below) and the full log file canalso be examined
Aimless summary file
iMosflm Tutorial
fileUsersandrewg4MOSFLMnewgui_tutorialiMosflm_tutorial_720_ver3html[29052015 105311]
An example of the Aimless graphical output
The AIMLESS logfile can also be examined by selecting the Log File tab
12 History and mosflm log fileSelecting History allows the history of the session to be examined or by selecting the Log tab the full mosflmlp file can be viewed Themosflmlp file is also available in a time-stamped file mosflm_yyyymmdd_hhmmsslp (eg mosflm_20100518_131019lp) and can beread with a text editor
The History has a tree structure and will show when various parameters have been changed This has not been fully implemented and isnot generally useful
The logfile may provide useful clues when processing has failed
13 Warning MessagesAs already mentioned in Adding images sect3 and Integration sect9 warning messages are generated by MOSFLM during processing Atraffic light colour coding has now been assigned based on the warnings and is shown next to the Warnings box
A Red status implies a serious problem that will affect data quality and should be addressed
An Orange status implies minor issues that should be checked to see if things can be improved
A Green status means no significant problems messages are for information only
iMosflm Tutorial
fileUsersandrewg4MOSFLMnewgui_tutorialiMosflm_tutorial_720_ver3html[29052015 105311]
Abbreviated messages can be obtained by clicking on the Warnings icon The full warning Details together with Hints amp Notes text (ifany are available) can be obtained by double-clicking the relevant warning Details are displayed in a pop-up text box which willdisappear with the next click outside the box The same full details and suggestions are of course available in the mosflmlp files whereeven more information may be available
NOTE This is the end of the part of the tutorial which deals directly with iMosflm but see sect19 which has some suggestions forfurther work if you have time The remainder of this document deals with integrating and scaling data with MOSFLM andAimless via the CCP4i user interface examining the traditional mosflm SUMMARY file with the CCP4 utility loggraph
The Appendix contains a shell script for running MOSFLM as a traditional batch job
14 Useful command line optionsiMosflm has a number of command line options and these can be listed by typingimosflm --helpCurrent options are
--allimages -a ltfilenamegt Starts mosflm loading all files that match the template generated from ltfilenamegt--ccp4i2 Autosaves an iMosflm session file upon exit with an XML list of all iMosflm output files--debug -d Creates a large output file for debugging purposes Dont use this unless asked to by a developer--expert -e Permits access to advanced detector settings This should not normally be required--fastload -f Attempt to speed loading of many images offline while indexing two default images separated by 90 degrees--help -h Displays this message then exits--imagedir -I ltdirectorygt Starts the image browser in this directory if ltdirectorygt is given as an environment variable it will be expanded to its full value--init -i ltfilenamegt Starts Mosflm and reads from the given saved session file--startdir -S ltdirectorygt Starts mosflm in directory ltstartdirgt rather than the current directory This will only work if the directory exists and you have write permission to it otherwise iMosflm will exit All the normal mosflm output files will be in this directory--singleimage -s ltfilenamegt Starts mosflm loading only the image from ltfilenamegt--site -X ltfilenamegt Reads anyall of the following lines from the file given WAVELENGTH ltxgt DISPERSION ltxgt POLARISATION [PINHOLE | MIRRORS | MONOCHROMATOR | SYNCHROTRON ltxgt] DIVERGENCE ltxh xvgt BEAM ltbeamx beamygt DISTANCE ltxgt DISTORTION TILT ltxgt DISTORTION TWIST ltxgt GAIN ltxgt DETECTOR REVERSEPHI DETECTOR OMEGA ltxgt--version -v Displays the program version and required Mosflm version then exits
These can be abbreviated to the shortest unambiguous string
141 The site fileimosflm --site ltsitefilegt will read keywords from the file ltsitefilegt that will overwrite incorrect information in image headers Thissaves having to manually correct values in every iMosflm session The site file can also be read or written as an option from the Sessionmenu (see Drop down menus sect21) Allowed keywords areWAVELENGTH ltxgt
iMosflm Tutorial
fileUsersandrewg4MOSFLMnewgui_tutorialiMosflm_tutorial_720_ver3html[29052015 105311]
DISPERSION ltxgtPOLARISATION [PINHOLE | MIRRORS | MONO | SYNCHROTRON ltxgt]DIVERGENCE ltxh xvgtBEAM ltbeamx beamygtDISTANCE ltxgtDISTORTION TILT ltxgtDISTORTION TWIST ltxgtGAIN ltxgtDETECTOR REVERSEPHIDETECTOR OMEGA ltxgt
15 The mosflm SUMMARY fileMOSFLM produces a summary file listing refined parameters for each image and when using iMosflm this file will be date- amp time-stamped and have a name such as mosflm_20100518_131019sum This contains the same information as the plots produced by theiMOSFLM GUI which now also include the number of bad spots and overloads
This can be inspected graphically from the CCP4i GUI using the program loggraph Select the pull down menu View Files from Job andunder Output files select Additional log graphs where the _SUMMARYloggraph file will be listed Select this file to display its tablesin loggraph
This is very useful to identify rogue images (with unusually high positional residual or low Iσ(I)) If you find any read that image intoMOSFLM and see what is wrong with it
If you have done more than one integration run during your MOSFLM session you will find multiple entries of the tables Look at the lastset for integration of the 84 images
Click on the Refined detector parameter tables and check on the stability of parameters like the TILT and TWIST of the detector (unitsare hundredths of a degree) and for Mar Research (or DIP) image plate data the distortion parameters ROFF and TOFF (units are mm) Ifthey are varying a lot (more than 20 for TWISTTILT) or 015 for ROFFTOFF then it is probably a good idea to fix these parameters atthe average value (or the known values for this detector if they are available) (see Detector parameters sect821)
Click on the Post refinement table and check the missets It does not matter if they change slowly and by an amount (per image) that isless than 01mosaic spread If they are changing more than this then there could be a problem with processing the data (there is notmuch you can do about this)
Check how the mosaic spread is changing If it is unstable or if you think it is not refining to sensible values (as judged by looking atthe prediction) then you can fix the input value in the same way as the detector parameters (see Crystal parameters sect822)
BADSPOTS AND OVERLOADS
The program will set a rejection flag for those reflections that fail certain tests for example too much variation in the background levela poor profile fit an intensity that is very negative (more than 5 standard deviations) a very high gradient for the background planeThese reflections are called Bad spots and they are listed individually for each image in the mosflmlp file together with the reason forflagging them The number of bad spots is also written to the summary file Generally there should be very few (5-10) bad spots oneach image If there are more it could be because the backstop shadow is not correctly allowed for (consider using the NULLPIXkeyword)
There should also be very few overloaded reflections on each image If there are a lot then a separate low resolution data collectionpass should be made with a much shorter exposure time
IMPORTANT Both Bad spots and Overloads are written to the output MTZ file but will be rejected by default by AIMLESS Theintensity of overloaded reflections is estimated by profile fitting that part of the spot that is not saturated To include these reflections inthe final merged data use the ACCEPT keyword in AIMLESS
16 Scaling data with CCP4i ccp4i
Select Directories amp ProjectDir (top right)
In the new window select Add project
Enter the project name in the Project field and the full directory path in the uses directory field Default values may have been enteredalready here Select this project from Project for this session
Select Apply and Exit Dismiss the warning message that comes up
Select Data reduction from the pull down menu of modules (orange bar at top left)
iMosflm Tutorial
fileUsersandrewg4MOSFLMnewgui_tutorialiMosflm_tutorial_720_ver3html[29052015 105311]
Select Symmetry Scale Merge (Aimless)
In the window that appears do the following
Give a job title (top line)
Click on the box next to Separate anomalous pairs for outlier rejection amp merging statistics (the crystals have been soaked in a mercurycompound)
In the next orange bar (line starts HKLIN 1) select Browse and select the MTZ file output by MOSFLM (probably called hg_001mtz)Select OK
If you did not supply the Project name Crystal name or Dataset name to Mosflm fill in the boxes for these now
Under Scaling Protocol
From the pull-down menu on the line starting Scale select with automatic default settings
At the bottom of window from the pull-down menu named Run select RunampView Com File
This will display a new window showing the command file for running the POINTLESS step select Continue After a brief pause it willshow the command file for running AIMLESS (This can be edited before submitting the job) Select Continue
In the main window it will show that the AIMLESS job is running
When AIMLESS has finished the command file for running the CTRUNCATE step will appearselect Continue
When CTRUNCATE has run the main window will say FINISHED
At that point select the pull-down menu View Files from Job and select View Log Graphs This will give you the same graphs asrunning loggraph on the AIMLESS log file they are also the same as those that appeared in IMOSFLMs QuickScale task To look at thelog file itself (eg the overall merging statistics) select View Log File and it will appear in a new window
161 Looking at the AIMLESS output
The simplest way to look at the output from AIMLESS is to use loggraph on the AIMLESS log file (or via the CCP4i GUI) This can displaymany different graphs
Use Scales vs rotation range to check for smooth variation in the scale factor Check the variation in B factor with image and if there isno real variation it is best to turn off the B-factor refinement
Use the Analysis against all Batches for all runs to detect bad images (high R-factor large number of rejected spots)
Check the Analysis against resolution Fractional bias to see if there is any indication of Partial bias (A negative partial bias will resultif the mosaic spread is underestimated or if there is a lot of diffuse scatter
The Fractional bias should be less than 1-2 although it will often exceed this for weak data (eg in the high resolution bins)
The Axial reflections graphs in AIMLESS are useful for detecting systematic absences which can be used to identify the true spacegroup However the detection of screw axes is thought to be sufficiently robust in POINTLESS that these graphs are no longer necessary
It can also be useful to look at the AIMLESS log file itself in particular the table giving statistics as a function of resolution The effectiveresolution limit of the data can be estimated by looking at the Mn(I)sd column (this is the mean Iσ(I) AFTER merging symmetry matesand is the best indicator of data quality) This table also shows shell and cumulative R-factors
The Mn(I)sd values depend on having realistic values of the standard deviations (errors) in the intensities As the values that come fromMOSFLM are always underestimates of the true error these values are scaled up in AIMLESS using a three-term correction
sdcorrected = SdFac Sqrt[sd(I)2 + SdBLPI + (SdAddI)2]
Here SdFac is an overall scale factor and SdB and SdAdd are intensity dependent factors
AIMLESS will automatically work out a suitable value for all three parameters in order to make the mean value of (observedscatter)(sdestimate) equal to 10 where observed scatter is the difference between an individual estimate of intensity and the mean ofall other estimates (from symmetry mates)
Probably the best estimate of the true high resolution limit of the data can be obtained from the CC(12) values these are thecorrelations between equivalent observations that have been divided randomly into two half-datasets The resolution limit is foundwhen the CC drops below ~ 05 - 03
This table comes under the heading
ANALYSIS OF STANDARD DEVIATIONS
iMosflm Tutorial
fileUsersandrewg4MOSFLMnewgui_tutorialiMosflm_tutorial_720_ver3html[29052015 105311]
in the AIMLESS log file and Run n standard deviation v Intensity test (where n is 1 or more) in the CCP4i GUI View Files from Job -View Log Graphs display
Can you identify a bad image in this dataset Can you work out why it is bad
(Cluethe image headers contain quite a lot of information that is not used by MOSFLM including the date and time that the image wascollected)
You can exclude a given batch from the scaling using the EXCLUDE keyword
RUN ALL EXCLUDE imagenumber
In this case run number will be 1
Rerun the scaling SENDING THE OUTPUT TO A NEW LOGFILE excluding this image and see the effect on the heights in the anomalousPatterson (in the log file) DO NOT repeat the integration In the command file uncomment the line (near the top) goto aimless so itskips the integration part
In the CCP4i GUI click to highlight the AIMLESS job which is listed as FINISHED and select ldquoReRun Jobrdquo from the control buttons downthe right-hand side of the main interface window Under ldquoExcluded Datardquo in the window that appears check the box next to Excludeselected batches and pull-down on the menu button to exclude a range Give the start amp end range to exclude (eg 74 to 74) Rerunthe job as before
17 Changing the symmetryFrom the list of options at the left hand side of the main window select ldquoUtilitiesrdquo and under that SortModifyCombine MTZ Files
In the new window give a new title eg reindex as H32
Click on the Box Change space group andor reindex reflections
Use the browse option to select the input MTZ file (First orange bar) the output filename will be generated automatically (but you canchange it)
Under Reindex details
In the last option check the box next to ldquoChange space group tordquo and enter H32 in the box This is above the final item Reducereflections to the asymmetric unit which is checked by default
Select Run from the Run option button
Then go back to the scaling window and select the new MTZ file (reindexed) as the input for scaling (use Browse) CHANGE THE JOBTITLE
Then select RUN
The scaling will now be performed in space group H32 Look at the merging statistics in the log file in particular the multiplicityweighted R-factor called Rmeas in the log file
18 Looking at the CTRUNCATE outputThe CTRUNCATE program converts intensities to amplitudes and also compiles some useful statistics The LTEST and the cumulativeintensity statistics tabulated by CTRUNCATE (and plotted by loggraph) provide the only point at which you will be able to detectmerohedral twinning (when the two lattices of the twin components exactly overlap and every measured intensity is actually the sum oftwo intensities)
For a good dataset the observed distribution should be within 1 of the theoretical distribution Is this the case for this data
19 If you have time 191 Different mosaic spreads
Try repeating the processing with the mosaic spread set to a value 25 smaller than the refined one and fix it by checking the Fix boxin the Integration window in iMosflm
Can you tell from the merging statistics if this data is better
192 Checking up on outliers
iMosflm Tutorial
fileUsersandrewg4MOSFLMnewgui_tutorialiMosflm_tutorial_720_ver3html[29052015 105311]
AIMLESS writes a file called ROGUES which lists reflections which show very poor agreement between symmetry mates or which areimplausibly large
Look in this file (it is ASCII) and try to work out why this has happened The ROGUES file gives you the image (Batch) on which thereflections have been recorded (for partials this is the image nearest the centre of the reflection so you may need to look on thepreceding and following image as well) Select a reflection which shows very poor agreement with its symmetry mates (A value greaterthan 10 in the DelIsd column in the ROGUES file)
Select the offending image by double-clicking it in the Images pane of the iMosflm main window Predict the reflections then enter thehkl values into the boxes and hit Return (or click the red warning button following the entry box for l) to locate the offending reflectionin the image You must give the measured indices - the first set of values in the ROGUES file - when doing this See if there is anythingodd about the spot Remember to check adjacent images for partials
193 How accurate does the unit cell have to be
Try changing the cell parameters by (say) 10 and integrate the images again What is the effect on the merging statistics
20 Tips1 When reading images into a session DO NOT attempt to carry out any other task until ALL the images have been read2 It is often worth repeating the indexing (usually only once) as the refined direct beam coordinates from the first indexing may give
an improved solution when the indexing is repeated (lower rmsd)3 Always integrate a few degrees of data before integrating the whole dataset (see sect9) If the space group is not known in advance
run Quicksymm with a few degrees of data to check that the correct indexing solution has been chosen4 For difficult images do not attempt to refine the unit cell initially once an indexing solution has been obtained try integrating a
few images to ensure that the integration is stable If then going on to refine the cell check that the prediction looks OK for thefirst image of every segment included in the refinement If it does not look very good consider using the pattern matching(Settings -gt Processing options -gt Advanced refinement see sect84)
5 If the resolution of the data is less than 35 Aring do not use the ldquoRefine Cellrdquo task Instead use several images in indexing and use thecell that comes from the indexing
6 If iMosflm gets into a state where the activity icon(upper right) is spinning but nothing seems to be happening click on the activityicon to stop it spinning and see if the session can be continued DO NOT click on the activity icon simply to abort a task this willgive unpredictable results Use the Abort button for cell refinement or integration There is no defined way to abort indexing
7 Use the image summation option (see sect4) to get a better impression of the diffraction for very low exposure Pilatus images8 Use image summation for detector parameter refinement for fine sliced very weak Pilatus images (Settings -gt Processing options -
gt Advanced refinement see sect821)9 For large mosaic spread values (gt 10deg) or small mosaic block sizes (lt10) consider increasing the maximum allowed reflection
width to avoid having too many green predicted reflections (Settings -gt Processing options -gt Advanced integration see sect97)10 By default on selecting the Indexing task iMosflm will find spots index and (assuming a solution has been found) estimate the
mosaicity For difficult cases it is more useful to restrict this to simply finding spots and then do the indexing and mosaicityestimation by clicking the appropriate buttons To do this change the check box Automatically index after spot finding inSettings -gt Processing options -gt Indexing
11 See sect521 and sect522 for advice if the indexing fails Also consider the possibility of a reversed phi rotation direction if you arenot familiar with the beamline (Settings -gt Experiment settings -gt Experiment see sect21)
12 If the detector parameters have refined to physically unreasonable values (eg because cell refinement or integration has beencarried out using an incorrect indexing solution) be sure to reset the detector parameters before attempting further processing(Settings -gt Experiment settings -gt Detector see sect21)
13 Always set the resolution limit slightly beyond the point at which any spots are visible (see sect414 ) For very weak fine-sliceddata it can be very difficult to estimate the resolution visually so integrate to the maximum resolution (inscribed circle) and usethe merging results to set the final resolution There should be no problems integrating to a resolution ~03-05 Aring beyond theactual resolution limit but for example integrating to 3 Aring when the true resolution limit is 5-6 Aring may cause problems and theintegration should then be repeated with a more realistic resolution limit
14 Use the site file sect141 if repeatedly processing data where the direct beam position is wrong or if the phi direction is reversed etcto save having to correct this for every session
Appendix IA command script for running MOSFLM using the keywords copied from the Batch processing window of the new GUI (see Integratingas a background job sect952) Note that keyworded input for MOSFLM and other CCP4 programs is case-insensitive apart from file anddirectory names
bincsh -fv Set a unique identifier for filenames for this job
set ident = x89_mos07_blk3_smallsep
iMosflm Tutorial
fileUsersandrewg4MOSFLMnewgui_tutorialiMosflm_tutorial_720_ver3html[29052015 105311]
$ipmosflm COORDS $identcoords SUMMARY $identsummary ltlt eof-ip Insert keywords copied from iMosflm batch window here
Keywords for this run For example could involve trying different values for mosaic spread or not integrating all images etc etchklout $identmtzgenfile $identgenprocess 1 1000 goeof-ip
pointlesspointless hklin $identmtz hklout $ident_pointlessmtz
aimlessaimless hklin $ident_pointlessmtz hklout $ident_aimless_partmtz ROGUES $identrogues ltlt eof-aimless Use all default options for aimlesseof-aimless
ctruncate hklin $ident_aimlessmtz hklout $ident_truncatemtz
Harry Powell Andrew Leslie and Owen Johnson
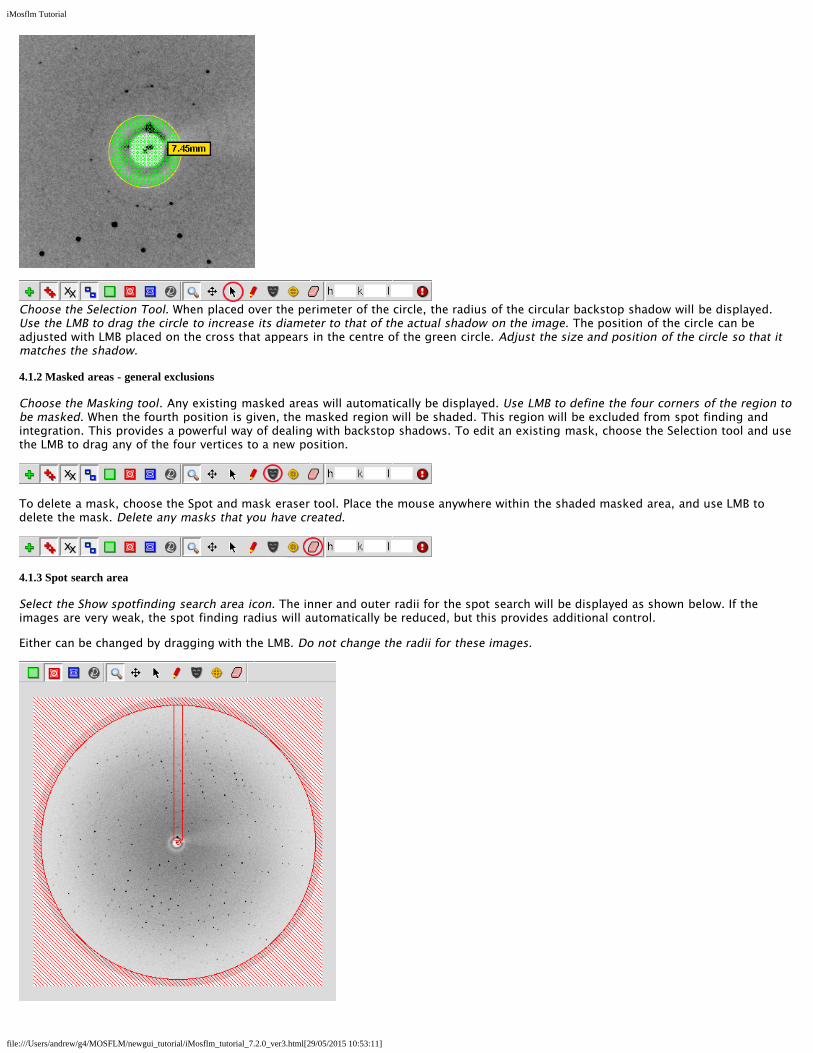
iMosflm Tutorial
fileUsersandrewg4MOSFLMnewgui_tutorialiMosflm_tutorial_720_ver3html[29052015 105311]
Advanced Usage
The red rectangle displays the area used to determine an initial estimate of the background of the image It is important that this doesnot overlap significant shadows on the image It can be shifted laterally or changed in orientation (in 90deg steps) by dragging with theLMB
414 Resolution limits
Select the Show resolution limits icon The low and high resolution limits will be displayed The resolution limits can be changed bydragging the perimeter of the circle with LMB (make sure that the Selection Tool has been chosen) The resolution limits will affectStrategy Cell refinement and Integration but not spot finding or indexing The low resolution is not strictly correct (it falls within thebackstop shadow) but does not need to be changed because spots within the backstop shadow will be rejected
415 Zooming and Panning
First select a region of the image to be zoomed with the Zoom tool
Select the Pan tool and pan the displayed area by holding down LMB and moving the mouse This is very rapid on a local machine butmay be slow if run on a remote machine over a network
416 Circle fitting
The circle fitting tool can be used to determine the direct beam position by fitting a circle to a set of points on a powder diffraction ringon the image (typically due to icing) or to fit a circular backstop shadow (although using the masking tool is probably easier)
Select the circle fitting tool Three new icons will appear in the image display area There are two (faint) ice rings visible on the image at391Aring and 367Aring Click with LMB on several positions (6-8) on the outer ring (as it is slightly stronger) Then click on the top circularicon
A circle that best fits the selected points (displayed as yellow crosses) will be drawn and the direct beam position at the centre of thiscircle will be indicated with a green cross The direct beam coordinates will be updated to reflect this new position
iMosflm Tutorial
fileUsersandrewg4MOSFLMnewgui_tutorialiMosflm_tutorial_720_ver3html[29052015 105311]
5 Spot finding indexing and mosaicity estimationWhen images have been added the Indexing operation becomes accessible (it is no longer greyed-out)
Click on Indexing This will bring up the major Indexing window in place of the Images window
51 Spot Finding
By default the first image and a second image 90 degrees away in phi (or as close to 90 as possible) will be selected and a spot searchcarried out on both images (This is controlled by the Automatically find spots on entering Autoindexing tick box in the Spot finding tabof Processing options)
Found spots will be displayed as crosses in the Image Display window (red for those above the intensity threshold yellow for thosebelow) Only those above the threshold will be used in indexing The intensity threshold normally defaults to 20 but will beautomatically reduced to 10 or 5 for weak images The threshold is determined by the last image to be processed
The number of spots found together with any manual additions or deletions are also given
Images to be searched for spots can be specified in several ways
1 Simply type in the numbers of the images (eg 1 84 above)
iMosflm Tutorial
fileUsersandrewg4MOSFLMnewgui_tutorialiMosflm_tutorial_720_ver3html[29052015 105311]
2 Use the Pick first image icon (single blue circle)
3 Use the Pick two images ~90 apart icon (two blue circles) This is the default behaviour
4 Use the Select images icon (multiple circles) If selected all images in the sector are displayed in a drop-down list Click on aimage to select it then double-click on the search icon (resembling a target in the colum headed Find) for that image to run thespot search The image will move to the top of the list (together with other images that have been searched)
Images to be used for indexing can be selected from those that have been searched by clicking on the Use button If this box waspreviously checked then clicking will remove this image from those to be used for indexing It can be added again by clicking theSelect images icon and clicking on the Use box
Before indexing always check by looking at the image display that the spot finding has worked correctly ie that most spots thatyou can see have been found that multiple crosses have not been drawn over the same spot that spots have not been placedover ice rings or ice spots Check all images that will be used in indexing
511 If the spot finding has not worked well
Parameters affecting the spot search can be modified by selecting the Settings drop-down window and selecting Processing optionsThe resulting new window contains six tabs relating to Spot finding Indexing Processing Advanced refinement Advanced integrationand Sort Scale and Merge
The Spot finding tab allows the Search area Spot discrimination parameters Spot size parameters Minimum spot separation andMaximum peak separation within spots (to deal with split spots) to be reset It also allows the choice between a local backgrounddetermination (preferred) and a radial background determination The local background method also uses an improved procedure forrecognising closely spaced spots The only parameters commonly changed are
1 Minimum spot separation This should be the size (in mm) of an average spot (not a very strong spot) If there are badly split spotsthe spot finding may place two (or more) crosses for a single diffraction spot To avoid this happening set the minimumseparation in X and Y to values equal to the spot size in mm This can be found by zooming the image and counting the number ofpixels across the spot horizontally (X) and vertically (Y) To convert this to mm use the pixel size as given in Settings -gtExperiment settings -gt Detector This separation parameter is very important when spots are very close but usually the programwill determine a suitable value
2 Minimum pixels per spot Default value 6 but this should be reduced automatically if spots are very small (eg when using in situscreening and microfocus beam) If there clearly are spots present and the spot size is very small try reducing this parameter to 3or 2
3 Local background box size Reducing this from 50 to (say) 20 can reduce the number of false spots found near any sharp shadowon the image (or tile boundaries for tiled detectors) Normally these false spots are weak (and will be drawn as yellow crosses) inwhich case they will not affect the indexing
For data collected in-house the spots can be quite large and rather weak In such cases the spot finding parameters are automaticallychanged but some improvement may still be obtained by the following
1 Reduce the spot finding threshold (default 35) eg to 2
2 Change the minimum number of pixels per spot (default 30) to 20 or 40
3 Set the minimum spot separation to a sensible value eg 15mm see above
52 Indexing
Providing there are no errors during spot finding indexing will be carried out automatically after spot finding (This is controlled by theAutomatically index after spot finding tick box in the Indexing tab of Processing options) If the image selection or indexingparameters are changed the Index button must be used to carry out the indexing
iMosflm Tutorial
fileUsersandrewg4MOSFLMnewgui_tutorialiMosflm_tutorial_720_ver3html[29052015 105311]
Autoindexing will be carried out by MOSFLM using spots (above the threshold) from the selected images The threshold is set byMOSFLM but can be changed using the entry box in the toolbar The list of solutions sorted by increasing penalty score will appear inthe lower part of the window The preferred solution will be highlighted in blue There will usually be a set of solutions with lowpenalties (0-20) followed by other solutions with significantly higher penalties The preferred solution is that with the highest symmetryfrom the group with low penalty values
Note that all these solutions are really the same P1 solution transformed to the 44 characteristic lattices with lattice symmetryconstraints applied Therefore if the P1 solution is wrong then all the others are wrong as well
For solutions with a penalty less than 50 the refined cell parameters (ref) will be shown This can be expanded (click on the + sign) toshow the reg unrefined but regularised cell (symmetry constraints applied) and the raw cell (no symmetry constraints applied)
The rms deviation (rmsd) or error in predicted spots positions (σ(xy) in mm) and the number of spots used to refine the solution aregiven for each solution
Usually the penalty will be less than 20 for the correct solution although it could be higher if there is an error in the direct beamcoordinates (or distancewavelength) The rmsd (error in spot positions) will typically be 01-02mm for a correct solution but if thespots are split or very elongated it can be as high as 1mm or higher
The predicted spot positions for the highlighted solution will be shown on the image display with the following default colour codes
Blue Fully recorded reflectionYellow (orange for Pilatus) Partially recorded reflection
iMosflm Tutorial
fileUsersandrewg4MOSFLMnewgui_tutorialiMosflm_tutorial_720_ver3html[29052015 105311]
Red Spatially overlapped reflection these will NOT be integratedGreen Reflection width too large (more than 5 degrees) not integrated
These colours may be adjusted via the Settings -gt Prediction colour item in the Image display window
Providing there are no errors in the indexing MOSFLM will automatically estimate the mosaic spread (mosaicity) based on the preferredsolution
Select other solutions with a higher penalty and see how well the predicted patterns match the diffraction image
The rmsd and visual inspection of the predicted pattern are the best ways of checking if a solution is correct If the agreement is notgood then the autoindexing has probably failed
It is often worth repeating the indexing (once) as the refined direct beam coordinates from the first indexing may give animproved solution (lower rmsd)
521 If the indexing fails - Direct beam search
The indexing is very sensitive to errors in the direct beam coordinates For a correct indexing solution the error should be less than halfthe minimum spot separation Check for example that the current direct beam position is behind the backstop If there are any icerings these can be used to determine the direct beam position (see Circle fitting sect416 )
If the accuracy of the direct beam coordinates (generally read from the image header) is uncertain the program can perform a gridsearch around the input coordinates The number and the size of the steps can be set from the Indexing tab of the Processing optionsmenu (see Settings - Processing options sect21) but defaults to two steps of 05mm on each side of the input coordinates The directbeam search is started by clicking on the Start beam search button in the Indexing pane While in progress it can be stopped byclicking the Abort beam search button
The indexing will be carried out for each set of starting coordinates (Beam x and Beam y in the table which appears) and if a solution isfound the refined beam coordinates (Beam x ref Beam y ref) the unit cell parameters of the triclinic solution and the rmsd error in spotcoordinates and in phi will be listed The correct solution will generally be the one with the smallest rms error in spot positions (σ(xy))To make it simpler to identify the correct solution once the grid search has finished the solutions will be sorted on σ(xy) so the correctsolution will be at the top of the list When sorting the solutions those which have smaller cell parameters will be listed first as it ispossible to have a small σ(xy) value for an incorrect solution with a much larger unit cell Beware of solutions at the top of the list wherethe cell is clearly too small (only happens rarely)
Note that only the triclinic (P1) solution will be listed
If there is now a solution with a smaller rmsd value than before and especially if more than one set of starting beam coordinates has thesame refined coordinates this is a good indication that the beam search has worked Note that if the initial beam coordinates werewrong by more than ~15mm the search may not work In this case either select a new starting position for the direct beam or changethe number of steps
To complete the indexing double-click on the chosen solution and the full indexing will carried out for these beam coordinates withthe solutions appearing in the upper window The results of the direct beam search can be hidden (collapsed) by clicking on the Hidebutton and recovered by clicking on the Show button
iMosflm Tutorial
fileUsersandrewg4MOSFLMnewgui_tutorialiMosflm_tutorial_720_ver3html[29052015 105311]
522 If the indexing fails - Other parameters
Errors in other physical parameters (wavelength crystal to detector distance) can also result in failure All these parameters should bechecked
Several parameters used in autoindexing can also be adjusted using entry fields and buttons that appear in the Indexing toolbar
Weak images
1 MOSFLM automatically reduces the Iσ(I) threshold for weak images and it may also reduce the resolution to 4Å but lower valuescan be tried It is important not to include spots that are not real - a small number of false spots can prevent the indexing fromworking
2 Try changing parameters for spot finding (see If the spot finding has not worked well sect511)
Multiple lattices
1 Try increasing the Iσ(I) threshold (default 20) for example to 40 or 60 so that only spots from the stronger lattice are selectedThis can be done by entering a new value in the leftmost of the circled icons above (and also via the Indexing tab of Processingoptions)
All cases
1 Include more images in the indexing Select images that are widely spaced in phi not close together2 Select images that show the clearest lunes andor have the best spot shape3 In case the crystal orientation has changed or if you are unsure of the direction of positive rotation in phi try indexing using only
one image4 Make sure that the Max cell edge value is not too small If in doubt set to 200 Aring (or more if the cell is expected to be large)5 If the cell parameters are known reduce the maximum allowed cell edge to the known maximum cell edge This can sometimes
help filter incorrect solutions but use with caution as often this needs to be ~twice the largest cell for successful indexingAlternatively try the known cell option
6 If the detector distance is uncertain and the images are high resolution (eg 2Å) allow the detector distance to refine during cellrefinement Use with caution
53 Indexing multiple lattices simultaneously
This is a new feature and is still undergoing development It is most likely to succeed when the different lattices are clearly separated atleast at higher resolution If the images shows badly split spots with several components (each arising from a sub-crystal with a slightlydifferent orientation) then indexing may well still be impossible
After spot finding examine the image to ensure that spots that are close to each other but belong to different lattices have beenidentified as separate spots and not treated as a single split spot (in which case the red cross will lie midway between the two spots)Adjusting the minimum spot separation (Settings -gt Processing options -gt Spot finding) can help in resolving close spots It may alsohelp to increase the inner radius of the spot search region (see Spot search area sect413) so that low resolution reflections where the
iMosflm Tutorial
fileUsersandrewg4MOSFLMnewgui_tutorialiMosflm_tutorial_720_ver3html[29052015 105311]
spots are not really separated are excluded from the search
The following procedure usually provides the best chance of success
1 Select appropriate images for use in indexing The separation of the lattices can be clearer on some images than others Ideallychoose several images widely separated in phi
2 Do a normal (single lattice) indexing first This will usually work but will give a high positional rmsd because of the presence of morethan one lattice This step is important because it will result in more accurate direct beam coordinates which are crucial for multi-lattice indexing
3 Select the ldquoIndex multiple latticesrdquo icon (next to the Index button) the Index button will change to Index multiple
The indexing results for different lattices will be presented in different tabs while the selected solution for each lattice will be shown inthe lower Summary window Currently a maximum of 5 lattices can be handled The figure below shows a case where 3 differentlattices were found
4 Judge the success of indexing by examining the lattice type and the cell parameters obtained for the different lattices (the cellsshould be very similar) and checking that the predictions match the observed spots The rmsd values for correct lattices should also besignificantly smaller than the value obtained in the initial (single lattice) indexing It may be necessary to manually select a differentautoindexing solution for some lattices in order to get the same lattice type (eg oP) for the different lattices
The Split column in the lower pane indicates the angle between the reference lattice (with value -) and the other lattices This is onlycalculated when the lattices have the same lattice type In this case the angles between lattice 1 and lattices 2 amp 3 are 34 and 16degrees
If a lattice is clearly incorrect it can be deleted by highlighting that lattice (in the lower pane that summarises the results) and using theright mouse button to select ldquodeleterdquo
The predictions for different lattices can be displayed either by highlighting the lattice in the Summary window or by using the latticeselector in the image display pane
iMosflm Tutorial
fileUsersandrewg4MOSFLMnewgui_tutorialiMosflm_tutorial_720_ver3html[29052015 105311]
In the image display spots in different lattices that overlap with each other are shown in magenta Only the summed intensity will bemeasured for these reflections
The predictions for all lattices can be shown by selecting the ldquomerge latticesrdquo icon in the image display
This can be useful to check if all the lattices have been successfully indexed because all spots in the image should then be predicted Inthe display predictions from lattice 12345 are shown in blue yellow red green and magenta with no distinction made between fullyand partially recorded reflections or spatial overlaps
iMosflm Tutorial
fileUsersandrewg4MOSFLMnewgui_tutorialiMosflm_tutorial_720_ver3html[29052015 105311]
531 Practical Tips
Beware of solutions where the lattices only vary in orientation by a small angle (less than 1 degree) as these are often different solutionsfor the same lattice The difference in orientation between lattices is given by the ldquosplitrdquo column in the Summary window but this is onlycalculated if the lattices have the same lattice type Differences are all relative to one lattice which will display a split angle as ldquo-ldquo Tocalculate the angles relative to a different lattice open the tab for that lattice select a different solution to that currently selected andthen select the original solution ndash this will trigger recalculation of the split angles relative to that lattice
Other parameters that can influence the indexing are the rdquoMaximum deviation from integral hklrdquo (default 02 when indexing multiplelattices otherwise 03) and ldquoNumber of vectors to find for indexingrdquo (default 30) These can be changed via the Indexing tab of theldquoProcessing Optionsrdquo that can be selected from the ldquoSettingsrdquo menu item Values between 015 and 025 might be helpful for the firstparameter and increasing the number of vectors from 30 to 50 can also help At present there is no defined protocol for changing thedefault parameter values for particular cases it has to be done by trial and error
Experience so far has shown that selecting appropriate images and adjusting the maximum cell length used in indexing have the biggesteffect The optimum value for the maximum cell length will normally lie between one and three times the largest cell dimension but it isworth varying this in steps of between 25 and 50 Aring as the indexing can be very sensitive to this parameter
For a more complete discussion of multiple lattice indexing see Powell HR Johnson O amp Leslie AGW 2013 Autoindexingdiffraction images with iMosflm Acta Cryst D69 1195-1203
54 Known cell option
For images that are very difficult to index if the cell parameters are known the known cell option can be usedSelect the ldquoKnown cellrdquo icon (next to the Multiple lattices icon) Enter the cell parameters in the Input known cell pop-up window andselect OK when all 6 parameters have been provided Then select the Index Cell button
To revert to normal indexing select the ldquoKnown cellrdquo icon and then select Clear in the Input known cell pop-up window
55 Space group selection
Note that the indexing is based solely on information about the unit cell parameters It will therefore be very difficult (or impossible) todetermine the correct Laue group in the presence of pseudosymmetry For example a monoclinic space group with β ~ 90deg will appearto be orthorhombic an orthorhombic space group with very similar a and b cell parameters will appear to be tetragonal These can onlybe distinguished when intensities are available (ie after integration) by running POINTLESS (QuickSymm) (see Running Pointless to check the
iMosflm Tutorial
fileUsersandrewg4MOSFLMnewgui_tutorialiMosflm_tutorial_720_ver3html[29052015 105311]
symmetry sect10)
In addition it is not possible to distinguish between Laue Groups 4m and 4mmm 3 and 3m 6m and 6mmm m3 and m3m Thiswill not affect integration of the images but it will affect the strategy calculation In the absence of additional information the lowersymmetry should be chosen for the strategy calculation to ensure that a complete dataset is collected
The presence of screw axes also cannot be detected so there is no basis on which to distinguish P21 from P2 etc This does not affectany aspect of data collection or processing and can be chosen (on the basis of systematic absences) after integration by runningPOINTLESS
In this example there is no way of knowing at this stage if the space group is h3 or h32 so leave it as h3
56 Mosaicity estimation
If the Automatically index after spot finding option has been chosen (Indexingtab of Processing Options) the mosaicity (mosaic spread) will be estimatedautomatically for the preferred solution However if another solution is chosenthe mosaicity should be estimated again
Click on the Estimate button to estimate the mosaicity
A window will appear which plots the total predicted intensity as a function ofmosaic spread from which an estimate is determined
The predictions displayed on the image will be updated Entering different valuesof mosaic spread in the box (followed by return) will allow a visual estimate of theeffect of changing the mosaic spread
The mosaic spread can also be entered in the Images pane by clicking once on theMosaicity line and once again on the value displayed
561 The mosaic block size
In some cases the apparent mosaic spread is much larger at low resolution than at high resolution so that if it is set to a value thatresults in all the low resolution spots being predicted many more spots are predicted than are visible at high resolution This effect isbest dealt with by adjusting the Mosaic block size which is also displayed in the Images pane This is modelling the size in microns ofthe individual mosaic blocks in the crystal Decreasing this to values of 05-5 microns (say) from the default of 100 microns will resultin predicting more spots at low resolution but have virtually no effect at high resolution This parameter is not refined (at present) andso the best value must be determined by trial and error
6 Saving and recovering a sessionThe session can be saved at any time using the Session drop-down menu referred to in sect21 The first time that a session is saved youwill be prompted for a filename The filename convention for saved session files is that the extension is mos
Save the current session Then exit from iMosflm (using the Session drop-down menu) restart iMosflm and read in the saved session
If the program crashes it should be possible to recover all but the latest actions as a temporary copy of the session file is continuallysaved to the directory mosflm in the users home directory
Restart iMosflm and it will pop up a Recover session window
Selecting the Recover button will restore the session as far as possible
iMosflm Tutorial
fileUsersandrewg4MOSFLMnewgui_tutorialiMosflm_tutorial_720_ver3html[29052015 105311]
7 Data collection strategyOnce the crystal orientation and (probable) Laue group have been determined it is possible to calculate a data collection strategy andthe Strategy icon is no longer greyed-out (in fact all other operations Strategy Cell Refinement and Integration become possible at thispoint)
Select the Strategy icon This will open the Strategy window
The statistics initially presented in the window are based on the images read in to the current session If only two (or more) references
iMosflm Tutorial
fileUsersandrewg4MOSFLMnewgui_tutorialiMosflm_tutorial_720_ver3html[29052015 105311]
images have been read in no statistics will be presented
When the Strategy option is used after two initial images (typically 90deg apart in φ) have been collected a complete shaded segment willnot be shown in the lower part of the screen rather an empty circle will be shown with the matrix label beneath it Click the Auto-complete button and in the pop-up menu that appears select a rotation angle or sweep of data to collect - or leave the Rotationsetting as Auto for a calculation of maximum completeness for this crystal orientation Click on Ok and the completeness results willbe presented
The orientation of the crystal expressed as the angles between the abc unit cell axes and the XYZ coordinate frame is given X isalong the X-ray beam Z is the rotation axis A warning will be given if the unique axis is so close to the rotation axis that there will bemissing cusp data
71 Evaluating completeness manually
The completeness of any given segment of data can be determined manually using the circle at the bottom left of the window Click onthe red segment shown in this circle
This will result in small black boxes being drawn on the circumference at the start and end of the red sector
Use the LMB to click on the black box at 0 and drag this around the circle
When the LMB is released the statistics for that sector will be displayed The statistics are presented in two ways Near the top right ofthe window the overall completeness is shown as red circles for unique data and anomalous pairs The average multiplicity is givenbeneath these circles
More detailed statistics (such as completeness as a function of resolution) are given in a series of histograms that can be selected by adrop-down menu
72 Calculating a strategy automatically
Uncheck the Use checkbox at the right side of the hg_001 line listed in the sector list near the top of the Strategy pane This means
iMosflm Tutorial
fileUsersandrewg4MOSFLMnewgui_tutorialiMosflm_tutorial_720_ver3html[29052015 105311]
that the 84 images used thus far will not be included in the completeness calculation only the matrix derived from indexing them willbe used Select the Auto-complete button to calculate a strategy automatically
A strategy calculation data pop-up window will appear
If multiple matrices have been defined (for different sectors of data) then the appropriate one can be selected (if there is only one sectorthis has no effect)
The total φ rotation to be used is normally calculated by MOSFLM based on the Laue group and the crystal orientation (the Auto setting)However it is sometimes possible to achieve a high completeness with a significantly smaller total rotation (eg 60deg in two 30degsegments will typically give gt94 completeness for orthorhombic space groups) and this can sometimes be useful if radiation damage isa serious problem although when using hybrid pixel detectors it is better to use a very conservative exposure time and collect a wide φrotation
Total rotation angles of between 5deg and 90deg can be selected from the drop-down list The number of segments to be used can be setbetween 1 and 3
If the check box is checked data completeness will be calculated to optimize the proportion of anomalous data collected
THIS IS IMPORTANT The optimum strategy is often different when maximising completeness of the anomalous data
Choose the default values (Rotation Auto Segments 1) but check the anomalous data box then click on Ok Look at the variousstatistics presented as bar charts
In space group H3 if rotating around the c axis a total rotation of 120deg would be required to collect a complete dataset (ignoring anydata lost in the cusp) Because the c axis is 22deg away from the rotation axis in this case it is possible to collect very high completeness(for unique data) with a rotation much smaller than this
Try to find the minimum total rotation that will give a dataset that is gt95 complete for the unique data Now do the same butrequiring gt95 completeness for the anomalous data
SKIP OVER SECTION 73 IF DOING THE NORMAL TUTORIAL
73 Calculating a strategy using multiple crystals
The Strategy pane may also be used when due to radiation damage many crystals are required to collect a complete dataset
IMPORTANT This procedure will only work correctly for space groups where there is no indexing ambiguity For those spacegroups where there is an indexing ambiguity( see httpwwwccp4acukdisthtmlreindexinghtml for a complete list) it isnecessary to integrate images to determine whether different crystals have been indexed in the same way This is not achievablewithin the Strategy option at present
Suppose the first crystal has been indexed from the reference images
Enter the Strategy pane an empty circle is displayed in the bottom part of the screen and click on the Auto-complete button nearthe top-right of the pane In the Auto-complete window that appears choose a suitable Rotation angle for the amount of datathat can be collected from one crystal say 20 degrees for this example Leave Segments set to 1 and do not check Optimize foranomalous data
Click the Ok button and the completeness of the data will be displayed The matrix name start and end phi values and the phiextent will be displayed in the top area of the pane with a checkbox ticked under the Use column This means this segment will beused in further strategy calculations
Accept and save this result by clicking on the yellow hatched segment displayed in the large circle near the bottom of the paneClick once and the segment will be outlined in black (you can adjust the start or end phi value calculated in one degree incrementsby click+dragging the respective black square) click again this time on the black square denoting the start or end phi (or release ifyou have adjusted by click+dragging) and the segment will turn red The segment will not be saved unless it has turned red
This result will be saved if you leave this pane (eg to load more images) and return later in this session The strategy file can alsobe saved to a permanent file using the Save button on the tool-bar This is highly recommended when working with many crystals
Return to the Strategy pane when you have loaded and indexed the reference image(s) from the second crystal and repeat the procedureabove You will see the calculated segment from the first matrix displayed at the bottom-left of the screen The optimum phi range for
iMosflm Tutorial
fileUsersandrewg4MOSFLMnewgui_tutorialiMosflm_tutorial_720_ver3html[29052015 105311]
the second crystal will be displayed Save this in the same way as for the first crystal (clicking twice) Repeat this procedure for anysubsequent crystals and in each case the optimum phi range will be calculated for the latest crystal taking into account the data fromprevious crystals
It is a good idea to save the strategy to a file as each new crystal is added in case the program crashes and this information is lost
In practice it is probably safest to have a separate iMosflm session that is reserved for the strategy calculations and not used to processany data The strategy for each new crystal can be calculated as described above If there is a problem and the session is corrupted or ifiMosflm is closed down for any reason it is straightforward to restore the status of the session providing the strategy has been savedThe following steps should be taken
1 Read in the reference images for the latest crystal and index them
2 Select the Strategy pane
3 Read in the optimised strategy for all previous crystals using the ldquoAddrdquo button and giving the appropriate filename
4 Making sure that the circle for the latest crystal is highlighted in the lower left window click on lsquoAuto-completersquo and follow the stepsdescribed above
Advanced Usage
The startend phi values for each crystalmatrix can be updated This might be required if for example only 10 degrees of useful datawere collected from a particular crystal instead of the anticipated 20 degrees To change the phi values click either on the matrix namein the top pane or on the circle showing the segment of data in the lower left pane (these are highlighted in a blue box as the mousemoves over them) The corresponding segment will now be displayed in the larger circle Click on the red segment so that a blacksquare appears at the startend phi values Then simply drag the appropriate phi to the desired value The completeness willautomatically be updated (but the strategy calculation for the latest crystal will not be repeated to do this the current segment must bedeleted by highlighting the matrix name and using right click and then repeating the Auto-complete step)
If matrix files saved from iMosflm are available from crystals for which data have been collected in previous sessions these can beadded into the calculation using the Add matrix button on the tool-bar
If the saved strategy result has become complicated or is incorrect and you wish to restart the calculations afresh there is a tool-barbutton Reload sectors from session This will remove any calculated sectors while leaving any known matrices listed at the bottom-leftof the Strategy pane
If you have saved a strategy file from a previous session this can be used to re-initialize the Strategy pane using the Load button onthe tool-bar
A Spacegroup pull-down menu has been added to the tool-bar to permit different choices of space group to be used in thecalculations (eg H3 and H32) This menu is populated from the list offered on the Indexing pane However the space group symboltext is editable Any space group symbol entered will be validated by Mosflm together with the current cell parameters
As a calculator for a multi-segment strategy the Strategy pane is reasonably flexible you can Save or Delete highlighted matrix lines byright-clicking As you highlight different matrix lines the orientation of the crystal expressed as the angles between the abc unit cellaxes and the XYZ coordinate frame is re-displayed in the centre of the pane
The following screen shot shows the cumulative results in the Strategy pane after this procedure has been followed for four crystals(ignore the iMosflm version number)
iMosflm Tutorial
fileUsersandrewg4MOSFLMnewgui_tutorialiMosflm_tutorial_720_ver3html[29052015 105311]
731 Calculating a strategy when some data have already been collected and processed
This option is not yet implemented If data have already been processed (to give an MTZ file) but the images are not currently available (eg they were collected on a previoussynchrotron trip possibly at a different synchrotron) then the MTZ file containing this data can be read and used to calculate a strategyfor data collection from new crystalsThe MTZ icon in the tool bar is used to read the MTZ file
74 Calculating a suitable oscillation angle
To calculate the maximum possible oscillation angle while avoiding spatial overlaps click on the Check for overlaps button A pop-upwindow will appear from which the option to calculate the maximum oscillation angle (as a function of φ) or check how many overlapswill occur for different (user selected) oscillation angles The results are plotted in the same pane as the histograms for the strategycalculations Note that the overlap calculation is based on the current values for the mosaic spread and spot separation and can be verysensitive to these values Note also that these are maximum and not necessarily recommended oscillation angles
iMosflm Tutorial
fileUsersandrewg4MOSFLMnewgui_tutorialiMosflm_tutorial_720_ver3html[29052015 105311]
8 Cell refinementIt is important to determine the cell parameters accurately before integrating the images Although the unit cell is refined as part of theautoindexing providing the diffraction extends beyond ~35Å resolution it is possible to obtain more accurate cell parameters using aprocedure known as post-refinement This procedure requires the integration of a series of images in ideally two or more separatesegments at widely different φ values The distribution of the intensity of partially recorded reflections over the images on which theyoccur is used to refine the unit cell crystal orientation and mosaic spread
Select the Cell Refinement icon
81 Selecting the images
iMosflm Tutorial
fileUsersandrewg4MOSFLMnewgui_tutorialiMosflm_tutorial_720_ver3html[29052015 105311]
There are several ways to select the images to be used in cell refinement Whichever method is used the image numbers will bedisplayed in the Images entry field iMosflm will automatically select appropriate images but these can be changed
811 Manual selection
A list of images can simply be typed into this box An image series can be specified as n-m where n and m are the first and last imagesDifferent series must be separated by white space or comma
For orthorhombic or higher symmetries two segments should be given approximately 90deg apart in φ For monoclinic or triclinic datathree or four segments are best (eg φ = 04590135)
The number of images that should be included in each segment depends on the mosaic spread and oscillation angle A reasonablenumber is 2(mosaic spreadoscillation angle +1) MOSFLM will automatically select two or more segments as appropriate Note thatthere is a limit on the total number of images that can be used
812 Automatic selection
Selecting the Automatically select images icon will select a suitable set of images
813 Graphical selection (Not recommended)
Selecting this icon will give a new window
Images can be selected by clicking in the Use check-box in the list of images or by using the mouse to drag a selection of imagesfrom the sector displayed The other icons allow the sector to be zoomed in or out and the viewed area to be moved to make theselection easier The final two icons on the tool-bar switch the segment display to fit the display space as either a full circle or aquadrant This Image palette can be closed by clicking outside its area but will close after 60 seconds anyway
82 Integrating the images and refining the cell
Use one of the methods above to select images to use in cell refinement and click on the Process button Before starting cell refinementcheck that the prediction for the first image in each segment to be used is good The majority of the spot positions must be correctlypredicted for the first image in each segment or else the refinement will not work
The selected images will be integrated and following integration the cell parameters are refined Selectable refined detector parameters
iMosflm Tutorial
fileUsersandrewg4MOSFLMnewgui_tutorialiMosflm_tutorial_720_ver3html[29052015 105311]
will be plotted as will the changes in crystal orientation and (if selected) mosaic spread If the shift in cell parameters is greater than 25standard deviations another cycle of integration and cell refinement is carried out Typically two or three cycles are required forconvergence Note that the current program activity is shown in the bottom left-hand corner of the window in the status message area
The different windows are explained below Moving the mouse over any parameter or plotted graph point will give a full description ofit
821 The detector parameters window
The values of the refined detector parameters are displayed for each image as it is integratedThere is the option to fix any of the parameters during integration by checking the Fix box onthe right The positional residuals (overall central and weighted) are also listed
Any of these parameters can be selected for plotting on the graph that appears to the right ofthis box by simply clicking on that parameter (which is then highlighted in blue as shown herefor Beam x and Beam y)
Check the stability of the refined parameters by displaying the appropriate graphs To getsensible scaling of the graphs only parameters with similar numerical values should be plottedtogether
For weak images (ie few visible spots in the outer regions of the image) the tilt and twistmay not be well defined and might refine to large values (greater than one degree) Insuch cases these parameters should be fixed It is not generally recommended to fix any
iMosflm Tutorial
fileUsersandrewg4MOSFLMnewgui_tutorialiMosflm_tutorial_720_ver3html[29052015 105311]
other detector parameters
For very weak fine sliced images (Pilatus only) there is the option to sum images when findingsuitable spots for refinement see Settings -gt Processing Options -gt Advanced refinementwhich can in some cases make the refinement more stable
822 The crystal parameters window
The values of the refined crystal missetting angles φ(x) φ(y) φ(z) the unit cell parameters andmosaic spread for the current image are displayed in the table Selected parameters will beplotted as for the detector parameters Specific unit cell parameters can also be fixed
If more than one segment of data is being used for cell refinement it is not unusual to see achange in orientation of the crystal between the two segments
Observe how the crystal orientation is different for images in the two segments See how themosaic spread varies during refinement
823 The central spot profile
The average spot profile for the central region of the detector is plotted for eachimage This confirms that the spot prediction is good If the profile is not welldefined and central in the box or if the blue border for the peak region of the spot ismuch larger than the apparent spots size it suggests a problem with the integrationand the initial prediction should be checked In some cases it may be necessary toincrease or decrease the Profile Tolerance parameters to ensure that the blue boxfits the spot To do this select the Advanced integration tab of Processing optionsCheck the central spot profiles for the images used in the cell refinement
824 The summary window
This window presents a summary of how selected parameters have changed indifferent cycles of the cell refinement The behaviour of these parameters gives agood indication of whether the cell refinement has been successful
If the refinement has been successful the RMS residual should be lower for thefinal cycle than in previous cycles However errors in the cell can be compensatedquite well by changing the crystal to detector distance so the differences are notalways dramatic
The other parameters that can be plotted from the pull-down list are the detectordistance and the Pixel ratio (Yscale)
The detector distance should be the same for all images in the refinement If the original indexing was based on auto-indexing a singleimage (say the first) then the detector distance might change for images from the second segment to compensate for an error in theoriginal cell If the variation in distance for different images increases with the cycle number this indicates that the refinement is notstable
The Pixel ratio (Yscale) parameter may also show an initial variation for images in different segments because refining Yscale (whichshould be 10000 for all except Raxis II and Raxis HTC detectors) can compensate for errors in cell dimensions in the same way that thedistance can The final values (last cycle) should be very close to identical for all images and should also be very close to unity (to within00010)
Cell refinement can be unstable if the data do not extend to at least 35 Aring If it appears unstable use the cell derived from auto-indexing a series of images well spaced in φ instead
iMosflm Tutorial
fileUsersandrewg4MOSFLMnewgui_tutorialiMosflm_tutorial_720_ver3html[29052015 105311]
Examine the plots to see if the parameters are stable and correct (Yscale)
825 The final results
When refinement has converged (or after 5 cycles) the initial and final cell parameters and the estimated errors (std dev) are listed
If time is available make a note of the std dev values and repeat the cell refinement using a larger number of images in each segmentAre the standard deviations smaller when using more images
83 Refining cell parameters for multiple lattices
Providing the resolution is high enough (generally better than ~35-32 Aring) and not too many of the spots in the different lattices areoverlapped it is possible to refine the cell parameters for each lattice individually The lattice to be refined is selected from the Latticeselector
This selector will be grayed out when processing a single lattice
84 If the prediction for the first image of a segment is poor
In some cases depending on how the indexing has been carried out or if the diffraction is poor or there has been a large change incrystal orientation during the data collection the prediction for one or more of the segments (the first image) may be poor In suchcases the integration and hence the cell refinement may fail It may be possible to successfully process the images after an initialrefinement of the crystal orientation using a pattern matching algorithm To select this option got to the Advanced refinement tab ofProcessing options and select the tick box for Refine orientation of first image in any run by pattern matching and for Integrate allimages Then refine the cell in the usual way During integration the orientation will be refined for the first image of each segmentoutput for this additional refinement will be written to the logfile but is not shown in the GUI
9 IntegrationThe accurate cell parameters are now used in the integration Note that although the images are integrated during the cell refinementthe intensities are not saved and no MTZ file is generated at that stage
It is good practice to start by integrating a block of images corresponding to a few degrees of data to check that the parameters do notneed further adjustment MOSFLM will generate warning messages after integration if there are any difficulties and it may be possibleto improve the situation by changing some of the default parameters (see Warning messages sect13)
Before integration ensure that the backstop shadow has been defined (see Masked areas backstop sect411 and Masked areas generalsect412)
91 Image selection
Image selection is performed in exactly the same way as in the cell refinement In this case the Automatic selection will simply includeall images in the current sector
Select images 1-10
92 Setting the MTZ filename and controlling updating of the image display
Two icons appear when the integration option is chosen
If the Show predictions icon is clicked the display window will be updated as eachimage is processed This will slow down the processing but allows the accuracy of theprediction to be checked for each image
iMosflm Tutorial
fileUsersandrewg4MOSFLMnewgui_tutorialiMosflm_tutorial_720_ver3html[29052015 105311]
Click on this icon so that the display will be updatedThe filename of the MTZ file containing the results of the integration is generatedautomatically but can be edited manually
93 Integrating the images
Click on the Process button to start integration
Integration of the images occurs in two passes In the first pass for each block of images (a number corresponding to a few degrees ofdata selected automatically by MOSFLM) the detector and crystal parameters are refined for each image in turn and the measurementboxes for all predicted spots are written to a file for use in the second pass In the second pass the standard profiles are formed fromreflections present on all of the images in this block and each image is then integrated and the results written to the MTZ file Thedisplay is not updated during the second pass and will remain on the last image of the block (assuming image updating has beenselected)
Note that the unit cell dimensions are normally fixed during integration and only the crystal orientation and mosaic spread are refinedCrystal parameter refinement only starts when a sufficient number of images have been integrated to provide data for the post-refinement typically after ~05-1 degree (more for high mosaicity)
94 Parameter display windows
As described in sect82 the refined detector and crystal parameters will be displayed in tables and selected parameters will be plotted ingraphs The average spot profile for each image will also be displayed
The size of these graphs (and the profile) can be expanded to fill the whole window by holding down Shift and clicking LMB anywherein the graph window A second Shift+click will revert the graph to the original size
In addition to these windows there are windows that tabulate and plot (as a function of image number) the mean Iσ(I) for profile fittedand summation integration intensities The overall values and the values for the highest resolution bin are given
The number of overloaded reflections Bad spots (ie those that fail certain tests see mosflm SUMMARY file sect15) Spatial overlaps andif processing multi-lattice images the number of lattice overlaps is listed for each image and can be plotted by highlighting thatparameter When processing data from crystals with large unit cells it is important to watch out for spatial overlaps (see sect97 for tips onhow to reduce the number of spatial overlaps if this is a problem)
A display of the standard profiles for different regions of the detector is also provided Poor profiles are averaged by includingreflections from inner regions of the detector Averaged profiles are indicated by a red line around the spot (rather than blue) Theoriginal unaveraged profile can be viewed a clicking on the profile (providing there were sufficient spots in that region to allowformation of a profile)
The profiles should be checked to see that they are well defined and centred within the box Poorly-defined diffuse or non-centredprofiles may suggest that the prediction is not very good in which case this should be checked on the corresponding image(s)
It may be useful to expand the standard profiles to fill the window using Shift + click in the profiles window
Finally the lower left window plots Iσ(I) as a function of resolution for any selected image
iMosflm Tutorial
fileUsersandrewg4MOSFLMnewgui_tutorialiMosflm_tutorial_720_ver3html[29052015 105311]
Different parameters can be plotted by selecting the small right- or left-pointing arrows on the title line above the plot
95 Integrating the whole datasetAssuming that everything looks OK the entire dataset can now be integrated However it is strongly recommended thatProjectCrystalDataset names are assigned first These are written to the output MTZ file and used by downstream programs inparticular AIMLESS will use this information when deciding which images belong to the same dataset
Select Experiment settings from the Settings drop-down menu (see Drop down menus sect21) to enter these names and optionally givea title for the MTZ file
Select images 1-84 and click on Process
951 Parallel Integration Using multiple cores
An option is available on the pull-down menu (next to the Process button in the Integration task) which splits up the integration jobover available cores on the local machine All aspects are currently determined automatically at present user-configurable options willbe available in a later version The algorithm used is as follows
iMosflm determines the number of cores available on the local machineIf the number of cores (N) is greater than 2 iMosflm splits the integration run into N-1 batches (up to a maximum of 16) containingapproximately the same number of images If N le 2 iMosflm splits the run into N batches
If the total number of images in each batch is less than 32 the number of batches is decreased until this condition is satisfied
The first batch is submitted as a background task consisting of a refinement stage and an integration stage with its input and outputfiles (including the MTZ file) in a new directory its name being determined from the number of segments of data being integrated andthe lattice number (if the sample has been determined to contain multiple lattices) If the directories exist already they are all movedinto a newly-created directory with a time-stamped name the files from the most recent integration run are thus in directories withnames following the pattern described above Once the refinement stage is complete the refined parameters are written to a file
The launch of subsequent batches are delayed until the corresponding preceding batch has written its refined parameters This file isread and the new batch is launched again with a refinement stage and integration stage
At present the job cannot be aborted once it has started
952 Integrating as a background job
By selecting Batch in the drop-down menu adjacent to the Process button the integration can be run as a background job rather thaninteractively and the GUI can be used to look at a different dataset
Selecting Batch from the drop-down menu will display a new window showing the script that will be used to process the images alongwith a number of processing options The script can be edited if additional keywords are required or if some parameters are to bechanged and can also be copied and pasted into a file for off-line processing
By default the job is divided into batches across multiple cores as determined for the parallel integration described in sect951 but thenumber of cores can be chosen by the user from a drop-down menu in this case the size of each batch is determined by the interface
Plotting the results of the integration can be turned off this can make processing much faster
iMosflm Tutorial
fileUsersandrewg4MOSFLMnewgui_tutorialiMosflm_tutorial_720_ver3html[29052015 105311]
It is possible to configure job submission for remote machines (which can be added by depressing the add host button) Ensure youhave enabled passwordless logins for all the remote machines you enter and that you specify the full path to the Mosflm executable inthe Batch destinations window The remote working directory (in which the log and MTZ files are written) and the remote imagedirectory must both be specified with their full path names Any required parameter fields that are not completed by the user arehighlighted in orange if the user tries to submit a job without completing these fields a new window containing only those fields (againhighlighted in orange) pops up with a request to do so
The number of cores available on the selected host can be determined by depressing the apple core button on the Batch destinationsconfiguration window
The log file for batch submission jobs the MTZ and SUMMARY files are written to the directory in which iMosflm was launched
96 Checking the integration
iMosflm Tutorial
fileUsersandrewg4MOSFLMnewgui_tutorialiMosflm_tutorial_720_ver3html[29052015 105311]
The detector and crystal parameter plots should be examined carefully to check for any instability in the refinement If there are largeand random variations in some parameters (eg the detector twist and tilt) then it may be better to fix them and repeat the integration
For cases (eg very small unit cells) where there are very few suitable reflections on each image the refinement of the missetting anglesmay show significant variations from one image to the next In such cases it is best to apply smoothing to the missetting angles usingthe tick box in Settings -gt Processing options -gt Advanced Refinement
Discontinuities due to blank images should also show up and the offending images should be removed from the scaling run
If adjacent spots are incompletely resolved on the detector it may be possible to improve the processing by increasing the PROFILETOLERANCE parameters by 1-2 These parameters can be set in the Advanced integration tab of the Processing options menu (useSettings)
97 Advanced features for integration
The Settings -gt Processing options menu allows additional control over the integration Parameters such as the minimum spotseparation resolution limits excluded resolution ranges block size MTZ filename and BATCH ADD can be changed in the Processingtab
Manually decreasing the minimum spot separation can help if a large number of reflections are flagged as spatially overlapped (redboxes) The prediction must be updated to see the effect of changing the separation this can be done either by displaying the next orprevious image or double clicking on the blue circle next to the image currently displayed in the Images pane
In the Advanced integration tab the measurement box parameters profile tolerance and profile averaging parameters can be set
The measurement box parameters can be adjusted for rare cases where the estimation of the spot size has not worked correctlyresulting in a box that is too small or too large The optimisation of the background rim and corner cutoff parameters that determinewhich pixels are used for the background and which pixels for the peak can also be turned off but this is generally not recommended
Increasing the profile tolerance can help in cases where adjacent spots are not completely resolved this can be judged by examining thestandard profiles By default the profile tolerance is automatically increased if there are a large number of spatial overlaps as this hasthe effect of reducing the minimum spot separation A message will be written to the logfile if this has happened This option can beturned off using the tick box Optimise profile tolerance values to avoid spot overlap
The profile outlier exclusion parameters control the exclusion of ice spots or hot pixels which could otherwise corrupt the standardprofiles
Pixels with a value less than the Null pixel threshold are considered to belong to inactive regions of the detector
The pixel saturation value determines when a reflection is considered to be an overload The intensity of overloaded reflections isestimated by profile fitting but these reflections are rejected by the scaling program AIMLESS by default
Increasing the Maximum reflection width in φ from the default value of 5deg will reduce the number of rejected reflections (green boxes)and is worthwhile when the mosaicity is very high or the mosaic block size is very small As with the minimum spot separation theimage must be refreshed to see the effect of changing this parameter
The rejection criteria will reject reflections with too much variation in the background (BGRATIO) or where the gradient of thebackground plane is too large These should only be changed if many reflections are being rejected PKRATIO only applies to fullyrecorded reflections and reflects a very poor profile fit With current data collection protocols there will be very few (if any) fullyrecorded reflections
Additional MOSFLM parameters will be added based on user requests
98 Integrating multiple lattices
When multiple lattices have been successfully indexed each lattice can be integrated individually by selecting the appropriate latticenumber
Reflections in the chosen lattice that are overlapped by a reflection from another lattice will be integrated but the measurement box willbe expanded so that the total intensity of the two (or more) reflections is measured These reflections will be flagged for specialtreatment Reflections that are not overlapped are referred to as singletons They will be dealt with in the normal way by POINTLESSand AIMLESS
NOTE If more than one lattice has been indexed and the results of integrating just ONE of the lattices are to be checked byrunning QuickSymm or QuickScale then the multi-lattice icon in the Integration pane must be turned off otherwise an error
iMosflm Tutorial
fileUsersandrewg4MOSFLMnewgui_tutorialiMosflm_tutorial_720_ver3html[29052015 105311]
message will be given saying that all lattices must be integrated
It is often the case that by measuring both lattices (in separate integration runs) and inputting both MTZ files to QuickScale the overallcompleteness is high using ONLY the singletons To use this option ensure that the multi-lattice icon is off
To make use of the intensity estimates for overlapped reflections MTZ files for all lattices must be input to the program FECKLESSwhich will derive the best estimate of the summed intensity This is the default option if more than one lattice has been indexed and itrequires that all lattices have been integrated (in separate runs) prior to running QuickSymm or QuickScale (FECKLESS will be runautomatically)
At this time no downstream programs can make use of the summed intensities of overlapping reflections but in the future it should bepossible to use this data in REFMAC
Currently it is recommended to use only singletons from all the lattices FECKLESS is not required in this case
The MTZ filename is automatically updated to reflect which lattice has been chosen to avoid overwriting the MTZ file of the first latticewhen integrating the second one FECKLESS when run from iMosflm relies on this naming convention so do not change it
10 Running Pointless to check the symmetryOnce the images have been integrated (even a few degrees of data in many cases) the program POINTLESS can be run to determine thetrue Laue symmetry and try to determine the space group using the QuickSymm button
iMosflm Tutorial
fileUsersandrewg4MOSFLMnewgui_tutorialiMosflm_tutorial_720_ver3html[29052015 105311]
Select the QuickSymm button
A summary of the Pointless results as shown below will appear in a qtRView window
Various graphs (L test for twinning ViewHKL to view the reciprocal lattice) can also be viewed in this window
Various options for POINTLESS such as a reference MTZ file forcing the symmetry selected in iMosflm and specifying multiple input MTZfiles can be selected from the Settings -gt Processing options -gt Sort Scale and Merge tab (see below)
iMosflm Tutorial
fileUsersandrewg4MOSFLMnewgui_tutorialiMosflm_tutorial_720_ver3html[29052015 105311]
Caution The results can be ambiguous if run with a partial dataset Look in the logfile to see how many relfections are used totest each possible symmetry operator
11 Running Aimless to scale and merge the dataSelect the QuickScale button
This will first run POINTLESS then change the space group for the data to that selected by POINTLESS (unless the iMosflm symmetry isset to override POINTLESS) run AIMLESS to scale and merge the data in that space group and then run CTRUNCATE which calculates anumber of statistics from the intensity data The CCP4 UNIQUEIFY script will then be run which generates all the unique reflections forthat spacegroup to the resolution of the measured data and will flag reflections (5 by default but this can be changed) for use as theRfree set
AIMLESS can be run from the QuickScale button either treating anomalous data (the default) or ignoring anomalous data If onlyprocessing a few degrees of data it is usually better to ignore anomalous because especially for low symmetry cases no mergingstatistics may be given in AIMLESS
SCALA can be selected as an alternative to AIMLESS for scaling (not recommended)
There is limited control over running AIMLESS (see figure above) including re-setting resolution limits rejecting batches (images)changing the treatment for accepting partials changing the rejection criterion and changing the procedure for updating the standarddeviation estimates
iMosflm Tutorial
fileUsersandrewg4MOSFLMnewgui_tutorialiMosflm_tutorial_720_ver3html[29052015 105311]
The AIMLESS results will be displayed in the qtRView as shown below along with graphical output (see below) and the full log file canalso be examined
Aimless summary file
iMosflm Tutorial
fileUsersandrewg4MOSFLMnewgui_tutorialiMosflm_tutorial_720_ver3html[29052015 105311]
An example of the Aimless graphical output
The AIMLESS logfile can also be examined by selecting the Log File tab
12 History and mosflm log fileSelecting History allows the history of the session to be examined or by selecting the Log tab the full mosflmlp file can be viewed Themosflmlp file is also available in a time-stamped file mosflm_yyyymmdd_hhmmsslp (eg mosflm_20100518_131019lp) and can beread with a text editor
The History has a tree structure and will show when various parameters have been changed This has not been fully implemented and isnot generally useful
The logfile may provide useful clues when processing has failed
13 Warning MessagesAs already mentioned in Adding images sect3 and Integration sect9 warning messages are generated by MOSFLM during processing Atraffic light colour coding has now been assigned based on the warnings and is shown next to the Warnings box
A Red status implies a serious problem that will affect data quality and should be addressed
An Orange status implies minor issues that should be checked to see if things can be improved
A Green status means no significant problems messages are for information only
iMosflm Tutorial
fileUsersandrewg4MOSFLMnewgui_tutorialiMosflm_tutorial_720_ver3html[29052015 105311]
Abbreviated messages can be obtained by clicking on the Warnings icon The full warning Details together with Hints amp Notes text (ifany are available) can be obtained by double-clicking the relevant warning Details are displayed in a pop-up text box which willdisappear with the next click outside the box The same full details and suggestions are of course available in the mosflmlp files whereeven more information may be available
NOTE This is the end of the part of the tutorial which deals directly with iMosflm but see sect19 which has some suggestions forfurther work if you have time The remainder of this document deals with integrating and scaling data with MOSFLM andAimless via the CCP4i user interface examining the traditional mosflm SUMMARY file with the CCP4 utility loggraph
The Appendix contains a shell script for running MOSFLM as a traditional batch job
14 Useful command line optionsiMosflm has a number of command line options and these can be listed by typingimosflm --helpCurrent options are
--allimages -a ltfilenamegt Starts mosflm loading all files that match the template generated from ltfilenamegt--ccp4i2 Autosaves an iMosflm session file upon exit with an XML list of all iMosflm output files--debug -d Creates a large output file for debugging purposes Dont use this unless asked to by a developer--expert -e Permits access to advanced detector settings This should not normally be required--fastload -f Attempt to speed loading of many images offline while indexing two default images separated by 90 degrees--help -h Displays this message then exits--imagedir -I ltdirectorygt Starts the image browser in this directory if ltdirectorygt is given as an environment variable it will be expanded to its full value--init -i ltfilenamegt Starts Mosflm and reads from the given saved session file--startdir -S ltdirectorygt Starts mosflm in directory ltstartdirgt rather than the current directory This will only work if the directory exists and you have write permission to it otherwise iMosflm will exit All the normal mosflm output files will be in this directory--singleimage -s ltfilenamegt Starts mosflm loading only the image from ltfilenamegt--site -X ltfilenamegt Reads anyall of the following lines from the file given WAVELENGTH ltxgt DISPERSION ltxgt POLARISATION [PINHOLE | MIRRORS | MONOCHROMATOR | SYNCHROTRON ltxgt] DIVERGENCE ltxh xvgt BEAM ltbeamx beamygt DISTANCE ltxgt DISTORTION TILT ltxgt DISTORTION TWIST ltxgt GAIN ltxgt DETECTOR REVERSEPHI DETECTOR OMEGA ltxgt--version -v Displays the program version and required Mosflm version then exits
These can be abbreviated to the shortest unambiguous string
141 The site fileimosflm --site ltsitefilegt will read keywords from the file ltsitefilegt that will overwrite incorrect information in image headers Thissaves having to manually correct values in every iMosflm session The site file can also be read or written as an option from the Sessionmenu (see Drop down menus sect21) Allowed keywords areWAVELENGTH ltxgt
iMosflm Tutorial
fileUsersandrewg4MOSFLMnewgui_tutorialiMosflm_tutorial_720_ver3html[29052015 105311]
DISPERSION ltxgtPOLARISATION [PINHOLE | MIRRORS | MONO | SYNCHROTRON ltxgt]DIVERGENCE ltxh xvgtBEAM ltbeamx beamygtDISTANCE ltxgtDISTORTION TILT ltxgtDISTORTION TWIST ltxgtGAIN ltxgtDETECTOR REVERSEPHIDETECTOR OMEGA ltxgt
15 The mosflm SUMMARY fileMOSFLM produces a summary file listing refined parameters for each image and when using iMosflm this file will be date- amp time-stamped and have a name such as mosflm_20100518_131019sum This contains the same information as the plots produced by theiMOSFLM GUI which now also include the number of bad spots and overloads
This can be inspected graphically from the CCP4i GUI using the program loggraph Select the pull down menu View Files from Job andunder Output files select Additional log graphs where the _SUMMARYloggraph file will be listed Select this file to display its tablesin loggraph
This is very useful to identify rogue images (with unusually high positional residual or low Iσ(I)) If you find any read that image intoMOSFLM and see what is wrong with it
If you have done more than one integration run during your MOSFLM session you will find multiple entries of the tables Look at the lastset for integration of the 84 images
Click on the Refined detector parameter tables and check on the stability of parameters like the TILT and TWIST of the detector (unitsare hundredths of a degree) and for Mar Research (or DIP) image plate data the distortion parameters ROFF and TOFF (units are mm) Ifthey are varying a lot (more than 20 for TWISTTILT) or 015 for ROFFTOFF then it is probably a good idea to fix these parameters atthe average value (or the known values for this detector if they are available) (see Detector parameters sect821)
Click on the Post refinement table and check the missets It does not matter if they change slowly and by an amount (per image) that isless than 01mosaic spread If they are changing more than this then there could be a problem with processing the data (there is notmuch you can do about this)
Check how the mosaic spread is changing If it is unstable or if you think it is not refining to sensible values (as judged by looking atthe prediction) then you can fix the input value in the same way as the detector parameters (see Crystal parameters sect822)
BADSPOTS AND OVERLOADS
The program will set a rejection flag for those reflections that fail certain tests for example too much variation in the background levela poor profile fit an intensity that is very negative (more than 5 standard deviations) a very high gradient for the background planeThese reflections are called Bad spots and they are listed individually for each image in the mosflmlp file together with the reason forflagging them The number of bad spots is also written to the summary file Generally there should be very few (5-10) bad spots oneach image If there are more it could be because the backstop shadow is not correctly allowed for (consider using the NULLPIXkeyword)
There should also be very few overloaded reflections on each image If there are a lot then a separate low resolution data collectionpass should be made with a much shorter exposure time
IMPORTANT Both Bad spots and Overloads are written to the output MTZ file but will be rejected by default by AIMLESS Theintensity of overloaded reflections is estimated by profile fitting that part of the spot that is not saturated To include these reflections inthe final merged data use the ACCEPT keyword in AIMLESS
16 Scaling data with CCP4i ccp4i
Select Directories amp ProjectDir (top right)
In the new window select Add project
Enter the project name in the Project field and the full directory path in the uses directory field Default values may have been enteredalready here Select this project from Project for this session
Select Apply and Exit Dismiss the warning message that comes up
Select Data reduction from the pull down menu of modules (orange bar at top left)
iMosflm Tutorial
fileUsersandrewg4MOSFLMnewgui_tutorialiMosflm_tutorial_720_ver3html[29052015 105311]
Select Symmetry Scale Merge (Aimless)
In the window that appears do the following
Give a job title (top line)
Click on the box next to Separate anomalous pairs for outlier rejection amp merging statistics (the crystals have been soaked in a mercurycompound)
In the next orange bar (line starts HKLIN 1) select Browse and select the MTZ file output by MOSFLM (probably called hg_001mtz)Select OK
If you did not supply the Project name Crystal name or Dataset name to Mosflm fill in the boxes for these now
Under Scaling Protocol
From the pull-down menu on the line starting Scale select with automatic default settings
At the bottom of window from the pull-down menu named Run select RunampView Com File
This will display a new window showing the command file for running the POINTLESS step select Continue After a brief pause it willshow the command file for running AIMLESS (This can be edited before submitting the job) Select Continue
In the main window it will show that the AIMLESS job is running
When AIMLESS has finished the command file for running the CTRUNCATE step will appearselect Continue
When CTRUNCATE has run the main window will say FINISHED
At that point select the pull-down menu View Files from Job and select View Log Graphs This will give you the same graphs asrunning loggraph on the AIMLESS log file they are also the same as those that appeared in IMOSFLMs QuickScale task To look at thelog file itself (eg the overall merging statistics) select View Log File and it will appear in a new window
161 Looking at the AIMLESS output
The simplest way to look at the output from AIMLESS is to use loggraph on the AIMLESS log file (or via the CCP4i GUI) This can displaymany different graphs
Use Scales vs rotation range to check for smooth variation in the scale factor Check the variation in B factor with image and if there isno real variation it is best to turn off the B-factor refinement
Use the Analysis against all Batches for all runs to detect bad images (high R-factor large number of rejected spots)
Check the Analysis against resolution Fractional bias to see if there is any indication of Partial bias (A negative partial bias will resultif the mosaic spread is underestimated or if there is a lot of diffuse scatter
The Fractional bias should be less than 1-2 although it will often exceed this for weak data (eg in the high resolution bins)
The Axial reflections graphs in AIMLESS are useful for detecting systematic absences which can be used to identify the true spacegroup However the detection of screw axes is thought to be sufficiently robust in POINTLESS that these graphs are no longer necessary
It can also be useful to look at the AIMLESS log file itself in particular the table giving statistics as a function of resolution The effectiveresolution limit of the data can be estimated by looking at the Mn(I)sd column (this is the mean Iσ(I) AFTER merging symmetry matesand is the best indicator of data quality) This table also shows shell and cumulative R-factors
The Mn(I)sd values depend on having realistic values of the standard deviations (errors) in the intensities As the values that come fromMOSFLM are always underestimates of the true error these values are scaled up in AIMLESS using a three-term correction
sdcorrected = SdFac Sqrt[sd(I)2 + SdBLPI + (SdAddI)2]
Here SdFac is an overall scale factor and SdB and SdAdd are intensity dependent factors
AIMLESS will automatically work out a suitable value for all three parameters in order to make the mean value of (observedscatter)(sdestimate) equal to 10 where observed scatter is the difference between an individual estimate of intensity and the mean ofall other estimates (from symmetry mates)
Probably the best estimate of the true high resolution limit of the data can be obtained from the CC(12) values these are thecorrelations between equivalent observations that have been divided randomly into two half-datasets The resolution limit is foundwhen the CC drops below ~ 05 - 03
This table comes under the heading
ANALYSIS OF STANDARD DEVIATIONS
iMosflm Tutorial
fileUsersandrewg4MOSFLMnewgui_tutorialiMosflm_tutorial_720_ver3html[29052015 105311]
in the AIMLESS log file and Run n standard deviation v Intensity test (where n is 1 or more) in the CCP4i GUI View Files from Job -View Log Graphs display
Can you identify a bad image in this dataset Can you work out why it is bad
(Cluethe image headers contain quite a lot of information that is not used by MOSFLM including the date and time that the image wascollected)
You can exclude a given batch from the scaling using the EXCLUDE keyword
RUN ALL EXCLUDE imagenumber
In this case run number will be 1
Rerun the scaling SENDING THE OUTPUT TO A NEW LOGFILE excluding this image and see the effect on the heights in the anomalousPatterson (in the log file) DO NOT repeat the integration In the command file uncomment the line (near the top) goto aimless so itskips the integration part
In the CCP4i GUI click to highlight the AIMLESS job which is listed as FINISHED and select ldquoReRun Jobrdquo from the control buttons downthe right-hand side of the main interface window Under ldquoExcluded Datardquo in the window that appears check the box next to Excludeselected batches and pull-down on the menu button to exclude a range Give the start amp end range to exclude (eg 74 to 74) Rerunthe job as before
17 Changing the symmetryFrom the list of options at the left hand side of the main window select ldquoUtilitiesrdquo and under that SortModifyCombine MTZ Files
In the new window give a new title eg reindex as H32
Click on the Box Change space group andor reindex reflections
Use the browse option to select the input MTZ file (First orange bar) the output filename will be generated automatically (but you canchange it)
Under Reindex details
In the last option check the box next to ldquoChange space group tordquo and enter H32 in the box This is above the final item Reducereflections to the asymmetric unit which is checked by default
Select Run from the Run option button
Then go back to the scaling window and select the new MTZ file (reindexed) as the input for scaling (use Browse) CHANGE THE JOBTITLE
Then select RUN
The scaling will now be performed in space group H32 Look at the merging statistics in the log file in particular the multiplicityweighted R-factor called Rmeas in the log file
18 Looking at the CTRUNCATE outputThe CTRUNCATE program converts intensities to amplitudes and also compiles some useful statistics The LTEST and the cumulativeintensity statistics tabulated by CTRUNCATE (and plotted by loggraph) provide the only point at which you will be able to detectmerohedral twinning (when the two lattices of the twin components exactly overlap and every measured intensity is actually the sum oftwo intensities)
For a good dataset the observed distribution should be within 1 of the theoretical distribution Is this the case for this data
19 If you have time 191 Different mosaic spreads
Try repeating the processing with the mosaic spread set to a value 25 smaller than the refined one and fix it by checking the Fix boxin the Integration window in iMosflm
Can you tell from the merging statistics if this data is better
192 Checking up on outliers
iMosflm Tutorial
fileUsersandrewg4MOSFLMnewgui_tutorialiMosflm_tutorial_720_ver3html[29052015 105311]
AIMLESS writes a file called ROGUES which lists reflections which show very poor agreement between symmetry mates or which areimplausibly large
Look in this file (it is ASCII) and try to work out why this has happened The ROGUES file gives you the image (Batch) on which thereflections have been recorded (for partials this is the image nearest the centre of the reflection so you may need to look on thepreceding and following image as well) Select a reflection which shows very poor agreement with its symmetry mates (A value greaterthan 10 in the DelIsd column in the ROGUES file)
Select the offending image by double-clicking it in the Images pane of the iMosflm main window Predict the reflections then enter thehkl values into the boxes and hit Return (or click the red warning button following the entry box for l) to locate the offending reflectionin the image You must give the measured indices - the first set of values in the ROGUES file - when doing this See if there is anythingodd about the spot Remember to check adjacent images for partials
193 How accurate does the unit cell have to be
Try changing the cell parameters by (say) 10 and integrate the images again What is the effect on the merging statistics
20 Tips1 When reading images into a session DO NOT attempt to carry out any other task until ALL the images have been read2 It is often worth repeating the indexing (usually only once) as the refined direct beam coordinates from the first indexing may give
an improved solution when the indexing is repeated (lower rmsd)3 Always integrate a few degrees of data before integrating the whole dataset (see sect9) If the space group is not known in advance
run Quicksymm with a few degrees of data to check that the correct indexing solution has been chosen4 For difficult images do not attempt to refine the unit cell initially once an indexing solution has been obtained try integrating a
few images to ensure that the integration is stable If then going on to refine the cell check that the prediction looks OK for thefirst image of every segment included in the refinement If it does not look very good consider using the pattern matching(Settings -gt Processing options -gt Advanced refinement see sect84)
5 If the resolution of the data is less than 35 Aring do not use the ldquoRefine Cellrdquo task Instead use several images in indexing and use thecell that comes from the indexing
6 If iMosflm gets into a state where the activity icon(upper right) is spinning but nothing seems to be happening click on the activityicon to stop it spinning and see if the session can be continued DO NOT click on the activity icon simply to abort a task this willgive unpredictable results Use the Abort button for cell refinement or integration There is no defined way to abort indexing
7 Use the image summation option (see sect4) to get a better impression of the diffraction for very low exposure Pilatus images8 Use image summation for detector parameter refinement for fine sliced very weak Pilatus images (Settings -gt Processing options -
gt Advanced refinement see sect821)9 For large mosaic spread values (gt 10deg) or small mosaic block sizes (lt10) consider increasing the maximum allowed reflection
width to avoid having too many green predicted reflections (Settings -gt Processing options -gt Advanced integration see sect97)10 By default on selecting the Indexing task iMosflm will find spots index and (assuming a solution has been found) estimate the
mosaicity For difficult cases it is more useful to restrict this to simply finding spots and then do the indexing and mosaicityestimation by clicking the appropriate buttons To do this change the check box Automatically index after spot finding inSettings -gt Processing options -gt Indexing
11 See sect521 and sect522 for advice if the indexing fails Also consider the possibility of a reversed phi rotation direction if you arenot familiar with the beamline (Settings -gt Experiment settings -gt Experiment see sect21)
12 If the detector parameters have refined to physically unreasonable values (eg because cell refinement or integration has beencarried out using an incorrect indexing solution) be sure to reset the detector parameters before attempting further processing(Settings -gt Experiment settings -gt Detector see sect21)
13 Always set the resolution limit slightly beyond the point at which any spots are visible (see sect414 ) For very weak fine-sliceddata it can be very difficult to estimate the resolution visually so integrate to the maximum resolution (inscribed circle) and usethe merging results to set the final resolution There should be no problems integrating to a resolution ~03-05 Aring beyond theactual resolution limit but for example integrating to 3 Aring when the true resolution limit is 5-6 Aring may cause problems and theintegration should then be repeated with a more realistic resolution limit
14 Use the site file sect141 if repeatedly processing data where the direct beam position is wrong or if the phi direction is reversed etcto save having to correct this for every session
Appendix IA command script for running MOSFLM using the keywords copied from the Batch processing window of the new GUI (see Integratingas a background job sect952) Note that keyworded input for MOSFLM and other CCP4 programs is case-insensitive apart from file anddirectory names
bincsh -fv Set a unique identifier for filenames for this job
set ident = x89_mos07_blk3_smallsep
iMosflm Tutorial
fileUsersandrewg4MOSFLMnewgui_tutorialiMosflm_tutorial_720_ver3html[29052015 105311]
$ipmosflm COORDS $identcoords SUMMARY $identsummary ltlt eof-ip Insert keywords copied from iMosflm batch window here
Keywords for this run For example could involve trying different values for mosaic spread or not integrating all images etc etchklout $identmtzgenfile $identgenprocess 1 1000 goeof-ip
pointlesspointless hklin $identmtz hklout $ident_pointlessmtz
aimlessaimless hklin $ident_pointlessmtz hklout $ident_aimless_partmtz ROGUES $identrogues ltlt eof-aimless Use all default options for aimlesseof-aimless
ctruncate hklin $ident_aimlessmtz hklout $ident_truncatemtz
Harry Powell Andrew Leslie and Owen Johnson
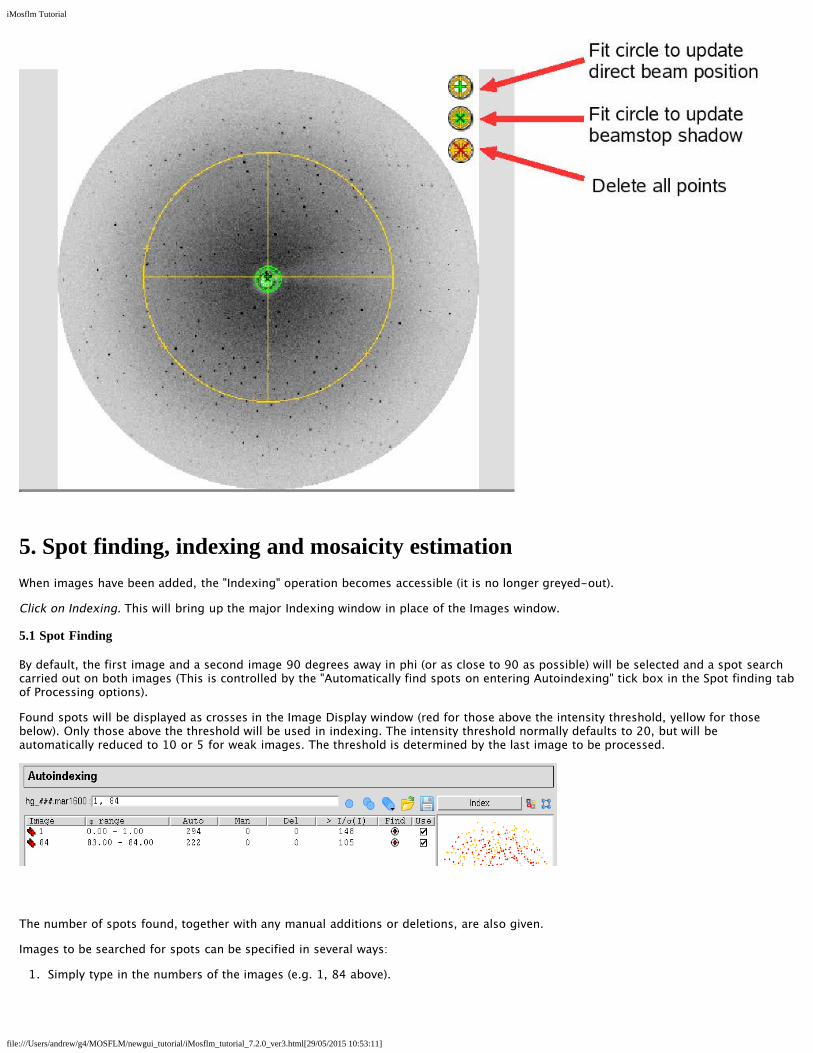
iMosflm Tutorial
fileUsersandrewg4MOSFLMnewgui_tutorialiMosflm_tutorial_720_ver3html[29052015 105311]
5 Spot finding indexing and mosaicity estimationWhen images have been added the Indexing operation becomes accessible (it is no longer greyed-out)
Click on Indexing This will bring up the major Indexing window in place of the Images window
51 Spot Finding
By default the first image and a second image 90 degrees away in phi (or as close to 90 as possible) will be selected and a spot searchcarried out on both images (This is controlled by the Automatically find spots on entering Autoindexing tick box in the Spot finding tabof Processing options)
Found spots will be displayed as crosses in the Image Display window (red for those above the intensity threshold yellow for thosebelow) Only those above the threshold will be used in indexing The intensity threshold normally defaults to 20 but will beautomatically reduced to 10 or 5 for weak images The threshold is determined by the last image to be processed
The number of spots found together with any manual additions or deletions are also given
Images to be searched for spots can be specified in several ways
1 Simply type in the numbers of the images (eg 1 84 above)
iMosflm Tutorial
fileUsersandrewg4MOSFLMnewgui_tutorialiMosflm_tutorial_720_ver3html[29052015 105311]
2 Use the Pick first image icon (single blue circle)
3 Use the Pick two images ~90 apart icon (two blue circles) This is the default behaviour
4 Use the Select images icon (multiple circles) If selected all images in the sector are displayed in a drop-down list Click on aimage to select it then double-click on the search icon (resembling a target in the colum headed Find) for that image to run thespot search The image will move to the top of the list (together with other images that have been searched)
Images to be used for indexing can be selected from those that have been searched by clicking on the Use button If this box waspreviously checked then clicking will remove this image from those to be used for indexing It can be added again by clicking theSelect images icon and clicking on the Use box
Before indexing always check by looking at the image display that the spot finding has worked correctly ie that most spots thatyou can see have been found that multiple crosses have not been drawn over the same spot that spots have not been placedover ice rings or ice spots Check all images that will be used in indexing
511 If the spot finding has not worked well
Parameters affecting the spot search can be modified by selecting the Settings drop-down window and selecting Processing optionsThe resulting new window contains six tabs relating to Spot finding Indexing Processing Advanced refinement Advanced integrationand Sort Scale and Merge
The Spot finding tab allows the Search area Spot discrimination parameters Spot size parameters Minimum spot separation andMaximum peak separation within spots (to deal with split spots) to be reset It also allows the choice between a local backgrounddetermination (preferred) and a radial background determination The local background method also uses an improved procedure forrecognising closely spaced spots The only parameters commonly changed are
1 Minimum spot separation This should be the size (in mm) of an average spot (not a very strong spot) If there are badly split spotsthe spot finding may place two (or more) crosses for a single diffraction spot To avoid this happening set the minimumseparation in X and Y to values equal to the spot size in mm This can be found by zooming the image and counting the number ofpixels across the spot horizontally (X) and vertically (Y) To convert this to mm use the pixel size as given in Settings -gtExperiment settings -gt Detector This separation parameter is very important when spots are very close but usually the programwill determine a suitable value
2 Minimum pixels per spot Default value 6 but this should be reduced automatically if spots are very small (eg when using in situscreening and microfocus beam) If there clearly are spots present and the spot size is very small try reducing this parameter to 3or 2
3 Local background box size Reducing this from 50 to (say) 20 can reduce the number of false spots found near any sharp shadowon the image (or tile boundaries for tiled detectors) Normally these false spots are weak (and will be drawn as yellow crosses) inwhich case they will not affect the indexing
For data collected in-house the spots can be quite large and rather weak In such cases the spot finding parameters are automaticallychanged but some improvement may still be obtained by the following
1 Reduce the spot finding threshold (default 35) eg to 2
2 Change the minimum number of pixels per spot (default 30) to 20 or 40
3 Set the minimum spot separation to a sensible value eg 15mm see above
52 Indexing
Providing there are no errors during spot finding indexing will be carried out automatically after spot finding (This is controlled by theAutomatically index after spot finding tick box in the Indexing tab of Processing options) If the image selection or indexingparameters are changed the Index button must be used to carry out the indexing
iMosflm Tutorial
fileUsersandrewg4MOSFLMnewgui_tutorialiMosflm_tutorial_720_ver3html[29052015 105311]
Autoindexing will be carried out by MOSFLM using spots (above the threshold) from the selected images The threshold is set byMOSFLM but can be changed using the entry box in the toolbar The list of solutions sorted by increasing penalty score will appear inthe lower part of the window The preferred solution will be highlighted in blue There will usually be a set of solutions with lowpenalties (0-20) followed by other solutions with significantly higher penalties The preferred solution is that with the highest symmetryfrom the group with low penalty values
Note that all these solutions are really the same P1 solution transformed to the 44 characteristic lattices with lattice symmetryconstraints applied Therefore if the P1 solution is wrong then all the others are wrong as well
For solutions with a penalty less than 50 the refined cell parameters (ref) will be shown This can be expanded (click on the + sign) toshow the reg unrefined but regularised cell (symmetry constraints applied) and the raw cell (no symmetry constraints applied)
The rms deviation (rmsd) or error in predicted spots positions (σ(xy) in mm) and the number of spots used to refine the solution aregiven for each solution
Usually the penalty will be less than 20 for the correct solution although it could be higher if there is an error in the direct beamcoordinates (or distancewavelength) The rmsd (error in spot positions) will typically be 01-02mm for a correct solution but if thespots are split or very elongated it can be as high as 1mm or higher
The predicted spot positions for the highlighted solution will be shown on the image display with the following default colour codes
Blue Fully recorded reflectionYellow (orange for Pilatus) Partially recorded reflection
iMosflm Tutorial
fileUsersandrewg4MOSFLMnewgui_tutorialiMosflm_tutorial_720_ver3html[29052015 105311]
Red Spatially overlapped reflection these will NOT be integratedGreen Reflection width too large (more than 5 degrees) not integrated
These colours may be adjusted via the Settings -gt Prediction colour item in the Image display window
Providing there are no errors in the indexing MOSFLM will automatically estimate the mosaic spread (mosaicity) based on the preferredsolution
Select other solutions with a higher penalty and see how well the predicted patterns match the diffraction image
The rmsd and visual inspection of the predicted pattern are the best ways of checking if a solution is correct If the agreement is notgood then the autoindexing has probably failed
It is often worth repeating the indexing (once) as the refined direct beam coordinates from the first indexing may give animproved solution (lower rmsd)
521 If the indexing fails - Direct beam search
The indexing is very sensitive to errors in the direct beam coordinates For a correct indexing solution the error should be less than halfthe minimum spot separation Check for example that the current direct beam position is behind the backstop If there are any icerings these can be used to determine the direct beam position (see Circle fitting sect416 )
If the accuracy of the direct beam coordinates (generally read from the image header) is uncertain the program can perform a gridsearch around the input coordinates The number and the size of the steps can be set from the Indexing tab of the Processing optionsmenu (see Settings - Processing options sect21) but defaults to two steps of 05mm on each side of the input coordinates The directbeam search is started by clicking on the Start beam search button in the Indexing pane While in progress it can be stopped byclicking the Abort beam search button
The indexing will be carried out for each set of starting coordinates (Beam x and Beam y in the table which appears) and if a solution isfound the refined beam coordinates (Beam x ref Beam y ref) the unit cell parameters of the triclinic solution and the rmsd error in spotcoordinates and in phi will be listed The correct solution will generally be the one with the smallest rms error in spot positions (σ(xy))To make it simpler to identify the correct solution once the grid search has finished the solutions will be sorted on σ(xy) so the correctsolution will be at the top of the list When sorting the solutions those which have smaller cell parameters will be listed first as it ispossible to have a small σ(xy) value for an incorrect solution with a much larger unit cell Beware of solutions at the top of the list wherethe cell is clearly too small (only happens rarely)
Note that only the triclinic (P1) solution will be listed
If there is now a solution with a smaller rmsd value than before and especially if more than one set of starting beam coordinates has thesame refined coordinates this is a good indication that the beam search has worked Note that if the initial beam coordinates werewrong by more than ~15mm the search may not work In this case either select a new starting position for the direct beam or changethe number of steps
To complete the indexing double-click on the chosen solution and the full indexing will carried out for these beam coordinates withthe solutions appearing in the upper window The results of the direct beam search can be hidden (collapsed) by clicking on the Hidebutton and recovered by clicking on the Show button
iMosflm Tutorial
fileUsersandrewg4MOSFLMnewgui_tutorialiMosflm_tutorial_720_ver3html[29052015 105311]
522 If the indexing fails - Other parameters
Errors in other physical parameters (wavelength crystal to detector distance) can also result in failure All these parameters should bechecked
Several parameters used in autoindexing can also be adjusted using entry fields and buttons that appear in the Indexing toolbar
Weak images
1 MOSFLM automatically reduces the Iσ(I) threshold for weak images and it may also reduce the resolution to 4Å but lower valuescan be tried It is important not to include spots that are not real - a small number of false spots can prevent the indexing fromworking
2 Try changing parameters for spot finding (see If the spot finding has not worked well sect511)
Multiple lattices
1 Try increasing the Iσ(I) threshold (default 20) for example to 40 or 60 so that only spots from the stronger lattice are selectedThis can be done by entering a new value in the leftmost of the circled icons above (and also via the Indexing tab of Processingoptions)
All cases
1 Include more images in the indexing Select images that are widely spaced in phi not close together2 Select images that show the clearest lunes andor have the best spot shape3 In case the crystal orientation has changed or if you are unsure of the direction of positive rotation in phi try indexing using only
one image4 Make sure that the Max cell edge value is not too small If in doubt set to 200 Aring (or more if the cell is expected to be large)5 If the cell parameters are known reduce the maximum allowed cell edge to the known maximum cell edge This can sometimes
help filter incorrect solutions but use with caution as often this needs to be ~twice the largest cell for successful indexingAlternatively try the known cell option
6 If the detector distance is uncertain and the images are high resolution (eg 2Å) allow the detector distance to refine during cellrefinement Use with caution
53 Indexing multiple lattices simultaneously
This is a new feature and is still undergoing development It is most likely to succeed when the different lattices are clearly separated atleast at higher resolution If the images shows badly split spots with several components (each arising from a sub-crystal with a slightlydifferent orientation) then indexing may well still be impossible
After spot finding examine the image to ensure that spots that are close to each other but belong to different lattices have beenidentified as separate spots and not treated as a single split spot (in which case the red cross will lie midway between the two spots)Adjusting the minimum spot separation (Settings -gt Processing options -gt Spot finding) can help in resolving close spots It may alsohelp to increase the inner radius of the spot search region (see Spot search area sect413) so that low resolution reflections where the
iMosflm Tutorial
fileUsersandrewg4MOSFLMnewgui_tutorialiMosflm_tutorial_720_ver3html[29052015 105311]
spots are not really separated are excluded from the search
The following procedure usually provides the best chance of success
1 Select appropriate images for use in indexing The separation of the lattices can be clearer on some images than others Ideallychoose several images widely separated in phi
2 Do a normal (single lattice) indexing first This will usually work but will give a high positional rmsd because of the presence of morethan one lattice This step is important because it will result in more accurate direct beam coordinates which are crucial for multi-lattice indexing
3 Select the ldquoIndex multiple latticesrdquo icon (next to the Index button) the Index button will change to Index multiple
The indexing results for different lattices will be presented in different tabs while the selected solution for each lattice will be shown inthe lower Summary window Currently a maximum of 5 lattices can be handled The figure below shows a case where 3 differentlattices were found
4 Judge the success of indexing by examining the lattice type and the cell parameters obtained for the different lattices (the cellsshould be very similar) and checking that the predictions match the observed spots The rmsd values for correct lattices should also besignificantly smaller than the value obtained in the initial (single lattice) indexing It may be necessary to manually select a differentautoindexing solution for some lattices in order to get the same lattice type (eg oP) for the different lattices
The Split column in the lower pane indicates the angle between the reference lattice (with value -) and the other lattices This is onlycalculated when the lattices have the same lattice type In this case the angles between lattice 1 and lattices 2 amp 3 are 34 and 16degrees
If a lattice is clearly incorrect it can be deleted by highlighting that lattice (in the lower pane that summarises the results) and using theright mouse button to select ldquodeleterdquo
The predictions for different lattices can be displayed either by highlighting the lattice in the Summary window or by using the latticeselector in the image display pane
iMosflm Tutorial
fileUsersandrewg4MOSFLMnewgui_tutorialiMosflm_tutorial_720_ver3html[29052015 105311]
In the image display spots in different lattices that overlap with each other are shown in magenta Only the summed intensity will bemeasured for these reflections
The predictions for all lattices can be shown by selecting the ldquomerge latticesrdquo icon in the image display
This can be useful to check if all the lattices have been successfully indexed because all spots in the image should then be predicted Inthe display predictions from lattice 12345 are shown in blue yellow red green and magenta with no distinction made between fullyand partially recorded reflections or spatial overlaps
iMosflm Tutorial
fileUsersandrewg4MOSFLMnewgui_tutorialiMosflm_tutorial_720_ver3html[29052015 105311]
531 Practical Tips
Beware of solutions where the lattices only vary in orientation by a small angle (less than 1 degree) as these are often different solutionsfor the same lattice The difference in orientation between lattices is given by the ldquosplitrdquo column in the Summary window but this is onlycalculated if the lattices have the same lattice type Differences are all relative to one lattice which will display a split angle as ldquo-ldquo Tocalculate the angles relative to a different lattice open the tab for that lattice select a different solution to that currently selected andthen select the original solution ndash this will trigger recalculation of the split angles relative to that lattice
Other parameters that can influence the indexing are the rdquoMaximum deviation from integral hklrdquo (default 02 when indexing multiplelattices otherwise 03) and ldquoNumber of vectors to find for indexingrdquo (default 30) These can be changed via the Indexing tab of theldquoProcessing Optionsrdquo that can be selected from the ldquoSettingsrdquo menu item Values between 015 and 025 might be helpful for the firstparameter and increasing the number of vectors from 30 to 50 can also help At present there is no defined protocol for changing thedefault parameter values for particular cases it has to be done by trial and error
Experience so far has shown that selecting appropriate images and adjusting the maximum cell length used in indexing have the biggesteffect The optimum value for the maximum cell length will normally lie between one and three times the largest cell dimension but it isworth varying this in steps of between 25 and 50 Aring as the indexing can be very sensitive to this parameter
For a more complete discussion of multiple lattice indexing see Powell HR Johnson O amp Leslie AGW 2013 Autoindexingdiffraction images with iMosflm Acta Cryst D69 1195-1203
54 Known cell option
For images that are very difficult to index if the cell parameters are known the known cell option can be usedSelect the ldquoKnown cellrdquo icon (next to the Multiple lattices icon) Enter the cell parameters in the Input known cell pop-up window andselect OK when all 6 parameters have been provided Then select the Index Cell button
To revert to normal indexing select the ldquoKnown cellrdquo icon and then select Clear in the Input known cell pop-up window
55 Space group selection
Note that the indexing is based solely on information about the unit cell parameters It will therefore be very difficult (or impossible) todetermine the correct Laue group in the presence of pseudosymmetry For example a monoclinic space group with β ~ 90deg will appearto be orthorhombic an orthorhombic space group with very similar a and b cell parameters will appear to be tetragonal These can onlybe distinguished when intensities are available (ie after integration) by running POINTLESS (QuickSymm) (see Running Pointless to check the
iMosflm Tutorial
fileUsersandrewg4MOSFLMnewgui_tutorialiMosflm_tutorial_720_ver3html[29052015 105311]
symmetry sect10)
In addition it is not possible to distinguish between Laue Groups 4m and 4mmm 3 and 3m 6m and 6mmm m3 and m3m Thiswill not affect integration of the images but it will affect the strategy calculation In the absence of additional information the lowersymmetry should be chosen for the strategy calculation to ensure that a complete dataset is collected
The presence of screw axes also cannot be detected so there is no basis on which to distinguish P21 from P2 etc This does not affectany aspect of data collection or processing and can be chosen (on the basis of systematic absences) after integration by runningPOINTLESS
In this example there is no way of knowing at this stage if the space group is h3 or h32 so leave it as h3
56 Mosaicity estimation
If the Automatically index after spot finding option has been chosen (Indexingtab of Processing Options) the mosaicity (mosaic spread) will be estimatedautomatically for the preferred solution However if another solution is chosenthe mosaicity should be estimated again
Click on the Estimate button to estimate the mosaicity
A window will appear which plots the total predicted intensity as a function ofmosaic spread from which an estimate is determined
The predictions displayed on the image will be updated Entering different valuesof mosaic spread in the box (followed by return) will allow a visual estimate of theeffect of changing the mosaic spread
The mosaic spread can also be entered in the Images pane by clicking once on theMosaicity line and once again on the value displayed
561 The mosaic block size
In some cases the apparent mosaic spread is much larger at low resolution than at high resolution so that if it is set to a value thatresults in all the low resolution spots being predicted many more spots are predicted than are visible at high resolution This effect isbest dealt with by adjusting the Mosaic block size which is also displayed in the Images pane This is modelling the size in microns ofthe individual mosaic blocks in the crystal Decreasing this to values of 05-5 microns (say) from the default of 100 microns will resultin predicting more spots at low resolution but have virtually no effect at high resolution This parameter is not refined (at present) andso the best value must be determined by trial and error
6 Saving and recovering a sessionThe session can be saved at any time using the Session drop-down menu referred to in sect21 The first time that a session is saved youwill be prompted for a filename The filename convention for saved session files is that the extension is mos
Save the current session Then exit from iMosflm (using the Session drop-down menu) restart iMosflm and read in the saved session
If the program crashes it should be possible to recover all but the latest actions as a temporary copy of the session file is continuallysaved to the directory mosflm in the users home directory
Restart iMosflm and it will pop up a Recover session window
Selecting the Recover button will restore the session as far as possible
iMosflm Tutorial
fileUsersandrewg4MOSFLMnewgui_tutorialiMosflm_tutorial_720_ver3html[29052015 105311]
7 Data collection strategyOnce the crystal orientation and (probable) Laue group have been determined it is possible to calculate a data collection strategy andthe Strategy icon is no longer greyed-out (in fact all other operations Strategy Cell Refinement and Integration become possible at thispoint)
Select the Strategy icon This will open the Strategy window
The statistics initially presented in the window are based on the images read in to the current session If only two (or more) references
iMosflm Tutorial
fileUsersandrewg4MOSFLMnewgui_tutorialiMosflm_tutorial_720_ver3html[29052015 105311]
images have been read in no statistics will be presented
When the Strategy option is used after two initial images (typically 90deg apart in φ) have been collected a complete shaded segment willnot be shown in the lower part of the screen rather an empty circle will be shown with the matrix label beneath it Click the Auto-complete button and in the pop-up menu that appears select a rotation angle or sweep of data to collect - or leave the Rotationsetting as Auto for a calculation of maximum completeness for this crystal orientation Click on Ok and the completeness results willbe presented
The orientation of the crystal expressed as the angles between the abc unit cell axes and the XYZ coordinate frame is given X isalong the X-ray beam Z is the rotation axis A warning will be given if the unique axis is so close to the rotation axis that there will bemissing cusp data
71 Evaluating completeness manually
The completeness of any given segment of data can be determined manually using the circle at the bottom left of the window Click onthe red segment shown in this circle
This will result in small black boxes being drawn on the circumference at the start and end of the red sector
Use the LMB to click on the black box at 0 and drag this around the circle
When the LMB is released the statistics for that sector will be displayed The statistics are presented in two ways Near the top right ofthe window the overall completeness is shown as red circles for unique data and anomalous pairs The average multiplicity is givenbeneath these circles
More detailed statistics (such as completeness as a function of resolution) are given in a series of histograms that can be selected by adrop-down menu
72 Calculating a strategy automatically
Uncheck the Use checkbox at the right side of the hg_001 line listed in the sector list near the top of the Strategy pane This means
iMosflm Tutorial
fileUsersandrewg4MOSFLMnewgui_tutorialiMosflm_tutorial_720_ver3html[29052015 105311]
that the 84 images used thus far will not be included in the completeness calculation only the matrix derived from indexing them willbe used Select the Auto-complete button to calculate a strategy automatically
A strategy calculation data pop-up window will appear
If multiple matrices have been defined (for different sectors of data) then the appropriate one can be selected (if there is only one sectorthis has no effect)
The total φ rotation to be used is normally calculated by MOSFLM based on the Laue group and the crystal orientation (the Auto setting)However it is sometimes possible to achieve a high completeness with a significantly smaller total rotation (eg 60deg in two 30degsegments will typically give gt94 completeness for orthorhombic space groups) and this can sometimes be useful if radiation damage isa serious problem although when using hybrid pixel detectors it is better to use a very conservative exposure time and collect a wide φrotation
Total rotation angles of between 5deg and 90deg can be selected from the drop-down list The number of segments to be used can be setbetween 1 and 3
If the check box is checked data completeness will be calculated to optimize the proportion of anomalous data collected
THIS IS IMPORTANT The optimum strategy is often different when maximising completeness of the anomalous data
Choose the default values (Rotation Auto Segments 1) but check the anomalous data box then click on Ok Look at the variousstatistics presented as bar charts
In space group H3 if rotating around the c axis a total rotation of 120deg would be required to collect a complete dataset (ignoring anydata lost in the cusp) Because the c axis is 22deg away from the rotation axis in this case it is possible to collect very high completeness(for unique data) with a rotation much smaller than this
Try to find the minimum total rotation that will give a dataset that is gt95 complete for the unique data Now do the same butrequiring gt95 completeness for the anomalous data
SKIP OVER SECTION 73 IF DOING THE NORMAL TUTORIAL
73 Calculating a strategy using multiple crystals
The Strategy pane may also be used when due to radiation damage many crystals are required to collect a complete dataset
IMPORTANT This procedure will only work correctly for space groups where there is no indexing ambiguity For those spacegroups where there is an indexing ambiguity( see httpwwwccp4acukdisthtmlreindexinghtml for a complete list) it isnecessary to integrate images to determine whether different crystals have been indexed in the same way This is not achievablewithin the Strategy option at present
Suppose the first crystal has been indexed from the reference images
Enter the Strategy pane an empty circle is displayed in the bottom part of the screen and click on the Auto-complete button nearthe top-right of the pane In the Auto-complete window that appears choose a suitable Rotation angle for the amount of datathat can be collected from one crystal say 20 degrees for this example Leave Segments set to 1 and do not check Optimize foranomalous data
Click the Ok button and the completeness of the data will be displayed The matrix name start and end phi values and the phiextent will be displayed in the top area of the pane with a checkbox ticked under the Use column This means this segment will beused in further strategy calculations
Accept and save this result by clicking on the yellow hatched segment displayed in the large circle near the bottom of the paneClick once and the segment will be outlined in black (you can adjust the start or end phi value calculated in one degree incrementsby click+dragging the respective black square) click again this time on the black square denoting the start or end phi (or release ifyou have adjusted by click+dragging) and the segment will turn red The segment will not be saved unless it has turned red
This result will be saved if you leave this pane (eg to load more images) and return later in this session The strategy file can alsobe saved to a permanent file using the Save button on the tool-bar This is highly recommended when working with many crystals
Return to the Strategy pane when you have loaded and indexed the reference image(s) from the second crystal and repeat the procedureabove You will see the calculated segment from the first matrix displayed at the bottom-left of the screen The optimum phi range for
iMosflm Tutorial
fileUsersandrewg4MOSFLMnewgui_tutorialiMosflm_tutorial_720_ver3html[29052015 105311]
the second crystal will be displayed Save this in the same way as for the first crystal (clicking twice) Repeat this procedure for anysubsequent crystals and in each case the optimum phi range will be calculated for the latest crystal taking into account the data fromprevious crystals
It is a good idea to save the strategy to a file as each new crystal is added in case the program crashes and this information is lost
In practice it is probably safest to have a separate iMosflm session that is reserved for the strategy calculations and not used to processany data The strategy for each new crystal can be calculated as described above If there is a problem and the session is corrupted or ifiMosflm is closed down for any reason it is straightforward to restore the status of the session providing the strategy has been savedThe following steps should be taken
1 Read in the reference images for the latest crystal and index them
2 Select the Strategy pane
3 Read in the optimised strategy for all previous crystals using the ldquoAddrdquo button and giving the appropriate filename
4 Making sure that the circle for the latest crystal is highlighted in the lower left window click on lsquoAuto-completersquo and follow the stepsdescribed above
Advanced Usage
The startend phi values for each crystalmatrix can be updated This might be required if for example only 10 degrees of useful datawere collected from a particular crystal instead of the anticipated 20 degrees To change the phi values click either on the matrix namein the top pane or on the circle showing the segment of data in the lower left pane (these are highlighted in a blue box as the mousemoves over them) The corresponding segment will now be displayed in the larger circle Click on the red segment so that a blacksquare appears at the startend phi values Then simply drag the appropriate phi to the desired value The completeness willautomatically be updated (but the strategy calculation for the latest crystal will not be repeated to do this the current segment must bedeleted by highlighting the matrix name and using right click and then repeating the Auto-complete step)
If matrix files saved from iMosflm are available from crystals for which data have been collected in previous sessions these can beadded into the calculation using the Add matrix button on the tool-bar
If the saved strategy result has become complicated or is incorrect and you wish to restart the calculations afresh there is a tool-barbutton Reload sectors from session This will remove any calculated sectors while leaving any known matrices listed at the bottom-leftof the Strategy pane
If you have saved a strategy file from a previous session this can be used to re-initialize the Strategy pane using the Load button onthe tool-bar
A Spacegroup pull-down menu has been added to the tool-bar to permit different choices of space group to be used in thecalculations (eg H3 and H32) This menu is populated from the list offered on the Indexing pane However the space group symboltext is editable Any space group symbol entered will be validated by Mosflm together with the current cell parameters
As a calculator for a multi-segment strategy the Strategy pane is reasonably flexible you can Save or Delete highlighted matrix lines byright-clicking As you highlight different matrix lines the orientation of the crystal expressed as the angles between the abc unit cellaxes and the XYZ coordinate frame is re-displayed in the centre of the pane
The following screen shot shows the cumulative results in the Strategy pane after this procedure has been followed for four crystals(ignore the iMosflm version number)
iMosflm Tutorial
fileUsersandrewg4MOSFLMnewgui_tutorialiMosflm_tutorial_720_ver3html[29052015 105311]
731 Calculating a strategy when some data have already been collected and processed
This option is not yet implemented If data have already been processed (to give an MTZ file) but the images are not currently available (eg they were collected on a previoussynchrotron trip possibly at a different synchrotron) then the MTZ file containing this data can be read and used to calculate a strategyfor data collection from new crystalsThe MTZ icon in the tool bar is used to read the MTZ file
74 Calculating a suitable oscillation angle
To calculate the maximum possible oscillation angle while avoiding spatial overlaps click on the Check for overlaps button A pop-upwindow will appear from which the option to calculate the maximum oscillation angle (as a function of φ) or check how many overlapswill occur for different (user selected) oscillation angles The results are plotted in the same pane as the histograms for the strategycalculations Note that the overlap calculation is based on the current values for the mosaic spread and spot separation and can be verysensitive to these values Note also that these are maximum and not necessarily recommended oscillation angles
iMosflm Tutorial
fileUsersandrewg4MOSFLMnewgui_tutorialiMosflm_tutorial_720_ver3html[29052015 105311]
8 Cell refinementIt is important to determine the cell parameters accurately before integrating the images Although the unit cell is refined as part of theautoindexing providing the diffraction extends beyond ~35Å resolution it is possible to obtain more accurate cell parameters using aprocedure known as post-refinement This procedure requires the integration of a series of images in ideally two or more separatesegments at widely different φ values The distribution of the intensity of partially recorded reflections over the images on which theyoccur is used to refine the unit cell crystal orientation and mosaic spread
Select the Cell Refinement icon
81 Selecting the images
iMosflm Tutorial
fileUsersandrewg4MOSFLMnewgui_tutorialiMosflm_tutorial_720_ver3html[29052015 105311]
There are several ways to select the images to be used in cell refinement Whichever method is used the image numbers will bedisplayed in the Images entry field iMosflm will automatically select appropriate images but these can be changed
811 Manual selection
A list of images can simply be typed into this box An image series can be specified as n-m where n and m are the first and last imagesDifferent series must be separated by white space or comma
For orthorhombic or higher symmetries two segments should be given approximately 90deg apart in φ For monoclinic or triclinic datathree or four segments are best (eg φ = 04590135)
The number of images that should be included in each segment depends on the mosaic spread and oscillation angle A reasonablenumber is 2(mosaic spreadoscillation angle +1) MOSFLM will automatically select two or more segments as appropriate Note thatthere is a limit on the total number of images that can be used
812 Automatic selection
Selecting the Automatically select images icon will select a suitable set of images
813 Graphical selection (Not recommended)
Selecting this icon will give a new window
Images can be selected by clicking in the Use check-box in the list of images or by using the mouse to drag a selection of imagesfrom the sector displayed The other icons allow the sector to be zoomed in or out and the viewed area to be moved to make theselection easier The final two icons on the tool-bar switch the segment display to fit the display space as either a full circle or aquadrant This Image palette can be closed by clicking outside its area but will close after 60 seconds anyway
82 Integrating the images and refining the cell
Use one of the methods above to select images to use in cell refinement and click on the Process button Before starting cell refinementcheck that the prediction for the first image in each segment to be used is good The majority of the spot positions must be correctlypredicted for the first image in each segment or else the refinement will not work
The selected images will be integrated and following integration the cell parameters are refined Selectable refined detector parameters
iMosflm Tutorial
fileUsersandrewg4MOSFLMnewgui_tutorialiMosflm_tutorial_720_ver3html[29052015 105311]
will be plotted as will the changes in crystal orientation and (if selected) mosaic spread If the shift in cell parameters is greater than 25standard deviations another cycle of integration and cell refinement is carried out Typically two or three cycles are required forconvergence Note that the current program activity is shown in the bottom left-hand corner of the window in the status message area
The different windows are explained below Moving the mouse over any parameter or plotted graph point will give a full description ofit
821 The detector parameters window
The values of the refined detector parameters are displayed for each image as it is integratedThere is the option to fix any of the parameters during integration by checking the Fix box onthe right The positional residuals (overall central and weighted) are also listed
Any of these parameters can be selected for plotting on the graph that appears to the right ofthis box by simply clicking on that parameter (which is then highlighted in blue as shown herefor Beam x and Beam y)
Check the stability of the refined parameters by displaying the appropriate graphs To getsensible scaling of the graphs only parameters with similar numerical values should be plottedtogether
For weak images (ie few visible spots in the outer regions of the image) the tilt and twistmay not be well defined and might refine to large values (greater than one degree) Insuch cases these parameters should be fixed It is not generally recommended to fix any
iMosflm Tutorial
fileUsersandrewg4MOSFLMnewgui_tutorialiMosflm_tutorial_720_ver3html[29052015 105311]
other detector parameters
For very weak fine sliced images (Pilatus only) there is the option to sum images when findingsuitable spots for refinement see Settings -gt Processing Options -gt Advanced refinementwhich can in some cases make the refinement more stable
822 The crystal parameters window
The values of the refined crystal missetting angles φ(x) φ(y) φ(z) the unit cell parameters andmosaic spread for the current image are displayed in the table Selected parameters will beplotted as for the detector parameters Specific unit cell parameters can also be fixed
If more than one segment of data is being used for cell refinement it is not unusual to see achange in orientation of the crystal between the two segments
Observe how the crystal orientation is different for images in the two segments See how themosaic spread varies during refinement
823 The central spot profile
The average spot profile for the central region of the detector is plotted for eachimage This confirms that the spot prediction is good If the profile is not welldefined and central in the box or if the blue border for the peak region of the spot ismuch larger than the apparent spots size it suggests a problem with the integrationand the initial prediction should be checked In some cases it may be necessary toincrease or decrease the Profile Tolerance parameters to ensure that the blue boxfits the spot To do this select the Advanced integration tab of Processing optionsCheck the central spot profiles for the images used in the cell refinement
824 The summary window
This window presents a summary of how selected parameters have changed indifferent cycles of the cell refinement The behaviour of these parameters gives agood indication of whether the cell refinement has been successful
If the refinement has been successful the RMS residual should be lower for thefinal cycle than in previous cycles However errors in the cell can be compensatedquite well by changing the crystal to detector distance so the differences are notalways dramatic
The other parameters that can be plotted from the pull-down list are the detectordistance and the Pixel ratio (Yscale)
The detector distance should be the same for all images in the refinement If the original indexing was based on auto-indexing a singleimage (say the first) then the detector distance might change for images from the second segment to compensate for an error in theoriginal cell If the variation in distance for different images increases with the cycle number this indicates that the refinement is notstable
The Pixel ratio (Yscale) parameter may also show an initial variation for images in different segments because refining Yscale (whichshould be 10000 for all except Raxis II and Raxis HTC detectors) can compensate for errors in cell dimensions in the same way that thedistance can The final values (last cycle) should be very close to identical for all images and should also be very close to unity (to within00010)
Cell refinement can be unstable if the data do not extend to at least 35 Aring If it appears unstable use the cell derived from auto-indexing a series of images well spaced in φ instead
iMosflm Tutorial
fileUsersandrewg4MOSFLMnewgui_tutorialiMosflm_tutorial_720_ver3html[29052015 105311]
Examine the plots to see if the parameters are stable and correct (Yscale)
825 The final results
When refinement has converged (or after 5 cycles) the initial and final cell parameters and the estimated errors (std dev) are listed
If time is available make a note of the std dev values and repeat the cell refinement using a larger number of images in each segmentAre the standard deviations smaller when using more images
83 Refining cell parameters for multiple lattices
Providing the resolution is high enough (generally better than ~35-32 Aring) and not too many of the spots in the different lattices areoverlapped it is possible to refine the cell parameters for each lattice individually The lattice to be refined is selected from the Latticeselector
This selector will be grayed out when processing a single lattice
84 If the prediction for the first image of a segment is poor
In some cases depending on how the indexing has been carried out or if the diffraction is poor or there has been a large change incrystal orientation during the data collection the prediction for one or more of the segments (the first image) may be poor In suchcases the integration and hence the cell refinement may fail It may be possible to successfully process the images after an initialrefinement of the crystal orientation using a pattern matching algorithm To select this option got to the Advanced refinement tab ofProcessing options and select the tick box for Refine orientation of first image in any run by pattern matching and for Integrate allimages Then refine the cell in the usual way During integration the orientation will be refined for the first image of each segmentoutput for this additional refinement will be written to the logfile but is not shown in the GUI
9 IntegrationThe accurate cell parameters are now used in the integration Note that although the images are integrated during the cell refinementthe intensities are not saved and no MTZ file is generated at that stage
It is good practice to start by integrating a block of images corresponding to a few degrees of data to check that the parameters do notneed further adjustment MOSFLM will generate warning messages after integration if there are any difficulties and it may be possibleto improve the situation by changing some of the default parameters (see Warning messages sect13)
Before integration ensure that the backstop shadow has been defined (see Masked areas backstop sect411 and Masked areas generalsect412)
91 Image selection
Image selection is performed in exactly the same way as in the cell refinement In this case the Automatic selection will simply includeall images in the current sector
Select images 1-10
92 Setting the MTZ filename and controlling updating of the image display
Two icons appear when the integration option is chosen
If the Show predictions icon is clicked the display window will be updated as eachimage is processed This will slow down the processing but allows the accuracy of theprediction to be checked for each image
iMosflm Tutorial
fileUsersandrewg4MOSFLMnewgui_tutorialiMosflm_tutorial_720_ver3html[29052015 105311]
Click on this icon so that the display will be updatedThe filename of the MTZ file containing the results of the integration is generatedautomatically but can be edited manually
93 Integrating the images
Click on the Process button to start integration
Integration of the images occurs in two passes In the first pass for each block of images (a number corresponding to a few degrees ofdata selected automatically by MOSFLM) the detector and crystal parameters are refined for each image in turn and the measurementboxes for all predicted spots are written to a file for use in the second pass In the second pass the standard profiles are formed fromreflections present on all of the images in this block and each image is then integrated and the results written to the MTZ file Thedisplay is not updated during the second pass and will remain on the last image of the block (assuming image updating has beenselected)
Note that the unit cell dimensions are normally fixed during integration and only the crystal orientation and mosaic spread are refinedCrystal parameter refinement only starts when a sufficient number of images have been integrated to provide data for the post-refinement typically after ~05-1 degree (more for high mosaicity)
94 Parameter display windows
As described in sect82 the refined detector and crystal parameters will be displayed in tables and selected parameters will be plotted ingraphs The average spot profile for each image will also be displayed
The size of these graphs (and the profile) can be expanded to fill the whole window by holding down Shift and clicking LMB anywherein the graph window A second Shift+click will revert the graph to the original size
In addition to these windows there are windows that tabulate and plot (as a function of image number) the mean Iσ(I) for profile fittedand summation integration intensities The overall values and the values for the highest resolution bin are given
The number of overloaded reflections Bad spots (ie those that fail certain tests see mosflm SUMMARY file sect15) Spatial overlaps andif processing multi-lattice images the number of lattice overlaps is listed for each image and can be plotted by highlighting thatparameter When processing data from crystals with large unit cells it is important to watch out for spatial overlaps (see sect97 for tips onhow to reduce the number of spatial overlaps if this is a problem)
A display of the standard profiles for different regions of the detector is also provided Poor profiles are averaged by includingreflections from inner regions of the detector Averaged profiles are indicated by a red line around the spot (rather than blue) Theoriginal unaveraged profile can be viewed a clicking on the profile (providing there were sufficient spots in that region to allowformation of a profile)
The profiles should be checked to see that they are well defined and centred within the box Poorly-defined diffuse or non-centredprofiles may suggest that the prediction is not very good in which case this should be checked on the corresponding image(s)
It may be useful to expand the standard profiles to fill the window using Shift + click in the profiles window
Finally the lower left window plots Iσ(I) as a function of resolution for any selected image
iMosflm Tutorial
fileUsersandrewg4MOSFLMnewgui_tutorialiMosflm_tutorial_720_ver3html[29052015 105311]
Different parameters can be plotted by selecting the small right- or left-pointing arrows on the title line above the plot
95 Integrating the whole datasetAssuming that everything looks OK the entire dataset can now be integrated However it is strongly recommended thatProjectCrystalDataset names are assigned first These are written to the output MTZ file and used by downstream programs inparticular AIMLESS will use this information when deciding which images belong to the same dataset
Select Experiment settings from the Settings drop-down menu (see Drop down menus sect21) to enter these names and optionally givea title for the MTZ file
Select images 1-84 and click on Process
951 Parallel Integration Using multiple cores
An option is available on the pull-down menu (next to the Process button in the Integration task) which splits up the integration jobover available cores on the local machine All aspects are currently determined automatically at present user-configurable options willbe available in a later version The algorithm used is as follows
iMosflm determines the number of cores available on the local machineIf the number of cores (N) is greater than 2 iMosflm splits the integration run into N-1 batches (up to a maximum of 16) containingapproximately the same number of images If N le 2 iMosflm splits the run into N batches
If the total number of images in each batch is less than 32 the number of batches is decreased until this condition is satisfied
The first batch is submitted as a background task consisting of a refinement stage and an integration stage with its input and outputfiles (including the MTZ file) in a new directory its name being determined from the number of segments of data being integrated andthe lattice number (if the sample has been determined to contain multiple lattices) If the directories exist already they are all movedinto a newly-created directory with a time-stamped name the files from the most recent integration run are thus in directories withnames following the pattern described above Once the refinement stage is complete the refined parameters are written to a file
The launch of subsequent batches are delayed until the corresponding preceding batch has written its refined parameters This file isread and the new batch is launched again with a refinement stage and integration stage
At present the job cannot be aborted once it has started
952 Integrating as a background job
By selecting Batch in the drop-down menu adjacent to the Process button the integration can be run as a background job rather thaninteractively and the GUI can be used to look at a different dataset
Selecting Batch from the drop-down menu will display a new window showing the script that will be used to process the images alongwith a number of processing options The script can be edited if additional keywords are required or if some parameters are to bechanged and can also be copied and pasted into a file for off-line processing
By default the job is divided into batches across multiple cores as determined for the parallel integration described in sect951 but thenumber of cores can be chosen by the user from a drop-down menu in this case the size of each batch is determined by the interface
Plotting the results of the integration can be turned off this can make processing much faster
iMosflm Tutorial
fileUsersandrewg4MOSFLMnewgui_tutorialiMosflm_tutorial_720_ver3html[29052015 105311]
It is possible to configure job submission for remote machines (which can be added by depressing the add host button) Ensure youhave enabled passwordless logins for all the remote machines you enter and that you specify the full path to the Mosflm executable inthe Batch destinations window The remote working directory (in which the log and MTZ files are written) and the remote imagedirectory must both be specified with their full path names Any required parameter fields that are not completed by the user arehighlighted in orange if the user tries to submit a job without completing these fields a new window containing only those fields (againhighlighted in orange) pops up with a request to do so
The number of cores available on the selected host can be determined by depressing the apple core button on the Batch destinationsconfiguration window
The log file for batch submission jobs the MTZ and SUMMARY files are written to the directory in which iMosflm was launched
96 Checking the integration
iMosflm Tutorial
fileUsersandrewg4MOSFLMnewgui_tutorialiMosflm_tutorial_720_ver3html[29052015 105311]
The detector and crystal parameter plots should be examined carefully to check for any instability in the refinement If there are largeand random variations in some parameters (eg the detector twist and tilt) then it may be better to fix them and repeat the integration
For cases (eg very small unit cells) where there are very few suitable reflections on each image the refinement of the missetting anglesmay show significant variations from one image to the next In such cases it is best to apply smoothing to the missetting angles usingthe tick box in Settings -gt Processing options -gt Advanced Refinement
Discontinuities due to blank images should also show up and the offending images should be removed from the scaling run
If adjacent spots are incompletely resolved on the detector it may be possible to improve the processing by increasing the PROFILETOLERANCE parameters by 1-2 These parameters can be set in the Advanced integration tab of the Processing options menu (useSettings)
97 Advanced features for integration
The Settings -gt Processing options menu allows additional control over the integration Parameters such as the minimum spotseparation resolution limits excluded resolution ranges block size MTZ filename and BATCH ADD can be changed in the Processingtab
Manually decreasing the minimum spot separation can help if a large number of reflections are flagged as spatially overlapped (redboxes) The prediction must be updated to see the effect of changing the separation this can be done either by displaying the next orprevious image or double clicking on the blue circle next to the image currently displayed in the Images pane
In the Advanced integration tab the measurement box parameters profile tolerance and profile averaging parameters can be set
The measurement box parameters can be adjusted for rare cases where the estimation of the spot size has not worked correctlyresulting in a box that is too small or too large The optimisation of the background rim and corner cutoff parameters that determinewhich pixels are used for the background and which pixels for the peak can also be turned off but this is generally not recommended
Increasing the profile tolerance can help in cases where adjacent spots are not completely resolved this can be judged by examining thestandard profiles By default the profile tolerance is automatically increased if there are a large number of spatial overlaps as this hasthe effect of reducing the minimum spot separation A message will be written to the logfile if this has happened This option can beturned off using the tick box Optimise profile tolerance values to avoid spot overlap
The profile outlier exclusion parameters control the exclusion of ice spots or hot pixels which could otherwise corrupt the standardprofiles
Pixels with a value less than the Null pixel threshold are considered to belong to inactive regions of the detector
The pixel saturation value determines when a reflection is considered to be an overload The intensity of overloaded reflections isestimated by profile fitting but these reflections are rejected by the scaling program AIMLESS by default
Increasing the Maximum reflection width in φ from the default value of 5deg will reduce the number of rejected reflections (green boxes)and is worthwhile when the mosaicity is very high or the mosaic block size is very small As with the minimum spot separation theimage must be refreshed to see the effect of changing this parameter
The rejection criteria will reject reflections with too much variation in the background (BGRATIO) or where the gradient of thebackground plane is too large These should only be changed if many reflections are being rejected PKRATIO only applies to fullyrecorded reflections and reflects a very poor profile fit With current data collection protocols there will be very few (if any) fullyrecorded reflections
Additional MOSFLM parameters will be added based on user requests
98 Integrating multiple lattices
When multiple lattices have been successfully indexed each lattice can be integrated individually by selecting the appropriate latticenumber
Reflections in the chosen lattice that are overlapped by a reflection from another lattice will be integrated but the measurement box willbe expanded so that the total intensity of the two (or more) reflections is measured These reflections will be flagged for specialtreatment Reflections that are not overlapped are referred to as singletons They will be dealt with in the normal way by POINTLESSand AIMLESS
NOTE If more than one lattice has been indexed and the results of integrating just ONE of the lattices are to be checked byrunning QuickSymm or QuickScale then the multi-lattice icon in the Integration pane must be turned off otherwise an error
iMosflm Tutorial
fileUsersandrewg4MOSFLMnewgui_tutorialiMosflm_tutorial_720_ver3html[29052015 105311]
message will be given saying that all lattices must be integrated
It is often the case that by measuring both lattices (in separate integration runs) and inputting both MTZ files to QuickScale the overallcompleteness is high using ONLY the singletons To use this option ensure that the multi-lattice icon is off
To make use of the intensity estimates for overlapped reflections MTZ files for all lattices must be input to the program FECKLESSwhich will derive the best estimate of the summed intensity This is the default option if more than one lattice has been indexed and itrequires that all lattices have been integrated (in separate runs) prior to running QuickSymm or QuickScale (FECKLESS will be runautomatically)
At this time no downstream programs can make use of the summed intensities of overlapping reflections but in the future it should bepossible to use this data in REFMAC
Currently it is recommended to use only singletons from all the lattices FECKLESS is not required in this case
The MTZ filename is automatically updated to reflect which lattice has been chosen to avoid overwriting the MTZ file of the first latticewhen integrating the second one FECKLESS when run from iMosflm relies on this naming convention so do not change it
10 Running Pointless to check the symmetryOnce the images have been integrated (even a few degrees of data in many cases) the program POINTLESS can be run to determine thetrue Laue symmetry and try to determine the space group using the QuickSymm button
iMosflm Tutorial
fileUsersandrewg4MOSFLMnewgui_tutorialiMosflm_tutorial_720_ver3html[29052015 105311]
Select the QuickSymm button
A summary of the Pointless results as shown below will appear in a qtRView window
Various graphs (L test for twinning ViewHKL to view the reciprocal lattice) can also be viewed in this window
Various options for POINTLESS such as a reference MTZ file forcing the symmetry selected in iMosflm and specifying multiple input MTZfiles can be selected from the Settings -gt Processing options -gt Sort Scale and Merge tab (see below)
iMosflm Tutorial
fileUsersandrewg4MOSFLMnewgui_tutorialiMosflm_tutorial_720_ver3html[29052015 105311]
Caution The results can be ambiguous if run with a partial dataset Look in the logfile to see how many relfections are used totest each possible symmetry operator
11 Running Aimless to scale and merge the dataSelect the QuickScale button
This will first run POINTLESS then change the space group for the data to that selected by POINTLESS (unless the iMosflm symmetry isset to override POINTLESS) run AIMLESS to scale and merge the data in that space group and then run CTRUNCATE which calculates anumber of statistics from the intensity data The CCP4 UNIQUEIFY script will then be run which generates all the unique reflections forthat spacegroup to the resolution of the measured data and will flag reflections (5 by default but this can be changed) for use as theRfree set
AIMLESS can be run from the QuickScale button either treating anomalous data (the default) or ignoring anomalous data If onlyprocessing a few degrees of data it is usually better to ignore anomalous because especially for low symmetry cases no mergingstatistics may be given in AIMLESS
SCALA can be selected as an alternative to AIMLESS for scaling (not recommended)
There is limited control over running AIMLESS (see figure above) including re-setting resolution limits rejecting batches (images)changing the treatment for accepting partials changing the rejection criterion and changing the procedure for updating the standarddeviation estimates
iMosflm Tutorial
fileUsersandrewg4MOSFLMnewgui_tutorialiMosflm_tutorial_720_ver3html[29052015 105311]
The AIMLESS results will be displayed in the qtRView as shown below along with graphical output (see below) and the full log file canalso be examined
Aimless summary file
iMosflm Tutorial
fileUsersandrewg4MOSFLMnewgui_tutorialiMosflm_tutorial_720_ver3html[29052015 105311]
An example of the Aimless graphical output
The AIMLESS logfile can also be examined by selecting the Log File tab
12 History and mosflm log fileSelecting History allows the history of the session to be examined or by selecting the Log tab the full mosflmlp file can be viewed Themosflmlp file is also available in a time-stamped file mosflm_yyyymmdd_hhmmsslp (eg mosflm_20100518_131019lp) and can beread with a text editor
The History has a tree structure and will show when various parameters have been changed This has not been fully implemented and isnot generally useful
The logfile may provide useful clues when processing has failed
13 Warning MessagesAs already mentioned in Adding images sect3 and Integration sect9 warning messages are generated by MOSFLM during processing Atraffic light colour coding has now been assigned based on the warnings and is shown next to the Warnings box
A Red status implies a serious problem that will affect data quality and should be addressed
An Orange status implies minor issues that should be checked to see if things can be improved
A Green status means no significant problems messages are for information only
iMosflm Tutorial
fileUsersandrewg4MOSFLMnewgui_tutorialiMosflm_tutorial_720_ver3html[29052015 105311]
Abbreviated messages can be obtained by clicking on the Warnings icon The full warning Details together with Hints amp Notes text (ifany are available) can be obtained by double-clicking the relevant warning Details are displayed in a pop-up text box which willdisappear with the next click outside the box The same full details and suggestions are of course available in the mosflmlp files whereeven more information may be available
NOTE This is the end of the part of the tutorial which deals directly with iMosflm but see sect19 which has some suggestions forfurther work if you have time The remainder of this document deals with integrating and scaling data with MOSFLM andAimless via the CCP4i user interface examining the traditional mosflm SUMMARY file with the CCP4 utility loggraph
The Appendix contains a shell script for running MOSFLM as a traditional batch job
14 Useful command line optionsiMosflm has a number of command line options and these can be listed by typingimosflm --helpCurrent options are
--allimages -a ltfilenamegt Starts mosflm loading all files that match the template generated from ltfilenamegt--ccp4i2 Autosaves an iMosflm session file upon exit with an XML list of all iMosflm output files--debug -d Creates a large output file for debugging purposes Dont use this unless asked to by a developer--expert -e Permits access to advanced detector settings This should not normally be required--fastload -f Attempt to speed loading of many images offline while indexing two default images separated by 90 degrees--help -h Displays this message then exits--imagedir -I ltdirectorygt Starts the image browser in this directory if ltdirectorygt is given as an environment variable it will be expanded to its full value--init -i ltfilenamegt Starts Mosflm and reads from the given saved session file--startdir -S ltdirectorygt Starts mosflm in directory ltstartdirgt rather than the current directory This will only work if the directory exists and you have write permission to it otherwise iMosflm will exit All the normal mosflm output files will be in this directory--singleimage -s ltfilenamegt Starts mosflm loading only the image from ltfilenamegt--site -X ltfilenamegt Reads anyall of the following lines from the file given WAVELENGTH ltxgt DISPERSION ltxgt POLARISATION [PINHOLE | MIRRORS | MONOCHROMATOR | SYNCHROTRON ltxgt] DIVERGENCE ltxh xvgt BEAM ltbeamx beamygt DISTANCE ltxgt DISTORTION TILT ltxgt DISTORTION TWIST ltxgt GAIN ltxgt DETECTOR REVERSEPHI DETECTOR OMEGA ltxgt--version -v Displays the program version and required Mosflm version then exits
These can be abbreviated to the shortest unambiguous string
141 The site fileimosflm --site ltsitefilegt will read keywords from the file ltsitefilegt that will overwrite incorrect information in image headers Thissaves having to manually correct values in every iMosflm session The site file can also be read or written as an option from the Sessionmenu (see Drop down menus sect21) Allowed keywords areWAVELENGTH ltxgt
iMosflm Tutorial
fileUsersandrewg4MOSFLMnewgui_tutorialiMosflm_tutorial_720_ver3html[29052015 105311]
DISPERSION ltxgtPOLARISATION [PINHOLE | MIRRORS | MONO | SYNCHROTRON ltxgt]DIVERGENCE ltxh xvgtBEAM ltbeamx beamygtDISTANCE ltxgtDISTORTION TILT ltxgtDISTORTION TWIST ltxgtGAIN ltxgtDETECTOR REVERSEPHIDETECTOR OMEGA ltxgt
15 The mosflm SUMMARY fileMOSFLM produces a summary file listing refined parameters for each image and when using iMosflm this file will be date- amp time-stamped and have a name such as mosflm_20100518_131019sum This contains the same information as the plots produced by theiMOSFLM GUI which now also include the number of bad spots and overloads
This can be inspected graphically from the CCP4i GUI using the program loggraph Select the pull down menu View Files from Job andunder Output files select Additional log graphs where the _SUMMARYloggraph file will be listed Select this file to display its tablesin loggraph
This is very useful to identify rogue images (with unusually high positional residual or low Iσ(I)) If you find any read that image intoMOSFLM and see what is wrong with it
If you have done more than one integration run during your MOSFLM session you will find multiple entries of the tables Look at the lastset for integration of the 84 images
Click on the Refined detector parameter tables and check on the stability of parameters like the TILT and TWIST of the detector (unitsare hundredths of a degree) and for Mar Research (or DIP) image plate data the distortion parameters ROFF and TOFF (units are mm) Ifthey are varying a lot (more than 20 for TWISTTILT) or 015 for ROFFTOFF then it is probably a good idea to fix these parameters atthe average value (or the known values for this detector if they are available) (see Detector parameters sect821)
Click on the Post refinement table and check the missets It does not matter if they change slowly and by an amount (per image) that isless than 01mosaic spread If they are changing more than this then there could be a problem with processing the data (there is notmuch you can do about this)
Check how the mosaic spread is changing If it is unstable or if you think it is not refining to sensible values (as judged by looking atthe prediction) then you can fix the input value in the same way as the detector parameters (see Crystal parameters sect822)
BADSPOTS AND OVERLOADS
The program will set a rejection flag for those reflections that fail certain tests for example too much variation in the background levela poor profile fit an intensity that is very negative (more than 5 standard deviations) a very high gradient for the background planeThese reflections are called Bad spots and they are listed individually for each image in the mosflmlp file together with the reason forflagging them The number of bad spots is also written to the summary file Generally there should be very few (5-10) bad spots oneach image If there are more it could be because the backstop shadow is not correctly allowed for (consider using the NULLPIXkeyword)
There should also be very few overloaded reflections on each image If there are a lot then a separate low resolution data collectionpass should be made with a much shorter exposure time
IMPORTANT Both Bad spots and Overloads are written to the output MTZ file but will be rejected by default by AIMLESS Theintensity of overloaded reflections is estimated by profile fitting that part of the spot that is not saturated To include these reflections inthe final merged data use the ACCEPT keyword in AIMLESS
16 Scaling data with CCP4i ccp4i
Select Directories amp ProjectDir (top right)
In the new window select Add project
Enter the project name in the Project field and the full directory path in the uses directory field Default values may have been enteredalready here Select this project from Project for this session
Select Apply and Exit Dismiss the warning message that comes up
Select Data reduction from the pull down menu of modules (orange bar at top left)
iMosflm Tutorial
fileUsersandrewg4MOSFLMnewgui_tutorialiMosflm_tutorial_720_ver3html[29052015 105311]
Select Symmetry Scale Merge (Aimless)
In the window that appears do the following
Give a job title (top line)
Click on the box next to Separate anomalous pairs for outlier rejection amp merging statistics (the crystals have been soaked in a mercurycompound)
In the next orange bar (line starts HKLIN 1) select Browse and select the MTZ file output by MOSFLM (probably called hg_001mtz)Select OK
If you did not supply the Project name Crystal name or Dataset name to Mosflm fill in the boxes for these now
Under Scaling Protocol
From the pull-down menu on the line starting Scale select with automatic default settings
At the bottom of window from the pull-down menu named Run select RunampView Com File
This will display a new window showing the command file for running the POINTLESS step select Continue After a brief pause it willshow the command file for running AIMLESS (This can be edited before submitting the job) Select Continue
In the main window it will show that the AIMLESS job is running
When AIMLESS has finished the command file for running the CTRUNCATE step will appearselect Continue
When CTRUNCATE has run the main window will say FINISHED
At that point select the pull-down menu View Files from Job and select View Log Graphs This will give you the same graphs asrunning loggraph on the AIMLESS log file they are also the same as those that appeared in IMOSFLMs QuickScale task To look at thelog file itself (eg the overall merging statistics) select View Log File and it will appear in a new window
161 Looking at the AIMLESS output
The simplest way to look at the output from AIMLESS is to use loggraph on the AIMLESS log file (or via the CCP4i GUI) This can displaymany different graphs
Use Scales vs rotation range to check for smooth variation in the scale factor Check the variation in B factor with image and if there isno real variation it is best to turn off the B-factor refinement
Use the Analysis against all Batches for all runs to detect bad images (high R-factor large number of rejected spots)
Check the Analysis against resolution Fractional bias to see if there is any indication of Partial bias (A negative partial bias will resultif the mosaic spread is underestimated or if there is a lot of diffuse scatter
The Fractional bias should be less than 1-2 although it will often exceed this for weak data (eg in the high resolution bins)
The Axial reflections graphs in AIMLESS are useful for detecting systematic absences which can be used to identify the true spacegroup However the detection of screw axes is thought to be sufficiently robust in POINTLESS that these graphs are no longer necessary
It can also be useful to look at the AIMLESS log file itself in particular the table giving statistics as a function of resolution The effectiveresolution limit of the data can be estimated by looking at the Mn(I)sd column (this is the mean Iσ(I) AFTER merging symmetry matesand is the best indicator of data quality) This table also shows shell and cumulative R-factors
The Mn(I)sd values depend on having realistic values of the standard deviations (errors) in the intensities As the values that come fromMOSFLM are always underestimates of the true error these values are scaled up in AIMLESS using a three-term correction
sdcorrected = SdFac Sqrt[sd(I)2 + SdBLPI + (SdAddI)2]
Here SdFac is an overall scale factor and SdB and SdAdd are intensity dependent factors
AIMLESS will automatically work out a suitable value for all three parameters in order to make the mean value of (observedscatter)(sdestimate) equal to 10 where observed scatter is the difference between an individual estimate of intensity and the mean ofall other estimates (from symmetry mates)
Probably the best estimate of the true high resolution limit of the data can be obtained from the CC(12) values these are thecorrelations between equivalent observations that have been divided randomly into two half-datasets The resolution limit is foundwhen the CC drops below ~ 05 - 03
This table comes under the heading
ANALYSIS OF STANDARD DEVIATIONS
iMosflm Tutorial
fileUsersandrewg4MOSFLMnewgui_tutorialiMosflm_tutorial_720_ver3html[29052015 105311]
in the AIMLESS log file and Run n standard deviation v Intensity test (where n is 1 or more) in the CCP4i GUI View Files from Job -View Log Graphs display
Can you identify a bad image in this dataset Can you work out why it is bad
(Cluethe image headers contain quite a lot of information that is not used by MOSFLM including the date and time that the image wascollected)
You can exclude a given batch from the scaling using the EXCLUDE keyword
RUN ALL EXCLUDE imagenumber
In this case run number will be 1
Rerun the scaling SENDING THE OUTPUT TO A NEW LOGFILE excluding this image and see the effect on the heights in the anomalousPatterson (in the log file) DO NOT repeat the integration In the command file uncomment the line (near the top) goto aimless so itskips the integration part
In the CCP4i GUI click to highlight the AIMLESS job which is listed as FINISHED and select ldquoReRun Jobrdquo from the control buttons downthe right-hand side of the main interface window Under ldquoExcluded Datardquo in the window that appears check the box next to Excludeselected batches and pull-down on the menu button to exclude a range Give the start amp end range to exclude (eg 74 to 74) Rerunthe job as before
17 Changing the symmetryFrom the list of options at the left hand side of the main window select ldquoUtilitiesrdquo and under that SortModifyCombine MTZ Files
In the new window give a new title eg reindex as H32
Click on the Box Change space group andor reindex reflections
Use the browse option to select the input MTZ file (First orange bar) the output filename will be generated automatically (but you canchange it)
Under Reindex details
In the last option check the box next to ldquoChange space group tordquo and enter H32 in the box This is above the final item Reducereflections to the asymmetric unit which is checked by default
Select Run from the Run option button
Then go back to the scaling window and select the new MTZ file (reindexed) as the input for scaling (use Browse) CHANGE THE JOBTITLE
Then select RUN
The scaling will now be performed in space group H32 Look at the merging statistics in the log file in particular the multiplicityweighted R-factor called Rmeas in the log file
18 Looking at the CTRUNCATE outputThe CTRUNCATE program converts intensities to amplitudes and also compiles some useful statistics The LTEST and the cumulativeintensity statistics tabulated by CTRUNCATE (and plotted by loggraph) provide the only point at which you will be able to detectmerohedral twinning (when the two lattices of the twin components exactly overlap and every measured intensity is actually the sum oftwo intensities)
For a good dataset the observed distribution should be within 1 of the theoretical distribution Is this the case for this data
19 If you have time 191 Different mosaic spreads
Try repeating the processing with the mosaic spread set to a value 25 smaller than the refined one and fix it by checking the Fix boxin the Integration window in iMosflm
Can you tell from the merging statistics if this data is better
192 Checking up on outliers
iMosflm Tutorial
fileUsersandrewg4MOSFLMnewgui_tutorialiMosflm_tutorial_720_ver3html[29052015 105311]
AIMLESS writes a file called ROGUES which lists reflections which show very poor agreement between symmetry mates or which areimplausibly large
Look in this file (it is ASCII) and try to work out why this has happened The ROGUES file gives you the image (Batch) on which thereflections have been recorded (for partials this is the image nearest the centre of the reflection so you may need to look on thepreceding and following image as well) Select a reflection which shows very poor agreement with its symmetry mates (A value greaterthan 10 in the DelIsd column in the ROGUES file)
Select the offending image by double-clicking it in the Images pane of the iMosflm main window Predict the reflections then enter thehkl values into the boxes and hit Return (or click the red warning button following the entry box for l) to locate the offending reflectionin the image You must give the measured indices - the first set of values in the ROGUES file - when doing this See if there is anythingodd about the spot Remember to check adjacent images for partials
193 How accurate does the unit cell have to be
Try changing the cell parameters by (say) 10 and integrate the images again What is the effect on the merging statistics
20 Tips1 When reading images into a session DO NOT attempt to carry out any other task until ALL the images have been read2 It is often worth repeating the indexing (usually only once) as the refined direct beam coordinates from the first indexing may give
an improved solution when the indexing is repeated (lower rmsd)3 Always integrate a few degrees of data before integrating the whole dataset (see sect9) If the space group is not known in advance
run Quicksymm with a few degrees of data to check that the correct indexing solution has been chosen4 For difficult images do not attempt to refine the unit cell initially once an indexing solution has been obtained try integrating a
few images to ensure that the integration is stable If then going on to refine the cell check that the prediction looks OK for thefirst image of every segment included in the refinement If it does not look very good consider using the pattern matching(Settings -gt Processing options -gt Advanced refinement see sect84)
5 If the resolution of the data is less than 35 Aring do not use the ldquoRefine Cellrdquo task Instead use several images in indexing and use thecell that comes from the indexing
6 If iMosflm gets into a state where the activity icon(upper right) is spinning but nothing seems to be happening click on the activityicon to stop it spinning and see if the session can be continued DO NOT click on the activity icon simply to abort a task this willgive unpredictable results Use the Abort button for cell refinement or integration There is no defined way to abort indexing
7 Use the image summation option (see sect4) to get a better impression of the diffraction for very low exposure Pilatus images8 Use image summation for detector parameter refinement for fine sliced very weak Pilatus images (Settings -gt Processing options -
gt Advanced refinement see sect821)9 For large mosaic spread values (gt 10deg) or small mosaic block sizes (lt10) consider increasing the maximum allowed reflection
width to avoid having too many green predicted reflections (Settings -gt Processing options -gt Advanced integration see sect97)10 By default on selecting the Indexing task iMosflm will find spots index and (assuming a solution has been found) estimate the
mosaicity For difficult cases it is more useful to restrict this to simply finding spots and then do the indexing and mosaicityestimation by clicking the appropriate buttons To do this change the check box Automatically index after spot finding inSettings -gt Processing options -gt Indexing
11 See sect521 and sect522 for advice if the indexing fails Also consider the possibility of a reversed phi rotation direction if you arenot familiar with the beamline (Settings -gt Experiment settings -gt Experiment see sect21)
12 If the detector parameters have refined to physically unreasonable values (eg because cell refinement or integration has beencarried out using an incorrect indexing solution) be sure to reset the detector parameters before attempting further processing(Settings -gt Experiment settings -gt Detector see sect21)
13 Always set the resolution limit slightly beyond the point at which any spots are visible (see sect414 ) For very weak fine-sliceddata it can be very difficult to estimate the resolution visually so integrate to the maximum resolution (inscribed circle) and usethe merging results to set the final resolution There should be no problems integrating to a resolution ~03-05 Aring beyond theactual resolution limit but for example integrating to 3 Aring when the true resolution limit is 5-6 Aring may cause problems and theintegration should then be repeated with a more realistic resolution limit
14 Use the site file sect141 if repeatedly processing data where the direct beam position is wrong or if the phi direction is reversed etcto save having to correct this for every session
Appendix IA command script for running MOSFLM using the keywords copied from the Batch processing window of the new GUI (see Integratingas a background job sect952) Note that keyworded input for MOSFLM and other CCP4 programs is case-insensitive apart from file anddirectory names
bincsh -fv Set a unique identifier for filenames for this job
set ident = x89_mos07_blk3_smallsep
iMosflm Tutorial
fileUsersandrewg4MOSFLMnewgui_tutorialiMosflm_tutorial_720_ver3html[29052015 105311]
$ipmosflm COORDS $identcoords SUMMARY $identsummary ltlt eof-ip Insert keywords copied from iMosflm batch window here
Keywords for this run For example could involve trying different values for mosaic spread or not integrating all images etc etchklout $identmtzgenfile $identgenprocess 1 1000 goeof-ip
pointlesspointless hklin $identmtz hklout $ident_pointlessmtz
aimlessaimless hklin $ident_pointlessmtz hklout $ident_aimless_partmtz ROGUES $identrogues ltlt eof-aimless Use all default options for aimlesseof-aimless
ctruncate hklin $ident_aimlessmtz hklout $ident_truncatemtz
Harry Powell Andrew Leslie and Owen Johnson
iMosflm Tutorial
fileUsersandrewg4MOSFLMnewgui_tutorialiMosflm_tutorial_720_ver3html[29052015 105311]
2 Use the Pick first image icon (single blue circle)
3 Use the Pick two images ~90 apart icon (two blue circles) This is the default behaviour
4 Use the Select images icon (multiple circles) If selected all images in the sector are displayed in a drop-down list Click on aimage to select it then double-click on the search icon (resembling a target in the colum headed Find) for that image to run thespot search The image will move to the top of the list (together with other images that have been searched)
Images to be used for indexing can be selected from those that have been searched by clicking on the Use button If this box waspreviously checked then clicking will remove this image from those to be used for indexing It can be added again by clicking theSelect images icon and clicking on the Use box
Before indexing always check by looking at the image display that the spot finding has worked correctly ie that most spots thatyou can see have been found that multiple crosses have not been drawn over the same spot that spots have not been placedover ice rings or ice spots Check all images that will be used in indexing
511 If the spot finding has not worked well
Parameters affecting the spot search can be modified by selecting the Settings drop-down window and selecting Processing optionsThe resulting new window contains six tabs relating to Spot finding Indexing Processing Advanced refinement Advanced integrationand Sort Scale and Merge
The Spot finding tab allows the Search area Spot discrimination parameters Spot size parameters Minimum spot separation andMaximum peak separation within spots (to deal with split spots) to be reset It also allows the choice between a local backgrounddetermination (preferred) and a radial background determination The local background method also uses an improved procedure forrecognising closely spaced spots The only parameters commonly changed are
1 Minimum spot separation This should be the size (in mm) of an average spot (not a very strong spot) If there are badly split spotsthe spot finding may place two (or more) crosses for a single diffraction spot To avoid this happening set the minimumseparation in X and Y to values equal to the spot size in mm This can be found by zooming the image and counting the number ofpixels across the spot horizontally (X) and vertically (Y) To convert this to mm use the pixel size as given in Settings -gtExperiment settings -gt Detector This separation parameter is very important when spots are very close but usually the programwill determine a suitable value
2 Minimum pixels per spot Default value 6 but this should be reduced automatically if spots are very small (eg when using in situscreening and microfocus beam) If there clearly are spots present and the spot size is very small try reducing this parameter to 3or 2
3 Local background box size Reducing this from 50 to (say) 20 can reduce the number of false spots found near any sharp shadowon the image (or tile boundaries for tiled detectors) Normally these false spots are weak (and will be drawn as yellow crosses) inwhich case they will not affect the indexing
For data collected in-house the spots can be quite large and rather weak In such cases the spot finding parameters are automaticallychanged but some improvement may still be obtained by the following
1 Reduce the spot finding threshold (default 35) eg to 2
2 Change the minimum number of pixels per spot (default 30) to 20 or 40
3 Set the minimum spot separation to a sensible value eg 15mm see above
52 Indexing
Providing there are no errors during spot finding indexing will be carried out automatically after spot finding (This is controlled by theAutomatically index after spot finding tick box in the Indexing tab of Processing options) If the image selection or indexingparameters are changed the Index button must be used to carry out the indexing
iMosflm Tutorial
fileUsersandrewg4MOSFLMnewgui_tutorialiMosflm_tutorial_720_ver3html[29052015 105311]
Autoindexing will be carried out by MOSFLM using spots (above the threshold) from the selected images The threshold is set byMOSFLM but can be changed using the entry box in the toolbar The list of solutions sorted by increasing penalty score will appear inthe lower part of the window The preferred solution will be highlighted in blue There will usually be a set of solutions with lowpenalties (0-20) followed by other solutions with significantly higher penalties The preferred solution is that with the highest symmetryfrom the group with low penalty values
Note that all these solutions are really the same P1 solution transformed to the 44 characteristic lattices with lattice symmetryconstraints applied Therefore if the P1 solution is wrong then all the others are wrong as well
For solutions with a penalty less than 50 the refined cell parameters (ref) will be shown This can be expanded (click on the + sign) toshow the reg unrefined but regularised cell (symmetry constraints applied) and the raw cell (no symmetry constraints applied)
The rms deviation (rmsd) or error in predicted spots positions (σ(xy) in mm) and the number of spots used to refine the solution aregiven for each solution
Usually the penalty will be less than 20 for the correct solution although it could be higher if there is an error in the direct beamcoordinates (or distancewavelength) The rmsd (error in spot positions) will typically be 01-02mm for a correct solution but if thespots are split or very elongated it can be as high as 1mm or higher
The predicted spot positions for the highlighted solution will be shown on the image display with the following default colour codes
Blue Fully recorded reflectionYellow (orange for Pilatus) Partially recorded reflection
iMosflm Tutorial
fileUsersandrewg4MOSFLMnewgui_tutorialiMosflm_tutorial_720_ver3html[29052015 105311]
Red Spatially overlapped reflection these will NOT be integratedGreen Reflection width too large (more than 5 degrees) not integrated
These colours may be adjusted via the Settings -gt Prediction colour item in the Image display window
Providing there are no errors in the indexing MOSFLM will automatically estimate the mosaic spread (mosaicity) based on the preferredsolution
Select other solutions with a higher penalty and see how well the predicted patterns match the diffraction image
The rmsd and visual inspection of the predicted pattern are the best ways of checking if a solution is correct If the agreement is notgood then the autoindexing has probably failed
It is often worth repeating the indexing (once) as the refined direct beam coordinates from the first indexing may give animproved solution (lower rmsd)
521 If the indexing fails - Direct beam search
The indexing is very sensitive to errors in the direct beam coordinates For a correct indexing solution the error should be less than halfthe minimum spot separation Check for example that the current direct beam position is behind the backstop If there are any icerings these can be used to determine the direct beam position (see Circle fitting sect416 )
If the accuracy of the direct beam coordinates (generally read from the image header) is uncertain the program can perform a gridsearch around the input coordinates The number and the size of the steps can be set from the Indexing tab of the Processing optionsmenu (see Settings - Processing options sect21) but defaults to two steps of 05mm on each side of the input coordinates The directbeam search is started by clicking on the Start beam search button in the Indexing pane While in progress it can be stopped byclicking the Abort beam search button
The indexing will be carried out for each set of starting coordinates (Beam x and Beam y in the table which appears) and if a solution isfound the refined beam coordinates (Beam x ref Beam y ref) the unit cell parameters of the triclinic solution and the rmsd error in spotcoordinates and in phi will be listed The correct solution will generally be the one with the smallest rms error in spot positions (σ(xy))To make it simpler to identify the correct solution once the grid search has finished the solutions will be sorted on σ(xy) so the correctsolution will be at the top of the list When sorting the solutions those which have smaller cell parameters will be listed first as it ispossible to have a small σ(xy) value for an incorrect solution with a much larger unit cell Beware of solutions at the top of the list wherethe cell is clearly too small (only happens rarely)
Note that only the triclinic (P1) solution will be listed
If there is now a solution with a smaller rmsd value than before and especially if more than one set of starting beam coordinates has thesame refined coordinates this is a good indication that the beam search has worked Note that if the initial beam coordinates werewrong by more than ~15mm the search may not work In this case either select a new starting position for the direct beam or changethe number of steps
To complete the indexing double-click on the chosen solution and the full indexing will carried out for these beam coordinates withthe solutions appearing in the upper window The results of the direct beam search can be hidden (collapsed) by clicking on the Hidebutton and recovered by clicking on the Show button
iMosflm Tutorial
fileUsersandrewg4MOSFLMnewgui_tutorialiMosflm_tutorial_720_ver3html[29052015 105311]
522 If the indexing fails - Other parameters
Errors in other physical parameters (wavelength crystal to detector distance) can also result in failure All these parameters should bechecked
Several parameters used in autoindexing can also be adjusted using entry fields and buttons that appear in the Indexing toolbar
Weak images
1 MOSFLM automatically reduces the Iσ(I) threshold for weak images and it may also reduce the resolution to 4Å but lower valuescan be tried It is important not to include spots that are not real - a small number of false spots can prevent the indexing fromworking
2 Try changing parameters for spot finding (see If the spot finding has not worked well sect511)
Multiple lattices
1 Try increasing the Iσ(I) threshold (default 20) for example to 40 or 60 so that only spots from the stronger lattice are selectedThis can be done by entering a new value in the leftmost of the circled icons above (and also via the Indexing tab of Processingoptions)
All cases
1 Include more images in the indexing Select images that are widely spaced in phi not close together2 Select images that show the clearest lunes andor have the best spot shape3 In case the crystal orientation has changed or if you are unsure of the direction of positive rotation in phi try indexing using only
one image4 Make sure that the Max cell edge value is not too small If in doubt set to 200 Aring (or more if the cell is expected to be large)5 If the cell parameters are known reduce the maximum allowed cell edge to the known maximum cell edge This can sometimes
help filter incorrect solutions but use with caution as often this needs to be ~twice the largest cell for successful indexingAlternatively try the known cell option
6 If the detector distance is uncertain and the images are high resolution (eg 2Å) allow the detector distance to refine during cellrefinement Use with caution
53 Indexing multiple lattices simultaneously
This is a new feature and is still undergoing development It is most likely to succeed when the different lattices are clearly separated atleast at higher resolution If the images shows badly split spots with several components (each arising from a sub-crystal with a slightlydifferent orientation) then indexing may well still be impossible
After spot finding examine the image to ensure that spots that are close to each other but belong to different lattices have beenidentified as separate spots and not treated as a single split spot (in which case the red cross will lie midway between the two spots)Adjusting the minimum spot separation (Settings -gt Processing options -gt Spot finding) can help in resolving close spots It may alsohelp to increase the inner radius of the spot search region (see Spot search area sect413) so that low resolution reflections where the
iMosflm Tutorial
fileUsersandrewg4MOSFLMnewgui_tutorialiMosflm_tutorial_720_ver3html[29052015 105311]
spots are not really separated are excluded from the search
The following procedure usually provides the best chance of success
1 Select appropriate images for use in indexing The separation of the lattices can be clearer on some images than others Ideallychoose several images widely separated in phi
2 Do a normal (single lattice) indexing first This will usually work but will give a high positional rmsd because of the presence of morethan one lattice This step is important because it will result in more accurate direct beam coordinates which are crucial for multi-lattice indexing
3 Select the ldquoIndex multiple latticesrdquo icon (next to the Index button) the Index button will change to Index multiple
The indexing results for different lattices will be presented in different tabs while the selected solution for each lattice will be shown inthe lower Summary window Currently a maximum of 5 lattices can be handled The figure below shows a case where 3 differentlattices were found
4 Judge the success of indexing by examining the lattice type and the cell parameters obtained for the different lattices (the cellsshould be very similar) and checking that the predictions match the observed spots The rmsd values for correct lattices should also besignificantly smaller than the value obtained in the initial (single lattice) indexing It may be necessary to manually select a differentautoindexing solution for some lattices in order to get the same lattice type (eg oP) for the different lattices
The Split column in the lower pane indicates the angle between the reference lattice (with value -) and the other lattices This is onlycalculated when the lattices have the same lattice type In this case the angles between lattice 1 and lattices 2 amp 3 are 34 and 16degrees
If a lattice is clearly incorrect it can be deleted by highlighting that lattice (in the lower pane that summarises the results) and using theright mouse button to select ldquodeleterdquo
The predictions for different lattices can be displayed either by highlighting the lattice in the Summary window or by using the latticeselector in the image display pane
iMosflm Tutorial
fileUsersandrewg4MOSFLMnewgui_tutorialiMosflm_tutorial_720_ver3html[29052015 105311]
In the image display spots in different lattices that overlap with each other are shown in magenta Only the summed intensity will bemeasured for these reflections
The predictions for all lattices can be shown by selecting the ldquomerge latticesrdquo icon in the image display
This can be useful to check if all the lattices have been successfully indexed because all spots in the image should then be predicted Inthe display predictions from lattice 12345 are shown in blue yellow red green and magenta with no distinction made between fullyand partially recorded reflections or spatial overlaps
iMosflm Tutorial
fileUsersandrewg4MOSFLMnewgui_tutorialiMosflm_tutorial_720_ver3html[29052015 105311]
531 Practical Tips
Beware of solutions where the lattices only vary in orientation by a small angle (less than 1 degree) as these are often different solutionsfor the same lattice The difference in orientation between lattices is given by the ldquosplitrdquo column in the Summary window but this is onlycalculated if the lattices have the same lattice type Differences are all relative to one lattice which will display a split angle as ldquo-ldquo Tocalculate the angles relative to a different lattice open the tab for that lattice select a different solution to that currently selected andthen select the original solution ndash this will trigger recalculation of the split angles relative to that lattice
Other parameters that can influence the indexing are the rdquoMaximum deviation from integral hklrdquo (default 02 when indexing multiplelattices otherwise 03) and ldquoNumber of vectors to find for indexingrdquo (default 30) These can be changed via the Indexing tab of theldquoProcessing Optionsrdquo that can be selected from the ldquoSettingsrdquo menu item Values between 015 and 025 might be helpful for the firstparameter and increasing the number of vectors from 30 to 50 can also help At present there is no defined protocol for changing thedefault parameter values for particular cases it has to be done by trial and error
Experience so far has shown that selecting appropriate images and adjusting the maximum cell length used in indexing have the biggesteffect The optimum value for the maximum cell length will normally lie between one and three times the largest cell dimension but it isworth varying this in steps of between 25 and 50 Aring as the indexing can be very sensitive to this parameter
For a more complete discussion of multiple lattice indexing see Powell HR Johnson O amp Leslie AGW 2013 Autoindexingdiffraction images with iMosflm Acta Cryst D69 1195-1203
54 Known cell option
For images that are very difficult to index if the cell parameters are known the known cell option can be usedSelect the ldquoKnown cellrdquo icon (next to the Multiple lattices icon) Enter the cell parameters in the Input known cell pop-up window andselect OK when all 6 parameters have been provided Then select the Index Cell button
To revert to normal indexing select the ldquoKnown cellrdquo icon and then select Clear in the Input known cell pop-up window
55 Space group selection
Note that the indexing is based solely on information about the unit cell parameters It will therefore be very difficult (or impossible) todetermine the correct Laue group in the presence of pseudosymmetry For example a monoclinic space group with β ~ 90deg will appearto be orthorhombic an orthorhombic space group with very similar a and b cell parameters will appear to be tetragonal These can onlybe distinguished when intensities are available (ie after integration) by running POINTLESS (QuickSymm) (see Running Pointless to check the
iMosflm Tutorial
fileUsersandrewg4MOSFLMnewgui_tutorialiMosflm_tutorial_720_ver3html[29052015 105311]
symmetry sect10)
In addition it is not possible to distinguish between Laue Groups 4m and 4mmm 3 and 3m 6m and 6mmm m3 and m3m Thiswill not affect integration of the images but it will affect the strategy calculation In the absence of additional information the lowersymmetry should be chosen for the strategy calculation to ensure that a complete dataset is collected
The presence of screw axes also cannot be detected so there is no basis on which to distinguish P21 from P2 etc This does not affectany aspect of data collection or processing and can be chosen (on the basis of systematic absences) after integration by runningPOINTLESS
In this example there is no way of knowing at this stage if the space group is h3 or h32 so leave it as h3
56 Mosaicity estimation
If the Automatically index after spot finding option has been chosen (Indexingtab of Processing Options) the mosaicity (mosaic spread) will be estimatedautomatically for the preferred solution However if another solution is chosenthe mosaicity should be estimated again
Click on the Estimate button to estimate the mosaicity
A window will appear which plots the total predicted intensity as a function ofmosaic spread from which an estimate is determined
The predictions displayed on the image will be updated Entering different valuesof mosaic spread in the box (followed by return) will allow a visual estimate of theeffect of changing the mosaic spread
The mosaic spread can also be entered in the Images pane by clicking once on theMosaicity line and once again on the value displayed
561 The mosaic block size
In some cases the apparent mosaic spread is much larger at low resolution than at high resolution so that if it is set to a value thatresults in all the low resolution spots being predicted many more spots are predicted than are visible at high resolution This effect isbest dealt with by adjusting the Mosaic block size which is also displayed in the Images pane This is modelling the size in microns ofthe individual mosaic blocks in the crystal Decreasing this to values of 05-5 microns (say) from the default of 100 microns will resultin predicting more spots at low resolution but have virtually no effect at high resolution This parameter is not refined (at present) andso the best value must be determined by trial and error
6 Saving and recovering a sessionThe session can be saved at any time using the Session drop-down menu referred to in sect21 The first time that a session is saved youwill be prompted for a filename The filename convention for saved session files is that the extension is mos
Save the current session Then exit from iMosflm (using the Session drop-down menu) restart iMosflm and read in the saved session
If the program crashes it should be possible to recover all but the latest actions as a temporary copy of the session file is continuallysaved to the directory mosflm in the users home directory
Restart iMosflm and it will pop up a Recover session window
Selecting the Recover button will restore the session as far as possible
iMosflm Tutorial
fileUsersandrewg4MOSFLMnewgui_tutorialiMosflm_tutorial_720_ver3html[29052015 105311]
7 Data collection strategyOnce the crystal orientation and (probable) Laue group have been determined it is possible to calculate a data collection strategy andthe Strategy icon is no longer greyed-out (in fact all other operations Strategy Cell Refinement and Integration become possible at thispoint)
Select the Strategy icon This will open the Strategy window
The statistics initially presented in the window are based on the images read in to the current session If only two (or more) references
iMosflm Tutorial
fileUsersandrewg4MOSFLMnewgui_tutorialiMosflm_tutorial_720_ver3html[29052015 105311]
images have been read in no statistics will be presented
When the Strategy option is used after two initial images (typically 90deg apart in φ) have been collected a complete shaded segment willnot be shown in the lower part of the screen rather an empty circle will be shown with the matrix label beneath it Click the Auto-complete button and in the pop-up menu that appears select a rotation angle or sweep of data to collect - or leave the Rotationsetting as Auto for a calculation of maximum completeness for this crystal orientation Click on Ok and the completeness results willbe presented
The orientation of the crystal expressed as the angles between the abc unit cell axes and the XYZ coordinate frame is given X isalong the X-ray beam Z is the rotation axis A warning will be given if the unique axis is so close to the rotation axis that there will bemissing cusp data
71 Evaluating completeness manually
The completeness of any given segment of data can be determined manually using the circle at the bottom left of the window Click onthe red segment shown in this circle
This will result in small black boxes being drawn on the circumference at the start and end of the red sector
Use the LMB to click on the black box at 0 and drag this around the circle
When the LMB is released the statistics for that sector will be displayed The statistics are presented in two ways Near the top right ofthe window the overall completeness is shown as red circles for unique data and anomalous pairs The average multiplicity is givenbeneath these circles
More detailed statistics (such as completeness as a function of resolution) are given in a series of histograms that can be selected by adrop-down menu
72 Calculating a strategy automatically
Uncheck the Use checkbox at the right side of the hg_001 line listed in the sector list near the top of the Strategy pane This means
iMosflm Tutorial
fileUsersandrewg4MOSFLMnewgui_tutorialiMosflm_tutorial_720_ver3html[29052015 105311]
that the 84 images used thus far will not be included in the completeness calculation only the matrix derived from indexing them willbe used Select the Auto-complete button to calculate a strategy automatically
A strategy calculation data pop-up window will appear
If multiple matrices have been defined (for different sectors of data) then the appropriate one can be selected (if there is only one sectorthis has no effect)
The total φ rotation to be used is normally calculated by MOSFLM based on the Laue group and the crystal orientation (the Auto setting)However it is sometimes possible to achieve a high completeness with a significantly smaller total rotation (eg 60deg in two 30degsegments will typically give gt94 completeness for orthorhombic space groups) and this can sometimes be useful if radiation damage isa serious problem although when using hybrid pixel detectors it is better to use a very conservative exposure time and collect a wide φrotation
Total rotation angles of between 5deg and 90deg can be selected from the drop-down list The number of segments to be used can be setbetween 1 and 3
If the check box is checked data completeness will be calculated to optimize the proportion of anomalous data collected
THIS IS IMPORTANT The optimum strategy is often different when maximising completeness of the anomalous data
Choose the default values (Rotation Auto Segments 1) but check the anomalous data box then click on Ok Look at the variousstatistics presented as bar charts
In space group H3 if rotating around the c axis a total rotation of 120deg would be required to collect a complete dataset (ignoring anydata lost in the cusp) Because the c axis is 22deg away from the rotation axis in this case it is possible to collect very high completeness(for unique data) with a rotation much smaller than this
Try to find the minimum total rotation that will give a dataset that is gt95 complete for the unique data Now do the same butrequiring gt95 completeness for the anomalous data
SKIP OVER SECTION 73 IF DOING THE NORMAL TUTORIAL
73 Calculating a strategy using multiple crystals
The Strategy pane may also be used when due to radiation damage many crystals are required to collect a complete dataset
IMPORTANT This procedure will only work correctly for space groups where there is no indexing ambiguity For those spacegroups where there is an indexing ambiguity( see httpwwwccp4acukdisthtmlreindexinghtml for a complete list) it isnecessary to integrate images to determine whether different crystals have been indexed in the same way This is not achievablewithin the Strategy option at present
Suppose the first crystal has been indexed from the reference images
Enter the Strategy pane an empty circle is displayed in the bottom part of the screen and click on the Auto-complete button nearthe top-right of the pane In the Auto-complete window that appears choose a suitable Rotation angle for the amount of datathat can be collected from one crystal say 20 degrees for this example Leave Segments set to 1 and do not check Optimize foranomalous data
Click the Ok button and the completeness of the data will be displayed The matrix name start and end phi values and the phiextent will be displayed in the top area of the pane with a checkbox ticked under the Use column This means this segment will beused in further strategy calculations
Accept and save this result by clicking on the yellow hatched segment displayed in the large circle near the bottom of the paneClick once and the segment will be outlined in black (you can adjust the start or end phi value calculated in one degree incrementsby click+dragging the respective black square) click again this time on the black square denoting the start or end phi (or release ifyou have adjusted by click+dragging) and the segment will turn red The segment will not be saved unless it has turned red
This result will be saved if you leave this pane (eg to load more images) and return later in this session The strategy file can alsobe saved to a permanent file using the Save button on the tool-bar This is highly recommended when working with many crystals
Return to the Strategy pane when you have loaded and indexed the reference image(s) from the second crystal and repeat the procedureabove You will see the calculated segment from the first matrix displayed at the bottom-left of the screen The optimum phi range for
iMosflm Tutorial
fileUsersandrewg4MOSFLMnewgui_tutorialiMosflm_tutorial_720_ver3html[29052015 105311]
the second crystal will be displayed Save this in the same way as for the first crystal (clicking twice) Repeat this procedure for anysubsequent crystals and in each case the optimum phi range will be calculated for the latest crystal taking into account the data fromprevious crystals
It is a good idea to save the strategy to a file as each new crystal is added in case the program crashes and this information is lost
In practice it is probably safest to have a separate iMosflm session that is reserved for the strategy calculations and not used to processany data The strategy for each new crystal can be calculated as described above If there is a problem and the session is corrupted or ifiMosflm is closed down for any reason it is straightforward to restore the status of the session providing the strategy has been savedThe following steps should be taken
1 Read in the reference images for the latest crystal and index them
2 Select the Strategy pane
3 Read in the optimised strategy for all previous crystals using the ldquoAddrdquo button and giving the appropriate filename
4 Making sure that the circle for the latest crystal is highlighted in the lower left window click on lsquoAuto-completersquo and follow the stepsdescribed above
Advanced Usage
The startend phi values for each crystalmatrix can be updated This might be required if for example only 10 degrees of useful datawere collected from a particular crystal instead of the anticipated 20 degrees To change the phi values click either on the matrix namein the top pane or on the circle showing the segment of data in the lower left pane (these are highlighted in a blue box as the mousemoves over them) The corresponding segment will now be displayed in the larger circle Click on the red segment so that a blacksquare appears at the startend phi values Then simply drag the appropriate phi to the desired value The completeness willautomatically be updated (but the strategy calculation for the latest crystal will not be repeated to do this the current segment must bedeleted by highlighting the matrix name and using right click and then repeating the Auto-complete step)
If matrix files saved from iMosflm are available from crystals for which data have been collected in previous sessions these can beadded into the calculation using the Add matrix button on the tool-bar
If the saved strategy result has become complicated or is incorrect and you wish to restart the calculations afresh there is a tool-barbutton Reload sectors from session This will remove any calculated sectors while leaving any known matrices listed at the bottom-leftof the Strategy pane
If you have saved a strategy file from a previous session this can be used to re-initialize the Strategy pane using the Load button onthe tool-bar
A Spacegroup pull-down menu has been added to the tool-bar to permit different choices of space group to be used in thecalculations (eg H3 and H32) This menu is populated from the list offered on the Indexing pane However the space group symboltext is editable Any space group symbol entered will be validated by Mosflm together with the current cell parameters
As a calculator for a multi-segment strategy the Strategy pane is reasonably flexible you can Save or Delete highlighted matrix lines byright-clicking As you highlight different matrix lines the orientation of the crystal expressed as the angles between the abc unit cellaxes and the XYZ coordinate frame is re-displayed in the centre of the pane
The following screen shot shows the cumulative results in the Strategy pane after this procedure has been followed for four crystals(ignore the iMosflm version number)
iMosflm Tutorial
fileUsersandrewg4MOSFLMnewgui_tutorialiMosflm_tutorial_720_ver3html[29052015 105311]
731 Calculating a strategy when some data have already been collected and processed
This option is not yet implemented If data have already been processed (to give an MTZ file) but the images are not currently available (eg they were collected on a previoussynchrotron trip possibly at a different synchrotron) then the MTZ file containing this data can be read and used to calculate a strategyfor data collection from new crystalsThe MTZ icon in the tool bar is used to read the MTZ file
74 Calculating a suitable oscillation angle
To calculate the maximum possible oscillation angle while avoiding spatial overlaps click on the Check for overlaps button A pop-upwindow will appear from which the option to calculate the maximum oscillation angle (as a function of φ) or check how many overlapswill occur for different (user selected) oscillation angles The results are plotted in the same pane as the histograms for the strategycalculations Note that the overlap calculation is based on the current values for the mosaic spread and spot separation and can be verysensitive to these values Note also that these are maximum and not necessarily recommended oscillation angles
iMosflm Tutorial
fileUsersandrewg4MOSFLMnewgui_tutorialiMosflm_tutorial_720_ver3html[29052015 105311]
8 Cell refinementIt is important to determine the cell parameters accurately before integrating the images Although the unit cell is refined as part of theautoindexing providing the diffraction extends beyond ~35Å resolution it is possible to obtain more accurate cell parameters using aprocedure known as post-refinement This procedure requires the integration of a series of images in ideally two or more separatesegments at widely different φ values The distribution of the intensity of partially recorded reflections over the images on which theyoccur is used to refine the unit cell crystal orientation and mosaic spread
Select the Cell Refinement icon
81 Selecting the images
iMosflm Tutorial
fileUsersandrewg4MOSFLMnewgui_tutorialiMosflm_tutorial_720_ver3html[29052015 105311]
There are several ways to select the images to be used in cell refinement Whichever method is used the image numbers will bedisplayed in the Images entry field iMosflm will automatically select appropriate images but these can be changed
811 Manual selection
A list of images can simply be typed into this box An image series can be specified as n-m where n and m are the first and last imagesDifferent series must be separated by white space or comma
For orthorhombic or higher symmetries two segments should be given approximately 90deg apart in φ For monoclinic or triclinic datathree or four segments are best (eg φ = 04590135)
The number of images that should be included in each segment depends on the mosaic spread and oscillation angle A reasonablenumber is 2(mosaic spreadoscillation angle +1) MOSFLM will automatically select two or more segments as appropriate Note thatthere is a limit on the total number of images that can be used
812 Automatic selection
Selecting the Automatically select images icon will select a suitable set of images
813 Graphical selection (Not recommended)
Selecting this icon will give a new window
Images can be selected by clicking in the Use check-box in the list of images or by using the mouse to drag a selection of imagesfrom the sector displayed The other icons allow the sector to be zoomed in or out and the viewed area to be moved to make theselection easier The final two icons on the tool-bar switch the segment display to fit the display space as either a full circle or aquadrant This Image palette can be closed by clicking outside its area but will close after 60 seconds anyway
82 Integrating the images and refining the cell
Use one of the methods above to select images to use in cell refinement and click on the Process button Before starting cell refinementcheck that the prediction for the first image in each segment to be used is good The majority of the spot positions must be correctlypredicted for the first image in each segment or else the refinement will not work
The selected images will be integrated and following integration the cell parameters are refined Selectable refined detector parameters
iMosflm Tutorial
fileUsersandrewg4MOSFLMnewgui_tutorialiMosflm_tutorial_720_ver3html[29052015 105311]
will be plotted as will the changes in crystal orientation and (if selected) mosaic spread If the shift in cell parameters is greater than 25standard deviations another cycle of integration and cell refinement is carried out Typically two or three cycles are required forconvergence Note that the current program activity is shown in the bottom left-hand corner of the window in the status message area
The different windows are explained below Moving the mouse over any parameter or plotted graph point will give a full description ofit
821 The detector parameters window
The values of the refined detector parameters are displayed for each image as it is integratedThere is the option to fix any of the parameters during integration by checking the Fix box onthe right The positional residuals (overall central and weighted) are also listed
Any of these parameters can be selected for plotting on the graph that appears to the right ofthis box by simply clicking on that parameter (which is then highlighted in blue as shown herefor Beam x and Beam y)
Check the stability of the refined parameters by displaying the appropriate graphs To getsensible scaling of the graphs only parameters with similar numerical values should be plottedtogether
For weak images (ie few visible spots in the outer regions of the image) the tilt and twistmay not be well defined and might refine to large values (greater than one degree) Insuch cases these parameters should be fixed It is not generally recommended to fix any
iMosflm Tutorial
fileUsersandrewg4MOSFLMnewgui_tutorialiMosflm_tutorial_720_ver3html[29052015 105311]
other detector parameters
For very weak fine sliced images (Pilatus only) there is the option to sum images when findingsuitable spots for refinement see Settings -gt Processing Options -gt Advanced refinementwhich can in some cases make the refinement more stable
822 The crystal parameters window
The values of the refined crystal missetting angles φ(x) φ(y) φ(z) the unit cell parameters andmosaic spread for the current image are displayed in the table Selected parameters will beplotted as for the detector parameters Specific unit cell parameters can also be fixed
If more than one segment of data is being used for cell refinement it is not unusual to see achange in orientation of the crystal between the two segments
Observe how the crystal orientation is different for images in the two segments See how themosaic spread varies during refinement
823 The central spot profile
The average spot profile for the central region of the detector is plotted for eachimage This confirms that the spot prediction is good If the profile is not welldefined and central in the box or if the blue border for the peak region of the spot ismuch larger than the apparent spots size it suggests a problem with the integrationand the initial prediction should be checked In some cases it may be necessary toincrease or decrease the Profile Tolerance parameters to ensure that the blue boxfits the spot To do this select the Advanced integration tab of Processing optionsCheck the central spot profiles for the images used in the cell refinement
824 The summary window
This window presents a summary of how selected parameters have changed indifferent cycles of the cell refinement The behaviour of these parameters gives agood indication of whether the cell refinement has been successful
If the refinement has been successful the RMS residual should be lower for thefinal cycle than in previous cycles However errors in the cell can be compensatedquite well by changing the crystal to detector distance so the differences are notalways dramatic
The other parameters that can be plotted from the pull-down list are the detectordistance and the Pixel ratio (Yscale)
The detector distance should be the same for all images in the refinement If the original indexing was based on auto-indexing a singleimage (say the first) then the detector distance might change for images from the second segment to compensate for an error in theoriginal cell If the variation in distance for different images increases with the cycle number this indicates that the refinement is notstable
The Pixel ratio (Yscale) parameter may also show an initial variation for images in different segments because refining Yscale (whichshould be 10000 for all except Raxis II and Raxis HTC detectors) can compensate for errors in cell dimensions in the same way that thedistance can The final values (last cycle) should be very close to identical for all images and should also be very close to unity (to within00010)
Cell refinement can be unstable if the data do not extend to at least 35 Aring If it appears unstable use the cell derived from auto-indexing a series of images well spaced in φ instead
iMosflm Tutorial
fileUsersandrewg4MOSFLMnewgui_tutorialiMosflm_tutorial_720_ver3html[29052015 105311]
Examine the plots to see if the parameters are stable and correct (Yscale)
825 The final results
When refinement has converged (or after 5 cycles) the initial and final cell parameters and the estimated errors (std dev) are listed
If time is available make a note of the std dev values and repeat the cell refinement using a larger number of images in each segmentAre the standard deviations smaller when using more images
83 Refining cell parameters for multiple lattices
Providing the resolution is high enough (generally better than ~35-32 Aring) and not too many of the spots in the different lattices areoverlapped it is possible to refine the cell parameters for each lattice individually The lattice to be refined is selected from the Latticeselector
This selector will be grayed out when processing a single lattice
84 If the prediction for the first image of a segment is poor
In some cases depending on how the indexing has been carried out or if the diffraction is poor or there has been a large change incrystal orientation during the data collection the prediction for one or more of the segments (the first image) may be poor In suchcases the integration and hence the cell refinement may fail It may be possible to successfully process the images after an initialrefinement of the crystal orientation using a pattern matching algorithm To select this option got to the Advanced refinement tab ofProcessing options and select the tick box for Refine orientation of first image in any run by pattern matching and for Integrate allimages Then refine the cell in the usual way During integration the orientation will be refined for the first image of each segmentoutput for this additional refinement will be written to the logfile but is not shown in the GUI
9 IntegrationThe accurate cell parameters are now used in the integration Note that although the images are integrated during the cell refinementthe intensities are not saved and no MTZ file is generated at that stage
It is good practice to start by integrating a block of images corresponding to a few degrees of data to check that the parameters do notneed further adjustment MOSFLM will generate warning messages after integration if there are any difficulties and it may be possibleto improve the situation by changing some of the default parameters (see Warning messages sect13)
Before integration ensure that the backstop shadow has been defined (see Masked areas backstop sect411 and Masked areas generalsect412)
91 Image selection
Image selection is performed in exactly the same way as in the cell refinement In this case the Automatic selection will simply includeall images in the current sector
Select images 1-10
92 Setting the MTZ filename and controlling updating of the image display
Two icons appear when the integration option is chosen
If the Show predictions icon is clicked the display window will be updated as eachimage is processed This will slow down the processing but allows the accuracy of theprediction to be checked for each image
iMosflm Tutorial
fileUsersandrewg4MOSFLMnewgui_tutorialiMosflm_tutorial_720_ver3html[29052015 105311]
Click on this icon so that the display will be updatedThe filename of the MTZ file containing the results of the integration is generatedautomatically but can be edited manually
93 Integrating the images
Click on the Process button to start integration
Integration of the images occurs in two passes In the first pass for each block of images (a number corresponding to a few degrees ofdata selected automatically by MOSFLM) the detector and crystal parameters are refined for each image in turn and the measurementboxes for all predicted spots are written to a file for use in the second pass In the second pass the standard profiles are formed fromreflections present on all of the images in this block and each image is then integrated and the results written to the MTZ file Thedisplay is not updated during the second pass and will remain on the last image of the block (assuming image updating has beenselected)
Note that the unit cell dimensions are normally fixed during integration and only the crystal orientation and mosaic spread are refinedCrystal parameter refinement only starts when a sufficient number of images have been integrated to provide data for the post-refinement typically after ~05-1 degree (more for high mosaicity)
94 Parameter display windows
As described in sect82 the refined detector and crystal parameters will be displayed in tables and selected parameters will be plotted ingraphs The average spot profile for each image will also be displayed
The size of these graphs (and the profile) can be expanded to fill the whole window by holding down Shift and clicking LMB anywherein the graph window A second Shift+click will revert the graph to the original size
In addition to these windows there are windows that tabulate and plot (as a function of image number) the mean Iσ(I) for profile fittedand summation integration intensities The overall values and the values for the highest resolution bin are given
The number of overloaded reflections Bad spots (ie those that fail certain tests see mosflm SUMMARY file sect15) Spatial overlaps andif processing multi-lattice images the number of lattice overlaps is listed for each image and can be plotted by highlighting thatparameter When processing data from crystals with large unit cells it is important to watch out for spatial overlaps (see sect97 for tips onhow to reduce the number of spatial overlaps if this is a problem)
A display of the standard profiles for different regions of the detector is also provided Poor profiles are averaged by includingreflections from inner regions of the detector Averaged profiles are indicated by a red line around the spot (rather than blue) Theoriginal unaveraged profile can be viewed a clicking on the profile (providing there were sufficient spots in that region to allowformation of a profile)
The profiles should be checked to see that they are well defined and centred within the box Poorly-defined diffuse or non-centredprofiles may suggest that the prediction is not very good in which case this should be checked on the corresponding image(s)
It may be useful to expand the standard profiles to fill the window using Shift + click in the profiles window
Finally the lower left window plots Iσ(I) as a function of resolution for any selected image
iMosflm Tutorial
fileUsersandrewg4MOSFLMnewgui_tutorialiMosflm_tutorial_720_ver3html[29052015 105311]
Different parameters can be plotted by selecting the small right- or left-pointing arrows on the title line above the plot
95 Integrating the whole datasetAssuming that everything looks OK the entire dataset can now be integrated However it is strongly recommended thatProjectCrystalDataset names are assigned first These are written to the output MTZ file and used by downstream programs inparticular AIMLESS will use this information when deciding which images belong to the same dataset
Select Experiment settings from the Settings drop-down menu (see Drop down menus sect21) to enter these names and optionally givea title for the MTZ file
Select images 1-84 and click on Process
951 Parallel Integration Using multiple cores
An option is available on the pull-down menu (next to the Process button in the Integration task) which splits up the integration jobover available cores on the local machine All aspects are currently determined automatically at present user-configurable options willbe available in a later version The algorithm used is as follows
iMosflm determines the number of cores available on the local machineIf the number of cores (N) is greater than 2 iMosflm splits the integration run into N-1 batches (up to a maximum of 16) containingapproximately the same number of images If N le 2 iMosflm splits the run into N batches
If the total number of images in each batch is less than 32 the number of batches is decreased until this condition is satisfied
The first batch is submitted as a background task consisting of a refinement stage and an integration stage with its input and outputfiles (including the MTZ file) in a new directory its name being determined from the number of segments of data being integrated andthe lattice number (if the sample has been determined to contain multiple lattices) If the directories exist already they are all movedinto a newly-created directory with a time-stamped name the files from the most recent integration run are thus in directories withnames following the pattern described above Once the refinement stage is complete the refined parameters are written to a file
The launch of subsequent batches are delayed until the corresponding preceding batch has written its refined parameters This file isread and the new batch is launched again with a refinement stage and integration stage
At present the job cannot be aborted once it has started
952 Integrating as a background job
By selecting Batch in the drop-down menu adjacent to the Process button the integration can be run as a background job rather thaninteractively and the GUI can be used to look at a different dataset
Selecting Batch from the drop-down menu will display a new window showing the script that will be used to process the images alongwith a number of processing options The script can be edited if additional keywords are required or if some parameters are to bechanged and can also be copied and pasted into a file for off-line processing
By default the job is divided into batches across multiple cores as determined for the parallel integration described in sect951 but thenumber of cores can be chosen by the user from a drop-down menu in this case the size of each batch is determined by the interface
Plotting the results of the integration can be turned off this can make processing much faster
iMosflm Tutorial
fileUsersandrewg4MOSFLMnewgui_tutorialiMosflm_tutorial_720_ver3html[29052015 105311]
It is possible to configure job submission for remote machines (which can be added by depressing the add host button) Ensure youhave enabled passwordless logins for all the remote machines you enter and that you specify the full path to the Mosflm executable inthe Batch destinations window The remote working directory (in which the log and MTZ files are written) and the remote imagedirectory must both be specified with their full path names Any required parameter fields that are not completed by the user arehighlighted in orange if the user tries to submit a job without completing these fields a new window containing only those fields (againhighlighted in orange) pops up with a request to do so
The number of cores available on the selected host can be determined by depressing the apple core button on the Batch destinationsconfiguration window
The log file for batch submission jobs the MTZ and SUMMARY files are written to the directory in which iMosflm was launched
96 Checking the integration
iMosflm Tutorial
fileUsersandrewg4MOSFLMnewgui_tutorialiMosflm_tutorial_720_ver3html[29052015 105311]
The detector and crystal parameter plots should be examined carefully to check for any instability in the refinement If there are largeand random variations in some parameters (eg the detector twist and tilt) then it may be better to fix them and repeat the integration
For cases (eg very small unit cells) where there are very few suitable reflections on each image the refinement of the missetting anglesmay show significant variations from one image to the next In such cases it is best to apply smoothing to the missetting angles usingthe tick box in Settings -gt Processing options -gt Advanced Refinement
Discontinuities due to blank images should also show up and the offending images should be removed from the scaling run
If adjacent spots are incompletely resolved on the detector it may be possible to improve the processing by increasing the PROFILETOLERANCE parameters by 1-2 These parameters can be set in the Advanced integration tab of the Processing options menu (useSettings)
97 Advanced features for integration
The Settings -gt Processing options menu allows additional control over the integration Parameters such as the minimum spotseparation resolution limits excluded resolution ranges block size MTZ filename and BATCH ADD can be changed in the Processingtab
Manually decreasing the minimum spot separation can help if a large number of reflections are flagged as spatially overlapped (redboxes) The prediction must be updated to see the effect of changing the separation this can be done either by displaying the next orprevious image or double clicking on the blue circle next to the image currently displayed in the Images pane
In the Advanced integration tab the measurement box parameters profile tolerance and profile averaging parameters can be set
The measurement box parameters can be adjusted for rare cases where the estimation of the spot size has not worked correctlyresulting in a box that is too small or too large The optimisation of the background rim and corner cutoff parameters that determinewhich pixels are used for the background and which pixels for the peak can also be turned off but this is generally not recommended
Increasing the profile tolerance can help in cases where adjacent spots are not completely resolved this can be judged by examining thestandard profiles By default the profile tolerance is automatically increased if there are a large number of spatial overlaps as this hasthe effect of reducing the minimum spot separation A message will be written to the logfile if this has happened This option can beturned off using the tick box Optimise profile tolerance values to avoid spot overlap
The profile outlier exclusion parameters control the exclusion of ice spots or hot pixels which could otherwise corrupt the standardprofiles
Pixels with a value less than the Null pixel threshold are considered to belong to inactive regions of the detector
The pixel saturation value determines when a reflection is considered to be an overload The intensity of overloaded reflections isestimated by profile fitting but these reflections are rejected by the scaling program AIMLESS by default
Increasing the Maximum reflection width in φ from the default value of 5deg will reduce the number of rejected reflections (green boxes)and is worthwhile when the mosaicity is very high or the mosaic block size is very small As with the minimum spot separation theimage must be refreshed to see the effect of changing this parameter
The rejection criteria will reject reflections with too much variation in the background (BGRATIO) or where the gradient of thebackground plane is too large These should only be changed if many reflections are being rejected PKRATIO only applies to fullyrecorded reflections and reflects a very poor profile fit With current data collection protocols there will be very few (if any) fullyrecorded reflections
Additional MOSFLM parameters will be added based on user requests
98 Integrating multiple lattices
When multiple lattices have been successfully indexed each lattice can be integrated individually by selecting the appropriate latticenumber
Reflections in the chosen lattice that are overlapped by a reflection from another lattice will be integrated but the measurement box willbe expanded so that the total intensity of the two (or more) reflections is measured These reflections will be flagged for specialtreatment Reflections that are not overlapped are referred to as singletons They will be dealt with in the normal way by POINTLESSand AIMLESS
NOTE If more than one lattice has been indexed and the results of integrating just ONE of the lattices are to be checked byrunning QuickSymm or QuickScale then the multi-lattice icon in the Integration pane must be turned off otherwise an error
iMosflm Tutorial
fileUsersandrewg4MOSFLMnewgui_tutorialiMosflm_tutorial_720_ver3html[29052015 105311]
message will be given saying that all lattices must be integrated
It is often the case that by measuring both lattices (in separate integration runs) and inputting both MTZ files to QuickScale the overallcompleteness is high using ONLY the singletons To use this option ensure that the multi-lattice icon is off
To make use of the intensity estimates for overlapped reflections MTZ files for all lattices must be input to the program FECKLESSwhich will derive the best estimate of the summed intensity This is the default option if more than one lattice has been indexed and itrequires that all lattices have been integrated (in separate runs) prior to running QuickSymm or QuickScale (FECKLESS will be runautomatically)
At this time no downstream programs can make use of the summed intensities of overlapping reflections but in the future it should bepossible to use this data in REFMAC
Currently it is recommended to use only singletons from all the lattices FECKLESS is not required in this case
The MTZ filename is automatically updated to reflect which lattice has been chosen to avoid overwriting the MTZ file of the first latticewhen integrating the second one FECKLESS when run from iMosflm relies on this naming convention so do not change it
10 Running Pointless to check the symmetryOnce the images have been integrated (even a few degrees of data in many cases) the program POINTLESS can be run to determine thetrue Laue symmetry and try to determine the space group using the QuickSymm button
iMosflm Tutorial
fileUsersandrewg4MOSFLMnewgui_tutorialiMosflm_tutorial_720_ver3html[29052015 105311]
Select the QuickSymm button
A summary of the Pointless results as shown below will appear in a qtRView window
Various graphs (L test for twinning ViewHKL to view the reciprocal lattice) can also be viewed in this window
Various options for POINTLESS such as a reference MTZ file forcing the symmetry selected in iMosflm and specifying multiple input MTZfiles can be selected from the Settings -gt Processing options -gt Sort Scale and Merge tab (see below)
iMosflm Tutorial
fileUsersandrewg4MOSFLMnewgui_tutorialiMosflm_tutorial_720_ver3html[29052015 105311]
Caution The results can be ambiguous if run with a partial dataset Look in the logfile to see how many relfections are used totest each possible symmetry operator
11 Running Aimless to scale and merge the dataSelect the QuickScale button
This will first run POINTLESS then change the space group for the data to that selected by POINTLESS (unless the iMosflm symmetry isset to override POINTLESS) run AIMLESS to scale and merge the data in that space group and then run CTRUNCATE which calculates anumber of statistics from the intensity data The CCP4 UNIQUEIFY script will then be run which generates all the unique reflections forthat spacegroup to the resolution of the measured data and will flag reflections (5 by default but this can be changed) for use as theRfree set
AIMLESS can be run from the QuickScale button either treating anomalous data (the default) or ignoring anomalous data If onlyprocessing a few degrees of data it is usually better to ignore anomalous because especially for low symmetry cases no mergingstatistics may be given in AIMLESS
SCALA can be selected as an alternative to AIMLESS for scaling (not recommended)
There is limited control over running AIMLESS (see figure above) including re-setting resolution limits rejecting batches (images)changing the treatment for accepting partials changing the rejection criterion and changing the procedure for updating the standarddeviation estimates
iMosflm Tutorial
fileUsersandrewg4MOSFLMnewgui_tutorialiMosflm_tutorial_720_ver3html[29052015 105311]
The AIMLESS results will be displayed in the qtRView as shown below along with graphical output (see below) and the full log file canalso be examined
Aimless summary file
iMosflm Tutorial
fileUsersandrewg4MOSFLMnewgui_tutorialiMosflm_tutorial_720_ver3html[29052015 105311]
An example of the Aimless graphical output
The AIMLESS logfile can also be examined by selecting the Log File tab
12 History and mosflm log fileSelecting History allows the history of the session to be examined or by selecting the Log tab the full mosflmlp file can be viewed Themosflmlp file is also available in a time-stamped file mosflm_yyyymmdd_hhmmsslp (eg mosflm_20100518_131019lp) and can beread with a text editor
The History has a tree structure and will show when various parameters have been changed This has not been fully implemented and isnot generally useful
The logfile may provide useful clues when processing has failed
13 Warning MessagesAs already mentioned in Adding images sect3 and Integration sect9 warning messages are generated by MOSFLM during processing Atraffic light colour coding has now been assigned based on the warnings and is shown next to the Warnings box
A Red status implies a serious problem that will affect data quality and should be addressed
An Orange status implies minor issues that should be checked to see if things can be improved
A Green status means no significant problems messages are for information only
iMosflm Tutorial
fileUsersandrewg4MOSFLMnewgui_tutorialiMosflm_tutorial_720_ver3html[29052015 105311]
Abbreviated messages can be obtained by clicking on the Warnings icon The full warning Details together with Hints amp Notes text (ifany are available) can be obtained by double-clicking the relevant warning Details are displayed in a pop-up text box which willdisappear with the next click outside the box The same full details and suggestions are of course available in the mosflmlp files whereeven more information may be available
NOTE This is the end of the part of the tutorial which deals directly with iMosflm but see sect19 which has some suggestions forfurther work if you have time The remainder of this document deals with integrating and scaling data with MOSFLM andAimless via the CCP4i user interface examining the traditional mosflm SUMMARY file with the CCP4 utility loggraph
The Appendix contains a shell script for running MOSFLM as a traditional batch job
14 Useful command line optionsiMosflm has a number of command line options and these can be listed by typingimosflm --helpCurrent options are
--allimages -a ltfilenamegt Starts mosflm loading all files that match the template generated from ltfilenamegt--ccp4i2 Autosaves an iMosflm session file upon exit with an XML list of all iMosflm output files--debug -d Creates a large output file for debugging purposes Dont use this unless asked to by a developer--expert -e Permits access to advanced detector settings This should not normally be required--fastload -f Attempt to speed loading of many images offline while indexing two default images separated by 90 degrees--help -h Displays this message then exits--imagedir -I ltdirectorygt Starts the image browser in this directory if ltdirectorygt is given as an environment variable it will be expanded to its full value--init -i ltfilenamegt Starts Mosflm and reads from the given saved session file--startdir -S ltdirectorygt Starts mosflm in directory ltstartdirgt rather than the current directory This will only work if the directory exists and you have write permission to it otherwise iMosflm will exit All the normal mosflm output files will be in this directory--singleimage -s ltfilenamegt Starts mosflm loading only the image from ltfilenamegt--site -X ltfilenamegt Reads anyall of the following lines from the file given WAVELENGTH ltxgt DISPERSION ltxgt POLARISATION [PINHOLE | MIRRORS | MONOCHROMATOR | SYNCHROTRON ltxgt] DIVERGENCE ltxh xvgt BEAM ltbeamx beamygt DISTANCE ltxgt DISTORTION TILT ltxgt DISTORTION TWIST ltxgt GAIN ltxgt DETECTOR REVERSEPHI DETECTOR OMEGA ltxgt--version -v Displays the program version and required Mosflm version then exits
These can be abbreviated to the shortest unambiguous string
141 The site fileimosflm --site ltsitefilegt will read keywords from the file ltsitefilegt that will overwrite incorrect information in image headers Thissaves having to manually correct values in every iMosflm session The site file can also be read or written as an option from the Sessionmenu (see Drop down menus sect21) Allowed keywords areWAVELENGTH ltxgt
iMosflm Tutorial
fileUsersandrewg4MOSFLMnewgui_tutorialiMosflm_tutorial_720_ver3html[29052015 105311]
DISPERSION ltxgtPOLARISATION [PINHOLE | MIRRORS | MONO | SYNCHROTRON ltxgt]DIVERGENCE ltxh xvgtBEAM ltbeamx beamygtDISTANCE ltxgtDISTORTION TILT ltxgtDISTORTION TWIST ltxgtGAIN ltxgtDETECTOR REVERSEPHIDETECTOR OMEGA ltxgt
15 The mosflm SUMMARY fileMOSFLM produces a summary file listing refined parameters for each image and when using iMosflm this file will be date- amp time-stamped and have a name such as mosflm_20100518_131019sum This contains the same information as the plots produced by theiMOSFLM GUI which now also include the number of bad spots and overloads
This can be inspected graphically from the CCP4i GUI using the program loggraph Select the pull down menu View Files from Job andunder Output files select Additional log graphs where the _SUMMARYloggraph file will be listed Select this file to display its tablesin loggraph
This is very useful to identify rogue images (with unusually high positional residual or low Iσ(I)) If you find any read that image intoMOSFLM and see what is wrong with it
If you have done more than one integration run during your MOSFLM session you will find multiple entries of the tables Look at the lastset for integration of the 84 images
Click on the Refined detector parameter tables and check on the stability of parameters like the TILT and TWIST of the detector (unitsare hundredths of a degree) and for Mar Research (or DIP) image plate data the distortion parameters ROFF and TOFF (units are mm) Ifthey are varying a lot (more than 20 for TWISTTILT) or 015 for ROFFTOFF then it is probably a good idea to fix these parameters atthe average value (or the known values for this detector if they are available) (see Detector parameters sect821)
Click on the Post refinement table and check the missets It does not matter if they change slowly and by an amount (per image) that isless than 01mosaic spread If they are changing more than this then there could be a problem with processing the data (there is notmuch you can do about this)
Check how the mosaic spread is changing If it is unstable or if you think it is not refining to sensible values (as judged by looking atthe prediction) then you can fix the input value in the same way as the detector parameters (see Crystal parameters sect822)
BADSPOTS AND OVERLOADS
The program will set a rejection flag for those reflections that fail certain tests for example too much variation in the background levela poor profile fit an intensity that is very negative (more than 5 standard deviations) a very high gradient for the background planeThese reflections are called Bad spots and they are listed individually for each image in the mosflmlp file together with the reason forflagging them The number of bad spots is also written to the summary file Generally there should be very few (5-10) bad spots oneach image If there are more it could be because the backstop shadow is not correctly allowed for (consider using the NULLPIXkeyword)
There should also be very few overloaded reflections on each image If there are a lot then a separate low resolution data collectionpass should be made with a much shorter exposure time
IMPORTANT Both Bad spots and Overloads are written to the output MTZ file but will be rejected by default by AIMLESS Theintensity of overloaded reflections is estimated by profile fitting that part of the spot that is not saturated To include these reflections inthe final merged data use the ACCEPT keyword in AIMLESS
16 Scaling data with CCP4i ccp4i
Select Directories amp ProjectDir (top right)
In the new window select Add project
Enter the project name in the Project field and the full directory path in the uses directory field Default values may have been enteredalready here Select this project from Project for this session
Select Apply and Exit Dismiss the warning message that comes up
Select Data reduction from the pull down menu of modules (orange bar at top left)
iMosflm Tutorial
fileUsersandrewg4MOSFLMnewgui_tutorialiMosflm_tutorial_720_ver3html[29052015 105311]
Select Symmetry Scale Merge (Aimless)
In the window that appears do the following
Give a job title (top line)
Click on the box next to Separate anomalous pairs for outlier rejection amp merging statistics (the crystals have been soaked in a mercurycompound)
In the next orange bar (line starts HKLIN 1) select Browse and select the MTZ file output by MOSFLM (probably called hg_001mtz)Select OK
If you did not supply the Project name Crystal name or Dataset name to Mosflm fill in the boxes for these now
Under Scaling Protocol
From the pull-down menu on the line starting Scale select with automatic default settings
At the bottom of window from the pull-down menu named Run select RunampView Com File
This will display a new window showing the command file for running the POINTLESS step select Continue After a brief pause it willshow the command file for running AIMLESS (This can be edited before submitting the job) Select Continue
In the main window it will show that the AIMLESS job is running
When AIMLESS has finished the command file for running the CTRUNCATE step will appearselect Continue
When CTRUNCATE has run the main window will say FINISHED
At that point select the pull-down menu View Files from Job and select View Log Graphs This will give you the same graphs asrunning loggraph on the AIMLESS log file they are also the same as those that appeared in IMOSFLMs QuickScale task To look at thelog file itself (eg the overall merging statistics) select View Log File and it will appear in a new window
161 Looking at the AIMLESS output
The simplest way to look at the output from AIMLESS is to use loggraph on the AIMLESS log file (or via the CCP4i GUI) This can displaymany different graphs
Use Scales vs rotation range to check for smooth variation in the scale factor Check the variation in B factor with image and if there isno real variation it is best to turn off the B-factor refinement
Use the Analysis against all Batches for all runs to detect bad images (high R-factor large number of rejected spots)
Check the Analysis against resolution Fractional bias to see if there is any indication of Partial bias (A negative partial bias will resultif the mosaic spread is underestimated or if there is a lot of diffuse scatter
The Fractional bias should be less than 1-2 although it will often exceed this for weak data (eg in the high resolution bins)
The Axial reflections graphs in AIMLESS are useful for detecting systematic absences which can be used to identify the true spacegroup However the detection of screw axes is thought to be sufficiently robust in POINTLESS that these graphs are no longer necessary
It can also be useful to look at the AIMLESS log file itself in particular the table giving statistics as a function of resolution The effectiveresolution limit of the data can be estimated by looking at the Mn(I)sd column (this is the mean Iσ(I) AFTER merging symmetry matesand is the best indicator of data quality) This table also shows shell and cumulative R-factors
The Mn(I)sd values depend on having realistic values of the standard deviations (errors) in the intensities As the values that come fromMOSFLM are always underestimates of the true error these values are scaled up in AIMLESS using a three-term correction
sdcorrected = SdFac Sqrt[sd(I)2 + SdBLPI + (SdAddI)2]
Here SdFac is an overall scale factor and SdB and SdAdd are intensity dependent factors
AIMLESS will automatically work out a suitable value for all three parameters in order to make the mean value of (observedscatter)(sdestimate) equal to 10 where observed scatter is the difference between an individual estimate of intensity and the mean ofall other estimates (from symmetry mates)
Probably the best estimate of the true high resolution limit of the data can be obtained from the CC(12) values these are thecorrelations between equivalent observations that have been divided randomly into two half-datasets The resolution limit is foundwhen the CC drops below ~ 05 - 03
This table comes under the heading
ANALYSIS OF STANDARD DEVIATIONS
iMosflm Tutorial
fileUsersandrewg4MOSFLMnewgui_tutorialiMosflm_tutorial_720_ver3html[29052015 105311]
in the AIMLESS log file and Run n standard deviation v Intensity test (where n is 1 or more) in the CCP4i GUI View Files from Job -View Log Graphs display
Can you identify a bad image in this dataset Can you work out why it is bad
(Cluethe image headers contain quite a lot of information that is not used by MOSFLM including the date and time that the image wascollected)
You can exclude a given batch from the scaling using the EXCLUDE keyword
RUN ALL EXCLUDE imagenumber
In this case run number will be 1
Rerun the scaling SENDING THE OUTPUT TO A NEW LOGFILE excluding this image and see the effect on the heights in the anomalousPatterson (in the log file) DO NOT repeat the integration In the command file uncomment the line (near the top) goto aimless so itskips the integration part
In the CCP4i GUI click to highlight the AIMLESS job which is listed as FINISHED and select ldquoReRun Jobrdquo from the control buttons downthe right-hand side of the main interface window Under ldquoExcluded Datardquo in the window that appears check the box next to Excludeselected batches and pull-down on the menu button to exclude a range Give the start amp end range to exclude (eg 74 to 74) Rerunthe job as before
17 Changing the symmetryFrom the list of options at the left hand side of the main window select ldquoUtilitiesrdquo and under that SortModifyCombine MTZ Files
In the new window give a new title eg reindex as H32
Click on the Box Change space group andor reindex reflections
Use the browse option to select the input MTZ file (First orange bar) the output filename will be generated automatically (but you canchange it)
Under Reindex details
In the last option check the box next to ldquoChange space group tordquo and enter H32 in the box This is above the final item Reducereflections to the asymmetric unit which is checked by default
Select Run from the Run option button
Then go back to the scaling window and select the new MTZ file (reindexed) as the input for scaling (use Browse) CHANGE THE JOBTITLE
Then select RUN
The scaling will now be performed in space group H32 Look at the merging statistics in the log file in particular the multiplicityweighted R-factor called Rmeas in the log file
18 Looking at the CTRUNCATE outputThe CTRUNCATE program converts intensities to amplitudes and also compiles some useful statistics The LTEST and the cumulativeintensity statistics tabulated by CTRUNCATE (and plotted by loggraph) provide the only point at which you will be able to detectmerohedral twinning (when the two lattices of the twin components exactly overlap and every measured intensity is actually the sum oftwo intensities)
For a good dataset the observed distribution should be within 1 of the theoretical distribution Is this the case for this data
19 If you have time 191 Different mosaic spreads
Try repeating the processing with the mosaic spread set to a value 25 smaller than the refined one and fix it by checking the Fix boxin the Integration window in iMosflm
Can you tell from the merging statistics if this data is better
192 Checking up on outliers
iMosflm Tutorial
fileUsersandrewg4MOSFLMnewgui_tutorialiMosflm_tutorial_720_ver3html[29052015 105311]
AIMLESS writes a file called ROGUES which lists reflections which show very poor agreement between symmetry mates or which areimplausibly large
Look in this file (it is ASCII) and try to work out why this has happened The ROGUES file gives you the image (Batch) on which thereflections have been recorded (for partials this is the image nearest the centre of the reflection so you may need to look on thepreceding and following image as well) Select a reflection which shows very poor agreement with its symmetry mates (A value greaterthan 10 in the DelIsd column in the ROGUES file)
Select the offending image by double-clicking it in the Images pane of the iMosflm main window Predict the reflections then enter thehkl values into the boxes and hit Return (or click the red warning button following the entry box for l) to locate the offending reflectionin the image You must give the measured indices - the first set of values in the ROGUES file - when doing this See if there is anythingodd about the spot Remember to check adjacent images for partials
193 How accurate does the unit cell have to be
Try changing the cell parameters by (say) 10 and integrate the images again What is the effect on the merging statistics
20 Tips1 When reading images into a session DO NOT attempt to carry out any other task until ALL the images have been read2 It is often worth repeating the indexing (usually only once) as the refined direct beam coordinates from the first indexing may give
an improved solution when the indexing is repeated (lower rmsd)3 Always integrate a few degrees of data before integrating the whole dataset (see sect9) If the space group is not known in advance
run Quicksymm with a few degrees of data to check that the correct indexing solution has been chosen4 For difficult images do not attempt to refine the unit cell initially once an indexing solution has been obtained try integrating a
few images to ensure that the integration is stable If then going on to refine the cell check that the prediction looks OK for thefirst image of every segment included in the refinement If it does not look very good consider using the pattern matching(Settings -gt Processing options -gt Advanced refinement see sect84)
5 If the resolution of the data is less than 35 Aring do not use the ldquoRefine Cellrdquo task Instead use several images in indexing and use thecell that comes from the indexing
6 If iMosflm gets into a state where the activity icon(upper right) is spinning but nothing seems to be happening click on the activityicon to stop it spinning and see if the session can be continued DO NOT click on the activity icon simply to abort a task this willgive unpredictable results Use the Abort button for cell refinement or integration There is no defined way to abort indexing
7 Use the image summation option (see sect4) to get a better impression of the diffraction for very low exposure Pilatus images8 Use image summation for detector parameter refinement for fine sliced very weak Pilatus images (Settings -gt Processing options -
gt Advanced refinement see sect821)9 For large mosaic spread values (gt 10deg) or small mosaic block sizes (lt10) consider increasing the maximum allowed reflection
width to avoid having too many green predicted reflections (Settings -gt Processing options -gt Advanced integration see sect97)10 By default on selecting the Indexing task iMosflm will find spots index and (assuming a solution has been found) estimate the
mosaicity For difficult cases it is more useful to restrict this to simply finding spots and then do the indexing and mosaicityestimation by clicking the appropriate buttons To do this change the check box Automatically index after spot finding inSettings -gt Processing options -gt Indexing
11 See sect521 and sect522 for advice if the indexing fails Also consider the possibility of a reversed phi rotation direction if you arenot familiar with the beamline (Settings -gt Experiment settings -gt Experiment see sect21)
12 If the detector parameters have refined to physically unreasonable values (eg because cell refinement or integration has beencarried out using an incorrect indexing solution) be sure to reset the detector parameters before attempting further processing(Settings -gt Experiment settings -gt Detector see sect21)
13 Always set the resolution limit slightly beyond the point at which any spots are visible (see sect414 ) For very weak fine-sliceddata it can be very difficult to estimate the resolution visually so integrate to the maximum resolution (inscribed circle) and usethe merging results to set the final resolution There should be no problems integrating to a resolution ~03-05 Aring beyond theactual resolution limit but for example integrating to 3 Aring when the true resolution limit is 5-6 Aring may cause problems and theintegration should then be repeated with a more realistic resolution limit
14 Use the site file sect141 if repeatedly processing data where the direct beam position is wrong or if the phi direction is reversed etcto save having to correct this for every session
Appendix IA command script for running MOSFLM using the keywords copied from the Batch processing window of the new GUI (see Integratingas a background job sect952) Note that keyworded input for MOSFLM and other CCP4 programs is case-insensitive apart from file anddirectory names
bincsh -fv Set a unique identifier for filenames for this job
set ident = x89_mos07_blk3_smallsep
iMosflm Tutorial
fileUsersandrewg4MOSFLMnewgui_tutorialiMosflm_tutorial_720_ver3html[29052015 105311]
$ipmosflm COORDS $identcoords SUMMARY $identsummary ltlt eof-ip Insert keywords copied from iMosflm batch window here
Keywords for this run For example could involve trying different values for mosaic spread or not integrating all images etc etchklout $identmtzgenfile $identgenprocess 1 1000 goeof-ip
pointlesspointless hklin $identmtz hklout $ident_pointlessmtz
aimlessaimless hklin $ident_pointlessmtz hklout $ident_aimless_partmtz ROGUES $identrogues ltlt eof-aimless Use all default options for aimlesseof-aimless
ctruncate hklin $ident_aimlessmtz hklout $ident_truncatemtz
Harry Powell Andrew Leslie and Owen Johnson
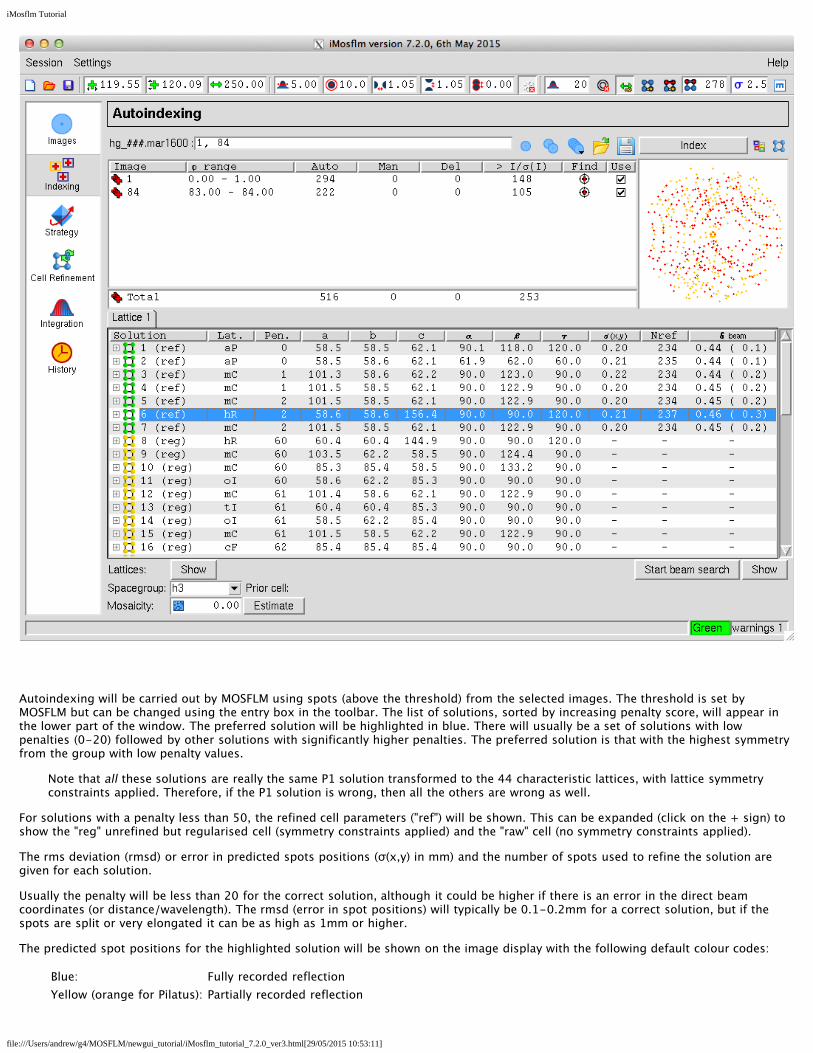
iMosflm Tutorial
fileUsersandrewg4MOSFLMnewgui_tutorialiMosflm_tutorial_720_ver3html[29052015 105311]
Autoindexing will be carried out by MOSFLM using spots (above the threshold) from the selected images The threshold is set byMOSFLM but can be changed using the entry box in the toolbar The list of solutions sorted by increasing penalty score will appear inthe lower part of the window The preferred solution will be highlighted in blue There will usually be a set of solutions with lowpenalties (0-20) followed by other solutions with significantly higher penalties The preferred solution is that with the highest symmetryfrom the group with low penalty values
Note that all these solutions are really the same P1 solution transformed to the 44 characteristic lattices with lattice symmetryconstraints applied Therefore if the P1 solution is wrong then all the others are wrong as well
For solutions with a penalty less than 50 the refined cell parameters (ref) will be shown This can be expanded (click on the + sign) toshow the reg unrefined but regularised cell (symmetry constraints applied) and the raw cell (no symmetry constraints applied)
The rms deviation (rmsd) or error in predicted spots positions (σ(xy) in mm) and the number of spots used to refine the solution aregiven for each solution
Usually the penalty will be less than 20 for the correct solution although it could be higher if there is an error in the direct beamcoordinates (or distancewavelength) The rmsd (error in spot positions) will typically be 01-02mm for a correct solution but if thespots are split or very elongated it can be as high as 1mm or higher
The predicted spot positions for the highlighted solution will be shown on the image display with the following default colour codes
Blue Fully recorded reflectionYellow (orange for Pilatus) Partially recorded reflection
iMosflm Tutorial
fileUsersandrewg4MOSFLMnewgui_tutorialiMosflm_tutorial_720_ver3html[29052015 105311]
Red Spatially overlapped reflection these will NOT be integratedGreen Reflection width too large (more than 5 degrees) not integrated
These colours may be adjusted via the Settings -gt Prediction colour item in the Image display window
Providing there are no errors in the indexing MOSFLM will automatically estimate the mosaic spread (mosaicity) based on the preferredsolution
Select other solutions with a higher penalty and see how well the predicted patterns match the diffraction image
The rmsd and visual inspection of the predicted pattern are the best ways of checking if a solution is correct If the agreement is notgood then the autoindexing has probably failed
It is often worth repeating the indexing (once) as the refined direct beam coordinates from the first indexing may give animproved solution (lower rmsd)
521 If the indexing fails - Direct beam search
The indexing is very sensitive to errors in the direct beam coordinates For a correct indexing solution the error should be less than halfthe minimum spot separation Check for example that the current direct beam position is behind the backstop If there are any icerings these can be used to determine the direct beam position (see Circle fitting sect416 )
If the accuracy of the direct beam coordinates (generally read from the image header) is uncertain the program can perform a gridsearch around the input coordinates The number and the size of the steps can be set from the Indexing tab of the Processing optionsmenu (see Settings - Processing options sect21) but defaults to two steps of 05mm on each side of the input coordinates The directbeam search is started by clicking on the Start beam search button in the Indexing pane While in progress it can be stopped byclicking the Abort beam search button
The indexing will be carried out for each set of starting coordinates (Beam x and Beam y in the table which appears) and if a solution isfound the refined beam coordinates (Beam x ref Beam y ref) the unit cell parameters of the triclinic solution and the rmsd error in spotcoordinates and in phi will be listed The correct solution will generally be the one with the smallest rms error in spot positions (σ(xy))To make it simpler to identify the correct solution once the grid search has finished the solutions will be sorted on σ(xy) so the correctsolution will be at the top of the list When sorting the solutions those which have smaller cell parameters will be listed first as it ispossible to have a small σ(xy) value for an incorrect solution with a much larger unit cell Beware of solutions at the top of the list wherethe cell is clearly too small (only happens rarely)
Note that only the triclinic (P1) solution will be listed
If there is now a solution with a smaller rmsd value than before and especially if more than one set of starting beam coordinates has thesame refined coordinates this is a good indication that the beam search has worked Note that if the initial beam coordinates werewrong by more than ~15mm the search may not work In this case either select a new starting position for the direct beam or changethe number of steps
To complete the indexing double-click on the chosen solution and the full indexing will carried out for these beam coordinates withthe solutions appearing in the upper window The results of the direct beam search can be hidden (collapsed) by clicking on the Hidebutton and recovered by clicking on the Show button
iMosflm Tutorial
fileUsersandrewg4MOSFLMnewgui_tutorialiMosflm_tutorial_720_ver3html[29052015 105311]
522 If the indexing fails - Other parameters
Errors in other physical parameters (wavelength crystal to detector distance) can also result in failure All these parameters should bechecked
Several parameters used in autoindexing can also be adjusted using entry fields and buttons that appear in the Indexing toolbar
Weak images
1 MOSFLM automatically reduces the Iσ(I) threshold for weak images and it may also reduce the resolution to 4Å but lower valuescan be tried It is important not to include spots that are not real - a small number of false spots can prevent the indexing fromworking
2 Try changing parameters for spot finding (see If the spot finding has not worked well sect511)
Multiple lattices
1 Try increasing the Iσ(I) threshold (default 20) for example to 40 or 60 so that only spots from the stronger lattice are selectedThis can be done by entering a new value in the leftmost of the circled icons above (and also via the Indexing tab of Processingoptions)
All cases
1 Include more images in the indexing Select images that are widely spaced in phi not close together2 Select images that show the clearest lunes andor have the best spot shape3 In case the crystal orientation has changed or if you are unsure of the direction of positive rotation in phi try indexing using only
one image4 Make sure that the Max cell edge value is not too small If in doubt set to 200 Aring (or more if the cell is expected to be large)5 If the cell parameters are known reduce the maximum allowed cell edge to the known maximum cell edge This can sometimes
help filter incorrect solutions but use with caution as often this needs to be ~twice the largest cell for successful indexingAlternatively try the known cell option
6 If the detector distance is uncertain and the images are high resolution (eg 2Å) allow the detector distance to refine during cellrefinement Use with caution
53 Indexing multiple lattices simultaneously
This is a new feature and is still undergoing development It is most likely to succeed when the different lattices are clearly separated atleast at higher resolution If the images shows badly split spots with several components (each arising from a sub-crystal with a slightlydifferent orientation) then indexing may well still be impossible
After spot finding examine the image to ensure that spots that are close to each other but belong to different lattices have beenidentified as separate spots and not treated as a single split spot (in which case the red cross will lie midway between the two spots)Adjusting the minimum spot separation (Settings -gt Processing options -gt Spot finding) can help in resolving close spots It may alsohelp to increase the inner radius of the spot search region (see Spot search area sect413) so that low resolution reflections where the
iMosflm Tutorial
fileUsersandrewg4MOSFLMnewgui_tutorialiMosflm_tutorial_720_ver3html[29052015 105311]
spots are not really separated are excluded from the search
The following procedure usually provides the best chance of success
1 Select appropriate images for use in indexing The separation of the lattices can be clearer on some images than others Ideallychoose several images widely separated in phi
2 Do a normal (single lattice) indexing first This will usually work but will give a high positional rmsd because of the presence of morethan one lattice This step is important because it will result in more accurate direct beam coordinates which are crucial for multi-lattice indexing
3 Select the ldquoIndex multiple latticesrdquo icon (next to the Index button) the Index button will change to Index multiple
The indexing results for different lattices will be presented in different tabs while the selected solution for each lattice will be shown inthe lower Summary window Currently a maximum of 5 lattices can be handled The figure below shows a case where 3 differentlattices were found
4 Judge the success of indexing by examining the lattice type and the cell parameters obtained for the different lattices (the cellsshould be very similar) and checking that the predictions match the observed spots The rmsd values for correct lattices should also besignificantly smaller than the value obtained in the initial (single lattice) indexing It may be necessary to manually select a differentautoindexing solution for some lattices in order to get the same lattice type (eg oP) for the different lattices
The Split column in the lower pane indicates the angle between the reference lattice (with value -) and the other lattices This is onlycalculated when the lattices have the same lattice type In this case the angles between lattice 1 and lattices 2 amp 3 are 34 and 16degrees
If a lattice is clearly incorrect it can be deleted by highlighting that lattice (in the lower pane that summarises the results) and using theright mouse button to select ldquodeleterdquo
The predictions for different lattices can be displayed either by highlighting the lattice in the Summary window or by using the latticeselector in the image display pane
iMosflm Tutorial
fileUsersandrewg4MOSFLMnewgui_tutorialiMosflm_tutorial_720_ver3html[29052015 105311]
In the image display spots in different lattices that overlap with each other are shown in magenta Only the summed intensity will bemeasured for these reflections
The predictions for all lattices can be shown by selecting the ldquomerge latticesrdquo icon in the image display
This can be useful to check if all the lattices have been successfully indexed because all spots in the image should then be predicted Inthe display predictions from lattice 12345 are shown in blue yellow red green and magenta with no distinction made between fullyand partially recorded reflections or spatial overlaps
iMosflm Tutorial
fileUsersandrewg4MOSFLMnewgui_tutorialiMosflm_tutorial_720_ver3html[29052015 105311]
531 Practical Tips
Beware of solutions where the lattices only vary in orientation by a small angle (less than 1 degree) as these are often different solutionsfor the same lattice The difference in orientation between lattices is given by the ldquosplitrdquo column in the Summary window but this is onlycalculated if the lattices have the same lattice type Differences are all relative to one lattice which will display a split angle as ldquo-ldquo Tocalculate the angles relative to a different lattice open the tab for that lattice select a different solution to that currently selected andthen select the original solution ndash this will trigger recalculation of the split angles relative to that lattice
Other parameters that can influence the indexing are the rdquoMaximum deviation from integral hklrdquo (default 02 when indexing multiplelattices otherwise 03) and ldquoNumber of vectors to find for indexingrdquo (default 30) These can be changed via the Indexing tab of theldquoProcessing Optionsrdquo that can be selected from the ldquoSettingsrdquo menu item Values between 015 and 025 might be helpful for the firstparameter and increasing the number of vectors from 30 to 50 can also help At present there is no defined protocol for changing thedefault parameter values for particular cases it has to be done by trial and error
Experience so far has shown that selecting appropriate images and adjusting the maximum cell length used in indexing have the biggesteffect The optimum value for the maximum cell length will normally lie between one and three times the largest cell dimension but it isworth varying this in steps of between 25 and 50 Aring as the indexing can be very sensitive to this parameter
For a more complete discussion of multiple lattice indexing see Powell HR Johnson O amp Leslie AGW 2013 Autoindexingdiffraction images with iMosflm Acta Cryst D69 1195-1203
54 Known cell option
For images that are very difficult to index if the cell parameters are known the known cell option can be usedSelect the ldquoKnown cellrdquo icon (next to the Multiple lattices icon) Enter the cell parameters in the Input known cell pop-up window andselect OK when all 6 parameters have been provided Then select the Index Cell button
To revert to normal indexing select the ldquoKnown cellrdquo icon and then select Clear in the Input known cell pop-up window
55 Space group selection
Note that the indexing is based solely on information about the unit cell parameters It will therefore be very difficult (or impossible) todetermine the correct Laue group in the presence of pseudosymmetry For example a monoclinic space group with β ~ 90deg will appearto be orthorhombic an orthorhombic space group with very similar a and b cell parameters will appear to be tetragonal These can onlybe distinguished when intensities are available (ie after integration) by running POINTLESS (QuickSymm) (see Running Pointless to check the
iMosflm Tutorial
fileUsersandrewg4MOSFLMnewgui_tutorialiMosflm_tutorial_720_ver3html[29052015 105311]
symmetry sect10)
In addition it is not possible to distinguish between Laue Groups 4m and 4mmm 3 and 3m 6m and 6mmm m3 and m3m Thiswill not affect integration of the images but it will affect the strategy calculation In the absence of additional information the lowersymmetry should be chosen for the strategy calculation to ensure that a complete dataset is collected
The presence of screw axes also cannot be detected so there is no basis on which to distinguish P21 from P2 etc This does not affectany aspect of data collection or processing and can be chosen (on the basis of systematic absences) after integration by runningPOINTLESS
In this example there is no way of knowing at this stage if the space group is h3 or h32 so leave it as h3
56 Mosaicity estimation
If the Automatically index after spot finding option has been chosen (Indexingtab of Processing Options) the mosaicity (mosaic spread) will be estimatedautomatically for the preferred solution However if another solution is chosenthe mosaicity should be estimated again
Click on the Estimate button to estimate the mosaicity
A window will appear which plots the total predicted intensity as a function ofmosaic spread from which an estimate is determined
The predictions displayed on the image will be updated Entering different valuesof mosaic spread in the box (followed by return) will allow a visual estimate of theeffect of changing the mosaic spread
The mosaic spread can also be entered in the Images pane by clicking once on theMosaicity line and once again on the value displayed
561 The mosaic block size
In some cases the apparent mosaic spread is much larger at low resolution than at high resolution so that if it is set to a value thatresults in all the low resolution spots being predicted many more spots are predicted than are visible at high resolution This effect isbest dealt with by adjusting the Mosaic block size which is also displayed in the Images pane This is modelling the size in microns ofthe individual mosaic blocks in the crystal Decreasing this to values of 05-5 microns (say) from the default of 100 microns will resultin predicting more spots at low resolution but have virtually no effect at high resolution This parameter is not refined (at present) andso the best value must be determined by trial and error
6 Saving and recovering a sessionThe session can be saved at any time using the Session drop-down menu referred to in sect21 The first time that a session is saved youwill be prompted for a filename The filename convention for saved session files is that the extension is mos
Save the current session Then exit from iMosflm (using the Session drop-down menu) restart iMosflm and read in the saved session
If the program crashes it should be possible to recover all but the latest actions as a temporary copy of the session file is continuallysaved to the directory mosflm in the users home directory
Restart iMosflm and it will pop up a Recover session window
Selecting the Recover button will restore the session as far as possible
iMosflm Tutorial
fileUsersandrewg4MOSFLMnewgui_tutorialiMosflm_tutorial_720_ver3html[29052015 105311]
7 Data collection strategyOnce the crystal orientation and (probable) Laue group have been determined it is possible to calculate a data collection strategy andthe Strategy icon is no longer greyed-out (in fact all other operations Strategy Cell Refinement and Integration become possible at thispoint)
Select the Strategy icon This will open the Strategy window
The statistics initially presented in the window are based on the images read in to the current session If only two (or more) references
iMosflm Tutorial
fileUsersandrewg4MOSFLMnewgui_tutorialiMosflm_tutorial_720_ver3html[29052015 105311]
images have been read in no statistics will be presented
When the Strategy option is used after two initial images (typically 90deg apart in φ) have been collected a complete shaded segment willnot be shown in the lower part of the screen rather an empty circle will be shown with the matrix label beneath it Click the Auto-complete button and in the pop-up menu that appears select a rotation angle or sweep of data to collect - or leave the Rotationsetting as Auto for a calculation of maximum completeness for this crystal orientation Click on Ok and the completeness results willbe presented
The orientation of the crystal expressed as the angles between the abc unit cell axes and the XYZ coordinate frame is given X isalong the X-ray beam Z is the rotation axis A warning will be given if the unique axis is so close to the rotation axis that there will bemissing cusp data
71 Evaluating completeness manually
The completeness of any given segment of data can be determined manually using the circle at the bottom left of the window Click onthe red segment shown in this circle
This will result in small black boxes being drawn on the circumference at the start and end of the red sector
Use the LMB to click on the black box at 0 and drag this around the circle
When the LMB is released the statistics for that sector will be displayed The statistics are presented in two ways Near the top right ofthe window the overall completeness is shown as red circles for unique data and anomalous pairs The average multiplicity is givenbeneath these circles
More detailed statistics (such as completeness as a function of resolution) are given in a series of histograms that can be selected by adrop-down menu
72 Calculating a strategy automatically
Uncheck the Use checkbox at the right side of the hg_001 line listed in the sector list near the top of the Strategy pane This means
iMosflm Tutorial
fileUsersandrewg4MOSFLMnewgui_tutorialiMosflm_tutorial_720_ver3html[29052015 105311]
that the 84 images used thus far will not be included in the completeness calculation only the matrix derived from indexing them willbe used Select the Auto-complete button to calculate a strategy automatically
A strategy calculation data pop-up window will appear
If multiple matrices have been defined (for different sectors of data) then the appropriate one can be selected (if there is only one sectorthis has no effect)
The total φ rotation to be used is normally calculated by MOSFLM based on the Laue group and the crystal orientation (the Auto setting)However it is sometimes possible to achieve a high completeness with a significantly smaller total rotation (eg 60deg in two 30degsegments will typically give gt94 completeness for orthorhombic space groups) and this can sometimes be useful if radiation damage isa serious problem although when using hybrid pixel detectors it is better to use a very conservative exposure time and collect a wide φrotation
Total rotation angles of between 5deg and 90deg can be selected from the drop-down list The number of segments to be used can be setbetween 1 and 3
If the check box is checked data completeness will be calculated to optimize the proportion of anomalous data collected
THIS IS IMPORTANT The optimum strategy is often different when maximising completeness of the anomalous data
Choose the default values (Rotation Auto Segments 1) but check the anomalous data box then click on Ok Look at the variousstatistics presented as bar charts
In space group H3 if rotating around the c axis a total rotation of 120deg would be required to collect a complete dataset (ignoring anydata lost in the cusp) Because the c axis is 22deg away from the rotation axis in this case it is possible to collect very high completeness(for unique data) with a rotation much smaller than this
Try to find the minimum total rotation that will give a dataset that is gt95 complete for the unique data Now do the same butrequiring gt95 completeness for the anomalous data
SKIP OVER SECTION 73 IF DOING THE NORMAL TUTORIAL
73 Calculating a strategy using multiple crystals
The Strategy pane may also be used when due to radiation damage many crystals are required to collect a complete dataset
IMPORTANT This procedure will only work correctly for space groups where there is no indexing ambiguity For those spacegroups where there is an indexing ambiguity( see httpwwwccp4acukdisthtmlreindexinghtml for a complete list) it isnecessary to integrate images to determine whether different crystals have been indexed in the same way This is not achievablewithin the Strategy option at present
Suppose the first crystal has been indexed from the reference images
Enter the Strategy pane an empty circle is displayed in the bottom part of the screen and click on the Auto-complete button nearthe top-right of the pane In the Auto-complete window that appears choose a suitable Rotation angle for the amount of datathat can be collected from one crystal say 20 degrees for this example Leave Segments set to 1 and do not check Optimize foranomalous data
Click the Ok button and the completeness of the data will be displayed The matrix name start and end phi values and the phiextent will be displayed in the top area of the pane with a checkbox ticked under the Use column This means this segment will beused in further strategy calculations
Accept and save this result by clicking on the yellow hatched segment displayed in the large circle near the bottom of the paneClick once and the segment will be outlined in black (you can adjust the start or end phi value calculated in one degree incrementsby click+dragging the respective black square) click again this time on the black square denoting the start or end phi (or release ifyou have adjusted by click+dragging) and the segment will turn red The segment will not be saved unless it has turned red
This result will be saved if you leave this pane (eg to load more images) and return later in this session The strategy file can alsobe saved to a permanent file using the Save button on the tool-bar This is highly recommended when working with many crystals
Return to the Strategy pane when you have loaded and indexed the reference image(s) from the second crystal and repeat the procedureabove You will see the calculated segment from the first matrix displayed at the bottom-left of the screen The optimum phi range for
iMosflm Tutorial
fileUsersandrewg4MOSFLMnewgui_tutorialiMosflm_tutorial_720_ver3html[29052015 105311]
the second crystal will be displayed Save this in the same way as for the first crystal (clicking twice) Repeat this procedure for anysubsequent crystals and in each case the optimum phi range will be calculated for the latest crystal taking into account the data fromprevious crystals
It is a good idea to save the strategy to a file as each new crystal is added in case the program crashes and this information is lost
In practice it is probably safest to have a separate iMosflm session that is reserved for the strategy calculations and not used to processany data The strategy for each new crystal can be calculated as described above If there is a problem and the session is corrupted or ifiMosflm is closed down for any reason it is straightforward to restore the status of the session providing the strategy has been savedThe following steps should be taken
1 Read in the reference images for the latest crystal and index them
2 Select the Strategy pane
3 Read in the optimised strategy for all previous crystals using the ldquoAddrdquo button and giving the appropriate filename
4 Making sure that the circle for the latest crystal is highlighted in the lower left window click on lsquoAuto-completersquo and follow the stepsdescribed above
Advanced Usage
The startend phi values for each crystalmatrix can be updated This might be required if for example only 10 degrees of useful datawere collected from a particular crystal instead of the anticipated 20 degrees To change the phi values click either on the matrix namein the top pane or on the circle showing the segment of data in the lower left pane (these are highlighted in a blue box as the mousemoves over them) The corresponding segment will now be displayed in the larger circle Click on the red segment so that a blacksquare appears at the startend phi values Then simply drag the appropriate phi to the desired value The completeness willautomatically be updated (but the strategy calculation for the latest crystal will not be repeated to do this the current segment must bedeleted by highlighting the matrix name and using right click and then repeating the Auto-complete step)
If matrix files saved from iMosflm are available from crystals for which data have been collected in previous sessions these can beadded into the calculation using the Add matrix button on the tool-bar
If the saved strategy result has become complicated or is incorrect and you wish to restart the calculations afresh there is a tool-barbutton Reload sectors from session This will remove any calculated sectors while leaving any known matrices listed at the bottom-leftof the Strategy pane
If you have saved a strategy file from a previous session this can be used to re-initialize the Strategy pane using the Load button onthe tool-bar
A Spacegroup pull-down menu has been added to the tool-bar to permit different choices of space group to be used in thecalculations (eg H3 and H32) This menu is populated from the list offered on the Indexing pane However the space group symboltext is editable Any space group symbol entered will be validated by Mosflm together with the current cell parameters
As a calculator for a multi-segment strategy the Strategy pane is reasonably flexible you can Save or Delete highlighted matrix lines byright-clicking As you highlight different matrix lines the orientation of the crystal expressed as the angles between the abc unit cellaxes and the XYZ coordinate frame is re-displayed in the centre of the pane
The following screen shot shows the cumulative results in the Strategy pane after this procedure has been followed for four crystals(ignore the iMosflm version number)
iMosflm Tutorial
fileUsersandrewg4MOSFLMnewgui_tutorialiMosflm_tutorial_720_ver3html[29052015 105311]
731 Calculating a strategy when some data have already been collected and processed
This option is not yet implemented If data have already been processed (to give an MTZ file) but the images are not currently available (eg they were collected on a previoussynchrotron trip possibly at a different synchrotron) then the MTZ file containing this data can be read and used to calculate a strategyfor data collection from new crystalsThe MTZ icon in the tool bar is used to read the MTZ file
74 Calculating a suitable oscillation angle
To calculate the maximum possible oscillation angle while avoiding spatial overlaps click on the Check for overlaps button A pop-upwindow will appear from which the option to calculate the maximum oscillation angle (as a function of φ) or check how many overlapswill occur for different (user selected) oscillation angles The results are plotted in the same pane as the histograms for the strategycalculations Note that the overlap calculation is based on the current values for the mosaic spread and spot separation and can be verysensitive to these values Note also that these are maximum and not necessarily recommended oscillation angles
iMosflm Tutorial
fileUsersandrewg4MOSFLMnewgui_tutorialiMosflm_tutorial_720_ver3html[29052015 105311]
8 Cell refinementIt is important to determine the cell parameters accurately before integrating the images Although the unit cell is refined as part of theautoindexing providing the diffraction extends beyond ~35Å resolution it is possible to obtain more accurate cell parameters using aprocedure known as post-refinement This procedure requires the integration of a series of images in ideally two or more separatesegments at widely different φ values The distribution of the intensity of partially recorded reflections over the images on which theyoccur is used to refine the unit cell crystal orientation and mosaic spread
Select the Cell Refinement icon
81 Selecting the images
iMosflm Tutorial
fileUsersandrewg4MOSFLMnewgui_tutorialiMosflm_tutorial_720_ver3html[29052015 105311]
There are several ways to select the images to be used in cell refinement Whichever method is used the image numbers will bedisplayed in the Images entry field iMosflm will automatically select appropriate images but these can be changed
811 Manual selection
A list of images can simply be typed into this box An image series can be specified as n-m where n and m are the first and last imagesDifferent series must be separated by white space or comma
For orthorhombic or higher symmetries two segments should be given approximately 90deg apart in φ For monoclinic or triclinic datathree or four segments are best (eg φ = 04590135)
The number of images that should be included in each segment depends on the mosaic spread and oscillation angle A reasonablenumber is 2(mosaic spreadoscillation angle +1) MOSFLM will automatically select two or more segments as appropriate Note thatthere is a limit on the total number of images that can be used
812 Automatic selection
Selecting the Automatically select images icon will select a suitable set of images
813 Graphical selection (Not recommended)
Selecting this icon will give a new window
Images can be selected by clicking in the Use check-box in the list of images or by using the mouse to drag a selection of imagesfrom the sector displayed The other icons allow the sector to be zoomed in or out and the viewed area to be moved to make theselection easier The final two icons on the tool-bar switch the segment display to fit the display space as either a full circle or aquadrant This Image palette can be closed by clicking outside its area but will close after 60 seconds anyway
82 Integrating the images and refining the cell
Use one of the methods above to select images to use in cell refinement and click on the Process button Before starting cell refinementcheck that the prediction for the first image in each segment to be used is good The majority of the spot positions must be correctlypredicted for the first image in each segment or else the refinement will not work
The selected images will be integrated and following integration the cell parameters are refined Selectable refined detector parameters
iMosflm Tutorial
fileUsersandrewg4MOSFLMnewgui_tutorialiMosflm_tutorial_720_ver3html[29052015 105311]
will be plotted as will the changes in crystal orientation and (if selected) mosaic spread If the shift in cell parameters is greater than 25standard deviations another cycle of integration and cell refinement is carried out Typically two or three cycles are required forconvergence Note that the current program activity is shown in the bottom left-hand corner of the window in the status message area
The different windows are explained below Moving the mouse over any parameter or plotted graph point will give a full description ofit
821 The detector parameters window
The values of the refined detector parameters are displayed for each image as it is integratedThere is the option to fix any of the parameters during integration by checking the Fix box onthe right The positional residuals (overall central and weighted) are also listed
Any of these parameters can be selected for plotting on the graph that appears to the right ofthis box by simply clicking on that parameter (which is then highlighted in blue as shown herefor Beam x and Beam y)
Check the stability of the refined parameters by displaying the appropriate graphs To getsensible scaling of the graphs only parameters with similar numerical values should be plottedtogether
For weak images (ie few visible spots in the outer regions of the image) the tilt and twistmay not be well defined and might refine to large values (greater than one degree) Insuch cases these parameters should be fixed It is not generally recommended to fix any
iMosflm Tutorial
fileUsersandrewg4MOSFLMnewgui_tutorialiMosflm_tutorial_720_ver3html[29052015 105311]
other detector parameters
For very weak fine sliced images (Pilatus only) there is the option to sum images when findingsuitable spots for refinement see Settings -gt Processing Options -gt Advanced refinementwhich can in some cases make the refinement more stable
822 The crystal parameters window
The values of the refined crystal missetting angles φ(x) φ(y) φ(z) the unit cell parameters andmosaic spread for the current image are displayed in the table Selected parameters will beplotted as for the detector parameters Specific unit cell parameters can also be fixed
If more than one segment of data is being used for cell refinement it is not unusual to see achange in orientation of the crystal between the two segments
Observe how the crystal orientation is different for images in the two segments See how themosaic spread varies during refinement
823 The central spot profile
The average spot profile for the central region of the detector is plotted for eachimage This confirms that the spot prediction is good If the profile is not welldefined and central in the box or if the blue border for the peak region of the spot ismuch larger than the apparent spots size it suggests a problem with the integrationand the initial prediction should be checked In some cases it may be necessary toincrease or decrease the Profile Tolerance parameters to ensure that the blue boxfits the spot To do this select the Advanced integration tab of Processing optionsCheck the central spot profiles for the images used in the cell refinement
824 The summary window
This window presents a summary of how selected parameters have changed indifferent cycles of the cell refinement The behaviour of these parameters gives agood indication of whether the cell refinement has been successful
If the refinement has been successful the RMS residual should be lower for thefinal cycle than in previous cycles However errors in the cell can be compensatedquite well by changing the crystal to detector distance so the differences are notalways dramatic
The other parameters that can be plotted from the pull-down list are the detectordistance and the Pixel ratio (Yscale)
The detector distance should be the same for all images in the refinement If the original indexing was based on auto-indexing a singleimage (say the first) then the detector distance might change for images from the second segment to compensate for an error in theoriginal cell If the variation in distance for different images increases with the cycle number this indicates that the refinement is notstable
The Pixel ratio (Yscale) parameter may also show an initial variation for images in different segments because refining Yscale (whichshould be 10000 for all except Raxis II and Raxis HTC detectors) can compensate for errors in cell dimensions in the same way that thedistance can The final values (last cycle) should be very close to identical for all images and should also be very close to unity (to within00010)
Cell refinement can be unstable if the data do not extend to at least 35 Aring If it appears unstable use the cell derived from auto-indexing a series of images well spaced in φ instead
iMosflm Tutorial
fileUsersandrewg4MOSFLMnewgui_tutorialiMosflm_tutorial_720_ver3html[29052015 105311]
Examine the plots to see if the parameters are stable and correct (Yscale)
825 The final results
When refinement has converged (or after 5 cycles) the initial and final cell parameters and the estimated errors (std dev) are listed
If time is available make a note of the std dev values and repeat the cell refinement using a larger number of images in each segmentAre the standard deviations smaller when using more images
83 Refining cell parameters for multiple lattices
Providing the resolution is high enough (generally better than ~35-32 Aring) and not too many of the spots in the different lattices areoverlapped it is possible to refine the cell parameters for each lattice individually The lattice to be refined is selected from the Latticeselector
This selector will be grayed out when processing a single lattice
84 If the prediction for the first image of a segment is poor
In some cases depending on how the indexing has been carried out or if the diffraction is poor or there has been a large change incrystal orientation during the data collection the prediction for one or more of the segments (the first image) may be poor In suchcases the integration and hence the cell refinement may fail It may be possible to successfully process the images after an initialrefinement of the crystal orientation using a pattern matching algorithm To select this option got to the Advanced refinement tab ofProcessing options and select the tick box for Refine orientation of first image in any run by pattern matching and for Integrate allimages Then refine the cell in the usual way During integration the orientation will be refined for the first image of each segmentoutput for this additional refinement will be written to the logfile but is not shown in the GUI
9 IntegrationThe accurate cell parameters are now used in the integration Note that although the images are integrated during the cell refinementthe intensities are not saved and no MTZ file is generated at that stage
It is good practice to start by integrating a block of images corresponding to a few degrees of data to check that the parameters do notneed further adjustment MOSFLM will generate warning messages after integration if there are any difficulties and it may be possibleto improve the situation by changing some of the default parameters (see Warning messages sect13)
Before integration ensure that the backstop shadow has been defined (see Masked areas backstop sect411 and Masked areas generalsect412)
91 Image selection
Image selection is performed in exactly the same way as in the cell refinement In this case the Automatic selection will simply includeall images in the current sector
Select images 1-10
92 Setting the MTZ filename and controlling updating of the image display
Two icons appear when the integration option is chosen
If the Show predictions icon is clicked the display window will be updated as eachimage is processed This will slow down the processing but allows the accuracy of theprediction to be checked for each image
iMosflm Tutorial
fileUsersandrewg4MOSFLMnewgui_tutorialiMosflm_tutorial_720_ver3html[29052015 105311]
Click on this icon so that the display will be updatedThe filename of the MTZ file containing the results of the integration is generatedautomatically but can be edited manually
93 Integrating the images
Click on the Process button to start integration
Integration of the images occurs in two passes In the first pass for each block of images (a number corresponding to a few degrees ofdata selected automatically by MOSFLM) the detector and crystal parameters are refined for each image in turn and the measurementboxes for all predicted spots are written to a file for use in the second pass In the second pass the standard profiles are formed fromreflections present on all of the images in this block and each image is then integrated and the results written to the MTZ file Thedisplay is not updated during the second pass and will remain on the last image of the block (assuming image updating has beenselected)
Note that the unit cell dimensions are normally fixed during integration and only the crystal orientation and mosaic spread are refinedCrystal parameter refinement only starts when a sufficient number of images have been integrated to provide data for the post-refinement typically after ~05-1 degree (more for high mosaicity)
94 Parameter display windows
As described in sect82 the refined detector and crystal parameters will be displayed in tables and selected parameters will be plotted ingraphs The average spot profile for each image will also be displayed
The size of these graphs (and the profile) can be expanded to fill the whole window by holding down Shift and clicking LMB anywherein the graph window A second Shift+click will revert the graph to the original size
In addition to these windows there are windows that tabulate and plot (as a function of image number) the mean Iσ(I) for profile fittedand summation integration intensities The overall values and the values for the highest resolution bin are given
The number of overloaded reflections Bad spots (ie those that fail certain tests see mosflm SUMMARY file sect15) Spatial overlaps andif processing multi-lattice images the number of lattice overlaps is listed for each image and can be plotted by highlighting thatparameter When processing data from crystals with large unit cells it is important to watch out for spatial overlaps (see sect97 for tips onhow to reduce the number of spatial overlaps if this is a problem)
A display of the standard profiles for different regions of the detector is also provided Poor profiles are averaged by includingreflections from inner regions of the detector Averaged profiles are indicated by a red line around the spot (rather than blue) Theoriginal unaveraged profile can be viewed a clicking on the profile (providing there were sufficient spots in that region to allowformation of a profile)
The profiles should be checked to see that they are well defined and centred within the box Poorly-defined diffuse or non-centredprofiles may suggest that the prediction is not very good in which case this should be checked on the corresponding image(s)
It may be useful to expand the standard profiles to fill the window using Shift + click in the profiles window
Finally the lower left window plots Iσ(I) as a function of resolution for any selected image
iMosflm Tutorial
fileUsersandrewg4MOSFLMnewgui_tutorialiMosflm_tutorial_720_ver3html[29052015 105311]
Different parameters can be plotted by selecting the small right- or left-pointing arrows on the title line above the plot
95 Integrating the whole datasetAssuming that everything looks OK the entire dataset can now be integrated However it is strongly recommended thatProjectCrystalDataset names are assigned first These are written to the output MTZ file and used by downstream programs inparticular AIMLESS will use this information when deciding which images belong to the same dataset
Select Experiment settings from the Settings drop-down menu (see Drop down menus sect21) to enter these names and optionally givea title for the MTZ file
Select images 1-84 and click on Process
951 Parallel Integration Using multiple cores
An option is available on the pull-down menu (next to the Process button in the Integration task) which splits up the integration jobover available cores on the local machine All aspects are currently determined automatically at present user-configurable options willbe available in a later version The algorithm used is as follows
iMosflm determines the number of cores available on the local machineIf the number of cores (N) is greater than 2 iMosflm splits the integration run into N-1 batches (up to a maximum of 16) containingapproximately the same number of images If N le 2 iMosflm splits the run into N batches
If the total number of images in each batch is less than 32 the number of batches is decreased until this condition is satisfied
The first batch is submitted as a background task consisting of a refinement stage and an integration stage with its input and outputfiles (including the MTZ file) in a new directory its name being determined from the number of segments of data being integrated andthe lattice number (if the sample has been determined to contain multiple lattices) If the directories exist already they are all movedinto a newly-created directory with a time-stamped name the files from the most recent integration run are thus in directories withnames following the pattern described above Once the refinement stage is complete the refined parameters are written to a file
The launch of subsequent batches are delayed until the corresponding preceding batch has written its refined parameters This file isread and the new batch is launched again with a refinement stage and integration stage
At present the job cannot be aborted once it has started
952 Integrating as a background job
By selecting Batch in the drop-down menu adjacent to the Process button the integration can be run as a background job rather thaninteractively and the GUI can be used to look at a different dataset
Selecting Batch from the drop-down menu will display a new window showing the script that will be used to process the images alongwith a number of processing options The script can be edited if additional keywords are required or if some parameters are to bechanged and can also be copied and pasted into a file for off-line processing
By default the job is divided into batches across multiple cores as determined for the parallel integration described in sect951 but thenumber of cores can be chosen by the user from a drop-down menu in this case the size of each batch is determined by the interface
Plotting the results of the integration can be turned off this can make processing much faster
iMosflm Tutorial
fileUsersandrewg4MOSFLMnewgui_tutorialiMosflm_tutorial_720_ver3html[29052015 105311]
It is possible to configure job submission for remote machines (which can be added by depressing the add host button) Ensure youhave enabled passwordless logins for all the remote machines you enter and that you specify the full path to the Mosflm executable inthe Batch destinations window The remote working directory (in which the log and MTZ files are written) and the remote imagedirectory must both be specified with their full path names Any required parameter fields that are not completed by the user arehighlighted in orange if the user tries to submit a job without completing these fields a new window containing only those fields (againhighlighted in orange) pops up with a request to do so
The number of cores available on the selected host can be determined by depressing the apple core button on the Batch destinationsconfiguration window
The log file for batch submission jobs the MTZ and SUMMARY files are written to the directory in which iMosflm was launched
96 Checking the integration
iMosflm Tutorial
fileUsersandrewg4MOSFLMnewgui_tutorialiMosflm_tutorial_720_ver3html[29052015 105311]
The detector and crystal parameter plots should be examined carefully to check for any instability in the refinement If there are largeand random variations in some parameters (eg the detector twist and tilt) then it may be better to fix them and repeat the integration
For cases (eg very small unit cells) where there are very few suitable reflections on each image the refinement of the missetting anglesmay show significant variations from one image to the next In such cases it is best to apply smoothing to the missetting angles usingthe tick box in Settings -gt Processing options -gt Advanced Refinement
Discontinuities due to blank images should also show up and the offending images should be removed from the scaling run
If adjacent spots are incompletely resolved on the detector it may be possible to improve the processing by increasing the PROFILETOLERANCE parameters by 1-2 These parameters can be set in the Advanced integration tab of the Processing options menu (useSettings)
97 Advanced features for integration
The Settings -gt Processing options menu allows additional control over the integration Parameters such as the minimum spotseparation resolution limits excluded resolution ranges block size MTZ filename and BATCH ADD can be changed in the Processingtab
Manually decreasing the minimum spot separation can help if a large number of reflections are flagged as spatially overlapped (redboxes) The prediction must be updated to see the effect of changing the separation this can be done either by displaying the next orprevious image or double clicking on the blue circle next to the image currently displayed in the Images pane
In the Advanced integration tab the measurement box parameters profile tolerance and profile averaging parameters can be set
The measurement box parameters can be adjusted for rare cases where the estimation of the spot size has not worked correctlyresulting in a box that is too small or too large The optimisation of the background rim and corner cutoff parameters that determinewhich pixels are used for the background and which pixels for the peak can also be turned off but this is generally not recommended
Increasing the profile tolerance can help in cases where adjacent spots are not completely resolved this can be judged by examining thestandard profiles By default the profile tolerance is automatically increased if there are a large number of spatial overlaps as this hasthe effect of reducing the minimum spot separation A message will be written to the logfile if this has happened This option can beturned off using the tick box Optimise profile tolerance values to avoid spot overlap
The profile outlier exclusion parameters control the exclusion of ice spots or hot pixels which could otherwise corrupt the standardprofiles
Pixels with a value less than the Null pixel threshold are considered to belong to inactive regions of the detector
The pixel saturation value determines when a reflection is considered to be an overload The intensity of overloaded reflections isestimated by profile fitting but these reflections are rejected by the scaling program AIMLESS by default
Increasing the Maximum reflection width in φ from the default value of 5deg will reduce the number of rejected reflections (green boxes)and is worthwhile when the mosaicity is very high or the mosaic block size is very small As with the minimum spot separation theimage must be refreshed to see the effect of changing this parameter
The rejection criteria will reject reflections with too much variation in the background (BGRATIO) or where the gradient of thebackground plane is too large These should only be changed if many reflections are being rejected PKRATIO only applies to fullyrecorded reflections and reflects a very poor profile fit With current data collection protocols there will be very few (if any) fullyrecorded reflections
Additional MOSFLM parameters will be added based on user requests
98 Integrating multiple lattices
When multiple lattices have been successfully indexed each lattice can be integrated individually by selecting the appropriate latticenumber
Reflections in the chosen lattice that are overlapped by a reflection from another lattice will be integrated but the measurement box willbe expanded so that the total intensity of the two (or more) reflections is measured These reflections will be flagged for specialtreatment Reflections that are not overlapped are referred to as singletons They will be dealt with in the normal way by POINTLESSand AIMLESS
NOTE If more than one lattice has been indexed and the results of integrating just ONE of the lattices are to be checked byrunning QuickSymm or QuickScale then the multi-lattice icon in the Integration pane must be turned off otherwise an error
iMosflm Tutorial
fileUsersandrewg4MOSFLMnewgui_tutorialiMosflm_tutorial_720_ver3html[29052015 105311]
message will be given saying that all lattices must be integrated
It is often the case that by measuring both lattices (in separate integration runs) and inputting both MTZ files to QuickScale the overallcompleteness is high using ONLY the singletons To use this option ensure that the multi-lattice icon is off
To make use of the intensity estimates for overlapped reflections MTZ files for all lattices must be input to the program FECKLESSwhich will derive the best estimate of the summed intensity This is the default option if more than one lattice has been indexed and itrequires that all lattices have been integrated (in separate runs) prior to running QuickSymm or QuickScale (FECKLESS will be runautomatically)
At this time no downstream programs can make use of the summed intensities of overlapping reflections but in the future it should bepossible to use this data in REFMAC
Currently it is recommended to use only singletons from all the lattices FECKLESS is not required in this case
The MTZ filename is automatically updated to reflect which lattice has been chosen to avoid overwriting the MTZ file of the first latticewhen integrating the second one FECKLESS when run from iMosflm relies on this naming convention so do not change it
10 Running Pointless to check the symmetryOnce the images have been integrated (even a few degrees of data in many cases) the program POINTLESS can be run to determine thetrue Laue symmetry and try to determine the space group using the QuickSymm button
iMosflm Tutorial
fileUsersandrewg4MOSFLMnewgui_tutorialiMosflm_tutorial_720_ver3html[29052015 105311]
Select the QuickSymm button
A summary of the Pointless results as shown below will appear in a qtRView window
Various graphs (L test for twinning ViewHKL to view the reciprocal lattice) can also be viewed in this window
Various options for POINTLESS such as a reference MTZ file forcing the symmetry selected in iMosflm and specifying multiple input MTZfiles can be selected from the Settings -gt Processing options -gt Sort Scale and Merge tab (see below)
iMosflm Tutorial
fileUsersandrewg4MOSFLMnewgui_tutorialiMosflm_tutorial_720_ver3html[29052015 105311]
Caution The results can be ambiguous if run with a partial dataset Look in the logfile to see how many relfections are used totest each possible symmetry operator
11 Running Aimless to scale and merge the dataSelect the QuickScale button
This will first run POINTLESS then change the space group for the data to that selected by POINTLESS (unless the iMosflm symmetry isset to override POINTLESS) run AIMLESS to scale and merge the data in that space group and then run CTRUNCATE which calculates anumber of statistics from the intensity data The CCP4 UNIQUEIFY script will then be run which generates all the unique reflections forthat spacegroup to the resolution of the measured data and will flag reflections (5 by default but this can be changed) for use as theRfree set
AIMLESS can be run from the QuickScale button either treating anomalous data (the default) or ignoring anomalous data If onlyprocessing a few degrees of data it is usually better to ignore anomalous because especially for low symmetry cases no mergingstatistics may be given in AIMLESS
SCALA can be selected as an alternative to AIMLESS for scaling (not recommended)
There is limited control over running AIMLESS (see figure above) including re-setting resolution limits rejecting batches (images)changing the treatment for accepting partials changing the rejection criterion and changing the procedure for updating the standarddeviation estimates
iMosflm Tutorial
fileUsersandrewg4MOSFLMnewgui_tutorialiMosflm_tutorial_720_ver3html[29052015 105311]
The AIMLESS results will be displayed in the qtRView as shown below along with graphical output (see below) and the full log file canalso be examined
Aimless summary file
iMosflm Tutorial
fileUsersandrewg4MOSFLMnewgui_tutorialiMosflm_tutorial_720_ver3html[29052015 105311]
An example of the Aimless graphical output
The AIMLESS logfile can also be examined by selecting the Log File tab
12 History and mosflm log fileSelecting History allows the history of the session to be examined or by selecting the Log tab the full mosflmlp file can be viewed Themosflmlp file is also available in a time-stamped file mosflm_yyyymmdd_hhmmsslp (eg mosflm_20100518_131019lp) and can beread with a text editor
The History has a tree structure and will show when various parameters have been changed This has not been fully implemented and isnot generally useful
The logfile may provide useful clues when processing has failed
13 Warning MessagesAs already mentioned in Adding images sect3 and Integration sect9 warning messages are generated by MOSFLM during processing Atraffic light colour coding has now been assigned based on the warnings and is shown next to the Warnings box
A Red status implies a serious problem that will affect data quality and should be addressed
An Orange status implies minor issues that should be checked to see if things can be improved
A Green status means no significant problems messages are for information only
iMosflm Tutorial
fileUsersandrewg4MOSFLMnewgui_tutorialiMosflm_tutorial_720_ver3html[29052015 105311]
Abbreviated messages can be obtained by clicking on the Warnings icon The full warning Details together with Hints amp Notes text (ifany are available) can be obtained by double-clicking the relevant warning Details are displayed in a pop-up text box which willdisappear with the next click outside the box The same full details and suggestions are of course available in the mosflmlp files whereeven more information may be available
NOTE This is the end of the part of the tutorial which deals directly with iMosflm but see sect19 which has some suggestions forfurther work if you have time The remainder of this document deals with integrating and scaling data with MOSFLM andAimless via the CCP4i user interface examining the traditional mosflm SUMMARY file with the CCP4 utility loggraph
The Appendix contains a shell script for running MOSFLM as a traditional batch job
14 Useful command line optionsiMosflm has a number of command line options and these can be listed by typingimosflm --helpCurrent options are
--allimages -a ltfilenamegt Starts mosflm loading all files that match the template generated from ltfilenamegt--ccp4i2 Autosaves an iMosflm session file upon exit with an XML list of all iMosflm output files--debug -d Creates a large output file for debugging purposes Dont use this unless asked to by a developer--expert -e Permits access to advanced detector settings This should not normally be required--fastload -f Attempt to speed loading of many images offline while indexing two default images separated by 90 degrees--help -h Displays this message then exits--imagedir -I ltdirectorygt Starts the image browser in this directory if ltdirectorygt is given as an environment variable it will be expanded to its full value--init -i ltfilenamegt Starts Mosflm and reads from the given saved session file--startdir -S ltdirectorygt Starts mosflm in directory ltstartdirgt rather than the current directory This will only work if the directory exists and you have write permission to it otherwise iMosflm will exit All the normal mosflm output files will be in this directory--singleimage -s ltfilenamegt Starts mosflm loading only the image from ltfilenamegt--site -X ltfilenamegt Reads anyall of the following lines from the file given WAVELENGTH ltxgt DISPERSION ltxgt POLARISATION [PINHOLE | MIRRORS | MONOCHROMATOR | SYNCHROTRON ltxgt] DIVERGENCE ltxh xvgt BEAM ltbeamx beamygt DISTANCE ltxgt DISTORTION TILT ltxgt DISTORTION TWIST ltxgt GAIN ltxgt DETECTOR REVERSEPHI DETECTOR OMEGA ltxgt--version -v Displays the program version and required Mosflm version then exits
These can be abbreviated to the shortest unambiguous string
141 The site fileimosflm --site ltsitefilegt will read keywords from the file ltsitefilegt that will overwrite incorrect information in image headers Thissaves having to manually correct values in every iMosflm session The site file can also be read or written as an option from the Sessionmenu (see Drop down menus sect21) Allowed keywords areWAVELENGTH ltxgt
iMosflm Tutorial
fileUsersandrewg4MOSFLMnewgui_tutorialiMosflm_tutorial_720_ver3html[29052015 105311]
DISPERSION ltxgtPOLARISATION [PINHOLE | MIRRORS | MONO | SYNCHROTRON ltxgt]DIVERGENCE ltxh xvgtBEAM ltbeamx beamygtDISTANCE ltxgtDISTORTION TILT ltxgtDISTORTION TWIST ltxgtGAIN ltxgtDETECTOR REVERSEPHIDETECTOR OMEGA ltxgt
15 The mosflm SUMMARY fileMOSFLM produces a summary file listing refined parameters for each image and when using iMosflm this file will be date- amp time-stamped and have a name such as mosflm_20100518_131019sum This contains the same information as the plots produced by theiMOSFLM GUI which now also include the number of bad spots and overloads
This can be inspected graphically from the CCP4i GUI using the program loggraph Select the pull down menu View Files from Job andunder Output files select Additional log graphs where the _SUMMARYloggraph file will be listed Select this file to display its tablesin loggraph
This is very useful to identify rogue images (with unusually high positional residual or low Iσ(I)) If you find any read that image intoMOSFLM and see what is wrong with it
If you have done more than one integration run during your MOSFLM session you will find multiple entries of the tables Look at the lastset for integration of the 84 images
Click on the Refined detector parameter tables and check on the stability of parameters like the TILT and TWIST of the detector (unitsare hundredths of a degree) and for Mar Research (or DIP) image plate data the distortion parameters ROFF and TOFF (units are mm) Ifthey are varying a lot (more than 20 for TWISTTILT) or 015 for ROFFTOFF then it is probably a good idea to fix these parameters atthe average value (or the known values for this detector if they are available) (see Detector parameters sect821)
Click on the Post refinement table and check the missets It does not matter if they change slowly and by an amount (per image) that isless than 01mosaic spread If they are changing more than this then there could be a problem with processing the data (there is notmuch you can do about this)
Check how the mosaic spread is changing If it is unstable or if you think it is not refining to sensible values (as judged by looking atthe prediction) then you can fix the input value in the same way as the detector parameters (see Crystal parameters sect822)
BADSPOTS AND OVERLOADS
The program will set a rejection flag for those reflections that fail certain tests for example too much variation in the background levela poor profile fit an intensity that is very negative (more than 5 standard deviations) a very high gradient for the background planeThese reflections are called Bad spots and they are listed individually for each image in the mosflmlp file together with the reason forflagging them The number of bad spots is also written to the summary file Generally there should be very few (5-10) bad spots oneach image If there are more it could be because the backstop shadow is not correctly allowed for (consider using the NULLPIXkeyword)
There should also be very few overloaded reflections on each image If there are a lot then a separate low resolution data collectionpass should be made with a much shorter exposure time
IMPORTANT Both Bad spots and Overloads are written to the output MTZ file but will be rejected by default by AIMLESS Theintensity of overloaded reflections is estimated by profile fitting that part of the spot that is not saturated To include these reflections inthe final merged data use the ACCEPT keyword in AIMLESS
16 Scaling data with CCP4i ccp4i
Select Directories amp ProjectDir (top right)
In the new window select Add project
Enter the project name in the Project field and the full directory path in the uses directory field Default values may have been enteredalready here Select this project from Project for this session
Select Apply and Exit Dismiss the warning message that comes up
Select Data reduction from the pull down menu of modules (orange bar at top left)
iMosflm Tutorial
fileUsersandrewg4MOSFLMnewgui_tutorialiMosflm_tutorial_720_ver3html[29052015 105311]
Select Symmetry Scale Merge (Aimless)
In the window that appears do the following
Give a job title (top line)
Click on the box next to Separate anomalous pairs for outlier rejection amp merging statistics (the crystals have been soaked in a mercurycompound)
In the next orange bar (line starts HKLIN 1) select Browse and select the MTZ file output by MOSFLM (probably called hg_001mtz)Select OK
If you did not supply the Project name Crystal name or Dataset name to Mosflm fill in the boxes for these now
Under Scaling Protocol
From the pull-down menu on the line starting Scale select with automatic default settings
At the bottom of window from the pull-down menu named Run select RunampView Com File
This will display a new window showing the command file for running the POINTLESS step select Continue After a brief pause it willshow the command file for running AIMLESS (This can be edited before submitting the job) Select Continue
In the main window it will show that the AIMLESS job is running
When AIMLESS has finished the command file for running the CTRUNCATE step will appearselect Continue
When CTRUNCATE has run the main window will say FINISHED
At that point select the pull-down menu View Files from Job and select View Log Graphs This will give you the same graphs asrunning loggraph on the AIMLESS log file they are also the same as those that appeared in IMOSFLMs QuickScale task To look at thelog file itself (eg the overall merging statistics) select View Log File and it will appear in a new window
161 Looking at the AIMLESS output
The simplest way to look at the output from AIMLESS is to use loggraph on the AIMLESS log file (or via the CCP4i GUI) This can displaymany different graphs
Use Scales vs rotation range to check for smooth variation in the scale factor Check the variation in B factor with image and if there isno real variation it is best to turn off the B-factor refinement
Use the Analysis against all Batches for all runs to detect bad images (high R-factor large number of rejected spots)
Check the Analysis against resolution Fractional bias to see if there is any indication of Partial bias (A negative partial bias will resultif the mosaic spread is underestimated or if there is a lot of diffuse scatter
The Fractional bias should be less than 1-2 although it will often exceed this for weak data (eg in the high resolution bins)
The Axial reflections graphs in AIMLESS are useful for detecting systematic absences which can be used to identify the true spacegroup However the detection of screw axes is thought to be sufficiently robust in POINTLESS that these graphs are no longer necessary
It can also be useful to look at the AIMLESS log file itself in particular the table giving statistics as a function of resolution The effectiveresolution limit of the data can be estimated by looking at the Mn(I)sd column (this is the mean Iσ(I) AFTER merging symmetry matesand is the best indicator of data quality) This table also shows shell and cumulative R-factors
The Mn(I)sd values depend on having realistic values of the standard deviations (errors) in the intensities As the values that come fromMOSFLM are always underestimates of the true error these values are scaled up in AIMLESS using a three-term correction
sdcorrected = SdFac Sqrt[sd(I)2 + SdBLPI + (SdAddI)2]
Here SdFac is an overall scale factor and SdB and SdAdd are intensity dependent factors
AIMLESS will automatically work out a suitable value for all three parameters in order to make the mean value of (observedscatter)(sdestimate) equal to 10 where observed scatter is the difference between an individual estimate of intensity and the mean ofall other estimates (from symmetry mates)
Probably the best estimate of the true high resolution limit of the data can be obtained from the CC(12) values these are thecorrelations between equivalent observations that have been divided randomly into two half-datasets The resolution limit is foundwhen the CC drops below ~ 05 - 03
This table comes under the heading
ANALYSIS OF STANDARD DEVIATIONS
iMosflm Tutorial
fileUsersandrewg4MOSFLMnewgui_tutorialiMosflm_tutorial_720_ver3html[29052015 105311]
in the AIMLESS log file and Run n standard deviation v Intensity test (where n is 1 or more) in the CCP4i GUI View Files from Job -View Log Graphs display
Can you identify a bad image in this dataset Can you work out why it is bad
(Cluethe image headers contain quite a lot of information that is not used by MOSFLM including the date and time that the image wascollected)
You can exclude a given batch from the scaling using the EXCLUDE keyword
RUN ALL EXCLUDE imagenumber
In this case run number will be 1
Rerun the scaling SENDING THE OUTPUT TO A NEW LOGFILE excluding this image and see the effect on the heights in the anomalousPatterson (in the log file) DO NOT repeat the integration In the command file uncomment the line (near the top) goto aimless so itskips the integration part
In the CCP4i GUI click to highlight the AIMLESS job which is listed as FINISHED and select ldquoReRun Jobrdquo from the control buttons downthe right-hand side of the main interface window Under ldquoExcluded Datardquo in the window that appears check the box next to Excludeselected batches and pull-down on the menu button to exclude a range Give the start amp end range to exclude (eg 74 to 74) Rerunthe job as before
17 Changing the symmetryFrom the list of options at the left hand side of the main window select ldquoUtilitiesrdquo and under that SortModifyCombine MTZ Files
In the new window give a new title eg reindex as H32
Click on the Box Change space group andor reindex reflections
Use the browse option to select the input MTZ file (First orange bar) the output filename will be generated automatically (but you canchange it)
Under Reindex details
In the last option check the box next to ldquoChange space group tordquo and enter H32 in the box This is above the final item Reducereflections to the asymmetric unit which is checked by default
Select Run from the Run option button
Then go back to the scaling window and select the new MTZ file (reindexed) as the input for scaling (use Browse) CHANGE THE JOBTITLE
Then select RUN
The scaling will now be performed in space group H32 Look at the merging statistics in the log file in particular the multiplicityweighted R-factor called Rmeas in the log file
18 Looking at the CTRUNCATE outputThe CTRUNCATE program converts intensities to amplitudes and also compiles some useful statistics The LTEST and the cumulativeintensity statistics tabulated by CTRUNCATE (and plotted by loggraph) provide the only point at which you will be able to detectmerohedral twinning (when the two lattices of the twin components exactly overlap and every measured intensity is actually the sum oftwo intensities)
For a good dataset the observed distribution should be within 1 of the theoretical distribution Is this the case for this data
19 If you have time 191 Different mosaic spreads
Try repeating the processing with the mosaic spread set to a value 25 smaller than the refined one and fix it by checking the Fix boxin the Integration window in iMosflm
Can you tell from the merging statistics if this data is better
192 Checking up on outliers
iMosflm Tutorial
fileUsersandrewg4MOSFLMnewgui_tutorialiMosflm_tutorial_720_ver3html[29052015 105311]
AIMLESS writes a file called ROGUES which lists reflections which show very poor agreement between symmetry mates or which areimplausibly large
Look in this file (it is ASCII) and try to work out why this has happened The ROGUES file gives you the image (Batch) on which thereflections have been recorded (for partials this is the image nearest the centre of the reflection so you may need to look on thepreceding and following image as well) Select a reflection which shows very poor agreement with its symmetry mates (A value greaterthan 10 in the DelIsd column in the ROGUES file)
Select the offending image by double-clicking it in the Images pane of the iMosflm main window Predict the reflections then enter thehkl values into the boxes and hit Return (or click the red warning button following the entry box for l) to locate the offending reflectionin the image You must give the measured indices - the first set of values in the ROGUES file - when doing this See if there is anythingodd about the spot Remember to check adjacent images for partials
193 How accurate does the unit cell have to be
Try changing the cell parameters by (say) 10 and integrate the images again What is the effect on the merging statistics
20 Tips1 When reading images into a session DO NOT attempt to carry out any other task until ALL the images have been read2 It is often worth repeating the indexing (usually only once) as the refined direct beam coordinates from the first indexing may give
an improved solution when the indexing is repeated (lower rmsd)3 Always integrate a few degrees of data before integrating the whole dataset (see sect9) If the space group is not known in advance
run Quicksymm with a few degrees of data to check that the correct indexing solution has been chosen4 For difficult images do not attempt to refine the unit cell initially once an indexing solution has been obtained try integrating a
few images to ensure that the integration is stable If then going on to refine the cell check that the prediction looks OK for thefirst image of every segment included in the refinement If it does not look very good consider using the pattern matching(Settings -gt Processing options -gt Advanced refinement see sect84)
5 If the resolution of the data is less than 35 Aring do not use the ldquoRefine Cellrdquo task Instead use several images in indexing and use thecell that comes from the indexing
6 If iMosflm gets into a state where the activity icon(upper right) is spinning but nothing seems to be happening click on the activityicon to stop it spinning and see if the session can be continued DO NOT click on the activity icon simply to abort a task this willgive unpredictable results Use the Abort button for cell refinement or integration There is no defined way to abort indexing
7 Use the image summation option (see sect4) to get a better impression of the diffraction for very low exposure Pilatus images8 Use image summation for detector parameter refinement for fine sliced very weak Pilatus images (Settings -gt Processing options -
gt Advanced refinement see sect821)9 For large mosaic spread values (gt 10deg) or small mosaic block sizes (lt10) consider increasing the maximum allowed reflection
width to avoid having too many green predicted reflections (Settings -gt Processing options -gt Advanced integration see sect97)10 By default on selecting the Indexing task iMosflm will find spots index and (assuming a solution has been found) estimate the
mosaicity For difficult cases it is more useful to restrict this to simply finding spots and then do the indexing and mosaicityestimation by clicking the appropriate buttons To do this change the check box Automatically index after spot finding inSettings -gt Processing options -gt Indexing
11 See sect521 and sect522 for advice if the indexing fails Also consider the possibility of a reversed phi rotation direction if you arenot familiar with the beamline (Settings -gt Experiment settings -gt Experiment see sect21)
12 If the detector parameters have refined to physically unreasonable values (eg because cell refinement or integration has beencarried out using an incorrect indexing solution) be sure to reset the detector parameters before attempting further processing(Settings -gt Experiment settings -gt Detector see sect21)
13 Always set the resolution limit slightly beyond the point at which any spots are visible (see sect414 ) For very weak fine-sliceddata it can be very difficult to estimate the resolution visually so integrate to the maximum resolution (inscribed circle) and usethe merging results to set the final resolution There should be no problems integrating to a resolution ~03-05 Aring beyond theactual resolution limit but for example integrating to 3 Aring when the true resolution limit is 5-6 Aring may cause problems and theintegration should then be repeated with a more realistic resolution limit
14 Use the site file sect141 if repeatedly processing data where the direct beam position is wrong or if the phi direction is reversed etcto save having to correct this for every session
Appendix IA command script for running MOSFLM using the keywords copied from the Batch processing window of the new GUI (see Integratingas a background job sect952) Note that keyworded input for MOSFLM and other CCP4 programs is case-insensitive apart from file anddirectory names
bincsh -fv Set a unique identifier for filenames for this job
set ident = x89_mos07_blk3_smallsep
iMosflm Tutorial
fileUsersandrewg4MOSFLMnewgui_tutorialiMosflm_tutorial_720_ver3html[29052015 105311]
$ipmosflm COORDS $identcoords SUMMARY $identsummary ltlt eof-ip Insert keywords copied from iMosflm batch window here
Keywords for this run For example could involve trying different values for mosaic spread or not integrating all images etc etchklout $identmtzgenfile $identgenprocess 1 1000 goeof-ip
pointlesspointless hklin $identmtz hklout $ident_pointlessmtz
aimlessaimless hklin $ident_pointlessmtz hklout $ident_aimless_partmtz ROGUES $identrogues ltlt eof-aimless Use all default options for aimlesseof-aimless
ctruncate hklin $ident_aimlessmtz hklout $ident_truncatemtz
Harry Powell Andrew Leslie and Owen Johnson
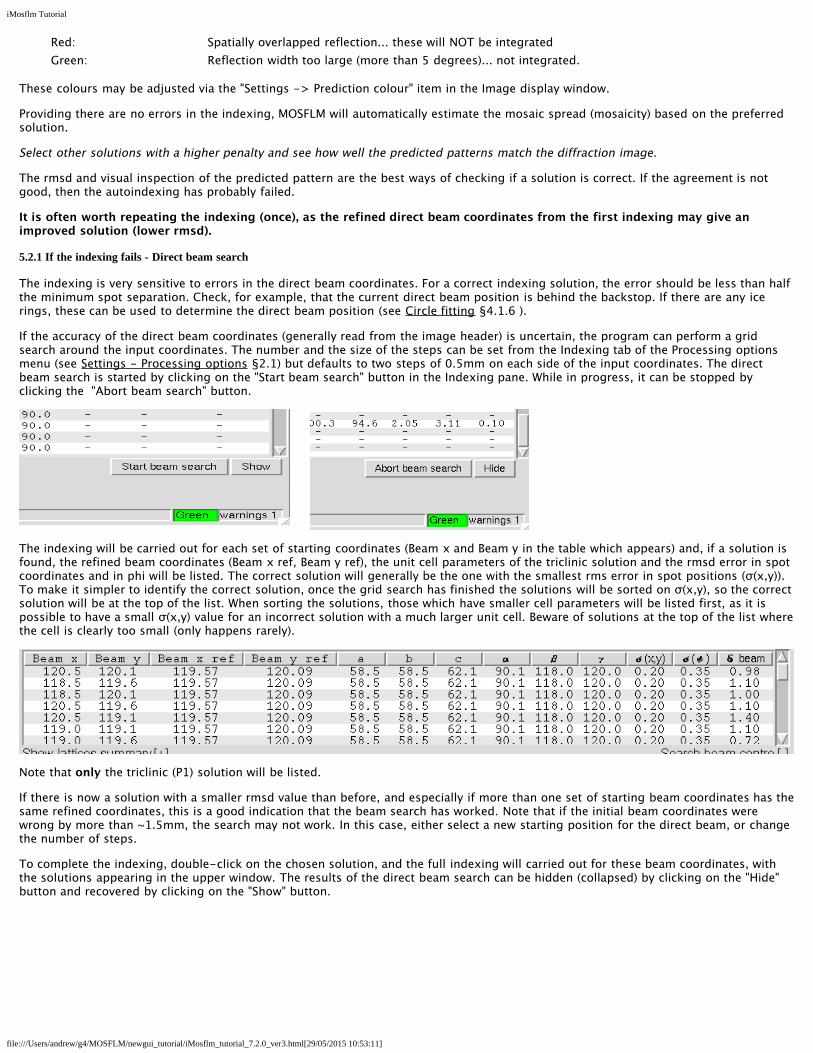
iMosflm Tutorial
fileUsersandrewg4MOSFLMnewgui_tutorialiMosflm_tutorial_720_ver3html[29052015 105311]
Red Spatially overlapped reflection these will NOT be integratedGreen Reflection width too large (more than 5 degrees) not integrated
These colours may be adjusted via the Settings -gt Prediction colour item in the Image display window
Providing there are no errors in the indexing MOSFLM will automatically estimate the mosaic spread (mosaicity) based on the preferredsolution
Select other solutions with a higher penalty and see how well the predicted patterns match the diffraction image
The rmsd and visual inspection of the predicted pattern are the best ways of checking if a solution is correct If the agreement is notgood then the autoindexing has probably failed
It is often worth repeating the indexing (once) as the refined direct beam coordinates from the first indexing may give animproved solution (lower rmsd)
521 If the indexing fails - Direct beam search
The indexing is very sensitive to errors in the direct beam coordinates For a correct indexing solution the error should be less than halfthe minimum spot separation Check for example that the current direct beam position is behind the backstop If there are any icerings these can be used to determine the direct beam position (see Circle fitting sect416 )
If the accuracy of the direct beam coordinates (generally read from the image header) is uncertain the program can perform a gridsearch around the input coordinates The number and the size of the steps can be set from the Indexing tab of the Processing optionsmenu (see Settings - Processing options sect21) but defaults to two steps of 05mm on each side of the input coordinates The directbeam search is started by clicking on the Start beam search button in the Indexing pane While in progress it can be stopped byclicking the Abort beam search button
The indexing will be carried out for each set of starting coordinates (Beam x and Beam y in the table which appears) and if a solution isfound the refined beam coordinates (Beam x ref Beam y ref) the unit cell parameters of the triclinic solution and the rmsd error in spotcoordinates and in phi will be listed The correct solution will generally be the one with the smallest rms error in spot positions (σ(xy))To make it simpler to identify the correct solution once the grid search has finished the solutions will be sorted on σ(xy) so the correctsolution will be at the top of the list When sorting the solutions those which have smaller cell parameters will be listed first as it ispossible to have a small σ(xy) value for an incorrect solution with a much larger unit cell Beware of solutions at the top of the list wherethe cell is clearly too small (only happens rarely)
Note that only the triclinic (P1) solution will be listed
If there is now a solution with a smaller rmsd value than before and especially if more than one set of starting beam coordinates has thesame refined coordinates this is a good indication that the beam search has worked Note that if the initial beam coordinates werewrong by more than ~15mm the search may not work In this case either select a new starting position for the direct beam or changethe number of steps
To complete the indexing double-click on the chosen solution and the full indexing will carried out for these beam coordinates withthe solutions appearing in the upper window The results of the direct beam search can be hidden (collapsed) by clicking on the Hidebutton and recovered by clicking on the Show button
iMosflm Tutorial
fileUsersandrewg4MOSFLMnewgui_tutorialiMosflm_tutorial_720_ver3html[29052015 105311]
522 If the indexing fails - Other parameters
Errors in other physical parameters (wavelength crystal to detector distance) can also result in failure All these parameters should bechecked
Several parameters used in autoindexing can also be adjusted using entry fields and buttons that appear in the Indexing toolbar
Weak images
1 MOSFLM automatically reduces the Iσ(I) threshold for weak images and it may also reduce the resolution to 4Å but lower valuescan be tried It is important not to include spots that are not real - a small number of false spots can prevent the indexing fromworking
2 Try changing parameters for spot finding (see If the spot finding has not worked well sect511)
Multiple lattices
1 Try increasing the Iσ(I) threshold (default 20) for example to 40 or 60 so that only spots from the stronger lattice are selectedThis can be done by entering a new value in the leftmost of the circled icons above (and also via the Indexing tab of Processingoptions)
All cases
1 Include more images in the indexing Select images that are widely spaced in phi not close together2 Select images that show the clearest lunes andor have the best spot shape3 In case the crystal orientation has changed or if you are unsure of the direction of positive rotation in phi try indexing using only
one image4 Make sure that the Max cell edge value is not too small If in doubt set to 200 Aring (or more if the cell is expected to be large)5 If the cell parameters are known reduce the maximum allowed cell edge to the known maximum cell edge This can sometimes
help filter incorrect solutions but use with caution as often this needs to be ~twice the largest cell for successful indexingAlternatively try the known cell option
6 If the detector distance is uncertain and the images are high resolution (eg 2Å) allow the detector distance to refine during cellrefinement Use with caution
53 Indexing multiple lattices simultaneously
This is a new feature and is still undergoing development It is most likely to succeed when the different lattices are clearly separated atleast at higher resolution If the images shows badly split spots with several components (each arising from a sub-crystal with a slightlydifferent orientation) then indexing may well still be impossible
After spot finding examine the image to ensure that spots that are close to each other but belong to different lattices have beenidentified as separate spots and not treated as a single split spot (in which case the red cross will lie midway between the two spots)Adjusting the minimum spot separation (Settings -gt Processing options -gt Spot finding) can help in resolving close spots It may alsohelp to increase the inner radius of the spot search region (see Spot search area sect413) so that low resolution reflections where the
iMosflm Tutorial
fileUsersandrewg4MOSFLMnewgui_tutorialiMosflm_tutorial_720_ver3html[29052015 105311]
spots are not really separated are excluded from the search
The following procedure usually provides the best chance of success
1 Select appropriate images for use in indexing The separation of the lattices can be clearer on some images than others Ideallychoose several images widely separated in phi
2 Do a normal (single lattice) indexing first This will usually work but will give a high positional rmsd because of the presence of morethan one lattice This step is important because it will result in more accurate direct beam coordinates which are crucial for multi-lattice indexing
3 Select the ldquoIndex multiple latticesrdquo icon (next to the Index button) the Index button will change to Index multiple
The indexing results for different lattices will be presented in different tabs while the selected solution for each lattice will be shown inthe lower Summary window Currently a maximum of 5 lattices can be handled The figure below shows a case where 3 differentlattices were found
4 Judge the success of indexing by examining the lattice type and the cell parameters obtained for the different lattices (the cellsshould be very similar) and checking that the predictions match the observed spots The rmsd values for correct lattices should also besignificantly smaller than the value obtained in the initial (single lattice) indexing It may be necessary to manually select a differentautoindexing solution for some lattices in order to get the same lattice type (eg oP) for the different lattices
The Split column in the lower pane indicates the angle between the reference lattice (with value -) and the other lattices This is onlycalculated when the lattices have the same lattice type In this case the angles between lattice 1 and lattices 2 amp 3 are 34 and 16degrees
If a lattice is clearly incorrect it can be deleted by highlighting that lattice (in the lower pane that summarises the results) and using theright mouse button to select ldquodeleterdquo
The predictions for different lattices can be displayed either by highlighting the lattice in the Summary window or by using the latticeselector in the image display pane
iMosflm Tutorial
fileUsersandrewg4MOSFLMnewgui_tutorialiMosflm_tutorial_720_ver3html[29052015 105311]
In the image display spots in different lattices that overlap with each other are shown in magenta Only the summed intensity will bemeasured for these reflections
The predictions for all lattices can be shown by selecting the ldquomerge latticesrdquo icon in the image display
This can be useful to check if all the lattices have been successfully indexed because all spots in the image should then be predicted Inthe display predictions from lattice 12345 are shown in blue yellow red green and magenta with no distinction made between fullyand partially recorded reflections or spatial overlaps
iMosflm Tutorial
fileUsersandrewg4MOSFLMnewgui_tutorialiMosflm_tutorial_720_ver3html[29052015 105311]
531 Practical Tips
Beware of solutions where the lattices only vary in orientation by a small angle (less than 1 degree) as these are often different solutionsfor the same lattice The difference in orientation between lattices is given by the ldquosplitrdquo column in the Summary window but this is onlycalculated if the lattices have the same lattice type Differences are all relative to one lattice which will display a split angle as ldquo-ldquo Tocalculate the angles relative to a different lattice open the tab for that lattice select a different solution to that currently selected andthen select the original solution ndash this will trigger recalculation of the split angles relative to that lattice
Other parameters that can influence the indexing are the rdquoMaximum deviation from integral hklrdquo (default 02 when indexing multiplelattices otherwise 03) and ldquoNumber of vectors to find for indexingrdquo (default 30) These can be changed via the Indexing tab of theldquoProcessing Optionsrdquo that can be selected from the ldquoSettingsrdquo menu item Values between 015 and 025 might be helpful for the firstparameter and increasing the number of vectors from 30 to 50 can also help At present there is no defined protocol for changing thedefault parameter values for particular cases it has to be done by trial and error
Experience so far has shown that selecting appropriate images and adjusting the maximum cell length used in indexing have the biggesteffect The optimum value for the maximum cell length will normally lie between one and three times the largest cell dimension but it isworth varying this in steps of between 25 and 50 Aring as the indexing can be very sensitive to this parameter
For a more complete discussion of multiple lattice indexing see Powell HR Johnson O amp Leslie AGW 2013 Autoindexingdiffraction images with iMosflm Acta Cryst D69 1195-1203
54 Known cell option
For images that are very difficult to index if the cell parameters are known the known cell option can be usedSelect the ldquoKnown cellrdquo icon (next to the Multiple lattices icon) Enter the cell parameters in the Input known cell pop-up window andselect OK when all 6 parameters have been provided Then select the Index Cell button
To revert to normal indexing select the ldquoKnown cellrdquo icon and then select Clear in the Input known cell pop-up window
55 Space group selection
Note that the indexing is based solely on information about the unit cell parameters It will therefore be very difficult (or impossible) todetermine the correct Laue group in the presence of pseudosymmetry For example a monoclinic space group with β ~ 90deg will appearto be orthorhombic an orthorhombic space group with very similar a and b cell parameters will appear to be tetragonal These can onlybe distinguished when intensities are available (ie after integration) by running POINTLESS (QuickSymm) (see Running Pointless to check the
iMosflm Tutorial
fileUsersandrewg4MOSFLMnewgui_tutorialiMosflm_tutorial_720_ver3html[29052015 105311]
symmetry sect10)
In addition it is not possible to distinguish between Laue Groups 4m and 4mmm 3 and 3m 6m and 6mmm m3 and m3m Thiswill not affect integration of the images but it will affect the strategy calculation In the absence of additional information the lowersymmetry should be chosen for the strategy calculation to ensure that a complete dataset is collected
The presence of screw axes also cannot be detected so there is no basis on which to distinguish P21 from P2 etc This does not affectany aspect of data collection or processing and can be chosen (on the basis of systematic absences) after integration by runningPOINTLESS
In this example there is no way of knowing at this stage if the space group is h3 or h32 so leave it as h3
56 Mosaicity estimation
If the Automatically index after spot finding option has been chosen (Indexingtab of Processing Options) the mosaicity (mosaic spread) will be estimatedautomatically for the preferred solution However if another solution is chosenthe mosaicity should be estimated again
Click on the Estimate button to estimate the mosaicity
A window will appear which plots the total predicted intensity as a function ofmosaic spread from which an estimate is determined
The predictions displayed on the image will be updated Entering different valuesof mosaic spread in the box (followed by return) will allow a visual estimate of theeffect of changing the mosaic spread
The mosaic spread can also be entered in the Images pane by clicking once on theMosaicity line and once again on the value displayed
561 The mosaic block size
In some cases the apparent mosaic spread is much larger at low resolution than at high resolution so that if it is set to a value thatresults in all the low resolution spots being predicted many more spots are predicted than are visible at high resolution This effect isbest dealt with by adjusting the Mosaic block size which is also displayed in the Images pane This is modelling the size in microns ofthe individual mosaic blocks in the crystal Decreasing this to values of 05-5 microns (say) from the default of 100 microns will resultin predicting more spots at low resolution but have virtually no effect at high resolution This parameter is not refined (at present) andso the best value must be determined by trial and error
6 Saving and recovering a sessionThe session can be saved at any time using the Session drop-down menu referred to in sect21 The first time that a session is saved youwill be prompted for a filename The filename convention for saved session files is that the extension is mos
Save the current session Then exit from iMosflm (using the Session drop-down menu) restart iMosflm and read in the saved session
If the program crashes it should be possible to recover all but the latest actions as a temporary copy of the session file is continuallysaved to the directory mosflm in the users home directory
Restart iMosflm and it will pop up a Recover session window
Selecting the Recover button will restore the session as far as possible
iMosflm Tutorial
fileUsersandrewg4MOSFLMnewgui_tutorialiMosflm_tutorial_720_ver3html[29052015 105311]
7 Data collection strategyOnce the crystal orientation and (probable) Laue group have been determined it is possible to calculate a data collection strategy andthe Strategy icon is no longer greyed-out (in fact all other operations Strategy Cell Refinement and Integration become possible at thispoint)
Select the Strategy icon This will open the Strategy window
The statistics initially presented in the window are based on the images read in to the current session If only two (or more) references
iMosflm Tutorial
fileUsersandrewg4MOSFLMnewgui_tutorialiMosflm_tutorial_720_ver3html[29052015 105311]
images have been read in no statistics will be presented
When the Strategy option is used after two initial images (typically 90deg apart in φ) have been collected a complete shaded segment willnot be shown in the lower part of the screen rather an empty circle will be shown with the matrix label beneath it Click the Auto-complete button and in the pop-up menu that appears select a rotation angle or sweep of data to collect - or leave the Rotationsetting as Auto for a calculation of maximum completeness for this crystal orientation Click on Ok and the completeness results willbe presented
The orientation of the crystal expressed as the angles between the abc unit cell axes and the XYZ coordinate frame is given X isalong the X-ray beam Z is the rotation axis A warning will be given if the unique axis is so close to the rotation axis that there will bemissing cusp data
71 Evaluating completeness manually
The completeness of any given segment of data can be determined manually using the circle at the bottom left of the window Click onthe red segment shown in this circle
This will result in small black boxes being drawn on the circumference at the start and end of the red sector
Use the LMB to click on the black box at 0 and drag this around the circle
When the LMB is released the statistics for that sector will be displayed The statistics are presented in two ways Near the top right ofthe window the overall completeness is shown as red circles for unique data and anomalous pairs The average multiplicity is givenbeneath these circles
More detailed statistics (such as completeness as a function of resolution) are given in a series of histograms that can be selected by adrop-down menu
72 Calculating a strategy automatically
Uncheck the Use checkbox at the right side of the hg_001 line listed in the sector list near the top of the Strategy pane This means
iMosflm Tutorial
fileUsersandrewg4MOSFLMnewgui_tutorialiMosflm_tutorial_720_ver3html[29052015 105311]
that the 84 images used thus far will not be included in the completeness calculation only the matrix derived from indexing them willbe used Select the Auto-complete button to calculate a strategy automatically
A strategy calculation data pop-up window will appear
If multiple matrices have been defined (for different sectors of data) then the appropriate one can be selected (if there is only one sectorthis has no effect)
The total φ rotation to be used is normally calculated by MOSFLM based on the Laue group and the crystal orientation (the Auto setting)However it is sometimes possible to achieve a high completeness with a significantly smaller total rotation (eg 60deg in two 30degsegments will typically give gt94 completeness for orthorhombic space groups) and this can sometimes be useful if radiation damage isa serious problem although when using hybrid pixel detectors it is better to use a very conservative exposure time and collect a wide φrotation
Total rotation angles of between 5deg and 90deg can be selected from the drop-down list The number of segments to be used can be setbetween 1 and 3
If the check box is checked data completeness will be calculated to optimize the proportion of anomalous data collected
THIS IS IMPORTANT The optimum strategy is often different when maximising completeness of the anomalous data
Choose the default values (Rotation Auto Segments 1) but check the anomalous data box then click on Ok Look at the variousstatistics presented as bar charts
In space group H3 if rotating around the c axis a total rotation of 120deg would be required to collect a complete dataset (ignoring anydata lost in the cusp) Because the c axis is 22deg away from the rotation axis in this case it is possible to collect very high completeness(for unique data) with a rotation much smaller than this
Try to find the minimum total rotation that will give a dataset that is gt95 complete for the unique data Now do the same butrequiring gt95 completeness for the anomalous data
SKIP OVER SECTION 73 IF DOING THE NORMAL TUTORIAL
73 Calculating a strategy using multiple crystals
The Strategy pane may also be used when due to radiation damage many crystals are required to collect a complete dataset
IMPORTANT This procedure will only work correctly for space groups where there is no indexing ambiguity For those spacegroups where there is an indexing ambiguity( see httpwwwccp4acukdisthtmlreindexinghtml for a complete list) it isnecessary to integrate images to determine whether different crystals have been indexed in the same way This is not achievablewithin the Strategy option at present
Suppose the first crystal has been indexed from the reference images
Enter the Strategy pane an empty circle is displayed in the bottom part of the screen and click on the Auto-complete button nearthe top-right of the pane In the Auto-complete window that appears choose a suitable Rotation angle for the amount of datathat can be collected from one crystal say 20 degrees for this example Leave Segments set to 1 and do not check Optimize foranomalous data
Click the Ok button and the completeness of the data will be displayed The matrix name start and end phi values and the phiextent will be displayed in the top area of the pane with a checkbox ticked under the Use column This means this segment will beused in further strategy calculations
Accept and save this result by clicking on the yellow hatched segment displayed in the large circle near the bottom of the paneClick once and the segment will be outlined in black (you can adjust the start or end phi value calculated in one degree incrementsby click+dragging the respective black square) click again this time on the black square denoting the start or end phi (or release ifyou have adjusted by click+dragging) and the segment will turn red The segment will not be saved unless it has turned red
This result will be saved if you leave this pane (eg to load more images) and return later in this session The strategy file can alsobe saved to a permanent file using the Save button on the tool-bar This is highly recommended when working with many crystals
Return to the Strategy pane when you have loaded and indexed the reference image(s) from the second crystal and repeat the procedureabove You will see the calculated segment from the first matrix displayed at the bottom-left of the screen The optimum phi range for
iMosflm Tutorial
fileUsersandrewg4MOSFLMnewgui_tutorialiMosflm_tutorial_720_ver3html[29052015 105311]
the second crystal will be displayed Save this in the same way as for the first crystal (clicking twice) Repeat this procedure for anysubsequent crystals and in each case the optimum phi range will be calculated for the latest crystal taking into account the data fromprevious crystals
It is a good idea to save the strategy to a file as each new crystal is added in case the program crashes and this information is lost
In practice it is probably safest to have a separate iMosflm session that is reserved for the strategy calculations and not used to processany data The strategy for each new crystal can be calculated as described above If there is a problem and the session is corrupted or ifiMosflm is closed down for any reason it is straightforward to restore the status of the session providing the strategy has been savedThe following steps should be taken
1 Read in the reference images for the latest crystal and index them
2 Select the Strategy pane
3 Read in the optimised strategy for all previous crystals using the ldquoAddrdquo button and giving the appropriate filename
4 Making sure that the circle for the latest crystal is highlighted in the lower left window click on lsquoAuto-completersquo and follow the stepsdescribed above
Advanced Usage
The startend phi values for each crystalmatrix can be updated This might be required if for example only 10 degrees of useful datawere collected from a particular crystal instead of the anticipated 20 degrees To change the phi values click either on the matrix namein the top pane or on the circle showing the segment of data in the lower left pane (these are highlighted in a blue box as the mousemoves over them) The corresponding segment will now be displayed in the larger circle Click on the red segment so that a blacksquare appears at the startend phi values Then simply drag the appropriate phi to the desired value The completeness willautomatically be updated (but the strategy calculation for the latest crystal will not be repeated to do this the current segment must bedeleted by highlighting the matrix name and using right click and then repeating the Auto-complete step)
If matrix files saved from iMosflm are available from crystals for which data have been collected in previous sessions these can beadded into the calculation using the Add matrix button on the tool-bar
If the saved strategy result has become complicated or is incorrect and you wish to restart the calculations afresh there is a tool-barbutton Reload sectors from session This will remove any calculated sectors while leaving any known matrices listed at the bottom-leftof the Strategy pane
If you have saved a strategy file from a previous session this can be used to re-initialize the Strategy pane using the Load button onthe tool-bar
A Spacegroup pull-down menu has been added to the tool-bar to permit different choices of space group to be used in thecalculations (eg H3 and H32) This menu is populated from the list offered on the Indexing pane However the space group symboltext is editable Any space group symbol entered will be validated by Mosflm together with the current cell parameters
As a calculator for a multi-segment strategy the Strategy pane is reasonably flexible you can Save or Delete highlighted matrix lines byright-clicking As you highlight different matrix lines the orientation of the crystal expressed as the angles between the abc unit cellaxes and the XYZ coordinate frame is re-displayed in the centre of the pane
The following screen shot shows the cumulative results in the Strategy pane after this procedure has been followed for four crystals(ignore the iMosflm version number)
iMosflm Tutorial
fileUsersandrewg4MOSFLMnewgui_tutorialiMosflm_tutorial_720_ver3html[29052015 105311]
731 Calculating a strategy when some data have already been collected and processed
This option is not yet implemented If data have already been processed (to give an MTZ file) but the images are not currently available (eg they were collected on a previoussynchrotron trip possibly at a different synchrotron) then the MTZ file containing this data can be read and used to calculate a strategyfor data collection from new crystalsThe MTZ icon in the tool bar is used to read the MTZ file
74 Calculating a suitable oscillation angle
To calculate the maximum possible oscillation angle while avoiding spatial overlaps click on the Check for overlaps button A pop-upwindow will appear from which the option to calculate the maximum oscillation angle (as a function of φ) or check how many overlapswill occur for different (user selected) oscillation angles The results are plotted in the same pane as the histograms for the strategycalculations Note that the overlap calculation is based on the current values for the mosaic spread and spot separation and can be verysensitive to these values Note also that these are maximum and not necessarily recommended oscillation angles
iMosflm Tutorial
fileUsersandrewg4MOSFLMnewgui_tutorialiMosflm_tutorial_720_ver3html[29052015 105311]
8 Cell refinementIt is important to determine the cell parameters accurately before integrating the images Although the unit cell is refined as part of theautoindexing providing the diffraction extends beyond ~35Å resolution it is possible to obtain more accurate cell parameters using aprocedure known as post-refinement This procedure requires the integration of a series of images in ideally two or more separatesegments at widely different φ values The distribution of the intensity of partially recorded reflections over the images on which theyoccur is used to refine the unit cell crystal orientation and mosaic spread
Select the Cell Refinement icon
81 Selecting the images
iMosflm Tutorial
fileUsersandrewg4MOSFLMnewgui_tutorialiMosflm_tutorial_720_ver3html[29052015 105311]
There are several ways to select the images to be used in cell refinement Whichever method is used the image numbers will bedisplayed in the Images entry field iMosflm will automatically select appropriate images but these can be changed
811 Manual selection
A list of images can simply be typed into this box An image series can be specified as n-m where n and m are the first and last imagesDifferent series must be separated by white space or comma
For orthorhombic or higher symmetries two segments should be given approximately 90deg apart in φ For monoclinic or triclinic datathree or four segments are best (eg φ = 04590135)
The number of images that should be included in each segment depends on the mosaic spread and oscillation angle A reasonablenumber is 2(mosaic spreadoscillation angle +1) MOSFLM will automatically select two or more segments as appropriate Note thatthere is a limit on the total number of images that can be used
812 Automatic selection
Selecting the Automatically select images icon will select a suitable set of images
813 Graphical selection (Not recommended)
Selecting this icon will give a new window
Images can be selected by clicking in the Use check-box in the list of images or by using the mouse to drag a selection of imagesfrom the sector displayed The other icons allow the sector to be zoomed in or out and the viewed area to be moved to make theselection easier The final two icons on the tool-bar switch the segment display to fit the display space as either a full circle or aquadrant This Image palette can be closed by clicking outside its area but will close after 60 seconds anyway
82 Integrating the images and refining the cell
Use one of the methods above to select images to use in cell refinement and click on the Process button Before starting cell refinementcheck that the prediction for the first image in each segment to be used is good The majority of the spot positions must be correctlypredicted for the first image in each segment or else the refinement will not work
The selected images will be integrated and following integration the cell parameters are refined Selectable refined detector parameters
iMosflm Tutorial
fileUsersandrewg4MOSFLMnewgui_tutorialiMosflm_tutorial_720_ver3html[29052015 105311]
will be plotted as will the changes in crystal orientation and (if selected) mosaic spread If the shift in cell parameters is greater than 25standard deviations another cycle of integration and cell refinement is carried out Typically two or three cycles are required forconvergence Note that the current program activity is shown in the bottom left-hand corner of the window in the status message area
The different windows are explained below Moving the mouse over any parameter or plotted graph point will give a full description ofit
821 The detector parameters window
The values of the refined detector parameters are displayed for each image as it is integratedThere is the option to fix any of the parameters during integration by checking the Fix box onthe right The positional residuals (overall central and weighted) are also listed
Any of these parameters can be selected for plotting on the graph that appears to the right ofthis box by simply clicking on that parameter (which is then highlighted in blue as shown herefor Beam x and Beam y)
Check the stability of the refined parameters by displaying the appropriate graphs To getsensible scaling of the graphs only parameters with similar numerical values should be plottedtogether
For weak images (ie few visible spots in the outer regions of the image) the tilt and twistmay not be well defined and might refine to large values (greater than one degree) Insuch cases these parameters should be fixed It is not generally recommended to fix any
iMosflm Tutorial
fileUsersandrewg4MOSFLMnewgui_tutorialiMosflm_tutorial_720_ver3html[29052015 105311]
other detector parameters
For very weak fine sliced images (Pilatus only) there is the option to sum images when findingsuitable spots for refinement see Settings -gt Processing Options -gt Advanced refinementwhich can in some cases make the refinement more stable
822 The crystal parameters window
The values of the refined crystal missetting angles φ(x) φ(y) φ(z) the unit cell parameters andmosaic spread for the current image are displayed in the table Selected parameters will beplotted as for the detector parameters Specific unit cell parameters can also be fixed
If more than one segment of data is being used for cell refinement it is not unusual to see achange in orientation of the crystal between the two segments
Observe how the crystal orientation is different for images in the two segments See how themosaic spread varies during refinement
823 The central spot profile
The average spot profile for the central region of the detector is plotted for eachimage This confirms that the spot prediction is good If the profile is not welldefined and central in the box or if the blue border for the peak region of the spot ismuch larger than the apparent spots size it suggests a problem with the integrationand the initial prediction should be checked In some cases it may be necessary toincrease or decrease the Profile Tolerance parameters to ensure that the blue boxfits the spot To do this select the Advanced integration tab of Processing optionsCheck the central spot profiles for the images used in the cell refinement
824 The summary window
This window presents a summary of how selected parameters have changed indifferent cycles of the cell refinement The behaviour of these parameters gives agood indication of whether the cell refinement has been successful
If the refinement has been successful the RMS residual should be lower for thefinal cycle than in previous cycles However errors in the cell can be compensatedquite well by changing the crystal to detector distance so the differences are notalways dramatic
The other parameters that can be plotted from the pull-down list are the detectordistance and the Pixel ratio (Yscale)
The detector distance should be the same for all images in the refinement If the original indexing was based on auto-indexing a singleimage (say the first) then the detector distance might change for images from the second segment to compensate for an error in theoriginal cell If the variation in distance for different images increases with the cycle number this indicates that the refinement is notstable
The Pixel ratio (Yscale) parameter may also show an initial variation for images in different segments because refining Yscale (whichshould be 10000 for all except Raxis II and Raxis HTC detectors) can compensate for errors in cell dimensions in the same way that thedistance can The final values (last cycle) should be very close to identical for all images and should also be very close to unity (to within00010)
Cell refinement can be unstable if the data do not extend to at least 35 Aring If it appears unstable use the cell derived from auto-indexing a series of images well spaced in φ instead
iMosflm Tutorial
fileUsersandrewg4MOSFLMnewgui_tutorialiMosflm_tutorial_720_ver3html[29052015 105311]
Examine the plots to see if the parameters are stable and correct (Yscale)
825 The final results
When refinement has converged (or after 5 cycles) the initial and final cell parameters and the estimated errors (std dev) are listed
If time is available make a note of the std dev values and repeat the cell refinement using a larger number of images in each segmentAre the standard deviations smaller when using more images
83 Refining cell parameters for multiple lattices
Providing the resolution is high enough (generally better than ~35-32 Aring) and not too many of the spots in the different lattices areoverlapped it is possible to refine the cell parameters for each lattice individually The lattice to be refined is selected from the Latticeselector
This selector will be grayed out when processing a single lattice
84 If the prediction for the first image of a segment is poor
In some cases depending on how the indexing has been carried out or if the diffraction is poor or there has been a large change incrystal orientation during the data collection the prediction for one or more of the segments (the first image) may be poor In suchcases the integration and hence the cell refinement may fail It may be possible to successfully process the images after an initialrefinement of the crystal orientation using a pattern matching algorithm To select this option got to the Advanced refinement tab ofProcessing options and select the tick box for Refine orientation of first image in any run by pattern matching and for Integrate allimages Then refine the cell in the usual way During integration the orientation will be refined for the first image of each segmentoutput for this additional refinement will be written to the logfile but is not shown in the GUI
9 IntegrationThe accurate cell parameters are now used in the integration Note that although the images are integrated during the cell refinementthe intensities are not saved and no MTZ file is generated at that stage
It is good practice to start by integrating a block of images corresponding to a few degrees of data to check that the parameters do notneed further adjustment MOSFLM will generate warning messages after integration if there are any difficulties and it may be possibleto improve the situation by changing some of the default parameters (see Warning messages sect13)
Before integration ensure that the backstop shadow has been defined (see Masked areas backstop sect411 and Masked areas generalsect412)
91 Image selection
Image selection is performed in exactly the same way as in the cell refinement In this case the Automatic selection will simply includeall images in the current sector
Select images 1-10
92 Setting the MTZ filename and controlling updating of the image display
Two icons appear when the integration option is chosen
If the Show predictions icon is clicked the display window will be updated as eachimage is processed This will slow down the processing but allows the accuracy of theprediction to be checked for each image
iMosflm Tutorial
fileUsersandrewg4MOSFLMnewgui_tutorialiMosflm_tutorial_720_ver3html[29052015 105311]
Click on this icon so that the display will be updatedThe filename of the MTZ file containing the results of the integration is generatedautomatically but can be edited manually
93 Integrating the images
Click on the Process button to start integration
Integration of the images occurs in two passes In the first pass for each block of images (a number corresponding to a few degrees ofdata selected automatically by MOSFLM) the detector and crystal parameters are refined for each image in turn and the measurementboxes for all predicted spots are written to a file for use in the second pass In the second pass the standard profiles are formed fromreflections present on all of the images in this block and each image is then integrated and the results written to the MTZ file Thedisplay is not updated during the second pass and will remain on the last image of the block (assuming image updating has beenselected)
Note that the unit cell dimensions are normally fixed during integration and only the crystal orientation and mosaic spread are refinedCrystal parameter refinement only starts when a sufficient number of images have been integrated to provide data for the post-refinement typically after ~05-1 degree (more for high mosaicity)
94 Parameter display windows
As described in sect82 the refined detector and crystal parameters will be displayed in tables and selected parameters will be plotted ingraphs The average spot profile for each image will also be displayed
The size of these graphs (and the profile) can be expanded to fill the whole window by holding down Shift and clicking LMB anywherein the graph window A second Shift+click will revert the graph to the original size
In addition to these windows there are windows that tabulate and plot (as a function of image number) the mean Iσ(I) for profile fittedand summation integration intensities The overall values and the values for the highest resolution bin are given
The number of overloaded reflections Bad spots (ie those that fail certain tests see mosflm SUMMARY file sect15) Spatial overlaps andif processing multi-lattice images the number of lattice overlaps is listed for each image and can be plotted by highlighting thatparameter When processing data from crystals with large unit cells it is important to watch out for spatial overlaps (see sect97 for tips onhow to reduce the number of spatial overlaps if this is a problem)
A display of the standard profiles for different regions of the detector is also provided Poor profiles are averaged by includingreflections from inner regions of the detector Averaged profiles are indicated by a red line around the spot (rather than blue) Theoriginal unaveraged profile can be viewed a clicking on the profile (providing there were sufficient spots in that region to allowformation of a profile)
The profiles should be checked to see that they are well defined and centred within the box Poorly-defined diffuse or non-centredprofiles may suggest that the prediction is not very good in which case this should be checked on the corresponding image(s)
It may be useful to expand the standard profiles to fill the window using Shift + click in the profiles window
Finally the lower left window plots Iσ(I) as a function of resolution for any selected image
iMosflm Tutorial
fileUsersandrewg4MOSFLMnewgui_tutorialiMosflm_tutorial_720_ver3html[29052015 105311]
Different parameters can be plotted by selecting the small right- or left-pointing arrows on the title line above the plot
95 Integrating the whole datasetAssuming that everything looks OK the entire dataset can now be integrated However it is strongly recommended thatProjectCrystalDataset names are assigned first These are written to the output MTZ file and used by downstream programs inparticular AIMLESS will use this information when deciding which images belong to the same dataset
Select Experiment settings from the Settings drop-down menu (see Drop down menus sect21) to enter these names and optionally givea title for the MTZ file
Select images 1-84 and click on Process
951 Parallel Integration Using multiple cores
An option is available on the pull-down menu (next to the Process button in the Integration task) which splits up the integration jobover available cores on the local machine All aspects are currently determined automatically at present user-configurable options willbe available in a later version The algorithm used is as follows
iMosflm determines the number of cores available on the local machineIf the number of cores (N) is greater than 2 iMosflm splits the integration run into N-1 batches (up to a maximum of 16) containingapproximately the same number of images If N le 2 iMosflm splits the run into N batches
If the total number of images in each batch is less than 32 the number of batches is decreased until this condition is satisfied
The first batch is submitted as a background task consisting of a refinement stage and an integration stage with its input and outputfiles (including the MTZ file) in a new directory its name being determined from the number of segments of data being integrated andthe lattice number (if the sample has been determined to contain multiple lattices) If the directories exist already they are all movedinto a newly-created directory with a time-stamped name the files from the most recent integration run are thus in directories withnames following the pattern described above Once the refinement stage is complete the refined parameters are written to a file
The launch of subsequent batches are delayed until the corresponding preceding batch has written its refined parameters This file isread and the new batch is launched again with a refinement stage and integration stage
At present the job cannot be aborted once it has started
952 Integrating as a background job
By selecting Batch in the drop-down menu adjacent to the Process button the integration can be run as a background job rather thaninteractively and the GUI can be used to look at a different dataset
Selecting Batch from the drop-down menu will display a new window showing the script that will be used to process the images alongwith a number of processing options The script can be edited if additional keywords are required or if some parameters are to bechanged and can also be copied and pasted into a file for off-line processing
By default the job is divided into batches across multiple cores as determined for the parallel integration described in sect951 but thenumber of cores can be chosen by the user from a drop-down menu in this case the size of each batch is determined by the interface
Plotting the results of the integration can be turned off this can make processing much faster
iMosflm Tutorial
fileUsersandrewg4MOSFLMnewgui_tutorialiMosflm_tutorial_720_ver3html[29052015 105311]
It is possible to configure job submission for remote machines (which can be added by depressing the add host button) Ensure youhave enabled passwordless logins for all the remote machines you enter and that you specify the full path to the Mosflm executable inthe Batch destinations window The remote working directory (in which the log and MTZ files are written) and the remote imagedirectory must both be specified with their full path names Any required parameter fields that are not completed by the user arehighlighted in orange if the user tries to submit a job without completing these fields a new window containing only those fields (againhighlighted in orange) pops up with a request to do so
The number of cores available on the selected host can be determined by depressing the apple core button on the Batch destinationsconfiguration window
The log file for batch submission jobs the MTZ and SUMMARY files are written to the directory in which iMosflm was launched
96 Checking the integration
iMosflm Tutorial
fileUsersandrewg4MOSFLMnewgui_tutorialiMosflm_tutorial_720_ver3html[29052015 105311]
The detector and crystal parameter plots should be examined carefully to check for any instability in the refinement If there are largeand random variations in some parameters (eg the detector twist and tilt) then it may be better to fix them and repeat the integration
For cases (eg very small unit cells) where there are very few suitable reflections on each image the refinement of the missetting anglesmay show significant variations from one image to the next In such cases it is best to apply smoothing to the missetting angles usingthe tick box in Settings -gt Processing options -gt Advanced Refinement
Discontinuities due to blank images should also show up and the offending images should be removed from the scaling run
If adjacent spots are incompletely resolved on the detector it may be possible to improve the processing by increasing the PROFILETOLERANCE parameters by 1-2 These parameters can be set in the Advanced integration tab of the Processing options menu (useSettings)
97 Advanced features for integration
The Settings -gt Processing options menu allows additional control over the integration Parameters such as the minimum spotseparation resolution limits excluded resolution ranges block size MTZ filename and BATCH ADD can be changed in the Processingtab
Manually decreasing the minimum spot separation can help if a large number of reflections are flagged as spatially overlapped (redboxes) The prediction must be updated to see the effect of changing the separation this can be done either by displaying the next orprevious image or double clicking on the blue circle next to the image currently displayed in the Images pane
In the Advanced integration tab the measurement box parameters profile tolerance and profile averaging parameters can be set
The measurement box parameters can be adjusted for rare cases where the estimation of the spot size has not worked correctlyresulting in a box that is too small or too large The optimisation of the background rim and corner cutoff parameters that determinewhich pixels are used for the background and which pixels for the peak can also be turned off but this is generally not recommended
Increasing the profile tolerance can help in cases where adjacent spots are not completely resolved this can be judged by examining thestandard profiles By default the profile tolerance is automatically increased if there are a large number of spatial overlaps as this hasthe effect of reducing the minimum spot separation A message will be written to the logfile if this has happened This option can beturned off using the tick box Optimise profile tolerance values to avoid spot overlap
The profile outlier exclusion parameters control the exclusion of ice spots or hot pixels which could otherwise corrupt the standardprofiles
Pixels with a value less than the Null pixel threshold are considered to belong to inactive regions of the detector
The pixel saturation value determines when a reflection is considered to be an overload The intensity of overloaded reflections isestimated by profile fitting but these reflections are rejected by the scaling program AIMLESS by default
Increasing the Maximum reflection width in φ from the default value of 5deg will reduce the number of rejected reflections (green boxes)and is worthwhile when the mosaicity is very high or the mosaic block size is very small As with the minimum spot separation theimage must be refreshed to see the effect of changing this parameter
The rejection criteria will reject reflections with too much variation in the background (BGRATIO) or where the gradient of thebackground plane is too large These should only be changed if many reflections are being rejected PKRATIO only applies to fullyrecorded reflections and reflects a very poor profile fit With current data collection protocols there will be very few (if any) fullyrecorded reflections
Additional MOSFLM parameters will be added based on user requests
98 Integrating multiple lattices
When multiple lattices have been successfully indexed each lattice can be integrated individually by selecting the appropriate latticenumber
Reflections in the chosen lattice that are overlapped by a reflection from another lattice will be integrated but the measurement box willbe expanded so that the total intensity of the two (or more) reflections is measured These reflections will be flagged for specialtreatment Reflections that are not overlapped are referred to as singletons They will be dealt with in the normal way by POINTLESSand AIMLESS
NOTE If more than one lattice has been indexed and the results of integrating just ONE of the lattices are to be checked byrunning QuickSymm or QuickScale then the multi-lattice icon in the Integration pane must be turned off otherwise an error
iMosflm Tutorial
fileUsersandrewg4MOSFLMnewgui_tutorialiMosflm_tutorial_720_ver3html[29052015 105311]
message will be given saying that all lattices must be integrated
It is often the case that by measuring both lattices (in separate integration runs) and inputting both MTZ files to QuickScale the overallcompleteness is high using ONLY the singletons To use this option ensure that the multi-lattice icon is off
To make use of the intensity estimates for overlapped reflections MTZ files for all lattices must be input to the program FECKLESSwhich will derive the best estimate of the summed intensity This is the default option if more than one lattice has been indexed and itrequires that all lattices have been integrated (in separate runs) prior to running QuickSymm or QuickScale (FECKLESS will be runautomatically)
At this time no downstream programs can make use of the summed intensities of overlapping reflections but in the future it should bepossible to use this data in REFMAC
Currently it is recommended to use only singletons from all the lattices FECKLESS is not required in this case
The MTZ filename is automatically updated to reflect which lattice has been chosen to avoid overwriting the MTZ file of the first latticewhen integrating the second one FECKLESS when run from iMosflm relies on this naming convention so do not change it
10 Running Pointless to check the symmetryOnce the images have been integrated (even a few degrees of data in many cases) the program POINTLESS can be run to determine thetrue Laue symmetry and try to determine the space group using the QuickSymm button
iMosflm Tutorial
fileUsersandrewg4MOSFLMnewgui_tutorialiMosflm_tutorial_720_ver3html[29052015 105311]
Select the QuickSymm button
A summary of the Pointless results as shown below will appear in a qtRView window
Various graphs (L test for twinning ViewHKL to view the reciprocal lattice) can also be viewed in this window
Various options for POINTLESS such as a reference MTZ file forcing the symmetry selected in iMosflm and specifying multiple input MTZfiles can be selected from the Settings -gt Processing options -gt Sort Scale and Merge tab (see below)
iMosflm Tutorial
fileUsersandrewg4MOSFLMnewgui_tutorialiMosflm_tutorial_720_ver3html[29052015 105311]
Caution The results can be ambiguous if run with a partial dataset Look in the logfile to see how many relfections are used totest each possible symmetry operator
11 Running Aimless to scale and merge the dataSelect the QuickScale button
This will first run POINTLESS then change the space group for the data to that selected by POINTLESS (unless the iMosflm symmetry isset to override POINTLESS) run AIMLESS to scale and merge the data in that space group and then run CTRUNCATE which calculates anumber of statistics from the intensity data The CCP4 UNIQUEIFY script will then be run which generates all the unique reflections forthat spacegroup to the resolution of the measured data and will flag reflections (5 by default but this can be changed) for use as theRfree set
AIMLESS can be run from the QuickScale button either treating anomalous data (the default) or ignoring anomalous data If onlyprocessing a few degrees of data it is usually better to ignore anomalous because especially for low symmetry cases no mergingstatistics may be given in AIMLESS
SCALA can be selected as an alternative to AIMLESS for scaling (not recommended)
There is limited control over running AIMLESS (see figure above) including re-setting resolution limits rejecting batches (images)changing the treatment for accepting partials changing the rejection criterion and changing the procedure for updating the standarddeviation estimates
iMosflm Tutorial
fileUsersandrewg4MOSFLMnewgui_tutorialiMosflm_tutorial_720_ver3html[29052015 105311]
The AIMLESS results will be displayed in the qtRView as shown below along with graphical output (see below) and the full log file canalso be examined
Aimless summary file
iMosflm Tutorial
fileUsersandrewg4MOSFLMnewgui_tutorialiMosflm_tutorial_720_ver3html[29052015 105311]
An example of the Aimless graphical output
The AIMLESS logfile can also be examined by selecting the Log File tab
12 History and mosflm log fileSelecting History allows the history of the session to be examined or by selecting the Log tab the full mosflmlp file can be viewed Themosflmlp file is also available in a time-stamped file mosflm_yyyymmdd_hhmmsslp (eg mosflm_20100518_131019lp) and can beread with a text editor
The History has a tree structure and will show when various parameters have been changed This has not been fully implemented and isnot generally useful
The logfile may provide useful clues when processing has failed
13 Warning MessagesAs already mentioned in Adding images sect3 and Integration sect9 warning messages are generated by MOSFLM during processing Atraffic light colour coding has now been assigned based on the warnings and is shown next to the Warnings box
A Red status implies a serious problem that will affect data quality and should be addressed
An Orange status implies minor issues that should be checked to see if things can be improved
A Green status means no significant problems messages are for information only
iMosflm Tutorial
fileUsersandrewg4MOSFLMnewgui_tutorialiMosflm_tutorial_720_ver3html[29052015 105311]
Abbreviated messages can be obtained by clicking on the Warnings icon The full warning Details together with Hints amp Notes text (ifany are available) can be obtained by double-clicking the relevant warning Details are displayed in a pop-up text box which willdisappear with the next click outside the box The same full details and suggestions are of course available in the mosflmlp files whereeven more information may be available
NOTE This is the end of the part of the tutorial which deals directly with iMosflm but see sect19 which has some suggestions forfurther work if you have time The remainder of this document deals with integrating and scaling data with MOSFLM andAimless via the CCP4i user interface examining the traditional mosflm SUMMARY file with the CCP4 utility loggraph
The Appendix contains a shell script for running MOSFLM as a traditional batch job
14 Useful command line optionsiMosflm has a number of command line options and these can be listed by typingimosflm --helpCurrent options are
--allimages -a ltfilenamegt Starts mosflm loading all files that match the template generated from ltfilenamegt--ccp4i2 Autosaves an iMosflm session file upon exit with an XML list of all iMosflm output files--debug -d Creates a large output file for debugging purposes Dont use this unless asked to by a developer--expert -e Permits access to advanced detector settings This should not normally be required--fastload -f Attempt to speed loading of many images offline while indexing two default images separated by 90 degrees--help -h Displays this message then exits--imagedir -I ltdirectorygt Starts the image browser in this directory if ltdirectorygt is given as an environment variable it will be expanded to its full value--init -i ltfilenamegt Starts Mosflm and reads from the given saved session file--startdir -S ltdirectorygt Starts mosflm in directory ltstartdirgt rather than the current directory This will only work if the directory exists and you have write permission to it otherwise iMosflm will exit All the normal mosflm output files will be in this directory--singleimage -s ltfilenamegt Starts mosflm loading only the image from ltfilenamegt--site -X ltfilenamegt Reads anyall of the following lines from the file given WAVELENGTH ltxgt DISPERSION ltxgt POLARISATION [PINHOLE | MIRRORS | MONOCHROMATOR | SYNCHROTRON ltxgt] DIVERGENCE ltxh xvgt BEAM ltbeamx beamygt DISTANCE ltxgt DISTORTION TILT ltxgt DISTORTION TWIST ltxgt GAIN ltxgt DETECTOR REVERSEPHI DETECTOR OMEGA ltxgt--version -v Displays the program version and required Mosflm version then exits
These can be abbreviated to the shortest unambiguous string
141 The site fileimosflm --site ltsitefilegt will read keywords from the file ltsitefilegt that will overwrite incorrect information in image headers Thissaves having to manually correct values in every iMosflm session The site file can also be read or written as an option from the Sessionmenu (see Drop down menus sect21) Allowed keywords areWAVELENGTH ltxgt
iMosflm Tutorial
fileUsersandrewg4MOSFLMnewgui_tutorialiMosflm_tutorial_720_ver3html[29052015 105311]
DISPERSION ltxgtPOLARISATION [PINHOLE | MIRRORS | MONO | SYNCHROTRON ltxgt]DIVERGENCE ltxh xvgtBEAM ltbeamx beamygtDISTANCE ltxgtDISTORTION TILT ltxgtDISTORTION TWIST ltxgtGAIN ltxgtDETECTOR REVERSEPHIDETECTOR OMEGA ltxgt
15 The mosflm SUMMARY fileMOSFLM produces a summary file listing refined parameters for each image and when using iMosflm this file will be date- amp time-stamped and have a name such as mosflm_20100518_131019sum This contains the same information as the plots produced by theiMOSFLM GUI which now also include the number of bad spots and overloads
This can be inspected graphically from the CCP4i GUI using the program loggraph Select the pull down menu View Files from Job andunder Output files select Additional log graphs where the _SUMMARYloggraph file will be listed Select this file to display its tablesin loggraph
This is very useful to identify rogue images (with unusually high positional residual or low Iσ(I)) If you find any read that image intoMOSFLM and see what is wrong with it
If you have done more than one integration run during your MOSFLM session you will find multiple entries of the tables Look at the lastset for integration of the 84 images
Click on the Refined detector parameter tables and check on the stability of parameters like the TILT and TWIST of the detector (unitsare hundredths of a degree) and for Mar Research (or DIP) image plate data the distortion parameters ROFF and TOFF (units are mm) Ifthey are varying a lot (more than 20 for TWISTTILT) or 015 for ROFFTOFF then it is probably a good idea to fix these parameters atthe average value (or the known values for this detector if they are available) (see Detector parameters sect821)
Click on the Post refinement table and check the missets It does not matter if they change slowly and by an amount (per image) that isless than 01mosaic spread If they are changing more than this then there could be a problem with processing the data (there is notmuch you can do about this)
Check how the mosaic spread is changing If it is unstable or if you think it is not refining to sensible values (as judged by looking atthe prediction) then you can fix the input value in the same way as the detector parameters (see Crystal parameters sect822)
BADSPOTS AND OVERLOADS
The program will set a rejection flag for those reflections that fail certain tests for example too much variation in the background levela poor profile fit an intensity that is very negative (more than 5 standard deviations) a very high gradient for the background planeThese reflections are called Bad spots and they are listed individually for each image in the mosflmlp file together with the reason forflagging them The number of bad spots is also written to the summary file Generally there should be very few (5-10) bad spots oneach image If there are more it could be because the backstop shadow is not correctly allowed for (consider using the NULLPIXkeyword)
There should also be very few overloaded reflections on each image If there are a lot then a separate low resolution data collectionpass should be made with a much shorter exposure time
IMPORTANT Both Bad spots and Overloads are written to the output MTZ file but will be rejected by default by AIMLESS Theintensity of overloaded reflections is estimated by profile fitting that part of the spot that is not saturated To include these reflections inthe final merged data use the ACCEPT keyword in AIMLESS
16 Scaling data with CCP4i ccp4i
Select Directories amp ProjectDir (top right)
In the new window select Add project
Enter the project name in the Project field and the full directory path in the uses directory field Default values may have been enteredalready here Select this project from Project for this session
Select Apply and Exit Dismiss the warning message that comes up
Select Data reduction from the pull down menu of modules (orange bar at top left)
iMosflm Tutorial
fileUsersandrewg4MOSFLMnewgui_tutorialiMosflm_tutorial_720_ver3html[29052015 105311]
Select Symmetry Scale Merge (Aimless)
In the window that appears do the following
Give a job title (top line)
Click on the box next to Separate anomalous pairs for outlier rejection amp merging statistics (the crystals have been soaked in a mercurycompound)
In the next orange bar (line starts HKLIN 1) select Browse and select the MTZ file output by MOSFLM (probably called hg_001mtz)Select OK
If you did not supply the Project name Crystal name or Dataset name to Mosflm fill in the boxes for these now
Under Scaling Protocol
From the pull-down menu on the line starting Scale select with automatic default settings
At the bottom of window from the pull-down menu named Run select RunampView Com File
This will display a new window showing the command file for running the POINTLESS step select Continue After a brief pause it willshow the command file for running AIMLESS (This can be edited before submitting the job) Select Continue
In the main window it will show that the AIMLESS job is running
When AIMLESS has finished the command file for running the CTRUNCATE step will appearselect Continue
When CTRUNCATE has run the main window will say FINISHED
At that point select the pull-down menu View Files from Job and select View Log Graphs This will give you the same graphs asrunning loggraph on the AIMLESS log file they are also the same as those that appeared in IMOSFLMs QuickScale task To look at thelog file itself (eg the overall merging statistics) select View Log File and it will appear in a new window
161 Looking at the AIMLESS output
The simplest way to look at the output from AIMLESS is to use loggraph on the AIMLESS log file (or via the CCP4i GUI) This can displaymany different graphs
Use Scales vs rotation range to check for smooth variation in the scale factor Check the variation in B factor with image and if there isno real variation it is best to turn off the B-factor refinement
Use the Analysis against all Batches for all runs to detect bad images (high R-factor large number of rejected spots)
Check the Analysis against resolution Fractional bias to see if there is any indication of Partial bias (A negative partial bias will resultif the mosaic spread is underestimated or if there is a lot of diffuse scatter
The Fractional bias should be less than 1-2 although it will often exceed this for weak data (eg in the high resolution bins)
The Axial reflections graphs in AIMLESS are useful for detecting systematic absences which can be used to identify the true spacegroup However the detection of screw axes is thought to be sufficiently robust in POINTLESS that these graphs are no longer necessary
It can also be useful to look at the AIMLESS log file itself in particular the table giving statistics as a function of resolution The effectiveresolution limit of the data can be estimated by looking at the Mn(I)sd column (this is the mean Iσ(I) AFTER merging symmetry matesand is the best indicator of data quality) This table also shows shell and cumulative R-factors
The Mn(I)sd values depend on having realistic values of the standard deviations (errors) in the intensities As the values that come fromMOSFLM are always underestimates of the true error these values are scaled up in AIMLESS using a three-term correction
sdcorrected = SdFac Sqrt[sd(I)2 + SdBLPI + (SdAddI)2]
Here SdFac is an overall scale factor and SdB and SdAdd are intensity dependent factors
AIMLESS will automatically work out a suitable value for all three parameters in order to make the mean value of (observedscatter)(sdestimate) equal to 10 where observed scatter is the difference between an individual estimate of intensity and the mean ofall other estimates (from symmetry mates)
Probably the best estimate of the true high resolution limit of the data can be obtained from the CC(12) values these are thecorrelations between equivalent observations that have been divided randomly into two half-datasets The resolution limit is foundwhen the CC drops below ~ 05 - 03
This table comes under the heading
ANALYSIS OF STANDARD DEVIATIONS
iMosflm Tutorial
fileUsersandrewg4MOSFLMnewgui_tutorialiMosflm_tutorial_720_ver3html[29052015 105311]
in the AIMLESS log file and Run n standard deviation v Intensity test (where n is 1 or more) in the CCP4i GUI View Files from Job -View Log Graphs display
Can you identify a bad image in this dataset Can you work out why it is bad
(Cluethe image headers contain quite a lot of information that is not used by MOSFLM including the date and time that the image wascollected)
You can exclude a given batch from the scaling using the EXCLUDE keyword
RUN ALL EXCLUDE imagenumber
In this case run number will be 1
Rerun the scaling SENDING THE OUTPUT TO A NEW LOGFILE excluding this image and see the effect on the heights in the anomalousPatterson (in the log file) DO NOT repeat the integration In the command file uncomment the line (near the top) goto aimless so itskips the integration part
In the CCP4i GUI click to highlight the AIMLESS job which is listed as FINISHED and select ldquoReRun Jobrdquo from the control buttons downthe right-hand side of the main interface window Under ldquoExcluded Datardquo in the window that appears check the box next to Excludeselected batches and pull-down on the menu button to exclude a range Give the start amp end range to exclude (eg 74 to 74) Rerunthe job as before
17 Changing the symmetryFrom the list of options at the left hand side of the main window select ldquoUtilitiesrdquo and under that SortModifyCombine MTZ Files
In the new window give a new title eg reindex as H32
Click on the Box Change space group andor reindex reflections
Use the browse option to select the input MTZ file (First orange bar) the output filename will be generated automatically (but you canchange it)
Under Reindex details
In the last option check the box next to ldquoChange space group tordquo and enter H32 in the box This is above the final item Reducereflections to the asymmetric unit which is checked by default
Select Run from the Run option button
Then go back to the scaling window and select the new MTZ file (reindexed) as the input for scaling (use Browse) CHANGE THE JOBTITLE
Then select RUN
The scaling will now be performed in space group H32 Look at the merging statistics in the log file in particular the multiplicityweighted R-factor called Rmeas in the log file
18 Looking at the CTRUNCATE outputThe CTRUNCATE program converts intensities to amplitudes and also compiles some useful statistics The LTEST and the cumulativeintensity statistics tabulated by CTRUNCATE (and plotted by loggraph) provide the only point at which you will be able to detectmerohedral twinning (when the two lattices of the twin components exactly overlap and every measured intensity is actually the sum oftwo intensities)
For a good dataset the observed distribution should be within 1 of the theoretical distribution Is this the case for this data
19 If you have time 191 Different mosaic spreads
Try repeating the processing with the mosaic spread set to a value 25 smaller than the refined one and fix it by checking the Fix boxin the Integration window in iMosflm
Can you tell from the merging statistics if this data is better
192 Checking up on outliers
iMosflm Tutorial
fileUsersandrewg4MOSFLMnewgui_tutorialiMosflm_tutorial_720_ver3html[29052015 105311]
AIMLESS writes a file called ROGUES which lists reflections which show very poor agreement between symmetry mates or which areimplausibly large
Look in this file (it is ASCII) and try to work out why this has happened The ROGUES file gives you the image (Batch) on which thereflections have been recorded (for partials this is the image nearest the centre of the reflection so you may need to look on thepreceding and following image as well) Select a reflection which shows very poor agreement with its symmetry mates (A value greaterthan 10 in the DelIsd column in the ROGUES file)
Select the offending image by double-clicking it in the Images pane of the iMosflm main window Predict the reflections then enter thehkl values into the boxes and hit Return (or click the red warning button following the entry box for l) to locate the offending reflectionin the image You must give the measured indices - the first set of values in the ROGUES file - when doing this See if there is anythingodd about the spot Remember to check adjacent images for partials
193 How accurate does the unit cell have to be
Try changing the cell parameters by (say) 10 and integrate the images again What is the effect on the merging statistics
20 Tips1 When reading images into a session DO NOT attempt to carry out any other task until ALL the images have been read2 It is often worth repeating the indexing (usually only once) as the refined direct beam coordinates from the first indexing may give
an improved solution when the indexing is repeated (lower rmsd)3 Always integrate a few degrees of data before integrating the whole dataset (see sect9) If the space group is not known in advance
run Quicksymm with a few degrees of data to check that the correct indexing solution has been chosen4 For difficult images do not attempt to refine the unit cell initially once an indexing solution has been obtained try integrating a
few images to ensure that the integration is stable If then going on to refine the cell check that the prediction looks OK for thefirst image of every segment included in the refinement If it does not look very good consider using the pattern matching(Settings -gt Processing options -gt Advanced refinement see sect84)
5 If the resolution of the data is less than 35 Aring do not use the ldquoRefine Cellrdquo task Instead use several images in indexing and use thecell that comes from the indexing
6 If iMosflm gets into a state where the activity icon(upper right) is spinning but nothing seems to be happening click on the activityicon to stop it spinning and see if the session can be continued DO NOT click on the activity icon simply to abort a task this willgive unpredictable results Use the Abort button for cell refinement or integration There is no defined way to abort indexing
7 Use the image summation option (see sect4) to get a better impression of the diffraction for very low exposure Pilatus images8 Use image summation for detector parameter refinement for fine sliced very weak Pilatus images (Settings -gt Processing options -
gt Advanced refinement see sect821)9 For large mosaic spread values (gt 10deg) or small mosaic block sizes (lt10) consider increasing the maximum allowed reflection
width to avoid having too many green predicted reflections (Settings -gt Processing options -gt Advanced integration see sect97)10 By default on selecting the Indexing task iMosflm will find spots index and (assuming a solution has been found) estimate the
mosaicity For difficult cases it is more useful to restrict this to simply finding spots and then do the indexing and mosaicityestimation by clicking the appropriate buttons To do this change the check box Automatically index after spot finding inSettings -gt Processing options -gt Indexing
11 See sect521 and sect522 for advice if the indexing fails Also consider the possibility of a reversed phi rotation direction if you arenot familiar with the beamline (Settings -gt Experiment settings -gt Experiment see sect21)
12 If the detector parameters have refined to physically unreasonable values (eg because cell refinement or integration has beencarried out using an incorrect indexing solution) be sure to reset the detector parameters before attempting further processing(Settings -gt Experiment settings -gt Detector see sect21)
13 Always set the resolution limit slightly beyond the point at which any spots are visible (see sect414 ) For very weak fine-sliceddata it can be very difficult to estimate the resolution visually so integrate to the maximum resolution (inscribed circle) and usethe merging results to set the final resolution There should be no problems integrating to a resolution ~03-05 Aring beyond theactual resolution limit but for example integrating to 3 Aring when the true resolution limit is 5-6 Aring may cause problems and theintegration should then be repeated with a more realistic resolution limit
14 Use the site file sect141 if repeatedly processing data where the direct beam position is wrong or if the phi direction is reversed etcto save having to correct this for every session
Appendix IA command script for running MOSFLM using the keywords copied from the Batch processing window of the new GUI (see Integratingas a background job sect952) Note that keyworded input for MOSFLM and other CCP4 programs is case-insensitive apart from file anddirectory names
bincsh -fv Set a unique identifier for filenames for this job
set ident = x89_mos07_blk3_smallsep
iMosflm Tutorial
fileUsersandrewg4MOSFLMnewgui_tutorialiMosflm_tutorial_720_ver3html[29052015 105311]
$ipmosflm COORDS $identcoords SUMMARY $identsummary ltlt eof-ip Insert keywords copied from iMosflm batch window here
Keywords for this run For example could involve trying different values for mosaic spread or not integrating all images etc etchklout $identmtzgenfile $identgenprocess 1 1000 goeof-ip
pointlesspointless hklin $identmtz hklout $ident_pointlessmtz
aimlessaimless hklin $ident_pointlessmtz hklout $ident_aimless_partmtz ROGUES $identrogues ltlt eof-aimless Use all default options for aimlesseof-aimless
ctruncate hklin $ident_aimlessmtz hklout $ident_truncatemtz
Harry Powell Andrew Leslie and Owen Johnson
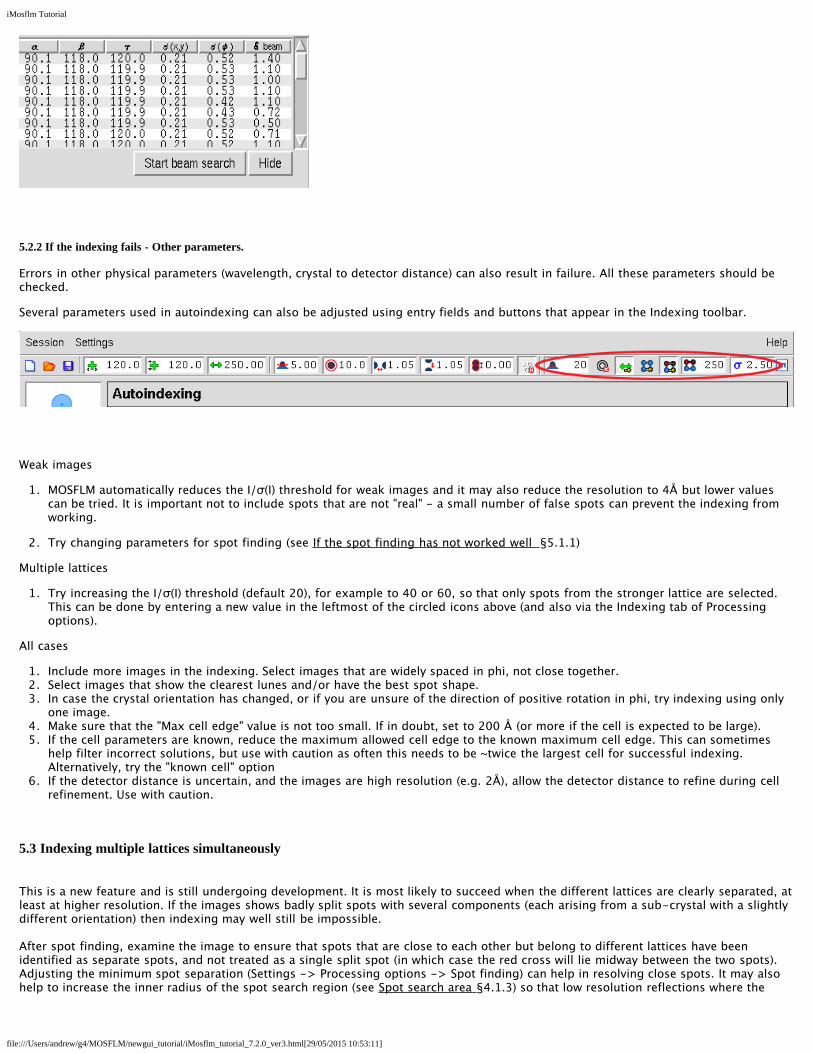
iMosflm Tutorial
fileUsersandrewg4MOSFLMnewgui_tutorialiMosflm_tutorial_720_ver3html[29052015 105311]
522 If the indexing fails - Other parameters
Errors in other physical parameters (wavelength crystal to detector distance) can also result in failure All these parameters should bechecked
Several parameters used in autoindexing can also be adjusted using entry fields and buttons that appear in the Indexing toolbar
Weak images
1 MOSFLM automatically reduces the Iσ(I) threshold for weak images and it may also reduce the resolution to 4Å but lower valuescan be tried It is important not to include spots that are not real - a small number of false spots can prevent the indexing fromworking
2 Try changing parameters for spot finding (see If the spot finding has not worked well sect511)
Multiple lattices
1 Try increasing the Iσ(I) threshold (default 20) for example to 40 or 60 so that only spots from the stronger lattice are selectedThis can be done by entering a new value in the leftmost of the circled icons above (and also via the Indexing tab of Processingoptions)
All cases
1 Include more images in the indexing Select images that are widely spaced in phi not close together2 Select images that show the clearest lunes andor have the best spot shape3 In case the crystal orientation has changed or if you are unsure of the direction of positive rotation in phi try indexing using only
one image4 Make sure that the Max cell edge value is not too small If in doubt set to 200 Aring (or more if the cell is expected to be large)5 If the cell parameters are known reduce the maximum allowed cell edge to the known maximum cell edge This can sometimes
help filter incorrect solutions but use with caution as often this needs to be ~twice the largest cell for successful indexingAlternatively try the known cell option
6 If the detector distance is uncertain and the images are high resolution (eg 2Å) allow the detector distance to refine during cellrefinement Use with caution
53 Indexing multiple lattices simultaneously
This is a new feature and is still undergoing development It is most likely to succeed when the different lattices are clearly separated atleast at higher resolution If the images shows badly split spots with several components (each arising from a sub-crystal with a slightlydifferent orientation) then indexing may well still be impossible
After spot finding examine the image to ensure that spots that are close to each other but belong to different lattices have beenidentified as separate spots and not treated as a single split spot (in which case the red cross will lie midway between the two spots)Adjusting the minimum spot separation (Settings -gt Processing options -gt Spot finding) can help in resolving close spots It may alsohelp to increase the inner radius of the spot search region (see Spot search area sect413) so that low resolution reflections where the
iMosflm Tutorial
fileUsersandrewg4MOSFLMnewgui_tutorialiMosflm_tutorial_720_ver3html[29052015 105311]
spots are not really separated are excluded from the search
The following procedure usually provides the best chance of success
1 Select appropriate images for use in indexing The separation of the lattices can be clearer on some images than others Ideallychoose several images widely separated in phi
2 Do a normal (single lattice) indexing first This will usually work but will give a high positional rmsd because of the presence of morethan one lattice This step is important because it will result in more accurate direct beam coordinates which are crucial for multi-lattice indexing
3 Select the ldquoIndex multiple latticesrdquo icon (next to the Index button) the Index button will change to Index multiple
The indexing results for different lattices will be presented in different tabs while the selected solution for each lattice will be shown inthe lower Summary window Currently a maximum of 5 lattices can be handled The figure below shows a case where 3 differentlattices were found
4 Judge the success of indexing by examining the lattice type and the cell parameters obtained for the different lattices (the cellsshould be very similar) and checking that the predictions match the observed spots The rmsd values for correct lattices should also besignificantly smaller than the value obtained in the initial (single lattice) indexing It may be necessary to manually select a differentautoindexing solution for some lattices in order to get the same lattice type (eg oP) for the different lattices
The Split column in the lower pane indicates the angle between the reference lattice (with value -) and the other lattices This is onlycalculated when the lattices have the same lattice type In this case the angles between lattice 1 and lattices 2 amp 3 are 34 and 16degrees
If a lattice is clearly incorrect it can be deleted by highlighting that lattice (in the lower pane that summarises the results) and using theright mouse button to select ldquodeleterdquo
The predictions for different lattices can be displayed either by highlighting the lattice in the Summary window or by using the latticeselector in the image display pane
iMosflm Tutorial
fileUsersandrewg4MOSFLMnewgui_tutorialiMosflm_tutorial_720_ver3html[29052015 105311]
In the image display spots in different lattices that overlap with each other are shown in magenta Only the summed intensity will bemeasured for these reflections
The predictions for all lattices can be shown by selecting the ldquomerge latticesrdquo icon in the image display
This can be useful to check if all the lattices have been successfully indexed because all spots in the image should then be predicted Inthe display predictions from lattice 12345 are shown in blue yellow red green and magenta with no distinction made between fullyand partially recorded reflections or spatial overlaps
iMosflm Tutorial
fileUsersandrewg4MOSFLMnewgui_tutorialiMosflm_tutorial_720_ver3html[29052015 105311]
531 Practical Tips
Beware of solutions where the lattices only vary in orientation by a small angle (less than 1 degree) as these are often different solutionsfor the same lattice The difference in orientation between lattices is given by the ldquosplitrdquo column in the Summary window but this is onlycalculated if the lattices have the same lattice type Differences are all relative to one lattice which will display a split angle as ldquo-ldquo Tocalculate the angles relative to a different lattice open the tab for that lattice select a different solution to that currently selected andthen select the original solution ndash this will trigger recalculation of the split angles relative to that lattice
Other parameters that can influence the indexing are the rdquoMaximum deviation from integral hklrdquo (default 02 when indexing multiplelattices otherwise 03) and ldquoNumber of vectors to find for indexingrdquo (default 30) These can be changed via the Indexing tab of theldquoProcessing Optionsrdquo that can be selected from the ldquoSettingsrdquo menu item Values between 015 and 025 might be helpful for the firstparameter and increasing the number of vectors from 30 to 50 can also help At present there is no defined protocol for changing thedefault parameter values for particular cases it has to be done by trial and error
Experience so far has shown that selecting appropriate images and adjusting the maximum cell length used in indexing have the biggesteffect The optimum value for the maximum cell length will normally lie between one and three times the largest cell dimension but it isworth varying this in steps of between 25 and 50 Aring as the indexing can be very sensitive to this parameter
For a more complete discussion of multiple lattice indexing see Powell HR Johnson O amp Leslie AGW 2013 Autoindexingdiffraction images with iMosflm Acta Cryst D69 1195-1203
54 Known cell option
For images that are very difficult to index if the cell parameters are known the known cell option can be usedSelect the ldquoKnown cellrdquo icon (next to the Multiple lattices icon) Enter the cell parameters in the Input known cell pop-up window andselect OK when all 6 parameters have been provided Then select the Index Cell button
To revert to normal indexing select the ldquoKnown cellrdquo icon and then select Clear in the Input known cell pop-up window
55 Space group selection
Note that the indexing is based solely on information about the unit cell parameters It will therefore be very difficult (or impossible) todetermine the correct Laue group in the presence of pseudosymmetry For example a monoclinic space group with β ~ 90deg will appearto be orthorhombic an orthorhombic space group with very similar a and b cell parameters will appear to be tetragonal These can onlybe distinguished when intensities are available (ie after integration) by running POINTLESS (QuickSymm) (see Running Pointless to check the
iMosflm Tutorial
fileUsersandrewg4MOSFLMnewgui_tutorialiMosflm_tutorial_720_ver3html[29052015 105311]
symmetry sect10)
In addition it is not possible to distinguish between Laue Groups 4m and 4mmm 3 and 3m 6m and 6mmm m3 and m3m Thiswill not affect integration of the images but it will affect the strategy calculation In the absence of additional information the lowersymmetry should be chosen for the strategy calculation to ensure that a complete dataset is collected
The presence of screw axes also cannot be detected so there is no basis on which to distinguish P21 from P2 etc This does not affectany aspect of data collection or processing and can be chosen (on the basis of systematic absences) after integration by runningPOINTLESS
In this example there is no way of knowing at this stage if the space group is h3 or h32 so leave it as h3
56 Mosaicity estimation
If the Automatically index after spot finding option has been chosen (Indexingtab of Processing Options) the mosaicity (mosaic spread) will be estimatedautomatically for the preferred solution However if another solution is chosenthe mosaicity should be estimated again
Click on the Estimate button to estimate the mosaicity
A window will appear which plots the total predicted intensity as a function ofmosaic spread from which an estimate is determined
The predictions displayed on the image will be updated Entering different valuesof mosaic spread in the box (followed by return) will allow a visual estimate of theeffect of changing the mosaic spread
The mosaic spread can also be entered in the Images pane by clicking once on theMosaicity line and once again on the value displayed
561 The mosaic block size
In some cases the apparent mosaic spread is much larger at low resolution than at high resolution so that if it is set to a value thatresults in all the low resolution spots being predicted many more spots are predicted than are visible at high resolution This effect isbest dealt with by adjusting the Mosaic block size which is also displayed in the Images pane This is modelling the size in microns ofthe individual mosaic blocks in the crystal Decreasing this to values of 05-5 microns (say) from the default of 100 microns will resultin predicting more spots at low resolution but have virtually no effect at high resolution This parameter is not refined (at present) andso the best value must be determined by trial and error
6 Saving and recovering a sessionThe session can be saved at any time using the Session drop-down menu referred to in sect21 The first time that a session is saved youwill be prompted for a filename The filename convention for saved session files is that the extension is mos
Save the current session Then exit from iMosflm (using the Session drop-down menu) restart iMosflm and read in the saved session
If the program crashes it should be possible to recover all but the latest actions as a temporary copy of the session file is continuallysaved to the directory mosflm in the users home directory
Restart iMosflm and it will pop up a Recover session window
Selecting the Recover button will restore the session as far as possible
iMosflm Tutorial
fileUsersandrewg4MOSFLMnewgui_tutorialiMosflm_tutorial_720_ver3html[29052015 105311]
7 Data collection strategyOnce the crystal orientation and (probable) Laue group have been determined it is possible to calculate a data collection strategy andthe Strategy icon is no longer greyed-out (in fact all other operations Strategy Cell Refinement and Integration become possible at thispoint)
Select the Strategy icon This will open the Strategy window
The statistics initially presented in the window are based on the images read in to the current session If only two (or more) references
iMosflm Tutorial
fileUsersandrewg4MOSFLMnewgui_tutorialiMosflm_tutorial_720_ver3html[29052015 105311]
images have been read in no statistics will be presented
When the Strategy option is used after two initial images (typically 90deg apart in φ) have been collected a complete shaded segment willnot be shown in the lower part of the screen rather an empty circle will be shown with the matrix label beneath it Click the Auto-complete button and in the pop-up menu that appears select a rotation angle or sweep of data to collect - or leave the Rotationsetting as Auto for a calculation of maximum completeness for this crystal orientation Click on Ok and the completeness results willbe presented
The orientation of the crystal expressed as the angles between the abc unit cell axes and the XYZ coordinate frame is given X isalong the X-ray beam Z is the rotation axis A warning will be given if the unique axis is so close to the rotation axis that there will bemissing cusp data
71 Evaluating completeness manually
The completeness of any given segment of data can be determined manually using the circle at the bottom left of the window Click onthe red segment shown in this circle
This will result in small black boxes being drawn on the circumference at the start and end of the red sector
Use the LMB to click on the black box at 0 and drag this around the circle
When the LMB is released the statistics for that sector will be displayed The statistics are presented in two ways Near the top right ofthe window the overall completeness is shown as red circles for unique data and anomalous pairs The average multiplicity is givenbeneath these circles
More detailed statistics (such as completeness as a function of resolution) are given in a series of histograms that can be selected by adrop-down menu
72 Calculating a strategy automatically
Uncheck the Use checkbox at the right side of the hg_001 line listed in the sector list near the top of the Strategy pane This means
iMosflm Tutorial
fileUsersandrewg4MOSFLMnewgui_tutorialiMosflm_tutorial_720_ver3html[29052015 105311]
that the 84 images used thus far will not be included in the completeness calculation only the matrix derived from indexing them willbe used Select the Auto-complete button to calculate a strategy automatically
A strategy calculation data pop-up window will appear
If multiple matrices have been defined (for different sectors of data) then the appropriate one can be selected (if there is only one sectorthis has no effect)
The total φ rotation to be used is normally calculated by MOSFLM based on the Laue group and the crystal orientation (the Auto setting)However it is sometimes possible to achieve a high completeness with a significantly smaller total rotation (eg 60deg in two 30degsegments will typically give gt94 completeness for orthorhombic space groups) and this can sometimes be useful if radiation damage isa serious problem although when using hybrid pixel detectors it is better to use a very conservative exposure time and collect a wide φrotation
Total rotation angles of between 5deg and 90deg can be selected from the drop-down list The number of segments to be used can be setbetween 1 and 3
If the check box is checked data completeness will be calculated to optimize the proportion of anomalous data collected
THIS IS IMPORTANT The optimum strategy is often different when maximising completeness of the anomalous data
Choose the default values (Rotation Auto Segments 1) but check the anomalous data box then click on Ok Look at the variousstatistics presented as bar charts
In space group H3 if rotating around the c axis a total rotation of 120deg would be required to collect a complete dataset (ignoring anydata lost in the cusp) Because the c axis is 22deg away from the rotation axis in this case it is possible to collect very high completeness(for unique data) with a rotation much smaller than this
Try to find the minimum total rotation that will give a dataset that is gt95 complete for the unique data Now do the same butrequiring gt95 completeness for the anomalous data
SKIP OVER SECTION 73 IF DOING THE NORMAL TUTORIAL
73 Calculating a strategy using multiple crystals
The Strategy pane may also be used when due to radiation damage many crystals are required to collect a complete dataset
IMPORTANT This procedure will only work correctly for space groups where there is no indexing ambiguity For those spacegroups where there is an indexing ambiguity( see httpwwwccp4acukdisthtmlreindexinghtml for a complete list) it isnecessary to integrate images to determine whether different crystals have been indexed in the same way This is not achievablewithin the Strategy option at present
Suppose the first crystal has been indexed from the reference images
Enter the Strategy pane an empty circle is displayed in the bottom part of the screen and click on the Auto-complete button nearthe top-right of the pane In the Auto-complete window that appears choose a suitable Rotation angle for the amount of datathat can be collected from one crystal say 20 degrees for this example Leave Segments set to 1 and do not check Optimize foranomalous data
Click the Ok button and the completeness of the data will be displayed The matrix name start and end phi values and the phiextent will be displayed in the top area of the pane with a checkbox ticked under the Use column This means this segment will beused in further strategy calculations
Accept and save this result by clicking on the yellow hatched segment displayed in the large circle near the bottom of the paneClick once and the segment will be outlined in black (you can adjust the start or end phi value calculated in one degree incrementsby click+dragging the respective black square) click again this time on the black square denoting the start or end phi (or release ifyou have adjusted by click+dragging) and the segment will turn red The segment will not be saved unless it has turned red
This result will be saved if you leave this pane (eg to load more images) and return later in this session The strategy file can alsobe saved to a permanent file using the Save button on the tool-bar This is highly recommended when working with many crystals
Return to the Strategy pane when you have loaded and indexed the reference image(s) from the second crystal and repeat the procedureabove You will see the calculated segment from the first matrix displayed at the bottom-left of the screen The optimum phi range for
iMosflm Tutorial
fileUsersandrewg4MOSFLMnewgui_tutorialiMosflm_tutorial_720_ver3html[29052015 105311]
the second crystal will be displayed Save this in the same way as for the first crystal (clicking twice) Repeat this procedure for anysubsequent crystals and in each case the optimum phi range will be calculated for the latest crystal taking into account the data fromprevious crystals
It is a good idea to save the strategy to a file as each new crystal is added in case the program crashes and this information is lost
In practice it is probably safest to have a separate iMosflm session that is reserved for the strategy calculations and not used to processany data The strategy for each new crystal can be calculated as described above If there is a problem and the session is corrupted or ifiMosflm is closed down for any reason it is straightforward to restore the status of the session providing the strategy has been savedThe following steps should be taken
1 Read in the reference images for the latest crystal and index them
2 Select the Strategy pane
3 Read in the optimised strategy for all previous crystals using the ldquoAddrdquo button and giving the appropriate filename
4 Making sure that the circle for the latest crystal is highlighted in the lower left window click on lsquoAuto-completersquo and follow the stepsdescribed above
Advanced Usage
The startend phi values for each crystalmatrix can be updated This might be required if for example only 10 degrees of useful datawere collected from a particular crystal instead of the anticipated 20 degrees To change the phi values click either on the matrix namein the top pane or on the circle showing the segment of data in the lower left pane (these are highlighted in a blue box as the mousemoves over them) The corresponding segment will now be displayed in the larger circle Click on the red segment so that a blacksquare appears at the startend phi values Then simply drag the appropriate phi to the desired value The completeness willautomatically be updated (but the strategy calculation for the latest crystal will not be repeated to do this the current segment must bedeleted by highlighting the matrix name and using right click and then repeating the Auto-complete step)
If matrix files saved from iMosflm are available from crystals for which data have been collected in previous sessions these can beadded into the calculation using the Add matrix button on the tool-bar
If the saved strategy result has become complicated or is incorrect and you wish to restart the calculations afresh there is a tool-barbutton Reload sectors from session This will remove any calculated sectors while leaving any known matrices listed at the bottom-leftof the Strategy pane
If you have saved a strategy file from a previous session this can be used to re-initialize the Strategy pane using the Load button onthe tool-bar
A Spacegroup pull-down menu has been added to the tool-bar to permit different choices of space group to be used in thecalculations (eg H3 and H32) This menu is populated from the list offered on the Indexing pane However the space group symboltext is editable Any space group symbol entered will be validated by Mosflm together with the current cell parameters
As a calculator for a multi-segment strategy the Strategy pane is reasonably flexible you can Save or Delete highlighted matrix lines byright-clicking As you highlight different matrix lines the orientation of the crystal expressed as the angles between the abc unit cellaxes and the XYZ coordinate frame is re-displayed in the centre of the pane
The following screen shot shows the cumulative results in the Strategy pane after this procedure has been followed for four crystals(ignore the iMosflm version number)
iMosflm Tutorial
fileUsersandrewg4MOSFLMnewgui_tutorialiMosflm_tutorial_720_ver3html[29052015 105311]
731 Calculating a strategy when some data have already been collected and processed
This option is not yet implemented If data have already been processed (to give an MTZ file) but the images are not currently available (eg they were collected on a previoussynchrotron trip possibly at a different synchrotron) then the MTZ file containing this data can be read and used to calculate a strategyfor data collection from new crystalsThe MTZ icon in the tool bar is used to read the MTZ file
74 Calculating a suitable oscillation angle
To calculate the maximum possible oscillation angle while avoiding spatial overlaps click on the Check for overlaps button A pop-upwindow will appear from which the option to calculate the maximum oscillation angle (as a function of φ) or check how many overlapswill occur for different (user selected) oscillation angles The results are plotted in the same pane as the histograms for the strategycalculations Note that the overlap calculation is based on the current values for the mosaic spread and spot separation and can be verysensitive to these values Note also that these are maximum and not necessarily recommended oscillation angles
iMosflm Tutorial
fileUsersandrewg4MOSFLMnewgui_tutorialiMosflm_tutorial_720_ver3html[29052015 105311]
8 Cell refinementIt is important to determine the cell parameters accurately before integrating the images Although the unit cell is refined as part of theautoindexing providing the diffraction extends beyond ~35Å resolution it is possible to obtain more accurate cell parameters using aprocedure known as post-refinement This procedure requires the integration of a series of images in ideally two or more separatesegments at widely different φ values The distribution of the intensity of partially recorded reflections over the images on which theyoccur is used to refine the unit cell crystal orientation and mosaic spread
Select the Cell Refinement icon
81 Selecting the images
iMosflm Tutorial
fileUsersandrewg4MOSFLMnewgui_tutorialiMosflm_tutorial_720_ver3html[29052015 105311]
There are several ways to select the images to be used in cell refinement Whichever method is used the image numbers will bedisplayed in the Images entry field iMosflm will automatically select appropriate images but these can be changed
811 Manual selection
A list of images can simply be typed into this box An image series can be specified as n-m where n and m are the first and last imagesDifferent series must be separated by white space or comma
For orthorhombic or higher symmetries two segments should be given approximately 90deg apart in φ For monoclinic or triclinic datathree or four segments are best (eg φ = 04590135)
The number of images that should be included in each segment depends on the mosaic spread and oscillation angle A reasonablenumber is 2(mosaic spreadoscillation angle +1) MOSFLM will automatically select two or more segments as appropriate Note thatthere is a limit on the total number of images that can be used
812 Automatic selection
Selecting the Automatically select images icon will select a suitable set of images
813 Graphical selection (Not recommended)
Selecting this icon will give a new window
Images can be selected by clicking in the Use check-box in the list of images or by using the mouse to drag a selection of imagesfrom the sector displayed The other icons allow the sector to be zoomed in or out and the viewed area to be moved to make theselection easier The final two icons on the tool-bar switch the segment display to fit the display space as either a full circle or aquadrant This Image palette can be closed by clicking outside its area but will close after 60 seconds anyway
82 Integrating the images and refining the cell
Use one of the methods above to select images to use in cell refinement and click on the Process button Before starting cell refinementcheck that the prediction for the first image in each segment to be used is good The majority of the spot positions must be correctlypredicted for the first image in each segment or else the refinement will not work
The selected images will be integrated and following integration the cell parameters are refined Selectable refined detector parameters
iMosflm Tutorial
fileUsersandrewg4MOSFLMnewgui_tutorialiMosflm_tutorial_720_ver3html[29052015 105311]
will be plotted as will the changes in crystal orientation and (if selected) mosaic spread If the shift in cell parameters is greater than 25standard deviations another cycle of integration and cell refinement is carried out Typically two or three cycles are required forconvergence Note that the current program activity is shown in the bottom left-hand corner of the window in the status message area
The different windows are explained below Moving the mouse over any parameter or plotted graph point will give a full description ofit
821 The detector parameters window
The values of the refined detector parameters are displayed for each image as it is integratedThere is the option to fix any of the parameters during integration by checking the Fix box onthe right The positional residuals (overall central and weighted) are also listed
Any of these parameters can be selected for plotting on the graph that appears to the right ofthis box by simply clicking on that parameter (which is then highlighted in blue as shown herefor Beam x and Beam y)
Check the stability of the refined parameters by displaying the appropriate graphs To getsensible scaling of the graphs only parameters with similar numerical values should be plottedtogether
For weak images (ie few visible spots in the outer regions of the image) the tilt and twistmay not be well defined and might refine to large values (greater than one degree) Insuch cases these parameters should be fixed It is not generally recommended to fix any
iMosflm Tutorial
fileUsersandrewg4MOSFLMnewgui_tutorialiMosflm_tutorial_720_ver3html[29052015 105311]
other detector parameters
For very weak fine sliced images (Pilatus only) there is the option to sum images when findingsuitable spots for refinement see Settings -gt Processing Options -gt Advanced refinementwhich can in some cases make the refinement more stable
822 The crystal parameters window
The values of the refined crystal missetting angles φ(x) φ(y) φ(z) the unit cell parameters andmosaic spread for the current image are displayed in the table Selected parameters will beplotted as for the detector parameters Specific unit cell parameters can also be fixed
If more than one segment of data is being used for cell refinement it is not unusual to see achange in orientation of the crystal between the two segments
Observe how the crystal orientation is different for images in the two segments See how themosaic spread varies during refinement
823 The central spot profile
The average spot profile for the central region of the detector is plotted for eachimage This confirms that the spot prediction is good If the profile is not welldefined and central in the box or if the blue border for the peak region of the spot ismuch larger than the apparent spots size it suggests a problem with the integrationand the initial prediction should be checked In some cases it may be necessary toincrease or decrease the Profile Tolerance parameters to ensure that the blue boxfits the spot To do this select the Advanced integration tab of Processing optionsCheck the central spot profiles for the images used in the cell refinement
824 The summary window
This window presents a summary of how selected parameters have changed indifferent cycles of the cell refinement The behaviour of these parameters gives agood indication of whether the cell refinement has been successful
If the refinement has been successful the RMS residual should be lower for thefinal cycle than in previous cycles However errors in the cell can be compensatedquite well by changing the crystal to detector distance so the differences are notalways dramatic
The other parameters that can be plotted from the pull-down list are the detectordistance and the Pixel ratio (Yscale)
The detector distance should be the same for all images in the refinement If the original indexing was based on auto-indexing a singleimage (say the first) then the detector distance might change for images from the second segment to compensate for an error in theoriginal cell If the variation in distance for different images increases with the cycle number this indicates that the refinement is notstable
The Pixel ratio (Yscale) parameter may also show an initial variation for images in different segments because refining Yscale (whichshould be 10000 for all except Raxis II and Raxis HTC detectors) can compensate for errors in cell dimensions in the same way that thedistance can The final values (last cycle) should be very close to identical for all images and should also be very close to unity (to within00010)
Cell refinement can be unstable if the data do not extend to at least 35 Aring If it appears unstable use the cell derived from auto-indexing a series of images well spaced in φ instead
iMosflm Tutorial
fileUsersandrewg4MOSFLMnewgui_tutorialiMosflm_tutorial_720_ver3html[29052015 105311]
Examine the plots to see if the parameters are stable and correct (Yscale)
825 The final results
When refinement has converged (or after 5 cycles) the initial and final cell parameters and the estimated errors (std dev) are listed
If time is available make a note of the std dev values and repeat the cell refinement using a larger number of images in each segmentAre the standard deviations smaller when using more images
83 Refining cell parameters for multiple lattices
Providing the resolution is high enough (generally better than ~35-32 Aring) and not too many of the spots in the different lattices areoverlapped it is possible to refine the cell parameters for each lattice individually The lattice to be refined is selected from the Latticeselector
This selector will be grayed out when processing a single lattice
84 If the prediction for the first image of a segment is poor
In some cases depending on how the indexing has been carried out or if the diffraction is poor or there has been a large change incrystal orientation during the data collection the prediction for one or more of the segments (the first image) may be poor In suchcases the integration and hence the cell refinement may fail It may be possible to successfully process the images after an initialrefinement of the crystal orientation using a pattern matching algorithm To select this option got to the Advanced refinement tab ofProcessing options and select the tick box for Refine orientation of first image in any run by pattern matching and for Integrate allimages Then refine the cell in the usual way During integration the orientation will be refined for the first image of each segmentoutput for this additional refinement will be written to the logfile but is not shown in the GUI
9 IntegrationThe accurate cell parameters are now used in the integration Note that although the images are integrated during the cell refinementthe intensities are not saved and no MTZ file is generated at that stage
It is good practice to start by integrating a block of images corresponding to a few degrees of data to check that the parameters do notneed further adjustment MOSFLM will generate warning messages after integration if there are any difficulties and it may be possibleto improve the situation by changing some of the default parameters (see Warning messages sect13)
Before integration ensure that the backstop shadow has been defined (see Masked areas backstop sect411 and Masked areas generalsect412)
91 Image selection
Image selection is performed in exactly the same way as in the cell refinement In this case the Automatic selection will simply includeall images in the current sector
Select images 1-10
92 Setting the MTZ filename and controlling updating of the image display
Two icons appear when the integration option is chosen
If the Show predictions icon is clicked the display window will be updated as eachimage is processed This will slow down the processing but allows the accuracy of theprediction to be checked for each image
iMosflm Tutorial
fileUsersandrewg4MOSFLMnewgui_tutorialiMosflm_tutorial_720_ver3html[29052015 105311]
Click on this icon so that the display will be updatedThe filename of the MTZ file containing the results of the integration is generatedautomatically but can be edited manually
93 Integrating the images
Click on the Process button to start integration
Integration of the images occurs in two passes In the first pass for each block of images (a number corresponding to a few degrees ofdata selected automatically by MOSFLM) the detector and crystal parameters are refined for each image in turn and the measurementboxes for all predicted spots are written to a file for use in the second pass In the second pass the standard profiles are formed fromreflections present on all of the images in this block and each image is then integrated and the results written to the MTZ file Thedisplay is not updated during the second pass and will remain on the last image of the block (assuming image updating has beenselected)
Note that the unit cell dimensions are normally fixed during integration and only the crystal orientation and mosaic spread are refinedCrystal parameter refinement only starts when a sufficient number of images have been integrated to provide data for the post-refinement typically after ~05-1 degree (more for high mosaicity)
94 Parameter display windows
As described in sect82 the refined detector and crystal parameters will be displayed in tables and selected parameters will be plotted ingraphs The average spot profile for each image will also be displayed
The size of these graphs (and the profile) can be expanded to fill the whole window by holding down Shift and clicking LMB anywherein the graph window A second Shift+click will revert the graph to the original size
In addition to these windows there are windows that tabulate and plot (as a function of image number) the mean Iσ(I) for profile fittedand summation integration intensities The overall values and the values for the highest resolution bin are given
The number of overloaded reflections Bad spots (ie those that fail certain tests see mosflm SUMMARY file sect15) Spatial overlaps andif processing multi-lattice images the number of lattice overlaps is listed for each image and can be plotted by highlighting thatparameter When processing data from crystals with large unit cells it is important to watch out for spatial overlaps (see sect97 for tips onhow to reduce the number of spatial overlaps if this is a problem)
A display of the standard profiles for different regions of the detector is also provided Poor profiles are averaged by includingreflections from inner regions of the detector Averaged profiles are indicated by a red line around the spot (rather than blue) Theoriginal unaveraged profile can be viewed a clicking on the profile (providing there were sufficient spots in that region to allowformation of a profile)
The profiles should be checked to see that they are well defined and centred within the box Poorly-defined diffuse or non-centredprofiles may suggest that the prediction is not very good in which case this should be checked on the corresponding image(s)
It may be useful to expand the standard profiles to fill the window using Shift + click in the profiles window
Finally the lower left window plots Iσ(I) as a function of resolution for any selected image
iMosflm Tutorial
fileUsersandrewg4MOSFLMnewgui_tutorialiMosflm_tutorial_720_ver3html[29052015 105311]
Different parameters can be plotted by selecting the small right- or left-pointing arrows on the title line above the plot
95 Integrating the whole datasetAssuming that everything looks OK the entire dataset can now be integrated However it is strongly recommended thatProjectCrystalDataset names are assigned first These are written to the output MTZ file and used by downstream programs inparticular AIMLESS will use this information when deciding which images belong to the same dataset
Select Experiment settings from the Settings drop-down menu (see Drop down menus sect21) to enter these names and optionally givea title for the MTZ file
Select images 1-84 and click on Process
951 Parallel Integration Using multiple cores
An option is available on the pull-down menu (next to the Process button in the Integration task) which splits up the integration jobover available cores on the local machine All aspects are currently determined automatically at present user-configurable options willbe available in a later version The algorithm used is as follows
iMosflm determines the number of cores available on the local machineIf the number of cores (N) is greater than 2 iMosflm splits the integration run into N-1 batches (up to a maximum of 16) containingapproximately the same number of images If N le 2 iMosflm splits the run into N batches
If the total number of images in each batch is less than 32 the number of batches is decreased until this condition is satisfied
The first batch is submitted as a background task consisting of a refinement stage and an integration stage with its input and outputfiles (including the MTZ file) in a new directory its name being determined from the number of segments of data being integrated andthe lattice number (if the sample has been determined to contain multiple lattices) If the directories exist already they are all movedinto a newly-created directory with a time-stamped name the files from the most recent integration run are thus in directories withnames following the pattern described above Once the refinement stage is complete the refined parameters are written to a file
The launch of subsequent batches are delayed until the corresponding preceding batch has written its refined parameters This file isread and the new batch is launched again with a refinement stage and integration stage
At present the job cannot be aborted once it has started
952 Integrating as a background job
By selecting Batch in the drop-down menu adjacent to the Process button the integration can be run as a background job rather thaninteractively and the GUI can be used to look at a different dataset
Selecting Batch from the drop-down menu will display a new window showing the script that will be used to process the images alongwith a number of processing options The script can be edited if additional keywords are required or if some parameters are to bechanged and can also be copied and pasted into a file for off-line processing
By default the job is divided into batches across multiple cores as determined for the parallel integration described in sect951 but thenumber of cores can be chosen by the user from a drop-down menu in this case the size of each batch is determined by the interface
Plotting the results of the integration can be turned off this can make processing much faster
iMosflm Tutorial
fileUsersandrewg4MOSFLMnewgui_tutorialiMosflm_tutorial_720_ver3html[29052015 105311]
It is possible to configure job submission for remote machines (which can be added by depressing the add host button) Ensure youhave enabled passwordless logins for all the remote machines you enter and that you specify the full path to the Mosflm executable inthe Batch destinations window The remote working directory (in which the log and MTZ files are written) and the remote imagedirectory must both be specified with their full path names Any required parameter fields that are not completed by the user arehighlighted in orange if the user tries to submit a job without completing these fields a new window containing only those fields (againhighlighted in orange) pops up with a request to do so
The number of cores available on the selected host can be determined by depressing the apple core button on the Batch destinationsconfiguration window
The log file for batch submission jobs the MTZ and SUMMARY files are written to the directory in which iMosflm was launched
96 Checking the integration
iMosflm Tutorial
fileUsersandrewg4MOSFLMnewgui_tutorialiMosflm_tutorial_720_ver3html[29052015 105311]
The detector and crystal parameter plots should be examined carefully to check for any instability in the refinement If there are largeand random variations in some parameters (eg the detector twist and tilt) then it may be better to fix them and repeat the integration
For cases (eg very small unit cells) where there are very few suitable reflections on each image the refinement of the missetting anglesmay show significant variations from one image to the next In such cases it is best to apply smoothing to the missetting angles usingthe tick box in Settings -gt Processing options -gt Advanced Refinement
Discontinuities due to blank images should also show up and the offending images should be removed from the scaling run
If adjacent spots are incompletely resolved on the detector it may be possible to improve the processing by increasing the PROFILETOLERANCE parameters by 1-2 These parameters can be set in the Advanced integration tab of the Processing options menu (useSettings)
97 Advanced features for integration
The Settings -gt Processing options menu allows additional control over the integration Parameters such as the minimum spotseparation resolution limits excluded resolution ranges block size MTZ filename and BATCH ADD can be changed in the Processingtab
Manually decreasing the minimum spot separation can help if a large number of reflections are flagged as spatially overlapped (redboxes) The prediction must be updated to see the effect of changing the separation this can be done either by displaying the next orprevious image or double clicking on the blue circle next to the image currently displayed in the Images pane
In the Advanced integration tab the measurement box parameters profile tolerance and profile averaging parameters can be set
The measurement box parameters can be adjusted for rare cases where the estimation of the spot size has not worked correctlyresulting in a box that is too small or too large The optimisation of the background rim and corner cutoff parameters that determinewhich pixels are used for the background and which pixels for the peak can also be turned off but this is generally not recommended
Increasing the profile tolerance can help in cases where adjacent spots are not completely resolved this can be judged by examining thestandard profiles By default the profile tolerance is automatically increased if there are a large number of spatial overlaps as this hasthe effect of reducing the minimum spot separation A message will be written to the logfile if this has happened This option can beturned off using the tick box Optimise profile tolerance values to avoid spot overlap
The profile outlier exclusion parameters control the exclusion of ice spots or hot pixels which could otherwise corrupt the standardprofiles
Pixels with a value less than the Null pixel threshold are considered to belong to inactive regions of the detector
The pixel saturation value determines when a reflection is considered to be an overload The intensity of overloaded reflections isestimated by profile fitting but these reflections are rejected by the scaling program AIMLESS by default
Increasing the Maximum reflection width in φ from the default value of 5deg will reduce the number of rejected reflections (green boxes)and is worthwhile when the mosaicity is very high or the mosaic block size is very small As with the minimum spot separation theimage must be refreshed to see the effect of changing this parameter
The rejection criteria will reject reflections with too much variation in the background (BGRATIO) or where the gradient of thebackground plane is too large These should only be changed if many reflections are being rejected PKRATIO only applies to fullyrecorded reflections and reflects a very poor profile fit With current data collection protocols there will be very few (if any) fullyrecorded reflections
Additional MOSFLM parameters will be added based on user requests
98 Integrating multiple lattices
When multiple lattices have been successfully indexed each lattice can be integrated individually by selecting the appropriate latticenumber
Reflections in the chosen lattice that are overlapped by a reflection from another lattice will be integrated but the measurement box willbe expanded so that the total intensity of the two (or more) reflections is measured These reflections will be flagged for specialtreatment Reflections that are not overlapped are referred to as singletons They will be dealt with in the normal way by POINTLESSand AIMLESS
NOTE If more than one lattice has been indexed and the results of integrating just ONE of the lattices are to be checked byrunning QuickSymm or QuickScale then the multi-lattice icon in the Integration pane must be turned off otherwise an error
iMosflm Tutorial
fileUsersandrewg4MOSFLMnewgui_tutorialiMosflm_tutorial_720_ver3html[29052015 105311]
message will be given saying that all lattices must be integrated
It is often the case that by measuring both lattices (in separate integration runs) and inputting both MTZ files to QuickScale the overallcompleteness is high using ONLY the singletons To use this option ensure that the multi-lattice icon is off
To make use of the intensity estimates for overlapped reflections MTZ files for all lattices must be input to the program FECKLESSwhich will derive the best estimate of the summed intensity This is the default option if more than one lattice has been indexed and itrequires that all lattices have been integrated (in separate runs) prior to running QuickSymm or QuickScale (FECKLESS will be runautomatically)
At this time no downstream programs can make use of the summed intensities of overlapping reflections but in the future it should bepossible to use this data in REFMAC
Currently it is recommended to use only singletons from all the lattices FECKLESS is not required in this case
The MTZ filename is automatically updated to reflect which lattice has been chosen to avoid overwriting the MTZ file of the first latticewhen integrating the second one FECKLESS when run from iMosflm relies on this naming convention so do not change it
10 Running Pointless to check the symmetryOnce the images have been integrated (even a few degrees of data in many cases) the program POINTLESS can be run to determine thetrue Laue symmetry and try to determine the space group using the QuickSymm button
iMosflm Tutorial
fileUsersandrewg4MOSFLMnewgui_tutorialiMosflm_tutorial_720_ver3html[29052015 105311]
Select the QuickSymm button
A summary of the Pointless results as shown below will appear in a qtRView window
Various graphs (L test for twinning ViewHKL to view the reciprocal lattice) can also be viewed in this window
Various options for POINTLESS such as a reference MTZ file forcing the symmetry selected in iMosflm and specifying multiple input MTZfiles can be selected from the Settings -gt Processing options -gt Sort Scale and Merge tab (see below)
iMosflm Tutorial
fileUsersandrewg4MOSFLMnewgui_tutorialiMosflm_tutorial_720_ver3html[29052015 105311]
Caution The results can be ambiguous if run with a partial dataset Look in the logfile to see how many relfections are used totest each possible symmetry operator
11 Running Aimless to scale and merge the dataSelect the QuickScale button
This will first run POINTLESS then change the space group for the data to that selected by POINTLESS (unless the iMosflm symmetry isset to override POINTLESS) run AIMLESS to scale and merge the data in that space group and then run CTRUNCATE which calculates anumber of statistics from the intensity data The CCP4 UNIQUEIFY script will then be run which generates all the unique reflections forthat spacegroup to the resolution of the measured data and will flag reflections (5 by default but this can be changed) for use as theRfree set
AIMLESS can be run from the QuickScale button either treating anomalous data (the default) or ignoring anomalous data If onlyprocessing a few degrees of data it is usually better to ignore anomalous because especially for low symmetry cases no mergingstatistics may be given in AIMLESS
SCALA can be selected as an alternative to AIMLESS for scaling (not recommended)
There is limited control over running AIMLESS (see figure above) including re-setting resolution limits rejecting batches (images)changing the treatment for accepting partials changing the rejection criterion and changing the procedure for updating the standarddeviation estimates
iMosflm Tutorial
fileUsersandrewg4MOSFLMnewgui_tutorialiMosflm_tutorial_720_ver3html[29052015 105311]
The AIMLESS results will be displayed in the qtRView as shown below along with graphical output (see below) and the full log file canalso be examined
Aimless summary file
iMosflm Tutorial
fileUsersandrewg4MOSFLMnewgui_tutorialiMosflm_tutorial_720_ver3html[29052015 105311]
An example of the Aimless graphical output
The AIMLESS logfile can also be examined by selecting the Log File tab
12 History and mosflm log fileSelecting History allows the history of the session to be examined or by selecting the Log tab the full mosflmlp file can be viewed Themosflmlp file is also available in a time-stamped file mosflm_yyyymmdd_hhmmsslp (eg mosflm_20100518_131019lp) and can beread with a text editor
The History has a tree structure and will show when various parameters have been changed This has not been fully implemented and isnot generally useful
The logfile may provide useful clues when processing has failed
13 Warning MessagesAs already mentioned in Adding images sect3 and Integration sect9 warning messages are generated by MOSFLM during processing Atraffic light colour coding has now been assigned based on the warnings and is shown next to the Warnings box
A Red status implies a serious problem that will affect data quality and should be addressed
An Orange status implies minor issues that should be checked to see if things can be improved
A Green status means no significant problems messages are for information only
iMosflm Tutorial
fileUsersandrewg4MOSFLMnewgui_tutorialiMosflm_tutorial_720_ver3html[29052015 105311]
Abbreviated messages can be obtained by clicking on the Warnings icon The full warning Details together with Hints amp Notes text (ifany are available) can be obtained by double-clicking the relevant warning Details are displayed in a pop-up text box which willdisappear with the next click outside the box The same full details and suggestions are of course available in the mosflmlp files whereeven more information may be available
NOTE This is the end of the part of the tutorial which deals directly with iMosflm but see sect19 which has some suggestions forfurther work if you have time The remainder of this document deals with integrating and scaling data with MOSFLM andAimless via the CCP4i user interface examining the traditional mosflm SUMMARY file with the CCP4 utility loggraph
The Appendix contains a shell script for running MOSFLM as a traditional batch job
14 Useful command line optionsiMosflm has a number of command line options and these can be listed by typingimosflm --helpCurrent options are
--allimages -a ltfilenamegt Starts mosflm loading all files that match the template generated from ltfilenamegt--ccp4i2 Autosaves an iMosflm session file upon exit with an XML list of all iMosflm output files--debug -d Creates a large output file for debugging purposes Dont use this unless asked to by a developer--expert -e Permits access to advanced detector settings This should not normally be required--fastload -f Attempt to speed loading of many images offline while indexing two default images separated by 90 degrees--help -h Displays this message then exits--imagedir -I ltdirectorygt Starts the image browser in this directory if ltdirectorygt is given as an environment variable it will be expanded to its full value--init -i ltfilenamegt Starts Mosflm and reads from the given saved session file--startdir -S ltdirectorygt Starts mosflm in directory ltstartdirgt rather than the current directory This will only work if the directory exists and you have write permission to it otherwise iMosflm will exit All the normal mosflm output files will be in this directory--singleimage -s ltfilenamegt Starts mosflm loading only the image from ltfilenamegt--site -X ltfilenamegt Reads anyall of the following lines from the file given WAVELENGTH ltxgt DISPERSION ltxgt POLARISATION [PINHOLE | MIRRORS | MONOCHROMATOR | SYNCHROTRON ltxgt] DIVERGENCE ltxh xvgt BEAM ltbeamx beamygt DISTANCE ltxgt DISTORTION TILT ltxgt DISTORTION TWIST ltxgt GAIN ltxgt DETECTOR REVERSEPHI DETECTOR OMEGA ltxgt--version -v Displays the program version and required Mosflm version then exits
These can be abbreviated to the shortest unambiguous string
141 The site fileimosflm --site ltsitefilegt will read keywords from the file ltsitefilegt that will overwrite incorrect information in image headers Thissaves having to manually correct values in every iMosflm session The site file can also be read or written as an option from the Sessionmenu (see Drop down menus sect21) Allowed keywords areWAVELENGTH ltxgt
iMosflm Tutorial
fileUsersandrewg4MOSFLMnewgui_tutorialiMosflm_tutorial_720_ver3html[29052015 105311]
DISPERSION ltxgtPOLARISATION [PINHOLE | MIRRORS | MONO | SYNCHROTRON ltxgt]DIVERGENCE ltxh xvgtBEAM ltbeamx beamygtDISTANCE ltxgtDISTORTION TILT ltxgtDISTORTION TWIST ltxgtGAIN ltxgtDETECTOR REVERSEPHIDETECTOR OMEGA ltxgt
15 The mosflm SUMMARY fileMOSFLM produces a summary file listing refined parameters for each image and when using iMosflm this file will be date- amp time-stamped and have a name such as mosflm_20100518_131019sum This contains the same information as the plots produced by theiMOSFLM GUI which now also include the number of bad spots and overloads
This can be inspected graphically from the CCP4i GUI using the program loggraph Select the pull down menu View Files from Job andunder Output files select Additional log graphs where the _SUMMARYloggraph file will be listed Select this file to display its tablesin loggraph
This is very useful to identify rogue images (with unusually high positional residual or low Iσ(I)) If you find any read that image intoMOSFLM and see what is wrong with it
If you have done more than one integration run during your MOSFLM session you will find multiple entries of the tables Look at the lastset for integration of the 84 images
Click on the Refined detector parameter tables and check on the stability of parameters like the TILT and TWIST of the detector (unitsare hundredths of a degree) and for Mar Research (or DIP) image plate data the distortion parameters ROFF and TOFF (units are mm) Ifthey are varying a lot (more than 20 for TWISTTILT) or 015 for ROFFTOFF then it is probably a good idea to fix these parameters atthe average value (or the known values for this detector if they are available) (see Detector parameters sect821)
Click on the Post refinement table and check the missets It does not matter if they change slowly and by an amount (per image) that isless than 01mosaic spread If they are changing more than this then there could be a problem with processing the data (there is notmuch you can do about this)
Check how the mosaic spread is changing If it is unstable or if you think it is not refining to sensible values (as judged by looking atthe prediction) then you can fix the input value in the same way as the detector parameters (see Crystal parameters sect822)
BADSPOTS AND OVERLOADS
The program will set a rejection flag for those reflections that fail certain tests for example too much variation in the background levela poor profile fit an intensity that is very negative (more than 5 standard deviations) a very high gradient for the background planeThese reflections are called Bad spots and they are listed individually for each image in the mosflmlp file together with the reason forflagging them The number of bad spots is also written to the summary file Generally there should be very few (5-10) bad spots oneach image If there are more it could be because the backstop shadow is not correctly allowed for (consider using the NULLPIXkeyword)
There should also be very few overloaded reflections on each image If there are a lot then a separate low resolution data collectionpass should be made with a much shorter exposure time
IMPORTANT Both Bad spots and Overloads are written to the output MTZ file but will be rejected by default by AIMLESS Theintensity of overloaded reflections is estimated by profile fitting that part of the spot that is not saturated To include these reflections inthe final merged data use the ACCEPT keyword in AIMLESS
16 Scaling data with CCP4i ccp4i
Select Directories amp ProjectDir (top right)
In the new window select Add project
Enter the project name in the Project field and the full directory path in the uses directory field Default values may have been enteredalready here Select this project from Project for this session
Select Apply and Exit Dismiss the warning message that comes up
Select Data reduction from the pull down menu of modules (orange bar at top left)
iMosflm Tutorial
fileUsersandrewg4MOSFLMnewgui_tutorialiMosflm_tutorial_720_ver3html[29052015 105311]
Select Symmetry Scale Merge (Aimless)
In the window that appears do the following
Give a job title (top line)
Click on the box next to Separate anomalous pairs for outlier rejection amp merging statistics (the crystals have been soaked in a mercurycompound)
In the next orange bar (line starts HKLIN 1) select Browse and select the MTZ file output by MOSFLM (probably called hg_001mtz)Select OK
If you did not supply the Project name Crystal name or Dataset name to Mosflm fill in the boxes for these now
Under Scaling Protocol
From the pull-down menu on the line starting Scale select with automatic default settings
At the bottom of window from the pull-down menu named Run select RunampView Com File
This will display a new window showing the command file for running the POINTLESS step select Continue After a brief pause it willshow the command file for running AIMLESS (This can be edited before submitting the job) Select Continue
In the main window it will show that the AIMLESS job is running
When AIMLESS has finished the command file for running the CTRUNCATE step will appearselect Continue
When CTRUNCATE has run the main window will say FINISHED
At that point select the pull-down menu View Files from Job and select View Log Graphs This will give you the same graphs asrunning loggraph on the AIMLESS log file they are also the same as those that appeared in IMOSFLMs QuickScale task To look at thelog file itself (eg the overall merging statistics) select View Log File and it will appear in a new window
161 Looking at the AIMLESS output
The simplest way to look at the output from AIMLESS is to use loggraph on the AIMLESS log file (or via the CCP4i GUI) This can displaymany different graphs
Use Scales vs rotation range to check for smooth variation in the scale factor Check the variation in B factor with image and if there isno real variation it is best to turn off the B-factor refinement
Use the Analysis against all Batches for all runs to detect bad images (high R-factor large number of rejected spots)
Check the Analysis against resolution Fractional bias to see if there is any indication of Partial bias (A negative partial bias will resultif the mosaic spread is underestimated or if there is a lot of diffuse scatter
The Fractional bias should be less than 1-2 although it will often exceed this for weak data (eg in the high resolution bins)
The Axial reflections graphs in AIMLESS are useful for detecting systematic absences which can be used to identify the true spacegroup However the detection of screw axes is thought to be sufficiently robust in POINTLESS that these graphs are no longer necessary
It can also be useful to look at the AIMLESS log file itself in particular the table giving statistics as a function of resolution The effectiveresolution limit of the data can be estimated by looking at the Mn(I)sd column (this is the mean Iσ(I) AFTER merging symmetry matesand is the best indicator of data quality) This table also shows shell and cumulative R-factors
The Mn(I)sd values depend on having realistic values of the standard deviations (errors) in the intensities As the values that come fromMOSFLM are always underestimates of the true error these values are scaled up in AIMLESS using a three-term correction
sdcorrected = SdFac Sqrt[sd(I)2 + SdBLPI + (SdAddI)2]
Here SdFac is an overall scale factor and SdB and SdAdd are intensity dependent factors
AIMLESS will automatically work out a suitable value for all three parameters in order to make the mean value of (observedscatter)(sdestimate) equal to 10 where observed scatter is the difference between an individual estimate of intensity and the mean ofall other estimates (from symmetry mates)
Probably the best estimate of the true high resolution limit of the data can be obtained from the CC(12) values these are thecorrelations between equivalent observations that have been divided randomly into two half-datasets The resolution limit is foundwhen the CC drops below ~ 05 - 03
This table comes under the heading
ANALYSIS OF STANDARD DEVIATIONS
iMosflm Tutorial
fileUsersandrewg4MOSFLMnewgui_tutorialiMosflm_tutorial_720_ver3html[29052015 105311]
in the AIMLESS log file and Run n standard deviation v Intensity test (where n is 1 or more) in the CCP4i GUI View Files from Job -View Log Graphs display
Can you identify a bad image in this dataset Can you work out why it is bad
(Cluethe image headers contain quite a lot of information that is not used by MOSFLM including the date and time that the image wascollected)
You can exclude a given batch from the scaling using the EXCLUDE keyword
RUN ALL EXCLUDE imagenumber
In this case run number will be 1
Rerun the scaling SENDING THE OUTPUT TO A NEW LOGFILE excluding this image and see the effect on the heights in the anomalousPatterson (in the log file) DO NOT repeat the integration In the command file uncomment the line (near the top) goto aimless so itskips the integration part
In the CCP4i GUI click to highlight the AIMLESS job which is listed as FINISHED and select ldquoReRun Jobrdquo from the control buttons downthe right-hand side of the main interface window Under ldquoExcluded Datardquo in the window that appears check the box next to Excludeselected batches and pull-down on the menu button to exclude a range Give the start amp end range to exclude (eg 74 to 74) Rerunthe job as before
17 Changing the symmetryFrom the list of options at the left hand side of the main window select ldquoUtilitiesrdquo and under that SortModifyCombine MTZ Files
In the new window give a new title eg reindex as H32
Click on the Box Change space group andor reindex reflections
Use the browse option to select the input MTZ file (First orange bar) the output filename will be generated automatically (but you canchange it)
Under Reindex details
In the last option check the box next to ldquoChange space group tordquo and enter H32 in the box This is above the final item Reducereflections to the asymmetric unit which is checked by default
Select Run from the Run option button
Then go back to the scaling window and select the new MTZ file (reindexed) as the input for scaling (use Browse) CHANGE THE JOBTITLE
Then select RUN
The scaling will now be performed in space group H32 Look at the merging statistics in the log file in particular the multiplicityweighted R-factor called Rmeas in the log file
18 Looking at the CTRUNCATE outputThe CTRUNCATE program converts intensities to amplitudes and also compiles some useful statistics The LTEST and the cumulativeintensity statistics tabulated by CTRUNCATE (and plotted by loggraph) provide the only point at which you will be able to detectmerohedral twinning (when the two lattices of the twin components exactly overlap and every measured intensity is actually the sum oftwo intensities)
For a good dataset the observed distribution should be within 1 of the theoretical distribution Is this the case for this data
19 If you have time 191 Different mosaic spreads
Try repeating the processing with the mosaic spread set to a value 25 smaller than the refined one and fix it by checking the Fix boxin the Integration window in iMosflm
Can you tell from the merging statistics if this data is better
192 Checking up on outliers
iMosflm Tutorial
fileUsersandrewg4MOSFLMnewgui_tutorialiMosflm_tutorial_720_ver3html[29052015 105311]
AIMLESS writes a file called ROGUES which lists reflections which show very poor agreement between symmetry mates or which areimplausibly large
Look in this file (it is ASCII) and try to work out why this has happened The ROGUES file gives you the image (Batch) on which thereflections have been recorded (for partials this is the image nearest the centre of the reflection so you may need to look on thepreceding and following image as well) Select a reflection which shows very poor agreement with its symmetry mates (A value greaterthan 10 in the DelIsd column in the ROGUES file)
Select the offending image by double-clicking it in the Images pane of the iMosflm main window Predict the reflections then enter thehkl values into the boxes and hit Return (or click the red warning button following the entry box for l) to locate the offending reflectionin the image You must give the measured indices - the first set of values in the ROGUES file - when doing this See if there is anythingodd about the spot Remember to check adjacent images for partials
193 How accurate does the unit cell have to be
Try changing the cell parameters by (say) 10 and integrate the images again What is the effect on the merging statistics
20 Tips1 When reading images into a session DO NOT attempt to carry out any other task until ALL the images have been read2 It is often worth repeating the indexing (usually only once) as the refined direct beam coordinates from the first indexing may give
an improved solution when the indexing is repeated (lower rmsd)3 Always integrate a few degrees of data before integrating the whole dataset (see sect9) If the space group is not known in advance
run Quicksymm with a few degrees of data to check that the correct indexing solution has been chosen4 For difficult images do not attempt to refine the unit cell initially once an indexing solution has been obtained try integrating a
few images to ensure that the integration is stable If then going on to refine the cell check that the prediction looks OK for thefirst image of every segment included in the refinement If it does not look very good consider using the pattern matching(Settings -gt Processing options -gt Advanced refinement see sect84)
5 If the resolution of the data is less than 35 Aring do not use the ldquoRefine Cellrdquo task Instead use several images in indexing and use thecell that comes from the indexing
6 If iMosflm gets into a state where the activity icon(upper right) is spinning but nothing seems to be happening click on the activityicon to stop it spinning and see if the session can be continued DO NOT click on the activity icon simply to abort a task this willgive unpredictable results Use the Abort button for cell refinement or integration There is no defined way to abort indexing
7 Use the image summation option (see sect4) to get a better impression of the diffraction for very low exposure Pilatus images8 Use image summation for detector parameter refinement for fine sliced very weak Pilatus images (Settings -gt Processing options -
gt Advanced refinement see sect821)9 For large mosaic spread values (gt 10deg) or small mosaic block sizes (lt10) consider increasing the maximum allowed reflection
width to avoid having too many green predicted reflections (Settings -gt Processing options -gt Advanced integration see sect97)10 By default on selecting the Indexing task iMosflm will find spots index and (assuming a solution has been found) estimate the
mosaicity For difficult cases it is more useful to restrict this to simply finding spots and then do the indexing and mosaicityestimation by clicking the appropriate buttons To do this change the check box Automatically index after spot finding inSettings -gt Processing options -gt Indexing
11 See sect521 and sect522 for advice if the indexing fails Also consider the possibility of a reversed phi rotation direction if you arenot familiar with the beamline (Settings -gt Experiment settings -gt Experiment see sect21)
12 If the detector parameters have refined to physically unreasonable values (eg because cell refinement or integration has beencarried out using an incorrect indexing solution) be sure to reset the detector parameters before attempting further processing(Settings -gt Experiment settings -gt Detector see sect21)
13 Always set the resolution limit slightly beyond the point at which any spots are visible (see sect414 ) For very weak fine-sliceddata it can be very difficult to estimate the resolution visually so integrate to the maximum resolution (inscribed circle) and usethe merging results to set the final resolution There should be no problems integrating to a resolution ~03-05 Aring beyond theactual resolution limit but for example integrating to 3 Aring when the true resolution limit is 5-6 Aring may cause problems and theintegration should then be repeated with a more realistic resolution limit
14 Use the site file sect141 if repeatedly processing data where the direct beam position is wrong or if the phi direction is reversed etcto save having to correct this for every session
Appendix IA command script for running MOSFLM using the keywords copied from the Batch processing window of the new GUI (see Integratingas a background job sect952) Note that keyworded input for MOSFLM and other CCP4 programs is case-insensitive apart from file anddirectory names
bincsh -fv Set a unique identifier for filenames for this job
set ident = x89_mos07_blk3_smallsep
iMosflm Tutorial
fileUsersandrewg4MOSFLMnewgui_tutorialiMosflm_tutorial_720_ver3html[29052015 105311]
$ipmosflm COORDS $identcoords SUMMARY $identsummary ltlt eof-ip Insert keywords copied from iMosflm batch window here
Keywords for this run For example could involve trying different values for mosaic spread or not integrating all images etc etchklout $identmtzgenfile $identgenprocess 1 1000 goeof-ip
pointlesspointless hklin $identmtz hklout $ident_pointlessmtz
aimlessaimless hklin $ident_pointlessmtz hklout $ident_aimless_partmtz ROGUES $identrogues ltlt eof-aimless Use all default options for aimlesseof-aimless
ctruncate hklin $ident_aimlessmtz hklout $ident_truncatemtz
Harry Powell Andrew Leslie and Owen Johnson
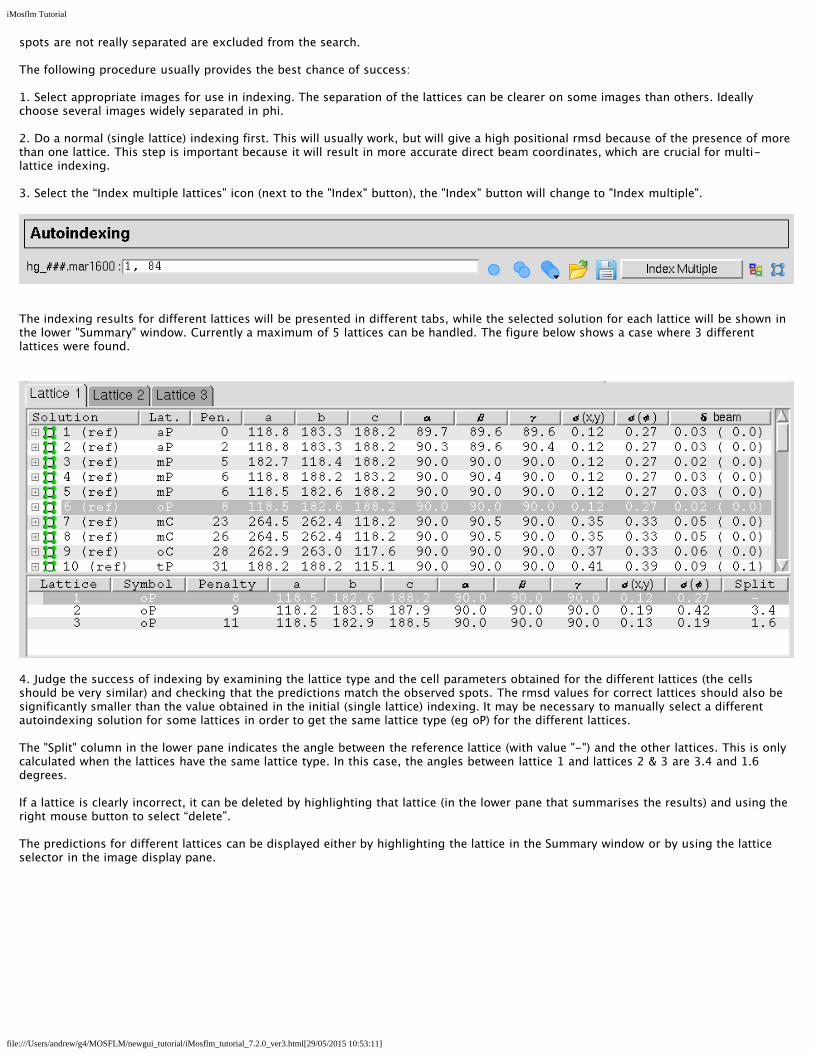
iMosflm Tutorial
fileUsersandrewg4MOSFLMnewgui_tutorialiMosflm_tutorial_720_ver3html[29052015 105311]
spots are not really separated are excluded from the search
The following procedure usually provides the best chance of success
1 Select appropriate images for use in indexing The separation of the lattices can be clearer on some images than others Ideallychoose several images widely separated in phi
2 Do a normal (single lattice) indexing first This will usually work but will give a high positional rmsd because of the presence of morethan one lattice This step is important because it will result in more accurate direct beam coordinates which are crucial for multi-lattice indexing
3 Select the ldquoIndex multiple latticesrdquo icon (next to the Index button) the Index button will change to Index multiple
The indexing results for different lattices will be presented in different tabs while the selected solution for each lattice will be shown inthe lower Summary window Currently a maximum of 5 lattices can be handled The figure below shows a case where 3 differentlattices were found
4 Judge the success of indexing by examining the lattice type and the cell parameters obtained for the different lattices (the cellsshould be very similar) and checking that the predictions match the observed spots The rmsd values for correct lattices should also besignificantly smaller than the value obtained in the initial (single lattice) indexing It may be necessary to manually select a differentautoindexing solution for some lattices in order to get the same lattice type (eg oP) for the different lattices
The Split column in the lower pane indicates the angle between the reference lattice (with value -) and the other lattices This is onlycalculated when the lattices have the same lattice type In this case the angles between lattice 1 and lattices 2 amp 3 are 34 and 16degrees
If a lattice is clearly incorrect it can be deleted by highlighting that lattice (in the lower pane that summarises the results) and using theright mouse button to select ldquodeleterdquo
The predictions for different lattices can be displayed either by highlighting the lattice in the Summary window or by using the latticeselector in the image display pane
iMosflm Tutorial
fileUsersandrewg4MOSFLMnewgui_tutorialiMosflm_tutorial_720_ver3html[29052015 105311]
In the image display spots in different lattices that overlap with each other are shown in magenta Only the summed intensity will bemeasured for these reflections
The predictions for all lattices can be shown by selecting the ldquomerge latticesrdquo icon in the image display
This can be useful to check if all the lattices have been successfully indexed because all spots in the image should then be predicted Inthe display predictions from lattice 12345 are shown in blue yellow red green and magenta with no distinction made between fullyand partially recorded reflections or spatial overlaps
iMosflm Tutorial
fileUsersandrewg4MOSFLMnewgui_tutorialiMosflm_tutorial_720_ver3html[29052015 105311]
531 Practical Tips
Beware of solutions where the lattices only vary in orientation by a small angle (less than 1 degree) as these are often different solutionsfor the same lattice The difference in orientation between lattices is given by the ldquosplitrdquo column in the Summary window but this is onlycalculated if the lattices have the same lattice type Differences are all relative to one lattice which will display a split angle as ldquo-ldquo Tocalculate the angles relative to a different lattice open the tab for that lattice select a different solution to that currently selected andthen select the original solution ndash this will trigger recalculation of the split angles relative to that lattice
Other parameters that can influence the indexing are the rdquoMaximum deviation from integral hklrdquo (default 02 when indexing multiplelattices otherwise 03) and ldquoNumber of vectors to find for indexingrdquo (default 30) These can be changed via the Indexing tab of theldquoProcessing Optionsrdquo that can be selected from the ldquoSettingsrdquo menu item Values between 015 and 025 might be helpful for the firstparameter and increasing the number of vectors from 30 to 50 can also help At present there is no defined protocol for changing thedefault parameter values for particular cases it has to be done by trial and error
Experience so far has shown that selecting appropriate images and adjusting the maximum cell length used in indexing have the biggesteffect The optimum value for the maximum cell length will normally lie between one and three times the largest cell dimension but it isworth varying this in steps of between 25 and 50 Aring as the indexing can be very sensitive to this parameter
For a more complete discussion of multiple lattice indexing see Powell HR Johnson O amp Leslie AGW 2013 Autoindexingdiffraction images with iMosflm Acta Cryst D69 1195-1203
54 Known cell option
For images that are very difficult to index if the cell parameters are known the known cell option can be usedSelect the ldquoKnown cellrdquo icon (next to the Multiple lattices icon) Enter the cell parameters in the Input known cell pop-up window andselect OK when all 6 parameters have been provided Then select the Index Cell button
To revert to normal indexing select the ldquoKnown cellrdquo icon and then select Clear in the Input known cell pop-up window
55 Space group selection
Note that the indexing is based solely on information about the unit cell parameters It will therefore be very difficult (or impossible) todetermine the correct Laue group in the presence of pseudosymmetry For example a monoclinic space group with β ~ 90deg will appearto be orthorhombic an orthorhombic space group with very similar a and b cell parameters will appear to be tetragonal These can onlybe distinguished when intensities are available (ie after integration) by running POINTLESS (QuickSymm) (see Running Pointless to check the
iMosflm Tutorial
fileUsersandrewg4MOSFLMnewgui_tutorialiMosflm_tutorial_720_ver3html[29052015 105311]
symmetry sect10)
In addition it is not possible to distinguish between Laue Groups 4m and 4mmm 3 and 3m 6m and 6mmm m3 and m3m Thiswill not affect integration of the images but it will affect the strategy calculation In the absence of additional information the lowersymmetry should be chosen for the strategy calculation to ensure that a complete dataset is collected
The presence of screw axes also cannot be detected so there is no basis on which to distinguish P21 from P2 etc This does not affectany aspect of data collection or processing and can be chosen (on the basis of systematic absences) after integration by runningPOINTLESS
In this example there is no way of knowing at this stage if the space group is h3 or h32 so leave it as h3
56 Mosaicity estimation
If the Automatically index after spot finding option has been chosen (Indexingtab of Processing Options) the mosaicity (mosaic spread) will be estimatedautomatically for the preferred solution However if another solution is chosenthe mosaicity should be estimated again
Click on the Estimate button to estimate the mosaicity
A window will appear which plots the total predicted intensity as a function ofmosaic spread from which an estimate is determined
The predictions displayed on the image will be updated Entering different valuesof mosaic spread in the box (followed by return) will allow a visual estimate of theeffect of changing the mosaic spread
The mosaic spread can also be entered in the Images pane by clicking once on theMosaicity line and once again on the value displayed
561 The mosaic block size
In some cases the apparent mosaic spread is much larger at low resolution than at high resolution so that if it is set to a value thatresults in all the low resolution spots being predicted many more spots are predicted than are visible at high resolution This effect isbest dealt with by adjusting the Mosaic block size which is also displayed in the Images pane This is modelling the size in microns ofthe individual mosaic blocks in the crystal Decreasing this to values of 05-5 microns (say) from the default of 100 microns will resultin predicting more spots at low resolution but have virtually no effect at high resolution This parameter is not refined (at present) andso the best value must be determined by trial and error
6 Saving and recovering a sessionThe session can be saved at any time using the Session drop-down menu referred to in sect21 The first time that a session is saved youwill be prompted for a filename The filename convention for saved session files is that the extension is mos
Save the current session Then exit from iMosflm (using the Session drop-down menu) restart iMosflm and read in the saved session
If the program crashes it should be possible to recover all but the latest actions as a temporary copy of the session file is continuallysaved to the directory mosflm in the users home directory
Restart iMosflm and it will pop up a Recover session window
Selecting the Recover button will restore the session as far as possible
iMosflm Tutorial
fileUsersandrewg4MOSFLMnewgui_tutorialiMosflm_tutorial_720_ver3html[29052015 105311]
7 Data collection strategyOnce the crystal orientation and (probable) Laue group have been determined it is possible to calculate a data collection strategy andthe Strategy icon is no longer greyed-out (in fact all other operations Strategy Cell Refinement and Integration become possible at thispoint)
Select the Strategy icon This will open the Strategy window
The statistics initially presented in the window are based on the images read in to the current session If only two (or more) references
iMosflm Tutorial
fileUsersandrewg4MOSFLMnewgui_tutorialiMosflm_tutorial_720_ver3html[29052015 105311]
images have been read in no statistics will be presented
When the Strategy option is used after two initial images (typically 90deg apart in φ) have been collected a complete shaded segment willnot be shown in the lower part of the screen rather an empty circle will be shown with the matrix label beneath it Click the Auto-complete button and in the pop-up menu that appears select a rotation angle or sweep of data to collect - or leave the Rotationsetting as Auto for a calculation of maximum completeness for this crystal orientation Click on Ok and the completeness results willbe presented
The orientation of the crystal expressed as the angles between the abc unit cell axes and the XYZ coordinate frame is given X isalong the X-ray beam Z is the rotation axis A warning will be given if the unique axis is so close to the rotation axis that there will bemissing cusp data
71 Evaluating completeness manually
The completeness of any given segment of data can be determined manually using the circle at the bottom left of the window Click onthe red segment shown in this circle
This will result in small black boxes being drawn on the circumference at the start and end of the red sector
Use the LMB to click on the black box at 0 and drag this around the circle
When the LMB is released the statistics for that sector will be displayed The statistics are presented in two ways Near the top right ofthe window the overall completeness is shown as red circles for unique data and anomalous pairs The average multiplicity is givenbeneath these circles
More detailed statistics (such as completeness as a function of resolution) are given in a series of histograms that can be selected by adrop-down menu
72 Calculating a strategy automatically
Uncheck the Use checkbox at the right side of the hg_001 line listed in the sector list near the top of the Strategy pane This means
iMosflm Tutorial
fileUsersandrewg4MOSFLMnewgui_tutorialiMosflm_tutorial_720_ver3html[29052015 105311]
that the 84 images used thus far will not be included in the completeness calculation only the matrix derived from indexing them willbe used Select the Auto-complete button to calculate a strategy automatically
A strategy calculation data pop-up window will appear
If multiple matrices have been defined (for different sectors of data) then the appropriate one can be selected (if there is only one sectorthis has no effect)
The total φ rotation to be used is normally calculated by MOSFLM based on the Laue group and the crystal orientation (the Auto setting)However it is sometimes possible to achieve a high completeness with a significantly smaller total rotation (eg 60deg in two 30degsegments will typically give gt94 completeness for orthorhombic space groups) and this can sometimes be useful if radiation damage isa serious problem although when using hybrid pixel detectors it is better to use a very conservative exposure time and collect a wide φrotation
Total rotation angles of between 5deg and 90deg can be selected from the drop-down list The number of segments to be used can be setbetween 1 and 3
If the check box is checked data completeness will be calculated to optimize the proportion of anomalous data collected
THIS IS IMPORTANT The optimum strategy is often different when maximising completeness of the anomalous data
Choose the default values (Rotation Auto Segments 1) but check the anomalous data box then click on Ok Look at the variousstatistics presented as bar charts
In space group H3 if rotating around the c axis a total rotation of 120deg would be required to collect a complete dataset (ignoring anydata lost in the cusp) Because the c axis is 22deg away from the rotation axis in this case it is possible to collect very high completeness(for unique data) with a rotation much smaller than this
Try to find the minimum total rotation that will give a dataset that is gt95 complete for the unique data Now do the same butrequiring gt95 completeness for the anomalous data
SKIP OVER SECTION 73 IF DOING THE NORMAL TUTORIAL
73 Calculating a strategy using multiple crystals
The Strategy pane may also be used when due to radiation damage many crystals are required to collect a complete dataset
IMPORTANT This procedure will only work correctly for space groups where there is no indexing ambiguity For those spacegroups where there is an indexing ambiguity( see httpwwwccp4acukdisthtmlreindexinghtml for a complete list) it isnecessary to integrate images to determine whether different crystals have been indexed in the same way This is not achievablewithin the Strategy option at present
Suppose the first crystal has been indexed from the reference images
Enter the Strategy pane an empty circle is displayed in the bottom part of the screen and click on the Auto-complete button nearthe top-right of the pane In the Auto-complete window that appears choose a suitable Rotation angle for the amount of datathat can be collected from one crystal say 20 degrees for this example Leave Segments set to 1 and do not check Optimize foranomalous data
Click the Ok button and the completeness of the data will be displayed The matrix name start and end phi values and the phiextent will be displayed in the top area of the pane with a checkbox ticked under the Use column This means this segment will beused in further strategy calculations
Accept and save this result by clicking on the yellow hatched segment displayed in the large circle near the bottom of the paneClick once and the segment will be outlined in black (you can adjust the start or end phi value calculated in one degree incrementsby click+dragging the respective black square) click again this time on the black square denoting the start or end phi (or release ifyou have adjusted by click+dragging) and the segment will turn red The segment will not be saved unless it has turned red
This result will be saved if you leave this pane (eg to load more images) and return later in this session The strategy file can alsobe saved to a permanent file using the Save button on the tool-bar This is highly recommended when working with many crystals
Return to the Strategy pane when you have loaded and indexed the reference image(s) from the second crystal and repeat the procedureabove You will see the calculated segment from the first matrix displayed at the bottom-left of the screen The optimum phi range for
iMosflm Tutorial
fileUsersandrewg4MOSFLMnewgui_tutorialiMosflm_tutorial_720_ver3html[29052015 105311]
the second crystal will be displayed Save this in the same way as for the first crystal (clicking twice) Repeat this procedure for anysubsequent crystals and in each case the optimum phi range will be calculated for the latest crystal taking into account the data fromprevious crystals
It is a good idea to save the strategy to a file as each new crystal is added in case the program crashes and this information is lost
In practice it is probably safest to have a separate iMosflm session that is reserved for the strategy calculations and not used to processany data The strategy for each new crystal can be calculated as described above If there is a problem and the session is corrupted or ifiMosflm is closed down for any reason it is straightforward to restore the status of the session providing the strategy has been savedThe following steps should be taken
1 Read in the reference images for the latest crystal and index them
2 Select the Strategy pane
3 Read in the optimised strategy for all previous crystals using the ldquoAddrdquo button and giving the appropriate filename
4 Making sure that the circle for the latest crystal is highlighted in the lower left window click on lsquoAuto-completersquo and follow the stepsdescribed above
Advanced Usage
The startend phi values for each crystalmatrix can be updated This might be required if for example only 10 degrees of useful datawere collected from a particular crystal instead of the anticipated 20 degrees To change the phi values click either on the matrix namein the top pane or on the circle showing the segment of data in the lower left pane (these are highlighted in a blue box as the mousemoves over them) The corresponding segment will now be displayed in the larger circle Click on the red segment so that a blacksquare appears at the startend phi values Then simply drag the appropriate phi to the desired value The completeness willautomatically be updated (but the strategy calculation for the latest crystal will not be repeated to do this the current segment must bedeleted by highlighting the matrix name and using right click and then repeating the Auto-complete step)
If matrix files saved from iMosflm are available from crystals for which data have been collected in previous sessions these can beadded into the calculation using the Add matrix button on the tool-bar
If the saved strategy result has become complicated or is incorrect and you wish to restart the calculations afresh there is a tool-barbutton Reload sectors from session This will remove any calculated sectors while leaving any known matrices listed at the bottom-leftof the Strategy pane
If you have saved a strategy file from a previous session this can be used to re-initialize the Strategy pane using the Load button onthe tool-bar
A Spacegroup pull-down menu has been added to the tool-bar to permit different choices of space group to be used in thecalculations (eg H3 and H32) This menu is populated from the list offered on the Indexing pane However the space group symboltext is editable Any space group symbol entered will be validated by Mosflm together with the current cell parameters
As a calculator for a multi-segment strategy the Strategy pane is reasonably flexible you can Save or Delete highlighted matrix lines byright-clicking As you highlight different matrix lines the orientation of the crystal expressed as the angles between the abc unit cellaxes and the XYZ coordinate frame is re-displayed in the centre of the pane
The following screen shot shows the cumulative results in the Strategy pane after this procedure has been followed for four crystals(ignore the iMosflm version number)
iMosflm Tutorial
fileUsersandrewg4MOSFLMnewgui_tutorialiMosflm_tutorial_720_ver3html[29052015 105311]
731 Calculating a strategy when some data have already been collected and processed
This option is not yet implemented If data have already been processed (to give an MTZ file) but the images are not currently available (eg they were collected on a previoussynchrotron trip possibly at a different synchrotron) then the MTZ file containing this data can be read and used to calculate a strategyfor data collection from new crystalsThe MTZ icon in the tool bar is used to read the MTZ file
74 Calculating a suitable oscillation angle
To calculate the maximum possible oscillation angle while avoiding spatial overlaps click on the Check for overlaps button A pop-upwindow will appear from which the option to calculate the maximum oscillation angle (as a function of φ) or check how many overlapswill occur for different (user selected) oscillation angles The results are plotted in the same pane as the histograms for the strategycalculations Note that the overlap calculation is based on the current values for the mosaic spread and spot separation and can be verysensitive to these values Note also that these are maximum and not necessarily recommended oscillation angles
iMosflm Tutorial
fileUsersandrewg4MOSFLMnewgui_tutorialiMosflm_tutorial_720_ver3html[29052015 105311]
8 Cell refinementIt is important to determine the cell parameters accurately before integrating the images Although the unit cell is refined as part of theautoindexing providing the diffraction extends beyond ~35Å resolution it is possible to obtain more accurate cell parameters using aprocedure known as post-refinement This procedure requires the integration of a series of images in ideally two or more separatesegments at widely different φ values The distribution of the intensity of partially recorded reflections over the images on which theyoccur is used to refine the unit cell crystal orientation and mosaic spread
Select the Cell Refinement icon
81 Selecting the images
iMosflm Tutorial
fileUsersandrewg4MOSFLMnewgui_tutorialiMosflm_tutorial_720_ver3html[29052015 105311]
There are several ways to select the images to be used in cell refinement Whichever method is used the image numbers will bedisplayed in the Images entry field iMosflm will automatically select appropriate images but these can be changed
811 Manual selection
A list of images can simply be typed into this box An image series can be specified as n-m where n and m are the first and last imagesDifferent series must be separated by white space or comma
For orthorhombic or higher symmetries two segments should be given approximately 90deg apart in φ For monoclinic or triclinic datathree or four segments are best (eg φ = 04590135)
The number of images that should be included in each segment depends on the mosaic spread and oscillation angle A reasonablenumber is 2(mosaic spreadoscillation angle +1) MOSFLM will automatically select two or more segments as appropriate Note thatthere is a limit on the total number of images that can be used
812 Automatic selection
Selecting the Automatically select images icon will select a suitable set of images
813 Graphical selection (Not recommended)
Selecting this icon will give a new window
Images can be selected by clicking in the Use check-box in the list of images or by using the mouse to drag a selection of imagesfrom the sector displayed The other icons allow the sector to be zoomed in or out and the viewed area to be moved to make theselection easier The final two icons on the tool-bar switch the segment display to fit the display space as either a full circle or aquadrant This Image palette can be closed by clicking outside its area but will close after 60 seconds anyway
82 Integrating the images and refining the cell
Use one of the methods above to select images to use in cell refinement and click on the Process button Before starting cell refinementcheck that the prediction for the first image in each segment to be used is good The majority of the spot positions must be correctlypredicted for the first image in each segment or else the refinement will not work
The selected images will be integrated and following integration the cell parameters are refined Selectable refined detector parameters
iMosflm Tutorial
fileUsersandrewg4MOSFLMnewgui_tutorialiMosflm_tutorial_720_ver3html[29052015 105311]
will be plotted as will the changes in crystal orientation and (if selected) mosaic spread If the shift in cell parameters is greater than 25standard deviations another cycle of integration and cell refinement is carried out Typically two or three cycles are required forconvergence Note that the current program activity is shown in the bottom left-hand corner of the window in the status message area
The different windows are explained below Moving the mouse over any parameter or plotted graph point will give a full description ofit
821 The detector parameters window
The values of the refined detector parameters are displayed for each image as it is integratedThere is the option to fix any of the parameters during integration by checking the Fix box onthe right The positional residuals (overall central and weighted) are also listed
Any of these parameters can be selected for plotting on the graph that appears to the right ofthis box by simply clicking on that parameter (which is then highlighted in blue as shown herefor Beam x and Beam y)
Check the stability of the refined parameters by displaying the appropriate graphs To getsensible scaling of the graphs only parameters with similar numerical values should be plottedtogether
For weak images (ie few visible spots in the outer regions of the image) the tilt and twistmay not be well defined and might refine to large values (greater than one degree) Insuch cases these parameters should be fixed It is not generally recommended to fix any
iMosflm Tutorial
fileUsersandrewg4MOSFLMnewgui_tutorialiMosflm_tutorial_720_ver3html[29052015 105311]
other detector parameters
For very weak fine sliced images (Pilatus only) there is the option to sum images when findingsuitable spots for refinement see Settings -gt Processing Options -gt Advanced refinementwhich can in some cases make the refinement more stable
822 The crystal parameters window
The values of the refined crystal missetting angles φ(x) φ(y) φ(z) the unit cell parameters andmosaic spread for the current image are displayed in the table Selected parameters will beplotted as for the detector parameters Specific unit cell parameters can also be fixed
If more than one segment of data is being used for cell refinement it is not unusual to see achange in orientation of the crystal between the two segments
Observe how the crystal orientation is different for images in the two segments See how themosaic spread varies during refinement
823 The central spot profile
The average spot profile for the central region of the detector is plotted for eachimage This confirms that the spot prediction is good If the profile is not welldefined and central in the box or if the blue border for the peak region of the spot ismuch larger than the apparent spots size it suggests a problem with the integrationand the initial prediction should be checked In some cases it may be necessary toincrease or decrease the Profile Tolerance parameters to ensure that the blue boxfits the spot To do this select the Advanced integration tab of Processing optionsCheck the central spot profiles for the images used in the cell refinement
824 The summary window
This window presents a summary of how selected parameters have changed indifferent cycles of the cell refinement The behaviour of these parameters gives agood indication of whether the cell refinement has been successful
If the refinement has been successful the RMS residual should be lower for thefinal cycle than in previous cycles However errors in the cell can be compensatedquite well by changing the crystal to detector distance so the differences are notalways dramatic
The other parameters that can be plotted from the pull-down list are the detectordistance and the Pixel ratio (Yscale)
The detector distance should be the same for all images in the refinement If the original indexing was based on auto-indexing a singleimage (say the first) then the detector distance might change for images from the second segment to compensate for an error in theoriginal cell If the variation in distance for different images increases with the cycle number this indicates that the refinement is notstable
The Pixel ratio (Yscale) parameter may also show an initial variation for images in different segments because refining Yscale (whichshould be 10000 for all except Raxis II and Raxis HTC detectors) can compensate for errors in cell dimensions in the same way that thedistance can The final values (last cycle) should be very close to identical for all images and should also be very close to unity (to within00010)
Cell refinement can be unstable if the data do not extend to at least 35 Aring If it appears unstable use the cell derived from auto-indexing a series of images well spaced in φ instead
iMosflm Tutorial
fileUsersandrewg4MOSFLMnewgui_tutorialiMosflm_tutorial_720_ver3html[29052015 105311]
Examine the plots to see if the parameters are stable and correct (Yscale)
825 The final results
When refinement has converged (or after 5 cycles) the initial and final cell parameters and the estimated errors (std dev) are listed
If time is available make a note of the std dev values and repeat the cell refinement using a larger number of images in each segmentAre the standard deviations smaller when using more images
83 Refining cell parameters for multiple lattices
Providing the resolution is high enough (generally better than ~35-32 Aring) and not too many of the spots in the different lattices areoverlapped it is possible to refine the cell parameters for each lattice individually The lattice to be refined is selected from the Latticeselector
This selector will be grayed out when processing a single lattice
84 If the prediction for the first image of a segment is poor
In some cases depending on how the indexing has been carried out or if the diffraction is poor or there has been a large change incrystal orientation during the data collection the prediction for one or more of the segments (the first image) may be poor In suchcases the integration and hence the cell refinement may fail It may be possible to successfully process the images after an initialrefinement of the crystal orientation using a pattern matching algorithm To select this option got to the Advanced refinement tab ofProcessing options and select the tick box for Refine orientation of first image in any run by pattern matching and for Integrate allimages Then refine the cell in the usual way During integration the orientation will be refined for the first image of each segmentoutput for this additional refinement will be written to the logfile but is not shown in the GUI
9 IntegrationThe accurate cell parameters are now used in the integration Note that although the images are integrated during the cell refinementthe intensities are not saved and no MTZ file is generated at that stage
It is good practice to start by integrating a block of images corresponding to a few degrees of data to check that the parameters do notneed further adjustment MOSFLM will generate warning messages after integration if there are any difficulties and it may be possibleto improve the situation by changing some of the default parameters (see Warning messages sect13)
Before integration ensure that the backstop shadow has been defined (see Masked areas backstop sect411 and Masked areas generalsect412)
91 Image selection
Image selection is performed in exactly the same way as in the cell refinement In this case the Automatic selection will simply includeall images in the current sector
Select images 1-10
92 Setting the MTZ filename and controlling updating of the image display
Two icons appear when the integration option is chosen
If the Show predictions icon is clicked the display window will be updated as eachimage is processed This will slow down the processing but allows the accuracy of theprediction to be checked for each image
iMosflm Tutorial
fileUsersandrewg4MOSFLMnewgui_tutorialiMosflm_tutorial_720_ver3html[29052015 105311]
Click on this icon so that the display will be updatedThe filename of the MTZ file containing the results of the integration is generatedautomatically but can be edited manually
93 Integrating the images
Click on the Process button to start integration
Integration of the images occurs in two passes In the first pass for each block of images (a number corresponding to a few degrees ofdata selected automatically by MOSFLM) the detector and crystal parameters are refined for each image in turn and the measurementboxes for all predicted spots are written to a file for use in the second pass In the second pass the standard profiles are formed fromreflections present on all of the images in this block and each image is then integrated and the results written to the MTZ file Thedisplay is not updated during the second pass and will remain on the last image of the block (assuming image updating has beenselected)
Note that the unit cell dimensions are normally fixed during integration and only the crystal orientation and mosaic spread are refinedCrystal parameter refinement only starts when a sufficient number of images have been integrated to provide data for the post-refinement typically after ~05-1 degree (more for high mosaicity)
94 Parameter display windows
As described in sect82 the refined detector and crystal parameters will be displayed in tables and selected parameters will be plotted ingraphs The average spot profile for each image will also be displayed
The size of these graphs (and the profile) can be expanded to fill the whole window by holding down Shift and clicking LMB anywherein the graph window A second Shift+click will revert the graph to the original size
In addition to these windows there are windows that tabulate and plot (as a function of image number) the mean Iσ(I) for profile fittedand summation integration intensities The overall values and the values for the highest resolution bin are given
The number of overloaded reflections Bad spots (ie those that fail certain tests see mosflm SUMMARY file sect15) Spatial overlaps andif processing multi-lattice images the number of lattice overlaps is listed for each image and can be plotted by highlighting thatparameter When processing data from crystals with large unit cells it is important to watch out for spatial overlaps (see sect97 for tips onhow to reduce the number of spatial overlaps if this is a problem)
A display of the standard profiles for different regions of the detector is also provided Poor profiles are averaged by includingreflections from inner regions of the detector Averaged profiles are indicated by a red line around the spot (rather than blue) Theoriginal unaveraged profile can be viewed a clicking on the profile (providing there were sufficient spots in that region to allowformation of a profile)
The profiles should be checked to see that they are well defined and centred within the box Poorly-defined diffuse or non-centredprofiles may suggest that the prediction is not very good in which case this should be checked on the corresponding image(s)
It may be useful to expand the standard profiles to fill the window using Shift + click in the profiles window
Finally the lower left window plots Iσ(I) as a function of resolution for any selected image
iMosflm Tutorial
fileUsersandrewg4MOSFLMnewgui_tutorialiMosflm_tutorial_720_ver3html[29052015 105311]
Different parameters can be plotted by selecting the small right- or left-pointing arrows on the title line above the plot
95 Integrating the whole datasetAssuming that everything looks OK the entire dataset can now be integrated However it is strongly recommended thatProjectCrystalDataset names are assigned first These are written to the output MTZ file and used by downstream programs inparticular AIMLESS will use this information when deciding which images belong to the same dataset
Select Experiment settings from the Settings drop-down menu (see Drop down menus sect21) to enter these names and optionally givea title for the MTZ file
Select images 1-84 and click on Process
951 Parallel Integration Using multiple cores
An option is available on the pull-down menu (next to the Process button in the Integration task) which splits up the integration jobover available cores on the local machine All aspects are currently determined automatically at present user-configurable options willbe available in a later version The algorithm used is as follows
iMosflm determines the number of cores available on the local machineIf the number of cores (N) is greater than 2 iMosflm splits the integration run into N-1 batches (up to a maximum of 16) containingapproximately the same number of images If N le 2 iMosflm splits the run into N batches
If the total number of images in each batch is less than 32 the number of batches is decreased until this condition is satisfied
The first batch is submitted as a background task consisting of a refinement stage and an integration stage with its input and outputfiles (including the MTZ file) in a new directory its name being determined from the number of segments of data being integrated andthe lattice number (if the sample has been determined to contain multiple lattices) If the directories exist already they are all movedinto a newly-created directory with a time-stamped name the files from the most recent integration run are thus in directories withnames following the pattern described above Once the refinement stage is complete the refined parameters are written to a file
The launch of subsequent batches are delayed until the corresponding preceding batch has written its refined parameters This file isread and the new batch is launched again with a refinement stage and integration stage
At present the job cannot be aborted once it has started
952 Integrating as a background job
By selecting Batch in the drop-down menu adjacent to the Process button the integration can be run as a background job rather thaninteractively and the GUI can be used to look at a different dataset
Selecting Batch from the drop-down menu will display a new window showing the script that will be used to process the images alongwith a number of processing options The script can be edited if additional keywords are required or if some parameters are to bechanged and can also be copied and pasted into a file for off-line processing
By default the job is divided into batches across multiple cores as determined for the parallel integration described in sect951 but thenumber of cores can be chosen by the user from a drop-down menu in this case the size of each batch is determined by the interface
Plotting the results of the integration can be turned off this can make processing much faster
iMosflm Tutorial
fileUsersandrewg4MOSFLMnewgui_tutorialiMosflm_tutorial_720_ver3html[29052015 105311]
It is possible to configure job submission for remote machines (which can be added by depressing the add host button) Ensure youhave enabled passwordless logins for all the remote machines you enter and that you specify the full path to the Mosflm executable inthe Batch destinations window The remote working directory (in which the log and MTZ files are written) and the remote imagedirectory must both be specified with their full path names Any required parameter fields that are not completed by the user arehighlighted in orange if the user tries to submit a job without completing these fields a new window containing only those fields (againhighlighted in orange) pops up with a request to do so
The number of cores available on the selected host can be determined by depressing the apple core button on the Batch destinationsconfiguration window
The log file for batch submission jobs the MTZ and SUMMARY files are written to the directory in which iMosflm was launched
96 Checking the integration
iMosflm Tutorial
fileUsersandrewg4MOSFLMnewgui_tutorialiMosflm_tutorial_720_ver3html[29052015 105311]
The detector and crystal parameter plots should be examined carefully to check for any instability in the refinement If there are largeand random variations in some parameters (eg the detector twist and tilt) then it may be better to fix them and repeat the integration
For cases (eg very small unit cells) where there are very few suitable reflections on each image the refinement of the missetting anglesmay show significant variations from one image to the next In such cases it is best to apply smoothing to the missetting angles usingthe tick box in Settings -gt Processing options -gt Advanced Refinement
Discontinuities due to blank images should also show up and the offending images should be removed from the scaling run
If adjacent spots are incompletely resolved on the detector it may be possible to improve the processing by increasing the PROFILETOLERANCE parameters by 1-2 These parameters can be set in the Advanced integration tab of the Processing options menu (useSettings)
97 Advanced features for integration
The Settings -gt Processing options menu allows additional control over the integration Parameters such as the minimum spotseparation resolution limits excluded resolution ranges block size MTZ filename and BATCH ADD can be changed in the Processingtab
Manually decreasing the minimum spot separation can help if a large number of reflections are flagged as spatially overlapped (redboxes) The prediction must be updated to see the effect of changing the separation this can be done either by displaying the next orprevious image or double clicking on the blue circle next to the image currently displayed in the Images pane
In the Advanced integration tab the measurement box parameters profile tolerance and profile averaging parameters can be set
The measurement box parameters can be adjusted for rare cases where the estimation of the spot size has not worked correctlyresulting in a box that is too small or too large The optimisation of the background rim and corner cutoff parameters that determinewhich pixels are used for the background and which pixels for the peak can also be turned off but this is generally not recommended
Increasing the profile tolerance can help in cases where adjacent spots are not completely resolved this can be judged by examining thestandard profiles By default the profile tolerance is automatically increased if there are a large number of spatial overlaps as this hasthe effect of reducing the minimum spot separation A message will be written to the logfile if this has happened This option can beturned off using the tick box Optimise profile tolerance values to avoid spot overlap
The profile outlier exclusion parameters control the exclusion of ice spots or hot pixels which could otherwise corrupt the standardprofiles
Pixels with a value less than the Null pixel threshold are considered to belong to inactive regions of the detector
The pixel saturation value determines when a reflection is considered to be an overload The intensity of overloaded reflections isestimated by profile fitting but these reflections are rejected by the scaling program AIMLESS by default
Increasing the Maximum reflection width in φ from the default value of 5deg will reduce the number of rejected reflections (green boxes)and is worthwhile when the mosaicity is very high or the mosaic block size is very small As with the minimum spot separation theimage must be refreshed to see the effect of changing this parameter
The rejection criteria will reject reflections with too much variation in the background (BGRATIO) or where the gradient of thebackground plane is too large These should only be changed if many reflections are being rejected PKRATIO only applies to fullyrecorded reflections and reflects a very poor profile fit With current data collection protocols there will be very few (if any) fullyrecorded reflections
Additional MOSFLM parameters will be added based on user requests
98 Integrating multiple lattices
When multiple lattices have been successfully indexed each lattice can be integrated individually by selecting the appropriate latticenumber
Reflections in the chosen lattice that are overlapped by a reflection from another lattice will be integrated but the measurement box willbe expanded so that the total intensity of the two (or more) reflections is measured These reflections will be flagged for specialtreatment Reflections that are not overlapped are referred to as singletons They will be dealt with in the normal way by POINTLESSand AIMLESS
NOTE If more than one lattice has been indexed and the results of integrating just ONE of the lattices are to be checked byrunning QuickSymm or QuickScale then the multi-lattice icon in the Integration pane must be turned off otherwise an error
iMosflm Tutorial
fileUsersandrewg4MOSFLMnewgui_tutorialiMosflm_tutorial_720_ver3html[29052015 105311]
message will be given saying that all lattices must be integrated
It is often the case that by measuring both lattices (in separate integration runs) and inputting both MTZ files to QuickScale the overallcompleteness is high using ONLY the singletons To use this option ensure that the multi-lattice icon is off
To make use of the intensity estimates for overlapped reflections MTZ files for all lattices must be input to the program FECKLESSwhich will derive the best estimate of the summed intensity This is the default option if more than one lattice has been indexed and itrequires that all lattices have been integrated (in separate runs) prior to running QuickSymm or QuickScale (FECKLESS will be runautomatically)
At this time no downstream programs can make use of the summed intensities of overlapping reflections but in the future it should bepossible to use this data in REFMAC
Currently it is recommended to use only singletons from all the lattices FECKLESS is not required in this case
The MTZ filename is automatically updated to reflect which lattice has been chosen to avoid overwriting the MTZ file of the first latticewhen integrating the second one FECKLESS when run from iMosflm relies on this naming convention so do not change it
10 Running Pointless to check the symmetryOnce the images have been integrated (even a few degrees of data in many cases) the program POINTLESS can be run to determine thetrue Laue symmetry and try to determine the space group using the QuickSymm button
iMosflm Tutorial
fileUsersandrewg4MOSFLMnewgui_tutorialiMosflm_tutorial_720_ver3html[29052015 105311]
Select the QuickSymm button
A summary of the Pointless results as shown below will appear in a qtRView window
Various graphs (L test for twinning ViewHKL to view the reciprocal lattice) can also be viewed in this window
Various options for POINTLESS such as a reference MTZ file forcing the symmetry selected in iMosflm and specifying multiple input MTZfiles can be selected from the Settings -gt Processing options -gt Sort Scale and Merge tab (see below)
iMosflm Tutorial
fileUsersandrewg4MOSFLMnewgui_tutorialiMosflm_tutorial_720_ver3html[29052015 105311]
Caution The results can be ambiguous if run with a partial dataset Look in the logfile to see how many relfections are used totest each possible symmetry operator
11 Running Aimless to scale and merge the dataSelect the QuickScale button
This will first run POINTLESS then change the space group for the data to that selected by POINTLESS (unless the iMosflm symmetry isset to override POINTLESS) run AIMLESS to scale and merge the data in that space group and then run CTRUNCATE which calculates anumber of statistics from the intensity data The CCP4 UNIQUEIFY script will then be run which generates all the unique reflections forthat spacegroup to the resolution of the measured data and will flag reflections (5 by default but this can be changed) for use as theRfree set
AIMLESS can be run from the QuickScale button either treating anomalous data (the default) or ignoring anomalous data If onlyprocessing a few degrees of data it is usually better to ignore anomalous because especially for low symmetry cases no mergingstatistics may be given in AIMLESS
SCALA can be selected as an alternative to AIMLESS for scaling (not recommended)
There is limited control over running AIMLESS (see figure above) including re-setting resolution limits rejecting batches (images)changing the treatment for accepting partials changing the rejection criterion and changing the procedure for updating the standarddeviation estimates
iMosflm Tutorial
fileUsersandrewg4MOSFLMnewgui_tutorialiMosflm_tutorial_720_ver3html[29052015 105311]
The AIMLESS results will be displayed in the qtRView as shown below along with graphical output (see below) and the full log file canalso be examined
Aimless summary file
iMosflm Tutorial
fileUsersandrewg4MOSFLMnewgui_tutorialiMosflm_tutorial_720_ver3html[29052015 105311]
An example of the Aimless graphical output
The AIMLESS logfile can also be examined by selecting the Log File tab
12 History and mosflm log fileSelecting History allows the history of the session to be examined or by selecting the Log tab the full mosflmlp file can be viewed Themosflmlp file is also available in a time-stamped file mosflm_yyyymmdd_hhmmsslp (eg mosflm_20100518_131019lp) and can beread with a text editor
The History has a tree structure and will show when various parameters have been changed This has not been fully implemented and isnot generally useful
The logfile may provide useful clues when processing has failed
13 Warning MessagesAs already mentioned in Adding images sect3 and Integration sect9 warning messages are generated by MOSFLM during processing Atraffic light colour coding has now been assigned based on the warnings and is shown next to the Warnings box
A Red status implies a serious problem that will affect data quality and should be addressed
An Orange status implies minor issues that should be checked to see if things can be improved
A Green status means no significant problems messages are for information only
iMosflm Tutorial
fileUsersandrewg4MOSFLMnewgui_tutorialiMosflm_tutorial_720_ver3html[29052015 105311]
Abbreviated messages can be obtained by clicking on the Warnings icon The full warning Details together with Hints amp Notes text (ifany are available) can be obtained by double-clicking the relevant warning Details are displayed in a pop-up text box which willdisappear with the next click outside the box The same full details and suggestions are of course available in the mosflmlp files whereeven more information may be available
NOTE This is the end of the part of the tutorial which deals directly with iMosflm but see sect19 which has some suggestions forfurther work if you have time The remainder of this document deals with integrating and scaling data with MOSFLM andAimless via the CCP4i user interface examining the traditional mosflm SUMMARY file with the CCP4 utility loggraph
The Appendix contains a shell script for running MOSFLM as a traditional batch job
14 Useful command line optionsiMosflm has a number of command line options and these can be listed by typingimosflm --helpCurrent options are
--allimages -a ltfilenamegt Starts mosflm loading all files that match the template generated from ltfilenamegt--ccp4i2 Autosaves an iMosflm session file upon exit with an XML list of all iMosflm output files--debug -d Creates a large output file for debugging purposes Dont use this unless asked to by a developer--expert -e Permits access to advanced detector settings This should not normally be required--fastload -f Attempt to speed loading of many images offline while indexing two default images separated by 90 degrees--help -h Displays this message then exits--imagedir -I ltdirectorygt Starts the image browser in this directory if ltdirectorygt is given as an environment variable it will be expanded to its full value--init -i ltfilenamegt Starts Mosflm and reads from the given saved session file--startdir -S ltdirectorygt Starts mosflm in directory ltstartdirgt rather than the current directory This will only work if the directory exists and you have write permission to it otherwise iMosflm will exit All the normal mosflm output files will be in this directory--singleimage -s ltfilenamegt Starts mosflm loading only the image from ltfilenamegt--site -X ltfilenamegt Reads anyall of the following lines from the file given WAVELENGTH ltxgt DISPERSION ltxgt POLARISATION [PINHOLE | MIRRORS | MONOCHROMATOR | SYNCHROTRON ltxgt] DIVERGENCE ltxh xvgt BEAM ltbeamx beamygt DISTANCE ltxgt DISTORTION TILT ltxgt DISTORTION TWIST ltxgt GAIN ltxgt DETECTOR REVERSEPHI DETECTOR OMEGA ltxgt--version -v Displays the program version and required Mosflm version then exits
These can be abbreviated to the shortest unambiguous string
141 The site fileimosflm --site ltsitefilegt will read keywords from the file ltsitefilegt that will overwrite incorrect information in image headers Thissaves having to manually correct values in every iMosflm session The site file can also be read or written as an option from the Sessionmenu (see Drop down menus sect21) Allowed keywords areWAVELENGTH ltxgt
iMosflm Tutorial
fileUsersandrewg4MOSFLMnewgui_tutorialiMosflm_tutorial_720_ver3html[29052015 105311]
DISPERSION ltxgtPOLARISATION [PINHOLE | MIRRORS | MONO | SYNCHROTRON ltxgt]DIVERGENCE ltxh xvgtBEAM ltbeamx beamygtDISTANCE ltxgtDISTORTION TILT ltxgtDISTORTION TWIST ltxgtGAIN ltxgtDETECTOR REVERSEPHIDETECTOR OMEGA ltxgt
15 The mosflm SUMMARY fileMOSFLM produces a summary file listing refined parameters for each image and when using iMosflm this file will be date- amp time-stamped and have a name such as mosflm_20100518_131019sum This contains the same information as the plots produced by theiMOSFLM GUI which now also include the number of bad spots and overloads
This can be inspected graphically from the CCP4i GUI using the program loggraph Select the pull down menu View Files from Job andunder Output files select Additional log graphs where the _SUMMARYloggraph file will be listed Select this file to display its tablesin loggraph
This is very useful to identify rogue images (with unusually high positional residual or low Iσ(I)) If you find any read that image intoMOSFLM and see what is wrong with it
If you have done more than one integration run during your MOSFLM session you will find multiple entries of the tables Look at the lastset for integration of the 84 images
Click on the Refined detector parameter tables and check on the stability of parameters like the TILT and TWIST of the detector (unitsare hundredths of a degree) and for Mar Research (or DIP) image plate data the distortion parameters ROFF and TOFF (units are mm) Ifthey are varying a lot (more than 20 for TWISTTILT) or 015 for ROFFTOFF then it is probably a good idea to fix these parameters atthe average value (or the known values for this detector if they are available) (see Detector parameters sect821)
Click on the Post refinement table and check the missets It does not matter if they change slowly and by an amount (per image) that isless than 01mosaic spread If they are changing more than this then there could be a problem with processing the data (there is notmuch you can do about this)
Check how the mosaic spread is changing If it is unstable or if you think it is not refining to sensible values (as judged by looking atthe prediction) then you can fix the input value in the same way as the detector parameters (see Crystal parameters sect822)
BADSPOTS AND OVERLOADS
The program will set a rejection flag for those reflections that fail certain tests for example too much variation in the background levela poor profile fit an intensity that is very negative (more than 5 standard deviations) a very high gradient for the background planeThese reflections are called Bad spots and they are listed individually for each image in the mosflmlp file together with the reason forflagging them The number of bad spots is also written to the summary file Generally there should be very few (5-10) bad spots oneach image If there are more it could be because the backstop shadow is not correctly allowed for (consider using the NULLPIXkeyword)
There should also be very few overloaded reflections on each image If there are a lot then a separate low resolution data collectionpass should be made with a much shorter exposure time
IMPORTANT Both Bad spots and Overloads are written to the output MTZ file but will be rejected by default by AIMLESS Theintensity of overloaded reflections is estimated by profile fitting that part of the spot that is not saturated To include these reflections inthe final merged data use the ACCEPT keyword in AIMLESS
16 Scaling data with CCP4i ccp4i
Select Directories amp ProjectDir (top right)
In the new window select Add project
Enter the project name in the Project field and the full directory path in the uses directory field Default values may have been enteredalready here Select this project from Project for this session
Select Apply and Exit Dismiss the warning message that comes up
Select Data reduction from the pull down menu of modules (orange bar at top left)
iMosflm Tutorial
fileUsersandrewg4MOSFLMnewgui_tutorialiMosflm_tutorial_720_ver3html[29052015 105311]
Select Symmetry Scale Merge (Aimless)
In the window that appears do the following
Give a job title (top line)
Click on the box next to Separate anomalous pairs for outlier rejection amp merging statistics (the crystals have been soaked in a mercurycompound)
In the next orange bar (line starts HKLIN 1) select Browse and select the MTZ file output by MOSFLM (probably called hg_001mtz)Select OK
If you did not supply the Project name Crystal name or Dataset name to Mosflm fill in the boxes for these now
Under Scaling Protocol
From the pull-down menu on the line starting Scale select with automatic default settings
At the bottom of window from the pull-down menu named Run select RunampView Com File
This will display a new window showing the command file for running the POINTLESS step select Continue After a brief pause it willshow the command file for running AIMLESS (This can be edited before submitting the job) Select Continue
In the main window it will show that the AIMLESS job is running
When AIMLESS has finished the command file for running the CTRUNCATE step will appearselect Continue
When CTRUNCATE has run the main window will say FINISHED
At that point select the pull-down menu View Files from Job and select View Log Graphs This will give you the same graphs asrunning loggraph on the AIMLESS log file they are also the same as those that appeared in IMOSFLMs QuickScale task To look at thelog file itself (eg the overall merging statistics) select View Log File and it will appear in a new window
161 Looking at the AIMLESS output
The simplest way to look at the output from AIMLESS is to use loggraph on the AIMLESS log file (or via the CCP4i GUI) This can displaymany different graphs
Use Scales vs rotation range to check for smooth variation in the scale factor Check the variation in B factor with image and if there isno real variation it is best to turn off the B-factor refinement
Use the Analysis against all Batches for all runs to detect bad images (high R-factor large number of rejected spots)
Check the Analysis against resolution Fractional bias to see if there is any indication of Partial bias (A negative partial bias will resultif the mosaic spread is underestimated or if there is a lot of diffuse scatter
The Fractional bias should be less than 1-2 although it will often exceed this for weak data (eg in the high resolution bins)
The Axial reflections graphs in AIMLESS are useful for detecting systematic absences which can be used to identify the true spacegroup However the detection of screw axes is thought to be sufficiently robust in POINTLESS that these graphs are no longer necessary
It can also be useful to look at the AIMLESS log file itself in particular the table giving statistics as a function of resolution The effectiveresolution limit of the data can be estimated by looking at the Mn(I)sd column (this is the mean Iσ(I) AFTER merging symmetry matesand is the best indicator of data quality) This table also shows shell and cumulative R-factors
The Mn(I)sd values depend on having realistic values of the standard deviations (errors) in the intensities As the values that come fromMOSFLM are always underestimates of the true error these values are scaled up in AIMLESS using a three-term correction
sdcorrected = SdFac Sqrt[sd(I)2 + SdBLPI + (SdAddI)2]
Here SdFac is an overall scale factor and SdB and SdAdd are intensity dependent factors
AIMLESS will automatically work out a suitable value for all three parameters in order to make the mean value of (observedscatter)(sdestimate) equal to 10 where observed scatter is the difference between an individual estimate of intensity and the mean ofall other estimates (from symmetry mates)
Probably the best estimate of the true high resolution limit of the data can be obtained from the CC(12) values these are thecorrelations between equivalent observations that have been divided randomly into two half-datasets The resolution limit is foundwhen the CC drops below ~ 05 - 03
This table comes under the heading
ANALYSIS OF STANDARD DEVIATIONS
iMosflm Tutorial
fileUsersandrewg4MOSFLMnewgui_tutorialiMosflm_tutorial_720_ver3html[29052015 105311]
in the AIMLESS log file and Run n standard deviation v Intensity test (where n is 1 or more) in the CCP4i GUI View Files from Job -View Log Graphs display
Can you identify a bad image in this dataset Can you work out why it is bad
(Cluethe image headers contain quite a lot of information that is not used by MOSFLM including the date and time that the image wascollected)
You can exclude a given batch from the scaling using the EXCLUDE keyword
RUN ALL EXCLUDE imagenumber
In this case run number will be 1
Rerun the scaling SENDING THE OUTPUT TO A NEW LOGFILE excluding this image and see the effect on the heights in the anomalousPatterson (in the log file) DO NOT repeat the integration In the command file uncomment the line (near the top) goto aimless so itskips the integration part
In the CCP4i GUI click to highlight the AIMLESS job which is listed as FINISHED and select ldquoReRun Jobrdquo from the control buttons downthe right-hand side of the main interface window Under ldquoExcluded Datardquo in the window that appears check the box next to Excludeselected batches and pull-down on the menu button to exclude a range Give the start amp end range to exclude (eg 74 to 74) Rerunthe job as before
17 Changing the symmetryFrom the list of options at the left hand side of the main window select ldquoUtilitiesrdquo and under that SortModifyCombine MTZ Files
In the new window give a new title eg reindex as H32
Click on the Box Change space group andor reindex reflections
Use the browse option to select the input MTZ file (First orange bar) the output filename will be generated automatically (but you canchange it)
Under Reindex details
In the last option check the box next to ldquoChange space group tordquo and enter H32 in the box This is above the final item Reducereflections to the asymmetric unit which is checked by default
Select Run from the Run option button
Then go back to the scaling window and select the new MTZ file (reindexed) as the input for scaling (use Browse) CHANGE THE JOBTITLE
Then select RUN
The scaling will now be performed in space group H32 Look at the merging statistics in the log file in particular the multiplicityweighted R-factor called Rmeas in the log file
18 Looking at the CTRUNCATE outputThe CTRUNCATE program converts intensities to amplitudes and also compiles some useful statistics The LTEST and the cumulativeintensity statistics tabulated by CTRUNCATE (and plotted by loggraph) provide the only point at which you will be able to detectmerohedral twinning (when the two lattices of the twin components exactly overlap and every measured intensity is actually the sum oftwo intensities)
For a good dataset the observed distribution should be within 1 of the theoretical distribution Is this the case for this data
19 If you have time 191 Different mosaic spreads
Try repeating the processing with the mosaic spread set to a value 25 smaller than the refined one and fix it by checking the Fix boxin the Integration window in iMosflm
Can you tell from the merging statistics if this data is better
192 Checking up on outliers
iMosflm Tutorial
fileUsersandrewg4MOSFLMnewgui_tutorialiMosflm_tutorial_720_ver3html[29052015 105311]
AIMLESS writes a file called ROGUES which lists reflections which show very poor agreement between symmetry mates or which areimplausibly large
Look in this file (it is ASCII) and try to work out why this has happened The ROGUES file gives you the image (Batch) on which thereflections have been recorded (for partials this is the image nearest the centre of the reflection so you may need to look on thepreceding and following image as well) Select a reflection which shows very poor agreement with its symmetry mates (A value greaterthan 10 in the DelIsd column in the ROGUES file)
Select the offending image by double-clicking it in the Images pane of the iMosflm main window Predict the reflections then enter thehkl values into the boxes and hit Return (or click the red warning button following the entry box for l) to locate the offending reflectionin the image You must give the measured indices - the first set of values in the ROGUES file - when doing this See if there is anythingodd about the spot Remember to check adjacent images for partials
193 How accurate does the unit cell have to be
Try changing the cell parameters by (say) 10 and integrate the images again What is the effect on the merging statistics
20 Tips1 When reading images into a session DO NOT attempt to carry out any other task until ALL the images have been read2 It is often worth repeating the indexing (usually only once) as the refined direct beam coordinates from the first indexing may give
an improved solution when the indexing is repeated (lower rmsd)3 Always integrate a few degrees of data before integrating the whole dataset (see sect9) If the space group is not known in advance
run Quicksymm with a few degrees of data to check that the correct indexing solution has been chosen4 For difficult images do not attempt to refine the unit cell initially once an indexing solution has been obtained try integrating a
few images to ensure that the integration is stable If then going on to refine the cell check that the prediction looks OK for thefirst image of every segment included in the refinement If it does not look very good consider using the pattern matching(Settings -gt Processing options -gt Advanced refinement see sect84)
5 If the resolution of the data is less than 35 Aring do not use the ldquoRefine Cellrdquo task Instead use several images in indexing and use thecell that comes from the indexing
6 If iMosflm gets into a state where the activity icon(upper right) is spinning but nothing seems to be happening click on the activityicon to stop it spinning and see if the session can be continued DO NOT click on the activity icon simply to abort a task this willgive unpredictable results Use the Abort button for cell refinement or integration There is no defined way to abort indexing
7 Use the image summation option (see sect4) to get a better impression of the diffraction for very low exposure Pilatus images8 Use image summation for detector parameter refinement for fine sliced very weak Pilatus images (Settings -gt Processing options -
gt Advanced refinement see sect821)9 For large mosaic spread values (gt 10deg) or small mosaic block sizes (lt10) consider increasing the maximum allowed reflection
width to avoid having too many green predicted reflections (Settings -gt Processing options -gt Advanced integration see sect97)10 By default on selecting the Indexing task iMosflm will find spots index and (assuming a solution has been found) estimate the
mosaicity For difficult cases it is more useful to restrict this to simply finding spots and then do the indexing and mosaicityestimation by clicking the appropriate buttons To do this change the check box Automatically index after spot finding inSettings -gt Processing options -gt Indexing
11 See sect521 and sect522 for advice if the indexing fails Also consider the possibility of a reversed phi rotation direction if you arenot familiar with the beamline (Settings -gt Experiment settings -gt Experiment see sect21)
12 If the detector parameters have refined to physically unreasonable values (eg because cell refinement or integration has beencarried out using an incorrect indexing solution) be sure to reset the detector parameters before attempting further processing(Settings -gt Experiment settings -gt Detector see sect21)
13 Always set the resolution limit slightly beyond the point at which any spots are visible (see sect414 ) For very weak fine-sliceddata it can be very difficult to estimate the resolution visually so integrate to the maximum resolution (inscribed circle) and usethe merging results to set the final resolution There should be no problems integrating to a resolution ~03-05 Aring beyond theactual resolution limit but for example integrating to 3 Aring when the true resolution limit is 5-6 Aring may cause problems and theintegration should then be repeated with a more realistic resolution limit
14 Use the site file sect141 if repeatedly processing data where the direct beam position is wrong or if the phi direction is reversed etcto save having to correct this for every session
Appendix IA command script for running MOSFLM using the keywords copied from the Batch processing window of the new GUI (see Integratingas a background job sect952) Note that keyworded input for MOSFLM and other CCP4 programs is case-insensitive apart from file anddirectory names
bincsh -fv Set a unique identifier for filenames for this job
set ident = x89_mos07_blk3_smallsep
iMosflm Tutorial
fileUsersandrewg4MOSFLMnewgui_tutorialiMosflm_tutorial_720_ver3html[29052015 105311]
$ipmosflm COORDS $identcoords SUMMARY $identsummary ltlt eof-ip Insert keywords copied from iMosflm batch window here
Keywords for this run For example could involve trying different values for mosaic spread or not integrating all images etc etchklout $identmtzgenfile $identgenprocess 1 1000 goeof-ip
pointlesspointless hklin $identmtz hklout $ident_pointlessmtz
aimlessaimless hklin $ident_pointlessmtz hklout $ident_aimless_partmtz ROGUES $identrogues ltlt eof-aimless Use all default options for aimlesseof-aimless
ctruncate hklin $ident_aimlessmtz hklout $ident_truncatemtz
Harry Powell Andrew Leslie and Owen Johnson
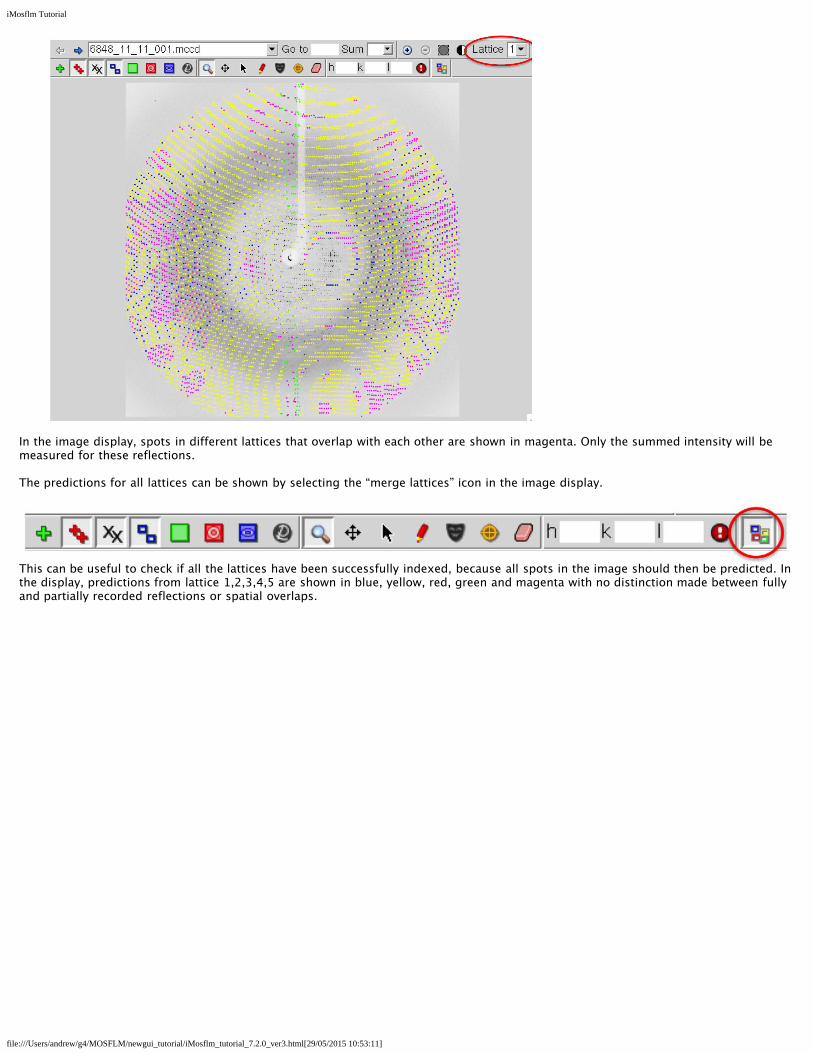
iMosflm Tutorial
fileUsersandrewg4MOSFLMnewgui_tutorialiMosflm_tutorial_720_ver3html[29052015 105311]
In the image display spots in different lattices that overlap with each other are shown in magenta Only the summed intensity will bemeasured for these reflections
The predictions for all lattices can be shown by selecting the ldquomerge latticesrdquo icon in the image display
This can be useful to check if all the lattices have been successfully indexed because all spots in the image should then be predicted Inthe display predictions from lattice 12345 are shown in blue yellow red green and magenta with no distinction made between fullyand partially recorded reflections or spatial overlaps
iMosflm Tutorial
fileUsersandrewg4MOSFLMnewgui_tutorialiMosflm_tutorial_720_ver3html[29052015 105311]
531 Practical Tips
Beware of solutions where the lattices only vary in orientation by a small angle (less than 1 degree) as these are often different solutionsfor the same lattice The difference in orientation between lattices is given by the ldquosplitrdquo column in the Summary window but this is onlycalculated if the lattices have the same lattice type Differences are all relative to one lattice which will display a split angle as ldquo-ldquo Tocalculate the angles relative to a different lattice open the tab for that lattice select a different solution to that currently selected andthen select the original solution ndash this will trigger recalculation of the split angles relative to that lattice
Other parameters that can influence the indexing are the rdquoMaximum deviation from integral hklrdquo (default 02 when indexing multiplelattices otherwise 03) and ldquoNumber of vectors to find for indexingrdquo (default 30) These can be changed via the Indexing tab of theldquoProcessing Optionsrdquo that can be selected from the ldquoSettingsrdquo menu item Values between 015 and 025 might be helpful for the firstparameter and increasing the number of vectors from 30 to 50 can also help At present there is no defined protocol for changing thedefault parameter values for particular cases it has to be done by trial and error
Experience so far has shown that selecting appropriate images and adjusting the maximum cell length used in indexing have the biggesteffect The optimum value for the maximum cell length will normally lie between one and three times the largest cell dimension but it isworth varying this in steps of between 25 and 50 Aring as the indexing can be very sensitive to this parameter
For a more complete discussion of multiple lattice indexing see Powell HR Johnson O amp Leslie AGW 2013 Autoindexingdiffraction images with iMosflm Acta Cryst D69 1195-1203
54 Known cell option
For images that are very difficult to index if the cell parameters are known the known cell option can be usedSelect the ldquoKnown cellrdquo icon (next to the Multiple lattices icon) Enter the cell parameters in the Input known cell pop-up window andselect OK when all 6 parameters have been provided Then select the Index Cell button
To revert to normal indexing select the ldquoKnown cellrdquo icon and then select Clear in the Input known cell pop-up window
55 Space group selection
Note that the indexing is based solely on information about the unit cell parameters It will therefore be very difficult (or impossible) todetermine the correct Laue group in the presence of pseudosymmetry For example a monoclinic space group with β ~ 90deg will appearto be orthorhombic an orthorhombic space group with very similar a and b cell parameters will appear to be tetragonal These can onlybe distinguished when intensities are available (ie after integration) by running POINTLESS (QuickSymm) (see Running Pointless to check the
iMosflm Tutorial
fileUsersandrewg4MOSFLMnewgui_tutorialiMosflm_tutorial_720_ver3html[29052015 105311]
symmetry sect10)
In addition it is not possible to distinguish between Laue Groups 4m and 4mmm 3 and 3m 6m and 6mmm m3 and m3m Thiswill not affect integration of the images but it will affect the strategy calculation In the absence of additional information the lowersymmetry should be chosen for the strategy calculation to ensure that a complete dataset is collected
The presence of screw axes also cannot be detected so there is no basis on which to distinguish P21 from P2 etc This does not affectany aspect of data collection or processing and can be chosen (on the basis of systematic absences) after integration by runningPOINTLESS
In this example there is no way of knowing at this stage if the space group is h3 or h32 so leave it as h3
56 Mosaicity estimation
If the Automatically index after spot finding option has been chosen (Indexingtab of Processing Options) the mosaicity (mosaic spread) will be estimatedautomatically for the preferred solution However if another solution is chosenthe mosaicity should be estimated again
Click on the Estimate button to estimate the mosaicity
A window will appear which plots the total predicted intensity as a function ofmosaic spread from which an estimate is determined
The predictions displayed on the image will be updated Entering different valuesof mosaic spread in the box (followed by return) will allow a visual estimate of theeffect of changing the mosaic spread
The mosaic spread can also be entered in the Images pane by clicking once on theMosaicity line and once again on the value displayed
561 The mosaic block size
In some cases the apparent mosaic spread is much larger at low resolution than at high resolution so that if it is set to a value thatresults in all the low resolution spots being predicted many more spots are predicted than are visible at high resolution This effect isbest dealt with by adjusting the Mosaic block size which is also displayed in the Images pane This is modelling the size in microns ofthe individual mosaic blocks in the crystal Decreasing this to values of 05-5 microns (say) from the default of 100 microns will resultin predicting more spots at low resolution but have virtually no effect at high resolution This parameter is not refined (at present) andso the best value must be determined by trial and error
6 Saving and recovering a sessionThe session can be saved at any time using the Session drop-down menu referred to in sect21 The first time that a session is saved youwill be prompted for a filename The filename convention for saved session files is that the extension is mos
Save the current session Then exit from iMosflm (using the Session drop-down menu) restart iMosflm and read in the saved session
If the program crashes it should be possible to recover all but the latest actions as a temporary copy of the session file is continuallysaved to the directory mosflm in the users home directory
Restart iMosflm and it will pop up a Recover session window
Selecting the Recover button will restore the session as far as possible
iMosflm Tutorial
fileUsersandrewg4MOSFLMnewgui_tutorialiMosflm_tutorial_720_ver3html[29052015 105311]
7 Data collection strategyOnce the crystal orientation and (probable) Laue group have been determined it is possible to calculate a data collection strategy andthe Strategy icon is no longer greyed-out (in fact all other operations Strategy Cell Refinement and Integration become possible at thispoint)
Select the Strategy icon This will open the Strategy window
The statistics initially presented in the window are based on the images read in to the current session If only two (or more) references
iMosflm Tutorial
fileUsersandrewg4MOSFLMnewgui_tutorialiMosflm_tutorial_720_ver3html[29052015 105311]
images have been read in no statistics will be presented
When the Strategy option is used after two initial images (typically 90deg apart in φ) have been collected a complete shaded segment willnot be shown in the lower part of the screen rather an empty circle will be shown with the matrix label beneath it Click the Auto-complete button and in the pop-up menu that appears select a rotation angle or sweep of data to collect - or leave the Rotationsetting as Auto for a calculation of maximum completeness for this crystal orientation Click on Ok and the completeness results willbe presented
The orientation of the crystal expressed as the angles between the abc unit cell axes and the XYZ coordinate frame is given X isalong the X-ray beam Z is the rotation axis A warning will be given if the unique axis is so close to the rotation axis that there will bemissing cusp data
71 Evaluating completeness manually
The completeness of any given segment of data can be determined manually using the circle at the bottom left of the window Click onthe red segment shown in this circle
This will result in small black boxes being drawn on the circumference at the start and end of the red sector
Use the LMB to click on the black box at 0 and drag this around the circle
When the LMB is released the statistics for that sector will be displayed The statistics are presented in two ways Near the top right ofthe window the overall completeness is shown as red circles for unique data and anomalous pairs The average multiplicity is givenbeneath these circles
More detailed statistics (such as completeness as a function of resolution) are given in a series of histograms that can be selected by adrop-down menu
72 Calculating a strategy automatically
Uncheck the Use checkbox at the right side of the hg_001 line listed in the sector list near the top of the Strategy pane This means
iMosflm Tutorial
fileUsersandrewg4MOSFLMnewgui_tutorialiMosflm_tutorial_720_ver3html[29052015 105311]
that the 84 images used thus far will not be included in the completeness calculation only the matrix derived from indexing them willbe used Select the Auto-complete button to calculate a strategy automatically
A strategy calculation data pop-up window will appear
If multiple matrices have been defined (for different sectors of data) then the appropriate one can be selected (if there is only one sectorthis has no effect)
The total φ rotation to be used is normally calculated by MOSFLM based on the Laue group and the crystal orientation (the Auto setting)However it is sometimes possible to achieve a high completeness with a significantly smaller total rotation (eg 60deg in two 30degsegments will typically give gt94 completeness for orthorhombic space groups) and this can sometimes be useful if radiation damage isa serious problem although when using hybrid pixel detectors it is better to use a very conservative exposure time and collect a wide φrotation
Total rotation angles of between 5deg and 90deg can be selected from the drop-down list The number of segments to be used can be setbetween 1 and 3
If the check box is checked data completeness will be calculated to optimize the proportion of anomalous data collected
THIS IS IMPORTANT The optimum strategy is often different when maximising completeness of the anomalous data
Choose the default values (Rotation Auto Segments 1) but check the anomalous data box then click on Ok Look at the variousstatistics presented as bar charts
In space group H3 if rotating around the c axis a total rotation of 120deg would be required to collect a complete dataset (ignoring anydata lost in the cusp) Because the c axis is 22deg away from the rotation axis in this case it is possible to collect very high completeness(for unique data) with a rotation much smaller than this
Try to find the minimum total rotation that will give a dataset that is gt95 complete for the unique data Now do the same butrequiring gt95 completeness for the anomalous data
SKIP OVER SECTION 73 IF DOING THE NORMAL TUTORIAL
73 Calculating a strategy using multiple crystals
The Strategy pane may also be used when due to radiation damage many crystals are required to collect a complete dataset
IMPORTANT This procedure will only work correctly for space groups where there is no indexing ambiguity For those spacegroups where there is an indexing ambiguity( see httpwwwccp4acukdisthtmlreindexinghtml for a complete list) it isnecessary to integrate images to determine whether different crystals have been indexed in the same way This is not achievablewithin the Strategy option at present
Suppose the first crystal has been indexed from the reference images
Enter the Strategy pane an empty circle is displayed in the bottom part of the screen and click on the Auto-complete button nearthe top-right of the pane In the Auto-complete window that appears choose a suitable Rotation angle for the amount of datathat can be collected from one crystal say 20 degrees for this example Leave Segments set to 1 and do not check Optimize foranomalous data
Click the Ok button and the completeness of the data will be displayed The matrix name start and end phi values and the phiextent will be displayed in the top area of the pane with a checkbox ticked under the Use column This means this segment will beused in further strategy calculations
Accept and save this result by clicking on the yellow hatched segment displayed in the large circle near the bottom of the paneClick once and the segment will be outlined in black (you can adjust the start or end phi value calculated in one degree incrementsby click+dragging the respective black square) click again this time on the black square denoting the start or end phi (or release ifyou have adjusted by click+dragging) and the segment will turn red The segment will not be saved unless it has turned red
This result will be saved if you leave this pane (eg to load more images) and return later in this session The strategy file can alsobe saved to a permanent file using the Save button on the tool-bar This is highly recommended when working with many crystals
Return to the Strategy pane when you have loaded and indexed the reference image(s) from the second crystal and repeat the procedureabove You will see the calculated segment from the first matrix displayed at the bottom-left of the screen The optimum phi range for
iMosflm Tutorial
fileUsersandrewg4MOSFLMnewgui_tutorialiMosflm_tutorial_720_ver3html[29052015 105311]
the second crystal will be displayed Save this in the same way as for the first crystal (clicking twice) Repeat this procedure for anysubsequent crystals and in each case the optimum phi range will be calculated for the latest crystal taking into account the data fromprevious crystals
It is a good idea to save the strategy to a file as each new crystal is added in case the program crashes and this information is lost
In practice it is probably safest to have a separate iMosflm session that is reserved for the strategy calculations and not used to processany data The strategy for each new crystal can be calculated as described above If there is a problem and the session is corrupted or ifiMosflm is closed down for any reason it is straightforward to restore the status of the session providing the strategy has been savedThe following steps should be taken
1 Read in the reference images for the latest crystal and index them
2 Select the Strategy pane
3 Read in the optimised strategy for all previous crystals using the ldquoAddrdquo button and giving the appropriate filename
4 Making sure that the circle for the latest crystal is highlighted in the lower left window click on lsquoAuto-completersquo and follow the stepsdescribed above
Advanced Usage
The startend phi values for each crystalmatrix can be updated This might be required if for example only 10 degrees of useful datawere collected from a particular crystal instead of the anticipated 20 degrees To change the phi values click either on the matrix namein the top pane or on the circle showing the segment of data in the lower left pane (these are highlighted in a blue box as the mousemoves over them) The corresponding segment will now be displayed in the larger circle Click on the red segment so that a blacksquare appears at the startend phi values Then simply drag the appropriate phi to the desired value The completeness willautomatically be updated (but the strategy calculation for the latest crystal will not be repeated to do this the current segment must bedeleted by highlighting the matrix name and using right click and then repeating the Auto-complete step)
If matrix files saved from iMosflm are available from crystals for which data have been collected in previous sessions these can beadded into the calculation using the Add matrix button on the tool-bar
If the saved strategy result has become complicated or is incorrect and you wish to restart the calculations afresh there is a tool-barbutton Reload sectors from session This will remove any calculated sectors while leaving any known matrices listed at the bottom-leftof the Strategy pane
If you have saved a strategy file from a previous session this can be used to re-initialize the Strategy pane using the Load button onthe tool-bar
A Spacegroup pull-down menu has been added to the tool-bar to permit different choices of space group to be used in thecalculations (eg H3 and H32) This menu is populated from the list offered on the Indexing pane However the space group symboltext is editable Any space group symbol entered will be validated by Mosflm together with the current cell parameters
As a calculator for a multi-segment strategy the Strategy pane is reasonably flexible you can Save or Delete highlighted matrix lines byright-clicking As you highlight different matrix lines the orientation of the crystal expressed as the angles between the abc unit cellaxes and the XYZ coordinate frame is re-displayed in the centre of the pane
The following screen shot shows the cumulative results in the Strategy pane after this procedure has been followed for four crystals(ignore the iMosflm version number)
iMosflm Tutorial
fileUsersandrewg4MOSFLMnewgui_tutorialiMosflm_tutorial_720_ver3html[29052015 105311]
731 Calculating a strategy when some data have already been collected and processed
This option is not yet implemented If data have already been processed (to give an MTZ file) but the images are not currently available (eg they were collected on a previoussynchrotron trip possibly at a different synchrotron) then the MTZ file containing this data can be read and used to calculate a strategyfor data collection from new crystalsThe MTZ icon in the tool bar is used to read the MTZ file
74 Calculating a suitable oscillation angle
To calculate the maximum possible oscillation angle while avoiding spatial overlaps click on the Check for overlaps button A pop-upwindow will appear from which the option to calculate the maximum oscillation angle (as a function of φ) or check how many overlapswill occur for different (user selected) oscillation angles The results are plotted in the same pane as the histograms for the strategycalculations Note that the overlap calculation is based on the current values for the mosaic spread and spot separation and can be verysensitive to these values Note also that these are maximum and not necessarily recommended oscillation angles
iMosflm Tutorial
fileUsersandrewg4MOSFLMnewgui_tutorialiMosflm_tutorial_720_ver3html[29052015 105311]
8 Cell refinementIt is important to determine the cell parameters accurately before integrating the images Although the unit cell is refined as part of theautoindexing providing the diffraction extends beyond ~35Å resolution it is possible to obtain more accurate cell parameters using aprocedure known as post-refinement This procedure requires the integration of a series of images in ideally two or more separatesegments at widely different φ values The distribution of the intensity of partially recorded reflections over the images on which theyoccur is used to refine the unit cell crystal orientation and mosaic spread
Select the Cell Refinement icon
81 Selecting the images
iMosflm Tutorial
fileUsersandrewg4MOSFLMnewgui_tutorialiMosflm_tutorial_720_ver3html[29052015 105311]
There are several ways to select the images to be used in cell refinement Whichever method is used the image numbers will bedisplayed in the Images entry field iMosflm will automatically select appropriate images but these can be changed
811 Manual selection
A list of images can simply be typed into this box An image series can be specified as n-m where n and m are the first and last imagesDifferent series must be separated by white space or comma
For orthorhombic or higher symmetries two segments should be given approximately 90deg apart in φ For monoclinic or triclinic datathree or four segments are best (eg φ = 04590135)
The number of images that should be included in each segment depends on the mosaic spread and oscillation angle A reasonablenumber is 2(mosaic spreadoscillation angle +1) MOSFLM will automatically select two or more segments as appropriate Note thatthere is a limit on the total number of images that can be used
812 Automatic selection
Selecting the Automatically select images icon will select a suitable set of images
813 Graphical selection (Not recommended)
Selecting this icon will give a new window
Images can be selected by clicking in the Use check-box in the list of images or by using the mouse to drag a selection of imagesfrom the sector displayed The other icons allow the sector to be zoomed in or out and the viewed area to be moved to make theselection easier The final two icons on the tool-bar switch the segment display to fit the display space as either a full circle or aquadrant This Image palette can be closed by clicking outside its area but will close after 60 seconds anyway
82 Integrating the images and refining the cell
Use one of the methods above to select images to use in cell refinement and click on the Process button Before starting cell refinementcheck that the prediction for the first image in each segment to be used is good The majority of the spot positions must be correctlypredicted for the first image in each segment or else the refinement will not work
The selected images will be integrated and following integration the cell parameters are refined Selectable refined detector parameters
iMosflm Tutorial
fileUsersandrewg4MOSFLMnewgui_tutorialiMosflm_tutorial_720_ver3html[29052015 105311]
will be plotted as will the changes in crystal orientation and (if selected) mosaic spread If the shift in cell parameters is greater than 25standard deviations another cycle of integration and cell refinement is carried out Typically two or three cycles are required forconvergence Note that the current program activity is shown in the bottom left-hand corner of the window in the status message area
The different windows are explained below Moving the mouse over any parameter or plotted graph point will give a full description ofit
821 The detector parameters window
The values of the refined detector parameters are displayed for each image as it is integratedThere is the option to fix any of the parameters during integration by checking the Fix box onthe right The positional residuals (overall central and weighted) are also listed
Any of these parameters can be selected for plotting on the graph that appears to the right ofthis box by simply clicking on that parameter (which is then highlighted in blue as shown herefor Beam x and Beam y)
Check the stability of the refined parameters by displaying the appropriate graphs To getsensible scaling of the graphs only parameters with similar numerical values should be plottedtogether
For weak images (ie few visible spots in the outer regions of the image) the tilt and twistmay not be well defined and might refine to large values (greater than one degree) Insuch cases these parameters should be fixed It is not generally recommended to fix any
iMosflm Tutorial
fileUsersandrewg4MOSFLMnewgui_tutorialiMosflm_tutorial_720_ver3html[29052015 105311]
other detector parameters
For very weak fine sliced images (Pilatus only) there is the option to sum images when findingsuitable spots for refinement see Settings -gt Processing Options -gt Advanced refinementwhich can in some cases make the refinement more stable
822 The crystal parameters window
The values of the refined crystal missetting angles φ(x) φ(y) φ(z) the unit cell parameters andmosaic spread for the current image are displayed in the table Selected parameters will beplotted as for the detector parameters Specific unit cell parameters can also be fixed
If more than one segment of data is being used for cell refinement it is not unusual to see achange in orientation of the crystal between the two segments
Observe how the crystal orientation is different for images in the two segments See how themosaic spread varies during refinement
823 The central spot profile
The average spot profile for the central region of the detector is plotted for eachimage This confirms that the spot prediction is good If the profile is not welldefined and central in the box or if the blue border for the peak region of the spot ismuch larger than the apparent spots size it suggests a problem with the integrationand the initial prediction should be checked In some cases it may be necessary toincrease or decrease the Profile Tolerance parameters to ensure that the blue boxfits the spot To do this select the Advanced integration tab of Processing optionsCheck the central spot profiles for the images used in the cell refinement
824 The summary window
This window presents a summary of how selected parameters have changed indifferent cycles of the cell refinement The behaviour of these parameters gives agood indication of whether the cell refinement has been successful
If the refinement has been successful the RMS residual should be lower for thefinal cycle than in previous cycles However errors in the cell can be compensatedquite well by changing the crystal to detector distance so the differences are notalways dramatic
The other parameters that can be plotted from the pull-down list are the detectordistance and the Pixel ratio (Yscale)
The detector distance should be the same for all images in the refinement If the original indexing was based on auto-indexing a singleimage (say the first) then the detector distance might change for images from the second segment to compensate for an error in theoriginal cell If the variation in distance for different images increases with the cycle number this indicates that the refinement is notstable
The Pixel ratio (Yscale) parameter may also show an initial variation for images in different segments because refining Yscale (whichshould be 10000 for all except Raxis II and Raxis HTC detectors) can compensate for errors in cell dimensions in the same way that thedistance can The final values (last cycle) should be very close to identical for all images and should also be very close to unity (to within00010)
Cell refinement can be unstable if the data do not extend to at least 35 Aring If it appears unstable use the cell derived from auto-indexing a series of images well spaced in φ instead
iMosflm Tutorial
fileUsersandrewg4MOSFLMnewgui_tutorialiMosflm_tutorial_720_ver3html[29052015 105311]
Examine the plots to see if the parameters are stable and correct (Yscale)
825 The final results
When refinement has converged (or after 5 cycles) the initial and final cell parameters and the estimated errors (std dev) are listed
If time is available make a note of the std dev values and repeat the cell refinement using a larger number of images in each segmentAre the standard deviations smaller when using more images
83 Refining cell parameters for multiple lattices
Providing the resolution is high enough (generally better than ~35-32 Aring) and not too many of the spots in the different lattices areoverlapped it is possible to refine the cell parameters for each lattice individually The lattice to be refined is selected from the Latticeselector
This selector will be grayed out when processing a single lattice
84 If the prediction for the first image of a segment is poor
In some cases depending on how the indexing has been carried out or if the diffraction is poor or there has been a large change incrystal orientation during the data collection the prediction for one or more of the segments (the first image) may be poor In suchcases the integration and hence the cell refinement may fail It may be possible to successfully process the images after an initialrefinement of the crystal orientation using a pattern matching algorithm To select this option got to the Advanced refinement tab ofProcessing options and select the tick box for Refine orientation of first image in any run by pattern matching and for Integrate allimages Then refine the cell in the usual way During integration the orientation will be refined for the first image of each segmentoutput for this additional refinement will be written to the logfile but is not shown in the GUI
9 IntegrationThe accurate cell parameters are now used in the integration Note that although the images are integrated during the cell refinementthe intensities are not saved and no MTZ file is generated at that stage
It is good practice to start by integrating a block of images corresponding to a few degrees of data to check that the parameters do notneed further adjustment MOSFLM will generate warning messages after integration if there are any difficulties and it may be possibleto improve the situation by changing some of the default parameters (see Warning messages sect13)
Before integration ensure that the backstop shadow has been defined (see Masked areas backstop sect411 and Masked areas generalsect412)
91 Image selection
Image selection is performed in exactly the same way as in the cell refinement In this case the Automatic selection will simply includeall images in the current sector
Select images 1-10
92 Setting the MTZ filename and controlling updating of the image display
Two icons appear when the integration option is chosen
If the Show predictions icon is clicked the display window will be updated as eachimage is processed This will slow down the processing but allows the accuracy of theprediction to be checked for each image
iMosflm Tutorial
fileUsersandrewg4MOSFLMnewgui_tutorialiMosflm_tutorial_720_ver3html[29052015 105311]
Click on this icon so that the display will be updatedThe filename of the MTZ file containing the results of the integration is generatedautomatically but can be edited manually
93 Integrating the images
Click on the Process button to start integration
Integration of the images occurs in two passes In the first pass for each block of images (a number corresponding to a few degrees ofdata selected automatically by MOSFLM) the detector and crystal parameters are refined for each image in turn and the measurementboxes for all predicted spots are written to a file for use in the second pass In the second pass the standard profiles are formed fromreflections present on all of the images in this block and each image is then integrated and the results written to the MTZ file Thedisplay is not updated during the second pass and will remain on the last image of the block (assuming image updating has beenselected)
Note that the unit cell dimensions are normally fixed during integration and only the crystal orientation and mosaic spread are refinedCrystal parameter refinement only starts when a sufficient number of images have been integrated to provide data for the post-refinement typically after ~05-1 degree (more for high mosaicity)
94 Parameter display windows
As described in sect82 the refined detector and crystal parameters will be displayed in tables and selected parameters will be plotted ingraphs The average spot profile for each image will also be displayed
The size of these graphs (and the profile) can be expanded to fill the whole window by holding down Shift and clicking LMB anywherein the graph window A second Shift+click will revert the graph to the original size
In addition to these windows there are windows that tabulate and plot (as a function of image number) the mean Iσ(I) for profile fittedand summation integration intensities The overall values and the values for the highest resolution bin are given
The number of overloaded reflections Bad spots (ie those that fail certain tests see mosflm SUMMARY file sect15) Spatial overlaps andif processing multi-lattice images the number of lattice overlaps is listed for each image and can be plotted by highlighting thatparameter When processing data from crystals with large unit cells it is important to watch out for spatial overlaps (see sect97 for tips onhow to reduce the number of spatial overlaps if this is a problem)
A display of the standard profiles for different regions of the detector is also provided Poor profiles are averaged by includingreflections from inner regions of the detector Averaged profiles are indicated by a red line around the spot (rather than blue) Theoriginal unaveraged profile can be viewed a clicking on the profile (providing there were sufficient spots in that region to allowformation of a profile)
The profiles should be checked to see that they are well defined and centred within the box Poorly-defined diffuse or non-centredprofiles may suggest that the prediction is not very good in which case this should be checked on the corresponding image(s)
It may be useful to expand the standard profiles to fill the window using Shift + click in the profiles window
Finally the lower left window plots Iσ(I) as a function of resolution for any selected image
iMosflm Tutorial
fileUsersandrewg4MOSFLMnewgui_tutorialiMosflm_tutorial_720_ver3html[29052015 105311]
Different parameters can be plotted by selecting the small right- or left-pointing arrows on the title line above the plot
95 Integrating the whole datasetAssuming that everything looks OK the entire dataset can now be integrated However it is strongly recommended thatProjectCrystalDataset names are assigned first These are written to the output MTZ file and used by downstream programs inparticular AIMLESS will use this information when deciding which images belong to the same dataset
Select Experiment settings from the Settings drop-down menu (see Drop down menus sect21) to enter these names and optionally givea title for the MTZ file
Select images 1-84 and click on Process
951 Parallel Integration Using multiple cores
An option is available on the pull-down menu (next to the Process button in the Integration task) which splits up the integration jobover available cores on the local machine All aspects are currently determined automatically at present user-configurable options willbe available in a later version The algorithm used is as follows
iMosflm determines the number of cores available on the local machineIf the number of cores (N) is greater than 2 iMosflm splits the integration run into N-1 batches (up to a maximum of 16) containingapproximately the same number of images If N le 2 iMosflm splits the run into N batches
If the total number of images in each batch is less than 32 the number of batches is decreased until this condition is satisfied
The first batch is submitted as a background task consisting of a refinement stage and an integration stage with its input and outputfiles (including the MTZ file) in a new directory its name being determined from the number of segments of data being integrated andthe lattice number (if the sample has been determined to contain multiple lattices) If the directories exist already they are all movedinto a newly-created directory with a time-stamped name the files from the most recent integration run are thus in directories withnames following the pattern described above Once the refinement stage is complete the refined parameters are written to a file
The launch of subsequent batches are delayed until the corresponding preceding batch has written its refined parameters This file isread and the new batch is launched again with a refinement stage and integration stage
At present the job cannot be aborted once it has started
952 Integrating as a background job
By selecting Batch in the drop-down menu adjacent to the Process button the integration can be run as a background job rather thaninteractively and the GUI can be used to look at a different dataset
Selecting Batch from the drop-down menu will display a new window showing the script that will be used to process the images alongwith a number of processing options The script can be edited if additional keywords are required or if some parameters are to bechanged and can also be copied and pasted into a file for off-line processing
By default the job is divided into batches across multiple cores as determined for the parallel integration described in sect951 but thenumber of cores can be chosen by the user from a drop-down menu in this case the size of each batch is determined by the interface
Plotting the results of the integration can be turned off this can make processing much faster
iMosflm Tutorial
fileUsersandrewg4MOSFLMnewgui_tutorialiMosflm_tutorial_720_ver3html[29052015 105311]
It is possible to configure job submission for remote machines (which can be added by depressing the add host button) Ensure youhave enabled passwordless logins for all the remote machines you enter and that you specify the full path to the Mosflm executable inthe Batch destinations window The remote working directory (in which the log and MTZ files are written) and the remote imagedirectory must both be specified with their full path names Any required parameter fields that are not completed by the user arehighlighted in orange if the user tries to submit a job without completing these fields a new window containing only those fields (againhighlighted in orange) pops up with a request to do so
The number of cores available on the selected host can be determined by depressing the apple core button on the Batch destinationsconfiguration window
The log file for batch submission jobs the MTZ and SUMMARY files are written to the directory in which iMosflm was launched
96 Checking the integration
iMosflm Tutorial
fileUsersandrewg4MOSFLMnewgui_tutorialiMosflm_tutorial_720_ver3html[29052015 105311]
The detector and crystal parameter plots should be examined carefully to check for any instability in the refinement If there are largeand random variations in some parameters (eg the detector twist and tilt) then it may be better to fix them and repeat the integration
For cases (eg very small unit cells) where there are very few suitable reflections on each image the refinement of the missetting anglesmay show significant variations from one image to the next In such cases it is best to apply smoothing to the missetting angles usingthe tick box in Settings -gt Processing options -gt Advanced Refinement
Discontinuities due to blank images should also show up and the offending images should be removed from the scaling run
If adjacent spots are incompletely resolved on the detector it may be possible to improve the processing by increasing the PROFILETOLERANCE parameters by 1-2 These parameters can be set in the Advanced integration tab of the Processing options menu (useSettings)
97 Advanced features for integration
The Settings -gt Processing options menu allows additional control over the integration Parameters such as the minimum spotseparation resolution limits excluded resolution ranges block size MTZ filename and BATCH ADD can be changed in the Processingtab
Manually decreasing the minimum spot separation can help if a large number of reflections are flagged as spatially overlapped (redboxes) The prediction must be updated to see the effect of changing the separation this can be done either by displaying the next orprevious image or double clicking on the blue circle next to the image currently displayed in the Images pane
In the Advanced integration tab the measurement box parameters profile tolerance and profile averaging parameters can be set
The measurement box parameters can be adjusted for rare cases where the estimation of the spot size has not worked correctlyresulting in a box that is too small or too large The optimisation of the background rim and corner cutoff parameters that determinewhich pixels are used for the background and which pixels for the peak can also be turned off but this is generally not recommended
Increasing the profile tolerance can help in cases where adjacent spots are not completely resolved this can be judged by examining thestandard profiles By default the profile tolerance is automatically increased if there are a large number of spatial overlaps as this hasthe effect of reducing the minimum spot separation A message will be written to the logfile if this has happened This option can beturned off using the tick box Optimise profile tolerance values to avoid spot overlap
The profile outlier exclusion parameters control the exclusion of ice spots or hot pixels which could otherwise corrupt the standardprofiles
Pixels with a value less than the Null pixel threshold are considered to belong to inactive regions of the detector
The pixel saturation value determines when a reflection is considered to be an overload The intensity of overloaded reflections isestimated by profile fitting but these reflections are rejected by the scaling program AIMLESS by default
Increasing the Maximum reflection width in φ from the default value of 5deg will reduce the number of rejected reflections (green boxes)and is worthwhile when the mosaicity is very high or the mosaic block size is very small As with the minimum spot separation theimage must be refreshed to see the effect of changing this parameter
The rejection criteria will reject reflections with too much variation in the background (BGRATIO) or where the gradient of thebackground plane is too large These should only be changed if many reflections are being rejected PKRATIO only applies to fullyrecorded reflections and reflects a very poor profile fit With current data collection protocols there will be very few (if any) fullyrecorded reflections
Additional MOSFLM parameters will be added based on user requests
98 Integrating multiple lattices
When multiple lattices have been successfully indexed each lattice can be integrated individually by selecting the appropriate latticenumber
Reflections in the chosen lattice that are overlapped by a reflection from another lattice will be integrated but the measurement box willbe expanded so that the total intensity of the two (or more) reflections is measured These reflections will be flagged for specialtreatment Reflections that are not overlapped are referred to as singletons They will be dealt with in the normal way by POINTLESSand AIMLESS
NOTE If more than one lattice has been indexed and the results of integrating just ONE of the lattices are to be checked byrunning QuickSymm or QuickScale then the multi-lattice icon in the Integration pane must be turned off otherwise an error
iMosflm Tutorial
fileUsersandrewg4MOSFLMnewgui_tutorialiMosflm_tutorial_720_ver3html[29052015 105311]
message will be given saying that all lattices must be integrated
It is often the case that by measuring both lattices (in separate integration runs) and inputting both MTZ files to QuickScale the overallcompleteness is high using ONLY the singletons To use this option ensure that the multi-lattice icon is off
To make use of the intensity estimates for overlapped reflections MTZ files for all lattices must be input to the program FECKLESSwhich will derive the best estimate of the summed intensity This is the default option if more than one lattice has been indexed and itrequires that all lattices have been integrated (in separate runs) prior to running QuickSymm or QuickScale (FECKLESS will be runautomatically)
At this time no downstream programs can make use of the summed intensities of overlapping reflections but in the future it should bepossible to use this data in REFMAC
Currently it is recommended to use only singletons from all the lattices FECKLESS is not required in this case
The MTZ filename is automatically updated to reflect which lattice has been chosen to avoid overwriting the MTZ file of the first latticewhen integrating the second one FECKLESS when run from iMosflm relies on this naming convention so do not change it
10 Running Pointless to check the symmetryOnce the images have been integrated (even a few degrees of data in many cases) the program POINTLESS can be run to determine thetrue Laue symmetry and try to determine the space group using the QuickSymm button
iMosflm Tutorial
fileUsersandrewg4MOSFLMnewgui_tutorialiMosflm_tutorial_720_ver3html[29052015 105311]
Select the QuickSymm button
A summary of the Pointless results as shown below will appear in a qtRView window
Various graphs (L test for twinning ViewHKL to view the reciprocal lattice) can also be viewed in this window
Various options for POINTLESS such as a reference MTZ file forcing the symmetry selected in iMosflm and specifying multiple input MTZfiles can be selected from the Settings -gt Processing options -gt Sort Scale and Merge tab (see below)
iMosflm Tutorial
fileUsersandrewg4MOSFLMnewgui_tutorialiMosflm_tutorial_720_ver3html[29052015 105311]
Caution The results can be ambiguous if run with a partial dataset Look in the logfile to see how many relfections are used totest each possible symmetry operator
11 Running Aimless to scale and merge the dataSelect the QuickScale button
This will first run POINTLESS then change the space group for the data to that selected by POINTLESS (unless the iMosflm symmetry isset to override POINTLESS) run AIMLESS to scale and merge the data in that space group and then run CTRUNCATE which calculates anumber of statistics from the intensity data The CCP4 UNIQUEIFY script will then be run which generates all the unique reflections forthat spacegroup to the resolution of the measured data and will flag reflections (5 by default but this can be changed) for use as theRfree set
AIMLESS can be run from the QuickScale button either treating anomalous data (the default) or ignoring anomalous data If onlyprocessing a few degrees of data it is usually better to ignore anomalous because especially for low symmetry cases no mergingstatistics may be given in AIMLESS
SCALA can be selected as an alternative to AIMLESS for scaling (not recommended)
There is limited control over running AIMLESS (see figure above) including re-setting resolution limits rejecting batches (images)changing the treatment for accepting partials changing the rejection criterion and changing the procedure for updating the standarddeviation estimates
iMosflm Tutorial
fileUsersandrewg4MOSFLMnewgui_tutorialiMosflm_tutorial_720_ver3html[29052015 105311]
The AIMLESS results will be displayed in the qtRView as shown below along with graphical output (see below) and the full log file canalso be examined
Aimless summary file
iMosflm Tutorial
fileUsersandrewg4MOSFLMnewgui_tutorialiMosflm_tutorial_720_ver3html[29052015 105311]
An example of the Aimless graphical output
The AIMLESS logfile can also be examined by selecting the Log File tab
12 History and mosflm log fileSelecting History allows the history of the session to be examined or by selecting the Log tab the full mosflmlp file can be viewed Themosflmlp file is also available in a time-stamped file mosflm_yyyymmdd_hhmmsslp (eg mosflm_20100518_131019lp) and can beread with a text editor
The History has a tree structure and will show when various parameters have been changed This has not been fully implemented and isnot generally useful
The logfile may provide useful clues when processing has failed
13 Warning MessagesAs already mentioned in Adding images sect3 and Integration sect9 warning messages are generated by MOSFLM during processing Atraffic light colour coding has now been assigned based on the warnings and is shown next to the Warnings box
A Red status implies a serious problem that will affect data quality and should be addressed
An Orange status implies minor issues that should be checked to see if things can be improved
A Green status means no significant problems messages are for information only
iMosflm Tutorial
fileUsersandrewg4MOSFLMnewgui_tutorialiMosflm_tutorial_720_ver3html[29052015 105311]
Abbreviated messages can be obtained by clicking on the Warnings icon The full warning Details together with Hints amp Notes text (ifany are available) can be obtained by double-clicking the relevant warning Details are displayed in a pop-up text box which willdisappear with the next click outside the box The same full details and suggestions are of course available in the mosflmlp files whereeven more information may be available
NOTE This is the end of the part of the tutorial which deals directly with iMosflm but see sect19 which has some suggestions forfurther work if you have time The remainder of this document deals with integrating and scaling data with MOSFLM andAimless via the CCP4i user interface examining the traditional mosflm SUMMARY file with the CCP4 utility loggraph
The Appendix contains a shell script for running MOSFLM as a traditional batch job
14 Useful command line optionsiMosflm has a number of command line options and these can be listed by typingimosflm --helpCurrent options are
--allimages -a ltfilenamegt Starts mosflm loading all files that match the template generated from ltfilenamegt--ccp4i2 Autosaves an iMosflm session file upon exit with an XML list of all iMosflm output files--debug -d Creates a large output file for debugging purposes Dont use this unless asked to by a developer--expert -e Permits access to advanced detector settings This should not normally be required--fastload -f Attempt to speed loading of many images offline while indexing two default images separated by 90 degrees--help -h Displays this message then exits--imagedir -I ltdirectorygt Starts the image browser in this directory if ltdirectorygt is given as an environment variable it will be expanded to its full value--init -i ltfilenamegt Starts Mosflm and reads from the given saved session file--startdir -S ltdirectorygt Starts mosflm in directory ltstartdirgt rather than the current directory This will only work if the directory exists and you have write permission to it otherwise iMosflm will exit All the normal mosflm output files will be in this directory--singleimage -s ltfilenamegt Starts mosflm loading only the image from ltfilenamegt--site -X ltfilenamegt Reads anyall of the following lines from the file given WAVELENGTH ltxgt DISPERSION ltxgt POLARISATION [PINHOLE | MIRRORS | MONOCHROMATOR | SYNCHROTRON ltxgt] DIVERGENCE ltxh xvgt BEAM ltbeamx beamygt DISTANCE ltxgt DISTORTION TILT ltxgt DISTORTION TWIST ltxgt GAIN ltxgt DETECTOR REVERSEPHI DETECTOR OMEGA ltxgt--version -v Displays the program version and required Mosflm version then exits
These can be abbreviated to the shortest unambiguous string
141 The site fileimosflm --site ltsitefilegt will read keywords from the file ltsitefilegt that will overwrite incorrect information in image headers Thissaves having to manually correct values in every iMosflm session The site file can also be read or written as an option from the Sessionmenu (see Drop down menus sect21) Allowed keywords areWAVELENGTH ltxgt
iMosflm Tutorial
fileUsersandrewg4MOSFLMnewgui_tutorialiMosflm_tutorial_720_ver3html[29052015 105311]
DISPERSION ltxgtPOLARISATION [PINHOLE | MIRRORS | MONO | SYNCHROTRON ltxgt]DIVERGENCE ltxh xvgtBEAM ltbeamx beamygtDISTANCE ltxgtDISTORTION TILT ltxgtDISTORTION TWIST ltxgtGAIN ltxgtDETECTOR REVERSEPHIDETECTOR OMEGA ltxgt
15 The mosflm SUMMARY fileMOSFLM produces a summary file listing refined parameters for each image and when using iMosflm this file will be date- amp time-stamped and have a name such as mosflm_20100518_131019sum This contains the same information as the plots produced by theiMOSFLM GUI which now also include the number of bad spots and overloads
This can be inspected graphically from the CCP4i GUI using the program loggraph Select the pull down menu View Files from Job andunder Output files select Additional log graphs where the _SUMMARYloggraph file will be listed Select this file to display its tablesin loggraph
This is very useful to identify rogue images (with unusually high positional residual or low Iσ(I)) If you find any read that image intoMOSFLM and see what is wrong with it
If you have done more than one integration run during your MOSFLM session you will find multiple entries of the tables Look at the lastset for integration of the 84 images
Click on the Refined detector parameter tables and check on the stability of parameters like the TILT and TWIST of the detector (unitsare hundredths of a degree) and for Mar Research (or DIP) image plate data the distortion parameters ROFF and TOFF (units are mm) Ifthey are varying a lot (more than 20 for TWISTTILT) or 015 for ROFFTOFF then it is probably a good idea to fix these parameters atthe average value (or the known values for this detector if they are available) (see Detector parameters sect821)
Click on the Post refinement table and check the missets It does not matter if they change slowly and by an amount (per image) that isless than 01mosaic spread If they are changing more than this then there could be a problem with processing the data (there is notmuch you can do about this)
Check how the mosaic spread is changing If it is unstable or if you think it is not refining to sensible values (as judged by looking atthe prediction) then you can fix the input value in the same way as the detector parameters (see Crystal parameters sect822)
BADSPOTS AND OVERLOADS
The program will set a rejection flag for those reflections that fail certain tests for example too much variation in the background levela poor profile fit an intensity that is very negative (more than 5 standard deviations) a very high gradient for the background planeThese reflections are called Bad spots and they are listed individually for each image in the mosflmlp file together with the reason forflagging them The number of bad spots is also written to the summary file Generally there should be very few (5-10) bad spots oneach image If there are more it could be because the backstop shadow is not correctly allowed for (consider using the NULLPIXkeyword)
There should also be very few overloaded reflections on each image If there are a lot then a separate low resolution data collectionpass should be made with a much shorter exposure time
IMPORTANT Both Bad spots and Overloads are written to the output MTZ file but will be rejected by default by AIMLESS Theintensity of overloaded reflections is estimated by profile fitting that part of the spot that is not saturated To include these reflections inthe final merged data use the ACCEPT keyword in AIMLESS
16 Scaling data with CCP4i ccp4i
Select Directories amp ProjectDir (top right)
In the new window select Add project
Enter the project name in the Project field and the full directory path in the uses directory field Default values may have been enteredalready here Select this project from Project for this session
Select Apply and Exit Dismiss the warning message that comes up
Select Data reduction from the pull down menu of modules (orange bar at top left)
iMosflm Tutorial
fileUsersandrewg4MOSFLMnewgui_tutorialiMosflm_tutorial_720_ver3html[29052015 105311]
Select Symmetry Scale Merge (Aimless)
In the window that appears do the following
Give a job title (top line)
Click on the box next to Separate anomalous pairs for outlier rejection amp merging statistics (the crystals have been soaked in a mercurycompound)
In the next orange bar (line starts HKLIN 1) select Browse and select the MTZ file output by MOSFLM (probably called hg_001mtz)Select OK
If you did not supply the Project name Crystal name or Dataset name to Mosflm fill in the boxes for these now
Under Scaling Protocol
From the pull-down menu on the line starting Scale select with automatic default settings
At the bottom of window from the pull-down menu named Run select RunampView Com File
This will display a new window showing the command file for running the POINTLESS step select Continue After a brief pause it willshow the command file for running AIMLESS (This can be edited before submitting the job) Select Continue
In the main window it will show that the AIMLESS job is running
When AIMLESS has finished the command file for running the CTRUNCATE step will appearselect Continue
When CTRUNCATE has run the main window will say FINISHED
At that point select the pull-down menu View Files from Job and select View Log Graphs This will give you the same graphs asrunning loggraph on the AIMLESS log file they are also the same as those that appeared in IMOSFLMs QuickScale task To look at thelog file itself (eg the overall merging statistics) select View Log File and it will appear in a new window
161 Looking at the AIMLESS output
The simplest way to look at the output from AIMLESS is to use loggraph on the AIMLESS log file (or via the CCP4i GUI) This can displaymany different graphs
Use Scales vs rotation range to check for smooth variation in the scale factor Check the variation in B factor with image and if there isno real variation it is best to turn off the B-factor refinement
Use the Analysis against all Batches for all runs to detect bad images (high R-factor large number of rejected spots)
Check the Analysis against resolution Fractional bias to see if there is any indication of Partial bias (A negative partial bias will resultif the mosaic spread is underestimated or if there is a lot of diffuse scatter
The Fractional bias should be less than 1-2 although it will often exceed this for weak data (eg in the high resolution bins)
The Axial reflections graphs in AIMLESS are useful for detecting systematic absences which can be used to identify the true spacegroup However the detection of screw axes is thought to be sufficiently robust in POINTLESS that these graphs are no longer necessary
It can also be useful to look at the AIMLESS log file itself in particular the table giving statistics as a function of resolution The effectiveresolution limit of the data can be estimated by looking at the Mn(I)sd column (this is the mean Iσ(I) AFTER merging symmetry matesand is the best indicator of data quality) This table also shows shell and cumulative R-factors
The Mn(I)sd values depend on having realistic values of the standard deviations (errors) in the intensities As the values that come fromMOSFLM are always underestimates of the true error these values are scaled up in AIMLESS using a three-term correction
sdcorrected = SdFac Sqrt[sd(I)2 + SdBLPI + (SdAddI)2]
Here SdFac is an overall scale factor and SdB and SdAdd are intensity dependent factors
AIMLESS will automatically work out a suitable value for all three parameters in order to make the mean value of (observedscatter)(sdestimate) equal to 10 where observed scatter is the difference between an individual estimate of intensity and the mean ofall other estimates (from symmetry mates)
Probably the best estimate of the true high resolution limit of the data can be obtained from the CC(12) values these are thecorrelations between equivalent observations that have been divided randomly into two half-datasets The resolution limit is foundwhen the CC drops below ~ 05 - 03
This table comes under the heading
ANALYSIS OF STANDARD DEVIATIONS
iMosflm Tutorial
fileUsersandrewg4MOSFLMnewgui_tutorialiMosflm_tutorial_720_ver3html[29052015 105311]
in the AIMLESS log file and Run n standard deviation v Intensity test (where n is 1 or more) in the CCP4i GUI View Files from Job -View Log Graphs display
Can you identify a bad image in this dataset Can you work out why it is bad
(Cluethe image headers contain quite a lot of information that is not used by MOSFLM including the date and time that the image wascollected)
You can exclude a given batch from the scaling using the EXCLUDE keyword
RUN ALL EXCLUDE imagenumber
In this case run number will be 1
Rerun the scaling SENDING THE OUTPUT TO A NEW LOGFILE excluding this image and see the effect on the heights in the anomalousPatterson (in the log file) DO NOT repeat the integration In the command file uncomment the line (near the top) goto aimless so itskips the integration part
In the CCP4i GUI click to highlight the AIMLESS job which is listed as FINISHED and select ldquoReRun Jobrdquo from the control buttons downthe right-hand side of the main interface window Under ldquoExcluded Datardquo in the window that appears check the box next to Excludeselected batches and pull-down on the menu button to exclude a range Give the start amp end range to exclude (eg 74 to 74) Rerunthe job as before
17 Changing the symmetryFrom the list of options at the left hand side of the main window select ldquoUtilitiesrdquo and under that SortModifyCombine MTZ Files
In the new window give a new title eg reindex as H32
Click on the Box Change space group andor reindex reflections
Use the browse option to select the input MTZ file (First orange bar) the output filename will be generated automatically (but you canchange it)
Under Reindex details
In the last option check the box next to ldquoChange space group tordquo and enter H32 in the box This is above the final item Reducereflections to the asymmetric unit which is checked by default
Select Run from the Run option button
Then go back to the scaling window and select the new MTZ file (reindexed) as the input for scaling (use Browse) CHANGE THE JOBTITLE
Then select RUN
The scaling will now be performed in space group H32 Look at the merging statistics in the log file in particular the multiplicityweighted R-factor called Rmeas in the log file
18 Looking at the CTRUNCATE outputThe CTRUNCATE program converts intensities to amplitudes and also compiles some useful statistics The LTEST and the cumulativeintensity statistics tabulated by CTRUNCATE (and plotted by loggraph) provide the only point at which you will be able to detectmerohedral twinning (when the two lattices of the twin components exactly overlap and every measured intensity is actually the sum oftwo intensities)
For a good dataset the observed distribution should be within 1 of the theoretical distribution Is this the case for this data
19 If you have time 191 Different mosaic spreads
Try repeating the processing with the mosaic spread set to a value 25 smaller than the refined one and fix it by checking the Fix boxin the Integration window in iMosflm
Can you tell from the merging statistics if this data is better
192 Checking up on outliers
iMosflm Tutorial
fileUsersandrewg4MOSFLMnewgui_tutorialiMosflm_tutorial_720_ver3html[29052015 105311]
AIMLESS writes a file called ROGUES which lists reflections which show very poor agreement between symmetry mates or which areimplausibly large
Look in this file (it is ASCII) and try to work out why this has happened The ROGUES file gives you the image (Batch) on which thereflections have been recorded (for partials this is the image nearest the centre of the reflection so you may need to look on thepreceding and following image as well) Select a reflection which shows very poor agreement with its symmetry mates (A value greaterthan 10 in the DelIsd column in the ROGUES file)
Select the offending image by double-clicking it in the Images pane of the iMosflm main window Predict the reflections then enter thehkl values into the boxes and hit Return (or click the red warning button following the entry box for l) to locate the offending reflectionin the image You must give the measured indices - the first set of values in the ROGUES file - when doing this See if there is anythingodd about the spot Remember to check adjacent images for partials
193 How accurate does the unit cell have to be
Try changing the cell parameters by (say) 10 and integrate the images again What is the effect on the merging statistics
20 Tips1 When reading images into a session DO NOT attempt to carry out any other task until ALL the images have been read2 It is often worth repeating the indexing (usually only once) as the refined direct beam coordinates from the first indexing may give
an improved solution when the indexing is repeated (lower rmsd)3 Always integrate a few degrees of data before integrating the whole dataset (see sect9) If the space group is not known in advance
run Quicksymm with a few degrees of data to check that the correct indexing solution has been chosen4 For difficult images do not attempt to refine the unit cell initially once an indexing solution has been obtained try integrating a
few images to ensure that the integration is stable If then going on to refine the cell check that the prediction looks OK for thefirst image of every segment included in the refinement If it does not look very good consider using the pattern matching(Settings -gt Processing options -gt Advanced refinement see sect84)
5 If the resolution of the data is less than 35 Aring do not use the ldquoRefine Cellrdquo task Instead use several images in indexing and use thecell that comes from the indexing
6 If iMosflm gets into a state where the activity icon(upper right) is spinning but nothing seems to be happening click on the activityicon to stop it spinning and see if the session can be continued DO NOT click on the activity icon simply to abort a task this willgive unpredictable results Use the Abort button for cell refinement or integration There is no defined way to abort indexing
7 Use the image summation option (see sect4) to get a better impression of the diffraction for very low exposure Pilatus images8 Use image summation for detector parameter refinement for fine sliced very weak Pilatus images (Settings -gt Processing options -
gt Advanced refinement see sect821)9 For large mosaic spread values (gt 10deg) or small mosaic block sizes (lt10) consider increasing the maximum allowed reflection
width to avoid having too many green predicted reflections (Settings -gt Processing options -gt Advanced integration see sect97)10 By default on selecting the Indexing task iMosflm will find spots index and (assuming a solution has been found) estimate the
mosaicity For difficult cases it is more useful to restrict this to simply finding spots and then do the indexing and mosaicityestimation by clicking the appropriate buttons To do this change the check box Automatically index after spot finding inSettings -gt Processing options -gt Indexing
11 See sect521 and sect522 for advice if the indexing fails Also consider the possibility of a reversed phi rotation direction if you arenot familiar with the beamline (Settings -gt Experiment settings -gt Experiment see sect21)
12 If the detector parameters have refined to physically unreasonable values (eg because cell refinement or integration has beencarried out using an incorrect indexing solution) be sure to reset the detector parameters before attempting further processing(Settings -gt Experiment settings -gt Detector see sect21)
13 Always set the resolution limit slightly beyond the point at which any spots are visible (see sect414 ) For very weak fine-sliceddata it can be very difficult to estimate the resolution visually so integrate to the maximum resolution (inscribed circle) and usethe merging results to set the final resolution There should be no problems integrating to a resolution ~03-05 Aring beyond theactual resolution limit but for example integrating to 3 Aring when the true resolution limit is 5-6 Aring may cause problems and theintegration should then be repeated with a more realistic resolution limit
14 Use the site file sect141 if repeatedly processing data where the direct beam position is wrong or if the phi direction is reversed etcto save having to correct this for every session
Appendix IA command script for running MOSFLM using the keywords copied from the Batch processing window of the new GUI (see Integratingas a background job sect952) Note that keyworded input for MOSFLM and other CCP4 programs is case-insensitive apart from file anddirectory names
bincsh -fv Set a unique identifier for filenames for this job
set ident = x89_mos07_blk3_smallsep
iMosflm Tutorial
fileUsersandrewg4MOSFLMnewgui_tutorialiMosflm_tutorial_720_ver3html[29052015 105311]
$ipmosflm COORDS $identcoords SUMMARY $identsummary ltlt eof-ip Insert keywords copied from iMosflm batch window here
Keywords for this run For example could involve trying different values for mosaic spread or not integrating all images etc etchklout $identmtzgenfile $identgenprocess 1 1000 goeof-ip
pointlesspointless hklin $identmtz hklout $ident_pointlessmtz
aimlessaimless hklin $ident_pointlessmtz hklout $ident_aimless_partmtz ROGUES $identrogues ltlt eof-aimless Use all default options for aimlesseof-aimless
ctruncate hklin $ident_aimlessmtz hklout $ident_truncatemtz
Harry Powell Andrew Leslie and Owen Johnson
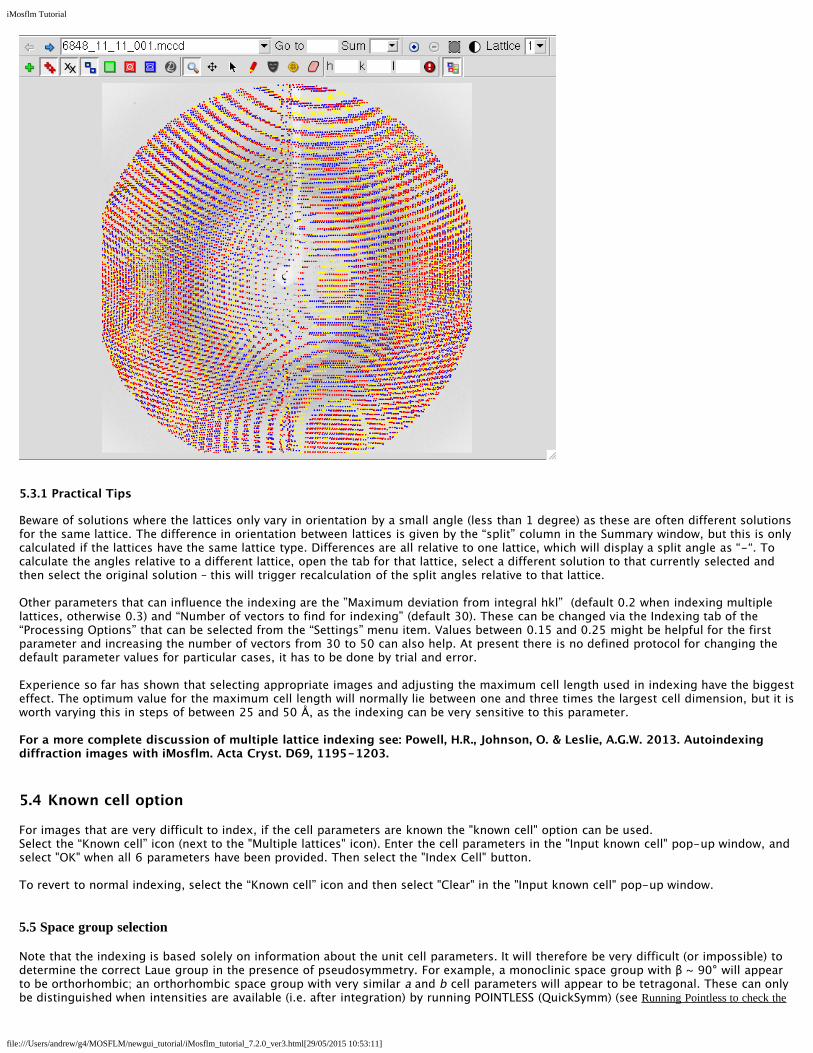
iMosflm Tutorial
fileUsersandrewg4MOSFLMnewgui_tutorialiMosflm_tutorial_720_ver3html[29052015 105311]
531 Practical Tips
Beware of solutions where the lattices only vary in orientation by a small angle (less than 1 degree) as these are often different solutionsfor the same lattice The difference in orientation between lattices is given by the ldquosplitrdquo column in the Summary window but this is onlycalculated if the lattices have the same lattice type Differences are all relative to one lattice which will display a split angle as ldquo-ldquo Tocalculate the angles relative to a different lattice open the tab for that lattice select a different solution to that currently selected andthen select the original solution ndash this will trigger recalculation of the split angles relative to that lattice
Other parameters that can influence the indexing are the rdquoMaximum deviation from integral hklrdquo (default 02 when indexing multiplelattices otherwise 03) and ldquoNumber of vectors to find for indexingrdquo (default 30) These can be changed via the Indexing tab of theldquoProcessing Optionsrdquo that can be selected from the ldquoSettingsrdquo menu item Values between 015 and 025 might be helpful for the firstparameter and increasing the number of vectors from 30 to 50 can also help At present there is no defined protocol for changing thedefault parameter values for particular cases it has to be done by trial and error
Experience so far has shown that selecting appropriate images and adjusting the maximum cell length used in indexing have the biggesteffect The optimum value for the maximum cell length will normally lie between one and three times the largest cell dimension but it isworth varying this in steps of between 25 and 50 Aring as the indexing can be very sensitive to this parameter
For a more complete discussion of multiple lattice indexing see Powell HR Johnson O amp Leslie AGW 2013 Autoindexingdiffraction images with iMosflm Acta Cryst D69 1195-1203
54 Known cell option
For images that are very difficult to index if the cell parameters are known the known cell option can be usedSelect the ldquoKnown cellrdquo icon (next to the Multiple lattices icon) Enter the cell parameters in the Input known cell pop-up window andselect OK when all 6 parameters have been provided Then select the Index Cell button
To revert to normal indexing select the ldquoKnown cellrdquo icon and then select Clear in the Input known cell pop-up window
55 Space group selection
Note that the indexing is based solely on information about the unit cell parameters It will therefore be very difficult (or impossible) todetermine the correct Laue group in the presence of pseudosymmetry For example a monoclinic space group with β ~ 90deg will appearto be orthorhombic an orthorhombic space group with very similar a and b cell parameters will appear to be tetragonal These can onlybe distinguished when intensities are available (ie after integration) by running POINTLESS (QuickSymm) (see Running Pointless to check the
iMosflm Tutorial
fileUsersandrewg4MOSFLMnewgui_tutorialiMosflm_tutorial_720_ver3html[29052015 105311]
symmetry sect10)
In addition it is not possible to distinguish between Laue Groups 4m and 4mmm 3 and 3m 6m and 6mmm m3 and m3m Thiswill not affect integration of the images but it will affect the strategy calculation In the absence of additional information the lowersymmetry should be chosen for the strategy calculation to ensure that a complete dataset is collected
The presence of screw axes also cannot be detected so there is no basis on which to distinguish P21 from P2 etc This does not affectany aspect of data collection or processing and can be chosen (on the basis of systematic absences) after integration by runningPOINTLESS
In this example there is no way of knowing at this stage if the space group is h3 or h32 so leave it as h3
56 Mosaicity estimation
If the Automatically index after spot finding option has been chosen (Indexingtab of Processing Options) the mosaicity (mosaic spread) will be estimatedautomatically for the preferred solution However if another solution is chosenthe mosaicity should be estimated again
Click on the Estimate button to estimate the mosaicity
A window will appear which plots the total predicted intensity as a function ofmosaic spread from which an estimate is determined
The predictions displayed on the image will be updated Entering different valuesof mosaic spread in the box (followed by return) will allow a visual estimate of theeffect of changing the mosaic spread
The mosaic spread can also be entered in the Images pane by clicking once on theMosaicity line and once again on the value displayed
561 The mosaic block size
In some cases the apparent mosaic spread is much larger at low resolution than at high resolution so that if it is set to a value thatresults in all the low resolution spots being predicted many more spots are predicted than are visible at high resolution This effect isbest dealt with by adjusting the Mosaic block size which is also displayed in the Images pane This is modelling the size in microns ofthe individual mosaic blocks in the crystal Decreasing this to values of 05-5 microns (say) from the default of 100 microns will resultin predicting more spots at low resolution but have virtually no effect at high resolution This parameter is not refined (at present) andso the best value must be determined by trial and error
6 Saving and recovering a sessionThe session can be saved at any time using the Session drop-down menu referred to in sect21 The first time that a session is saved youwill be prompted for a filename The filename convention for saved session files is that the extension is mos
Save the current session Then exit from iMosflm (using the Session drop-down menu) restart iMosflm and read in the saved session
If the program crashes it should be possible to recover all but the latest actions as a temporary copy of the session file is continuallysaved to the directory mosflm in the users home directory
Restart iMosflm and it will pop up a Recover session window
Selecting the Recover button will restore the session as far as possible
iMosflm Tutorial
fileUsersandrewg4MOSFLMnewgui_tutorialiMosflm_tutorial_720_ver3html[29052015 105311]
7 Data collection strategyOnce the crystal orientation and (probable) Laue group have been determined it is possible to calculate a data collection strategy andthe Strategy icon is no longer greyed-out (in fact all other operations Strategy Cell Refinement and Integration become possible at thispoint)
Select the Strategy icon This will open the Strategy window
The statistics initially presented in the window are based on the images read in to the current session If only two (or more) references
iMosflm Tutorial
fileUsersandrewg4MOSFLMnewgui_tutorialiMosflm_tutorial_720_ver3html[29052015 105311]
images have been read in no statistics will be presented
When the Strategy option is used after two initial images (typically 90deg apart in φ) have been collected a complete shaded segment willnot be shown in the lower part of the screen rather an empty circle will be shown with the matrix label beneath it Click the Auto-complete button and in the pop-up menu that appears select a rotation angle or sweep of data to collect - or leave the Rotationsetting as Auto for a calculation of maximum completeness for this crystal orientation Click on Ok and the completeness results willbe presented
The orientation of the crystal expressed as the angles between the abc unit cell axes and the XYZ coordinate frame is given X isalong the X-ray beam Z is the rotation axis A warning will be given if the unique axis is so close to the rotation axis that there will bemissing cusp data
71 Evaluating completeness manually
The completeness of any given segment of data can be determined manually using the circle at the bottom left of the window Click onthe red segment shown in this circle
This will result in small black boxes being drawn on the circumference at the start and end of the red sector
Use the LMB to click on the black box at 0 and drag this around the circle
When the LMB is released the statistics for that sector will be displayed The statistics are presented in two ways Near the top right ofthe window the overall completeness is shown as red circles for unique data and anomalous pairs The average multiplicity is givenbeneath these circles
More detailed statistics (such as completeness as a function of resolution) are given in a series of histograms that can be selected by adrop-down menu
72 Calculating a strategy automatically
Uncheck the Use checkbox at the right side of the hg_001 line listed in the sector list near the top of the Strategy pane This means
iMosflm Tutorial
fileUsersandrewg4MOSFLMnewgui_tutorialiMosflm_tutorial_720_ver3html[29052015 105311]
that the 84 images used thus far will not be included in the completeness calculation only the matrix derived from indexing them willbe used Select the Auto-complete button to calculate a strategy automatically
A strategy calculation data pop-up window will appear
If multiple matrices have been defined (for different sectors of data) then the appropriate one can be selected (if there is only one sectorthis has no effect)
The total φ rotation to be used is normally calculated by MOSFLM based on the Laue group and the crystal orientation (the Auto setting)However it is sometimes possible to achieve a high completeness with a significantly smaller total rotation (eg 60deg in two 30degsegments will typically give gt94 completeness for orthorhombic space groups) and this can sometimes be useful if radiation damage isa serious problem although when using hybrid pixel detectors it is better to use a very conservative exposure time and collect a wide φrotation
Total rotation angles of between 5deg and 90deg can be selected from the drop-down list The number of segments to be used can be setbetween 1 and 3
If the check box is checked data completeness will be calculated to optimize the proportion of anomalous data collected
THIS IS IMPORTANT The optimum strategy is often different when maximising completeness of the anomalous data
Choose the default values (Rotation Auto Segments 1) but check the anomalous data box then click on Ok Look at the variousstatistics presented as bar charts
In space group H3 if rotating around the c axis a total rotation of 120deg would be required to collect a complete dataset (ignoring anydata lost in the cusp) Because the c axis is 22deg away from the rotation axis in this case it is possible to collect very high completeness(for unique data) with a rotation much smaller than this
Try to find the minimum total rotation that will give a dataset that is gt95 complete for the unique data Now do the same butrequiring gt95 completeness for the anomalous data
SKIP OVER SECTION 73 IF DOING THE NORMAL TUTORIAL
73 Calculating a strategy using multiple crystals
The Strategy pane may also be used when due to radiation damage many crystals are required to collect a complete dataset
IMPORTANT This procedure will only work correctly for space groups where there is no indexing ambiguity For those spacegroups where there is an indexing ambiguity( see httpwwwccp4acukdisthtmlreindexinghtml for a complete list) it isnecessary to integrate images to determine whether different crystals have been indexed in the same way This is not achievablewithin the Strategy option at present
Suppose the first crystal has been indexed from the reference images
Enter the Strategy pane an empty circle is displayed in the bottom part of the screen and click on the Auto-complete button nearthe top-right of the pane In the Auto-complete window that appears choose a suitable Rotation angle for the amount of datathat can be collected from one crystal say 20 degrees for this example Leave Segments set to 1 and do not check Optimize foranomalous data
Click the Ok button and the completeness of the data will be displayed The matrix name start and end phi values and the phiextent will be displayed in the top area of the pane with a checkbox ticked under the Use column This means this segment will beused in further strategy calculations
Accept and save this result by clicking on the yellow hatched segment displayed in the large circle near the bottom of the paneClick once and the segment will be outlined in black (you can adjust the start or end phi value calculated in one degree incrementsby click+dragging the respective black square) click again this time on the black square denoting the start or end phi (or release ifyou have adjusted by click+dragging) and the segment will turn red The segment will not be saved unless it has turned red
This result will be saved if you leave this pane (eg to load more images) and return later in this session The strategy file can alsobe saved to a permanent file using the Save button on the tool-bar This is highly recommended when working with many crystals
Return to the Strategy pane when you have loaded and indexed the reference image(s) from the second crystal and repeat the procedureabove You will see the calculated segment from the first matrix displayed at the bottom-left of the screen The optimum phi range for
iMosflm Tutorial
fileUsersandrewg4MOSFLMnewgui_tutorialiMosflm_tutorial_720_ver3html[29052015 105311]
the second crystal will be displayed Save this in the same way as for the first crystal (clicking twice) Repeat this procedure for anysubsequent crystals and in each case the optimum phi range will be calculated for the latest crystal taking into account the data fromprevious crystals
It is a good idea to save the strategy to a file as each new crystal is added in case the program crashes and this information is lost
In practice it is probably safest to have a separate iMosflm session that is reserved for the strategy calculations and not used to processany data The strategy for each new crystal can be calculated as described above If there is a problem and the session is corrupted or ifiMosflm is closed down for any reason it is straightforward to restore the status of the session providing the strategy has been savedThe following steps should be taken
1 Read in the reference images for the latest crystal and index them
2 Select the Strategy pane
3 Read in the optimised strategy for all previous crystals using the ldquoAddrdquo button and giving the appropriate filename
4 Making sure that the circle for the latest crystal is highlighted in the lower left window click on lsquoAuto-completersquo and follow the stepsdescribed above
Advanced Usage
The startend phi values for each crystalmatrix can be updated This might be required if for example only 10 degrees of useful datawere collected from a particular crystal instead of the anticipated 20 degrees To change the phi values click either on the matrix namein the top pane or on the circle showing the segment of data in the lower left pane (these are highlighted in a blue box as the mousemoves over them) The corresponding segment will now be displayed in the larger circle Click on the red segment so that a blacksquare appears at the startend phi values Then simply drag the appropriate phi to the desired value The completeness willautomatically be updated (but the strategy calculation for the latest crystal will not be repeated to do this the current segment must bedeleted by highlighting the matrix name and using right click and then repeating the Auto-complete step)
If matrix files saved from iMosflm are available from crystals for which data have been collected in previous sessions these can beadded into the calculation using the Add matrix button on the tool-bar
If the saved strategy result has become complicated or is incorrect and you wish to restart the calculations afresh there is a tool-barbutton Reload sectors from session This will remove any calculated sectors while leaving any known matrices listed at the bottom-leftof the Strategy pane
If you have saved a strategy file from a previous session this can be used to re-initialize the Strategy pane using the Load button onthe tool-bar
A Spacegroup pull-down menu has been added to the tool-bar to permit different choices of space group to be used in thecalculations (eg H3 and H32) This menu is populated from the list offered on the Indexing pane However the space group symboltext is editable Any space group symbol entered will be validated by Mosflm together with the current cell parameters
As a calculator for a multi-segment strategy the Strategy pane is reasonably flexible you can Save or Delete highlighted matrix lines byright-clicking As you highlight different matrix lines the orientation of the crystal expressed as the angles between the abc unit cellaxes and the XYZ coordinate frame is re-displayed in the centre of the pane
The following screen shot shows the cumulative results in the Strategy pane after this procedure has been followed for four crystals(ignore the iMosflm version number)
iMosflm Tutorial
fileUsersandrewg4MOSFLMnewgui_tutorialiMosflm_tutorial_720_ver3html[29052015 105311]
731 Calculating a strategy when some data have already been collected and processed
This option is not yet implemented If data have already been processed (to give an MTZ file) but the images are not currently available (eg they were collected on a previoussynchrotron trip possibly at a different synchrotron) then the MTZ file containing this data can be read and used to calculate a strategyfor data collection from new crystalsThe MTZ icon in the tool bar is used to read the MTZ file
74 Calculating a suitable oscillation angle
To calculate the maximum possible oscillation angle while avoiding spatial overlaps click on the Check for overlaps button A pop-upwindow will appear from which the option to calculate the maximum oscillation angle (as a function of φ) or check how many overlapswill occur for different (user selected) oscillation angles The results are plotted in the same pane as the histograms for the strategycalculations Note that the overlap calculation is based on the current values for the mosaic spread and spot separation and can be verysensitive to these values Note also that these are maximum and not necessarily recommended oscillation angles
iMosflm Tutorial
fileUsersandrewg4MOSFLMnewgui_tutorialiMosflm_tutorial_720_ver3html[29052015 105311]
8 Cell refinementIt is important to determine the cell parameters accurately before integrating the images Although the unit cell is refined as part of theautoindexing providing the diffraction extends beyond ~35Å resolution it is possible to obtain more accurate cell parameters using aprocedure known as post-refinement This procedure requires the integration of a series of images in ideally two or more separatesegments at widely different φ values The distribution of the intensity of partially recorded reflections over the images on which theyoccur is used to refine the unit cell crystal orientation and mosaic spread
Select the Cell Refinement icon
81 Selecting the images
iMosflm Tutorial
fileUsersandrewg4MOSFLMnewgui_tutorialiMosflm_tutorial_720_ver3html[29052015 105311]
There are several ways to select the images to be used in cell refinement Whichever method is used the image numbers will bedisplayed in the Images entry field iMosflm will automatically select appropriate images but these can be changed
811 Manual selection
A list of images can simply be typed into this box An image series can be specified as n-m where n and m are the first and last imagesDifferent series must be separated by white space or comma
For orthorhombic or higher symmetries two segments should be given approximately 90deg apart in φ For monoclinic or triclinic datathree or four segments are best (eg φ = 04590135)
The number of images that should be included in each segment depends on the mosaic spread and oscillation angle A reasonablenumber is 2(mosaic spreadoscillation angle +1) MOSFLM will automatically select two or more segments as appropriate Note thatthere is a limit on the total number of images that can be used
812 Automatic selection
Selecting the Automatically select images icon will select a suitable set of images
813 Graphical selection (Not recommended)
Selecting this icon will give a new window
Images can be selected by clicking in the Use check-box in the list of images or by using the mouse to drag a selection of imagesfrom the sector displayed The other icons allow the sector to be zoomed in or out and the viewed area to be moved to make theselection easier The final two icons on the tool-bar switch the segment display to fit the display space as either a full circle or aquadrant This Image palette can be closed by clicking outside its area but will close after 60 seconds anyway
82 Integrating the images and refining the cell
Use one of the methods above to select images to use in cell refinement and click on the Process button Before starting cell refinementcheck that the prediction for the first image in each segment to be used is good The majority of the spot positions must be correctlypredicted for the first image in each segment or else the refinement will not work
The selected images will be integrated and following integration the cell parameters are refined Selectable refined detector parameters
iMosflm Tutorial
fileUsersandrewg4MOSFLMnewgui_tutorialiMosflm_tutorial_720_ver3html[29052015 105311]
will be plotted as will the changes in crystal orientation and (if selected) mosaic spread If the shift in cell parameters is greater than 25standard deviations another cycle of integration and cell refinement is carried out Typically two or three cycles are required forconvergence Note that the current program activity is shown in the bottom left-hand corner of the window in the status message area
The different windows are explained below Moving the mouse over any parameter or plotted graph point will give a full description ofit
821 The detector parameters window
The values of the refined detector parameters are displayed for each image as it is integratedThere is the option to fix any of the parameters during integration by checking the Fix box onthe right The positional residuals (overall central and weighted) are also listed
Any of these parameters can be selected for plotting on the graph that appears to the right ofthis box by simply clicking on that parameter (which is then highlighted in blue as shown herefor Beam x and Beam y)
Check the stability of the refined parameters by displaying the appropriate graphs To getsensible scaling of the graphs only parameters with similar numerical values should be plottedtogether
For weak images (ie few visible spots in the outer regions of the image) the tilt and twistmay not be well defined and might refine to large values (greater than one degree) Insuch cases these parameters should be fixed It is not generally recommended to fix any
iMosflm Tutorial
fileUsersandrewg4MOSFLMnewgui_tutorialiMosflm_tutorial_720_ver3html[29052015 105311]
other detector parameters
For very weak fine sliced images (Pilatus only) there is the option to sum images when findingsuitable spots for refinement see Settings -gt Processing Options -gt Advanced refinementwhich can in some cases make the refinement more stable
822 The crystal parameters window
The values of the refined crystal missetting angles φ(x) φ(y) φ(z) the unit cell parameters andmosaic spread for the current image are displayed in the table Selected parameters will beplotted as for the detector parameters Specific unit cell parameters can also be fixed
If more than one segment of data is being used for cell refinement it is not unusual to see achange in orientation of the crystal between the two segments
Observe how the crystal orientation is different for images in the two segments See how themosaic spread varies during refinement
823 The central spot profile
The average spot profile for the central region of the detector is plotted for eachimage This confirms that the spot prediction is good If the profile is not welldefined and central in the box or if the blue border for the peak region of the spot ismuch larger than the apparent spots size it suggests a problem with the integrationand the initial prediction should be checked In some cases it may be necessary toincrease or decrease the Profile Tolerance parameters to ensure that the blue boxfits the spot To do this select the Advanced integration tab of Processing optionsCheck the central spot profiles for the images used in the cell refinement
824 The summary window
This window presents a summary of how selected parameters have changed indifferent cycles of the cell refinement The behaviour of these parameters gives agood indication of whether the cell refinement has been successful
If the refinement has been successful the RMS residual should be lower for thefinal cycle than in previous cycles However errors in the cell can be compensatedquite well by changing the crystal to detector distance so the differences are notalways dramatic
The other parameters that can be plotted from the pull-down list are the detectordistance and the Pixel ratio (Yscale)
The detector distance should be the same for all images in the refinement If the original indexing was based on auto-indexing a singleimage (say the first) then the detector distance might change for images from the second segment to compensate for an error in theoriginal cell If the variation in distance for different images increases with the cycle number this indicates that the refinement is notstable
The Pixel ratio (Yscale) parameter may also show an initial variation for images in different segments because refining Yscale (whichshould be 10000 for all except Raxis II and Raxis HTC detectors) can compensate for errors in cell dimensions in the same way that thedistance can The final values (last cycle) should be very close to identical for all images and should also be very close to unity (to within00010)
Cell refinement can be unstable if the data do not extend to at least 35 Aring If it appears unstable use the cell derived from auto-indexing a series of images well spaced in φ instead
iMosflm Tutorial
fileUsersandrewg4MOSFLMnewgui_tutorialiMosflm_tutorial_720_ver3html[29052015 105311]
Examine the plots to see if the parameters are stable and correct (Yscale)
825 The final results
When refinement has converged (or after 5 cycles) the initial and final cell parameters and the estimated errors (std dev) are listed
If time is available make a note of the std dev values and repeat the cell refinement using a larger number of images in each segmentAre the standard deviations smaller when using more images
83 Refining cell parameters for multiple lattices
Providing the resolution is high enough (generally better than ~35-32 Aring) and not too many of the spots in the different lattices areoverlapped it is possible to refine the cell parameters for each lattice individually The lattice to be refined is selected from the Latticeselector
This selector will be grayed out when processing a single lattice
84 If the prediction for the first image of a segment is poor
In some cases depending on how the indexing has been carried out or if the diffraction is poor or there has been a large change incrystal orientation during the data collection the prediction for one or more of the segments (the first image) may be poor In suchcases the integration and hence the cell refinement may fail It may be possible to successfully process the images after an initialrefinement of the crystal orientation using a pattern matching algorithm To select this option got to the Advanced refinement tab ofProcessing options and select the tick box for Refine orientation of first image in any run by pattern matching and for Integrate allimages Then refine the cell in the usual way During integration the orientation will be refined for the first image of each segmentoutput for this additional refinement will be written to the logfile but is not shown in the GUI
9 IntegrationThe accurate cell parameters are now used in the integration Note that although the images are integrated during the cell refinementthe intensities are not saved and no MTZ file is generated at that stage
It is good practice to start by integrating a block of images corresponding to a few degrees of data to check that the parameters do notneed further adjustment MOSFLM will generate warning messages after integration if there are any difficulties and it may be possibleto improve the situation by changing some of the default parameters (see Warning messages sect13)
Before integration ensure that the backstop shadow has been defined (see Masked areas backstop sect411 and Masked areas generalsect412)
91 Image selection
Image selection is performed in exactly the same way as in the cell refinement In this case the Automatic selection will simply includeall images in the current sector
Select images 1-10
92 Setting the MTZ filename and controlling updating of the image display
Two icons appear when the integration option is chosen
If the Show predictions icon is clicked the display window will be updated as eachimage is processed This will slow down the processing but allows the accuracy of theprediction to be checked for each image
iMosflm Tutorial
fileUsersandrewg4MOSFLMnewgui_tutorialiMosflm_tutorial_720_ver3html[29052015 105311]
Click on this icon so that the display will be updatedThe filename of the MTZ file containing the results of the integration is generatedautomatically but can be edited manually
93 Integrating the images
Click on the Process button to start integration
Integration of the images occurs in two passes In the first pass for each block of images (a number corresponding to a few degrees ofdata selected automatically by MOSFLM) the detector and crystal parameters are refined for each image in turn and the measurementboxes for all predicted spots are written to a file for use in the second pass In the second pass the standard profiles are formed fromreflections present on all of the images in this block and each image is then integrated and the results written to the MTZ file Thedisplay is not updated during the second pass and will remain on the last image of the block (assuming image updating has beenselected)
Note that the unit cell dimensions are normally fixed during integration and only the crystal orientation and mosaic spread are refinedCrystal parameter refinement only starts when a sufficient number of images have been integrated to provide data for the post-refinement typically after ~05-1 degree (more for high mosaicity)
94 Parameter display windows
As described in sect82 the refined detector and crystal parameters will be displayed in tables and selected parameters will be plotted ingraphs The average spot profile for each image will also be displayed
The size of these graphs (and the profile) can be expanded to fill the whole window by holding down Shift and clicking LMB anywherein the graph window A second Shift+click will revert the graph to the original size
In addition to these windows there are windows that tabulate and plot (as a function of image number) the mean Iσ(I) for profile fittedand summation integration intensities The overall values and the values for the highest resolution bin are given
The number of overloaded reflections Bad spots (ie those that fail certain tests see mosflm SUMMARY file sect15) Spatial overlaps andif processing multi-lattice images the number of lattice overlaps is listed for each image and can be plotted by highlighting thatparameter When processing data from crystals with large unit cells it is important to watch out for spatial overlaps (see sect97 for tips onhow to reduce the number of spatial overlaps if this is a problem)
A display of the standard profiles for different regions of the detector is also provided Poor profiles are averaged by includingreflections from inner regions of the detector Averaged profiles are indicated by a red line around the spot (rather than blue) Theoriginal unaveraged profile can be viewed a clicking on the profile (providing there were sufficient spots in that region to allowformation of a profile)
The profiles should be checked to see that they are well defined and centred within the box Poorly-defined diffuse or non-centredprofiles may suggest that the prediction is not very good in which case this should be checked on the corresponding image(s)
It may be useful to expand the standard profiles to fill the window using Shift + click in the profiles window
Finally the lower left window plots Iσ(I) as a function of resolution for any selected image
iMosflm Tutorial
fileUsersandrewg4MOSFLMnewgui_tutorialiMosflm_tutorial_720_ver3html[29052015 105311]
Different parameters can be plotted by selecting the small right- or left-pointing arrows on the title line above the plot
95 Integrating the whole datasetAssuming that everything looks OK the entire dataset can now be integrated However it is strongly recommended thatProjectCrystalDataset names are assigned first These are written to the output MTZ file and used by downstream programs inparticular AIMLESS will use this information when deciding which images belong to the same dataset
Select Experiment settings from the Settings drop-down menu (see Drop down menus sect21) to enter these names and optionally givea title for the MTZ file
Select images 1-84 and click on Process
951 Parallel Integration Using multiple cores
An option is available on the pull-down menu (next to the Process button in the Integration task) which splits up the integration jobover available cores on the local machine All aspects are currently determined automatically at present user-configurable options willbe available in a later version The algorithm used is as follows
iMosflm determines the number of cores available on the local machineIf the number of cores (N) is greater than 2 iMosflm splits the integration run into N-1 batches (up to a maximum of 16) containingapproximately the same number of images If N le 2 iMosflm splits the run into N batches
If the total number of images in each batch is less than 32 the number of batches is decreased until this condition is satisfied
The first batch is submitted as a background task consisting of a refinement stage and an integration stage with its input and outputfiles (including the MTZ file) in a new directory its name being determined from the number of segments of data being integrated andthe lattice number (if the sample has been determined to contain multiple lattices) If the directories exist already they are all movedinto a newly-created directory with a time-stamped name the files from the most recent integration run are thus in directories withnames following the pattern described above Once the refinement stage is complete the refined parameters are written to a file
The launch of subsequent batches are delayed until the corresponding preceding batch has written its refined parameters This file isread and the new batch is launched again with a refinement stage and integration stage
At present the job cannot be aborted once it has started
952 Integrating as a background job
By selecting Batch in the drop-down menu adjacent to the Process button the integration can be run as a background job rather thaninteractively and the GUI can be used to look at a different dataset
Selecting Batch from the drop-down menu will display a new window showing the script that will be used to process the images alongwith a number of processing options The script can be edited if additional keywords are required or if some parameters are to bechanged and can also be copied and pasted into a file for off-line processing
By default the job is divided into batches across multiple cores as determined for the parallel integration described in sect951 but thenumber of cores can be chosen by the user from a drop-down menu in this case the size of each batch is determined by the interface
Plotting the results of the integration can be turned off this can make processing much faster
iMosflm Tutorial
fileUsersandrewg4MOSFLMnewgui_tutorialiMosflm_tutorial_720_ver3html[29052015 105311]
It is possible to configure job submission for remote machines (which can be added by depressing the add host button) Ensure youhave enabled passwordless logins for all the remote machines you enter and that you specify the full path to the Mosflm executable inthe Batch destinations window The remote working directory (in which the log and MTZ files are written) and the remote imagedirectory must both be specified with their full path names Any required parameter fields that are not completed by the user arehighlighted in orange if the user tries to submit a job without completing these fields a new window containing only those fields (againhighlighted in orange) pops up with a request to do so
The number of cores available on the selected host can be determined by depressing the apple core button on the Batch destinationsconfiguration window
The log file for batch submission jobs the MTZ and SUMMARY files are written to the directory in which iMosflm was launched
96 Checking the integration
iMosflm Tutorial
fileUsersandrewg4MOSFLMnewgui_tutorialiMosflm_tutorial_720_ver3html[29052015 105311]
The detector and crystal parameter plots should be examined carefully to check for any instability in the refinement If there are largeand random variations in some parameters (eg the detector twist and tilt) then it may be better to fix them and repeat the integration
For cases (eg very small unit cells) where there are very few suitable reflections on each image the refinement of the missetting anglesmay show significant variations from one image to the next In such cases it is best to apply smoothing to the missetting angles usingthe tick box in Settings -gt Processing options -gt Advanced Refinement
Discontinuities due to blank images should also show up and the offending images should be removed from the scaling run
If adjacent spots are incompletely resolved on the detector it may be possible to improve the processing by increasing the PROFILETOLERANCE parameters by 1-2 These parameters can be set in the Advanced integration tab of the Processing options menu (useSettings)
97 Advanced features for integration
The Settings -gt Processing options menu allows additional control over the integration Parameters such as the minimum spotseparation resolution limits excluded resolution ranges block size MTZ filename and BATCH ADD can be changed in the Processingtab
Manually decreasing the minimum spot separation can help if a large number of reflections are flagged as spatially overlapped (redboxes) The prediction must be updated to see the effect of changing the separation this can be done either by displaying the next orprevious image or double clicking on the blue circle next to the image currently displayed in the Images pane
In the Advanced integration tab the measurement box parameters profile tolerance and profile averaging parameters can be set
The measurement box parameters can be adjusted for rare cases where the estimation of the spot size has not worked correctlyresulting in a box that is too small or too large The optimisation of the background rim and corner cutoff parameters that determinewhich pixels are used for the background and which pixels for the peak can also be turned off but this is generally not recommended
Increasing the profile tolerance can help in cases where adjacent spots are not completely resolved this can be judged by examining thestandard profiles By default the profile tolerance is automatically increased if there are a large number of spatial overlaps as this hasthe effect of reducing the minimum spot separation A message will be written to the logfile if this has happened This option can beturned off using the tick box Optimise profile tolerance values to avoid spot overlap
The profile outlier exclusion parameters control the exclusion of ice spots or hot pixels which could otherwise corrupt the standardprofiles
Pixels with a value less than the Null pixel threshold are considered to belong to inactive regions of the detector
The pixel saturation value determines when a reflection is considered to be an overload The intensity of overloaded reflections isestimated by profile fitting but these reflections are rejected by the scaling program AIMLESS by default
Increasing the Maximum reflection width in φ from the default value of 5deg will reduce the number of rejected reflections (green boxes)and is worthwhile when the mosaicity is very high or the mosaic block size is very small As with the minimum spot separation theimage must be refreshed to see the effect of changing this parameter
The rejection criteria will reject reflections with too much variation in the background (BGRATIO) or where the gradient of thebackground plane is too large These should only be changed if many reflections are being rejected PKRATIO only applies to fullyrecorded reflections and reflects a very poor profile fit With current data collection protocols there will be very few (if any) fullyrecorded reflections
Additional MOSFLM parameters will be added based on user requests
98 Integrating multiple lattices
When multiple lattices have been successfully indexed each lattice can be integrated individually by selecting the appropriate latticenumber
Reflections in the chosen lattice that are overlapped by a reflection from another lattice will be integrated but the measurement box willbe expanded so that the total intensity of the two (or more) reflections is measured These reflections will be flagged for specialtreatment Reflections that are not overlapped are referred to as singletons They will be dealt with in the normal way by POINTLESSand AIMLESS
NOTE If more than one lattice has been indexed and the results of integrating just ONE of the lattices are to be checked byrunning QuickSymm or QuickScale then the multi-lattice icon in the Integration pane must be turned off otherwise an error
iMosflm Tutorial
fileUsersandrewg4MOSFLMnewgui_tutorialiMosflm_tutorial_720_ver3html[29052015 105311]
message will be given saying that all lattices must be integrated
It is often the case that by measuring both lattices (in separate integration runs) and inputting both MTZ files to QuickScale the overallcompleteness is high using ONLY the singletons To use this option ensure that the multi-lattice icon is off
To make use of the intensity estimates for overlapped reflections MTZ files for all lattices must be input to the program FECKLESSwhich will derive the best estimate of the summed intensity This is the default option if more than one lattice has been indexed and itrequires that all lattices have been integrated (in separate runs) prior to running QuickSymm or QuickScale (FECKLESS will be runautomatically)
At this time no downstream programs can make use of the summed intensities of overlapping reflections but in the future it should bepossible to use this data in REFMAC
Currently it is recommended to use only singletons from all the lattices FECKLESS is not required in this case
The MTZ filename is automatically updated to reflect which lattice has been chosen to avoid overwriting the MTZ file of the first latticewhen integrating the second one FECKLESS when run from iMosflm relies on this naming convention so do not change it
10 Running Pointless to check the symmetryOnce the images have been integrated (even a few degrees of data in many cases) the program POINTLESS can be run to determine thetrue Laue symmetry and try to determine the space group using the QuickSymm button
iMosflm Tutorial
fileUsersandrewg4MOSFLMnewgui_tutorialiMosflm_tutorial_720_ver3html[29052015 105311]
Select the QuickSymm button
A summary of the Pointless results as shown below will appear in a qtRView window
Various graphs (L test for twinning ViewHKL to view the reciprocal lattice) can also be viewed in this window
Various options for POINTLESS such as a reference MTZ file forcing the symmetry selected in iMosflm and specifying multiple input MTZfiles can be selected from the Settings -gt Processing options -gt Sort Scale and Merge tab (see below)
iMosflm Tutorial
fileUsersandrewg4MOSFLMnewgui_tutorialiMosflm_tutorial_720_ver3html[29052015 105311]
Caution The results can be ambiguous if run with a partial dataset Look in the logfile to see how many relfections are used totest each possible symmetry operator
11 Running Aimless to scale and merge the dataSelect the QuickScale button
This will first run POINTLESS then change the space group for the data to that selected by POINTLESS (unless the iMosflm symmetry isset to override POINTLESS) run AIMLESS to scale and merge the data in that space group and then run CTRUNCATE which calculates anumber of statistics from the intensity data The CCP4 UNIQUEIFY script will then be run which generates all the unique reflections forthat spacegroup to the resolution of the measured data and will flag reflections (5 by default but this can be changed) for use as theRfree set
AIMLESS can be run from the QuickScale button either treating anomalous data (the default) or ignoring anomalous data If onlyprocessing a few degrees of data it is usually better to ignore anomalous because especially for low symmetry cases no mergingstatistics may be given in AIMLESS
SCALA can be selected as an alternative to AIMLESS for scaling (not recommended)
There is limited control over running AIMLESS (see figure above) including re-setting resolution limits rejecting batches (images)changing the treatment for accepting partials changing the rejection criterion and changing the procedure for updating the standarddeviation estimates
iMosflm Tutorial
fileUsersandrewg4MOSFLMnewgui_tutorialiMosflm_tutorial_720_ver3html[29052015 105311]
The AIMLESS results will be displayed in the qtRView as shown below along with graphical output (see below) and the full log file canalso be examined
Aimless summary file
iMosflm Tutorial
fileUsersandrewg4MOSFLMnewgui_tutorialiMosflm_tutorial_720_ver3html[29052015 105311]
An example of the Aimless graphical output
The AIMLESS logfile can also be examined by selecting the Log File tab
12 History and mosflm log fileSelecting History allows the history of the session to be examined or by selecting the Log tab the full mosflmlp file can be viewed Themosflmlp file is also available in a time-stamped file mosflm_yyyymmdd_hhmmsslp (eg mosflm_20100518_131019lp) and can beread with a text editor
The History has a tree structure and will show when various parameters have been changed This has not been fully implemented and isnot generally useful
The logfile may provide useful clues when processing has failed
13 Warning MessagesAs already mentioned in Adding images sect3 and Integration sect9 warning messages are generated by MOSFLM during processing Atraffic light colour coding has now been assigned based on the warnings and is shown next to the Warnings box
A Red status implies a serious problem that will affect data quality and should be addressed
An Orange status implies minor issues that should be checked to see if things can be improved
A Green status means no significant problems messages are for information only
iMosflm Tutorial
fileUsersandrewg4MOSFLMnewgui_tutorialiMosflm_tutorial_720_ver3html[29052015 105311]
Abbreviated messages can be obtained by clicking on the Warnings icon The full warning Details together with Hints amp Notes text (ifany are available) can be obtained by double-clicking the relevant warning Details are displayed in a pop-up text box which willdisappear with the next click outside the box The same full details and suggestions are of course available in the mosflmlp files whereeven more information may be available
NOTE This is the end of the part of the tutorial which deals directly with iMosflm but see sect19 which has some suggestions forfurther work if you have time The remainder of this document deals with integrating and scaling data with MOSFLM andAimless via the CCP4i user interface examining the traditional mosflm SUMMARY file with the CCP4 utility loggraph
The Appendix contains a shell script for running MOSFLM as a traditional batch job
14 Useful command line optionsiMosflm has a number of command line options and these can be listed by typingimosflm --helpCurrent options are
--allimages -a ltfilenamegt Starts mosflm loading all files that match the template generated from ltfilenamegt--ccp4i2 Autosaves an iMosflm session file upon exit with an XML list of all iMosflm output files--debug -d Creates a large output file for debugging purposes Dont use this unless asked to by a developer--expert -e Permits access to advanced detector settings This should not normally be required--fastload -f Attempt to speed loading of many images offline while indexing two default images separated by 90 degrees--help -h Displays this message then exits--imagedir -I ltdirectorygt Starts the image browser in this directory if ltdirectorygt is given as an environment variable it will be expanded to its full value--init -i ltfilenamegt Starts Mosflm and reads from the given saved session file--startdir -S ltdirectorygt Starts mosflm in directory ltstartdirgt rather than the current directory This will only work if the directory exists and you have write permission to it otherwise iMosflm will exit All the normal mosflm output files will be in this directory--singleimage -s ltfilenamegt Starts mosflm loading only the image from ltfilenamegt--site -X ltfilenamegt Reads anyall of the following lines from the file given WAVELENGTH ltxgt DISPERSION ltxgt POLARISATION [PINHOLE | MIRRORS | MONOCHROMATOR | SYNCHROTRON ltxgt] DIVERGENCE ltxh xvgt BEAM ltbeamx beamygt DISTANCE ltxgt DISTORTION TILT ltxgt DISTORTION TWIST ltxgt GAIN ltxgt DETECTOR REVERSEPHI DETECTOR OMEGA ltxgt--version -v Displays the program version and required Mosflm version then exits
These can be abbreviated to the shortest unambiguous string
141 The site fileimosflm --site ltsitefilegt will read keywords from the file ltsitefilegt that will overwrite incorrect information in image headers Thissaves having to manually correct values in every iMosflm session The site file can also be read or written as an option from the Sessionmenu (see Drop down menus sect21) Allowed keywords areWAVELENGTH ltxgt
iMosflm Tutorial
fileUsersandrewg4MOSFLMnewgui_tutorialiMosflm_tutorial_720_ver3html[29052015 105311]
DISPERSION ltxgtPOLARISATION [PINHOLE | MIRRORS | MONO | SYNCHROTRON ltxgt]DIVERGENCE ltxh xvgtBEAM ltbeamx beamygtDISTANCE ltxgtDISTORTION TILT ltxgtDISTORTION TWIST ltxgtGAIN ltxgtDETECTOR REVERSEPHIDETECTOR OMEGA ltxgt
15 The mosflm SUMMARY fileMOSFLM produces a summary file listing refined parameters for each image and when using iMosflm this file will be date- amp time-stamped and have a name such as mosflm_20100518_131019sum This contains the same information as the plots produced by theiMOSFLM GUI which now also include the number of bad spots and overloads
This can be inspected graphically from the CCP4i GUI using the program loggraph Select the pull down menu View Files from Job andunder Output files select Additional log graphs where the _SUMMARYloggraph file will be listed Select this file to display its tablesin loggraph
This is very useful to identify rogue images (with unusually high positional residual or low Iσ(I)) If you find any read that image intoMOSFLM and see what is wrong with it
If you have done more than one integration run during your MOSFLM session you will find multiple entries of the tables Look at the lastset for integration of the 84 images
Click on the Refined detector parameter tables and check on the stability of parameters like the TILT and TWIST of the detector (unitsare hundredths of a degree) and for Mar Research (or DIP) image plate data the distortion parameters ROFF and TOFF (units are mm) Ifthey are varying a lot (more than 20 for TWISTTILT) or 015 for ROFFTOFF then it is probably a good idea to fix these parameters atthe average value (or the known values for this detector if they are available) (see Detector parameters sect821)
Click on the Post refinement table and check the missets It does not matter if they change slowly and by an amount (per image) that isless than 01mosaic spread If they are changing more than this then there could be a problem with processing the data (there is notmuch you can do about this)
Check how the mosaic spread is changing If it is unstable or if you think it is not refining to sensible values (as judged by looking atthe prediction) then you can fix the input value in the same way as the detector parameters (see Crystal parameters sect822)
BADSPOTS AND OVERLOADS
The program will set a rejection flag for those reflections that fail certain tests for example too much variation in the background levela poor profile fit an intensity that is very negative (more than 5 standard deviations) a very high gradient for the background planeThese reflections are called Bad spots and they are listed individually for each image in the mosflmlp file together with the reason forflagging them The number of bad spots is also written to the summary file Generally there should be very few (5-10) bad spots oneach image If there are more it could be because the backstop shadow is not correctly allowed for (consider using the NULLPIXkeyword)
There should also be very few overloaded reflections on each image If there are a lot then a separate low resolution data collectionpass should be made with a much shorter exposure time
IMPORTANT Both Bad spots and Overloads are written to the output MTZ file but will be rejected by default by AIMLESS Theintensity of overloaded reflections is estimated by profile fitting that part of the spot that is not saturated To include these reflections inthe final merged data use the ACCEPT keyword in AIMLESS
16 Scaling data with CCP4i ccp4i
Select Directories amp ProjectDir (top right)
In the new window select Add project
Enter the project name in the Project field and the full directory path in the uses directory field Default values may have been enteredalready here Select this project from Project for this session
Select Apply and Exit Dismiss the warning message that comes up
Select Data reduction from the pull down menu of modules (orange bar at top left)
iMosflm Tutorial
fileUsersandrewg4MOSFLMnewgui_tutorialiMosflm_tutorial_720_ver3html[29052015 105311]
Select Symmetry Scale Merge (Aimless)
In the window that appears do the following
Give a job title (top line)
Click on the box next to Separate anomalous pairs for outlier rejection amp merging statistics (the crystals have been soaked in a mercurycompound)
In the next orange bar (line starts HKLIN 1) select Browse and select the MTZ file output by MOSFLM (probably called hg_001mtz)Select OK
If you did not supply the Project name Crystal name or Dataset name to Mosflm fill in the boxes for these now
Under Scaling Protocol
From the pull-down menu on the line starting Scale select with automatic default settings
At the bottom of window from the pull-down menu named Run select RunampView Com File
This will display a new window showing the command file for running the POINTLESS step select Continue After a brief pause it willshow the command file for running AIMLESS (This can be edited before submitting the job) Select Continue
In the main window it will show that the AIMLESS job is running
When AIMLESS has finished the command file for running the CTRUNCATE step will appearselect Continue
When CTRUNCATE has run the main window will say FINISHED
At that point select the pull-down menu View Files from Job and select View Log Graphs This will give you the same graphs asrunning loggraph on the AIMLESS log file they are also the same as those that appeared in IMOSFLMs QuickScale task To look at thelog file itself (eg the overall merging statistics) select View Log File and it will appear in a new window
161 Looking at the AIMLESS output
The simplest way to look at the output from AIMLESS is to use loggraph on the AIMLESS log file (or via the CCP4i GUI) This can displaymany different graphs
Use Scales vs rotation range to check for smooth variation in the scale factor Check the variation in B factor with image and if there isno real variation it is best to turn off the B-factor refinement
Use the Analysis against all Batches for all runs to detect bad images (high R-factor large number of rejected spots)
Check the Analysis against resolution Fractional bias to see if there is any indication of Partial bias (A negative partial bias will resultif the mosaic spread is underestimated or if there is a lot of diffuse scatter
The Fractional bias should be less than 1-2 although it will often exceed this for weak data (eg in the high resolution bins)
The Axial reflections graphs in AIMLESS are useful for detecting systematic absences which can be used to identify the true spacegroup However the detection of screw axes is thought to be sufficiently robust in POINTLESS that these graphs are no longer necessary
It can also be useful to look at the AIMLESS log file itself in particular the table giving statistics as a function of resolution The effectiveresolution limit of the data can be estimated by looking at the Mn(I)sd column (this is the mean Iσ(I) AFTER merging symmetry matesand is the best indicator of data quality) This table also shows shell and cumulative R-factors
The Mn(I)sd values depend on having realistic values of the standard deviations (errors) in the intensities As the values that come fromMOSFLM are always underestimates of the true error these values are scaled up in AIMLESS using a three-term correction
sdcorrected = SdFac Sqrt[sd(I)2 + SdBLPI + (SdAddI)2]
Here SdFac is an overall scale factor and SdB and SdAdd are intensity dependent factors
AIMLESS will automatically work out a suitable value for all three parameters in order to make the mean value of (observedscatter)(sdestimate) equal to 10 where observed scatter is the difference between an individual estimate of intensity and the mean ofall other estimates (from symmetry mates)
Probably the best estimate of the true high resolution limit of the data can be obtained from the CC(12) values these are thecorrelations between equivalent observations that have been divided randomly into two half-datasets The resolution limit is foundwhen the CC drops below ~ 05 - 03
This table comes under the heading
ANALYSIS OF STANDARD DEVIATIONS
iMosflm Tutorial
fileUsersandrewg4MOSFLMnewgui_tutorialiMosflm_tutorial_720_ver3html[29052015 105311]
in the AIMLESS log file and Run n standard deviation v Intensity test (where n is 1 or more) in the CCP4i GUI View Files from Job -View Log Graphs display
Can you identify a bad image in this dataset Can you work out why it is bad
(Cluethe image headers contain quite a lot of information that is not used by MOSFLM including the date and time that the image wascollected)
You can exclude a given batch from the scaling using the EXCLUDE keyword
RUN ALL EXCLUDE imagenumber
In this case run number will be 1
Rerun the scaling SENDING THE OUTPUT TO A NEW LOGFILE excluding this image and see the effect on the heights in the anomalousPatterson (in the log file) DO NOT repeat the integration In the command file uncomment the line (near the top) goto aimless so itskips the integration part
In the CCP4i GUI click to highlight the AIMLESS job which is listed as FINISHED and select ldquoReRun Jobrdquo from the control buttons downthe right-hand side of the main interface window Under ldquoExcluded Datardquo in the window that appears check the box next to Excludeselected batches and pull-down on the menu button to exclude a range Give the start amp end range to exclude (eg 74 to 74) Rerunthe job as before
17 Changing the symmetryFrom the list of options at the left hand side of the main window select ldquoUtilitiesrdquo and under that SortModifyCombine MTZ Files
In the new window give a new title eg reindex as H32
Click on the Box Change space group andor reindex reflections
Use the browse option to select the input MTZ file (First orange bar) the output filename will be generated automatically (but you canchange it)
Under Reindex details
In the last option check the box next to ldquoChange space group tordquo and enter H32 in the box This is above the final item Reducereflections to the asymmetric unit which is checked by default
Select Run from the Run option button
Then go back to the scaling window and select the new MTZ file (reindexed) as the input for scaling (use Browse) CHANGE THE JOBTITLE
Then select RUN
The scaling will now be performed in space group H32 Look at the merging statistics in the log file in particular the multiplicityweighted R-factor called Rmeas in the log file
18 Looking at the CTRUNCATE outputThe CTRUNCATE program converts intensities to amplitudes and also compiles some useful statistics The LTEST and the cumulativeintensity statistics tabulated by CTRUNCATE (and plotted by loggraph) provide the only point at which you will be able to detectmerohedral twinning (when the two lattices of the twin components exactly overlap and every measured intensity is actually the sum oftwo intensities)
For a good dataset the observed distribution should be within 1 of the theoretical distribution Is this the case for this data
19 If you have time 191 Different mosaic spreads
Try repeating the processing with the mosaic spread set to a value 25 smaller than the refined one and fix it by checking the Fix boxin the Integration window in iMosflm
Can you tell from the merging statistics if this data is better
192 Checking up on outliers
iMosflm Tutorial
fileUsersandrewg4MOSFLMnewgui_tutorialiMosflm_tutorial_720_ver3html[29052015 105311]
AIMLESS writes a file called ROGUES which lists reflections which show very poor agreement between symmetry mates or which areimplausibly large
Look in this file (it is ASCII) and try to work out why this has happened The ROGUES file gives you the image (Batch) on which thereflections have been recorded (for partials this is the image nearest the centre of the reflection so you may need to look on thepreceding and following image as well) Select a reflection which shows very poor agreement with its symmetry mates (A value greaterthan 10 in the DelIsd column in the ROGUES file)
Select the offending image by double-clicking it in the Images pane of the iMosflm main window Predict the reflections then enter thehkl values into the boxes and hit Return (or click the red warning button following the entry box for l) to locate the offending reflectionin the image You must give the measured indices - the first set of values in the ROGUES file - when doing this See if there is anythingodd about the spot Remember to check adjacent images for partials
193 How accurate does the unit cell have to be
Try changing the cell parameters by (say) 10 and integrate the images again What is the effect on the merging statistics
20 Tips1 When reading images into a session DO NOT attempt to carry out any other task until ALL the images have been read2 It is often worth repeating the indexing (usually only once) as the refined direct beam coordinates from the first indexing may give
an improved solution when the indexing is repeated (lower rmsd)3 Always integrate a few degrees of data before integrating the whole dataset (see sect9) If the space group is not known in advance
run Quicksymm with a few degrees of data to check that the correct indexing solution has been chosen4 For difficult images do not attempt to refine the unit cell initially once an indexing solution has been obtained try integrating a
few images to ensure that the integration is stable If then going on to refine the cell check that the prediction looks OK for thefirst image of every segment included in the refinement If it does not look very good consider using the pattern matching(Settings -gt Processing options -gt Advanced refinement see sect84)
5 If the resolution of the data is less than 35 Aring do not use the ldquoRefine Cellrdquo task Instead use several images in indexing and use thecell that comes from the indexing
6 If iMosflm gets into a state where the activity icon(upper right) is spinning but nothing seems to be happening click on the activityicon to stop it spinning and see if the session can be continued DO NOT click on the activity icon simply to abort a task this willgive unpredictable results Use the Abort button for cell refinement or integration There is no defined way to abort indexing
7 Use the image summation option (see sect4) to get a better impression of the diffraction for very low exposure Pilatus images8 Use image summation for detector parameter refinement for fine sliced very weak Pilatus images (Settings -gt Processing options -
gt Advanced refinement see sect821)9 For large mosaic spread values (gt 10deg) or small mosaic block sizes (lt10) consider increasing the maximum allowed reflection
width to avoid having too many green predicted reflections (Settings -gt Processing options -gt Advanced integration see sect97)10 By default on selecting the Indexing task iMosflm will find spots index and (assuming a solution has been found) estimate the
mosaicity For difficult cases it is more useful to restrict this to simply finding spots and then do the indexing and mosaicityestimation by clicking the appropriate buttons To do this change the check box Automatically index after spot finding inSettings -gt Processing options -gt Indexing
11 See sect521 and sect522 for advice if the indexing fails Also consider the possibility of a reversed phi rotation direction if you arenot familiar with the beamline (Settings -gt Experiment settings -gt Experiment see sect21)
12 If the detector parameters have refined to physically unreasonable values (eg because cell refinement or integration has beencarried out using an incorrect indexing solution) be sure to reset the detector parameters before attempting further processing(Settings -gt Experiment settings -gt Detector see sect21)
13 Always set the resolution limit slightly beyond the point at which any spots are visible (see sect414 ) For very weak fine-sliceddata it can be very difficult to estimate the resolution visually so integrate to the maximum resolution (inscribed circle) and usethe merging results to set the final resolution There should be no problems integrating to a resolution ~03-05 Aring beyond theactual resolution limit but for example integrating to 3 Aring when the true resolution limit is 5-6 Aring may cause problems and theintegration should then be repeated with a more realistic resolution limit
14 Use the site file sect141 if repeatedly processing data where the direct beam position is wrong or if the phi direction is reversed etcto save having to correct this for every session
Appendix IA command script for running MOSFLM using the keywords copied from the Batch processing window of the new GUI (see Integratingas a background job sect952) Note that keyworded input for MOSFLM and other CCP4 programs is case-insensitive apart from file anddirectory names
bincsh -fv Set a unique identifier for filenames for this job
set ident = x89_mos07_blk3_smallsep
iMosflm Tutorial
fileUsersandrewg4MOSFLMnewgui_tutorialiMosflm_tutorial_720_ver3html[29052015 105311]
$ipmosflm COORDS $identcoords SUMMARY $identsummary ltlt eof-ip Insert keywords copied from iMosflm batch window here
Keywords for this run For example could involve trying different values for mosaic spread or not integrating all images etc etchklout $identmtzgenfile $identgenprocess 1 1000 goeof-ip
pointlesspointless hklin $identmtz hklout $ident_pointlessmtz
aimlessaimless hklin $ident_pointlessmtz hklout $ident_aimless_partmtz ROGUES $identrogues ltlt eof-aimless Use all default options for aimlesseof-aimless
ctruncate hklin $ident_aimlessmtz hklout $ident_truncatemtz
Harry Powell Andrew Leslie and Owen Johnson
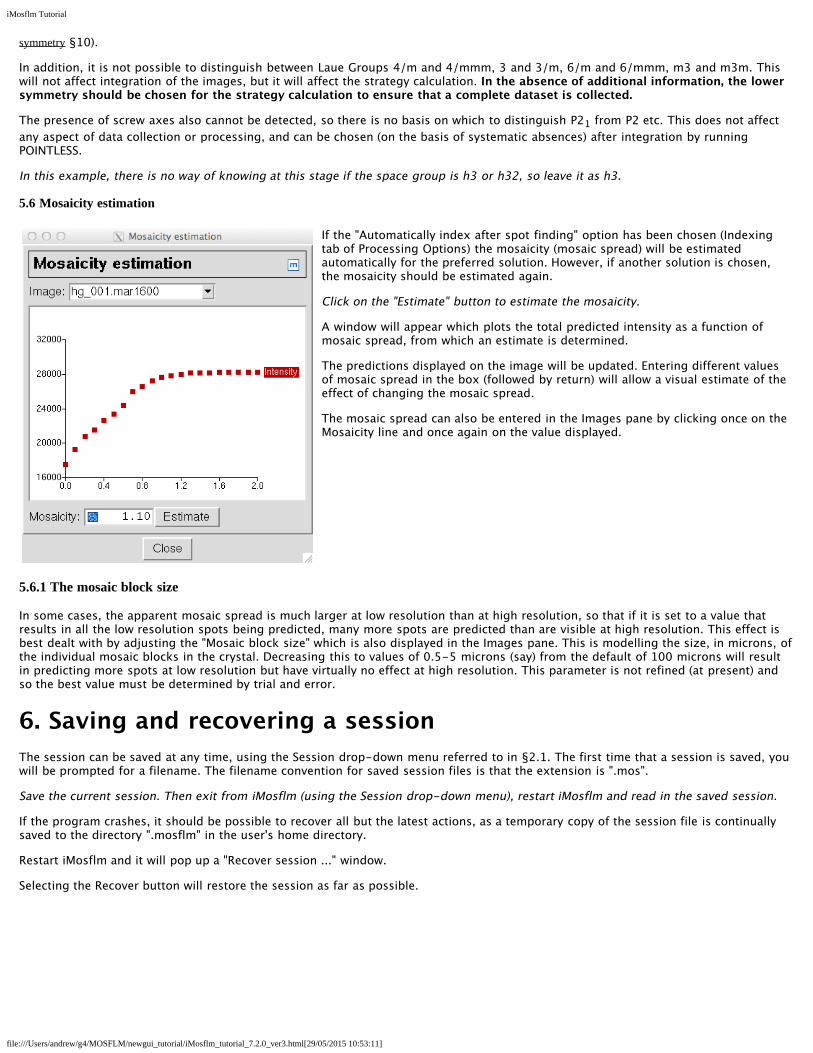
iMosflm Tutorial
fileUsersandrewg4MOSFLMnewgui_tutorialiMosflm_tutorial_720_ver3html[29052015 105311]
7 Data collection strategyOnce the crystal orientation and (probable) Laue group have been determined it is possible to calculate a data collection strategy andthe Strategy icon is no longer greyed-out (in fact all other operations Strategy Cell Refinement and Integration become possible at thispoint)
Select the Strategy icon This will open the Strategy window
The statistics initially presented in the window are based on the images read in to the current session If only two (or more) references
iMosflm Tutorial
fileUsersandrewg4MOSFLMnewgui_tutorialiMosflm_tutorial_720_ver3html[29052015 105311]
images have been read in no statistics will be presented
When the Strategy option is used after two initial images (typically 90deg apart in φ) have been collected a complete shaded segment willnot be shown in the lower part of the screen rather an empty circle will be shown with the matrix label beneath it Click the Auto-complete button and in the pop-up menu that appears select a rotation angle or sweep of data to collect - or leave the Rotationsetting as Auto for a calculation of maximum completeness for this crystal orientation Click on Ok and the completeness results willbe presented
The orientation of the crystal expressed as the angles between the abc unit cell axes and the XYZ coordinate frame is given X isalong the X-ray beam Z is the rotation axis A warning will be given if the unique axis is so close to the rotation axis that there will bemissing cusp data
71 Evaluating completeness manually
The completeness of any given segment of data can be determined manually using the circle at the bottom left of the window Click onthe red segment shown in this circle
This will result in small black boxes being drawn on the circumference at the start and end of the red sector
Use the LMB to click on the black box at 0 and drag this around the circle
When the LMB is released the statistics for that sector will be displayed The statistics are presented in two ways Near the top right ofthe window the overall completeness is shown as red circles for unique data and anomalous pairs The average multiplicity is givenbeneath these circles
More detailed statistics (such as completeness as a function of resolution) are given in a series of histograms that can be selected by adrop-down menu
72 Calculating a strategy automatically
Uncheck the Use checkbox at the right side of the hg_001 line listed in the sector list near the top of the Strategy pane This means
iMosflm Tutorial
fileUsersandrewg4MOSFLMnewgui_tutorialiMosflm_tutorial_720_ver3html[29052015 105311]
that the 84 images used thus far will not be included in the completeness calculation only the matrix derived from indexing them willbe used Select the Auto-complete button to calculate a strategy automatically
A strategy calculation data pop-up window will appear
If multiple matrices have been defined (for different sectors of data) then the appropriate one can be selected (if there is only one sectorthis has no effect)
The total φ rotation to be used is normally calculated by MOSFLM based on the Laue group and the crystal orientation (the Auto setting)However it is sometimes possible to achieve a high completeness with a significantly smaller total rotation (eg 60deg in two 30degsegments will typically give gt94 completeness for orthorhombic space groups) and this can sometimes be useful if radiation damage isa serious problem although when using hybrid pixel detectors it is better to use a very conservative exposure time and collect a wide φrotation
Total rotation angles of between 5deg and 90deg can be selected from the drop-down list The number of segments to be used can be setbetween 1 and 3
If the check box is checked data completeness will be calculated to optimize the proportion of anomalous data collected
THIS IS IMPORTANT The optimum strategy is often different when maximising completeness of the anomalous data
Choose the default values (Rotation Auto Segments 1) but check the anomalous data box then click on Ok Look at the variousstatistics presented as bar charts
In space group H3 if rotating around the c axis a total rotation of 120deg would be required to collect a complete dataset (ignoring anydata lost in the cusp) Because the c axis is 22deg away from the rotation axis in this case it is possible to collect very high completeness(for unique data) with a rotation much smaller than this
Try to find the minimum total rotation that will give a dataset that is gt95 complete for the unique data Now do the same butrequiring gt95 completeness for the anomalous data
SKIP OVER SECTION 73 IF DOING THE NORMAL TUTORIAL
73 Calculating a strategy using multiple crystals
The Strategy pane may also be used when due to radiation damage many crystals are required to collect a complete dataset
IMPORTANT This procedure will only work correctly for space groups where there is no indexing ambiguity For those spacegroups where there is an indexing ambiguity( see httpwwwccp4acukdisthtmlreindexinghtml for a complete list) it isnecessary to integrate images to determine whether different crystals have been indexed in the same way This is not achievablewithin the Strategy option at present
Suppose the first crystal has been indexed from the reference images
Enter the Strategy pane an empty circle is displayed in the bottom part of the screen and click on the Auto-complete button nearthe top-right of the pane In the Auto-complete window that appears choose a suitable Rotation angle for the amount of datathat can be collected from one crystal say 20 degrees for this example Leave Segments set to 1 and do not check Optimize foranomalous data
Click the Ok button and the completeness of the data will be displayed The matrix name start and end phi values and the phiextent will be displayed in the top area of the pane with a checkbox ticked under the Use column This means this segment will beused in further strategy calculations
Accept and save this result by clicking on the yellow hatched segment displayed in the large circle near the bottom of the paneClick once and the segment will be outlined in black (you can adjust the start or end phi value calculated in one degree incrementsby click+dragging the respective black square) click again this time on the black square denoting the start or end phi (or release ifyou have adjusted by click+dragging) and the segment will turn red The segment will not be saved unless it has turned red
This result will be saved if you leave this pane (eg to load more images) and return later in this session The strategy file can alsobe saved to a permanent file using the Save button on the tool-bar This is highly recommended when working with many crystals
Return to the Strategy pane when you have loaded and indexed the reference image(s) from the second crystal and repeat the procedureabove You will see the calculated segment from the first matrix displayed at the bottom-left of the screen The optimum phi range for
iMosflm Tutorial
fileUsersandrewg4MOSFLMnewgui_tutorialiMosflm_tutorial_720_ver3html[29052015 105311]
the second crystal will be displayed Save this in the same way as for the first crystal (clicking twice) Repeat this procedure for anysubsequent crystals and in each case the optimum phi range will be calculated for the latest crystal taking into account the data fromprevious crystals
It is a good idea to save the strategy to a file as each new crystal is added in case the program crashes and this information is lost
In practice it is probably safest to have a separate iMosflm session that is reserved for the strategy calculations and not used to processany data The strategy for each new crystal can be calculated as described above If there is a problem and the session is corrupted or ifiMosflm is closed down for any reason it is straightforward to restore the status of the session providing the strategy has been savedThe following steps should be taken
1 Read in the reference images for the latest crystal and index them
2 Select the Strategy pane
3 Read in the optimised strategy for all previous crystals using the ldquoAddrdquo button and giving the appropriate filename
4 Making sure that the circle for the latest crystal is highlighted in the lower left window click on lsquoAuto-completersquo and follow the stepsdescribed above
Advanced Usage
The startend phi values for each crystalmatrix can be updated This might be required if for example only 10 degrees of useful datawere collected from a particular crystal instead of the anticipated 20 degrees To change the phi values click either on the matrix namein the top pane or on the circle showing the segment of data in the lower left pane (these are highlighted in a blue box as the mousemoves over them) The corresponding segment will now be displayed in the larger circle Click on the red segment so that a blacksquare appears at the startend phi values Then simply drag the appropriate phi to the desired value The completeness willautomatically be updated (but the strategy calculation for the latest crystal will not be repeated to do this the current segment must bedeleted by highlighting the matrix name and using right click and then repeating the Auto-complete step)
If matrix files saved from iMosflm are available from crystals for which data have been collected in previous sessions these can beadded into the calculation using the Add matrix button on the tool-bar
If the saved strategy result has become complicated or is incorrect and you wish to restart the calculations afresh there is a tool-barbutton Reload sectors from session This will remove any calculated sectors while leaving any known matrices listed at the bottom-leftof the Strategy pane
If you have saved a strategy file from a previous session this can be used to re-initialize the Strategy pane using the Load button onthe tool-bar
A Spacegroup pull-down menu has been added to the tool-bar to permit different choices of space group to be used in thecalculations (eg H3 and H32) This menu is populated from the list offered on the Indexing pane However the space group symboltext is editable Any space group symbol entered will be validated by Mosflm together with the current cell parameters
As a calculator for a multi-segment strategy the Strategy pane is reasonably flexible you can Save or Delete highlighted matrix lines byright-clicking As you highlight different matrix lines the orientation of the crystal expressed as the angles between the abc unit cellaxes and the XYZ coordinate frame is re-displayed in the centre of the pane
The following screen shot shows the cumulative results in the Strategy pane after this procedure has been followed for four crystals(ignore the iMosflm version number)
iMosflm Tutorial
fileUsersandrewg4MOSFLMnewgui_tutorialiMosflm_tutorial_720_ver3html[29052015 105311]
731 Calculating a strategy when some data have already been collected and processed
This option is not yet implemented If data have already been processed (to give an MTZ file) but the images are not currently available (eg they were collected on a previoussynchrotron trip possibly at a different synchrotron) then the MTZ file containing this data can be read and used to calculate a strategyfor data collection from new crystalsThe MTZ icon in the tool bar is used to read the MTZ file
74 Calculating a suitable oscillation angle
To calculate the maximum possible oscillation angle while avoiding spatial overlaps click on the Check for overlaps button A pop-upwindow will appear from which the option to calculate the maximum oscillation angle (as a function of φ) or check how many overlapswill occur for different (user selected) oscillation angles The results are plotted in the same pane as the histograms for the strategycalculations Note that the overlap calculation is based on the current values for the mosaic spread and spot separation and can be verysensitive to these values Note also that these are maximum and not necessarily recommended oscillation angles
iMosflm Tutorial
fileUsersandrewg4MOSFLMnewgui_tutorialiMosflm_tutorial_720_ver3html[29052015 105311]
8 Cell refinementIt is important to determine the cell parameters accurately before integrating the images Although the unit cell is refined as part of theautoindexing providing the diffraction extends beyond ~35Å resolution it is possible to obtain more accurate cell parameters using aprocedure known as post-refinement This procedure requires the integration of a series of images in ideally two or more separatesegments at widely different φ values The distribution of the intensity of partially recorded reflections over the images on which theyoccur is used to refine the unit cell crystal orientation and mosaic spread
Select the Cell Refinement icon
81 Selecting the images
iMosflm Tutorial
fileUsersandrewg4MOSFLMnewgui_tutorialiMosflm_tutorial_720_ver3html[29052015 105311]
There are several ways to select the images to be used in cell refinement Whichever method is used the image numbers will bedisplayed in the Images entry field iMosflm will automatically select appropriate images but these can be changed
811 Manual selection
A list of images can simply be typed into this box An image series can be specified as n-m where n and m are the first and last imagesDifferent series must be separated by white space or comma
For orthorhombic or higher symmetries two segments should be given approximately 90deg apart in φ For monoclinic or triclinic datathree or four segments are best (eg φ = 04590135)
The number of images that should be included in each segment depends on the mosaic spread and oscillation angle A reasonablenumber is 2(mosaic spreadoscillation angle +1) MOSFLM will automatically select two or more segments as appropriate Note thatthere is a limit on the total number of images that can be used
812 Automatic selection
Selecting the Automatically select images icon will select a suitable set of images
813 Graphical selection (Not recommended)
Selecting this icon will give a new window
Images can be selected by clicking in the Use check-box in the list of images or by using the mouse to drag a selection of imagesfrom the sector displayed The other icons allow the sector to be zoomed in or out and the viewed area to be moved to make theselection easier The final two icons on the tool-bar switch the segment display to fit the display space as either a full circle or aquadrant This Image palette can be closed by clicking outside its area but will close after 60 seconds anyway
82 Integrating the images and refining the cell
Use one of the methods above to select images to use in cell refinement and click on the Process button Before starting cell refinementcheck that the prediction for the first image in each segment to be used is good The majority of the spot positions must be correctlypredicted for the first image in each segment or else the refinement will not work
The selected images will be integrated and following integration the cell parameters are refined Selectable refined detector parameters
iMosflm Tutorial
fileUsersandrewg4MOSFLMnewgui_tutorialiMosflm_tutorial_720_ver3html[29052015 105311]
will be plotted as will the changes in crystal orientation and (if selected) mosaic spread If the shift in cell parameters is greater than 25standard deviations another cycle of integration and cell refinement is carried out Typically two or three cycles are required forconvergence Note that the current program activity is shown in the bottom left-hand corner of the window in the status message area
The different windows are explained below Moving the mouse over any parameter or plotted graph point will give a full description ofit
821 The detector parameters window
The values of the refined detector parameters are displayed for each image as it is integratedThere is the option to fix any of the parameters during integration by checking the Fix box onthe right The positional residuals (overall central and weighted) are also listed
Any of these parameters can be selected for plotting on the graph that appears to the right ofthis box by simply clicking on that parameter (which is then highlighted in blue as shown herefor Beam x and Beam y)
Check the stability of the refined parameters by displaying the appropriate graphs To getsensible scaling of the graphs only parameters with similar numerical values should be plottedtogether
For weak images (ie few visible spots in the outer regions of the image) the tilt and twistmay not be well defined and might refine to large values (greater than one degree) Insuch cases these parameters should be fixed It is not generally recommended to fix any
iMosflm Tutorial
fileUsersandrewg4MOSFLMnewgui_tutorialiMosflm_tutorial_720_ver3html[29052015 105311]
other detector parameters
For very weak fine sliced images (Pilatus only) there is the option to sum images when findingsuitable spots for refinement see Settings -gt Processing Options -gt Advanced refinementwhich can in some cases make the refinement more stable
822 The crystal parameters window
The values of the refined crystal missetting angles φ(x) φ(y) φ(z) the unit cell parameters andmosaic spread for the current image are displayed in the table Selected parameters will beplotted as for the detector parameters Specific unit cell parameters can also be fixed
If more than one segment of data is being used for cell refinement it is not unusual to see achange in orientation of the crystal between the two segments
Observe how the crystal orientation is different for images in the two segments See how themosaic spread varies during refinement
823 The central spot profile
The average spot profile for the central region of the detector is plotted for eachimage This confirms that the spot prediction is good If the profile is not welldefined and central in the box or if the blue border for the peak region of the spot ismuch larger than the apparent spots size it suggests a problem with the integrationand the initial prediction should be checked In some cases it may be necessary toincrease or decrease the Profile Tolerance parameters to ensure that the blue boxfits the spot To do this select the Advanced integration tab of Processing optionsCheck the central spot profiles for the images used in the cell refinement
824 The summary window
This window presents a summary of how selected parameters have changed indifferent cycles of the cell refinement The behaviour of these parameters gives agood indication of whether the cell refinement has been successful
If the refinement has been successful the RMS residual should be lower for thefinal cycle than in previous cycles However errors in the cell can be compensatedquite well by changing the crystal to detector distance so the differences are notalways dramatic
The other parameters that can be plotted from the pull-down list are the detectordistance and the Pixel ratio (Yscale)
The detector distance should be the same for all images in the refinement If the original indexing was based on auto-indexing a singleimage (say the first) then the detector distance might change for images from the second segment to compensate for an error in theoriginal cell If the variation in distance for different images increases with the cycle number this indicates that the refinement is notstable
The Pixel ratio (Yscale) parameter may also show an initial variation for images in different segments because refining Yscale (whichshould be 10000 for all except Raxis II and Raxis HTC detectors) can compensate for errors in cell dimensions in the same way that thedistance can The final values (last cycle) should be very close to identical for all images and should also be very close to unity (to within00010)
Cell refinement can be unstable if the data do not extend to at least 35 Aring If it appears unstable use the cell derived from auto-indexing a series of images well spaced in φ instead
iMosflm Tutorial
fileUsersandrewg4MOSFLMnewgui_tutorialiMosflm_tutorial_720_ver3html[29052015 105311]
Examine the plots to see if the parameters are stable and correct (Yscale)
825 The final results
When refinement has converged (or after 5 cycles) the initial and final cell parameters and the estimated errors (std dev) are listed
If time is available make a note of the std dev values and repeat the cell refinement using a larger number of images in each segmentAre the standard deviations smaller when using more images
83 Refining cell parameters for multiple lattices
Providing the resolution is high enough (generally better than ~35-32 Aring) and not too many of the spots in the different lattices areoverlapped it is possible to refine the cell parameters for each lattice individually The lattice to be refined is selected from the Latticeselector
This selector will be grayed out when processing a single lattice
84 If the prediction for the first image of a segment is poor
In some cases depending on how the indexing has been carried out or if the diffraction is poor or there has been a large change incrystal orientation during the data collection the prediction for one or more of the segments (the first image) may be poor In suchcases the integration and hence the cell refinement may fail It may be possible to successfully process the images after an initialrefinement of the crystal orientation using a pattern matching algorithm To select this option got to the Advanced refinement tab ofProcessing options and select the tick box for Refine orientation of first image in any run by pattern matching and for Integrate allimages Then refine the cell in the usual way During integration the orientation will be refined for the first image of each segmentoutput for this additional refinement will be written to the logfile but is not shown in the GUI
9 IntegrationThe accurate cell parameters are now used in the integration Note that although the images are integrated during the cell refinementthe intensities are not saved and no MTZ file is generated at that stage
It is good practice to start by integrating a block of images corresponding to a few degrees of data to check that the parameters do notneed further adjustment MOSFLM will generate warning messages after integration if there are any difficulties and it may be possibleto improve the situation by changing some of the default parameters (see Warning messages sect13)
Before integration ensure that the backstop shadow has been defined (see Masked areas backstop sect411 and Masked areas generalsect412)
91 Image selection
Image selection is performed in exactly the same way as in the cell refinement In this case the Automatic selection will simply includeall images in the current sector
Select images 1-10
92 Setting the MTZ filename and controlling updating of the image display
Two icons appear when the integration option is chosen
If the Show predictions icon is clicked the display window will be updated as eachimage is processed This will slow down the processing but allows the accuracy of theprediction to be checked for each image
iMosflm Tutorial
fileUsersandrewg4MOSFLMnewgui_tutorialiMosflm_tutorial_720_ver3html[29052015 105311]
Click on this icon so that the display will be updatedThe filename of the MTZ file containing the results of the integration is generatedautomatically but can be edited manually
93 Integrating the images
Click on the Process button to start integration
Integration of the images occurs in two passes In the first pass for each block of images (a number corresponding to a few degrees ofdata selected automatically by MOSFLM) the detector and crystal parameters are refined for each image in turn and the measurementboxes for all predicted spots are written to a file for use in the second pass In the second pass the standard profiles are formed fromreflections present on all of the images in this block and each image is then integrated and the results written to the MTZ file Thedisplay is not updated during the second pass and will remain on the last image of the block (assuming image updating has beenselected)
Note that the unit cell dimensions are normally fixed during integration and only the crystal orientation and mosaic spread are refinedCrystal parameter refinement only starts when a sufficient number of images have been integrated to provide data for the post-refinement typically after ~05-1 degree (more for high mosaicity)
94 Parameter display windows
As described in sect82 the refined detector and crystal parameters will be displayed in tables and selected parameters will be plotted ingraphs The average spot profile for each image will also be displayed
The size of these graphs (and the profile) can be expanded to fill the whole window by holding down Shift and clicking LMB anywherein the graph window A second Shift+click will revert the graph to the original size
In addition to these windows there are windows that tabulate and plot (as a function of image number) the mean Iσ(I) for profile fittedand summation integration intensities The overall values and the values for the highest resolution bin are given
The number of overloaded reflections Bad spots (ie those that fail certain tests see mosflm SUMMARY file sect15) Spatial overlaps andif processing multi-lattice images the number of lattice overlaps is listed for each image and can be plotted by highlighting thatparameter When processing data from crystals with large unit cells it is important to watch out for spatial overlaps (see sect97 for tips onhow to reduce the number of spatial overlaps if this is a problem)
A display of the standard profiles for different regions of the detector is also provided Poor profiles are averaged by includingreflections from inner regions of the detector Averaged profiles are indicated by a red line around the spot (rather than blue) Theoriginal unaveraged profile can be viewed a clicking on the profile (providing there were sufficient spots in that region to allowformation of a profile)
The profiles should be checked to see that they are well defined and centred within the box Poorly-defined diffuse or non-centredprofiles may suggest that the prediction is not very good in which case this should be checked on the corresponding image(s)
It may be useful to expand the standard profiles to fill the window using Shift + click in the profiles window
Finally the lower left window plots Iσ(I) as a function of resolution for any selected image
iMosflm Tutorial
fileUsersandrewg4MOSFLMnewgui_tutorialiMosflm_tutorial_720_ver3html[29052015 105311]
Different parameters can be plotted by selecting the small right- or left-pointing arrows on the title line above the plot
95 Integrating the whole datasetAssuming that everything looks OK the entire dataset can now be integrated However it is strongly recommended thatProjectCrystalDataset names are assigned first These are written to the output MTZ file and used by downstream programs inparticular AIMLESS will use this information when deciding which images belong to the same dataset
Select Experiment settings from the Settings drop-down menu (see Drop down menus sect21) to enter these names and optionally givea title for the MTZ file
Select images 1-84 and click on Process
951 Parallel Integration Using multiple cores
An option is available on the pull-down menu (next to the Process button in the Integration task) which splits up the integration jobover available cores on the local machine All aspects are currently determined automatically at present user-configurable options willbe available in a later version The algorithm used is as follows
iMosflm determines the number of cores available on the local machineIf the number of cores (N) is greater than 2 iMosflm splits the integration run into N-1 batches (up to a maximum of 16) containingapproximately the same number of images If N le 2 iMosflm splits the run into N batches
If the total number of images in each batch is less than 32 the number of batches is decreased until this condition is satisfied
The first batch is submitted as a background task consisting of a refinement stage and an integration stage with its input and outputfiles (including the MTZ file) in a new directory its name being determined from the number of segments of data being integrated andthe lattice number (if the sample has been determined to contain multiple lattices) If the directories exist already they are all movedinto a newly-created directory with a time-stamped name the files from the most recent integration run are thus in directories withnames following the pattern described above Once the refinement stage is complete the refined parameters are written to a file
The launch of subsequent batches are delayed until the corresponding preceding batch has written its refined parameters This file isread and the new batch is launched again with a refinement stage and integration stage
At present the job cannot be aborted once it has started
952 Integrating as a background job
By selecting Batch in the drop-down menu adjacent to the Process button the integration can be run as a background job rather thaninteractively and the GUI can be used to look at a different dataset
Selecting Batch from the drop-down menu will display a new window showing the script that will be used to process the images alongwith a number of processing options The script can be edited if additional keywords are required or if some parameters are to bechanged and can also be copied and pasted into a file for off-line processing
By default the job is divided into batches across multiple cores as determined for the parallel integration described in sect951 but thenumber of cores can be chosen by the user from a drop-down menu in this case the size of each batch is determined by the interface
Plotting the results of the integration can be turned off this can make processing much faster
iMosflm Tutorial
fileUsersandrewg4MOSFLMnewgui_tutorialiMosflm_tutorial_720_ver3html[29052015 105311]
It is possible to configure job submission for remote machines (which can be added by depressing the add host button) Ensure youhave enabled passwordless logins for all the remote machines you enter and that you specify the full path to the Mosflm executable inthe Batch destinations window The remote working directory (in which the log and MTZ files are written) and the remote imagedirectory must both be specified with their full path names Any required parameter fields that are not completed by the user arehighlighted in orange if the user tries to submit a job without completing these fields a new window containing only those fields (againhighlighted in orange) pops up with a request to do so
The number of cores available on the selected host can be determined by depressing the apple core button on the Batch destinationsconfiguration window
The log file for batch submission jobs the MTZ and SUMMARY files are written to the directory in which iMosflm was launched
96 Checking the integration
iMosflm Tutorial
fileUsersandrewg4MOSFLMnewgui_tutorialiMosflm_tutorial_720_ver3html[29052015 105311]
The detector and crystal parameter plots should be examined carefully to check for any instability in the refinement If there are largeand random variations in some parameters (eg the detector twist and tilt) then it may be better to fix them and repeat the integration
For cases (eg very small unit cells) where there are very few suitable reflections on each image the refinement of the missetting anglesmay show significant variations from one image to the next In such cases it is best to apply smoothing to the missetting angles usingthe tick box in Settings -gt Processing options -gt Advanced Refinement
Discontinuities due to blank images should also show up and the offending images should be removed from the scaling run
If adjacent spots are incompletely resolved on the detector it may be possible to improve the processing by increasing the PROFILETOLERANCE parameters by 1-2 These parameters can be set in the Advanced integration tab of the Processing options menu (useSettings)
97 Advanced features for integration
The Settings -gt Processing options menu allows additional control over the integration Parameters such as the minimum spotseparation resolution limits excluded resolution ranges block size MTZ filename and BATCH ADD can be changed in the Processingtab
Manually decreasing the minimum spot separation can help if a large number of reflections are flagged as spatially overlapped (redboxes) The prediction must be updated to see the effect of changing the separation this can be done either by displaying the next orprevious image or double clicking on the blue circle next to the image currently displayed in the Images pane
In the Advanced integration tab the measurement box parameters profile tolerance and profile averaging parameters can be set
The measurement box parameters can be adjusted for rare cases where the estimation of the spot size has not worked correctlyresulting in a box that is too small or too large The optimisation of the background rim and corner cutoff parameters that determinewhich pixels are used for the background and which pixels for the peak can also be turned off but this is generally not recommended
Increasing the profile tolerance can help in cases where adjacent spots are not completely resolved this can be judged by examining thestandard profiles By default the profile tolerance is automatically increased if there are a large number of spatial overlaps as this hasthe effect of reducing the minimum spot separation A message will be written to the logfile if this has happened This option can beturned off using the tick box Optimise profile tolerance values to avoid spot overlap
The profile outlier exclusion parameters control the exclusion of ice spots or hot pixels which could otherwise corrupt the standardprofiles
Pixels with a value less than the Null pixel threshold are considered to belong to inactive regions of the detector
The pixel saturation value determines when a reflection is considered to be an overload The intensity of overloaded reflections isestimated by profile fitting but these reflections are rejected by the scaling program AIMLESS by default
Increasing the Maximum reflection width in φ from the default value of 5deg will reduce the number of rejected reflections (green boxes)and is worthwhile when the mosaicity is very high or the mosaic block size is very small As with the minimum spot separation theimage must be refreshed to see the effect of changing this parameter
The rejection criteria will reject reflections with too much variation in the background (BGRATIO) or where the gradient of thebackground plane is too large These should only be changed if many reflections are being rejected PKRATIO only applies to fullyrecorded reflections and reflects a very poor profile fit With current data collection protocols there will be very few (if any) fullyrecorded reflections
Additional MOSFLM parameters will be added based on user requests
98 Integrating multiple lattices
When multiple lattices have been successfully indexed each lattice can be integrated individually by selecting the appropriate latticenumber
Reflections in the chosen lattice that are overlapped by a reflection from another lattice will be integrated but the measurement box willbe expanded so that the total intensity of the two (or more) reflections is measured These reflections will be flagged for specialtreatment Reflections that are not overlapped are referred to as singletons They will be dealt with in the normal way by POINTLESSand AIMLESS
NOTE If more than one lattice has been indexed and the results of integrating just ONE of the lattices are to be checked byrunning QuickSymm or QuickScale then the multi-lattice icon in the Integration pane must be turned off otherwise an error
iMosflm Tutorial
fileUsersandrewg4MOSFLMnewgui_tutorialiMosflm_tutorial_720_ver3html[29052015 105311]
message will be given saying that all lattices must be integrated
It is often the case that by measuring both lattices (in separate integration runs) and inputting both MTZ files to QuickScale the overallcompleteness is high using ONLY the singletons To use this option ensure that the multi-lattice icon is off
To make use of the intensity estimates for overlapped reflections MTZ files for all lattices must be input to the program FECKLESSwhich will derive the best estimate of the summed intensity This is the default option if more than one lattice has been indexed and itrequires that all lattices have been integrated (in separate runs) prior to running QuickSymm or QuickScale (FECKLESS will be runautomatically)
At this time no downstream programs can make use of the summed intensities of overlapping reflections but in the future it should bepossible to use this data in REFMAC
Currently it is recommended to use only singletons from all the lattices FECKLESS is not required in this case
The MTZ filename is automatically updated to reflect which lattice has been chosen to avoid overwriting the MTZ file of the first latticewhen integrating the second one FECKLESS when run from iMosflm relies on this naming convention so do not change it
10 Running Pointless to check the symmetryOnce the images have been integrated (even a few degrees of data in many cases) the program POINTLESS can be run to determine thetrue Laue symmetry and try to determine the space group using the QuickSymm button
iMosflm Tutorial
fileUsersandrewg4MOSFLMnewgui_tutorialiMosflm_tutorial_720_ver3html[29052015 105311]
Select the QuickSymm button
A summary of the Pointless results as shown below will appear in a qtRView window
Various graphs (L test for twinning ViewHKL to view the reciprocal lattice) can also be viewed in this window
Various options for POINTLESS such as a reference MTZ file forcing the symmetry selected in iMosflm and specifying multiple input MTZfiles can be selected from the Settings -gt Processing options -gt Sort Scale and Merge tab (see below)
iMosflm Tutorial
fileUsersandrewg4MOSFLMnewgui_tutorialiMosflm_tutorial_720_ver3html[29052015 105311]
Caution The results can be ambiguous if run with a partial dataset Look in the logfile to see how many relfections are used totest each possible symmetry operator
11 Running Aimless to scale and merge the dataSelect the QuickScale button
This will first run POINTLESS then change the space group for the data to that selected by POINTLESS (unless the iMosflm symmetry isset to override POINTLESS) run AIMLESS to scale and merge the data in that space group and then run CTRUNCATE which calculates anumber of statistics from the intensity data The CCP4 UNIQUEIFY script will then be run which generates all the unique reflections forthat spacegroup to the resolution of the measured data and will flag reflections (5 by default but this can be changed) for use as theRfree set
AIMLESS can be run from the QuickScale button either treating anomalous data (the default) or ignoring anomalous data If onlyprocessing a few degrees of data it is usually better to ignore anomalous because especially for low symmetry cases no mergingstatistics may be given in AIMLESS
SCALA can be selected as an alternative to AIMLESS for scaling (not recommended)
There is limited control over running AIMLESS (see figure above) including re-setting resolution limits rejecting batches (images)changing the treatment for accepting partials changing the rejection criterion and changing the procedure for updating the standarddeviation estimates
iMosflm Tutorial
fileUsersandrewg4MOSFLMnewgui_tutorialiMosflm_tutorial_720_ver3html[29052015 105311]
The AIMLESS results will be displayed in the qtRView as shown below along with graphical output (see below) and the full log file canalso be examined
Aimless summary file
iMosflm Tutorial
fileUsersandrewg4MOSFLMnewgui_tutorialiMosflm_tutorial_720_ver3html[29052015 105311]
An example of the Aimless graphical output
The AIMLESS logfile can also be examined by selecting the Log File tab
12 History and mosflm log fileSelecting History allows the history of the session to be examined or by selecting the Log tab the full mosflmlp file can be viewed Themosflmlp file is also available in a time-stamped file mosflm_yyyymmdd_hhmmsslp (eg mosflm_20100518_131019lp) and can beread with a text editor
The History has a tree structure and will show when various parameters have been changed This has not been fully implemented and isnot generally useful
The logfile may provide useful clues when processing has failed
13 Warning MessagesAs already mentioned in Adding images sect3 and Integration sect9 warning messages are generated by MOSFLM during processing Atraffic light colour coding has now been assigned based on the warnings and is shown next to the Warnings box
A Red status implies a serious problem that will affect data quality and should be addressed
An Orange status implies minor issues that should be checked to see if things can be improved
A Green status means no significant problems messages are for information only
iMosflm Tutorial
fileUsersandrewg4MOSFLMnewgui_tutorialiMosflm_tutorial_720_ver3html[29052015 105311]
Abbreviated messages can be obtained by clicking on the Warnings icon The full warning Details together with Hints amp Notes text (ifany are available) can be obtained by double-clicking the relevant warning Details are displayed in a pop-up text box which willdisappear with the next click outside the box The same full details and suggestions are of course available in the mosflmlp files whereeven more information may be available
NOTE This is the end of the part of the tutorial which deals directly with iMosflm but see sect19 which has some suggestions forfurther work if you have time The remainder of this document deals with integrating and scaling data with MOSFLM andAimless via the CCP4i user interface examining the traditional mosflm SUMMARY file with the CCP4 utility loggraph
The Appendix contains a shell script for running MOSFLM as a traditional batch job
14 Useful command line optionsiMosflm has a number of command line options and these can be listed by typingimosflm --helpCurrent options are
--allimages -a ltfilenamegt Starts mosflm loading all files that match the template generated from ltfilenamegt--ccp4i2 Autosaves an iMosflm session file upon exit with an XML list of all iMosflm output files--debug -d Creates a large output file for debugging purposes Dont use this unless asked to by a developer--expert -e Permits access to advanced detector settings This should not normally be required--fastload -f Attempt to speed loading of many images offline while indexing two default images separated by 90 degrees--help -h Displays this message then exits--imagedir -I ltdirectorygt Starts the image browser in this directory if ltdirectorygt is given as an environment variable it will be expanded to its full value--init -i ltfilenamegt Starts Mosflm and reads from the given saved session file--startdir -S ltdirectorygt Starts mosflm in directory ltstartdirgt rather than the current directory This will only work if the directory exists and you have write permission to it otherwise iMosflm will exit All the normal mosflm output files will be in this directory--singleimage -s ltfilenamegt Starts mosflm loading only the image from ltfilenamegt--site -X ltfilenamegt Reads anyall of the following lines from the file given WAVELENGTH ltxgt DISPERSION ltxgt POLARISATION [PINHOLE | MIRRORS | MONOCHROMATOR | SYNCHROTRON ltxgt] DIVERGENCE ltxh xvgt BEAM ltbeamx beamygt DISTANCE ltxgt DISTORTION TILT ltxgt DISTORTION TWIST ltxgt GAIN ltxgt DETECTOR REVERSEPHI DETECTOR OMEGA ltxgt--version -v Displays the program version and required Mosflm version then exits
These can be abbreviated to the shortest unambiguous string
141 The site fileimosflm --site ltsitefilegt will read keywords from the file ltsitefilegt that will overwrite incorrect information in image headers Thissaves having to manually correct values in every iMosflm session The site file can also be read or written as an option from the Sessionmenu (see Drop down menus sect21) Allowed keywords areWAVELENGTH ltxgt
iMosflm Tutorial
fileUsersandrewg4MOSFLMnewgui_tutorialiMosflm_tutorial_720_ver3html[29052015 105311]
DISPERSION ltxgtPOLARISATION [PINHOLE | MIRRORS | MONO | SYNCHROTRON ltxgt]DIVERGENCE ltxh xvgtBEAM ltbeamx beamygtDISTANCE ltxgtDISTORTION TILT ltxgtDISTORTION TWIST ltxgtGAIN ltxgtDETECTOR REVERSEPHIDETECTOR OMEGA ltxgt
15 The mosflm SUMMARY fileMOSFLM produces a summary file listing refined parameters for each image and when using iMosflm this file will be date- amp time-stamped and have a name such as mosflm_20100518_131019sum This contains the same information as the plots produced by theiMOSFLM GUI which now also include the number of bad spots and overloads
This can be inspected graphically from the CCP4i GUI using the program loggraph Select the pull down menu View Files from Job andunder Output files select Additional log graphs where the _SUMMARYloggraph file will be listed Select this file to display its tablesin loggraph
This is very useful to identify rogue images (with unusually high positional residual or low Iσ(I)) If you find any read that image intoMOSFLM and see what is wrong with it
If you have done more than one integration run during your MOSFLM session you will find multiple entries of the tables Look at the lastset for integration of the 84 images
Click on the Refined detector parameter tables and check on the stability of parameters like the TILT and TWIST of the detector (unitsare hundredths of a degree) and for Mar Research (or DIP) image plate data the distortion parameters ROFF and TOFF (units are mm) Ifthey are varying a lot (more than 20 for TWISTTILT) or 015 for ROFFTOFF then it is probably a good idea to fix these parameters atthe average value (or the known values for this detector if they are available) (see Detector parameters sect821)
Click on the Post refinement table and check the missets It does not matter if they change slowly and by an amount (per image) that isless than 01mosaic spread If they are changing more than this then there could be a problem with processing the data (there is notmuch you can do about this)
Check how the mosaic spread is changing If it is unstable or if you think it is not refining to sensible values (as judged by looking atthe prediction) then you can fix the input value in the same way as the detector parameters (see Crystal parameters sect822)
BADSPOTS AND OVERLOADS
The program will set a rejection flag for those reflections that fail certain tests for example too much variation in the background levela poor profile fit an intensity that is very negative (more than 5 standard deviations) a very high gradient for the background planeThese reflections are called Bad spots and they are listed individually for each image in the mosflmlp file together with the reason forflagging them The number of bad spots is also written to the summary file Generally there should be very few (5-10) bad spots oneach image If there are more it could be because the backstop shadow is not correctly allowed for (consider using the NULLPIXkeyword)
There should also be very few overloaded reflections on each image If there are a lot then a separate low resolution data collectionpass should be made with a much shorter exposure time
IMPORTANT Both Bad spots and Overloads are written to the output MTZ file but will be rejected by default by AIMLESS Theintensity of overloaded reflections is estimated by profile fitting that part of the spot that is not saturated To include these reflections inthe final merged data use the ACCEPT keyword in AIMLESS
16 Scaling data with CCP4i ccp4i
Select Directories amp ProjectDir (top right)
In the new window select Add project
Enter the project name in the Project field and the full directory path in the uses directory field Default values may have been enteredalready here Select this project from Project for this session
Select Apply and Exit Dismiss the warning message that comes up
Select Data reduction from the pull down menu of modules (orange bar at top left)
iMosflm Tutorial
fileUsersandrewg4MOSFLMnewgui_tutorialiMosflm_tutorial_720_ver3html[29052015 105311]
Select Symmetry Scale Merge (Aimless)
In the window that appears do the following
Give a job title (top line)
Click on the box next to Separate anomalous pairs for outlier rejection amp merging statistics (the crystals have been soaked in a mercurycompound)
In the next orange bar (line starts HKLIN 1) select Browse and select the MTZ file output by MOSFLM (probably called hg_001mtz)Select OK
If you did not supply the Project name Crystal name or Dataset name to Mosflm fill in the boxes for these now
Under Scaling Protocol
From the pull-down menu on the line starting Scale select with automatic default settings
At the bottom of window from the pull-down menu named Run select RunampView Com File
This will display a new window showing the command file for running the POINTLESS step select Continue After a brief pause it willshow the command file for running AIMLESS (This can be edited before submitting the job) Select Continue
In the main window it will show that the AIMLESS job is running
When AIMLESS has finished the command file for running the CTRUNCATE step will appearselect Continue
When CTRUNCATE has run the main window will say FINISHED
At that point select the pull-down menu View Files from Job and select View Log Graphs This will give you the same graphs asrunning loggraph on the AIMLESS log file they are also the same as those that appeared in IMOSFLMs QuickScale task To look at thelog file itself (eg the overall merging statistics) select View Log File and it will appear in a new window
161 Looking at the AIMLESS output
The simplest way to look at the output from AIMLESS is to use loggraph on the AIMLESS log file (or via the CCP4i GUI) This can displaymany different graphs
Use Scales vs rotation range to check for smooth variation in the scale factor Check the variation in B factor with image and if there isno real variation it is best to turn off the B-factor refinement
Use the Analysis against all Batches for all runs to detect bad images (high R-factor large number of rejected spots)
Check the Analysis against resolution Fractional bias to see if there is any indication of Partial bias (A negative partial bias will resultif the mosaic spread is underestimated or if there is a lot of diffuse scatter
The Fractional bias should be less than 1-2 although it will often exceed this for weak data (eg in the high resolution bins)
The Axial reflections graphs in AIMLESS are useful for detecting systematic absences which can be used to identify the true spacegroup However the detection of screw axes is thought to be sufficiently robust in POINTLESS that these graphs are no longer necessary
It can also be useful to look at the AIMLESS log file itself in particular the table giving statistics as a function of resolution The effectiveresolution limit of the data can be estimated by looking at the Mn(I)sd column (this is the mean Iσ(I) AFTER merging symmetry matesand is the best indicator of data quality) This table also shows shell and cumulative R-factors
The Mn(I)sd values depend on having realistic values of the standard deviations (errors) in the intensities As the values that come fromMOSFLM are always underestimates of the true error these values are scaled up in AIMLESS using a three-term correction
sdcorrected = SdFac Sqrt[sd(I)2 + SdBLPI + (SdAddI)2]
Here SdFac is an overall scale factor and SdB and SdAdd are intensity dependent factors
AIMLESS will automatically work out a suitable value for all three parameters in order to make the mean value of (observedscatter)(sdestimate) equal to 10 where observed scatter is the difference between an individual estimate of intensity and the mean ofall other estimates (from symmetry mates)
Probably the best estimate of the true high resolution limit of the data can be obtained from the CC(12) values these are thecorrelations between equivalent observations that have been divided randomly into two half-datasets The resolution limit is foundwhen the CC drops below ~ 05 - 03
This table comes under the heading
ANALYSIS OF STANDARD DEVIATIONS
iMosflm Tutorial
fileUsersandrewg4MOSFLMnewgui_tutorialiMosflm_tutorial_720_ver3html[29052015 105311]
in the AIMLESS log file and Run n standard deviation v Intensity test (where n is 1 or more) in the CCP4i GUI View Files from Job -View Log Graphs display
Can you identify a bad image in this dataset Can you work out why it is bad
(Cluethe image headers contain quite a lot of information that is not used by MOSFLM including the date and time that the image wascollected)
You can exclude a given batch from the scaling using the EXCLUDE keyword
RUN ALL EXCLUDE imagenumber
In this case run number will be 1
Rerun the scaling SENDING THE OUTPUT TO A NEW LOGFILE excluding this image and see the effect on the heights in the anomalousPatterson (in the log file) DO NOT repeat the integration In the command file uncomment the line (near the top) goto aimless so itskips the integration part
In the CCP4i GUI click to highlight the AIMLESS job which is listed as FINISHED and select ldquoReRun Jobrdquo from the control buttons downthe right-hand side of the main interface window Under ldquoExcluded Datardquo in the window that appears check the box next to Excludeselected batches and pull-down on the menu button to exclude a range Give the start amp end range to exclude (eg 74 to 74) Rerunthe job as before
17 Changing the symmetryFrom the list of options at the left hand side of the main window select ldquoUtilitiesrdquo and under that SortModifyCombine MTZ Files
In the new window give a new title eg reindex as H32
Click on the Box Change space group andor reindex reflections
Use the browse option to select the input MTZ file (First orange bar) the output filename will be generated automatically (but you canchange it)
Under Reindex details
In the last option check the box next to ldquoChange space group tordquo and enter H32 in the box This is above the final item Reducereflections to the asymmetric unit which is checked by default
Select Run from the Run option button
Then go back to the scaling window and select the new MTZ file (reindexed) as the input for scaling (use Browse) CHANGE THE JOBTITLE
Then select RUN
The scaling will now be performed in space group H32 Look at the merging statistics in the log file in particular the multiplicityweighted R-factor called Rmeas in the log file
18 Looking at the CTRUNCATE outputThe CTRUNCATE program converts intensities to amplitudes and also compiles some useful statistics The LTEST and the cumulativeintensity statistics tabulated by CTRUNCATE (and plotted by loggraph) provide the only point at which you will be able to detectmerohedral twinning (when the two lattices of the twin components exactly overlap and every measured intensity is actually the sum oftwo intensities)
For a good dataset the observed distribution should be within 1 of the theoretical distribution Is this the case for this data
19 If you have time 191 Different mosaic spreads
Try repeating the processing with the mosaic spread set to a value 25 smaller than the refined one and fix it by checking the Fix boxin the Integration window in iMosflm
Can you tell from the merging statistics if this data is better
192 Checking up on outliers
iMosflm Tutorial
fileUsersandrewg4MOSFLMnewgui_tutorialiMosflm_tutorial_720_ver3html[29052015 105311]
AIMLESS writes a file called ROGUES which lists reflections which show very poor agreement between symmetry mates or which areimplausibly large
Look in this file (it is ASCII) and try to work out why this has happened The ROGUES file gives you the image (Batch) on which thereflections have been recorded (for partials this is the image nearest the centre of the reflection so you may need to look on thepreceding and following image as well) Select a reflection which shows very poor agreement with its symmetry mates (A value greaterthan 10 in the DelIsd column in the ROGUES file)
Select the offending image by double-clicking it in the Images pane of the iMosflm main window Predict the reflections then enter thehkl values into the boxes and hit Return (or click the red warning button following the entry box for l) to locate the offending reflectionin the image You must give the measured indices - the first set of values in the ROGUES file - when doing this See if there is anythingodd about the spot Remember to check adjacent images for partials
193 How accurate does the unit cell have to be
Try changing the cell parameters by (say) 10 and integrate the images again What is the effect on the merging statistics
20 Tips1 When reading images into a session DO NOT attempt to carry out any other task until ALL the images have been read2 It is often worth repeating the indexing (usually only once) as the refined direct beam coordinates from the first indexing may give
an improved solution when the indexing is repeated (lower rmsd)3 Always integrate a few degrees of data before integrating the whole dataset (see sect9) If the space group is not known in advance
run Quicksymm with a few degrees of data to check that the correct indexing solution has been chosen4 For difficult images do not attempt to refine the unit cell initially once an indexing solution has been obtained try integrating a
few images to ensure that the integration is stable If then going on to refine the cell check that the prediction looks OK for thefirst image of every segment included in the refinement If it does not look very good consider using the pattern matching(Settings -gt Processing options -gt Advanced refinement see sect84)
5 If the resolution of the data is less than 35 Aring do not use the ldquoRefine Cellrdquo task Instead use several images in indexing and use thecell that comes from the indexing
6 If iMosflm gets into a state where the activity icon(upper right) is spinning but nothing seems to be happening click on the activityicon to stop it spinning and see if the session can be continued DO NOT click on the activity icon simply to abort a task this willgive unpredictable results Use the Abort button for cell refinement or integration There is no defined way to abort indexing
7 Use the image summation option (see sect4) to get a better impression of the diffraction for very low exposure Pilatus images8 Use image summation for detector parameter refinement for fine sliced very weak Pilatus images (Settings -gt Processing options -
gt Advanced refinement see sect821)9 For large mosaic spread values (gt 10deg) or small mosaic block sizes (lt10) consider increasing the maximum allowed reflection
width to avoid having too many green predicted reflections (Settings -gt Processing options -gt Advanced integration see sect97)10 By default on selecting the Indexing task iMosflm will find spots index and (assuming a solution has been found) estimate the
mosaicity For difficult cases it is more useful to restrict this to simply finding spots and then do the indexing and mosaicityestimation by clicking the appropriate buttons To do this change the check box Automatically index after spot finding inSettings -gt Processing options -gt Indexing
11 See sect521 and sect522 for advice if the indexing fails Also consider the possibility of a reversed phi rotation direction if you arenot familiar with the beamline (Settings -gt Experiment settings -gt Experiment see sect21)
12 If the detector parameters have refined to physically unreasonable values (eg because cell refinement or integration has beencarried out using an incorrect indexing solution) be sure to reset the detector parameters before attempting further processing(Settings -gt Experiment settings -gt Detector see sect21)
13 Always set the resolution limit slightly beyond the point at which any spots are visible (see sect414 ) For very weak fine-sliceddata it can be very difficult to estimate the resolution visually so integrate to the maximum resolution (inscribed circle) and usethe merging results to set the final resolution There should be no problems integrating to a resolution ~03-05 Aring beyond theactual resolution limit but for example integrating to 3 Aring when the true resolution limit is 5-6 Aring may cause problems and theintegration should then be repeated with a more realistic resolution limit
14 Use the site file sect141 if repeatedly processing data where the direct beam position is wrong or if the phi direction is reversed etcto save having to correct this for every session
Appendix IA command script for running MOSFLM using the keywords copied from the Batch processing window of the new GUI (see Integratingas a background job sect952) Note that keyworded input for MOSFLM and other CCP4 programs is case-insensitive apart from file anddirectory names
bincsh -fv Set a unique identifier for filenames for this job
set ident = x89_mos07_blk3_smallsep
iMosflm Tutorial
fileUsersandrewg4MOSFLMnewgui_tutorialiMosflm_tutorial_720_ver3html[29052015 105311]
$ipmosflm COORDS $identcoords SUMMARY $identsummary ltlt eof-ip Insert keywords copied from iMosflm batch window here
Keywords for this run For example could involve trying different values for mosaic spread or not integrating all images etc etchklout $identmtzgenfile $identgenprocess 1 1000 goeof-ip
pointlesspointless hklin $identmtz hklout $ident_pointlessmtz
aimlessaimless hklin $ident_pointlessmtz hklout $ident_aimless_partmtz ROGUES $identrogues ltlt eof-aimless Use all default options for aimlesseof-aimless
ctruncate hklin $ident_aimlessmtz hklout $ident_truncatemtz
Harry Powell Andrew Leslie and Owen Johnson
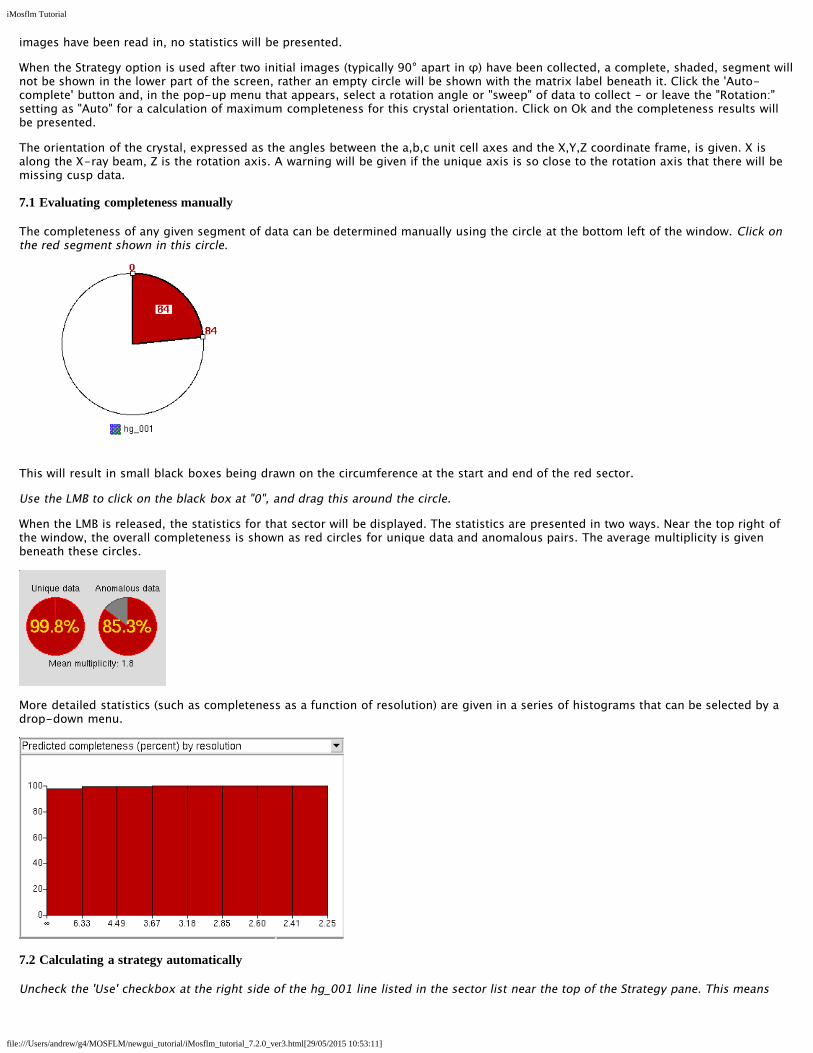
iMosflm Tutorial
fileUsersandrewg4MOSFLMnewgui_tutorialiMosflm_tutorial_720_ver3html[29052015 105311]
images have been read in no statistics will be presented
When the Strategy option is used after two initial images (typically 90deg apart in φ) have been collected a complete shaded segment willnot be shown in the lower part of the screen rather an empty circle will be shown with the matrix label beneath it Click the Auto-complete button and in the pop-up menu that appears select a rotation angle or sweep of data to collect - or leave the Rotationsetting as Auto for a calculation of maximum completeness for this crystal orientation Click on Ok and the completeness results willbe presented
The orientation of the crystal expressed as the angles between the abc unit cell axes and the XYZ coordinate frame is given X isalong the X-ray beam Z is the rotation axis A warning will be given if the unique axis is so close to the rotation axis that there will bemissing cusp data
71 Evaluating completeness manually
The completeness of any given segment of data can be determined manually using the circle at the bottom left of the window Click onthe red segment shown in this circle
This will result in small black boxes being drawn on the circumference at the start and end of the red sector
Use the LMB to click on the black box at 0 and drag this around the circle
When the LMB is released the statistics for that sector will be displayed The statistics are presented in two ways Near the top right ofthe window the overall completeness is shown as red circles for unique data and anomalous pairs The average multiplicity is givenbeneath these circles
More detailed statistics (such as completeness as a function of resolution) are given in a series of histograms that can be selected by adrop-down menu
72 Calculating a strategy automatically
Uncheck the Use checkbox at the right side of the hg_001 line listed in the sector list near the top of the Strategy pane This means
iMosflm Tutorial
fileUsersandrewg4MOSFLMnewgui_tutorialiMosflm_tutorial_720_ver3html[29052015 105311]
that the 84 images used thus far will not be included in the completeness calculation only the matrix derived from indexing them willbe used Select the Auto-complete button to calculate a strategy automatically
A strategy calculation data pop-up window will appear
If multiple matrices have been defined (for different sectors of data) then the appropriate one can be selected (if there is only one sectorthis has no effect)
The total φ rotation to be used is normally calculated by MOSFLM based on the Laue group and the crystal orientation (the Auto setting)However it is sometimes possible to achieve a high completeness with a significantly smaller total rotation (eg 60deg in two 30degsegments will typically give gt94 completeness for orthorhombic space groups) and this can sometimes be useful if radiation damage isa serious problem although when using hybrid pixel detectors it is better to use a very conservative exposure time and collect a wide φrotation
Total rotation angles of between 5deg and 90deg can be selected from the drop-down list The number of segments to be used can be setbetween 1 and 3
If the check box is checked data completeness will be calculated to optimize the proportion of anomalous data collected
THIS IS IMPORTANT The optimum strategy is often different when maximising completeness of the anomalous data
Choose the default values (Rotation Auto Segments 1) but check the anomalous data box then click on Ok Look at the variousstatistics presented as bar charts
In space group H3 if rotating around the c axis a total rotation of 120deg would be required to collect a complete dataset (ignoring anydata lost in the cusp) Because the c axis is 22deg away from the rotation axis in this case it is possible to collect very high completeness(for unique data) with a rotation much smaller than this
Try to find the minimum total rotation that will give a dataset that is gt95 complete for the unique data Now do the same butrequiring gt95 completeness for the anomalous data
SKIP OVER SECTION 73 IF DOING THE NORMAL TUTORIAL
73 Calculating a strategy using multiple crystals
The Strategy pane may also be used when due to radiation damage many crystals are required to collect a complete dataset
IMPORTANT This procedure will only work correctly for space groups where there is no indexing ambiguity For those spacegroups where there is an indexing ambiguity( see httpwwwccp4acukdisthtmlreindexinghtml for a complete list) it isnecessary to integrate images to determine whether different crystals have been indexed in the same way This is not achievablewithin the Strategy option at present
Suppose the first crystal has been indexed from the reference images
Enter the Strategy pane an empty circle is displayed in the bottom part of the screen and click on the Auto-complete button nearthe top-right of the pane In the Auto-complete window that appears choose a suitable Rotation angle for the amount of datathat can be collected from one crystal say 20 degrees for this example Leave Segments set to 1 and do not check Optimize foranomalous data
Click the Ok button and the completeness of the data will be displayed The matrix name start and end phi values and the phiextent will be displayed in the top area of the pane with a checkbox ticked under the Use column This means this segment will beused in further strategy calculations
Accept and save this result by clicking on the yellow hatched segment displayed in the large circle near the bottom of the paneClick once and the segment will be outlined in black (you can adjust the start or end phi value calculated in one degree incrementsby click+dragging the respective black square) click again this time on the black square denoting the start or end phi (or release ifyou have adjusted by click+dragging) and the segment will turn red The segment will not be saved unless it has turned red
This result will be saved if you leave this pane (eg to load more images) and return later in this session The strategy file can alsobe saved to a permanent file using the Save button on the tool-bar This is highly recommended when working with many crystals
Return to the Strategy pane when you have loaded and indexed the reference image(s) from the second crystal and repeat the procedureabove You will see the calculated segment from the first matrix displayed at the bottom-left of the screen The optimum phi range for
iMosflm Tutorial
fileUsersandrewg4MOSFLMnewgui_tutorialiMosflm_tutorial_720_ver3html[29052015 105311]
the second crystal will be displayed Save this in the same way as for the first crystal (clicking twice) Repeat this procedure for anysubsequent crystals and in each case the optimum phi range will be calculated for the latest crystal taking into account the data fromprevious crystals
It is a good idea to save the strategy to a file as each new crystal is added in case the program crashes and this information is lost
In practice it is probably safest to have a separate iMosflm session that is reserved for the strategy calculations and not used to processany data The strategy for each new crystal can be calculated as described above If there is a problem and the session is corrupted or ifiMosflm is closed down for any reason it is straightforward to restore the status of the session providing the strategy has been savedThe following steps should be taken
1 Read in the reference images for the latest crystal and index them
2 Select the Strategy pane
3 Read in the optimised strategy for all previous crystals using the ldquoAddrdquo button and giving the appropriate filename
4 Making sure that the circle for the latest crystal is highlighted in the lower left window click on lsquoAuto-completersquo and follow the stepsdescribed above
Advanced Usage
The startend phi values for each crystalmatrix can be updated This might be required if for example only 10 degrees of useful datawere collected from a particular crystal instead of the anticipated 20 degrees To change the phi values click either on the matrix namein the top pane or on the circle showing the segment of data in the lower left pane (these are highlighted in a blue box as the mousemoves over them) The corresponding segment will now be displayed in the larger circle Click on the red segment so that a blacksquare appears at the startend phi values Then simply drag the appropriate phi to the desired value The completeness willautomatically be updated (but the strategy calculation for the latest crystal will not be repeated to do this the current segment must bedeleted by highlighting the matrix name and using right click and then repeating the Auto-complete step)
If matrix files saved from iMosflm are available from crystals for which data have been collected in previous sessions these can beadded into the calculation using the Add matrix button on the tool-bar
If the saved strategy result has become complicated or is incorrect and you wish to restart the calculations afresh there is a tool-barbutton Reload sectors from session This will remove any calculated sectors while leaving any known matrices listed at the bottom-leftof the Strategy pane
If you have saved a strategy file from a previous session this can be used to re-initialize the Strategy pane using the Load button onthe tool-bar
A Spacegroup pull-down menu has been added to the tool-bar to permit different choices of space group to be used in thecalculations (eg H3 and H32) This menu is populated from the list offered on the Indexing pane However the space group symboltext is editable Any space group symbol entered will be validated by Mosflm together with the current cell parameters
As a calculator for a multi-segment strategy the Strategy pane is reasonably flexible you can Save or Delete highlighted matrix lines byright-clicking As you highlight different matrix lines the orientation of the crystal expressed as the angles between the abc unit cellaxes and the XYZ coordinate frame is re-displayed in the centre of the pane
The following screen shot shows the cumulative results in the Strategy pane after this procedure has been followed for four crystals(ignore the iMosflm version number)
iMosflm Tutorial
fileUsersandrewg4MOSFLMnewgui_tutorialiMosflm_tutorial_720_ver3html[29052015 105311]
731 Calculating a strategy when some data have already been collected and processed
This option is not yet implemented If data have already been processed (to give an MTZ file) but the images are not currently available (eg they were collected on a previoussynchrotron trip possibly at a different synchrotron) then the MTZ file containing this data can be read and used to calculate a strategyfor data collection from new crystalsThe MTZ icon in the tool bar is used to read the MTZ file
74 Calculating a suitable oscillation angle
To calculate the maximum possible oscillation angle while avoiding spatial overlaps click on the Check for overlaps button A pop-upwindow will appear from which the option to calculate the maximum oscillation angle (as a function of φ) or check how many overlapswill occur for different (user selected) oscillation angles The results are plotted in the same pane as the histograms for the strategycalculations Note that the overlap calculation is based on the current values for the mosaic spread and spot separation and can be verysensitive to these values Note also that these are maximum and not necessarily recommended oscillation angles
iMosflm Tutorial
fileUsersandrewg4MOSFLMnewgui_tutorialiMosflm_tutorial_720_ver3html[29052015 105311]
8 Cell refinementIt is important to determine the cell parameters accurately before integrating the images Although the unit cell is refined as part of theautoindexing providing the diffraction extends beyond ~35Å resolution it is possible to obtain more accurate cell parameters using aprocedure known as post-refinement This procedure requires the integration of a series of images in ideally two or more separatesegments at widely different φ values The distribution of the intensity of partially recorded reflections over the images on which theyoccur is used to refine the unit cell crystal orientation and mosaic spread
Select the Cell Refinement icon
81 Selecting the images
iMosflm Tutorial
fileUsersandrewg4MOSFLMnewgui_tutorialiMosflm_tutorial_720_ver3html[29052015 105311]
There are several ways to select the images to be used in cell refinement Whichever method is used the image numbers will bedisplayed in the Images entry field iMosflm will automatically select appropriate images but these can be changed
811 Manual selection
A list of images can simply be typed into this box An image series can be specified as n-m where n and m are the first and last imagesDifferent series must be separated by white space or comma
For orthorhombic or higher symmetries two segments should be given approximately 90deg apart in φ For monoclinic or triclinic datathree or four segments are best (eg φ = 04590135)
The number of images that should be included in each segment depends on the mosaic spread and oscillation angle A reasonablenumber is 2(mosaic spreadoscillation angle +1) MOSFLM will automatically select two or more segments as appropriate Note thatthere is a limit on the total number of images that can be used
812 Automatic selection
Selecting the Automatically select images icon will select a suitable set of images
813 Graphical selection (Not recommended)
Selecting this icon will give a new window
Images can be selected by clicking in the Use check-box in the list of images or by using the mouse to drag a selection of imagesfrom the sector displayed The other icons allow the sector to be zoomed in or out and the viewed area to be moved to make theselection easier The final two icons on the tool-bar switch the segment display to fit the display space as either a full circle or aquadrant This Image palette can be closed by clicking outside its area but will close after 60 seconds anyway
82 Integrating the images and refining the cell
Use one of the methods above to select images to use in cell refinement and click on the Process button Before starting cell refinementcheck that the prediction for the first image in each segment to be used is good The majority of the spot positions must be correctlypredicted for the first image in each segment or else the refinement will not work
The selected images will be integrated and following integration the cell parameters are refined Selectable refined detector parameters
iMosflm Tutorial
fileUsersandrewg4MOSFLMnewgui_tutorialiMosflm_tutorial_720_ver3html[29052015 105311]
will be plotted as will the changes in crystal orientation and (if selected) mosaic spread If the shift in cell parameters is greater than 25standard deviations another cycle of integration and cell refinement is carried out Typically two or three cycles are required forconvergence Note that the current program activity is shown in the bottom left-hand corner of the window in the status message area
The different windows are explained below Moving the mouse over any parameter or plotted graph point will give a full description ofit
821 The detector parameters window
The values of the refined detector parameters are displayed for each image as it is integratedThere is the option to fix any of the parameters during integration by checking the Fix box onthe right The positional residuals (overall central and weighted) are also listed
Any of these parameters can be selected for plotting on the graph that appears to the right ofthis box by simply clicking on that parameter (which is then highlighted in blue as shown herefor Beam x and Beam y)
Check the stability of the refined parameters by displaying the appropriate graphs To getsensible scaling of the graphs only parameters with similar numerical values should be plottedtogether
For weak images (ie few visible spots in the outer regions of the image) the tilt and twistmay not be well defined and might refine to large values (greater than one degree) Insuch cases these parameters should be fixed It is not generally recommended to fix any
iMosflm Tutorial
fileUsersandrewg4MOSFLMnewgui_tutorialiMosflm_tutorial_720_ver3html[29052015 105311]
other detector parameters
For very weak fine sliced images (Pilatus only) there is the option to sum images when findingsuitable spots for refinement see Settings -gt Processing Options -gt Advanced refinementwhich can in some cases make the refinement more stable
822 The crystal parameters window
The values of the refined crystal missetting angles φ(x) φ(y) φ(z) the unit cell parameters andmosaic spread for the current image are displayed in the table Selected parameters will beplotted as for the detector parameters Specific unit cell parameters can also be fixed
If more than one segment of data is being used for cell refinement it is not unusual to see achange in orientation of the crystal between the two segments
Observe how the crystal orientation is different for images in the two segments See how themosaic spread varies during refinement
823 The central spot profile
The average spot profile for the central region of the detector is plotted for eachimage This confirms that the spot prediction is good If the profile is not welldefined and central in the box or if the blue border for the peak region of the spot ismuch larger than the apparent spots size it suggests a problem with the integrationand the initial prediction should be checked In some cases it may be necessary toincrease or decrease the Profile Tolerance parameters to ensure that the blue boxfits the spot To do this select the Advanced integration tab of Processing optionsCheck the central spot profiles for the images used in the cell refinement
824 The summary window
This window presents a summary of how selected parameters have changed indifferent cycles of the cell refinement The behaviour of these parameters gives agood indication of whether the cell refinement has been successful
If the refinement has been successful the RMS residual should be lower for thefinal cycle than in previous cycles However errors in the cell can be compensatedquite well by changing the crystal to detector distance so the differences are notalways dramatic
The other parameters that can be plotted from the pull-down list are the detectordistance and the Pixel ratio (Yscale)
The detector distance should be the same for all images in the refinement If the original indexing was based on auto-indexing a singleimage (say the first) then the detector distance might change for images from the second segment to compensate for an error in theoriginal cell If the variation in distance for different images increases with the cycle number this indicates that the refinement is notstable
The Pixel ratio (Yscale) parameter may also show an initial variation for images in different segments because refining Yscale (whichshould be 10000 for all except Raxis II and Raxis HTC detectors) can compensate for errors in cell dimensions in the same way that thedistance can The final values (last cycle) should be very close to identical for all images and should also be very close to unity (to within00010)
Cell refinement can be unstable if the data do not extend to at least 35 Aring If it appears unstable use the cell derived from auto-indexing a series of images well spaced in φ instead
iMosflm Tutorial
fileUsersandrewg4MOSFLMnewgui_tutorialiMosflm_tutorial_720_ver3html[29052015 105311]
Examine the plots to see if the parameters are stable and correct (Yscale)
825 The final results
When refinement has converged (or after 5 cycles) the initial and final cell parameters and the estimated errors (std dev) are listed
If time is available make a note of the std dev values and repeat the cell refinement using a larger number of images in each segmentAre the standard deviations smaller when using more images
83 Refining cell parameters for multiple lattices
Providing the resolution is high enough (generally better than ~35-32 Aring) and not too many of the spots in the different lattices areoverlapped it is possible to refine the cell parameters for each lattice individually The lattice to be refined is selected from the Latticeselector
This selector will be grayed out when processing a single lattice
84 If the prediction for the first image of a segment is poor
In some cases depending on how the indexing has been carried out or if the diffraction is poor or there has been a large change incrystal orientation during the data collection the prediction for one or more of the segments (the first image) may be poor In suchcases the integration and hence the cell refinement may fail It may be possible to successfully process the images after an initialrefinement of the crystal orientation using a pattern matching algorithm To select this option got to the Advanced refinement tab ofProcessing options and select the tick box for Refine orientation of first image in any run by pattern matching and for Integrate allimages Then refine the cell in the usual way During integration the orientation will be refined for the first image of each segmentoutput for this additional refinement will be written to the logfile but is not shown in the GUI
9 IntegrationThe accurate cell parameters are now used in the integration Note that although the images are integrated during the cell refinementthe intensities are not saved and no MTZ file is generated at that stage
It is good practice to start by integrating a block of images corresponding to a few degrees of data to check that the parameters do notneed further adjustment MOSFLM will generate warning messages after integration if there are any difficulties and it may be possibleto improve the situation by changing some of the default parameters (see Warning messages sect13)
Before integration ensure that the backstop shadow has been defined (see Masked areas backstop sect411 and Masked areas generalsect412)
91 Image selection
Image selection is performed in exactly the same way as in the cell refinement In this case the Automatic selection will simply includeall images in the current sector
Select images 1-10
92 Setting the MTZ filename and controlling updating of the image display
Two icons appear when the integration option is chosen
If the Show predictions icon is clicked the display window will be updated as eachimage is processed This will slow down the processing but allows the accuracy of theprediction to be checked for each image
iMosflm Tutorial
fileUsersandrewg4MOSFLMnewgui_tutorialiMosflm_tutorial_720_ver3html[29052015 105311]
Click on this icon so that the display will be updatedThe filename of the MTZ file containing the results of the integration is generatedautomatically but can be edited manually
93 Integrating the images
Click on the Process button to start integration
Integration of the images occurs in two passes In the first pass for each block of images (a number corresponding to a few degrees ofdata selected automatically by MOSFLM) the detector and crystal parameters are refined for each image in turn and the measurementboxes for all predicted spots are written to a file for use in the second pass In the second pass the standard profiles are formed fromreflections present on all of the images in this block and each image is then integrated and the results written to the MTZ file Thedisplay is not updated during the second pass and will remain on the last image of the block (assuming image updating has beenselected)
Note that the unit cell dimensions are normally fixed during integration and only the crystal orientation and mosaic spread are refinedCrystal parameter refinement only starts when a sufficient number of images have been integrated to provide data for the post-refinement typically after ~05-1 degree (more for high mosaicity)
94 Parameter display windows
As described in sect82 the refined detector and crystal parameters will be displayed in tables and selected parameters will be plotted ingraphs The average spot profile for each image will also be displayed
The size of these graphs (and the profile) can be expanded to fill the whole window by holding down Shift and clicking LMB anywherein the graph window A second Shift+click will revert the graph to the original size
In addition to these windows there are windows that tabulate and plot (as a function of image number) the mean Iσ(I) for profile fittedand summation integration intensities The overall values and the values for the highest resolution bin are given
The number of overloaded reflections Bad spots (ie those that fail certain tests see mosflm SUMMARY file sect15) Spatial overlaps andif processing multi-lattice images the number of lattice overlaps is listed for each image and can be plotted by highlighting thatparameter When processing data from crystals with large unit cells it is important to watch out for spatial overlaps (see sect97 for tips onhow to reduce the number of spatial overlaps if this is a problem)
A display of the standard profiles for different regions of the detector is also provided Poor profiles are averaged by includingreflections from inner regions of the detector Averaged profiles are indicated by a red line around the spot (rather than blue) Theoriginal unaveraged profile can be viewed a clicking on the profile (providing there were sufficient spots in that region to allowformation of a profile)
The profiles should be checked to see that they are well defined and centred within the box Poorly-defined diffuse or non-centredprofiles may suggest that the prediction is not very good in which case this should be checked on the corresponding image(s)
It may be useful to expand the standard profiles to fill the window using Shift + click in the profiles window
Finally the lower left window plots Iσ(I) as a function of resolution for any selected image
iMosflm Tutorial
fileUsersandrewg4MOSFLMnewgui_tutorialiMosflm_tutorial_720_ver3html[29052015 105311]
Different parameters can be plotted by selecting the small right- or left-pointing arrows on the title line above the plot
95 Integrating the whole datasetAssuming that everything looks OK the entire dataset can now be integrated However it is strongly recommended thatProjectCrystalDataset names are assigned first These are written to the output MTZ file and used by downstream programs inparticular AIMLESS will use this information when deciding which images belong to the same dataset
Select Experiment settings from the Settings drop-down menu (see Drop down menus sect21) to enter these names and optionally givea title for the MTZ file
Select images 1-84 and click on Process
951 Parallel Integration Using multiple cores
An option is available on the pull-down menu (next to the Process button in the Integration task) which splits up the integration jobover available cores on the local machine All aspects are currently determined automatically at present user-configurable options willbe available in a later version The algorithm used is as follows
iMosflm determines the number of cores available on the local machineIf the number of cores (N) is greater than 2 iMosflm splits the integration run into N-1 batches (up to a maximum of 16) containingapproximately the same number of images If N le 2 iMosflm splits the run into N batches
If the total number of images in each batch is less than 32 the number of batches is decreased until this condition is satisfied
The first batch is submitted as a background task consisting of a refinement stage and an integration stage with its input and outputfiles (including the MTZ file) in a new directory its name being determined from the number of segments of data being integrated andthe lattice number (if the sample has been determined to contain multiple lattices) If the directories exist already they are all movedinto a newly-created directory with a time-stamped name the files from the most recent integration run are thus in directories withnames following the pattern described above Once the refinement stage is complete the refined parameters are written to a file
The launch of subsequent batches are delayed until the corresponding preceding batch has written its refined parameters This file isread and the new batch is launched again with a refinement stage and integration stage
At present the job cannot be aborted once it has started
952 Integrating as a background job
By selecting Batch in the drop-down menu adjacent to the Process button the integration can be run as a background job rather thaninteractively and the GUI can be used to look at a different dataset
Selecting Batch from the drop-down menu will display a new window showing the script that will be used to process the images alongwith a number of processing options The script can be edited if additional keywords are required or if some parameters are to bechanged and can also be copied and pasted into a file for off-line processing
By default the job is divided into batches across multiple cores as determined for the parallel integration described in sect951 but thenumber of cores can be chosen by the user from a drop-down menu in this case the size of each batch is determined by the interface
Plotting the results of the integration can be turned off this can make processing much faster
iMosflm Tutorial
fileUsersandrewg4MOSFLMnewgui_tutorialiMosflm_tutorial_720_ver3html[29052015 105311]
It is possible to configure job submission for remote machines (which can be added by depressing the add host button) Ensure youhave enabled passwordless logins for all the remote machines you enter and that you specify the full path to the Mosflm executable inthe Batch destinations window The remote working directory (in which the log and MTZ files are written) and the remote imagedirectory must both be specified with their full path names Any required parameter fields that are not completed by the user arehighlighted in orange if the user tries to submit a job without completing these fields a new window containing only those fields (againhighlighted in orange) pops up with a request to do so
The number of cores available on the selected host can be determined by depressing the apple core button on the Batch destinationsconfiguration window
The log file for batch submission jobs the MTZ and SUMMARY files are written to the directory in which iMosflm was launched
96 Checking the integration
iMosflm Tutorial
fileUsersandrewg4MOSFLMnewgui_tutorialiMosflm_tutorial_720_ver3html[29052015 105311]
The detector and crystal parameter plots should be examined carefully to check for any instability in the refinement If there are largeand random variations in some parameters (eg the detector twist and tilt) then it may be better to fix them and repeat the integration
For cases (eg very small unit cells) where there are very few suitable reflections on each image the refinement of the missetting anglesmay show significant variations from one image to the next In such cases it is best to apply smoothing to the missetting angles usingthe tick box in Settings -gt Processing options -gt Advanced Refinement
Discontinuities due to blank images should also show up and the offending images should be removed from the scaling run
If adjacent spots are incompletely resolved on the detector it may be possible to improve the processing by increasing the PROFILETOLERANCE parameters by 1-2 These parameters can be set in the Advanced integration tab of the Processing options menu (useSettings)
97 Advanced features for integration
The Settings -gt Processing options menu allows additional control over the integration Parameters such as the minimum spotseparation resolution limits excluded resolution ranges block size MTZ filename and BATCH ADD can be changed in the Processingtab
Manually decreasing the minimum spot separation can help if a large number of reflections are flagged as spatially overlapped (redboxes) The prediction must be updated to see the effect of changing the separation this can be done either by displaying the next orprevious image or double clicking on the blue circle next to the image currently displayed in the Images pane
In the Advanced integration tab the measurement box parameters profile tolerance and profile averaging parameters can be set
The measurement box parameters can be adjusted for rare cases where the estimation of the spot size has not worked correctlyresulting in a box that is too small or too large The optimisation of the background rim and corner cutoff parameters that determinewhich pixels are used for the background and which pixels for the peak can also be turned off but this is generally not recommended
Increasing the profile tolerance can help in cases where adjacent spots are not completely resolved this can be judged by examining thestandard profiles By default the profile tolerance is automatically increased if there are a large number of spatial overlaps as this hasthe effect of reducing the minimum spot separation A message will be written to the logfile if this has happened This option can beturned off using the tick box Optimise profile tolerance values to avoid spot overlap
The profile outlier exclusion parameters control the exclusion of ice spots or hot pixels which could otherwise corrupt the standardprofiles
Pixels with a value less than the Null pixel threshold are considered to belong to inactive regions of the detector
The pixel saturation value determines when a reflection is considered to be an overload The intensity of overloaded reflections isestimated by profile fitting but these reflections are rejected by the scaling program AIMLESS by default
Increasing the Maximum reflection width in φ from the default value of 5deg will reduce the number of rejected reflections (green boxes)and is worthwhile when the mosaicity is very high or the mosaic block size is very small As with the minimum spot separation theimage must be refreshed to see the effect of changing this parameter
The rejection criteria will reject reflections with too much variation in the background (BGRATIO) or where the gradient of thebackground plane is too large These should only be changed if many reflections are being rejected PKRATIO only applies to fullyrecorded reflections and reflects a very poor profile fit With current data collection protocols there will be very few (if any) fullyrecorded reflections
Additional MOSFLM parameters will be added based on user requests
98 Integrating multiple lattices
When multiple lattices have been successfully indexed each lattice can be integrated individually by selecting the appropriate latticenumber
Reflections in the chosen lattice that are overlapped by a reflection from another lattice will be integrated but the measurement box willbe expanded so that the total intensity of the two (or more) reflections is measured These reflections will be flagged for specialtreatment Reflections that are not overlapped are referred to as singletons They will be dealt with in the normal way by POINTLESSand AIMLESS
NOTE If more than one lattice has been indexed and the results of integrating just ONE of the lattices are to be checked byrunning QuickSymm or QuickScale then the multi-lattice icon in the Integration pane must be turned off otherwise an error
iMosflm Tutorial
fileUsersandrewg4MOSFLMnewgui_tutorialiMosflm_tutorial_720_ver3html[29052015 105311]
message will be given saying that all lattices must be integrated
It is often the case that by measuring both lattices (in separate integration runs) and inputting both MTZ files to QuickScale the overallcompleteness is high using ONLY the singletons To use this option ensure that the multi-lattice icon is off
To make use of the intensity estimates for overlapped reflections MTZ files for all lattices must be input to the program FECKLESSwhich will derive the best estimate of the summed intensity This is the default option if more than one lattice has been indexed and itrequires that all lattices have been integrated (in separate runs) prior to running QuickSymm or QuickScale (FECKLESS will be runautomatically)
At this time no downstream programs can make use of the summed intensities of overlapping reflections but in the future it should bepossible to use this data in REFMAC
Currently it is recommended to use only singletons from all the lattices FECKLESS is not required in this case
The MTZ filename is automatically updated to reflect which lattice has been chosen to avoid overwriting the MTZ file of the first latticewhen integrating the second one FECKLESS when run from iMosflm relies on this naming convention so do not change it
10 Running Pointless to check the symmetryOnce the images have been integrated (even a few degrees of data in many cases) the program POINTLESS can be run to determine thetrue Laue symmetry and try to determine the space group using the QuickSymm button
iMosflm Tutorial
fileUsersandrewg4MOSFLMnewgui_tutorialiMosflm_tutorial_720_ver3html[29052015 105311]
Select the QuickSymm button
A summary of the Pointless results as shown below will appear in a qtRView window
Various graphs (L test for twinning ViewHKL to view the reciprocal lattice) can also be viewed in this window
Various options for POINTLESS such as a reference MTZ file forcing the symmetry selected in iMosflm and specifying multiple input MTZfiles can be selected from the Settings -gt Processing options -gt Sort Scale and Merge tab (see below)
iMosflm Tutorial
fileUsersandrewg4MOSFLMnewgui_tutorialiMosflm_tutorial_720_ver3html[29052015 105311]
Caution The results can be ambiguous if run with a partial dataset Look in the logfile to see how many relfections are used totest each possible symmetry operator
11 Running Aimless to scale and merge the dataSelect the QuickScale button
This will first run POINTLESS then change the space group for the data to that selected by POINTLESS (unless the iMosflm symmetry isset to override POINTLESS) run AIMLESS to scale and merge the data in that space group and then run CTRUNCATE which calculates anumber of statistics from the intensity data The CCP4 UNIQUEIFY script will then be run which generates all the unique reflections forthat spacegroup to the resolution of the measured data and will flag reflections (5 by default but this can be changed) for use as theRfree set
AIMLESS can be run from the QuickScale button either treating anomalous data (the default) or ignoring anomalous data If onlyprocessing a few degrees of data it is usually better to ignore anomalous because especially for low symmetry cases no mergingstatistics may be given in AIMLESS
SCALA can be selected as an alternative to AIMLESS for scaling (not recommended)
There is limited control over running AIMLESS (see figure above) including re-setting resolution limits rejecting batches (images)changing the treatment for accepting partials changing the rejection criterion and changing the procedure for updating the standarddeviation estimates
iMosflm Tutorial
fileUsersandrewg4MOSFLMnewgui_tutorialiMosflm_tutorial_720_ver3html[29052015 105311]
The AIMLESS results will be displayed in the qtRView as shown below along with graphical output (see below) and the full log file canalso be examined
Aimless summary file
iMosflm Tutorial
fileUsersandrewg4MOSFLMnewgui_tutorialiMosflm_tutorial_720_ver3html[29052015 105311]
An example of the Aimless graphical output
The AIMLESS logfile can also be examined by selecting the Log File tab
12 History and mosflm log fileSelecting History allows the history of the session to be examined or by selecting the Log tab the full mosflmlp file can be viewed Themosflmlp file is also available in a time-stamped file mosflm_yyyymmdd_hhmmsslp (eg mosflm_20100518_131019lp) and can beread with a text editor
The History has a tree structure and will show when various parameters have been changed This has not been fully implemented and isnot generally useful
The logfile may provide useful clues when processing has failed
13 Warning MessagesAs already mentioned in Adding images sect3 and Integration sect9 warning messages are generated by MOSFLM during processing Atraffic light colour coding has now been assigned based on the warnings and is shown next to the Warnings box
A Red status implies a serious problem that will affect data quality and should be addressed
An Orange status implies minor issues that should be checked to see if things can be improved
A Green status means no significant problems messages are for information only
iMosflm Tutorial
fileUsersandrewg4MOSFLMnewgui_tutorialiMosflm_tutorial_720_ver3html[29052015 105311]
Abbreviated messages can be obtained by clicking on the Warnings icon The full warning Details together with Hints amp Notes text (ifany are available) can be obtained by double-clicking the relevant warning Details are displayed in a pop-up text box which willdisappear with the next click outside the box The same full details and suggestions are of course available in the mosflmlp files whereeven more information may be available
NOTE This is the end of the part of the tutorial which deals directly with iMosflm but see sect19 which has some suggestions forfurther work if you have time The remainder of this document deals with integrating and scaling data with MOSFLM andAimless via the CCP4i user interface examining the traditional mosflm SUMMARY file with the CCP4 utility loggraph
The Appendix contains a shell script for running MOSFLM as a traditional batch job
14 Useful command line optionsiMosflm has a number of command line options and these can be listed by typingimosflm --helpCurrent options are
--allimages -a ltfilenamegt Starts mosflm loading all files that match the template generated from ltfilenamegt--ccp4i2 Autosaves an iMosflm session file upon exit with an XML list of all iMosflm output files--debug -d Creates a large output file for debugging purposes Dont use this unless asked to by a developer--expert -e Permits access to advanced detector settings This should not normally be required--fastload -f Attempt to speed loading of many images offline while indexing two default images separated by 90 degrees--help -h Displays this message then exits--imagedir -I ltdirectorygt Starts the image browser in this directory if ltdirectorygt is given as an environment variable it will be expanded to its full value--init -i ltfilenamegt Starts Mosflm and reads from the given saved session file--startdir -S ltdirectorygt Starts mosflm in directory ltstartdirgt rather than the current directory This will only work if the directory exists and you have write permission to it otherwise iMosflm will exit All the normal mosflm output files will be in this directory--singleimage -s ltfilenamegt Starts mosflm loading only the image from ltfilenamegt--site -X ltfilenamegt Reads anyall of the following lines from the file given WAVELENGTH ltxgt DISPERSION ltxgt POLARISATION [PINHOLE | MIRRORS | MONOCHROMATOR | SYNCHROTRON ltxgt] DIVERGENCE ltxh xvgt BEAM ltbeamx beamygt DISTANCE ltxgt DISTORTION TILT ltxgt DISTORTION TWIST ltxgt GAIN ltxgt DETECTOR REVERSEPHI DETECTOR OMEGA ltxgt--version -v Displays the program version and required Mosflm version then exits
These can be abbreviated to the shortest unambiguous string
141 The site fileimosflm --site ltsitefilegt will read keywords from the file ltsitefilegt that will overwrite incorrect information in image headers Thissaves having to manually correct values in every iMosflm session The site file can also be read or written as an option from the Sessionmenu (see Drop down menus sect21) Allowed keywords areWAVELENGTH ltxgt
iMosflm Tutorial
fileUsersandrewg4MOSFLMnewgui_tutorialiMosflm_tutorial_720_ver3html[29052015 105311]
DISPERSION ltxgtPOLARISATION [PINHOLE | MIRRORS | MONO | SYNCHROTRON ltxgt]DIVERGENCE ltxh xvgtBEAM ltbeamx beamygtDISTANCE ltxgtDISTORTION TILT ltxgtDISTORTION TWIST ltxgtGAIN ltxgtDETECTOR REVERSEPHIDETECTOR OMEGA ltxgt
15 The mosflm SUMMARY fileMOSFLM produces a summary file listing refined parameters for each image and when using iMosflm this file will be date- amp time-stamped and have a name such as mosflm_20100518_131019sum This contains the same information as the plots produced by theiMOSFLM GUI which now also include the number of bad spots and overloads
This can be inspected graphically from the CCP4i GUI using the program loggraph Select the pull down menu View Files from Job andunder Output files select Additional log graphs where the _SUMMARYloggraph file will be listed Select this file to display its tablesin loggraph
This is very useful to identify rogue images (with unusually high positional residual or low Iσ(I)) If you find any read that image intoMOSFLM and see what is wrong with it
If you have done more than one integration run during your MOSFLM session you will find multiple entries of the tables Look at the lastset for integration of the 84 images
Click on the Refined detector parameter tables and check on the stability of parameters like the TILT and TWIST of the detector (unitsare hundredths of a degree) and for Mar Research (or DIP) image plate data the distortion parameters ROFF and TOFF (units are mm) Ifthey are varying a lot (more than 20 for TWISTTILT) or 015 for ROFFTOFF then it is probably a good idea to fix these parameters atthe average value (or the known values for this detector if they are available) (see Detector parameters sect821)
Click on the Post refinement table and check the missets It does not matter if they change slowly and by an amount (per image) that isless than 01mosaic spread If they are changing more than this then there could be a problem with processing the data (there is notmuch you can do about this)
Check how the mosaic spread is changing If it is unstable or if you think it is not refining to sensible values (as judged by looking atthe prediction) then you can fix the input value in the same way as the detector parameters (see Crystal parameters sect822)
BADSPOTS AND OVERLOADS
The program will set a rejection flag for those reflections that fail certain tests for example too much variation in the background levela poor profile fit an intensity that is very negative (more than 5 standard deviations) a very high gradient for the background planeThese reflections are called Bad spots and they are listed individually for each image in the mosflmlp file together with the reason forflagging them The number of bad spots is also written to the summary file Generally there should be very few (5-10) bad spots oneach image If there are more it could be because the backstop shadow is not correctly allowed for (consider using the NULLPIXkeyword)
There should also be very few overloaded reflections on each image If there are a lot then a separate low resolution data collectionpass should be made with a much shorter exposure time
IMPORTANT Both Bad spots and Overloads are written to the output MTZ file but will be rejected by default by AIMLESS Theintensity of overloaded reflections is estimated by profile fitting that part of the spot that is not saturated To include these reflections inthe final merged data use the ACCEPT keyword in AIMLESS
16 Scaling data with CCP4i ccp4i
Select Directories amp ProjectDir (top right)
In the new window select Add project
Enter the project name in the Project field and the full directory path in the uses directory field Default values may have been enteredalready here Select this project from Project for this session
Select Apply and Exit Dismiss the warning message that comes up
Select Data reduction from the pull down menu of modules (orange bar at top left)
iMosflm Tutorial
fileUsersandrewg4MOSFLMnewgui_tutorialiMosflm_tutorial_720_ver3html[29052015 105311]
Select Symmetry Scale Merge (Aimless)
In the window that appears do the following
Give a job title (top line)
Click on the box next to Separate anomalous pairs for outlier rejection amp merging statistics (the crystals have been soaked in a mercurycompound)
In the next orange bar (line starts HKLIN 1) select Browse and select the MTZ file output by MOSFLM (probably called hg_001mtz)Select OK
If you did not supply the Project name Crystal name or Dataset name to Mosflm fill in the boxes for these now
Under Scaling Protocol
From the pull-down menu on the line starting Scale select with automatic default settings
At the bottom of window from the pull-down menu named Run select RunampView Com File
This will display a new window showing the command file for running the POINTLESS step select Continue After a brief pause it willshow the command file for running AIMLESS (This can be edited before submitting the job) Select Continue
In the main window it will show that the AIMLESS job is running
When AIMLESS has finished the command file for running the CTRUNCATE step will appearselect Continue
When CTRUNCATE has run the main window will say FINISHED
At that point select the pull-down menu View Files from Job and select View Log Graphs This will give you the same graphs asrunning loggraph on the AIMLESS log file they are also the same as those that appeared in IMOSFLMs QuickScale task To look at thelog file itself (eg the overall merging statistics) select View Log File and it will appear in a new window
161 Looking at the AIMLESS output
The simplest way to look at the output from AIMLESS is to use loggraph on the AIMLESS log file (or via the CCP4i GUI) This can displaymany different graphs
Use Scales vs rotation range to check for smooth variation in the scale factor Check the variation in B factor with image and if there isno real variation it is best to turn off the B-factor refinement
Use the Analysis against all Batches for all runs to detect bad images (high R-factor large number of rejected spots)
Check the Analysis against resolution Fractional bias to see if there is any indication of Partial bias (A negative partial bias will resultif the mosaic spread is underestimated or if there is a lot of diffuse scatter
The Fractional bias should be less than 1-2 although it will often exceed this for weak data (eg in the high resolution bins)
The Axial reflections graphs in AIMLESS are useful for detecting systematic absences which can be used to identify the true spacegroup However the detection of screw axes is thought to be sufficiently robust in POINTLESS that these graphs are no longer necessary
It can also be useful to look at the AIMLESS log file itself in particular the table giving statistics as a function of resolution The effectiveresolution limit of the data can be estimated by looking at the Mn(I)sd column (this is the mean Iσ(I) AFTER merging symmetry matesand is the best indicator of data quality) This table also shows shell and cumulative R-factors
The Mn(I)sd values depend on having realistic values of the standard deviations (errors) in the intensities As the values that come fromMOSFLM are always underestimates of the true error these values are scaled up in AIMLESS using a three-term correction
sdcorrected = SdFac Sqrt[sd(I)2 + SdBLPI + (SdAddI)2]
Here SdFac is an overall scale factor and SdB and SdAdd are intensity dependent factors
AIMLESS will automatically work out a suitable value for all three parameters in order to make the mean value of (observedscatter)(sdestimate) equal to 10 where observed scatter is the difference between an individual estimate of intensity and the mean ofall other estimates (from symmetry mates)
Probably the best estimate of the true high resolution limit of the data can be obtained from the CC(12) values these are thecorrelations between equivalent observations that have been divided randomly into two half-datasets The resolution limit is foundwhen the CC drops below ~ 05 - 03
This table comes under the heading
ANALYSIS OF STANDARD DEVIATIONS
iMosflm Tutorial
fileUsersandrewg4MOSFLMnewgui_tutorialiMosflm_tutorial_720_ver3html[29052015 105311]
in the AIMLESS log file and Run n standard deviation v Intensity test (where n is 1 or more) in the CCP4i GUI View Files from Job -View Log Graphs display
Can you identify a bad image in this dataset Can you work out why it is bad
(Cluethe image headers contain quite a lot of information that is not used by MOSFLM including the date and time that the image wascollected)
You can exclude a given batch from the scaling using the EXCLUDE keyword
RUN ALL EXCLUDE imagenumber
In this case run number will be 1
Rerun the scaling SENDING THE OUTPUT TO A NEW LOGFILE excluding this image and see the effect on the heights in the anomalousPatterson (in the log file) DO NOT repeat the integration In the command file uncomment the line (near the top) goto aimless so itskips the integration part
In the CCP4i GUI click to highlight the AIMLESS job which is listed as FINISHED and select ldquoReRun Jobrdquo from the control buttons downthe right-hand side of the main interface window Under ldquoExcluded Datardquo in the window that appears check the box next to Excludeselected batches and pull-down on the menu button to exclude a range Give the start amp end range to exclude (eg 74 to 74) Rerunthe job as before
17 Changing the symmetryFrom the list of options at the left hand side of the main window select ldquoUtilitiesrdquo and under that SortModifyCombine MTZ Files
In the new window give a new title eg reindex as H32
Click on the Box Change space group andor reindex reflections
Use the browse option to select the input MTZ file (First orange bar) the output filename will be generated automatically (but you canchange it)
Under Reindex details
In the last option check the box next to ldquoChange space group tordquo and enter H32 in the box This is above the final item Reducereflections to the asymmetric unit which is checked by default
Select Run from the Run option button
Then go back to the scaling window and select the new MTZ file (reindexed) as the input for scaling (use Browse) CHANGE THE JOBTITLE
Then select RUN
The scaling will now be performed in space group H32 Look at the merging statistics in the log file in particular the multiplicityweighted R-factor called Rmeas in the log file
18 Looking at the CTRUNCATE outputThe CTRUNCATE program converts intensities to amplitudes and also compiles some useful statistics The LTEST and the cumulativeintensity statistics tabulated by CTRUNCATE (and plotted by loggraph) provide the only point at which you will be able to detectmerohedral twinning (when the two lattices of the twin components exactly overlap and every measured intensity is actually the sum oftwo intensities)
For a good dataset the observed distribution should be within 1 of the theoretical distribution Is this the case for this data
19 If you have time 191 Different mosaic spreads
Try repeating the processing with the mosaic spread set to a value 25 smaller than the refined one and fix it by checking the Fix boxin the Integration window in iMosflm
Can you tell from the merging statistics if this data is better
192 Checking up on outliers
iMosflm Tutorial
fileUsersandrewg4MOSFLMnewgui_tutorialiMosflm_tutorial_720_ver3html[29052015 105311]
AIMLESS writes a file called ROGUES which lists reflections which show very poor agreement between symmetry mates or which areimplausibly large
Look in this file (it is ASCII) and try to work out why this has happened The ROGUES file gives you the image (Batch) on which thereflections have been recorded (for partials this is the image nearest the centre of the reflection so you may need to look on thepreceding and following image as well) Select a reflection which shows very poor agreement with its symmetry mates (A value greaterthan 10 in the DelIsd column in the ROGUES file)
Select the offending image by double-clicking it in the Images pane of the iMosflm main window Predict the reflections then enter thehkl values into the boxes and hit Return (or click the red warning button following the entry box for l) to locate the offending reflectionin the image You must give the measured indices - the first set of values in the ROGUES file - when doing this See if there is anythingodd about the spot Remember to check adjacent images for partials
193 How accurate does the unit cell have to be
Try changing the cell parameters by (say) 10 and integrate the images again What is the effect on the merging statistics
20 Tips1 When reading images into a session DO NOT attempt to carry out any other task until ALL the images have been read2 It is often worth repeating the indexing (usually only once) as the refined direct beam coordinates from the first indexing may give
an improved solution when the indexing is repeated (lower rmsd)3 Always integrate a few degrees of data before integrating the whole dataset (see sect9) If the space group is not known in advance
run Quicksymm with a few degrees of data to check that the correct indexing solution has been chosen4 For difficult images do not attempt to refine the unit cell initially once an indexing solution has been obtained try integrating a
few images to ensure that the integration is stable If then going on to refine the cell check that the prediction looks OK for thefirst image of every segment included in the refinement If it does not look very good consider using the pattern matching(Settings -gt Processing options -gt Advanced refinement see sect84)
5 If the resolution of the data is less than 35 Aring do not use the ldquoRefine Cellrdquo task Instead use several images in indexing and use thecell that comes from the indexing
6 If iMosflm gets into a state where the activity icon(upper right) is spinning but nothing seems to be happening click on the activityicon to stop it spinning and see if the session can be continued DO NOT click on the activity icon simply to abort a task this willgive unpredictable results Use the Abort button for cell refinement or integration There is no defined way to abort indexing
7 Use the image summation option (see sect4) to get a better impression of the diffraction for very low exposure Pilatus images8 Use image summation for detector parameter refinement for fine sliced very weak Pilatus images (Settings -gt Processing options -
gt Advanced refinement see sect821)9 For large mosaic spread values (gt 10deg) or small mosaic block sizes (lt10) consider increasing the maximum allowed reflection
width to avoid having too many green predicted reflections (Settings -gt Processing options -gt Advanced integration see sect97)10 By default on selecting the Indexing task iMosflm will find spots index and (assuming a solution has been found) estimate the
mosaicity For difficult cases it is more useful to restrict this to simply finding spots and then do the indexing and mosaicityestimation by clicking the appropriate buttons To do this change the check box Automatically index after spot finding inSettings -gt Processing options -gt Indexing
11 See sect521 and sect522 for advice if the indexing fails Also consider the possibility of a reversed phi rotation direction if you arenot familiar with the beamline (Settings -gt Experiment settings -gt Experiment see sect21)
12 If the detector parameters have refined to physically unreasonable values (eg because cell refinement or integration has beencarried out using an incorrect indexing solution) be sure to reset the detector parameters before attempting further processing(Settings -gt Experiment settings -gt Detector see sect21)
13 Always set the resolution limit slightly beyond the point at which any spots are visible (see sect414 ) For very weak fine-sliceddata it can be very difficult to estimate the resolution visually so integrate to the maximum resolution (inscribed circle) and usethe merging results to set the final resolution There should be no problems integrating to a resolution ~03-05 Aring beyond theactual resolution limit but for example integrating to 3 Aring when the true resolution limit is 5-6 Aring may cause problems and theintegration should then be repeated with a more realistic resolution limit
14 Use the site file sect141 if repeatedly processing data where the direct beam position is wrong or if the phi direction is reversed etcto save having to correct this for every session
Appendix IA command script for running MOSFLM using the keywords copied from the Batch processing window of the new GUI (see Integratingas a background job sect952) Note that keyworded input for MOSFLM and other CCP4 programs is case-insensitive apart from file anddirectory names
bincsh -fv Set a unique identifier for filenames for this job
set ident = x89_mos07_blk3_smallsep
iMosflm Tutorial
fileUsersandrewg4MOSFLMnewgui_tutorialiMosflm_tutorial_720_ver3html[29052015 105311]
$ipmosflm COORDS $identcoords SUMMARY $identsummary ltlt eof-ip Insert keywords copied from iMosflm batch window here
Keywords for this run For example could involve trying different values for mosaic spread or not integrating all images etc etchklout $identmtzgenfile $identgenprocess 1 1000 goeof-ip
pointlesspointless hklin $identmtz hklout $ident_pointlessmtz
aimlessaimless hklin $ident_pointlessmtz hklout $ident_aimless_partmtz ROGUES $identrogues ltlt eof-aimless Use all default options for aimlesseof-aimless
ctruncate hklin $ident_aimlessmtz hklout $ident_truncatemtz
Harry Powell Andrew Leslie and Owen Johnson
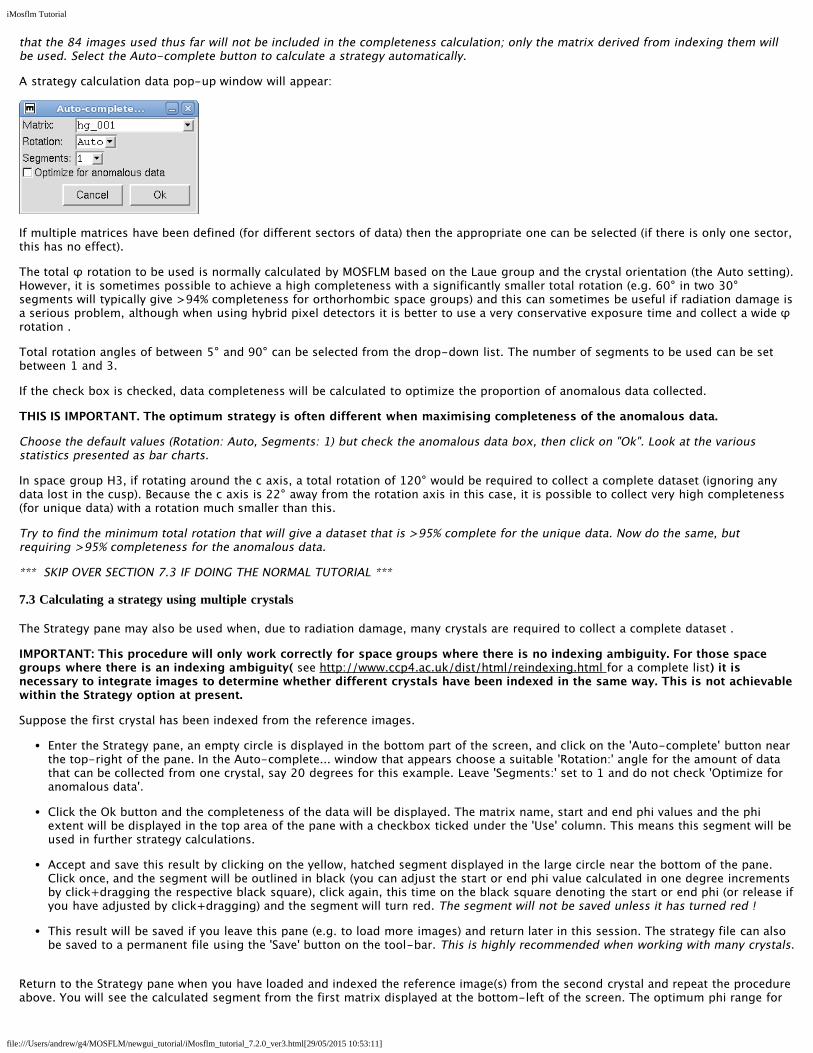
iMosflm Tutorial
fileUsersandrewg4MOSFLMnewgui_tutorialiMosflm_tutorial_720_ver3html[29052015 105311]
the second crystal will be displayed Save this in the same way as for the first crystal (clicking twice) Repeat this procedure for anysubsequent crystals and in each case the optimum phi range will be calculated for the latest crystal taking into account the data fromprevious crystals
It is a good idea to save the strategy to a file as each new crystal is added in case the program crashes and this information is lost
In practice it is probably safest to have a separate iMosflm session that is reserved for the strategy calculations and not used to processany data The strategy for each new crystal can be calculated as described above If there is a problem and the session is corrupted or ifiMosflm is closed down for any reason it is straightforward to restore the status of the session providing the strategy has been savedThe following steps should be taken
1 Read in the reference images for the latest crystal and index them
2 Select the Strategy pane
3 Read in the optimised strategy for all previous crystals using the ldquoAddrdquo button and giving the appropriate filename
4 Making sure that the circle for the latest crystal is highlighted in the lower left window click on lsquoAuto-completersquo and follow the stepsdescribed above
Advanced Usage
The startend phi values for each crystalmatrix can be updated This might be required if for example only 10 degrees of useful datawere collected from a particular crystal instead of the anticipated 20 degrees To change the phi values click either on the matrix namein the top pane or on the circle showing the segment of data in the lower left pane (these are highlighted in a blue box as the mousemoves over them) The corresponding segment will now be displayed in the larger circle Click on the red segment so that a blacksquare appears at the startend phi values Then simply drag the appropriate phi to the desired value The completeness willautomatically be updated (but the strategy calculation for the latest crystal will not be repeated to do this the current segment must bedeleted by highlighting the matrix name and using right click and then repeating the Auto-complete step)
If matrix files saved from iMosflm are available from crystals for which data have been collected in previous sessions these can beadded into the calculation using the Add matrix button on the tool-bar
If the saved strategy result has become complicated or is incorrect and you wish to restart the calculations afresh there is a tool-barbutton Reload sectors from session This will remove any calculated sectors while leaving any known matrices listed at the bottom-leftof the Strategy pane
If you have saved a strategy file from a previous session this can be used to re-initialize the Strategy pane using the Load button onthe tool-bar
A Spacegroup pull-down menu has been added to the tool-bar to permit different choices of space group to be used in thecalculations (eg H3 and H32) This menu is populated from the list offered on the Indexing pane However the space group symboltext is editable Any space group symbol entered will be validated by Mosflm together with the current cell parameters
As a calculator for a multi-segment strategy the Strategy pane is reasonably flexible you can Save or Delete highlighted matrix lines byright-clicking As you highlight different matrix lines the orientation of the crystal expressed as the angles between the abc unit cellaxes and the XYZ coordinate frame is re-displayed in the centre of the pane
The following screen shot shows the cumulative results in the Strategy pane after this procedure has been followed for four crystals(ignore the iMosflm version number)
iMosflm Tutorial
fileUsersandrewg4MOSFLMnewgui_tutorialiMosflm_tutorial_720_ver3html[29052015 105311]
731 Calculating a strategy when some data have already been collected and processed
This option is not yet implemented If data have already been processed (to give an MTZ file) but the images are not currently available (eg they were collected on a previoussynchrotron trip possibly at a different synchrotron) then the MTZ file containing this data can be read and used to calculate a strategyfor data collection from new crystalsThe MTZ icon in the tool bar is used to read the MTZ file
74 Calculating a suitable oscillation angle
To calculate the maximum possible oscillation angle while avoiding spatial overlaps click on the Check for overlaps button A pop-upwindow will appear from which the option to calculate the maximum oscillation angle (as a function of φ) or check how many overlapswill occur for different (user selected) oscillation angles The results are plotted in the same pane as the histograms for the strategycalculations Note that the overlap calculation is based on the current values for the mosaic spread and spot separation and can be verysensitive to these values Note also that these are maximum and not necessarily recommended oscillation angles
iMosflm Tutorial
fileUsersandrewg4MOSFLMnewgui_tutorialiMosflm_tutorial_720_ver3html[29052015 105311]
8 Cell refinementIt is important to determine the cell parameters accurately before integrating the images Although the unit cell is refined as part of theautoindexing providing the diffraction extends beyond ~35Å resolution it is possible to obtain more accurate cell parameters using aprocedure known as post-refinement This procedure requires the integration of a series of images in ideally two or more separatesegments at widely different φ values The distribution of the intensity of partially recorded reflections over the images on which theyoccur is used to refine the unit cell crystal orientation and mosaic spread
Select the Cell Refinement icon
81 Selecting the images
iMosflm Tutorial
fileUsersandrewg4MOSFLMnewgui_tutorialiMosflm_tutorial_720_ver3html[29052015 105311]
There are several ways to select the images to be used in cell refinement Whichever method is used the image numbers will bedisplayed in the Images entry field iMosflm will automatically select appropriate images but these can be changed
811 Manual selection
A list of images can simply be typed into this box An image series can be specified as n-m where n and m are the first and last imagesDifferent series must be separated by white space or comma
For orthorhombic or higher symmetries two segments should be given approximately 90deg apart in φ For monoclinic or triclinic datathree or four segments are best (eg φ = 04590135)
The number of images that should be included in each segment depends on the mosaic spread and oscillation angle A reasonablenumber is 2(mosaic spreadoscillation angle +1) MOSFLM will automatically select two or more segments as appropriate Note thatthere is a limit on the total number of images that can be used
812 Automatic selection
Selecting the Automatically select images icon will select a suitable set of images
813 Graphical selection (Not recommended)
Selecting this icon will give a new window
Images can be selected by clicking in the Use check-box in the list of images or by using the mouse to drag a selection of imagesfrom the sector displayed The other icons allow the sector to be zoomed in or out and the viewed area to be moved to make theselection easier The final two icons on the tool-bar switch the segment display to fit the display space as either a full circle or aquadrant This Image palette can be closed by clicking outside its area but will close after 60 seconds anyway
82 Integrating the images and refining the cell
Use one of the methods above to select images to use in cell refinement and click on the Process button Before starting cell refinementcheck that the prediction for the first image in each segment to be used is good The majority of the spot positions must be correctlypredicted for the first image in each segment or else the refinement will not work
The selected images will be integrated and following integration the cell parameters are refined Selectable refined detector parameters
iMosflm Tutorial
fileUsersandrewg4MOSFLMnewgui_tutorialiMosflm_tutorial_720_ver3html[29052015 105311]
will be plotted as will the changes in crystal orientation and (if selected) mosaic spread If the shift in cell parameters is greater than 25standard deviations another cycle of integration and cell refinement is carried out Typically two or three cycles are required forconvergence Note that the current program activity is shown in the bottom left-hand corner of the window in the status message area
The different windows are explained below Moving the mouse over any parameter or plotted graph point will give a full description ofit
821 The detector parameters window
The values of the refined detector parameters are displayed for each image as it is integratedThere is the option to fix any of the parameters during integration by checking the Fix box onthe right The positional residuals (overall central and weighted) are also listed
Any of these parameters can be selected for plotting on the graph that appears to the right ofthis box by simply clicking on that parameter (which is then highlighted in blue as shown herefor Beam x and Beam y)
Check the stability of the refined parameters by displaying the appropriate graphs To getsensible scaling of the graphs only parameters with similar numerical values should be plottedtogether
For weak images (ie few visible spots in the outer regions of the image) the tilt and twistmay not be well defined and might refine to large values (greater than one degree) Insuch cases these parameters should be fixed It is not generally recommended to fix any
iMosflm Tutorial
fileUsersandrewg4MOSFLMnewgui_tutorialiMosflm_tutorial_720_ver3html[29052015 105311]
other detector parameters
For very weak fine sliced images (Pilatus only) there is the option to sum images when findingsuitable spots for refinement see Settings -gt Processing Options -gt Advanced refinementwhich can in some cases make the refinement more stable
822 The crystal parameters window
The values of the refined crystal missetting angles φ(x) φ(y) φ(z) the unit cell parameters andmosaic spread for the current image are displayed in the table Selected parameters will beplotted as for the detector parameters Specific unit cell parameters can also be fixed
If more than one segment of data is being used for cell refinement it is not unusual to see achange in orientation of the crystal between the two segments
Observe how the crystal orientation is different for images in the two segments See how themosaic spread varies during refinement
823 The central spot profile
The average spot profile for the central region of the detector is plotted for eachimage This confirms that the spot prediction is good If the profile is not welldefined and central in the box or if the blue border for the peak region of the spot ismuch larger than the apparent spots size it suggests a problem with the integrationand the initial prediction should be checked In some cases it may be necessary toincrease or decrease the Profile Tolerance parameters to ensure that the blue boxfits the spot To do this select the Advanced integration tab of Processing optionsCheck the central spot profiles for the images used in the cell refinement
824 The summary window
This window presents a summary of how selected parameters have changed indifferent cycles of the cell refinement The behaviour of these parameters gives agood indication of whether the cell refinement has been successful
If the refinement has been successful the RMS residual should be lower for thefinal cycle than in previous cycles However errors in the cell can be compensatedquite well by changing the crystal to detector distance so the differences are notalways dramatic
The other parameters that can be plotted from the pull-down list are the detectordistance and the Pixel ratio (Yscale)
The detector distance should be the same for all images in the refinement If the original indexing was based on auto-indexing a singleimage (say the first) then the detector distance might change for images from the second segment to compensate for an error in theoriginal cell If the variation in distance for different images increases with the cycle number this indicates that the refinement is notstable
The Pixel ratio (Yscale) parameter may also show an initial variation for images in different segments because refining Yscale (whichshould be 10000 for all except Raxis II and Raxis HTC detectors) can compensate for errors in cell dimensions in the same way that thedistance can The final values (last cycle) should be very close to identical for all images and should also be very close to unity (to within00010)
Cell refinement can be unstable if the data do not extend to at least 35 Aring If it appears unstable use the cell derived from auto-indexing a series of images well spaced in φ instead
iMosflm Tutorial
fileUsersandrewg4MOSFLMnewgui_tutorialiMosflm_tutorial_720_ver3html[29052015 105311]
Examine the plots to see if the parameters are stable and correct (Yscale)
825 The final results
When refinement has converged (or after 5 cycles) the initial and final cell parameters and the estimated errors (std dev) are listed
If time is available make a note of the std dev values and repeat the cell refinement using a larger number of images in each segmentAre the standard deviations smaller when using more images
83 Refining cell parameters for multiple lattices
Providing the resolution is high enough (generally better than ~35-32 Aring) and not too many of the spots in the different lattices areoverlapped it is possible to refine the cell parameters for each lattice individually The lattice to be refined is selected from the Latticeselector
This selector will be grayed out when processing a single lattice
84 If the prediction for the first image of a segment is poor
In some cases depending on how the indexing has been carried out or if the diffraction is poor or there has been a large change incrystal orientation during the data collection the prediction for one or more of the segments (the first image) may be poor In suchcases the integration and hence the cell refinement may fail It may be possible to successfully process the images after an initialrefinement of the crystal orientation using a pattern matching algorithm To select this option got to the Advanced refinement tab ofProcessing options and select the tick box for Refine orientation of first image in any run by pattern matching and for Integrate allimages Then refine the cell in the usual way During integration the orientation will be refined for the first image of each segmentoutput for this additional refinement will be written to the logfile but is not shown in the GUI
9 IntegrationThe accurate cell parameters are now used in the integration Note that although the images are integrated during the cell refinementthe intensities are not saved and no MTZ file is generated at that stage
It is good practice to start by integrating a block of images corresponding to a few degrees of data to check that the parameters do notneed further adjustment MOSFLM will generate warning messages after integration if there are any difficulties and it may be possibleto improve the situation by changing some of the default parameters (see Warning messages sect13)
Before integration ensure that the backstop shadow has been defined (see Masked areas backstop sect411 and Masked areas generalsect412)
91 Image selection
Image selection is performed in exactly the same way as in the cell refinement In this case the Automatic selection will simply includeall images in the current sector
Select images 1-10
92 Setting the MTZ filename and controlling updating of the image display
Two icons appear when the integration option is chosen
If the Show predictions icon is clicked the display window will be updated as eachimage is processed This will slow down the processing but allows the accuracy of theprediction to be checked for each image
iMosflm Tutorial
fileUsersandrewg4MOSFLMnewgui_tutorialiMosflm_tutorial_720_ver3html[29052015 105311]
Click on this icon so that the display will be updatedThe filename of the MTZ file containing the results of the integration is generatedautomatically but can be edited manually
93 Integrating the images
Click on the Process button to start integration
Integration of the images occurs in two passes In the first pass for each block of images (a number corresponding to a few degrees ofdata selected automatically by MOSFLM) the detector and crystal parameters are refined for each image in turn and the measurementboxes for all predicted spots are written to a file for use in the second pass In the second pass the standard profiles are formed fromreflections present on all of the images in this block and each image is then integrated and the results written to the MTZ file Thedisplay is not updated during the second pass and will remain on the last image of the block (assuming image updating has beenselected)
Note that the unit cell dimensions are normally fixed during integration and only the crystal orientation and mosaic spread are refinedCrystal parameter refinement only starts when a sufficient number of images have been integrated to provide data for the post-refinement typically after ~05-1 degree (more for high mosaicity)
94 Parameter display windows
As described in sect82 the refined detector and crystal parameters will be displayed in tables and selected parameters will be plotted ingraphs The average spot profile for each image will also be displayed
The size of these graphs (and the profile) can be expanded to fill the whole window by holding down Shift and clicking LMB anywherein the graph window A second Shift+click will revert the graph to the original size
In addition to these windows there are windows that tabulate and plot (as a function of image number) the mean Iσ(I) for profile fittedand summation integration intensities The overall values and the values for the highest resolution bin are given
The number of overloaded reflections Bad spots (ie those that fail certain tests see mosflm SUMMARY file sect15) Spatial overlaps andif processing multi-lattice images the number of lattice overlaps is listed for each image and can be plotted by highlighting thatparameter When processing data from crystals with large unit cells it is important to watch out for spatial overlaps (see sect97 for tips onhow to reduce the number of spatial overlaps if this is a problem)
A display of the standard profiles for different regions of the detector is also provided Poor profiles are averaged by includingreflections from inner regions of the detector Averaged profiles are indicated by a red line around the spot (rather than blue) Theoriginal unaveraged profile can be viewed a clicking on the profile (providing there were sufficient spots in that region to allowformation of a profile)
The profiles should be checked to see that they are well defined and centred within the box Poorly-defined diffuse or non-centredprofiles may suggest that the prediction is not very good in which case this should be checked on the corresponding image(s)
It may be useful to expand the standard profiles to fill the window using Shift + click in the profiles window
Finally the lower left window plots Iσ(I) as a function of resolution for any selected image
iMosflm Tutorial
fileUsersandrewg4MOSFLMnewgui_tutorialiMosflm_tutorial_720_ver3html[29052015 105311]
Different parameters can be plotted by selecting the small right- or left-pointing arrows on the title line above the plot
95 Integrating the whole datasetAssuming that everything looks OK the entire dataset can now be integrated However it is strongly recommended thatProjectCrystalDataset names are assigned first These are written to the output MTZ file and used by downstream programs inparticular AIMLESS will use this information when deciding which images belong to the same dataset
Select Experiment settings from the Settings drop-down menu (see Drop down menus sect21) to enter these names and optionally givea title for the MTZ file
Select images 1-84 and click on Process
951 Parallel Integration Using multiple cores
An option is available on the pull-down menu (next to the Process button in the Integration task) which splits up the integration jobover available cores on the local machine All aspects are currently determined automatically at present user-configurable options willbe available in a later version The algorithm used is as follows
iMosflm determines the number of cores available on the local machineIf the number of cores (N) is greater than 2 iMosflm splits the integration run into N-1 batches (up to a maximum of 16) containingapproximately the same number of images If N le 2 iMosflm splits the run into N batches
If the total number of images in each batch is less than 32 the number of batches is decreased until this condition is satisfied
The first batch is submitted as a background task consisting of a refinement stage and an integration stage with its input and outputfiles (including the MTZ file) in a new directory its name being determined from the number of segments of data being integrated andthe lattice number (if the sample has been determined to contain multiple lattices) If the directories exist already they are all movedinto a newly-created directory with a time-stamped name the files from the most recent integration run are thus in directories withnames following the pattern described above Once the refinement stage is complete the refined parameters are written to a file
The launch of subsequent batches are delayed until the corresponding preceding batch has written its refined parameters This file isread and the new batch is launched again with a refinement stage and integration stage
At present the job cannot be aborted once it has started
952 Integrating as a background job
By selecting Batch in the drop-down menu adjacent to the Process button the integration can be run as a background job rather thaninteractively and the GUI can be used to look at a different dataset
Selecting Batch from the drop-down menu will display a new window showing the script that will be used to process the images alongwith a number of processing options The script can be edited if additional keywords are required or if some parameters are to bechanged and can also be copied and pasted into a file for off-line processing
By default the job is divided into batches across multiple cores as determined for the parallel integration described in sect951 but thenumber of cores can be chosen by the user from a drop-down menu in this case the size of each batch is determined by the interface
Plotting the results of the integration can be turned off this can make processing much faster
iMosflm Tutorial
fileUsersandrewg4MOSFLMnewgui_tutorialiMosflm_tutorial_720_ver3html[29052015 105311]
It is possible to configure job submission for remote machines (which can be added by depressing the add host button) Ensure youhave enabled passwordless logins for all the remote machines you enter and that you specify the full path to the Mosflm executable inthe Batch destinations window The remote working directory (in which the log and MTZ files are written) and the remote imagedirectory must both be specified with their full path names Any required parameter fields that are not completed by the user arehighlighted in orange if the user tries to submit a job without completing these fields a new window containing only those fields (againhighlighted in orange) pops up with a request to do so
The number of cores available on the selected host can be determined by depressing the apple core button on the Batch destinationsconfiguration window
The log file for batch submission jobs the MTZ and SUMMARY files are written to the directory in which iMosflm was launched
96 Checking the integration
iMosflm Tutorial
fileUsersandrewg4MOSFLMnewgui_tutorialiMosflm_tutorial_720_ver3html[29052015 105311]
The detector and crystal parameter plots should be examined carefully to check for any instability in the refinement If there are largeand random variations in some parameters (eg the detector twist and tilt) then it may be better to fix them and repeat the integration
For cases (eg very small unit cells) where there are very few suitable reflections on each image the refinement of the missetting anglesmay show significant variations from one image to the next In such cases it is best to apply smoothing to the missetting angles usingthe tick box in Settings -gt Processing options -gt Advanced Refinement
Discontinuities due to blank images should also show up and the offending images should be removed from the scaling run
If adjacent spots are incompletely resolved on the detector it may be possible to improve the processing by increasing the PROFILETOLERANCE parameters by 1-2 These parameters can be set in the Advanced integration tab of the Processing options menu (useSettings)
97 Advanced features for integration
The Settings -gt Processing options menu allows additional control over the integration Parameters such as the minimum spotseparation resolution limits excluded resolution ranges block size MTZ filename and BATCH ADD can be changed in the Processingtab
Manually decreasing the minimum spot separation can help if a large number of reflections are flagged as spatially overlapped (redboxes) The prediction must be updated to see the effect of changing the separation this can be done either by displaying the next orprevious image or double clicking on the blue circle next to the image currently displayed in the Images pane
In the Advanced integration tab the measurement box parameters profile tolerance and profile averaging parameters can be set
The measurement box parameters can be adjusted for rare cases where the estimation of the spot size has not worked correctlyresulting in a box that is too small or too large The optimisation of the background rim and corner cutoff parameters that determinewhich pixels are used for the background and which pixels for the peak can also be turned off but this is generally not recommended
Increasing the profile tolerance can help in cases where adjacent spots are not completely resolved this can be judged by examining thestandard profiles By default the profile tolerance is automatically increased if there are a large number of spatial overlaps as this hasthe effect of reducing the minimum spot separation A message will be written to the logfile if this has happened This option can beturned off using the tick box Optimise profile tolerance values to avoid spot overlap
The profile outlier exclusion parameters control the exclusion of ice spots or hot pixels which could otherwise corrupt the standardprofiles
Pixels with a value less than the Null pixel threshold are considered to belong to inactive regions of the detector
The pixel saturation value determines when a reflection is considered to be an overload The intensity of overloaded reflections isestimated by profile fitting but these reflections are rejected by the scaling program AIMLESS by default
Increasing the Maximum reflection width in φ from the default value of 5deg will reduce the number of rejected reflections (green boxes)and is worthwhile when the mosaicity is very high or the mosaic block size is very small As with the minimum spot separation theimage must be refreshed to see the effect of changing this parameter
The rejection criteria will reject reflections with too much variation in the background (BGRATIO) or where the gradient of thebackground plane is too large These should only be changed if many reflections are being rejected PKRATIO only applies to fullyrecorded reflections and reflects a very poor profile fit With current data collection protocols there will be very few (if any) fullyrecorded reflections
Additional MOSFLM parameters will be added based on user requests
98 Integrating multiple lattices
When multiple lattices have been successfully indexed each lattice can be integrated individually by selecting the appropriate latticenumber
Reflections in the chosen lattice that are overlapped by a reflection from another lattice will be integrated but the measurement box willbe expanded so that the total intensity of the two (or more) reflections is measured These reflections will be flagged for specialtreatment Reflections that are not overlapped are referred to as singletons They will be dealt with in the normal way by POINTLESSand AIMLESS
NOTE If more than one lattice has been indexed and the results of integrating just ONE of the lattices are to be checked byrunning QuickSymm or QuickScale then the multi-lattice icon in the Integration pane must be turned off otherwise an error
iMosflm Tutorial
fileUsersandrewg4MOSFLMnewgui_tutorialiMosflm_tutorial_720_ver3html[29052015 105311]
message will be given saying that all lattices must be integrated
It is often the case that by measuring both lattices (in separate integration runs) and inputting both MTZ files to QuickScale the overallcompleteness is high using ONLY the singletons To use this option ensure that the multi-lattice icon is off
To make use of the intensity estimates for overlapped reflections MTZ files for all lattices must be input to the program FECKLESSwhich will derive the best estimate of the summed intensity This is the default option if more than one lattice has been indexed and itrequires that all lattices have been integrated (in separate runs) prior to running QuickSymm or QuickScale (FECKLESS will be runautomatically)
At this time no downstream programs can make use of the summed intensities of overlapping reflections but in the future it should bepossible to use this data in REFMAC
Currently it is recommended to use only singletons from all the lattices FECKLESS is not required in this case
The MTZ filename is automatically updated to reflect which lattice has been chosen to avoid overwriting the MTZ file of the first latticewhen integrating the second one FECKLESS when run from iMosflm relies on this naming convention so do not change it
10 Running Pointless to check the symmetryOnce the images have been integrated (even a few degrees of data in many cases) the program POINTLESS can be run to determine thetrue Laue symmetry and try to determine the space group using the QuickSymm button
iMosflm Tutorial
fileUsersandrewg4MOSFLMnewgui_tutorialiMosflm_tutorial_720_ver3html[29052015 105311]
Select the QuickSymm button
A summary of the Pointless results as shown below will appear in a qtRView window
Various graphs (L test for twinning ViewHKL to view the reciprocal lattice) can also be viewed in this window
Various options for POINTLESS such as a reference MTZ file forcing the symmetry selected in iMosflm and specifying multiple input MTZfiles can be selected from the Settings -gt Processing options -gt Sort Scale and Merge tab (see below)
iMosflm Tutorial
fileUsersandrewg4MOSFLMnewgui_tutorialiMosflm_tutorial_720_ver3html[29052015 105311]
Caution The results can be ambiguous if run with a partial dataset Look in the logfile to see how many relfections are used totest each possible symmetry operator
11 Running Aimless to scale and merge the dataSelect the QuickScale button
This will first run POINTLESS then change the space group for the data to that selected by POINTLESS (unless the iMosflm symmetry isset to override POINTLESS) run AIMLESS to scale and merge the data in that space group and then run CTRUNCATE which calculates anumber of statistics from the intensity data The CCP4 UNIQUEIFY script will then be run which generates all the unique reflections forthat spacegroup to the resolution of the measured data and will flag reflections (5 by default but this can be changed) for use as theRfree set
AIMLESS can be run from the QuickScale button either treating anomalous data (the default) or ignoring anomalous data If onlyprocessing a few degrees of data it is usually better to ignore anomalous because especially for low symmetry cases no mergingstatistics may be given in AIMLESS
SCALA can be selected as an alternative to AIMLESS for scaling (not recommended)
There is limited control over running AIMLESS (see figure above) including re-setting resolution limits rejecting batches (images)changing the treatment for accepting partials changing the rejection criterion and changing the procedure for updating the standarddeviation estimates
iMosflm Tutorial
fileUsersandrewg4MOSFLMnewgui_tutorialiMosflm_tutorial_720_ver3html[29052015 105311]
The AIMLESS results will be displayed in the qtRView as shown below along with graphical output (see below) and the full log file canalso be examined
Aimless summary file
iMosflm Tutorial
fileUsersandrewg4MOSFLMnewgui_tutorialiMosflm_tutorial_720_ver3html[29052015 105311]
An example of the Aimless graphical output
The AIMLESS logfile can also be examined by selecting the Log File tab
12 History and mosflm log fileSelecting History allows the history of the session to be examined or by selecting the Log tab the full mosflmlp file can be viewed Themosflmlp file is also available in a time-stamped file mosflm_yyyymmdd_hhmmsslp (eg mosflm_20100518_131019lp) and can beread with a text editor
The History has a tree structure and will show when various parameters have been changed This has not been fully implemented and isnot generally useful
The logfile may provide useful clues when processing has failed
13 Warning MessagesAs already mentioned in Adding images sect3 and Integration sect9 warning messages are generated by MOSFLM during processing Atraffic light colour coding has now been assigned based on the warnings and is shown next to the Warnings box
A Red status implies a serious problem that will affect data quality and should be addressed
An Orange status implies minor issues that should be checked to see if things can be improved
A Green status means no significant problems messages are for information only
iMosflm Tutorial
fileUsersandrewg4MOSFLMnewgui_tutorialiMosflm_tutorial_720_ver3html[29052015 105311]
Abbreviated messages can be obtained by clicking on the Warnings icon The full warning Details together with Hints amp Notes text (ifany are available) can be obtained by double-clicking the relevant warning Details are displayed in a pop-up text box which willdisappear with the next click outside the box The same full details and suggestions are of course available in the mosflmlp files whereeven more information may be available
NOTE This is the end of the part of the tutorial which deals directly with iMosflm but see sect19 which has some suggestions forfurther work if you have time The remainder of this document deals with integrating and scaling data with MOSFLM andAimless via the CCP4i user interface examining the traditional mosflm SUMMARY file with the CCP4 utility loggraph
The Appendix contains a shell script for running MOSFLM as a traditional batch job
14 Useful command line optionsiMosflm has a number of command line options and these can be listed by typingimosflm --helpCurrent options are
--allimages -a ltfilenamegt Starts mosflm loading all files that match the template generated from ltfilenamegt--ccp4i2 Autosaves an iMosflm session file upon exit with an XML list of all iMosflm output files--debug -d Creates a large output file for debugging purposes Dont use this unless asked to by a developer--expert -e Permits access to advanced detector settings This should not normally be required--fastload -f Attempt to speed loading of many images offline while indexing two default images separated by 90 degrees--help -h Displays this message then exits--imagedir -I ltdirectorygt Starts the image browser in this directory if ltdirectorygt is given as an environment variable it will be expanded to its full value--init -i ltfilenamegt Starts Mosflm and reads from the given saved session file--startdir -S ltdirectorygt Starts mosflm in directory ltstartdirgt rather than the current directory This will only work if the directory exists and you have write permission to it otherwise iMosflm will exit All the normal mosflm output files will be in this directory--singleimage -s ltfilenamegt Starts mosflm loading only the image from ltfilenamegt--site -X ltfilenamegt Reads anyall of the following lines from the file given WAVELENGTH ltxgt DISPERSION ltxgt POLARISATION [PINHOLE | MIRRORS | MONOCHROMATOR | SYNCHROTRON ltxgt] DIVERGENCE ltxh xvgt BEAM ltbeamx beamygt DISTANCE ltxgt DISTORTION TILT ltxgt DISTORTION TWIST ltxgt GAIN ltxgt DETECTOR REVERSEPHI DETECTOR OMEGA ltxgt--version -v Displays the program version and required Mosflm version then exits
These can be abbreviated to the shortest unambiguous string
141 The site fileimosflm --site ltsitefilegt will read keywords from the file ltsitefilegt that will overwrite incorrect information in image headers Thissaves having to manually correct values in every iMosflm session The site file can also be read or written as an option from the Sessionmenu (see Drop down menus sect21) Allowed keywords areWAVELENGTH ltxgt
iMosflm Tutorial
fileUsersandrewg4MOSFLMnewgui_tutorialiMosflm_tutorial_720_ver3html[29052015 105311]
DISPERSION ltxgtPOLARISATION [PINHOLE | MIRRORS | MONO | SYNCHROTRON ltxgt]DIVERGENCE ltxh xvgtBEAM ltbeamx beamygtDISTANCE ltxgtDISTORTION TILT ltxgtDISTORTION TWIST ltxgtGAIN ltxgtDETECTOR REVERSEPHIDETECTOR OMEGA ltxgt
15 The mosflm SUMMARY fileMOSFLM produces a summary file listing refined parameters for each image and when using iMosflm this file will be date- amp time-stamped and have a name such as mosflm_20100518_131019sum This contains the same information as the plots produced by theiMOSFLM GUI which now also include the number of bad spots and overloads
This can be inspected graphically from the CCP4i GUI using the program loggraph Select the pull down menu View Files from Job andunder Output files select Additional log graphs where the _SUMMARYloggraph file will be listed Select this file to display its tablesin loggraph
This is very useful to identify rogue images (with unusually high positional residual or low Iσ(I)) If you find any read that image intoMOSFLM and see what is wrong with it
If you have done more than one integration run during your MOSFLM session you will find multiple entries of the tables Look at the lastset for integration of the 84 images
Click on the Refined detector parameter tables and check on the stability of parameters like the TILT and TWIST of the detector (unitsare hundredths of a degree) and for Mar Research (or DIP) image plate data the distortion parameters ROFF and TOFF (units are mm) Ifthey are varying a lot (more than 20 for TWISTTILT) or 015 for ROFFTOFF then it is probably a good idea to fix these parameters atthe average value (or the known values for this detector if they are available) (see Detector parameters sect821)
Click on the Post refinement table and check the missets It does not matter if they change slowly and by an amount (per image) that isless than 01mosaic spread If they are changing more than this then there could be a problem with processing the data (there is notmuch you can do about this)
Check how the mosaic spread is changing If it is unstable or if you think it is not refining to sensible values (as judged by looking atthe prediction) then you can fix the input value in the same way as the detector parameters (see Crystal parameters sect822)
BADSPOTS AND OVERLOADS
The program will set a rejection flag for those reflections that fail certain tests for example too much variation in the background levela poor profile fit an intensity that is very negative (more than 5 standard deviations) a very high gradient for the background planeThese reflections are called Bad spots and they are listed individually for each image in the mosflmlp file together with the reason forflagging them The number of bad spots is also written to the summary file Generally there should be very few (5-10) bad spots oneach image If there are more it could be because the backstop shadow is not correctly allowed for (consider using the NULLPIXkeyword)
There should also be very few overloaded reflections on each image If there are a lot then a separate low resolution data collectionpass should be made with a much shorter exposure time
IMPORTANT Both Bad spots and Overloads are written to the output MTZ file but will be rejected by default by AIMLESS Theintensity of overloaded reflections is estimated by profile fitting that part of the spot that is not saturated To include these reflections inthe final merged data use the ACCEPT keyword in AIMLESS
16 Scaling data with CCP4i ccp4i
Select Directories amp ProjectDir (top right)
In the new window select Add project
Enter the project name in the Project field and the full directory path in the uses directory field Default values may have been enteredalready here Select this project from Project for this session
Select Apply and Exit Dismiss the warning message that comes up
Select Data reduction from the pull down menu of modules (orange bar at top left)
iMosflm Tutorial
fileUsersandrewg4MOSFLMnewgui_tutorialiMosflm_tutorial_720_ver3html[29052015 105311]
Select Symmetry Scale Merge (Aimless)
In the window that appears do the following
Give a job title (top line)
Click on the box next to Separate anomalous pairs for outlier rejection amp merging statistics (the crystals have been soaked in a mercurycompound)
In the next orange bar (line starts HKLIN 1) select Browse and select the MTZ file output by MOSFLM (probably called hg_001mtz)Select OK
If you did not supply the Project name Crystal name or Dataset name to Mosflm fill in the boxes for these now
Under Scaling Protocol
From the pull-down menu on the line starting Scale select with automatic default settings
At the bottom of window from the pull-down menu named Run select RunampView Com File
This will display a new window showing the command file for running the POINTLESS step select Continue After a brief pause it willshow the command file for running AIMLESS (This can be edited before submitting the job) Select Continue
In the main window it will show that the AIMLESS job is running
When AIMLESS has finished the command file for running the CTRUNCATE step will appearselect Continue
When CTRUNCATE has run the main window will say FINISHED
At that point select the pull-down menu View Files from Job and select View Log Graphs This will give you the same graphs asrunning loggraph on the AIMLESS log file they are also the same as those that appeared in IMOSFLMs QuickScale task To look at thelog file itself (eg the overall merging statistics) select View Log File and it will appear in a new window
161 Looking at the AIMLESS output
The simplest way to look at the output from AIMLESS is to use loggraph on the AIMLESS log file (or via the CCP4i GUI) This can displaymany different graphs
Use Scales vs rotation range to check for smooth variation in the scale factor Check the variation in B factor with image and if there isno real variation it is best to turn off the B-factor refinement
Use the Analysis against all Batches for all runs to detect bad images (high R-factor large number of rejected spots)
Check the Analysis against resolution Fractional bias to see if there is any indication of Partial bias (A negative partial bias will resultif the mosaic spread is underestimated or if there is a lot of diffuse scatter
The Fractional bias should be less than 1-2 although it will often exceed this for weak data (eg in the high resolution bins)
The Axial reflections graphs in AIMLESS are useful for detecting systematic absences which can be used to identify the true spacegroup However the detection of screw axes is thought to be sufficiently robust in POINTLESS that these graphs are no longer necessary
It can also be useful to look at the AIMLESS log file itself in particular the table giving statistics as a function of resolution The effectiveresolution limit of the data can be estimated by looking at the Mn(I)sd column (this is the mean Iσ(I) AFTER merging symmetry matesand is the best indicator of data quality) This table also shows shell and cumulative R-factors
The Mn(I)sd values depend on having realistic values of the standard deviations (errors) in the intensities As the values that come fromMOSFLM are always underestimates of the true error these values are scaled up in AIMLESS using a three-term correction
sdcorrected = SdFac Sqrt[sd(I)2 + SdBLPI + (SdAddI)2]
Here SdFac is an overall scale factor and SdB and SdAdd are intensity dependent factors
AIMLESS will automatically work out a suitable value for all three parameters in order to make the mean value of (observedscatter)(sdestimate) equal to 10 where observed scatter is the difference between an individual estimate of intensity and the mean ofall other estimates (from symmetry mates)
Probably the best estimate of the true high resolution limit of the data can be obtained from the CC(12) values these are thecorrelations between equivalent observations that have been divided randomly into two half-datasets The resolution limit is foundwhen the CC drops below ~ 05 - 03
This table comes under the heading
ANALYSIS OF STANDARD DEVIATIONS
iMosflm Tutorial
fileUsersandrewg4MOSFLMnewgui_tutorialiMosflm_tutorial_720_ver3html[29052015 105311]
in the AIMLESS log file and Run n standard deviation v Intensity test (where n is 1 or more) in the CCP4i GUI View Files from Job -View Log Graphs display
Can you identify a bad image in this dataset Can you work out why it is bad
(Cluethe image headers contain quite a lot of information that is not used by MOSFLM including the date and time that the image wascollected)
You can exclude a given batch from the scaling using the EXCLUDE keyword
RUN ALL EXCLUDE imagenumber
In this case run number will be 1
Rerun the scaling SENDING THE OUTPUT TO A NEW LOGFILE excluding this image and see the effect on the heights in the anomalousPatterson (in the log file) DO NOT repeat the integration In the command file uncomment the line (near the top) goto aimless so itskips the integration part
In the CCP4i GUI click to highlight the AIMLESS job which is listed as FINISHED and select ldquoReRun Jobrdquo from the control buttons downthe right-hand side of the main interface window Under ldquoExcluded Datardquo in the window that appears check the box next to Excludeselected batches and pull-down on the menu button to exclude a range Give the start amp end range to exclude (eg 74 to 74) Rerunthe job as before
17 Changing the symmetryFrom the list of options at the left hand side of the main window select ldquoUtilitiesrdquo and under that SortModifyCombine MTZ Files
In the new window give a new title eg reindex as H32
Click on the Box Change space group andor reindex reflections
Use the browse option to select the input MTZ file (First orange bar) the output filename will be generated automatically (but you canchange it)
Under Reindex details
In the last option check the box next to ldquoChange space group tordquo and enter H32 in the box This is above the final item Reducereflections to the asymmetric unit which is checked by default
Select Run from the Run option button
Then go back to the scaling window and select the new MTZ file (reindexed) as the input for scaling (use Browse) CHANGE THE JOBTITLE
Then select RUN
The scaling will now be performed in space group H32 Look at the merging statistics in the log file in particular the multiplicityweighted R-factor called Rmeas in the log file
18 Looking at the CTRUNCATE outputThe CTRUNCATE program converts intensities to amplitudes and also compiles some useful statistics The LTEST and the cumulativeintensity statistics tabulated by CTRUNCATE (and plotted by loggraph) provide the only point at which you will be able to detectmerohedral twinning (when the two lattices of the twin components exactly overlap and every measured intensity is actually the sum oftwo intensities)
For a good dataset the observed distribution should be within 1 of the theoretical distribution Is this the case for this data
19 If you have time 191 Different mosaic spreads
Try repeating the processing with the mosaic spread set to a value 25 smaller than the refined one and fix it by checking the Fix boxin the Integration window in iMosflm
Can you tell from the merging statistics if this data is better
192 Checking up on outliers
iMosflm Tutorial
fileUsersandrewg4MOSFLMnewgui_tutorialiMosflm_tutorial_720_ver3html[29052015 105311]
AIMLESS writes a file called ROGUES which lists reflections which show very poor agreement between symmetry mates or which areimplausibly large
Look in this file (it is ASCII) and try to work out why this has happened The ROGUES file gives you the image (Batch) on which thereflections have been recorded (for partials this is the image nearest the centre of the reflection so you may need to look on thepreceding and following image as well) Select a reflection which shows very poor agreement with its symmetry mates (A value greaterthan 10 in the DelIsd column in the ROGUES file)
Select the offending image by double-clicking it in the Images pane of the iMosflm main window Predict the reflections then enter thehkl values into the boxes and hit Return (or click the red warning button following the entry box for l) to locate the offending reflectionin the image You must give the measured indices - the first set of values in the ROGUES file - when doing this See if there is anythingodd about the spot Remember to check adjacent images for partials
193 How accurate does the unit cell have to be
Try changing the cell parameters by (say) 10 and integrate the images again What is the effect on the merging statistics
20 Tips1 When reading images into a session DO NOT attempt to carry out any other task until ALL the images have been read2 It is often worth repeating the indexing (usually only once) as the refined direct beam coordinates from the first indexing may give
an improved solution when the indexing is repeated (lower rmsd)3 Always integrate a few degrees of data before integrating the whole dataset (see sect9) If the space group is not known in advance
run Quicksymm with a few degrees of data to check that the correct indexing solution has been chosen4 For difficult images do not attempt to refine the unit cell initially once an indexing solution has been obtained try integrating a
few images to ensure that the integration is stable If then going on to refine the cell check that the prediction looks OK for thefirst image of every segment included in the refinement If it does not look very good consider using the pattern matching(Settings -gt Processing options -gt Advanced refinement see sect84)
5 If the resolution of the data is less than 35 Aring do not use the ldquoRefine Cellrdquo task Instead use several images in indexing and use thecell that comes from the indexing
6 If iMosflm gets into a state where the activity icon(upper right) is spinning but nothing seems to be happening click on the activityicon to stop it spinning and see if the session can be continued DO NOT click on the activity icon simply to abort a task this willgive unpredictable results Use the Abort button for cell refinement or integration There is no defined way to abort indexing
7 Use the image summation option (see sect4) to get a better impression of the diffraction for very low exposure Pilatus images8 Use image summation for detector parameter refinement for fine sliced very weak Pilatus images (Settings -gt Processing options -
gt Advanced refinement see sect821)9 For large mosaic spread values (gt 10deg) or small mosaic block sizes (lt10) consider increasing the maximum allowed reflection
width to avoid having too many green predicted reflections (Settings -gt Processing options -gt Advanced integration see sect97)10 By default on selecting the Indexing task iMosflm will find spots index and (assuming a solution has been found) estimate the
mosaicity For difficult cases it is more useful to restrict this to simply finding spots and then do the indexing and mosaicityestimation by clicking the appropriate buttons To do this change the check box Automatically index after spot finding inSettings -gt Processing options -gt Indexing
11 See sect521 and sect522 for advice if the indexing fails Also consider the possibility of a reversed phi rotation direction if you arenot familiar with the beamline (Settings -gt Experiment settings -gt Experiment see sect21)
12 If the detector parameters have refined to physically unreasonable values (eg because cell refinement or integration has beencarried out using an incorrect indexing solution) be sure to reset the detector parameters before attempting further processing(Settings -gt Experiment settings -gt Detector see sect21)
13 Always set the resolution limit slightly beyond the point at which any spots are visible (see sect414 ) For very weak fine-sliceddata it can be very difficult to estimate the resolution visually so integrate to the maximum resolution (inscribed circle) and usethe merging results to set the final resolution There should be no problems integrating to a resolution ~03-05 Aring beyond theactual resolution limit but for example integrating to 3 Aring when the true resolution limit is 5-6 Aring may cause problems and theintegration should then be repeated with a more realistic resolution limit
14 Use the site file sect141 if repeatedly processing data where the direct beam position is wrong or if the phi direction is reversed etcto save having to correct this for every session
Appendix IA command script for running MOSFLM using the keywords copied from the Batch processing window of the new GUI (see Integratingas a background job sect952) Note that keyworded input for MOSFLM and other CCP4 programs is case-insensitive apart from file anddirectory names
bincsh -fv Set a unique identifier for filenames for this job
set ident = x89_mos07_blk3_smallsep
iMosflm Tutorial
fileUsersandrewg4MOSFLMnewgui_tutorialiMosflm_tutorial_720_ver3html[29052015 105311]
$ipmosflm COORDS $identcoords SUMMARY $identsummary ltlt eof-ip Insert keywords copied from iMosflm batch window here
Keywords for this run For example could involve trying different values for mosaic spread or not integrating all images etc etchklout $identmtzgenfile $identgenprocess 1 1000 goeof-ip
pointlesspointless hklin $identmtz hklout $ident_pointlessmtz
aimlessaimless hklin $ident_pointlessmtz hklout $ident_aimless_partmtz ROGUES $identrogues ltlt eof-aimless Use all default options for aimlesseof-aimless
ctruncate hklin $ident_aimlessmtz hklout $ident_truncatemtz
Harry Powell Andrew Leslie and Owen Johnson
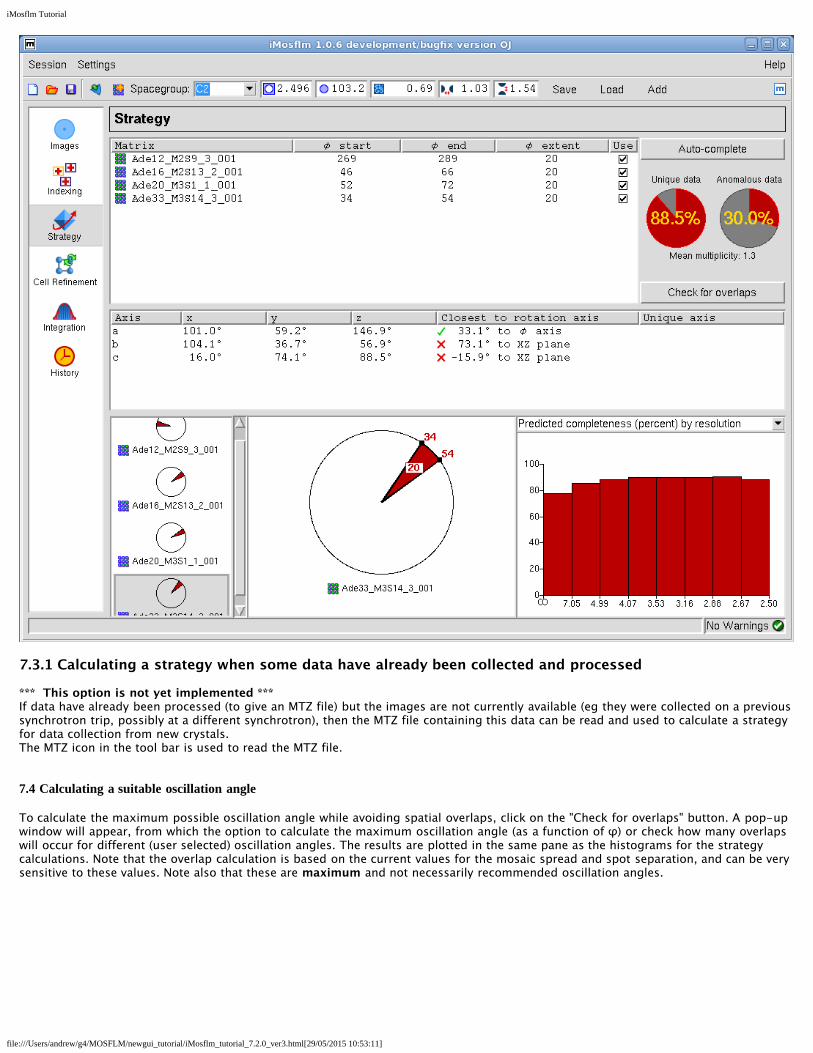
iMosflm Tutorial
fileUsersandrewg4MOSFLMnewgui_tutorialiMosflm_tutorial_720_ver3html[29052015 105311]
There are several ways to select the images to be used in cell refinement Whichever method is used the image numbers will bedisplayed in the Images entry field iMosflm will automatically select appropriate images but these can be changed
811 Manual selection
A list of images can simply be typed into this box An image series can be specified as n-m where n and m are the first and last imagesDifferent series must be separated by white space or comma
For orthorhombic or higher symmetries two segments should be given approximately 90deg apart in φ For monoclinic or triclinic datathree or four segments are best (eg φ = 04590135)
The number of images that should be included in each segment depends on the mosaic spread and oscillation angle A reasonablenumber is 2(mosaic spreadoscillation angle +1) MOSFLM will automatically select two or more segments as appropriate Note thatthere is a limit on the total number of images that can be used
812 Automatic selection
Selecting the Automatically select images icon will select a suitable set of images
813 Graphical selection (Not recommended)
Selecting this icon will give a new window
Images can be selected by clicking in the Use check-box in the list of images or by using the mouse to drag a selection of imagesfrom the sector displayed The other icons allow the sector to be zoomed in or out and the viewed area to be moved to make theselection easier The final two icons on the tool-bar switch the segment display to fit the display space as either a full circle or aquadrant This Image palette can be closed by clicking outside its area but will close after 60 seconds anyway
82 Integrating the images and refining the cell
Use one of the methods above to select images to use in cell refinement and click on the Process button Before starting cell refinementcheck that the prediction for the first image in each segment to be used is good The majority of the spot positions must be correctlypredicted for the first image in each segment or else the refinement will not work
The selected images will be integrated and following integration the cell parameters are refined Selectable refined detector parameters
iMosflm Tutorial
fileUsersandrewg4MOSFLMnewgui_tutorialiMosflm_tutorial_720_ver3html[29052015 105311]
will be plotted as will the changes in crystal orientation and (if selected) mosaic spread If the shift in cell parameters is greater than 25standard deviations another cycle of integration and cell refinement is carried out Typically two or three cycles are required forconvergence Note that the current program activity is shown in the bottom left-hand corner of the window in the status message area
The different windows are explained below Moving the mouse over any parameter or plotted graph point will give a full description ofit
821 The detector parameters window
The values of the refined detector parameters are displayed for each image as it is integratedThere is the option to fix any of the parameters during integration by checking the Fix box onthe right The positional residuals (overall central and weighted) are also listed
Any of these parameters can be selected for plotting on the graph that appears to the right ofthis box by simply clicking on that parameter (which is then highlighted in blue as shown herefor Beam x and Beam y)
Check the stability of the refined parameters by displaying the appropriate graphs To getsensible scaling of the graphs only parameters with similar numerical values should be plottedtogether
For weak images (ie few visible spots in the outer regions of the image) the tilt and twistmay not be well defined and might refine to large values (greater than one degree) Insuch cases these parameters should be fixed It is not generally recommended to fix any
iMosflm Tutorial
fileUsersandrewg4MOSFLMnewgui_tutorialiMosflm_tutorial_720_ver3html[29052015 105311]
other detector parameters
For very weak fine sliced images (Pilatus only) there is the option to sum images when findingsuitable spots for refinement see Settings -gt Processing Options -gt Advanced refinementwhich can in some cases make the refinement more stable
822 The crystal parameters window
The values of the refined crystal missetting angles φ(x) φ(y) φ(z) the unit cell parameters andmosaic spread for the current image are displayed in the table Selected parameters will beplotted as for the detector parameters Specific unit cell parameters can also be fixed
If more than one segment of data is being used for cell refinement it is not unusual to see achange in orientation of the crystal between the two segments
Observe how the crystal orientation is different for images in the two segments See how themosaic spread varies during refinement
823 The central spot profile
The average spot profile for the central region of the detector is plotted for eachimage This confirms that the spot prediction is good If the profile is not welldefined and central in the box or if the blue border for the peak region of the spot ismuch larger than the apparent spots size it suggests a problem with the integrationand the initial prediction should be checked In some cases it may be necessary toincrease or decrease the Profile Tolerance parameters to ensure that the blue boxfits the spot To do this select the Advanced integration tab of Processing optionsCheck the central spot profiles for the images used in the cell refinement
824 The summary window
This window presents a summary of how selected parameters have changed indifferent cycles of the cell refinement The behaviour of these parameters gives agood indication of whether the cell refinement has been successful
If the refinement has been successful the RMS residual should be lower for thefinal cycle than in previous cycles However errors in the cell can be compensatedquite well by changing the crystal to detector distance so the differences are notalways dramatic
The other parameters that can be plotted from the pull-down list are the detectordistance and the Pixel ratio (Yscale)
The detector distance should be the same for all images in the refinement If the original indexing was based on auto-indexing a singleimage (say the first) then the detector distance might change for images from the second segment to compensate for an error in theoriginal cell If the variation in distance for different images increases with the cycle number this indicates that the refinement is notstable
The Pixel ratio (Yscale) parameter may also show an initial variation for images in different segments because refining Yscale (whichshould be 10000 for all except Raxis II and Raxis HTC detectors) can compensate for errors in cell dimensions in the same way that thedistance can The final values (last cycle) should be very close to identical for all images and should also be very close to unity (to within00010)
Cell refinement can be unstable if the data do not extend to at least 35 Aring If it appears unstable use the cell derived from auto-indexing a series of images well spaced in φ instead
iMosflm Tutorial
fileUsersandrewg4MOSFLMnewgui_tutorialiMosflm_tutorial_720_ver3html[29052015 105311]
Examine the plots to see if the parameters are stable and correct (Yscale)
825 The final results
When refinement has converged (or after 5 cycles) the initial and final cell parameters and the estimated errors (std dev) are listed
If time is available make a note of the std dev values and repeat the cell refinement using a larger number of images in each segmentAre the standard deviations smaller when using more images
83 Refining cell parameters for multiple lattices
Providing the resolution is high enough (generally better than ~35-32 Aring) and not too many of the spots in the different lattices areoverlapped it is possible to refine the cell parameters for each lattice individually The lattice to be refined is selected from the Latticeselector
This selector will be grayed out when processing a single lattice
84 If the prediction for the first image of a segment is poor
In some cases depending on how the indexing has been carried out or if the diffraction is poor or there has been a large change incrystal orientation during the data collection the prediction for one or more of the segments (the first image) may be poor In suchcases the integration and hence the cell refinement may fail It may be possible to successfully process the images after an initialrefinement of the crystal orientation using a pattern matching algorithm To select this option got to the Advanced refinement tab ofProcessing options and select the tick box for Refine orientation of first image in any run by pattern matching and for Integrate allimages Then refine the cell in the usual way During integration the orientation will be refined for the first image of each segmentoutput for this additional refinement will be written to the logfile but is not shown in the GUI
9 IntegrationThe accurate cell parameters are now used in the integration Note that although the images are integrated during the cell refinementthe intensities are not saved and no MTZ file is generated at that stage
It is good practice to start by integrating a block of images corresponding to a few degrees of data to check that the parameters do notneed further adjustment MOSFLM will generate warning messages after integration if there are any difficulties and it may be possibleto improve the situation by changing some of the default parameters (see Warning messages sect13)
Before integration ensure that the backstop shadow has been defined (see Masked areas backstop sect411 and Masked areas generalsect412)
91 Image selection
Image selection is performed in exactly the same way as in the cell refinement In this case the Automatic selection will simply includeall images in the current sector
Select images 1-10
92 Setting the MTZ filename and controlling updating of the image display
Two icons appear when the integration option is chosen
If the Show predictions icon is clicked the display window will be updated as eachimage is processed This will slow down the processing but allows the accuracy of theprediction to be checked for each image
iMosflm Tutorial
fileUsersandrewg4MOSFLMnewgui_tutorialiMosflm_tutorial_720_ver3html[29052015 105311]
Click on this icon so that the display will be updatedThe filename of the MTZ file containing the results of the integration is generatedautomatically but can be edited manually
93 Integrating the images
Click on the Process button to start integration
Integration of the images occurs in two passes In the first pass for each block of images (a number corresponding to a few degrees ofdata selected automatically by MOSFLM) the detector and crystal parameters are refined for each image in turn and the measurementboxes for all predicted spots are written to a file for use in the second pass In the second pass the standard profiles are formed fromreflections present on all of the images in this block and each image is then integrated and the results written to the MTZ file Thedisplay is not updated during the second pass and will remain on the last image of the block (assuming image updating has beenselected)
Note that the unit cell dimensions are normally fixed during integration and only the crystal orientation and mosaic spread are refinedCrystal parameter refinement only starts when a sufficient number of images have been integrated to provide data for the post-refinement typically after ~05-1 degree (more for high mosaicity)
94 Parameter display windows
As described in sect82 the refined detector and crystal parameters will be displayed in tables and selected parameters will be plotted ingraphs The average spot profile for each image will also be displayed
The size of these graphs (and the profile) can be expanded to fill the whole window by holding down Shift and clicking LMB anywherein the graph window A second Shift+click will revert the graph to the original size
In addition to these windows there are windows that tabulate and plot (as a function of image number) the mean Iσ(I) for profile fittedand summation integration intensities The overall values and the values for the highest resolution bin are given
The number of overloaded reflections Bad spots (ie those that fail certain tests see mosflm SUMMARY file sect15) Spatial overlaps andif processing multi-lattice images the number of lattice overlaps is listed for each image and can be plotted by highlighting thatparameter When processing data from crystals with large unit cells it is important to watch out for spatial overlaps (see sect97 for tips onhow to reduce the number of spatial overlaps if this is a problem)
A display of the standard profiles for different regions of the detector is also provided Poor profiles are averaged by includingreflections from inner regions of the detector Averaged profiles are indicated by a red line around the spot (rather than blue) Theoriginal unaveraged profile can be viewed a clicking on the profile (providing there were sufficient spots in that region to allowformation of a profile)
The profiles should be checked to see that they are well defined and centred within the box Poorly-defined diffuse or non-centredprofiles may suggest that the prediction is not very good in which case this should be checked on the corresponding image(s)
It may be useful to expand the standard profiles to fill the window using Shift + click in the profiles window
Finally the lower left window plots Iσ(I) as a function of resolution for any selected image
iMosflm Tutorial
fileUsersandrewg4MOSFLMnewgui_tutorialiMosflm_tutorial_720_ver3html[29052015 105311]
Different parameters can be plotted by selecting the small right- or left-pointing arrows on the title line above the plot
95 Integrating the whole datasetAssuming that everything looks OK the entire dataset can now be integrated However it is strongly recommended thatProjectCrystalDataset names are assigned first These are written to the output MTZ file and used by downstream programs inparticular AIMLESS will use this information when deciding which images belong to the same dataset
Select Experiment settings from the Settings drop-down menu (see Drop down menus sect21) to enter these names and optionally givea title for the MTZ file
Select images 1-84 and click on Process
951 Parallel Integration Using multiple cores
An option is available on the pull-down menu (next to the Process button in the Integration task) which splits up the integration jobover available cores on the local machine All aspects are currently determined automatically at present user-configurable options willbe available in a later version The algorithm used is as follows
iMosflm determines the number of cores available on the local machineIf the number of cores (N) is greater than 2 iMosflm splits the integration run into N-1 batches (up to a maximum of 16) containingapproximately the same number of images If N le 2 iMosflm splits the run into N batches
If the total number of images in each batch is less than 32 the number of batches is decreased until this condition is satisfied
The first batch is submitted as a background task consisting of a refinement stage and an integration stage with its input and outputfiles (including the MTZ file) in a new directory its name being determined from the number of segments of data being integrated andthe lattice number (if the sample has been determined to contain multiple lattices) If the directories exist already they are all movedinto a newly-created directory with a time-stamped name the files from the most recent integration run are thus in directories withnames following the pattern described above Once the refinement stage is complete the refined parameters are written to a file
The launch of subsequent batches are delayed until the corresponding preceding batch has written its refined parameters This file isread and the new batch is launched again with a refinement stage and integration stage
At present the job cannot be aborted once it has started
952 Integrating as a background job
By selecting Batch in the drop-down menu adjacent to the Process button the integration can be run as a background job rather thaninteractively and the GUI can be used to look at a different dataset
Selecting Batch from the drop-down menu will display a new window showing the script that will be used to process the images alongwith a number of processing options The script can be edited if additional keywords are required or if some parameters are to bechanged and can also be copied and pasted into a file for off-line processing
By default the job is divided into batches across multiple cores as determined for the parallel integration described in sect951 but thenumber of cores can be chosen by the user from a drop-down menu in this case the size of each batch is determined by the interface
Plotting the results of the integration can be turned off this can make processing much faster
iMosflm Tutorial
fileUsersandrewg4MOSFLMnewgui_tutorialiMosflm_tutorial_720_ver3html[29052015 105311]
It is possible to configure job submission for remote machines (which can be added by depressing the add host button) Ensure youhave enabled passwordless logins for all the remote machines you enter and that you specify the full path to the Mosflm executable inthe Batch destinations window The remote working directory (in which the log and MTZ files are written) and the remote imagedirectory must both be specified with their full path names Any required parameter fields that are not completed by the user arehighlighted in orange if the user tries to submit a job without completing these fields a new window containing only those fields (againhighlighted in orange) pops up with a request to do so
The number of cores available on the selected host can be determined by depressing the apple core button on the Batch destinationsconfiguration window
The log file for batch submission jobs the MTZ and SUMMARY files are written to the directory in which iMosflm was launched
96 Checking the integration
iMosflm Tutorial
fileUsersandrewg4MOSFLMnewgui_tutorialiMosflm_tutorial_720_ver3html[29052015 105311]
The detector and crystal parameter plots should be examined carefully to check for any instability in the refinement If there are largeand random variations in some parameters (eg the detector twist and tilt) then it may be better to fix them and repeat the integration
For cases (eg very small unit cells) where there are very few suitable reflections on each image the refinement of the missetting anglesmay show significant variations from one image to the next In such cases it is best to apply smoothing to the missetting angles usingthe tick box in Settings -gt Processing options -gt Advanced Refinement
Discontinuities due to blank images should also show up and the offending images should be removed from the scaling run
If adjacent spots are incompletely resolved on the detector it may be possible to improve the processing by increasing the PROFILETOLERANCE parameters by 1-2 These parameters can be set in the Advanced integration tab of the Processing options menu (useSettings)
97 Advanced features for integration
The Settings -gt Processing options menu allows additional control over the integration Parameters such as the minimum spotseparation resolution limits excluded resolution ranges block size MTZ filename and BATCH ADD can be changed in the Processingtab
Manually decreasing the minimum spot separation can help if a large number of reflections are flagged as spatially overlapped (redboxes) The prediction must be updated to see the effect of changing the separation this can be done either by displaying the next orprevious image or double clicking on the blue circle next to the image currently displayed in the Images pane
In the Advanced integration tab the measurement box parameters profile tolerance and profile averaging parameters can be set
The measurement box parameters can be adjusted for rare cases where the estimation of the spot size has not worked correctlyresulting in a box that is too small or too large The optimisation of the background rim and corner cutoff parameters that determinewhich pixels are used for the background and which pixels for the peak can also be turned off but this is generally not recommended
Increasing the profile tolerance can help in cases where adjacent spots are not completely resolved this can be judged by examining thestandard profiles By default the profile tolerance is automatically increased if there are a large number of spatial overlaps as this hasthe effect of reducing the minimum spot separation A message will be written to the logfile if this has happened This option can beturned off using the tick box Optimise profile tolerance values to avoid spot overlap
The profile outlier exclusion parameters control the exclusion of ice spots or hot pixels which could otherwise corrupt the standardprofiles
Pixels with a value less than the Null pixel threshold are considered to belong to inactive regions of the detector
The pixel saturation value determines when a reflection is considered to be an overload The intensity of overloaded reflections isestimated by profile fitting but these reflections are rejected by the scaling program AIMLESS by default
Increasing the Maximum reflection width in φ from the default value of 5deg will reduce the number of rejected reflections (green boxes)and is worthwhile when the mosaicity is very high or the mosaic block size is very small As with the minimum spot separation theimage must be refreshed to see the effect of changing this parameter
The rejection criteria will reject reflections with too much variation in the background (BGRATIO) or where the gradient of thebackground plane is too large These should only be changed if many reflections are being rejected PKRATIO only applies to fullyrecorded reflections and reflects a very poor profile fit With current data collection protocols there will be very few (if any) fullyrecorded reflections
Additional MOSFLM parameters will be added based on user requests
98 Integrating multiple lattices
When multiple lattices have been successfully indexed each lattice can be integrated individually by selecting the appropriate latticenumber
Reflections in the chosen lattice that are overlapped by a reflection from another lattice will be integrated but the measurement box willbe expanded so that the total intensity of the two (or more) reflections is measured These reflections will be flagged for specialtreatment Reflections that are not overlapped are referred to as singletons They will be dealt with in the normal way by POINTLESSand AIMLESS
NOTE If more than one lattice has been indexed and the results of integrating just ONE of the lattices are to be checked byrunning QuickSymm or QuickScale then the multi-lattice icon in the Integration pane must be turned off otherwise an error
iMosflm Tutorial
fileUsersandrewg4MOSFLMnewgui_tutorialiMosflm_tutorial_720_ver3html[29052015 105311]
message will be given saying that all lattices must be integrated
It is often the case that by measuring both lattices (in separate integration runs) and inputting both MTZ files to QuickScale the overallcompleteness is high using ONLY the singletons To use this option ensure that the multi-lattice icon is off
To make use of the intensity estimates for overlapped reflections MTZ files for all lattices must be input to the program FECKLESSwhich will derive the best estimate of the summed intensity This is the default option if more than one lattice has been indexed and itrequires that all lattices have been integrated (in separate runs) prior to running QuickSymm or QuickScale (FECKLESS will be runautomatically)
At this time no downstream programs can make use of the summed intensities of overlapping reflections but in the future it should bepossible to use this data in REFMAC
Currently it is recommended to use only singletons from all the lattices FECKLESS is not required in this case
The MTZ filename is automatically updated to reflect which lattice has been chosen to avoid overwriting the MTZ file of the first latticewhen integrating the second one FECKLESS when run from iMosflm relies on this naming convention so do not change it
10 Running Pointless to check the symmetryOnce the images have been integrated (even a few degrees of data in many cases) the program POINTLESS can be run to determine thetrue Laue symmetry and try to determine the space group using the QuickSymm button
iMosflm Tutorial
fileUsersandrewg4MOSFLMnewgui_tutorialiMosflm_tutorial_720_ver3html[29052015 105311]
Select the QuickSymm button
A summary of the Pointless results as shown below will appear in a qtRView window
Various graphs (L test for twinning ViewHKL to view the reciprocal lattice) can also be viewed in this window
Various options for POINTLESS such as a reference MTZ file forcing the symmetry selected in iMosflm and specifying multiple input MTZfiles can be selected from the Settings -gt Processing options -gt Sort Scale and Merge tab (see below)
iMosflm Tutorial
fileUsersandrewg4MOSFLMnewgui_tutorialiMosflm_tutorial_720_ver3html[29052015 105311]
Caution The results can be ambiguous if run with a partial dataset Look in the logfile to see how many relfections are used totest each possible symmetry operator
11 Running Aimless to scale and merge the dataSelect the QuickScale button
This will first run POINTLESS then change the space group for the data to that selected by POINTLESS (unless the iMosflm symmetry isset to override POINTLESS) run AIMLESS to scale and merge the data in that space group and then run CTRUNCATE which calculates anumber of statistics from the intensity data The CCP4 UNIQUEIFY script will then be run which generates all the unique reflections forthat spacegroup to the resolution of the measured data and will flag reflections (5 by default but this can be changed) for use as theRfree set
AIMLESS can be run from the QuickScale button either treating anomalous data (the default) or ignoring anomalous data If onlyprocessing a few degrees of data it is usually better to ignore anomalous because especially for low symmetry cases no mergingstatistics may be given in AIMLESS
SCALA can be selected as an alternative to AIMLESS for scaling (not recommended)
There is limited control over running AIMLESS (see figure above) including re-setting resolution limits rejecting batches (images)changing the treatment for accepting partials changing the rejection criterion and changing the procedure for updating the standarddeviation estimates
iMosflm Tutorial
fileUsersandrewg4MOSFLMnewgui_tutorialiMosflm_tutorial_720_ver3html[29052015 105311]
The AIMLESS results will be displayed in the qtRView as shown below along with graphical output (see below) and the full log file canalso be examined
Aimless summary file
iMosflm Tutorial
fileUsersandrewg4MOSFLMnewgui_tutorialiMosflm_tutorial_720_ver3html[29052015 105311]
An example of the Aimless graphical output
The AIMLESS logfile can also be examined by selecting the Log File tab
12 History and mosflm log fileSelecting History allows the history of the session to be examined or by selecting the Log tab the full mosflmlp file can be viewed Themosflmlp file is also available in a time-stamped file mosflm_yyyymmdd_hhmmsslp (eg mosflm_20100518_131019lp) and can beread with a text editor
The History has a tree structure and will show when various parameters have been changed This has not been fully implemented and isnot generally useful
The logfile may provide useful clues when processing has failed
13 Warning MessagesAs already mentioned in Adding images sect3 and Integration sect9 warning messages are generated by MOSFLM during processing Atraffic light colour coding has now been assigned based on the warnings and is shown next to the Warnings box
A Red status implies a serious problem that will affect data quality and should be addressed
An Orange status implies minor issues that should be checked to see if things can be improved
A Green status means no significant problems messages are for information only
iMosflm Tutorial
fileUsersandrewg4MOSFLMnewgui_tutorialiMosflm_tutorial_720_ver3html[29052015 105311]
Abbreviated messages can be obtained by clicking on the Warnings icon The full warning Details together with Hints amp Notes text (ifany are available) can be obtained by double-clicking the relevant warning Details are displayed in a pop-up text box which willdisappear with the next click outside the box The same full details and suggestions are of course available in the mosflmlp files whereeven more information may be available
NOTE This is the end of the part of the tutorial which deals directly with iMosflm but see sect19 which has some suggestions forfurther work if you have time The remainder of this document deals with integrating and scaling data with MOSFLM andAimless via the CCP4i user interface examining the traditional mosflm SUMMARY file with the CCP4 utility loggraph
The Appendix contains a shell script for running MOSFLM as a traditional batch job
14 Useful command line optionsiMosflm has a number of command line options and these can be listed by typingimosflm --helpCurrent options are
--allimages -a ltfilenamegt Starts mosflm loading all files that match the template generated from ltfilenamegt--ccp4i2 Autosaves an iMosflm session file upon exit with an XML list of all iMosflm output files--debug -d Creates a large output file for debugging purposes Dont use this unless asked to by a developer--expert -e Permits access to advanced detector settings This should not normally be required--fastload -f Attempt to speed loading of many images offline while indexing two default images separated by 90 degrees--help -h Displays this message then exits--imagedir -I ltdirectorygt Starts the image browser in this directory if ltdirectorygt is given as an environment variable it will be expanded to its full value--init -i ltfilenamegt Starts Mosflm and reads from the given saved session file--startdir -S ltdirectorygt Starts mosflm in directory ltstartdirgt rather than the current directory This will only work if the directory exists and you have write permission to it otherwise iMosflm will exit All the normal mosflm output files will be in this directory--singleimage -s ltfilenamegt Starts mosflm loading only the image from ltfilenamegt--site -X ltfilenamegt Reads anyall of the following lines from the file given WAVELENGTH ltxgt DISPERSION ltxgt POLARISATION [PINHOLE | MIRRORS | MONOCHROMATOR | SYNCHROTRON ltxgt] DIVERGENCE ltxh xvgt BEAM ltbeamx beamygt DISTANCE ltxgt DISTORTION TILT ltxgt DISTORTION TWIST ltxgt GAIN ltxgt DETECTOR REVERSEPHI DETECTOR OMEGA ltxgt--version -v Displays the program version and required Mosflm version then exits
These can be abbreviated to the shortest unambiguous string
141 The site fileimosflm --site ltsitefilegt will read keywords from the file ltsitefilegt that will overwrite incorrect information in image headers Thissaves having to manually correct values in every iMosflm session The site file can also be read or written as an option from the Sessionmenu (see Drop down menus sect21) Allowed keywords areWAVELENGTH ltxgt
iMosflm Tutorial
fileUsersandrewg4MOSFLMnewgui_tutorialiMosflm_tutorial_720_ver3html[29052015 105311]
DISPERSION ltxgtPOLARISATION [PINHOLE | MIRRORS | MONO | SYNCHROTRON ltxgt]DIVERGENCE ltxh xvgtBEAM ltbeamx beamygtDISTANCE ltxgtDISTORTION TILT ltxgtDISTORTION TWIST ltxgtGAIN ltxgtDETECTOR REVERSEPHIDETECTOR OMEGA ltxgt
15 The mosflm SUMMARY fileMOSFLM produces a summary file listing refined parameters for each image and when using iMosflm this file will be date- amp time-stamped and have a name such as mosflm_20100518_131019sum This contains the same information as the plots produced by theiMOSFLM GUI which now also include the number of bad spots and overloads
This can be inspected graphically from the CCP4i GUI using the program loggraph Select the pull down menu View Files from Job andunder Output files select Additional log graphs where the _SUMMARYloggraph file will be listed Select this file to display its tablesin loggraph
This is very useful to identify rogue images (with unusually high positional residual or low Iσ(I)) If you find any read that image intoMOSFLM and see what is wrong with it
If you have done more than one integration run during your MOSFLM session you will find multiple entries of the tables Look at the lastset for integration of the 84 images
Click on the Refined detector parameter tables and check on the stability of parameters like the TILT and TWIST of the detector (unitsare hundredths of a degree) and for Mar Research (or DIP) image plate data the distortion parameters ROFF and TOFF (units are mm) Ifthey are varying a lot (more than 20 for TWISTTILT) or 015 for ROFFTOFF then it is probably a good idea to fix these parameters atthe average value (or the known values for this detector if they are available) (see Detector parameters sect821)
Click on the Post refinement table and check the missets It does not matter if they change slowly and by an amount (per image) that isless than 01mosaic spread If they are changing more than this then there could be a problem with processing the data (there is notmuch you can do about this)
Check how the mosaic spread is changing If it is unstable or if you think it is not refining to sensible values (as judged by looking atthe prediction) then you can fix the input value in the same way as the detector parameters (see Crystal parameters sect822)
BADSPOTS AND OVERLOADS
The program will set a rejection flag for those reflections that fail certain tests for example too much variation in the background levela poor profile fit an intensity that is very negative (more than 5 standard deviations) a very high gradient for the background planeThese reflections are called Bad spots and they are listed individually for each image in the mosflmlp file together with the reason forflagging them The number of bad spots is also written to the summary file Generally there should be very few (5-10) bad spots oneach image If there are more it could be because the backstop shadow is not correctly allowed for (consider using the NULLPIXkeyword)
There should also be very few overloaded reflections on each image If there are a lot then a separate low resolution data collectionpass should be made with a much shorter exposure time
IMPORTANT Both Bad spots and Overloads are written to the output MTZ file but will be rejected by default by AIMLESS Theintensity of overloaded reflections is estimated by profile fitting that part of the spot that is not saturated To include these reflections inthe final merged data use the ACCEPT keyword in AIMLESS
16 Scaling data with CCP4i ccp4i
Select Directories amp ProjectDir (top right)
In the new window select Add project
Enter the project name in the Project field and the full directory path in the uses directory field Default values may have been enteredalready here Select this project from Project for this session
Select Apply and Exit Dismiss the warning message that comes up
Select Data reduction from the pull down menu of modules (orange bar at top left)
iMosflm Tutorial
fileUsersandrewg4MOSFLMnewgui_tutorialiMosflm_tutorial_720_ver3html[29052015 105311]
Select Symmetry Scale Merge (Aimless)
In the window that appears do the following
Give a job title (top line)
Click on the box next to Separate anomalous pairs for outlier rejection amp merging statistics (the crystals have been soaked in a mercurycompound)
In the next orange bar (line starts HKLIN 1) select Browse and select the MTZ file output by MOSFLM (probably called hg_001mtz)Select OK
If you did not supply the Project name Crystal name or Dataset name to Mosflm fill in the boxes for these now
Under Scaling Protocol
From the pull-down menu on the line starting Scale select with automatic default settings
At the bottom of window from the pull-down menu named Run select RunampView Com File
This will display a new window showing the command file for running the POINTLESS step select Continue After a brief pause it willshow the command file for running AIMLESS (This can be edited before submitting the job) Select Continue
In the main window it will show that the AIMLESS job is running
When AIMLESS has finished the command file for running the CTRUNCATE step will appearselect Continue
When CTRUNCATE has run the main window will say FINISHED
At that point select the pull-down menu View Files from Job and select View Log Graphs This will give you the same graphs asrunning loggraph on the AIMLESS log file they are also the same as those that appeared in IMOSFLMs QuickScale task To look at thelog file itself (eg the overall merging statistics) select View Log File and it will appear in a new window
161 Looking at the AIMLESS output
The simplest way to look at the output from AIMLESS is to use loggraph on the AIMLESS log file (or via the CCP4i GUI) This can displaymany different graphs
Use Scales vs rotation range to check for smooth variation in the scale factor Check the variation in B factor with image and if there isno real variation it is best to turn off the B-factor refinement
Use the Analysis against all Batches for all runs to detect bad images (high R-factor large number of rejected spots)
Check the Analysis against resolution Fractional bias to see if there is any indication of Partial bias (A negative partial bias will resultif the mosaic spread is underestimated or if there is a lot of diffuse scatter
The Fractional bias should be less than 1-2 although it will often exceed this for weak data (eg in the high resolution bins)
The Axial reflections graphs in AIMLESS are useful for detecting systematic absences which can be used to identify the true spacegroup However the detection of screw axes is thought to be sufficiently robust in POINTLESS that these graphs are no longer necessary
It can also be useful to look at the AIMLESS log file itself in particular the table giving statistics as a function of resolution The effectiveresolution limit of the data can be estimated by looking at the Mn(I)sd column (this is the mean Iσ(I) AFTER merging symmetry matesand is the best indicator of data quality) This table also shows shell and cumulative R-factors
The Mn(I)sd values depend on having realistic values of the standard deviations (errors) in the intensities As the values that come fromMOSFLM are always underestimates of the true error these values are scaled up in AIMLESS using a three-term correction
sdcorrected = SdFac Sqrt[sd(I)2 + SdBLPI + (SdAddI)2]
Here SdFac is an overall scale factor and SdB and SdAdd are intensity dependent factors
AIMLESS will automatically work out a suitable value for all three parameters in order to make the mean value of (observedscatter)(sdestimate) equal to 10 where observed scatter is the difference between an individual estimate of intensity and the mean ofall other estimates (from symmetry mates)
Probably the best estimate of the true high resolution limit of the data can be obtained from the CC(12) values these are thecorrelations between equivalent observations that have been divided randomly into two half-datasets The resolution limit is foundwhen the CC drops below ~ 05 - 03
This table comes under the heading
ANALYSIS OF STANDARD DEVIATIONS
iMosflm Tutorial
fileUsersandrewg4MOSFLMnewgui_tutorialiMosflm_tutorial_720_ver3html[29052015 105311]
in the AIMLESS log file and Run n standard deviation v Intensity test (where n is 1 or more) in the CCP4i GUI View Files from Job -View Log Graphs display
Can you identify a bad image in this dataset Can you work out why it is bad
(Cluethe image headers contain quite a lot of information that is not used by MOSFLM including the date and time that the image wascollected)
You can exclude a given batch from the scaling using the EXCLUDE keyword
RUN ALL EXCLUDE imagenumber
In this case run number will be 1
Rerun the scaling SENDING THE OUTPUT TO A NEW LOGFILE excluding this image and see the effect on the heights in the anomalousPatterson (in the log file) DO NOT repeat the integration In the command file uncomment the line (near the top) goto aimless so itskips the integration part
In the CCP4i GUI click to highlight the AIMLESS job which is listed as FINISHED and select ldquoReRun Jobrdquo from the control buttons downthe right-hand side of the main interface window Under ldquoExcluded Datardquo in the window that appears check the box next to Excludeselected batches and pull-down on the menu button to exclude a range Give the start amp end range to exclude (eg 74 to 74) Rerunthe job as before
17 Changing the symmetryFrom the list of options at the left hand side of the main window select ldquoUtilitiesrdquo and under that SortModifyCombine MTZ Files
In the new window give a new title eg reindex as H32
Click on the Box Change space group andor reindex reflections
Use the browse option to select the input MTZ file (First orange bar) the output filename will be generated automatically (but you canchange it)
Under Reindex details
In the last option check the box next to ldquoChange space group tordquo and enter H32 in the box This is above the final item Reducereflections to the asymmetric unit which is checked by default
Select Run from the Run option button
Then go back to the scaling window and select the new MTZ file (reindexed) as the input for scaling (use Browse) CHANGE THE JOBTITLE
Then select RUN
The scaling will now be performed in space group H32 Look at the merging statistics in the log file in particular the multiplicityweighted R-factor called Rmeas in the log file
18 Looking at the CTRUNCATE outputThe CTRUNCATE program converts intensities to amplitudes and also compiles some useful statistics The LTEST and the cumulativeintensity statistics tabulated by CTRUNCATE (and plotted by loggraph) provide the only point at which you will be able to detectmerohedral twinning (when the two lattices of the twin components exactly overlap and every measured intensity is actually the sum oftwo intensities)
For a good dataset the observed distribution should be within 1 of the theoretical distribution Is this the case for this data
19 If you have time 191 Different mosaic spreads
Try repeating the processing with the mosaic spread set to a value 25 smaller than the refined one and fix it by checking the Fix boxin the Integration window in iMosflm
Can you tell from the merging statistics if this data is better
192 Checking up on outliers
iMosflm Tutorial
fileUsersandrewg4MOSFLMnewgui_tutorialiMosflm_tutorial_720_ver3html[29052015 105311]
AIMLESS writes a file called ROGUES which lists reflections which show very poor agreement between symmetry mates or which areimplausibly large
Look in this file (it is ASCII) and try to work out why this has happened The ROGUES file gives you the image (Batch) on which thereflections have been recorded (for partials this is the image nearest the centre of the reflection so you may need to look on thepreceding and following image as well) Select a reflection which shows very poor agreement with its symmetry mates (A value greaterthan 10 in the DelIsd column in the ROGUES file)
Select the offending image by double-clicking it in the Images pane of the iMosflm main window Predict the reflections then enter thehkl values into the boxes and hit Return (or click the red warning button following the entry box for l) to locate the offending reflectionin the image You must give the measured indices - the first set of values in the ROGUES file - when doing this See if there is anythingodd about the spot Remember to check adjacent images for partials
193 How accurate does the unit cell have to be
Try changing the cell parameters by (say) 10 and integrate the images again What is the effect on the merging statistics
20 Tips1 When reading images into a session DO NOT attempt to carry out any other task until ALL the images have been read2 It is often worth repeating the indexing (usually only once) as the refined direct beam coordinates from the first indexing may give
an improved solution when the indexing is repeated (lower rmsd)3 Always integrate a few degrees of data before integrating the whole dataset (see sect9) If the space group is not known in advance
run Quicksymm with a few degrees of data to check that the correct indexing solution has been chosen4 For difficult images do not attempt to refine the unit cell initially once an indexing solution has been obtained try integrating a
few images to ensure that the integration is stable If then going on to refine the cell check that the prediction looks OK for thefirst image of every segment included in the refinement If it does not look very good consider using the pattern matching(Settings -gt Processing options -gt Advanced refinement see sect84)
5 If the resolution of the data is less than 35 Aring do not use the ldquoRefine Cellrdquo task Instead use several images in indexing and use thecell that comes from the indexing
6 If iMosflm gets into a state where the activity icon(upper right) is spinning but nothing seems to be happening click on the activityicon to stop it spinning and see if the session can be continued DO NOT click on the activity icon simply to abort a task this willgive unpredictable results Use the Abort button for cell refinement or integration There is no defined way to abort indexing
7 Use the image summation option (see sect4) to get a better impression of the diffraction for very low exposure Pilatus images8 Use image summation for detector parameter refinement for fine sliced very weak Pilatus images (Settings -gt Processing options -
gt Advanced refinement see sect821)9 For large mosaic spread values (gt 10deg) or small mosaic block sizes (lt10) consider increasing the maximum allowed reflection
width to avoid having too many green predicted reflections (Settings -gt Processing options -gt Advanced integration see sect97)10 By default on selecting the Indexing task iMosflm will find spots index and (assuming a solution has been found) estimate the
mosaicity For difficult cases it is more useful to restrict this to simply finding spots and then do the indexing and mosaicityestimation by clicking the appropriate buttons To do this change the check box Automatically index after spot finding inSettings -gt Processing options -gt Indexing
11 See sect521 and sect522 for advice if the indexing fails Also consider the possibility of a reversed phi rotation direction if you arenot familiar with the beamline (Settings -gt Experiment settings -gt Experiment see sect21)
12 If the detector parameters have refined to physically unreasonable values (eg because cell refinement or integration has beencarried out using an incorrect indexing solution) be sure to reset the detector parameters before attempting further processing(Settings -gt Experiment settings -gt Detector see sect21)
13 Always set the resolution limit slightly beyond the point at which any spots are visible (see sect414 ) For very weak fine-sliceddata it can be very difficult to estimate the resolution visually so integrate to the maximum resolution (inscribed circle) and usethe merging results to set the final resolution There should be no problems integrating to a resolution ~03-05 Aring beyond theactual resolution limit but for example integrating to 3 Aring when the true resolution limit is 5-6 Aring may cause problems and theintegration should then be repeated with a more realistic resolution limit
14 Use the site file sect141 if repeatedly processing data where the direct beam position is wrong or if the phi direction is reversed etcto save having to correct this for every session
Appendix IA command script for running MOSFLM using the keywords copied from the Batch processing window of the new GUI (see Integratingas a background job sect952) Note that keyworded input for MOSFLM and other CCP4 programs is case-insensitive apart from file anddirectory names
bincsh -fv Set a unique identifier for filenames for this job
set ident = x89_mos07_blk3_smallsep
iMosflm Tutorial
fileUsersandrewg4MOSFLMnewgui_tutorialiMosflm_tutorial_720_ver3html[29052015 105311]
$ipmosflm COORDS $identcoords SUMMARY $identsummary ltlt eof-ip Insert keywords copied from iMosflm batch window here
Keywords for this run For example could involve trying different values for mosaic spread or not integrating all images etc etchklout $identmtzgenfile $identgenprocess 1 1000 goeof-ip
pointlesspointless hklin $identmtz hklout $ident_pointlessmtz
aimlessaimless hklin $ident_pointlessmtz hklout $ident_aimless_partmtz ROGUES $identrogues ltlt eof-aimless Use all default options for aimlesseof-aimless
ctruncate hklin $ident_aimlessmtz hklout $ident_truncatemtz
Harry Powell Andrew Leslie and Owen Johnson
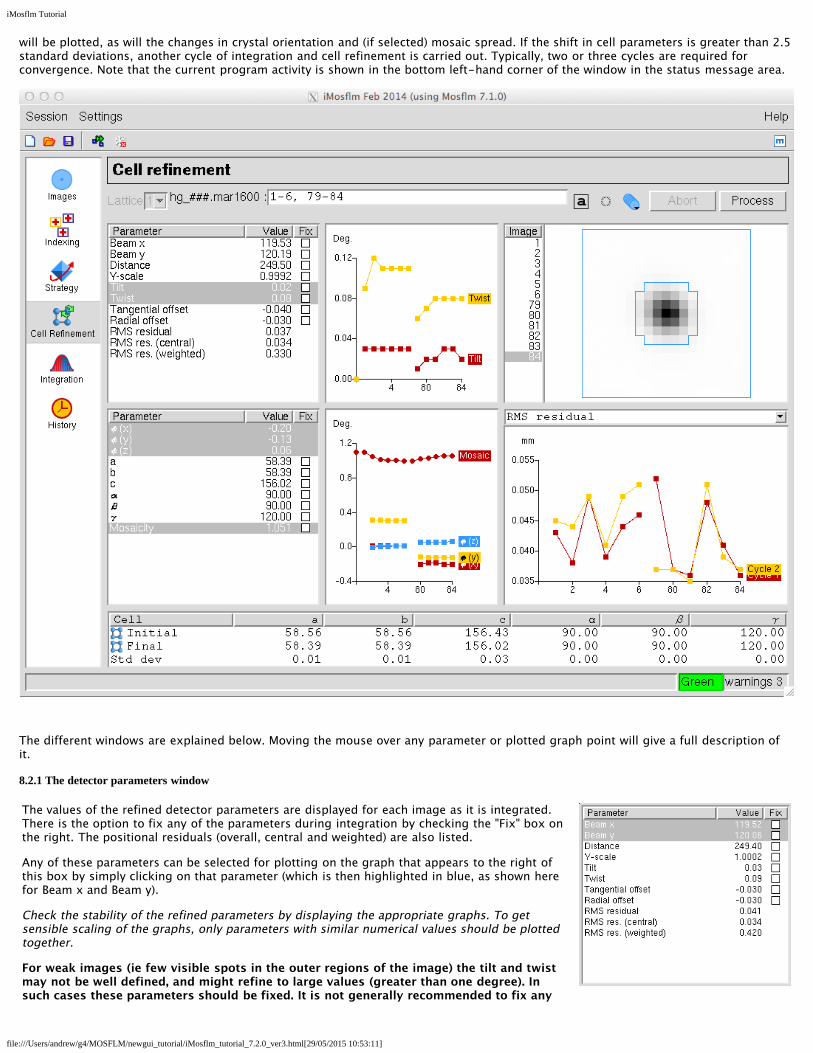
iMosflm Tutorial
fileUsersandrewg4MOSFLMnewgui_tutorialiMosflm_tutorial_720_ver3html[29052015 105311]
will be plotted as will the changes in crystal orientation and (if selected) mosaic spread If the shift in cell parameters is greater than 25standard deviations another cycle of integration and cell refinement is carried out Typically two or three cycles are required forconvergence Note that the current program activity is shown in the bottom left-hand corner of the window in the status message area
The different windows are explained below Moving the mouse over any parameter or plotted graph point will give a full description ofit
821 The detector parameters window
The values of the refined detector parameters are displayed for each image as it is integratedThere is the option to fix any of the parameters during integration by checking the Fix box onthe right The positional residuals (overall central and weighted) are also listed
Any of these parameters can be selected for plotting on the graph that appears to the right ofthis box by simply clicking on that parameter (which is then highlighted in blue as shown herefor Beam x and Beam y)
Check the stability of the refined parameters by displaying the appropriate graphs To getsensible scaling of the graphs only parameters with similar numerical values should be plottedtogether
For weak images (ie few visible spots in the outer regions of the image) the tilt and twistmay not be well defined and might refine to large values (greater than one degree) Insuch cases these parameters should be fixed It is not generally recommended to fix any
iMosflm Tutorial
fileUsersandrewg4MOSFLMnewgui_tutorialiMosflm_tutorial_720_ver3html[29052015 105311]
other detector parameters
For very weak fine sliced images (Pilatus only) there is the option to sum images when findingsuitable spots for refinement see Settings -gt Processing Options -gt Advanced refinementwhich can in some cases make the refinement more stable
822 The crystal parameters window
The values of the refined crystal missetting angles φ(x) φ(y) φ(z) the unit cell parameters andmosaic spread for the current image are displayed in the table Selected parameters will beplotted as for the detector parameters Specific unit cell parameters can also be fixed
If more than one segment of data is being used for cell refinement it is not unusual to see achange in orientation of the crystal between the two segments
Observe how the crystal orientation is different for images in the two segments See how themosaic spread varies during refinement
823 The central spot profile
The average spot profile for the central region of the detector is plotted for eachimage This confirms that the spot prediction is good If the profile is not welldefined and central in the box or if the blue border for the peak region of the spot ismuch larger than the apparent spots size it suggests a problem with the integrationand the initial prediction should be checked In some cases it may be necessary toincrease or decrease the Profile Tolerance parameters to ensure that the blue boxfits the spot To do this select the Advanced integration tab of Processing optionsCheck the central spot profiles for the images used in the cell refinement
824 The summary window
This window presents a summary of how selected parameters have changed indifferent cycles of the cell refinement The behaviour of these parameters gives agood indication of whether the cell refinement has been successful
If the refinement has been successful the RMS residual should be lower for thefinal cycle than in previous cycles However errors in the cell can be compensatedquite well by changing the crystal to detector distance so the differences are notalways dramatic
The other parameters that can be plotted from the pull-down list are the detectordistance and the Pixel ratio (Yscale)
The detector distance should be the same for all images in the refinement If the original indexing was based on auto-indexing a singleimage (say the first) then the detector distance might change for images from the second segment to compensate for an error in theoriginal cell If the variation in distance for different images increases with the cycle number this indicates that the refinement is notstable
The Pixel ratio (Yscale) parameter may also show an initial variation for images in different segments because refining Yscale (whichshould be 10000 for all except Raxis II and Raxis HTC detectors) can compensate for errors in cell dimensions in the same way that thedistance can The final values (last cycle) should be very close to identical for all images and should also be very close to unity (to within00010)
Cell refinement can be unstable if the data do not extend to at least 35 Aring If it appears unstable use the cell derived from auto-indexing a series of images well spaced in φ instead
iMosflm Tutorial
fileUsersandrewg4MOSFLMnewgui_tutorialiMosflm_tutorial_720_ver3html[29052015 105311]
Examine the plots to see if the parameters are stable and correct (Yscale)
825 The final results
When refinement has converged (or after 5 cycles) the initial and final cell parameters and the estimated errors (std dev) are listed
If time is available make a note of the std dev values and repeat the cell refinement using a larger number of images in each segmentAre the standard deviations smaller when using more images
83 Refining cell parameters for multiple lattices
Providing the resolution is high enough (generally better than ~35-32 Aring) and not too many of the spots in the different lattices areoverlapped it is possible to refine the cell parameters for each lattice individually The lattice to be refined is selected from the Latticeselector
This selector will be grayed out when processing a single lattice
84 If the prediction for the first image of a segment is poor
In some cases depending on how the indexing has been carried out or if the diffraction is poor or there has been a large change incrystal orientation during the data collection the prediction for one or more of the segments (the first image) may be poor In suchcases the integration and hence the cell refinement may fail It may be possible to successfully process the images after an initialrefinement of the crystal orientation using a pattern matching algorithm To select this option got to the Advanced refinement tab ofProcessing options and select the tick box for Refine orientation of first image in any run by pattern matching and for Integrate allimages Then refine the cell in the usual way During integration the orientation will be refined for the first image of each segmentoutput for this additional refinement will be written to the logfile but is not shown in the GUI
9 IntegrationThe accurate cell parameters are now used in the integration Note that although the images are integrated during the cell refinementthe intensities are not saved and no MTZ file is generated at that stage
It is good practice to start by integrating a block of images corresponding to a few degrees of data to check that the parameters do notneed further adjustment MOSFLM will generate warning messages after integration if there are any difficulties and it may be possibleto improve the situation by changing some of the default parameters (see Warning messages sect13)
Before integration ensure that the backstop shadow has been defined (see Masked areas backstop sect411 and Masked areas generalsect412)
91 Image selection
Image selection is performed in exactly the same way as in the cell refinement In this case the Automatic selection will simply includeall images in the current sector
Select images 1-10
92 Setting the MTZ filename and controlling updating of the image display
Two icons appear when the integration option is chosen
If the Show predictions icon is clicked the display window will be updated as eachimage is processed This will slow down the processing but allows the accuracy of theprediction to be checked for each image
iMosflm Tutorial
fileUsersandrewg4MOSFLMnewgui_tutorialiMosflm_tutorial_720_ver3html[29052015 105311]
Click on this icon so that the display will be updatedThe filename of the MTZ file containing the results of the integration is generatedautomatically but can be edited manually
93 Integrating the images
Click on the Process button to start integration
Integration of the images occurs in two passes In the first pass for each block of images (a number corresponding to a few degrees ofdata selected automatically by MOSFLM) the detector and crystal parameters are refined for each image in turn and the measurementboxes for all predicted spots are written to a file for use in the second pass In the second pass the standard profiles are formed fromreflections present on all of the images in this block and each image is then integrated and the results written to the MTZ file Thedisplay is not updated during the second pass and will remain on the last image of the block (assuming image updating has beenselected)
Note that the unit cell dimensions are normally fixed during integration and only the crystal orientation and mosaic spread are refinedCrystal parameter refinement only starts when a sufficient number of images have been integrated to provide data for the post-refinement typically after ~05-1 degree (more for high mosaicity)
94 Parameter display windows
As described in sect82 the refined detector and crystal parameters will be displayed in tables and selected parameters will be plotted ingraphs The average spot profile for each image will also be displayed
The size of these graphs (and the profile) can be expanded to fill the whole window by holding down Shift and clicking LMB anywherein the graph window A second Shift+click will revert the graph to the original size
In addition to these windows there are windows that tabulate and plot (as a function of image number) the mean Iσ(I) for profile fittedand summation integration intensities The overall values and the values for the highest resolution bin are given
The number of overloaded reflections Bad spots (ie those that fail certain tests see mosflm SUMMARY file sect15) Spatial overlaps andif processing multi-lattice images the number of lattice overlaps is listed for each image and can be plotted by highlighting thatparameter When processing data from crystals with large unit cells it is important to watch out for spatial overlaps (see sect97 for tips onhow to reduce the number of spatial overlaps if this is a problem)
A display of the standard profiles for different regions of the detector is also provided Poor profiles are averaged by includingreflections from inner regions of the detector Averaged profiles are indicated by a red line around the spot (rather than blue) Theoriginal unaveraged profile can be viewed a clicking on the profile (providing there were sufficient spots in that region to allowformation of a profile)
The profiles should be checked to see that they are well defined and centred within the box Poorly-defined diffuse or non-centredprofiles may suggest that the prediction is not very good in which case this should be checked on the corresponding image(s)
It may be useful to expand the standard profiles to fill the window using Shift + click in the profiles window
Finally the lower left window plots Iσ(I) as a function of resolution for any selected image
iMosflm Tutorial
fileUsersandrewg4MOSFLMnewgui_tutorialiMosflm_tutorial_720_ver3html[29052015 105311]
Different parameters can be plotted by selecting the small right- or left-pointing arrows on the title line above the plot
95 Integrating the whole datasetAssuming that everything looks OK the entire dataset can now be integrated However it is strongly recommended thatProjectCrystalDataset names are assigned first These are written to the output MTZ file and used by downstream programs inparticular AIMLESS will use this information when deciding which images belong to the same dataset
Select Experiment settings from the Settings drop-down menu (see Drop down menus sect21) to enter these names and optionally givea title for the MTZ file
Select images 1-84 and click on Process
951 Parallel Integration Using multiple cores
An option is available on the pull-down menu (next to the Process button in the Integration task) which splits up the integration jobover available cores on the local machine All aspects are currently determined automatically at present user-configurable options willbe available in a later version The algorithm used is as follows
iMosflm determines the number of cores available on the local machineIf the number of cores (N) is greater than 2 iMosflm splits the integration run into N-1 batches (up to a maximum of 16) containingapproximately the same number of images If N le 2 iMosflm splits the run into N batches
If the total number of images in each batch is less than 32 the number of batches is decreased until this condition is satisfied
The first batch is submitted as a background task consisting of a refinement stage and an integration stage with its input and outputfiles (including the MTZ file) in a new directory its name being determined from the number of segments of data being integrated andthe lattice number (if the sample has been determined to contain multiple lattices) If the directories exist already they are all movedinto a newly-created directory with a time-stamped name the files from the most recent integration run are thus in directories withnames following the pattern described above Once the refinement stage is complete the refined parameters are written to a file
The launch of subsequent batches are delayed until the corresponding preceding batch has written its refined parameters This file isread and the new batch is launched again with a refinement stage and integration stage
At present the job cannot be aborted once it has started
952 Integrating as a background job
By selecting Batch in the drop-down menu adjacent to the Process button the integration can be run as a background job rather thaninteractively and the GUI can be used to look at a different dataset
Selecting Batch from the drop-down menu will display a new window showing the script that will be used to process the images alongwith a number of processing options The script can be edited if additional keywords are required or if some parameters are to bechanged and can also be copied and pasted into a file for off-line processing
By default the job is divided into batches across multiple cores as determined for the parallel integration described in sect951 but thenumber of cores can be chosen by the user from a drop-down menu in this case the size of each batch is determined by the interface
Plotting the results of the integration can be turned off this can make processing much faster
iMosflm Tutorial
fileUsersandrewg4MOSFLMnewgui_tutorialiMosflm_tutorial_720_ver3html[29052015 105311]
It is possible to configure job submission for remote machines (which can be added by depressing the add host button) Ensure youhave enabled passwordless logins for all the remote machines you enter and that you specify the full path to the Mosflm executable inthe Batch destinations window The remote working directory (in which the log and MTZ files are written) and the remote imagedirectory must both be specified with their full path names Any required parameter fields that are not completed by the user arehighlighted in orange if the user tries to submit a job without completing these fields a new window containing only those fields (againhighlighted in orange) pops up with a request to do so
The number of cores available on the selected host can be determined by depressing the apple core button on the Batch destinationsconfiguration window
The log file for batch submission jobs the MTZ and SUMMARY files are written to the directory in which iMosflm was launched
96 Checking the integration
iMosflm Tutorial
fileUsersandrewg4MOSFLMnewgui_tutorialiMosflm_tutorial_720_ver3html[29052015 105311]
The detector and crystal parameter plots should be examined carefully to check for any instability in the refinement If there are largeand random variations in some parameters (eg the detector twist and tilt) then it may be better to fix them and repeat the integration
For cases (eg very small unit cells) where there are very few suitable reflections on each image the refinement of the missetting anglesmay show significant variations from one image to the next In such cases it is best to apply smoothing to the missetting angles usingthe tick box in Settings -gt Processing options -gt Advanced Refinement
Discontinuities due to blank images should also show up and the offending images should be removed from the scaling run
If adjacent spots are incompletely resolved on the detector it may be possible to improve the processing by increasing the PROFILETOLERANCE parameters by 1-2 These parameters can be set in the Advanced integration tab of the Processing options menu (useSettings)
97 Advanced features for integration
The Settings -gt Processing options menu allows additional control over the integration Parameters such as the minimum spotseparation resolution limits excluded resolution ranges block size MTZ filename and BATCH ADD can be changed in the Processingtab
Manually decreasing the minimum spot separation can help if a large number of reflections are flagged as spatially overlapped (redboxes) The prediction must be updated to see the effect of changing the separation this can be done either by displaying the next orprevious image or double clicking on the blue circle next to the image currently displayed in the Images pane
In the Advanced integration tab the measurement box parameters profile tolerance and profile averaging parameters can be set
The measurement box parameters can be adjusted for rare cases where the estimation of the spot size has not worked correctlyresulting in a box that is too small or too large The optimisation of the background rim and corner cutoff parameters that determinewhich pixels are used for the background and which pixels for the peak can also be turned off but this is generally not recommended
Increasing the profile tolerance can help in cases where adjacent spots are not completely resolved this can be judged by examining thestandard profiles By default the profile tolerance is automatically increased if there are a large number of spatial overlaps as this hasthe effect of reducing the minimum spot separation A message will be written to the logfile if this has happened This option can beturned off using the tick box Optimise profile tolerance values to avoid spot overlap
The profile outlier exclusion parameters control the exclusion of ice spots or hot pixels which could otherwise corrupt the standardprofiles
Pixels with a value less than the Null pixel threshold are considered to belong to inactive regions of the detector
The pixel saturation value determines when a reflection is considered to be an overload The intensity of overloaded reflections isestimated by profile fitting but these reflections are rejected by the scaling program AIMLESS by default
Increasing the Maximum reflection width in φ from the default value of 5deg will reduce the number of rejected reflections (green boxes)and is worthwhile when the mosaicity is very high or the mosaic block size is very small As with the minimum spot separation theimage must be refreshed to see the effect of changing this parameter
The rejection criteria will reject reflections with too much variation in the background (BGRATIO) or where the gradient of thebackground plane is too large These should only be changed if many reflections are being rejected PKRATIO only applies to fullyrecorded reflections and reflects a very poor profile fit With current data collection protocols there will be very few (if any) fullyrecorded reflections
Additional MOSFLM parameters will be added based on user requests
98 Integrating multiple lattices
When multiple lattices have been successfully indexed each lattice can be integrated individually by selecting the appropriate latticenumber
Reflections in the chosen lattice that are overlapped by a reflection from another lattice will be integrated but the measurement box willbe expanded so that the total intensity of the two (or more) reflections is measured These reflections will be flagged for specialtreatment Reflections that are not overlapped are referred to as singletons They will be dealt with in the normal way by POINTLESSand AIMLESS
NOTE If more than one lattice has been indexed and the results of integrating just ONE of the lattices are to be checked byrunning QuickSymm or QuickScale then the multi-lattice icon in the Integration pane must be turned off otherwise an error
iMosflm Tutorial
fileUsersandrewg4MOSFLMnewgui_tutorialiMosflm_tutorial_720_ver3html[29052015 105311]
message will be given saying that all lattices must be integrated
It is often the case that by measuring both lattices (in separate integration runs) and inputting both MTZ files to QuickScale the overallcompleteness is high using ONLY the singletons To use this option ensure that the multi-lattice icon is off
To make use of the intensity estimates for overlapped reflections MTZ files for all lattices must be input to the program FECKLESSwhich will derive the best estimate of the summed intensity This is the default option if more than one lattice has been indexed and itrequires that all lattices have been integrated (in separate runs) prior to running QuickSymm or QuickScale (FECKLESS will be runautomatically)
At this time no downstream programs can make use of the summed intensities of overlapping reflections but in the future it should bepossible to use this data in REFMAC
Currently it is recommended to use only singletons from all the lattices FECKLESS is not required in this case
The MTZ filename is automatically updated to reflect which lattice has been chosen to avoid overwriting the MTZ file of the first latticewhen integrating the second one FECKLESS when run from iMosflm relies on this naming convention so do not change it
10 Running Pointless to check the symmetryOnce the images have been integrated (even a few degrees of data in many cases) the program POINTLESS can be run to determine thetrue Laue symmetry and try to determine the space group using the QuickSymm button
iMosflm Tutorial
fileUsersandrewg4MOSFLMnewgui_tutorialiMosflm_tutorial_720_ver3html[29052015 105311]
Select the QuickSymm button
A summary of the Pointless results as shown below will appear in a qtRView window
Various graphs (L test for twinning ViewHKL to view the reciprocal lattice) can also be viewed in this window
Various options for POINTLESS such as a reference MTZ file forcing the symmetry selected in iMosflm and specifying multiple input MTZfiles can be selected from the Settings -gt Processing options -gt Sort Scale and Merge tab (see below)
iMosflm Tutorial
fileUsersandrewg4MOSFLMnewgui_tutorialiMosflm_tutorial_720_ver3html[29052015 105311]
Caution The results can be ambiguous if run with a partial dataset Look in the logfile to see how many relfections are used totest each possible symmetry operator
11 Running Aimless to scale and merge the dataSelect the QuickScale button
This will first run POINTLESS then change the space group for the data to that selected by POINTLESS (unless the iMosflm symmetry isset to override POINTLESS) run AIMLESS to scale and merge the data in that space group and then run CTRUNCATE which calculates anumber of statistics from the intensity data The CCP4 UNIQUEIFY script will then be run which generates all the unique reflections forthat spacegroup to the resolution of the measured data and will flag reflections (5 by default but this can be changed) for use as theRfree set
AIMLESS can be run from the QuickScale button either treating anomalous data (the default) or ignoring anomalous data If onlyprocessing a few degrees of data it is usually better to ignore anomalous because especially for low symmetry cases no mergingstatistics may be given in AIMLESS
SCALA can be selected as an alternative to AIMLESS for scaling (not recommended)
There is limited control over running AIMLESS (see figure above) including re-setting resolution limits rejecting batches (images)changing the treatment for accepting partials changing the rejection criterion and changing the procedure for updating the standarddeviation estimates
iMosflm Tutorial
fileUsersandrewg4MOSFLMnewgui_tutorialiMosflm_tutorial_720_ver3html[29052015 105311]
The AIMLESS results will be displayed in the qtRView as shown below along with graphical output (see below) and the full log file canalso be examined
Aimless summary file
iMosflm Tutorial
fileUsersandrewg4MOSFLMnewgui_tutorialiMosflm_tutorial_720_ver3html[29052015 105311]
An example of the Aimless graphical output
The AIMLESS logfile can also be examined by selecting the Log File tab
12 History and mosflm log fileSelecting History allows the history of the session to be examined or by selecting the Log tab the full mosflmlp file can be viewed Themosflmlp file is also available in a time-stamped file mosflm_yyyymmdd_hhmmsslp (eg mosflm_20100518_131019lp) and can beread with a text editor
The History has a tree structure and will show when various parameters have been changed This has not been fully implemented and isnot generally useful
The logfile may provide useful clues when processing has failed
13 Warning MessagesAs already mentioned in Adding images sect3 and Integration sect9 warning messages are generated by MOSFLM during processing Atraffic light colour coding has now been assigned based on the warnings and is shown next to the Warnings box
A Red status implies a serious problem that will affect data quality and should be addressed
An Orange status implies minor issues that should be checked to see if things can be improved
A Green status means no significant problems messages are for information only
iMosflm Tutorial
fileUsersandrewg4MOSFLMnewgui_tutorialiMosflm_tutorial_720_ver3html[29052015 105311]
Abbreviated messages can be obtained by clicking on the Warnings icon The full warning Details together with Hints amp Notes text (ifany are available) can be obtained by double-clicking the relevant warning Details are displayed in a pop-up text box which willdisappear with the next click outside the box The same full details and suggestions are of course available in the mosflmlp files whereeven more information may be available
NOTE This is the end of the part of the tutorial which deals directly with iMosflm but see sect19 which has some suggestions forfurther work if you have time The remainder of this document deals with integrating and scaling data with MOSFLM andAimless via the CCP4i user interface examining the traditional mosflm SUMMARY file with the CCP4 utility loggraph
The Appendix contains a shell script for running MOSFLM as a traditional batch job
14 Useful command line optionsiMosflm has a number of command line options and these can be listed by typingimosflm --helpCurrent options are
--allimages -a ltfilenamegt Starts mosflm loading all files that match the template generated from ltfilenamegt--ccp4i2 Autosaves an iMosflm session file upon exit with an XML list of all iMosflm output files--debug -d Creates a large output file for debugging purposes Dont use this unless asked to by a developer--expert -e Permits access to advanced detector settings This should not normally be required--fastload -f Attempt to speed loading of many images offline while indexing two default images separated by 90 degrees--help -h Displays this message then exits--imagedir -I ltdirectorygt Starts the image browser in this directory if ltdirectorygt is given as an environment variable it will be expanded to its full value--init -i ltfilenamegt Starts Mosflm and reads from the given saved session file--startdir -S ltdirectorygt Starts mosflm in directory ltstartdirgt rather than the current directory This will only work if the directory exists and you have write permission to it otherwise iMosflm will exit All the normal mosflm output files will be in this directory--singleimage -s ltfilenamegt Starts mosflm loading only the image from ltfilenamegt--site -X ltfilenamegt Reads anyall of the following lines from the file given WAVELENGTH ltxgt DISPERSION ltxgt POLARISATION [PINHOLE | MIRRORS | MONOCHROMATOR | SYNCHROTRON ltxgt] DIVERGENCE ltxh xvgt BEAM ltbeamx beamygt DISTANCE ltxgt DISTORTION TILT ltxgt DISTORTION TWIST ltxgt GAIN ltxgt DETECTOR REVERSEPHI DETECTOR OMEGA ltxgt--version -v Displays the program version and required Mosflm version then exits
These can be abbreviated to the shortest unambiguous string
141 The site fileimosflm --site ltsitefilegt will read keywords from the file ltsitefilegt that will overwrite incorrect information in image headers Thissaves having to manually correct values in every iMosflm session The site file can also be read or written as an option from the Sessionmenu (see Drop down menus sect21) Allowed keywords areWAVELENGTH ltxgt
iMosflm Tutorial
fileUsersandrewg4MOSFLMnewgui_tutorialiMosflm_tutorial_720_ver3html[29052015 105311]
DISPERSION ltxgtPOLARISATION [PINHOLE | MIRRORS | MONO | SYNCHROTRON ltxgt]DIVERGENCE ltxh xvgtBEAM ltbeamx beamygtDISTANCE ltxgtDISTORTION TILT ltxgtDISTORTION TWIST ltxgtGAIN ltxgtDETECTOR REVERSEPHIDETECTOR OMEGA ltxgt
15 The mosflm SUMMARY fileMOSFLM produces a summary file listing refined parameters for each image and when using iMosflm this file will be date- amp time-stamped and have a name such as mosflm_20100518_131019sum This contains the same information as the plots produced by theiMOSFLM GUI which now also include the number of bad spots and overloads
This can be inspected graphically from the CCP4i GUI using the program loggraph Select the pull down menu View Files from Job andunder Output files select Additional log graphs where the _SUMMARYloggraph file will be listed Select this file to display its tablesin loggraph
This is very useful to identify rogue images (with unusually high positional residual or low Iσ(I)) If you find any read that image intoMOSFLM and see what is wrong with it
If you have done more than one integration run during your MOSFLM session you will find multiple entries of the tables Look at the lastset for integration of the 84 images
Click on the Refined detector parameter tables and check on the stability of parameters like the TILT and TWIST of the detector (unitsare hundredths of a degree) and for Mar Research (or DIP) image plate data the distortion parameters ROFF and TOFF (units are mm) Ifthey are varying a lot (more than 20 for TWISTTILT) or 015 for ROFFTOFF then it is probably a good idea to fix these parameters atthe average value (or the known values for this detector if they are available) (see Detector parameters sect821)
Click on the Post refinement table and check the missets It does not matter if they change slowly and by an amount (per image) that isless than 01mosaic spread If they are changing more than this then there could be a problem with processing the data (there is notmuch you can do about this)
Check how the mosaic spread is changing If it is unstable or if you think it is not refining to sensible values (as judged by looking atthe prediction) then you can fix the input value in the same way as the detector parameters (see Crystal parameters sect822)
BADSPOTS AND OVERLOADS
The program will set a rejection flag for those reflections that fail certain tests for example too much variation in the background levela poor profile fit an intensity that is very negative (more than 5 standard deviations) a very high gradient for the background planeThese reflections are called Bad spots and they are listed individually for each image in the mosflmlp file together with the reason forflagging them The number of bad spots is also written to the summary file Generally there should be very few (5-10) bad spots oneach image If there are more it could be because the backstop shadow is not correctly allowed for (consider using the NULLPIXkeyword)
There should also be very few overloaded reflections on each image If there are a lot then a separate low resolution data collectionpass should be made with a much shorter exposure time
IMPORTANT Both Bad spots and Overloads are written to the output MTZ file but will be rejected by default by AIMLESS Theintensity of overloaded reflections is estimated by profile fitting that part of the spot that is not saturated To include these reflections inthe final merged data use the ACCEPT keyword in AIMLESS
16 Scaling data with CCP4i ccp4i
Select Directories amp ProjectDir (top right)
In the new window select Add project
Enter the project name in the Project field and the full directory path in the uses directory field Default values may have been enteredalready here Select this project from Project for this session
Select Apply and Exit Dismiss the warning message that comes up
Select Data reduction from the pull down menu of modules (orange bar at top left)
iMosflm Tutorial
fileUsersandrewg4MOSFLMnewgui_tutorialiMosflm_tutorial_720_ver3html[29052015 105311]
Select Symmetry Scale Merge (Aimless)
In the window that appears do the following
Give a job title (top line)
Click on the box next to Separate anomalous pairs for outlier rejection amp merging statistics (the crystals have been soaked in a mercurycompound)
In the next orange bar (line starts HKLIN 1) select Browse and select the MTZ file output by MOSFLM (probably called hg_001mtz)Select OK
If you did not supply the Project name Crystal name or Dataset name to Mosflm fill in the boxes for these now
Under Scaling Protocol
From the pull-down menu on the line starting Scale select with automatic default settings
At the bottom of window from the pull-down menu named Run select RunampView Com File
This will display a new window showing the command file for running the POINTLESS step select Continue After a brief pause it willshow the command file for running AIMLESS (This can be edited before submitting the job) Select Continue
In the main window it will show that the AIMLESS job is running
When AIMLESS has finished the command file for running the CTRUNCATE step will appearselect Continue
When CTRUNCATE has run the main window will say FINISHED
At that point select the pull-down menu View Files from Job and select View Log Graphs This will give you the same graphs asrunning loggraph on the AIMLESS log file they are also the same as those that appeared in IMOSFLMs QuickScale task To look at thelog file itself (eg the overall merging statistics) select View Log File and it will appear in a new window
161 Looking at the AIMLESS output
The simplest way to look at the output from AIMLESS is to use loggraph on the AIMLESS log file (or via the CCP4i GUI) This can displaymany different graphs
Use Scales vs rotation range to check for smooth variation in the scale factor Check the variation in B factor with image and if there isno real variation it is best to turn off the B-factor refinement
Use the Analysis against all Batches for all runs to detect bad images (high R-factor large number of rejected spots)
Check the Analysis against resolution Fractional bias to see if there is any indication of Partial bias (A negative partial bias will resultif the mosaic spread is underestimated or if there is a lot of diffuse scatter
The Fractional bias should be less than 1-2 although it will often exceed this for weak data (eg in the high resolution bins)
The Axial reflections graphs in AIMLESS are useful for detecting systematic absences which can be used to identify the true spacegroup However the detection of screw axes is thought to be sufficiently robust in POINTLESS that these graphs are no longer necessary
It can also be useful to look at the AIMLESS log file itself in particular the table giving statistics as a function of resolution The effectiveresolution limit of the data can be estimated by looking at the Mn(I)sd column (this is the mean Iσ(I) AFTER merging symmetry matesand is the best indicator of data quality) This table also shows shell and cumulative R-factors
The Mn(I)sd values depend on having realistic values of the standard deviations (errors) in the intensities As the values that come fromMOSFLM are always underestimates of the true error these values are scaled up in AIMLESS using a three-term correction
sdcorrected = SdFac Sqrt[sd(I)2 + SdBLPI + (SdAddI)2]
Here SdFac is an overall scale factor and SdB and SdAdd are intensity dependent factors
AIMLESS will automatically work out a suitable value for all three parameters in order to make the mean value of (observedscatter)(sdestimate) equal to 10 where observed scatter is the difference between an individual estimate of intensity and the mean ofall other estimates (from symmetry mates)
Probably the best estimate of the true high resolution limit of the data can be obtained from the CC(12) values these are thecorrelations between equivalent observations that have been divided randomly into two half-datasets The resolution limit is foundwhen the CC drops below ~ 05 - 03
This table comes under the heading
ANALYSIS OF STANDARD DEVIATIONS
iMosflm Tutorial
fileUsersandrewg4MOSFLMnewgui_tutorialiMosflm_tutorial_720_ver3html[29052015 105311]
in the AIMLESS log file and Run n standard deviation v Intensity test (where n is 1 or more) in the CCP4i GUI View Files from Job -View Log Graphs display
Can you identify a bad image in this dataset Can you work out why it is bad
(Cluethe image headers contain quite a lot of information that is not used by MOSFLM including the date and time that the image wascollected)
You can exclude a given batch from the scaling using the EXCLUDE keyword
RUN ALL EXCLUDE imagenumber
In this case run number will be 1
Rerun the scaling SENDING THE OUTPUT TO A NEW LOGFILE excluding this image and see the effect on the heights in the anomalousPatterson (in the log file) DO NOT repeat the integration In the command file uncomment the line (near the top) goto aimless so itskips the integration part
In the CCP4i GUI click to highlight the AIMLESS job which is listed as FINISHED and select ldquoReRun Jobrdquo from the control buttons downthe right-hand side of the main interface window Under ldquoExcluded Datardquo in the window that appears check the box next to Excludeselected batches and pull-down on the menu button to exclude a range Give the start amp end range to exclude (eg 74 to 74) Rerunthe job as before
17 Changing the symmetryFrom the list of options at the left hand side of the main window select ldquoUtilitiesrdquo and under that SortModifyCombine MTZ Files
In the new window give a new title eg reindex as H32
Click on the Box Change space group andor reindex reflections
Use the browse option to select the input MTZ file (First orange bar) the output filename will be generated automatically (but you canchange it)
Under Reindex details
In the last option check the box next to ldquoChange space group tordquo and enter H32 in the box This is above the final item Reducereflections to the asymmetric unit which is checked by default
Select Run from the Run option button
Then go back to the scaling window and select the new MTZ file (reindexed) as the input for scaling (use Browse) CHANGE THE JOBTITLE
Then select RUN
The scaling will now be performed in space group H32 Look at the merging statistics in the log file in particular the multiplicityweighted R-factor called Rmeas in the log file
18 Looking at the CTRUNCATE outputThe CTRUNCATE program converts intensities to amplitudes and also compiles some useful statistics The LTEST and the cumulativeintensity statistics tabulated by CTRUNCATE (and plotted by loggraph) provide the only point at which you will be able to detectmerohedral twinning (when the two lattices of the twin components exactly overlap and every measured intensity is actually the sum oftwo intensities)
For a good dataset the observed distribution should be within 1 of the theoretical distribution Is this the case for this data
19 If you have time 191 Different mosaic spreads
Try repeating the processing with the mosaic spread set to a value 25 smaller than the refined one and fix it by checking the Fix boxin the Integration window in iMosflm
Can you tell from the merging statistics if this data is better
192 Checking up on outliers
iMosflm Tutorial
fileUsersandrewg4MOSFLMnewgui_tutorialiMosflm_tutorial_720_ver3html[29052015 105311]
AIMLESS writes a file called ROGUES which lists reflections which show very poor agreement between symmetry mates or which areimplausibly large
Look in this file (it is ASCII) and try to work out why this has happened The ROGUES file gives you the image (Batch) on which thereflections have been recorded (for partials this is the image nearest the centre of the reflection so you may need to look on thepreceding and following image as well) Select a reflection which shows very poor agreement with its symmetry mates (A value greaterthan 10 in the DelIsd column in the ROGUES file)
Select the offending image by double-clicking it in the Images pane of the iMosflm main window Predict the reflections then enter thehkl values into the boxes and hit Return (or click the red warning button following the entry box for l) to locate the offending reflectionin the image You must give the measured indices - the first set of values in the ROGUES file - when doing this See if there is anythingodd about the spot Remember to check adjacent images for partials
193 How accurate does the unit cell have to be
Try changing the cell parameters by (say) 10 and integrate the images again What is the effect on the merging statistics
20 Tips1 When reading images into a session DO NOT attempt to carry out any other task until ALL the images have been read2 It is often worth repeating the indexing (usually only once) as the refined direct beam coordinates from the first indexing may give
an improved solution when the indexing is repeated (lower rmsd)3 Always integrate a few degrees of data before integrating the whole dataset (see sect9) If the space group is not known in advance
run Quicksymm with a few degrees of data to check that the correct indexing solution has been chosen4 For difficult images do not attempt to refine the unit cell initially once an indexing solution has been obtained try integrating a
few images to ensure that the integration is stable If then going on to refine the cell check that the prediction looks OK for thefirst image of every segment included in the refinement If it does not look very good consider using the pattern matching(Settings -gt Processing options -gt Advanced refinement see sect84)
5 If the resolution of the data is less than 35 Aring do not use the ldquoRefine Cellrdquo task Instead use several images in indexing and use thecell that comes from the indexing
6 If iMosflm gets into a state where the activity icon(upper right) is spinning but nothing seems to be happening click on the activityicon to stop it spinning and see if the session can be continued DO NOT click on the activity icon simply to abort a task this willgive unpredictable results Use the Abort button for cell refinement or integration There is no defined way to abort indexing
7 Use the image summation option (see sect4) to get a better impression of the diffraction for very low exposure Pilatus images8 Use image summation for detector parameter refinement for fine sliced very weak Pilatus images (Settings -gt Processing options -
gt Advanced refinement see sect821)9 For large mosaic spread values (gt 10deg) or small mosaic block sizes (lt10) consider increasing the maximum allowed reflection
width to avoid having too many green predicted reflections (Settings -gt Processing options -gt Advanced integration see sect97)10 By default on selecting the Indexing task iMosflm will find spots index and (assuming a solution has been found) estimate the
mosaicity For difficult cases it is more useful to restrict this to simply finding spots and then do the indexing and mosaicityestimation by clicking the appropriate buttons To do this change the check box Automatically index after spot finding inSettings -gt Processing options -gt Indexing
11 See sect521 and sect522 for advice if the indexing fails Also consider the possibility of a reversed phi rotation direction if you arenot familiar with the beamline (Settings -gt Experiment settings -gt Experiment see sect21)
12 If the detector parameters have refined to physically unreasonable values (eg because cell refinement or integration has beencarried out using an incorrect indexing solution) be sure to reset the detector parameters before attempting further processing(Settings -gt Experiment settings -gt Detector see sect21)
13 Always set the resolution limit slightly beyond the point at which any spots are visible (see sect414 ) For very weak fine-sliceddata it can be very difficult to estimate the resolution visually so integrate to the maximum resolution (inscribed circle) and usethe merging results to set the final resolution There should be no problems integrating to a resolution ~03-05 Aring beyond theactual resolution limit but for example integrating to 3 Aring when the true resolution limit is 5-6 Aring may cause problems and theintegration should then be repeated with a more realistic resolution limit
14 Use the site file sect141 if repeatedly processing data where the direct beam position is wrong or if the phi direction is reversed etcto save having to correct this for every session
Appendix IA command script for running MOSFLM using the keywords copied from the Batch processing window of the new GUI (see Integratingas a background job sect952) Note that keyworded input for MOSFLM and other CCP4 programs is case-insensitive apart from file anddirectory names
bincsh -fv Set a unique identifier for filenames for this job
set ident = x89_mos07_blk3_smallsep
iMosflm Tutorial
fileUsersandrewg4MOSFLMnewgui_tutorialiMosflm_tutorial_720_ver3html[29052015 105311]
$ipmosflm COORDS $identcoords SUMMARY $identsummary ltlt eof-ip Insert keywords copied from iMosflm batch window here
Keywords for this run For example could involve trying different values for mosaic spread or not integrating all images etc etchklout $identmtzgenfile $identgenprocess 1 1000 goeof-ip
pointlesspointless hklin $identmtz hklout $ident_pointlessmtz
aimlessaimless hklin $ident_pointlessmtz hklout $ident_aimless_partmtz ROGUES $identrogues ltlt eof-aimless Use all default options for aimlesseof-aimless
ctruncate hklin $ident_aimlessmtz hklout $ident_truncatemtz
Harry Powell Andrew Leslie and Owen Johnson
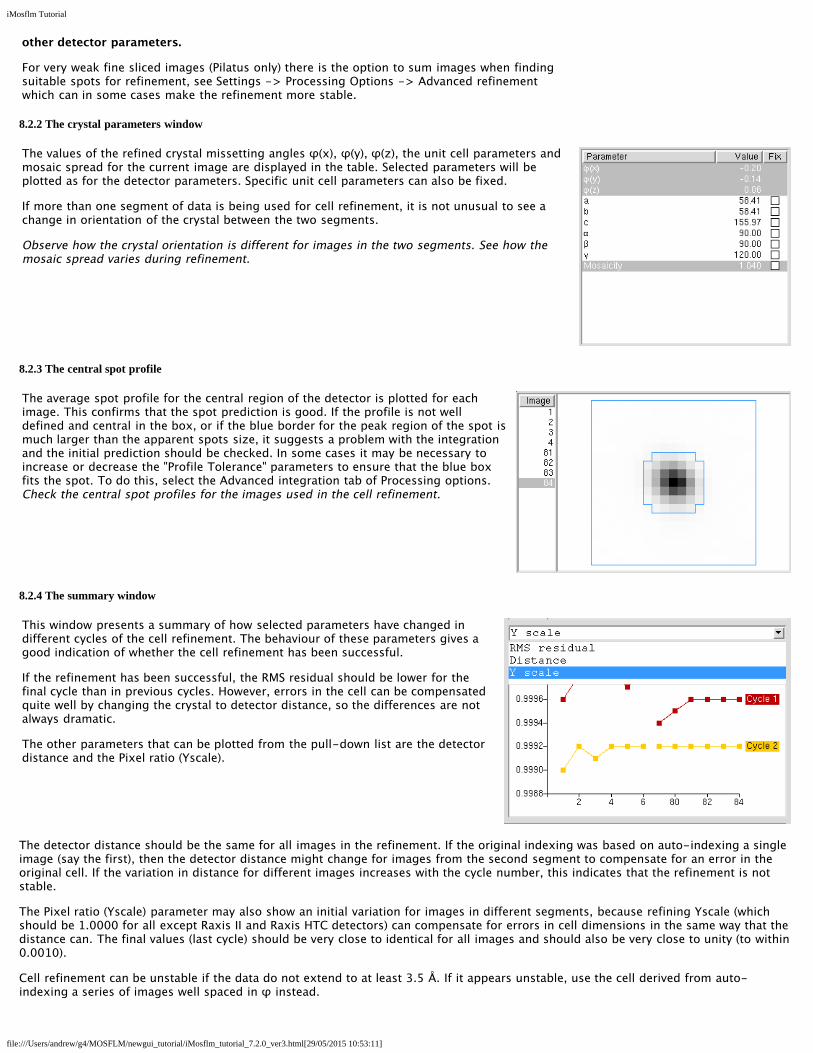
iMosflm Tutorial
fileUsersandrewg4MOSFLMnewgui_tutorialiMosflm_tutorial_720_ver3html[29052015 105311]
Examine the plots to see if the parameters are stable and correct (Yscale)
825 The final results
When refinement has converged (or after 5 cycles) the initial and final cell parameters and the estimated errors (std dev) are listed
If time is available make a note of the std dev values and repeat the cell refinement using a larger number of images in each segmentAre the standard deviations smaller when using more images
83 Refining cell parameters for multiple lattices
Providing the resolution is high enough (generally better than ~35-32 Aring) and not too many of the spots in the different lattices areoverlapped it is possible to refine the cell parameters for each lattice individually The lattice to be refined is selected from the Latticeselector
This selector will be grayed out when processing a single lattice
84 If the prediction for the first image of a segment is poor
In some cases depending on how the indexing has been carried out or if the diffraction is poor or there has been a large change incrystal orientation during the data collection the prediction for one or more of the segments (the first image) may be poor In suchcases the integration and hence the cell refinement may fail It may be possible to successfully process the images after an initialrefinement of the crystal orientation using a pattern matching algorithm To select this option got to the Advanced refinement tab ofProcessing options and select the tick box for Refine orientation of first image in any run by pattern matching and for Integrate allimages Then refine the cell in the usual way During integration the orientation will be refined for the first image of each segmentoutput for this additional refinement will be written to the logfile but is not shown in the GUI
9 IntegrationThe accurate cell parameters are now used in the integration Note that although the images are integrated during the cell refinementthe intensities are not saved and no MTZ file is generated at that stage
It is good practice to start by integrating a block of images corresponding to a few degrees of data to check that the parameters do notneed further adjustment MOSFLM will generate warning messages after integration if there are any difficulties and it may be possibleto improve the situation by changing some of the default parameters (see Warning messages sect13)
Before integration ensure that the backstop shadow has been defined (see Masked areas backstop sect411 and Masked areas generalsect412)
91 Image selection
Image selection is performed in exactly the same way as in the cell refinement In this case the Automatic selection will simply includeall images in the current sector
Select images 1-10
92 Setting the MTZ filename and controlling updating of the image display
Two icons appear when the integration option is chosen
If the Show predictions icon is clicked the display window will be updated as eachimage is processed This will slow down the processing but allows the accuracy of theprediction to be checked for each image
iMosflm Tutorial
fileUsersandrewg4MOSFLMnewgui_tutorialiMosflm_tutorial_720_ver3html[29052015 105311]
Click on this icon so that the display will be updatedThe filename of the MTZ file containing the results of the integration is generatedautomatically but can be edited manually
93 Integrating the images
Click on the Process button to start integration
Integration of the images occurs in two passes In the first pass for each block of images (a number corresponding to a few degrees ofdata selected automatically by MOSFLM) the detector and crystal parameters are refined for each image in turn and the measurementboxes for all predicted spots are written to a file for use in the second pass In the second pass the standard profiles are formed fromreflections present on all of the images in this block and each image is then integrated and the results written to the MTZ file Thedisplay is not updated during the second pass and will remain on the last image of the block (assuming image updating has beenselected)
Note that the unit cell dimensions are normally fixed during integration and only the crystal orientation and mosaic spread are refinedCrystal parameter refinement only starts when a sufficient number of images have been integrated to provide data for the post-refinement typically after ~05-1 degree (more for high mosaicity)
94 Parameter display windows
As described in sect82 the refined detector and crystal parameters will be displayed in tables and selected parameters will be plotted ingraphs The average spot profile for each image will also be displayed
The size of these graphs (and the profile) can be expanded to fill the whole window by holding down Shift and clicking LMB anywherein the graph window A second Shift+click will revert the graph to the original size
In addition to these windows there are windows that tabulate and plot (as a function of image number) the mean Iσ(I) for profile fittedand summation integration intensities The overall values and the values for the highest resolution bin are given
The number of overloaded reflections Bad spots (ie those that fail certain tests see mosflm SUMMARY file sect15) Spatial overlaps andif processing multi-lattice images the number of lattice overlaps is listed for each image and can be plotted by highlighting thatparameter When processing data from crystals with large unit cells it is important to watch out for spatial overlaps (see sect97 for tips onhow to reduce the number of spatial overlaps if this is a problem)
A display of the standard profiles for different regions of the detector is also provided Poor profiles are averaged by includingreflections from inner regions of the detector Averaged profiles are indicated by a red line around the spot (rather than blue) Theoriginal unaveraged profile can be viewed a clicking on the profile (providing there were sufficient spots in that region to allowformation of a profile)
The profiles should be checked to see that they are well defined and centred within the box Poorly-defined diffuse or non-centredprofiles may suggest that the prediction is not very good in which case this should be checked on the corresponding image(s)
It may be useful to expand the standard profiles to fill the window using Shift + click in the profiles window
Finally the lower left window plots Iσ(I) as a function of resolution for any selected image
iMosflm Tutorial
fileUsersandrewg4MOSFLMnewgui_tutorialiMosflm_tutorial_720_ver3html[29052015 105311]
Different parameters can be plotted by selecting the small right- or left-pointing arrows on the title line above the plot
95 Integrating the whole datasetAssuming that everything looks OK the entire dataset can now be integrated However it is strongly recommended thatProjectCrystalDataset names are assigned first These are written to the output MTZ file and used by downstream programs inparticular AIMLESS will use this information when deciding which images belong to the same dataset
Select Experiment settings from the Settings drop-down menu (see Drop down menus sect21) to enter these names and optionally givea title for the MTZ file
Select images 1-84 and click on Process
951 Parallel Integration Using multiple cores
An option is available on the pull-down menu (next to the Process button in the Integration task) which splits up the integration jobover available cores on the local machine All aspects are currently determined automatically at present user-configurable options willbe available in a later version The algorithm used is as follows
iMosflm determines the number of cores available on the local machineIf the number of cores (N) is greater than 2 iMosflm splits the integration run into N-1 batches (up to a maximum of 16) containingapproximately the same number of images If N le 2 iMosflm splits the run into N batches
If the total number of images in each batch is less than 32 the number of batches is decreased until this condition is satisfied
The first batch is submitted as a background task consisting of a refinement stage and an integration stage with its input and outputfiles (including the MTZ file) in a new directory its name being determined from the number of segments of data being integrated andthe lattice number (if the sample has been determined to contain multiple lattices) If the directories exist already they are all movedinto a newly-created directory with a time-stamped name the files from the most recent integration run are thus in directories withnames following the pattern described above Once the refinement stage is complete the refined parameters are written to a file
The launch of subsequent batches are delayed until the corresponding preceding batch has written its refined parameters This file isread and the new batch is launched again with a refinement stage and integration stage
At present the job cannot be aborted once it has started
952 Integrating as a background job
By selecting Batch in the drop-down menu adjacent to the Process button the integration can be run as a background job rather thaninteractively and the GUI can be used to look at a different dataset
Selecting Batch from the drop-down menu will display a new window showing the script that will be used to process the images alongwith a number of processing options The script can be edited if additional keywords are required or if some parameters are to bechanged and can also be copied and pasted into a file for off-line processing
By default the job is divided into batches across multiple cores as determined for the parallel integration described in sect951 but thenumber of cores can be chosen by the user from a drop-down menu in this case the size of each batch is determined by the interface
Plotting the results of the integration can be turned off this can make processing much faster
iMosflm Tutorial
fileUsersandrewg4MOSFLMnewgui_tutorialiMosflm_tutorial_720_ver3html[29052015 105311]
It is possible to configure job submission for remote machines (which can be added by depressing the add host button) Ensure youhave enabled passwordless logins for all the remote machines you enter and that you specify the full path to the Mosflm executable inthe Batch destinations window The remote working directory (in which the log and MTZ files are written) and the remote imagedirectory must both be specified with their full path names Any required parameter fields that are not completed by the user arehighlighted in orange if the user tries to submit a job without completing these fields a new window containing only those fields (againhighlighted in orange) pops up with a request to do so
The number of cores available on the selected host can be determined by depressing the apple core button on the Batch destinationsconfiguration window
The log file for batch submission jobs the MTZ and SUMMARY files are written to the directory in which iMosflm was launched
96 Checking the integration
iMosflm Tutorial
fileUsersandrewg4MOSFLMnewgui_tutorialiMosflm_tutorial_720_ver3html[29052015 105311]
The detector and crystal parameter plots should be examined carefully to check for any instability in the refinement If there are largeand random variations in some parameters (eg the detector twist and tilt) then it may be better to fix them and repeat the integration
For cases (eg very small unit cells) where there are very few suitable reflections on each image the refinement of the missetting anglesmay show significant variations from one image to the next In such cases it is best to apply smoothing to the missetting angles usingthe tick box in Settings -gt Processing options -gt Advanced Refinement
Discontinuities due to blank images should also show up and the offending images should be removed from the scaling run
If adjacent spots are incompletely resolved on the detector it may be possible to improve the processing by increasing the PROFILETOLERANCE parameters by 1-2 These parameters can be set in the Advanced integration tab of the Processing options menu (useSettings)
97 Advanced features for integration
The Settings -gt Processing options menu allows additional control over the integration Parameters such as the minimum spotseparation resolution limits excluded resolution ranges block size MTZ filename and BATCH ADD can be changed in the Processingtab
Manually decreasing the minimum spot separation can help if a large number of reflections are flagged as spatially overlapped (redboxes) The prediction must be updated to see the effect of changing the separation this can be done either by displaying the next orprevious image or double clicking on the blue circle next to the image currently displayed in the Images pane
In the Advanced integration tab the measurement box parameters profile tolerance and profile averaging parameters can be set
The measurement box parameters can be adjusted for rare cases where the estimation of the spot size has not worked correctlyresulting in a box that is too small or too large The optimisation of the background rim and corner cutoff parameters that determinewhich pixels are used for the background and which pixels for the peak can also be turned off but this is generally not recommended
Increasing the profile tolerance can help in cases where adjacent spots are not completely resolved this can be judged by examining thestandard profiles By default the profile tolerance is automatically increased if there are a large number of spatial overlaps as this hasthe effect of reducing the minimum spot separation A message will be written to the logfile if this has happened This option can beturned off using the tick box Optimise profile tolerance values to avoid spot overlap
The profile outlier exclusion parameters control the exclusion of ice spots or hot pixels which could otherwise corrupt the standardprofiles
Pixels with a value less than the Null pixel threshold are considered to belong to inactive regions of the detector
The pixel saturation value determines when a reflection is considered to be an overload The intensity of overloaded reflections isestimated by profile fitting but these reflections are rejected by the scaling program AIMLESS by default
Increasing the Maximum reflection width in φ from the default value of 5deg will reduce the number of rejected reflections (green boxes)and is worthwhile when the mosaicity is very high or the mosaic block size is very small As with the minimum spot separation theimage must be refreshed to see the effect of changing this parameter
The rejection criteria will reject reflections with too much variation in the background (BGRATIO) or where the gradient of thebackground plane is too large These should only be changed if many reflections are being rejected PKRATIO only applies to fullyrecorded reflections and reflects a very poor profile fit With current data collection protocols there will be very few (if any) fullyrecorded reflections
Additional MOSFLM parameters will be added based on user requests
98 Integrating multiple lattices
When multiple lattices have been successfully indexed each lattice can be integrated individually by selecting the appropriate latticenumber
Reflections in the chosen lattice that are overlapped by a reflection from another lattice will be integrated but the measurement box willbe expanded so that the total intensity of the two (or more) reflections is measured These reflections will be flagged for specialtreatment Reflections that are not overlapped are referred to as singletons They will be dealt with in the normal way by POINTLESSand AIMLESS
NOTE If more than one lattice has been indexed and the results of integrating just ONE of the lattices are to be checked byrunning QuickSymm or QuickScale then the multi-lattice icon in the Integration pane must be turned off otherwise an error
iMosflm Tutorial
fileUsersandrewg4MOSFLMnewgui_tutorialiMosflm_tutorial_720_ver3html[29052015 105311]
message will be given saying that all lattices must be integrated
It is often the case that by measuring both lattices (in separate integration runs) and inputting both MTZ files to QuickScale the overallcompleteness is high using ONLY the singletons To use this option ensure that the multi-lattice icon is off
To make use of the intensity estimates for overlapped reflections MTZ files for all lattices must be input to the program FECKLESSwhich will derive the best estimate of the summed intensity This is the default option if more than one lattice has been indexed and itrequires that all lattices have been integrated (in separate runs) prior to running QuickSymm or QuickScale (FECKLESS will be runautomatically)
At this time no downstream programs can make use of the summed intensities of overlapping reflections but in the future it should bepossible to use this data in REFMAC
Currently it is recommended to use only singletons from all the lattices FECKLESS is not required in this case
The MTZ filename is automatically updated to reflect which lattice has been chosen to avoid overwriting the MTZ file of the first latticewhen integrating the second one FECKLESS when run from iMosflm relies on this naming convention so do not change it
10 Running Pointless to check the symmetryOnce the images have been integrated (even a few degrees of data in many cases) the program POINTLESS can be run to determine thetrue Laue symmetry and try to determine the space group using the QuickSymm button
iMosflm Tutorial
fileUsersandrewg4MOSFLMnewgui_tutorialiMosflm_tutorial_720_ver3html[29052015 105311]
Select the QuickSymm button
A summary of the Pointless results as shown below will appear in a qtRView window
Various graphs (L test for twinning ViewHKL to view the reciprocal lattice) can also be viewed in this window
Various options for POINTLESS such as a reference MTZ file forcing the symmetry selected in iMosflm and specifying multiple input MTZfiles can be selected from the Settings -gt Processing options -gt Sort Scale and Merge tab (see below)
iMosflm Tutorial
fileUsersandrewg4MOSFLMnewgui_tutorialiMosflm_tutorial_720_ver3html[29052015 105311]
Caution The results can be ambiguous if run with a partial dataset Look in the logfile to see how many relfections are used totest each possible symmetry operator
11 Running Aimless to scale and merge the dataSelect the QuickScale button
This will first run POINTLESS then change the space group for the data to that selected by POINTLESS (unless the iMosflm symmetry isset to override POINTLESS) run AIMLESS to scale and merge the data in that space group and then run CTRUNCATE which calculates anumber of statistics from the intensity data The CCP4 UNIQUEIFY script will then be run which generates all the unique reflections forthat spacegroup to the resolution of the measured data and will flag reflections (5 by default but this can be changed) for use as theRfree set
AIMLESS can be run from the QuickScale button either treating anomalous data (the default) or ignoring anomalous data If onlyprocessing a few degrees of data it is usually better to ignore anomalous because especially for low symmetry cases no mergingstatistics may be given in AIMLESS
SCALA can be selected as an alternative to AIMLESS for scaling (not recommended)
There is limited control over running AIMLESS (see figure above) including re-setting resolution limits rejecting batches (images)changing the treatment for accepting partials changing the rejection criterion and changing the procedure for updating the standarddeviation estimates
iMosflm Tutorial
fileUsersandrewg4MOSFLMnewgui_tutorialiMosflm_tutorial_720_ver3html[29052015 105311]
The AIMLESS results will be displayed in the qtRView as shown below along with graphical output (see below) and the full log file canalso be examined
Aimless summary file
iMosflm Tutorial
fileUsersandrewg4MOSFLMnewgui_tutorialiMosflm_tutorial_720_ver3html[29052015 105311]
An example of the Aimless graphical output
The AIMLESS logfile can also be examined by selecting the Log File tab
12 History and mosflm log fileSelecting History allows the history of the session to be examined or by selecting the Log tab the full mosflmlp file can be viewed Themosflmlp file is also available in a time-stamped file mosflm_yyyymmdd_hhmmsslp (eg mosflm_20100518_131019lp) and can beread with a text editor
The History has a tree structure and will show when various parameters have been changed This has not been fully implemented and isnot generally useful
The logfile may provide useful clues when processing has failed
13 Warning MessagesAs already mentioned in Adding images sect3 and Integration sect9 warning messages are generated by MOSFLM during processing Atraffic light colour coding has now been assigned based on the warnings and is shown next to the Warnings box
A Red status implies a serious problem that will affect data quality and should be addressed
An Orange status implies minor issues that should be checked to see if things can be improved
A Green status means no significant problems messages are for information only
iMosflm Tutorial
fileUsersandrewg4MOSFLMnewgui_tutorialiMosflm_tutorial_720_ver3html[29052015 105311]
Abbreviated messages can be obtained by clicking on the Warnings icon The full warning Details together with Hints amp Notes text (ifany are available) can be obtained by double-clicking the relevant warning Details are displayed in a pop-up text box which willdisappear with the next click outside the box The same full details and suggestions are of course available in the mosflmlp files whereeven more information may be available
NOTE This is the end of the part of the tutorial which deals directly with iMosflm but see sect19 which has some suggestions forfurther work if you have time The remainder of this document deals with integrating and scaling data with MOSFLM andAimless via the CCP4i user interface examining the traditional mosflm SUMMARY file with the CCP4 utility loggraph
The Appendix contains a shell script for running MOSFLM as a traditional batch job
14 Useful command line optionsiMosflm has a number of command line options and these can be listed by typingimosflm --helpCurrent options are
--allimages -a ltfilenamegt Starts mosflm loading all files that match the template generated from ltfilenamegt--ccp4i2 Autosaves an iMosflm session file upon exit with an XML list of all iMosflm output files--debug -d Creates a large output file for debugging purposes Dont use this unless asked to by a developer--expert -e Permits access to advanced detector settings This should not normally be required--fastload -f Attempt to speed loading of many images offline while indexing two default images separated by 90 degrees--help -h Displays this message then exits--imagedir -I ltdirectorygt Starts the image browser in this directory if ltdirectorygt is given as an environment variable it will be expanded to its full value--init -i ltfilenamegt Starts Mosflm and reads from the given saved session file--startdir -S ltdirectorygt Starts mosflm in directory ltstartdirgt rather than the current directory This will only work if the directory exists and you have write permission to it otherwise iMosflm will exit All the normal mosflm output files will be in this directory--singleimage -s ltfilenamegt Starts mosflm loading only the image from ltfilenamegt--site -X ltfilenamegt Reads anyall of the following lines from the file given WAVELENGTH ltxgt DISPERSION ltxgt POLARISATION [PINHOLE | MIRRORS | MONOCHROMATOR | SYNCHROTRON ltxgt] DIVERGENCE ltxh xvgt BEAM ltbeamx beamygt DISTANCE ltxgt DISTORTION TILT ltxgt DISTORTION TWIST ltxgt GAIN ltxgt DETECTOR REVERSEPHI DETECTOR OMEGA ltxgt--version -v Displays the program version and required Mosflm version then exits
These can be abbreviated to the shortest unambiguous string
141 The site fileimosflm --site ltsitefilegt will read keywords from the file ltsitefilegt that will overwrite incorrect information in image headers Thissaves having to manually correct values in every iMosflm session The site file can also be read or written as an option from the Sessionmenu (see Drop down menus sect21) Allowed keywords areWAVELENGTH ltxgt
iMosflm Tutorial
fileUsersandrewg4MOSFLMnewgui_tutorialiMosflm_tutorial_720_ver3html[29052015 105311]
DISPERSION ltxgtPOLARISATION [PINHOLE | MIRRORS | MONO | SYNCHROTRON ltxgt]DIVERGENCE ltxh xvgtBEAM ltbeamx beamygtDISTANCE ltxgtDISTORTION TILT ltxgtDISTORTION TWIST ltxgtGAIN ltxgtDETECTOR REVERSEPHIDETECTOR OMEGA ltxgt
15 The mosflm SUMMARY fileMOSFLM produces a summary file listing refined parameters for each image and when using iMosflm this file will be date- amp time-stamped and have a name such as mosflm_20100518_131019sum This contains the same information as the plots produced by theiMOSFLM GUI which now also include the number of bad spots and overloads
This can be inspected graphically from the CCP4i GUI using the program loggraph Select the pull down menu View Files from Job andunder Output files select Additional log graphs where the _SUMMARYloggraph file will be listed Select this file to display its tablesin loggraph
This is very useful to identify rogue images (with unusually high positional residual or low Iσ(I)) If you find any read that image intoMOSFLM and see what is wrong with it
If you have done more than one integration run during your MOSFLM session you will find multiple entries of the tables Look at the lastset for integration of the 84 images
Click on the Refined detector parameter tables and check on the stability of parameters like the TILT and TWIST of the detector (unitsare hundredths of a degree) and for Mar Research (or DIP) image plate data the distortion parameters ROFF and TOFF (units are mm) Ifthey are varying a lot (more than 20 for TWISTTILT) or 015 for ROFFTOFF then it is probably a good idea to fix these parameters atthe average value (or the known values for this detector if they are available) (see Detector parameters sect821)
Click on the Post refinement table and check the missets It does not matter if they change slowly and by an amount (per image) that isless than 01mosaic spread If they are changing more than this then there could be a problem with processing the data (there is notmuch you can do about this)
Check how the mosaic spread is changing If it is unstable or if you think it is not refining to sensible values (as judged by looking atthe prediction) then you can fix the input value in the same way as the detector parameters (see Crystal parameters sect822)
BADSPOTS AND OVERLOADS
The program will set a rejection flag for those reflections that fail certain tests for example too much variation in the background levela poor profile fit an intensity that is very negative (more than 5 standard deviations) a very high gradient for the background planeThese reflections are called Bad spots and they are listed individually for each image in the mosflmlp file together with the reason forflagging them The number of bad spots is also written to the summary file Generally there should be very few (5-10) bad spots oneach image If there are more it could be because the backstop shadow is not correctly allowed for (consider using the NULLPIXkeyword)
There should also be very few overloaded reflections on each image If there are a lot then a separate low resolution data collectionpass should be made with a much shorter exposure time
IMPORTANT Both Bad spots and Overloads are written to the output MTZ file but will be rejected by default by AIMLESS Theintensity of overloaded reflections is estimated by profile fitting that part of the spot that is not saturated To include these reflections inthe final merged data use the ACCEPT keyword in AIMLESS
16 Scaling data with CCP4i ccp4i
Select Directories amp ProjectDir (top right)
In the new window select Add project
Enter the project name in the Project field and the full directory path in the uses directory field Default values may have been enteredalready here Select this project from Project for this session
Select Apply and Exit Dismiss the warning message that comes up
Select Data reduction from the pull down menu of modules (orange bar at top left)
iMosflm Tutorial
fileUsersandrewg4MOSFLMnewgui_tutorialiMosflm_tutorial_720_ver3html[29052015 105311]
Select Symmetry Scale Merge (Aimless)
In the window that appears do the following
Give a job title (top line)
Click on the box next to Separate anomalous pairs for outlier rejection amp merging statistics (the crystals have been soaked in a mercurycompound)
In the next orange bar (line starts HKLIN 1) select Browse and select the MTZ file output by MOSFLM (probably called hg_001mtz)Select OK
If you did not supply the Project name Crystal name or Dataset name to Mosflm fill in the boxes for these now
Under Scaling Protocol
From the pull-down menu on the line starting Scale select with automatic default settings
At the bottom of window from the pull-down menu named Run select RunampView Com File
This will display a new window showing the command file for running the POINTLESS step select Continue After a brief pause it willshow the command file for running AIMLESS (This can be edited before submitting the job) Select Continue
In the main window it will show that the AIMLESS job is running
When AIMLESS has finished the command file for running the CTRUNCATE step will appearselect Continue
When CTRUNCATE has run the main window will say FINISHED
At that point select the pull-down menu View Files from Job and select View Log Graphs This will give you the same graphs asrunning loggraph on the AIMLESS log file they are also the same as those that appeared in IMOSFLMs QuickScale task To look at thelog file itself (eg the overall merging statistics) select View Log File and it will appear in a new window
161 Looking at the AIMLESS output
The simplest way to look at the output from AIMLESS is to use loggraph on the AIMLESS log file (or via the CCP4i GUI) This can displaymany different graphs
Use Scales vs rotation range to check for smooth variation in the scale factor Check the variation in B factor with image and if there isno real variation it is best to turn off the B-factor refinement
Use the Analysis against all Batches for all runs to detect bad images (high R-factor large number of rejected spots)
Check the Analysis against resolution Fractional bias to see if there is any indication of Partial bias (A negative partial bias will resultif the mosaic spread is underestimated or if there is a lot of diffuse scatter
The Fractional bias should be less than 1-2 although it will often exceed this for weak data (eg in the high resolution bins)
The Axial reflections graphs in AIMLESS are useful for detecting systematic absences which can be used to identify the true spacegroup However the detection of screw axes is thought to be sufficiently robust in POINTLESS that these graphs are no longer necessary
It can also be useful to look at the AIMLESS log file itself in particular the table giving statistics as a function of resolution The effectiveresolution limit of the data can be estimated by looking at the Mn(I)sd column (this is the mean Iσ(I) AFTER merging symmetry matesand is the best indicator of data quality) This table also shows shell and cumulative R-factors
The Mn(I)sd values depend on having realistic values of the standard deviations (errors) in the intensities As the values that come fromMOSFLM are always underestimates of the true error these values are scaled up in AIMLESS using a three-term correction
sdcorrected = SdFac Sqrt[sd(I)2 + SdBLPI + (SdAddI)2]
Here SdFac is an overall scale factor and SdB and SdAdd are intensity dependent factors
AIMLESS will automatically work out a suitable value for all three parameters in order to make the mean value of (observedscatter)(sdestimate) equal to 10 where observed scatter is the difference between an individual estimate of intensity and the mean ofall other estimates (from symmetry mates)
Probably the best estimate of the true high resolution limit of the data can be obtained from the CC(12) values these are thecorrelations between equivalent observations that have been divided randomly into two half-datasets The resolution limit is foundwhen the CC drops below ~ 05 - 03
This table comes under the heading
ANALYSIS OF STANDARD DEVIATIONS
iMosflm Tutorial
fileUsersandrewg4MOSFLMnewgui_tutorialiMosflm_tutorial_720_ver3html[29052015 105311]
in the AIMLESS log file and Run n standard deviation v Intensity test (where n is 1 or more) in the CCP4i GUI View Files from Job -View Log Graphs display
Can you identify a bad image in this dataset Can you work out why it is bad
(Cluethe image headers contain quite a lot of information that is not used by MOSFLM including the date and time that the image wascollected)
You can exclude a given batch from the scaling using the EXCLUDE keyword
RUN ALL EXCLUDE imagenumber
In this case run number will be 1
Rerun the scaling SENDING THE OUTPUT TO A NEW LOGFILE excluding this image and see the effect on the heights in the anomalousPatterson (in the log file) DO NOT repeat the integration In the command file uncomment the line (near the top) goto aimless so itskips the integration part
In the CCP4i GUI click to highlight the AIMLESS job which is listed as FINISHED and select ldquoReRun Jobrdquo from the control buttons downthe right-hand side of the main interface window Under ldquoExcluded Datardquo in the window that appears check the box next to Excludeselected batches and pull-down on the menu button to exclude a range Give the start amp end range to exclude (eg 74 to 74) Rerunthe job as before
17 Changing the symmetryFrom the list of options at the left hand side of the main window select ldquoUtilitiesrdquo and under that SortModifyCombine MTZ Files
In the new window give a new title eg reindex as H32
Click on the Box Change space group andor reindex reflections
Use the browse option to select the input MTZ file (First orange bar) the output filename will be generated automatically (but you canchange it)
Under Reindex details
In the last option check the box next to ldquoChange space group tordquo and enter H32 in the box This is above the final item Reducereflections to the asymmetric unit which is checked by default
Select Run from the Run option button
Then go back to the scaling window and select the new MTZ file (reindexed) as the input for scaling (use Browse) CHANGE THE JOBTITLE
Then select RUN
The scaling will now be performed in space group H32 Look at the merging statistics in the log file in particular the multiplicityweighted R-factor called Rmeas in the log file
18 Looking at the CTRUNCATE outputThe CTRUNCATE program converts intensities to amplitudes and also compiles some useful statistics The LTEST and the cumulativeintensity statistics tabulated by CTRUNCATE (and plotted by loggraph) provide the only point at which you will be able to detectmerohedral twinning (when the two lattices of the twin components exactly overlap and every measured intensity is actually the sum oftwo intensities)
For a good dataset the observed distribution should be within 1 of the theoretical distribution Is this the case for this data
19 If you have time 191 Different mosaic spreads
Try repeating the processing with the mosaic spread set to a value 25 smaller than the refined one and fix it by checking the Fix boxin the Integration window in iMosflm
Can you tell from the merging statistics if this data is better
192 Checking up on outliers
iMosflm Tutorial
fileUsersandrewg4MOSFLMnewgui_tutorialiMosflm_tutorial_720_ver3html[29052015 105311]
AIMLESS writes a file called ROGUES which lists reflections which show very poor agreement between symmetry mates or which areimplausibly large
Look in this file (it is ASCII) and try to work out why this has happened The ROGUES file gives you the image (Batch) on which thereflections have been recorded (for partials this is the image nearest the centre of the reflection so you may need to look on thepreceding and following image as well) Select a reflection which shows very poor agreement with its symmetry mates (A value greaterthan 10 in the DelIsd column in the ROGUES file)
Select the offending image by double-clicking it in the Images pane of the iMosflm main window Predict the reflections then enter thehkl values into the boxes and hit Return (or click the red warning button following the entry box for l) to locate the offending reflectionin the image You must give the measured indices - the first set of values in the ROGUES file - when doing this See if there is anythingodd about the spot Remember to check adjacent images for partials
193 How accurate does the unit cell have to be
Try changing the cell parameters by (say) 10 and integrate the images again What is the effect on the merging statistics
20 Tips1 When reading images into a session DO NOT attempt to carry out any other task until ALL the images have been read2 It is often worth repeating the indexing (usually only once) as the refined direct beam coordinates from the first indexing may give
an improved solution when the indexing is repeated (lower rmsd)3 Always integrate a few degrees of data before integrating the whole dataset (see sect9) If the space group is not known in advance
run Quicksymm with a few degrees of data to check that the correct indexing solution has been chosen4 For difficult images do not attempt to refine the unit cell initially once an indexing solution has been obtained try integrating a
few images to ensure that the integration is stable If then going on to refine the cell check that the prediction looks OK for thefirst image of every segment included in the refinement If it does not look very good consider using the pattern matching(Settings -gt Processing options -gt Advanced refinement see sect84)
5 If the resolution of the data is less than 35 Aring do not use the ldquoRefine Cellrdquo task Instead use several images in indexing and use thecell that comes from the indexing
6 If iMosflm gets into a state where the activity icon(upper right) is spinning but nothing seems to be happening click on the activityicon to stop it spinning and see if the session can be continued DO NOT click on the activity icon simply to abort a task this willgive unpredictable results Use the Abort button for cell refinement or integration There is no defined way to abort indexing
7 Use the image summation option (see sect4) to get a better impression of the diffraction for very low exposure Pilatus images8 Use image summation for detector parameter refinement for fine sliced very weak Pilatus images (Settings -gt Processing options -
gt Advanced refinement see sect821)9 For large mosaic spread values (gt 10deg) or small mosaic block sizes (lt10) consider increasing the maximum allowed reflection
width to avoid having too many green predicted reflections (Settings -gt Processing options -gt Advanced integration see sect97)10 By default on selecting the Indexing task iMosflm will find spots index and (assuming a solution has been found) estimate the
mosaicity For difficult cases it is more useful to restrict this to simply finding spots and then do the indexing and mosaicityestimation by clicking the appropriate buttons To do this change the check box Automatically index after spot finding inSettings -gt Processing options -gt Indexing
11 See sect521 and sect522 for advice if the indexing fails Also consider the possibility of a reversed phi rotation direction if you arenot familiar with the beamline (Settings -gt Experiment settings -gt Experiment see sect21)
12 If the detector parameters have refined to physically unreasonable values (eg because cell refinement or integration has beencarried out using an incorrect indexing solution) be sure to reset the detector parameters before attempting further processing(Settings -gt Experiment settings -gt Detector see sect21)
13 Always set the resolution limit slightly beyond the point at which any spots are visible (see sect414 ) For very weak fine-sliceddata it can be very difficult to estimate the resolution visually so integrate to the maximum resolution (inscribed circle) and usethe merging results to set the final resolution There should be no problems integrating to a resolution ~03-05 Aring beyond theactual resolution limit but for example integrating to 3 Aring when the true resolution limit is 5-6 Aring may cause problems and theintegration should then be repeated with a more realistic resolution limit
14 Use the site file sect141 if repeatedly processing data where the direct beam position is wrong or if the phi direction is reversed etcto save having to correct this for every session
Appendix IA command script for running MOSFLM using the keywords copied from the Batch processing window of the new GUI (see Integratingas a background job sect952) Note that keyworded input for MOSFLM and other CCP4 programs is case-insensitive apart from file anddirectory names
bincsh -fv Set a unique identifier for filenames for this job
set ident = x89_mos07_blk3_smallsep
iMosflm Tutorial
fileUsersandrewg4MOSFLMnewgui_tutorialiMosflm_tutorial_720_ver3html[29052015 105311]
$ipmosflm COORDS $identcoords SUMMARY $identsummary ltlt eof-ip Insert keywords copied from iMosflm batch window here
Keywords for this run For example could involve trying different values for mosaic spread or not integrating all images etc etchklout $identmtzgenfile $identgenprocess 1 1000 goeof-ip
pointlesspointless hklin $identmtz hklout $ident_pointlessmtz
aimlessaimless hklin $ident_pointlessmtz hklout $ident_aimless_partmtz ROGUES $identrogues ltlt eof-aimless Use all default options for aimlesseof-aimless
ctruncate hklin $ident_aimlessmtz hklout $ident_truncatemtz
Harry Powell Andrew Leslie and Owen Johnson
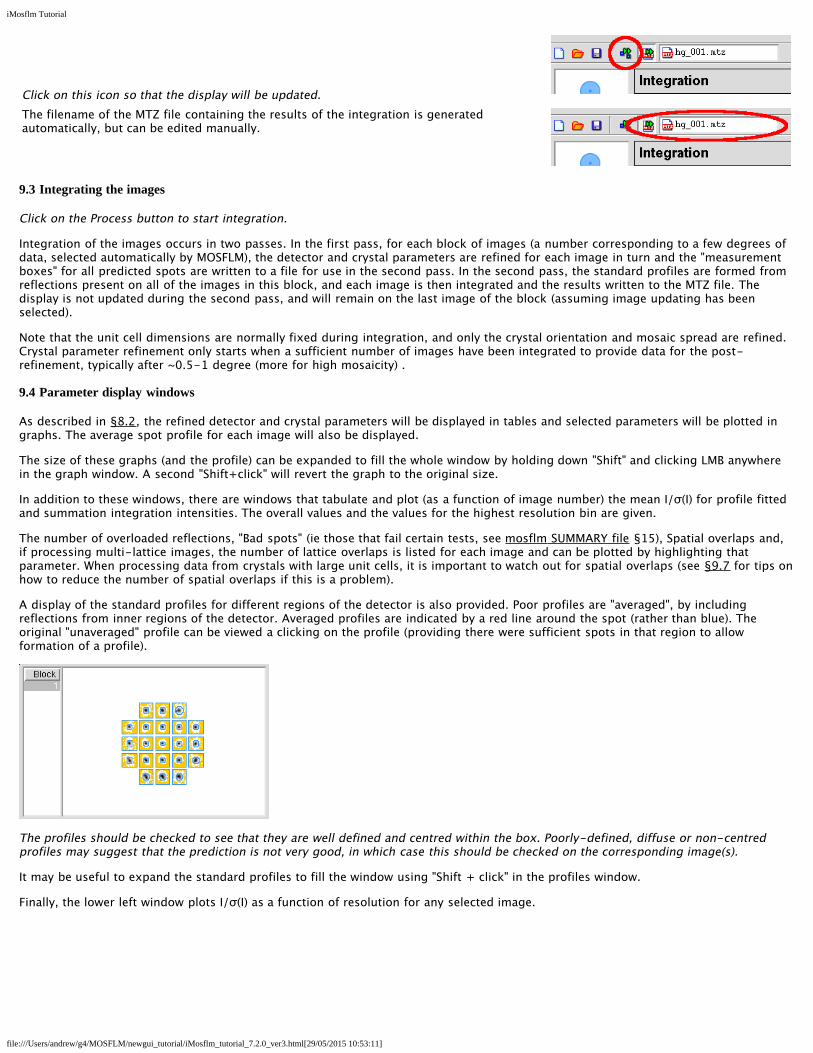
iMosflm Tutorial
fileUsersandrewg4MOSFLMnewgui_tutorialiMosflm_tutorial_720_ver3html[29052015 105311]
Click on this icon so that the display will be updatedThe filename of the MTZ file containing the results of the integration is generatedautomatically but can be edited manually
93 Integrating the images
Click on the Process button to start integration
Integration of the images occurs in two passes In the first pass for each block of images (a number corresponding to a few degrees ofdata selected automatically by MOSFLM) the detector and crystal parameters are refined for each image in turn and the measurementboxes for all predicted spots are written to a file for use in the second pass In the second pass the standard profiles are formed fromreflections present on all of the images in this block and each image is then integrated and the results written to the MTZ file Thedisplay is not updated during the second pass and will remain on the last image of the block (assuming image updating has beenselected)
Note that the unit cell dimensions are normally fixed during integration and only the crystal orientation and mosaic spread are refinedCrystal parameter refinement only starts when a sufficient number of images have been integrated to provide data for the post-refinement typically after ~05-1 degree (more for high mosaicity)
94 Parameter display windows
As described in sect82 the refined detector and crystal parameters will be displayed in tables and selected parameters will be plotted ingraphs The average spot profile for each image will also be displayed
The size of these graphs (and the profile) can be expanded to fill the whole window by holding down Shift and clicking LMB anywherein the graph window A second Shift+click will revert the graph to the original size
In addition to these windows there are windows that tabulate and plot (as a function of image number) the mean Iσ(I) for profile fittedand summation integration intensities The overall values and the values for the highest resolution bin are given
The number of overloaded reflections Bad spots (ie those that fail certain tests see mosflm SUMMARY file sect15) Spatial overlaps andif processing multi-lattice images the number of lattice overlaps is listed for each image and can be plotted by highlighting thatparameter When processing data from crystals with large unit cells it is important to watch out for spatial overlaps (see sect97 for tips onhow to reduce the number of spatial overlaps if this is a problem)
A display of the standard profiles for different regions of the detector is also provided Poor profiles are averaged by includingreflections from inner regions of the detector Averaged profiles are indicated by a red line around the spot (rather than blue) Theoriginal unaveraged profile can be viewed a clicking on the profile (providing there were sufficient spots in that region to allowformation of a profile)
The profiles should be checked to see that they are well defined and centred within the box Poorly-defined diffuse or non-centredprofiles may suggest that the prediction is not very good in which case this should be checked on the corresponding image(s)
It may be useful to expand the standard profiles to fill the window using Shift + click in the profiles window
Finally the lower left window plots Iσ(I) as a function of resolution for any selected image
iMosflm Tutorial
fileUsersandrewg4MOSFLMnewgui_tutorialiMosflm_tutorial_720_ver3html[29052015 105311]
Different parameters can be plotted by selecting the small right- or left-pointing arrows on the title line above the plot
95 Integrating the whole datasetAssuming that everything looks OK the entire dataset can now be integrated However it is strongly recommended thatProjectCrystalDataset names are assigned first These are written to the output MTZ file and used by downstream programs inparticular AIMLESS will use this information when deciding which images belong to the same dataset
Select Experiment settings from the Settings drop-down menu (see Drop down menus sect21) to enter these names and optionally givea title for the MTZ file
Select images 1-84 and click on Process
951 Parallel Integration Using multiple cores
An option is available on the pull-down menu (next to the Process button in the Integration task) which splits up the integration jobover available cores on the local machine All aspects are currently determined automatically at present user-configurable options willbe available in a later version The algorithm used is as follows
iMosflm determines the number of cores available on the local machineIf the number of cores (N) is greater than 2 iMosflm splits the integration run into N-1 batches (up to a maximum of 16) containingapproximately the same number of images If N le 2 iMosflm splits the run into N batches
If the total number of images in each batch is less than 32 the number of batches is decreased until this condition is satisfied
The first batch is submitted as a background task consisting of a refinement stage and an integration stage with its input and outputfiles (including the MTZ file) in a new directory its name being determined from the number of segments of data being integrated andthe lattice number (if the sample has been determined to contain multiple lattices) If the directories exist already they are all movedinto a newly-created directory with a time-stamped name the files from the most recent integration run are thus in directories withnames following the pattern described above Once the refinement stage is complete the refined parameters are written to a file
The launch of subsequent batches are delayed until the corresponding preceding batch has written its refined parameters This file isread and the new batch is launched again with a refinement stage and integration stage
At present the job cannot be aborted once it has started
952 Integrating as a background job
By selecting Batch in the drop-down menu adjacent to the Process button the integration can be run as a background job rather thaninteractively and the GUI can be used to look at a different dataset
Selecting Batch from the drop-down menu will display a new window showing the script that will be used to process the images alongwith a number of processing options The script can be edited if additional keywords are required or if some parameters are to bechanged and can also be copied and pasted into a file for off-line processing
By default the job is divided into batches across multiple cores as determined for the parallel integration described in sect951 but thenumber of cores can be chosen by the user from a drop-down menu in this case the size of each batch is determined by the interface
Plotting the results of the integration can be turned off this can make processing much faster
iMosflm Tutorial
fileUsersandrewg4MOSFLMnewgui_tutorialiMosflm_tutorial_720_ver3html[29052015 105311]
It is possible to configure job submission for remote machines (which can be added by depressing the add host button) Ensure youhave enabled passwordless logins for all the remote machines you enter and that you specify the full path to the Mosflm executable inthe Batch destinations window The remote working directory (in which the log and MTZ files are written) and the remote imagedirectory must both be specified with their full path names Any required parameter fields that are not completed by the user arehighlighted in orange if the user tries to submit a job without completing these fields a new window containing only those fields (againhighlighted in orange) pops up with a request to do so
The number of cores available on the selected host can be determined by depressing the apple core button on the Batch destinationsconfiguration window
The log file for batch submission jobs the MTZ and SUMMARY files are written to the directory in which iMosflm was launched
96 Checking the integration
iMosflm Tutorial
fileUsersandrewg4MOSFLMnewgui_tutorialiMosflm_tutorial_720_ver3html[29052015 105311]
The detector and crystal parameter plots should be examined carefully to check for any instability in the refinement If there are largeand random variations in some parameters (eg the detector twist and tilt) then it may be better to fix them and repeat the integration
For cases (eg very small unit cells) where there are very few suitable reflections on each image the refinement of the missetting anglesmay show significant variations from one image to the next In such cases it is best to apply smoothing to the missetting angles usingthe tick box in Settings -gt Processing options -gt Advanced Refinement
Discontinuities due to blank images should also show up and the offending images should be removed from the scaling run
If adjacent spots are incompletely resolved on the detector it may be possible to improve the processing by increasing the PROFILETOLERANCE parameters by 1-2 These parameters can be set in the Advanced integration tab of the Processing options menu (useSettings)
97 Advanced features for integration
The Settings -gt Processing options menu allows additional control over the integration Parameters such as the minimum spotseparation resolution limits excluded resolution ranges block size MTZ filename and BATCH ADD can be changed in the Processingtab
Manually decreasing the minimum spot separation can help if a large number of reflections are flagged as spatially overlapped (redboxes) The prediction must be updated to see the effect of changing the separation this can be done either by displaying the next orprevious image or double clicking on the blue circle next to the image currently displayed in the Images pane
In the Advanced integration tab the measurement box parameters profile tolerance and profile averaging parameters can be set
The measurement box parameters can be adjusted for rare cases where the estimation of the spot size has not worked correctlyresulting in a box that is too small or too large The optimisation of the background rim and corner cutoff parameters that determinewhich pixels are used for the background and which pixels for the peak can also be turned off but this is generally not recommended
Increasing the profile tolerance can help in cases where adjacent spots are not completely resolved this can be judged by examining thestandard profiles By default the profile tolerance is automatically increased if there are a large number of spatial overlaps as this hasthe effect of reducing the minimum spot separation A message will be written to the logfile if this has happened This option can beturned off using the tick box Optimise profile tolerance values to avoid spot overlap
The profile outlier exclusion parameters control the exclusion of ice spots or hot pixels which could otherwise corrupt the standardprofiles
Pixels with a value less than the Null pixel threshold are considered to belong to inactive regions of the detector
The pixel saturation value determines when a reflection is considered to be an overload The intensity of overloaded reflections isestimated by profile fitting but these reflections are rejected by the scaling program AIMLESS by default
Increasing the Maximum reflection width in φ from the default value of 5deg will reduce the number of rejected reflections (green boxes)and is worthwhile when the mosaicity is very high or the mosaic block size is very small As with the minimum spot separation theimage must be refreshed to see the effect of changing this parameter
The rejection criteria will reject reflections with too much variation in the background (BGRATIO) or where the gradient of thebackground plane is too large These should only be changed if many reflections are being rejected PKRATIO only applies to fullyrecorded reflections and reflects a very poor profile fit With current data collection protocols there will be very few (if any) fullyrecorded reflections
Additional MOSFLM parameters will be added based on user requests
98 Integrating multiple lattices
When multiple lattices have been successfully indexed each lattice can be integrated individually by selecting the appropriate latticenumber
Reflections in the chosen lattice that are overlapped by a reflection from another lattice will be integrated but the measurement box willbe expanded so that the total intensity of the two (or more) reflections is measured These reflections will be flagged for specialtreatment Reflections that are not overlapped are referred to as singletons They will be dealt with in the normal way by POINTLESSand AIMLESS
NOTE If more than one lattice has been indexed and the results of integrating just ONE of the lattices are to be checked byrunning QuickSymm or QuickScale then the multi-lattice icon in the Integration pane must be turned off otherwise an error
iMosflm Tutorial
fileUsersandrewg4MOSFLMnewgui_tutorialiMosflm_tutorial_720_ver3html[29052015 105311]
message will be given saying that all lattices must be integrated
It is often the case that by measuring both lattices (in separate integration runs) and inputting both MTZ files to QuickScale the overallcompleteness is high using ONLY the singletons To use this option ensure that the multi-lattice icon is off
To make use of the intensity estimates for overlapped reflections MTZ files for all lattices must be input to the program FECKLESSwhich will derive the best estimate of the summed intensity This is the default option if more than one lattice has been indexed and itrequires that all lattices have been integrated (in separate runs) prior to running QuickSymm or QuickScale (FECKLESS will be runautomatically)
At this time no downstream programs can make use of the summed intensities of overlapping reflections but in the future it should bepossible to use this data in REFMAC
Currently it is recommended to use only singletons from all the lattices FECKLESS is not required in this case
The MTZ filename is automatically updated to reflect which lattice has been chosen to avoid overwriting the MTZ file of the first latticewhen integrating the second one FECKLESS when run from iMosflm relies on this naming convention so do not change it
10 Running Pointless to check the symmetryOnce the images have been integrated (even a few degrees of data in many cases) the program POINTLESS can be run to determine thetrue Laue symmetry and try to determine the space group using the QuickSymm button
iMosflm Tutorial
fileUsersandrewg4MOSFLMnewgui_tutorialiMosflm_tutorial_720_ver3html[29052015 105311]
Select the QuickSymm button
A summary of the Pointless results as shown below will appear in a qtRView window
Various graphs (L test for twinning ViewHKL to view the reciprocal lattice) can also be viewed in this window
Various options for POINTLESS such as a reference MTZ file forcing the symmetry selected in iMosflm and specifying multiple input MTZfiles can be selected from the Settings -gt Processing options -gt Sort Scale and Merge tab (see below)
iMosflm Tutorial
fileUsersandrewg4MOSFLMnewgui_tutorialiMosflm_tutorial_720_ver3html[29052015 105311]
Caution The results can be ambiguous if run with a partial dataset Look in the logfile to see how many relfections are used totest each possible symmetry operator
11 Running Aimless to scale and merge the dataSelect the QuickScale button
This will first run POINTLESS then change the space group for the data to that selected by POINTLESS (unless the iMosflm symmetry isset to override POINTLESS) run AIMLESS to scale and merge the data in that space group and then run CTRUNCATE which calculates anumber of statistics from the intensity data The CCP4 UNIQUEIFY script will then be run which generates all the unique reflections forthat spacegroup to the resolution of the measured data and will flag reflections (5 by default but this can be changed) for use as theRfree set
AIMLESS can be run from the QuickScale button either treating anomalous data (the default) or ignoring anomalous data If onlyprocessing a few degrees of data it is usually better to ignore anomalous because especially for low symmetry cases no mergingstatistics may be given in AIMLESS
SCALA can be selected as an alternative to AIMLESS for scaling (not recommended)
There is limited control over running AIMLESS (see figure above) including re-setting resolution limits rejecting batches (images)changing the treatment for accepting partials changing the rejection criterion and changing the procedure for updating the standarddeviation estimates
iMosflm Tutorial
fileUsersandrewg4MOSFLMnewgui_tutorialiMosflm_tutorial_720_ver3html[29052015 105311]
The AIMLESS results will be displayed in the qtRView as shown below along with graphical output (see below) and the full log file canalso be examined
Aimless summary file
iMosflm Tutorial
fileUsersandrewg4MOSFLMnewgui_tutorialiMosflm_tutorial_720_ver3html[29052015 105311]
An example of the Aimless graphical output
The AIMLESS logfile can also be examined by selecting the Log File tab
12 History and mosflm log fileSelecting History allows the history of the session to be examined or by selecting the Log tab the full mosflmlp file can be viewed Themosflmlp file is also available in a time-stamped file mosflm_yyyymmdd_hhmmsslp (eg mosflm_20100518_131019lp) and can beread with a text editor
The History has a tree structure and will show when various parameters have been changed This has not been fully implemented and isnot generally useful
The logfile may provide useful clues when processing has failed
13 Warning MessagesAs already mentioned in Adding images sect3 and Integration sect9 warning messages are generated by MOSFLM during processing Atraffic light colour coding has now been assigned based on the warnings and is shown next to the Warnings box
A Red status implies a serious problem that will affect data quality and should be addressed
An Orange status implies minor issues that should be checked to see if things can be improved
A Green status means no significant problems messages are for information only
iMosflm Tutorial
fileUsersandrewg4MOSFLMnewgui_tutorialiMosflm_tutorial_720_ver3html[29052015 105311]
Abbreviated messages can be obtained by clicking on the Warnings icon The full warning Details together with Hints amp Notes text (ifany are available) can be obtained by double-clicking the relevant warning Details are displayed in a pop-up text box which willdisappear with the next click outside the box The same full details and suggestions are of course available in the mosflmlp files whereeven more information may be available
NOTE This is the end of the part of the tutorial which deals directly with iMosflm but see sect19 which has some suggestions forfurther work if you have time The remainder of this document deals with integrating and scaling data with MOSFLM andAimless via the CCP4i user interface examining the traditional mosflm SUMMARY file with the CCP4 utility loggraph
The Appendix contains a shell script for running MOSFLM as a traditional batch job
14 Useful command line optionsiMosflm has a number of command line options and these can be listed by typingimosflm --helpCurrent options are
--allimages -a ltfilenamegt Starts mosflm loading all files that match the template generated from ltfilenamegt--ccp4i2 Autosaves an iMosflm session file upon exit with an XML list of all iMosflm output files--debug -d Creates a large output file for debugging purposes Dont use this unless asked to by a developer--expert -e Permits access to advanced detector settings This should not normally be required--fastload -f Attempt to speed loading of many images offline while indexing two default images separated by 90 degrees--help -h Displays this message then exits--imagedir -I ltdirectorygt Starts the image browser in this directory if ltdirectorygt is given as an environment variable it will be expanded to its full value--init -i ltfilenamegt Starts Mosflm and reads from the given saved session file--startdir -S ltdirectorygt Starts mosflm in directory ltstartdirgt rather than the current directory This will only work if the directory exists and you have write permission to it otherwise iMosflm will exit All the normal mosflm output files will be in this directory--singleimage -s ltfilenamegt Starts mosflm loading only the image from ltfilenamegt--site -X ltfilenamegt Reads anyall of the following lines from the file given WAVELENGTH ltxgt DISPERSION ltxgt POLARISATION [PINHOLE | MIRRORS | MONOCHROMATOR | SYNCHROTRON ltxgt] DIVERGENCE ltxh xvgt BEAM ltbeamx beamygt DISTANCE ltxgt DISTORTION TILT ltxgt DISTORTION TWIST ltxgt GAIN ltxgt DETECTOR REVERSEPHI DETECTOR OMEGA ltxgt--version -v Displays the program version and required Mosflm version then exits
These can be abbreviated to the shortest unambiguous string
141 The site fileimosflm --site ltsitefilegt will read keywords from the file ltsitefilegt that will overwrite incorrect information in image headers Thissaves having to manually correct values in every iMosflm session The site file can also be read or written as an option from the Sessionmenu (see Drop down menus sect21) Allowed keywords areWAVELENGTH ltxgt
iMosflm Tutorial
fileUsersandrewg4MOSFLMnewgui_tutorialiMosflm_tutorial_720_ver3html[29052015 105311]
DISPERSION ltxgtPOLARISATION [PINHOLE | MIRRORS | MONO | SYNCHROTRON ltxgt]DIVERGENCE ltxh xvgtBEAM ltbeamx beamygtDISTANCE ltxgtDISTORTION TILT ltxgtDISTORTION TWIST ltxgtGAIN ltxgtDETECTOR REVERSEPHIDETECTOR OMEGA ltxgt
15 The mosflm SUMMARY fileMOSFLM produces a summary file listing refined parameters for each image and when using iMosflm this file will be date- amp time-stamped and have a name such as mosflm_20100518_131019sum This contains the same information as the plots produced by theiMOSFLM GUI which now also include the number of bad spots and overloads
This can be inspected graphically from the CCP4i GUI using the program loggraph Select the pull down menu View Files from Job andunder Output files select Additional log graphs where the _SUMMARYloggraph file will be listed Select this file to display its tablesin loggraph
This is very useful to identify rogue images (with unusually high positional residual or low Iσ(I)) If you find any read that image intoMOSFLM and see what is wrong with it
If you have done more than one integration run during your MOSFLM session you will find multiple entries of the tables Look at the lastset for integration of the 84 images
Click on the Refined detector parameter tables and check on the stability of parameters like the TILT and TWIST of the detector (unitsare hundredths of a degree) and for Mar Research (or DIP) image plate data the distortion parameters ROFF and TOFF (units are mm) Ifthey are varying a lot (more than 20 for TWISTTILT) or 015 for ROFFTOFF then it is probably a good idea to fix these parameters atthe average value (or the known values for this detector if they are available) (see Detector parameters sect821)
Click on the Post refinement table and check the missets It does not matter if they change slowly and by an amount (per image) that isless than 01mosaic spread If they are changing more than this then there could be a problem with processing the data (there is notmuch you can do about this)
Check how the mosaic spread is changing If it is unstable or if you think it is not refining to sensible values (as judged by looking atthe prediction) then you can fix the input value in the same way as the detector parameters (see Crystal parameters sect822)
BADSPOTS AND OVERLOADS
The program will set a rejection flag for those reflections that fail certain tests for example too much variation in the background levela poor profile fit an intensity that is very negative (more than 5 standard deviations) a very high gradient for the background planeThese reflections are called Bad spots and they are listed individually for each image in the mosflmlp file together with the reason forflagging them The number of bad spots is also written to the summary file Generally there should be very few (5-10) bad spots oneach image If there are more it could be because the backstop shadow is not correctly allowed for (consider using the NULLPIXkeyword)
There should also be very few overloaded reflections on each image If there are a lot then a separate low resolution data collectionpass should be made with a much shorter exposure time
IMPORTANT Both Bad spots and Overloads are written to the output MTZ file but will be rejected by default by AIMLESS Theintensity of overloaded reflections is estimated by profile fitting that part of the spot that is not saturated To include these reflections inthe final merged data use the ACCEPT keyword in AIMLESS
16 Scaling data with CCP4i ccp4i
Select Directories amp ProjectDir (top right)
In the new window select Add project
Enter the project name in the Project field and the full directory path in the uses directory field Default values may have been enteredalready here Select this project from Project for this session
Select Apply and Exit Dismiss the warning message that comes up
Select Data reduction from the pull down menu of modules (orange bar at top left)
iMosflm Tutorial
fileUsersandrewg4MOSFLMnewgui_tutorialiMosflm_tutorial_720_ver3html[29052015 105311]
Select Symmetry Scale Merge (Aimless)
In the window that appears do the following
Give a job title (top line)
Click on the box next to Separate anomalous pairs for outlier rejection amp merging statistics (the crystals have been soaked in a mercurycompound)
In the next orange bar (line starts HKLIN 1) select Browse and select the MTZ file output by MOSFLM (probably called hg_001mtz)Select OK
If you did not supply the Project name Crystal name or Dataset name to Mosflm fill in the boxes for these now
Under Scaling Protocol
From the pull-down menu on the line starting Scale select with automatic default settings
At the bottom of window from the pull-down menu named Run select RunampView Com File
This will display a new window showing the command file for running the POINTLESS step select Continue After a brief pause it willshow the command file for running AIMLESS (This can be edited before submitting the job) Select Continue
In the main window it will show that the AIMLESS job is running
When AIMLESS has finished the command file for running the CTRUNCATE step will appearselect Continue
When CTRUNCATE has run the main window will say FINISHED
At that point select the pull-down menu View Files from Job and select View Log Graphs This will give you the same graphs asrunning loggraph on the AIMLESS log file they are also the same as those that appeared in IMOSFLMs QuickScale task To look at thelog file itself (eg the overall merging statistics) select View Log File and it will appear in a new window
161 Looking at the AIMLESS output
The simplest way to look at the output from AIMLESS is to use loggraph on the AIMLESS log file (or via the CCP4i GUI) This can displaymany different graphs
Use Scales vs rotation range to check for smooth variation in the scale factor Check the variation in B factor with image and if there isno real variation it is best to turn off the B-factor refinement
Use the Analysis against all Batches for all runs to detect bad images (high R-factor large number of rejected spots)
Check the Analysis against resolution Fractional bias to see if there is any indication of Partial bias (A negative partial bias will resultif the mosaic spread is underestimated or if there is a lot of diffuse scatter
The Fractional bias should be less than 1-2 although it will often exceed this for weak data (eg in the high resolution bins)
The Axial reflections graphs in AIMLESS are useful for detecting systematic absences which can be used to identify the true spacegroup However the detection of screw axes is thought to be sufficiently robust in POINTLESS that these graphs are no longer necessary
It can also be useful to look at the AIMLESS log file itself in particular the table giving statistics as a function of resolution The effectiveresolution limit of the data can be estimated by looking at the Mn(I)sd column (this is the mean Iσ(I) AFTER merging symmetry matesand is the best indicator of data quality) This table also shows shell and cumulative R-factors
The Mn(I)sd values depend on having realistic values of the standard deviations (errors) in the intensities As the values that come fromMOSFLM are always underestimates of the true error these values are scaled up in AIMLESS using a three-term correction
sdcorrected = SdFac Sqrt[sd(I)2 + SdBLPI + (SdAddI)2]
Here SdFac is an overall scale factor and SdB and SdAdd are intensity dependent factors
AIMLESS will automatically work out a suitable value for all three parameters in order to make the mean value of (observedscatter)(sdestimate) equal to 10 where observed scatter is the difference between an individual estimate of intensity and the mean ofall other estimates (from symmetry mates)
Probably the best estimate of the true high resolution limit of the data can be obtained from the CC(12) values these are thecorrelations between equivalent observations that have been divided randomly into two half-datasets The resolution limit is foundwhen the CC drops below ~ 05 - 03
This table comes under the heading
ANALYSIS OF STANDARD DEVIATIONS
iMosflm Tutorial
fileUsersandrewg4MOSFLMnewgui_tutorialiMosflm_tutorial_720_ver3html[29052015 105311]
in the AIMLESS log file and Run n standard deviation v Intensity test (where n is 1 or more) in the CCP4i GUI View Files from Job -View Log Graphs display
Can you identify a bad image in this dataset Can you work out why it is bad
(Cluethe image headers contain quite a lot of information that is not used by MOSFLM including the date and time that the image wascollected)
You can exclude a given batch from the scaling using the EXCLUDE keyword
RUN ALL EXCLUDE imagenumber
In this case run number will be 1
Rerun the scaling SENDING THE OUTPUT TO A NEW LOGFILE excluding this image and see the effect on the heights in the anomalousPatterson (in the log file) DO NOT repeat the integration In the command file uncomment the line (near the top) goto aimless so itskips the integration part
In the CCP4i GUI click to highlight the AIMLESS job which is listed as FINISHED and select ldquoReRun Jobrdquo from the control buttons downthe right-hand side of the main interface window Under ldquoExcluded Datardquo in the window that appears check the box next to Excludeselected batches and pull-down on the menu button to exclude a range Give the start amp end range to exclude (eg 74 to 74) Rerunthe job as before
17 Changing the symmetryFrom the list of options at the left hand side of the main window select ldquoUtilitiesrdquo and under that SortModifyCombine MTZ Files
In the new window give a new title eg reindex as H32
Click on the Box Change space group andor reindex reflections
Use the browse option to select the input MTZ file (First orange bar) the output filename will be generated automatically (but you canchange it)
Under Reindex details
In the last option check the box next to ldquoChange space group tordquo and enter H32 in the box This is above the final item Reducereflections to the asymmetric unit which is checked by default
Select Run from the Run option button
Then go back to the scaling window and select the new MTZ file (reindexed) as the input for scaling (use Browse) CHANGE THE JOBTITLE
Then select RUN
The scaling will now be performed in space group H32 Look at the merging statistics in the log file in particular the multiplicityweighted R-factor called Rmeas in the log file
18 Looking at the CTRUNCATE outputThe CTRUNCATE program converts intensities to amplitudes and also compiles some useful statistics The LTEST and the cumulativeintensity statistics tabulated by CTRUNCATE (and plotted by loggraph) provide the only point at which you will be able to detectmerohedral twinning (when the two lattices of the twin components exactly overlap and every measured intensity is actually the sum oftwo intensities)
For a good dataset the observed distribution should be within 1 of the theoretical distribution Is this the case for this data
19 If you have time 191 Different mosaic spreads
Try repeating the processing with the mosaic spread set to a value 25 smaller than the refined one and fix it by checking the Fix boxin the Integration window in iMosflm
Can you tell from the merging statistics if this data is better
192 Checking up on outliers
iMosflm Tutorial
fileUsersandrewg4MOSFLMnewgui_tutorialiMosflm_tutorial_720_ver3html[29052015 105311]
AIMLESS writes a file called ROGUES which lists reflections which show very poor agreement between symmetry mates or which areimplausibly large
Look in this file (it is ASCII) and try to work out why this has happened The ROGUES file gives you the image (Batch) on which thereflections have been recorded (for partials this is the image nearest the centre of the reflection so you may need to look on thepreceding and following image as well) Select a reflection which shows very poor agreement with its symmetry mates (A value greaterthan 10 in the DelIsd column in the ROGUES file)
Select the offending image by double-clicking it in the Images pane of the iMosflm main window Predict the reflections then enter thehkl values into the boxes and hit Return (or click the red warning button following the entry box for l) to locate the offending reflectionin the image You must give the measured indices - the first set of values in the ROGUES file - when doing this See if there is anythingodd about the spot Remember to check adjacent images for partials
193 How accurate does the unit cell have to be
Try changing the cell parameters by (say) 10 and integrate the images again What is the effect on the merging statistics
20 Tips1 When reading images into a session DO NOT attempt to carry out any other task until ALL the images have been read2 It is often worth repeating the indexing (usually only once) as the refined direct beam coordinates from the first indexing may give
an improved solution when the indexing is repeated (lower rmsd)3 Always integrate a few degrees of data before integrating the whole dataset (see sect9) If the space group is not known in advance
run Quicksymm with a few degrees of data to check that the correct indexing solution has been chosen4 For difficult images do not attempt to refine the unit cell initially once an indexing solution has been obtained try integrating a
few images to ensure that the integration is stable If then going on to refine the cell check that the prediction looks OK for thefirst image of every segment included in the refinement If it does not look very good consider using the pattern matching(Settings -gt Processing options -gt Advanced refinement see sect84)
5 If the resolution of the data is less than 35 Aring do not use the ldquoRefine Cellrdquo task Instead use several images in indexing and use thecell that comes from the indexing
6 If iMosflm gets into a state where the activity icon(upper right) is spinning but nothing seems to be happening click on the activityicon to stop it spinning and see if the session can be continued DO NOT click on the activity icon simply to abort a task this willgive unpredictable results Use the Abort button for cell refinement or integration There is no defined way to abort indexing
7 Use the image summation option (see sect4) to get a better impression of the diffraction for very low exposure Pilatus images8 Use image summation for detector parameter refinement for fine sliced very weak Pilatus images (Settings -gt Processing options -
gt Advanced refinement see sect821)9 For large mosaic spread values (gt 10deg) or small mosaic block sizes (lt10) consider increasing the maximum allowed reflection
width to avoid having too many green predicted reflections (Settings -gt Processing options -gt Advanced integration see sect97)10 By default on selecting the Indexing task iMosflm will find spots index and (assuming a solution has been found) estimate the
mosaicity For difficult cases it is more useful to restrict this to simply finding spots and then do the indexing and mosaicityestimation by clicking the appropriate buttons To do this change the check box Automatically index after spot finding inSettings -gt Processing options -gt Indexing
11 See sect521 and sect522 for advice if the indexing fails Also consider the possibility of a reversed phi rotation direction if you arenot familiar with the beamline (Settings -gt Experiment settings -gt Experiment see sect21)
12 If the detector parameters have refined to physically unreasonable values (eg because cell refinement or integration has beencarried out using an incorrect indexing solution) be sure to reset the detector parameters before attempting further processing(Settings -gt Experiment settings -gt Detector see sect21)
13 Always set the resolution limit slightly beyond the point at which any spots are visible (see sect414 ) For very weak fine-sliceddata it can be very difficult to estimate the resolution visually so integrate to the maximum resolution (inscribed circle) and usethe merging results to set the final resolution There should be no problems integrating to a resolution ~03-05 Aring beyond theactual resolution limit but for example integrating to 3 Aring when the true resolution limit is 5-6 Aring may cause problems and theintegration should then be repeated with a more realistic resolution limit
14 Use the site file sect141 if repeatedly processing data where the direct beam position is wrong or if the phi direction is reversed etcto save having to correct this for every session
Appendix IA command script for running MOSFLM using the keywords copied from the Batch processing window of the new GUI (see Integratingas a background job sect952) Note that keyworded input for MOSFLM and other CCP4 programs is case-insensitive apart from file anddirectory names
bincsh -fv Set a unique identifier for filenames for this job
set ident = x89_mos07_blk3_smallsep
iMosflm Tutorial
fileUsersandrewg4MOSFLMnewgui_tutorialiMosflm_tutorial_720_ver3html[29052015 105311]
$ipmosflm COORDS $identcoords SUMMARY $identsummary ltlt eof-ip Insert keywords copied from iMosflm batch window here
Keywords for this run For example could involve trying different values for mosaic spread or not integrating all images etc etchklout $identmtzgenfile $identgenprocess 1 1000 goeof-ip
pointlesspointless hklin $identmtz hklout $ident_pointlessmtz
aimlessaimless hklin $ident_pointlessmtz hklout $ident_aimless_partmtz ROGUES $identrogues ltlt eof-aimless Use all default options for aimlesseof-aimless
ctruncate hklin $ident_aimlessmtz hklout $ident_truncatemtz
Harry Powell Andrew Leslie and Owen Johnson
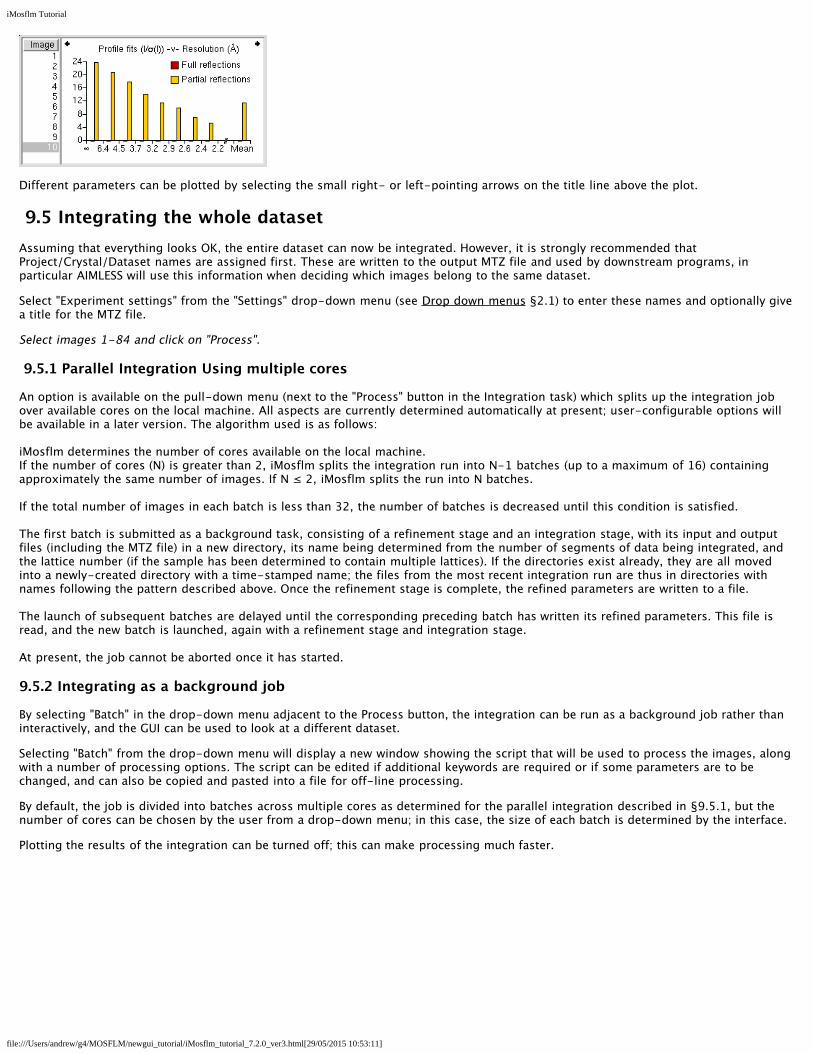
iMosflm Tutorial
fileUsersandrewg4MOSFLMnewgui_tutorialiMosflm_tutorial_720_ver3html[29052015 105311]
Different parameters can be plotted by selecting the small right- or left-pointing arrows on the title line above the plot
95 Integrating the whole datasetAssuming that everything looks OK the entire dataset can now be integrated However it is strongly recommended thatProjectCrystalDataset names are assigned first These are written to the output MTZ file and used by downstream programs inparticular AIMLESS will use this information when deciding which images belong to the same dataset
Select Experiment settings from the Settings drop-down menu (see Drop down menus sect21) to enter these names and optionally givea title for the MTZ file
Select images 1-84 and click on Process
951 Parallel Integration Using multiple cores
An option is available on the pull-down menu (next to the Process button in the Integration task) which splits up the integration jobover available cores on the local machine All aspects are currently determined automatically at present user-configurable options willbe available in a later version The algorithm used is as follows
iMosflm determines the number of cores available on the local machineIf the number of cores (N) is greater than 2 iMosflm splits the integration run into N-1 batches (up to a maximum of 16) containingapproximately the same number of images If N le 2 iMosflm splits the run into N batches
If the total number of images in each batch is less than 32 the number of batches is decreased until this condition is satisfied
The first batch is submitted as a background task consisting of a refinement stage and an integration stage with its input and outputfiles (including the MTZ file) in a new directory its name being determined from the number of segments of data being integrated andthe lattice number (if the sample has been determined to contain multiple lattices) If the directories exist already they are all movedinto a newly-created directory with a time-stamped name the files from the most recent integration run are thus in directories withnames following the pattern described above Once the refinement stage is complete the refined parameters are written to a file
The launch of subsequent batches are delayed until the corresponding preceding batch has written its refined parameters This file isread and the new batch is launched again with a refinement stage and integration stage
At present the job cannot be aborted once it has started
952 Integrating as a background job
By selecting Batch in the drop-down menu adjacent to the Process button the integration can be run as a background job rather thaninteractively and the GUI can be used to look at a different dataset
Selecting Batch from the drop-down menu will display a new window showing the script that will be used to process the images alongwith a number of processing options The script can be edited if additional keywords are required or if some parameters are to bechanged and can also be copied and pasted into a file for off-line processing
By default the job is divided into batches across multiple cores as determined for the parallel integration described in sect951 but thenumber of cores can be chosen by the user from a drop-down menu in this case the size of each batch is determined by the interface
Plotting the results of the integration can be turned off this can make processing much faster
iMosflm Tutorial
fileUsersandrewg4MOSFLMnewgui_tutorialiMosflm_tutorial_720_ver3html[29052015 105311]
It is possible to configure job submission for remote machines (which can be added by depressing the add host button) Ensure youhave enabled passwordless logins for all the remote machines you enter and that you specify the full path to the Mosflm executable inthe Batch destinations window The remote working directory (in which the log and MTZ files are written) and the remote imagedirectory must both be specified with their full path names Any required parameter fields that are not completed by the user arehighlighted in orange if the user tries to submit a job without completing these fields a new window containing only those fields (againhighlighted in orange) pops up with a request to do so
The number of cores available on the selected host can be determined by depressing the apple core button on the Batch destinationsconfiguration window
The log file for batch submission jobs the MTZ and SUMMARY files are written to the directory in which iMosflm was launched
96 Checking the integration
iMosflm Tutorial
fileUsersandrewg4MOSFLMnewgui_tutorialiMosflm_tutorial_720_ver3html[29052015 105311]
The detector and crystal parameter plots should be examined carefully to check for any instability in the refinement If there are largeand random variations in some parameters (eg the detector twist and tilt) then it may be better to fix them and repeat the integration
For cases (eg very small unit cells) where there are very few suitable reflections on each image the refinement of the missetting anglesmay show significant variations from one image to the next In such cases it is best to apply smoothing to the missetting angles usingthe tick box in Settings -gt Processing options -gt Advanced Refinement
Discontinuities due to blank images should also show up and the offending images should be removed from the scaling run
If adjacent spots are incompletely resolved on the detector it may be possible to improve the processing by increasing the PROFILETOLERANCE parameters by 1-2 These parameters can be set in the Advanced integration tab of the Processing options menu (useSettings)
97 Advanced features for integration
The Settings -gt Processing options menu allows additional control over the integration Parameters such as the minimum spotseparation resolution limits excluded resolution ranges block size MTZ filename and BATCH ADD can be changed in the Processingtab
Manually decreasing the minimum spot separation can help if a large number of reflections are flagged as spatially overlapped (redboxes) The prediction must be updated to see the effect of changing the separation this can be done either by displaying the next orprevious image or double clicking on the blue circle next to the image currently displayed in the Images pane
In the Advanced integration tab the measurement box parameters profile tolerance and profile averaging parameters can be set
The measurement box parameters can be adjusted for rare cases where the estimation of the spot size has not worked correctlyresulting in a box that is too small or too large The optimisation of the background rim and corner cutoff parameters that determinewhich pixels are used for the background and which pixels for the peak can also be turned off but this is generally not recommended
Increasing the profile tolerance can help in cases where adjacent spots are not completely resolved this can be judged by examining thestandard profiles By default the profile tolerance is automatically increased if there are a large number of spatial overlaps as this hasthe effect of reducing the minimum spot separation A message will be written to the logfile if this has happened This option can beturned off using the tick box Optimise profile tolerance values to avoid spot overlap
The profile outlier exclusion parameters control the exclusion of ice spots or hot pixels which could otherwise corrupt the standardprofiles
Pixels with a value less than the Null pixel threshold are considered to belong to inactive regions of the detector
The pixel saturation value determines when a reflection is considered to be an overload The intensity of overloaded reflections isestimated by profile fitting but these reflections are rejected by the scaling program AIMLESS by default
Increasing the Maximum reflection width in φ from the default value of 5deg will reduce the number of rejected reflections (green boxes)and is worthwhile when the mosaicity is very high or the mosaic block size is very small As with the minimum spot separation theimage must be refreshed to see the effect of changing this parameter
The rejection criteria will reject reflections with too much variation in the background (BGRATIO) or where the gradient of thebackground plane is too large These should only be changed if many reflections are being rejected PKRATIO only applies to fullyrecorded reflections and reflects a very poor profile fit With current data collection protocols there will be very few (if any) fullyrecorded reflections
Additional MOSFLM parameters will be added based on user requests
98 Integrating multiple lattices
When multiple lattices have been successfully indexed each lattice can be integrated individually by selecting the appropriate latticenumber
Reflections in the chosen lattice that are overlapped by a reflection from another lattice will be integrated but the measurement box willbe expanded so that the total intensity of the two (or more) reflections is measured These reflections will be flagged for specialtreatment Reflections that are not overlapped are referred to as singletons They will be dealt with in the normal way by POINTLESSand AIMLESS
NOTE If more than one lattice has been indexed and the results of integrating just ONE of the lattices are to be checked byrunning QuickSymm or QuickScale then the multi-lattice icon in the Integration pane must be turned off otherwise an error
iMosflm Tutorial
fileUsersandrewg4MOSFLMnewgui_tutorialiMosflm_tutorial_720_ver3html[29052015 105311]
message will be given saying that all lattices must be integrated
It is often the case that by measuring both lattices (in separate integration runs) and inputting both MTZ files to QuickScale the overallcompleteness is high using ONLY the singletons To use this option ensure that the multi-lattice icon is off
To make use of the intensity estimates for overlapped reflections MTZ files for all lattices must be input to the program FECKLESSwhich will derive the best estimate of the summed intensity This is the default option if more than one lattice has been indexed and itrequires that all lattices have been integrated (in separate runs) prior to running QuickSymm or QuickScale (FECKLESS will be runautomatically)
At this time no downstream programs can make use of the summed intensities of overlapping reflections but in the future it should bepossible to use this data in REFMAC
Currently it is recommended to use only singletons from all the lattices FECKLESS is not required in this case
The MTZ filename is automatically updated to reflect which lattice has been chosen to avoid overwriting the MTZ file of the first latticewhen integrating the second one FECKLESS when run from iMosflm relies on this naming convention so do not change it
10 Running Pointless to check the symmetryOnce the images have been integrated (even a few degrees of data in many cases) the program POINTLESS can be run to determine thetrue Laue symmetry and try to determine the space group using the QuickSymm button
iMosflm Tutorial
fileUsersandrewg4MOSFLMnewgui_tutorialiMosflm_tutorial_720_ver3html[29052015 105311]
Select the QuickSymm button
A summary of the Pointless results as shown below will appear in a qtRView window
Various graphs (L test for twinning ViewHKL to view the reciprocal lattice) can also be viewed in this window
Various options for POINTLESS such as a reference MTZ file forcing the symmetry selected in iMosflm and specifying multiple input MTZfiles can be selected from the Settings -gt Processing options -gt Sort Scale and Merge tab (see below)
iMosflm Tutorial
fileUsersandrewg4MOSFLMnewgui_tutorialiMosflm_tutorial_720_ver3html[29052015 105311]
Caution The results can be ambiguous if run with a partial dataset Look in the logfile to see how many relfections are used totest each possible symmetry operator
11 Running Aimless to scale and merge the dataSelect the QuickScale button
This will first run POINTLESS then change the space group for the data to that selected by POINTLESS (unless the iMosflm symmetry isset to override POINTLESS) run AIMLESS to scale and merge the data in that space group and then run CTRUNCATE which calculates anumber of statistics from the intensity data The CCP4 UNIQUEIFY script will then be run which generates all the unique reflections forthat spacegroup to the resolution of the measured data and will flag reflections (5 by default but this can be changed) for use as theRfree set
AIMLESS can be run from the QuickScale button either treating anomalous data (the default) or ignoring anomalous data If onlyprocessing a few degrees of data it is usually better to ignore anomalous because especially for low symmetry cases no mergingstatistics may be given in AIMLESS
SCALA can be selected as an alternative to AIMLESS for scaling (not recommended)
There is limited control over running AIMLESS (see figure above) including re-setting resolution limits rejecting batches (images)changing the treatment for accepting partials changing the rejection criterion and changing the procedure for updating the standarddeviation estimates
iMosflm Tutorial
fileUsersandrewg4MOSFLMnewgui_tutorialiMosflm_tutorial_720_ver3html[29052015 105311]
The AIMLESS results will be displayed in the qtRView as shown below along with graphical output (see below) and the full log file canalso be examined
Aimless summary file
iMosflm Tutorial
fileUsersandrewg4MOSFLMnewgui_tutorialiMosflm_tutorial_720_ver3html[29052015 105311]
An example of the Aimless graphical output
The AIMLESS logfile can also be examined by selecting the Log File tab
12 History and mosflm log fileSelecting History allows the history of the session to be examined or by selecting the Log tab the full mosflmlp file can be viewed Themosflmlp file is also available in a time-stamped file mosflm_yyyymmdd_hhmmsslp (eg mosflm_20100518_131019lp) and can beread with a text editor
The History has a tree structure and will show when various parameters have been changed This has not been fully implemented and isnot generally useful
The logfile may provide useful clues when processing has failed
13 Warning MessagesAs already mentioned in Adding images sect3 and Integration sect9 warning messages are generated by MOSFLM during processing Atraffic light colour coding has now been assigned based on the warnings and is shown next to the Warnings box
A Red status implies a serious problem that will affect data quality and should be addressed
An Orange status implies minor issues that should be checked to see if things can be improved
A Green status means no significant problems messages are for information only
iMosflm Tutorial
fileUsersandrewg4MOSFLMnewgui_tutorialiMosflm_tutorial_720_ver3html[29052015 105311]
Abbreviated messages can be obtained by clicking on the Warnings icon The full warning Details together with Hints amp Notes text (ifany are available) can be obtained by double-clicking the relevant warning Details are displayed in a pop-up text box which willdisappear with the next click outside the box The same full details and suggestions are of course available in the mosflmlp files whereeven more information may be available
NOTE This is the end of the part of the tutorial which deals directly with iMosflm but see sect19 which has some suggestions forfurther work if you have time The remainder of this document deals with integrating and scaling data with MOSFLM andAimless via the CCP4i user interface examining the traditional mosflm SUMMARY file with the CCP4 utility loggraph
The Appendix contains a shell script for running MOSFLM as a traditional batch job
14 Useful command line optionsiMosflm has a number of command line options and these can be listed by typingimosflm --helpCurrent options are
--allimages -a ltfilenamegt Starts mosflm loading all files that match the template generated from ltfilenamegt--ccp4i2 Autosaves an iMosflm session file upon exit with an XML list of all iMosflm output files--debug -d Creates a large output file for debugging purposes Dont use this unless asked to by a developer--expert -e Permits access to advanced detector settings This should not normally be required--fastload -f Attempt to speed loading of many images offline while indexing two default images separated by 90 degrees--help -h Displays this message then exits--imagedir -I ltdirectorygt Starts the image browser in this directory if ltdirectorygt is given as an environment variable it will be expanded to its full value--init -i ltfilenamegt Starts Mosflm and reads from the given saved session file--startdir -S ltdirectorygt Starts mosflm in directory ltstartdirgt rather than the current directory This will only work if the directory exists and you have write permission to it otherwise iMosflm will exit All the normal mosflm output files will be in this directory--singleimage -s ltfilenamegt Starts mosflm loading only the image from ltfilenamegt--site -X ltfilenamegt Reads anyall of the following lines from the file given WAVELENGTH ltxgt DISPERSION ltxgt POLARISATION [PINHOLE | MIRRORS | MONOCHROMATOR | SYNCHROTRON ltxgt] DIVERGENCE ltxh xvgt BEAM ltbeamx beamygt DISTANCE ltxgt DISTORTION TILT ltxgt DISTORTION TWIST ltxgt GAIN ltxgt DETECTOR REVERSEPHI DETECTOR OMEGA ltxgt--version -v Displays the program version and required Mosflm version then exits
These can be abbreviated to the shortest unambiguous string
141 The site fileimosflm --site ltsitefilegt will read keywords from the file ltsitefilegt that will overwrite incorrect information in image headers Thissaves having to manually correct values in every iMosflm session The site file can also be read or written as an option from the Sessionmenu (see Drop down menus sect21) Allowed keywords areWAVELENGTH ltxgt
iMosflm Tutorial
fileUsersandrewg4MOSFLMnewgui_tutorialiMosflm_tutorial_720_ver3html[29052015 105311]
DISPERSION ltxgtPOLARISATION [PINHOLE | MIRRORS | MONO | SYNCHROTRON ltxgt]DIVERGENCE ltxh xvgtBEAM ltbeamx beamygtDISTANCE ltxgtDISTORTION TILT ltxgtDISTORTION TWIST ltxgtGAIN ltxgtDETECTOR REVERSEPHIDETECTOR OMEGA ltxgt
15 The mosflm SUMMARY fileMOSFLM produces a summary file listing refined parameters for each image and when using iMosflm this file will be date- amp time-stamped and have a name such as mosflm_20100518_131019sum This contains the same information as the plots produced by theiMOSFLM GUI which now also include the number of bad spots and overloads
This can be inspected graphically from the CCP4i GUI using the program loggraph Select the pull down menu View Files from Job andunder Output files select Additional log graphs where the _SUMMARYloggraph file will be listed Select this file to display its tablesin loggraph
This is very useful to identify rogue images (with unusually high positional residual or low Iσ(I)) If you find any read that image intoMOSFLM and see what is wrong with it
If you have done more than one integration run during your MOSFLM session you will find multiple entries of the tables Look at the lastset for integration of the 84 images
Click on the Refined detector parameter tables and check on the stability of parameters like the TILT and TWIST of the detector (unitsare hundredths of a degree) and for Mar Research (or DIP) image plate data the distortion parameters ROFF and TOFF (units are mm) Ifthey are varying a lot (more than 20 for TWISTTILT) or 015 for ROFFTOFF then it is probably a good idea to fix these parameters atthe average value (or the known values for this detector if they are available) (see Detector parameters sect821)
Click on the Post refinement table and check the missets It does not matter if they change slowly and by an amount (per image) that isless than 01mosaic spread If they are changing more than this then there could be a problem with processing the data (there is notmuch you can do about this)
Check how the mosaic spread is changing If it is unstable or if you think it is not refining to sensible values (as judged by looking atthe prediction) then you can fix the input value in the same way as the detector parameters (see Crystal parameters sect822)
BADSPOTS AND OVERLOADS
The program will set a rejection flag for those reflections that fail certain tests for example too much variation in the background levela poor profile fit an intensity that is very negative (more than 5 standard deviations) a very high gradient for the background planeThese reflections are called Bad spots and they are listed individually for each image in the mosflmlp file together with the reason forflagging them The number of bad spots is also written to the summary file Generally there should be very few (5-10) bad spots oneach image If there are more it could be because the backstop shadow is not correctly allowed for (consider using the NULLPIXkeyword)
There should also be very few overloaded reflections on each image If there are a lot then a separate low resolution data collectionpass should be made with a much shorter exposure time
IMPORTANT Both Bad spots and Overloads are written to the output MTZ file but will be rejected by default by AIMLESS Theintensity of overloaded reflections is estimated by profile fitting that part of the spot that is not saturated To include these reflections inthe final merged data use the ACCEPT keyword in AIMLESS
16 Scaling data with CCP4i ccp4i
Select Directories amp ProjectDir (top right)
In the new window select Add project
Enter the project name in the Project field and the full directory path in the uses directory field Default values may have been enteredalready here Select this project from Project for this session
Select Apply and Exit Dismiss the warning message that comes up
Select Data reduction from the pull down menu of modules (orange bar at top left)
iMosflm Tutorial
fileUsersandrewg4MOSFLMnewgui_tutorialiMosflm_tutorial_720_ver3html[29052015 105311]
Select Symmetry Scale Merge (Aimless)
In the window that appears do the following
Give a job title (top line)
Click on the box next to Separate anomalous pairs for outlier rejection amp merging statistics (the crystals have been soaked in a mercurycompound)
In the next orange bar (line starts HKLIN 1) select Browse and select the MTZ file output by MOSFLM (probably called hg_001mtz)Select OK
If you did not supply the Project name Crystal name or Dataset name to Mosflm fill in the boxes for these now
Under Scaling Protocol
From the pull-down menu on the line starting Scale select with automatic default settings
At the bottom of window from the pull-down menu named Run select RunampView Com File
This will display a new window showing the command file for running the POINTLESS step select Continue After a brief pause it willshow the command file for running AIMLESS (This can be edited before submitting the job) Select Continue
In the main window it will show that the AIMLESS job is running
When AIMLESS has finished the command file for running the CTRUNCATE step will appearselect Continue
When CTRUNCATE has run the main window will say FINISHED
At that point select the pull-down menu View Files from Job and select View Log Graphs This will give you the same graphs asrunning loggraph on the AIMLESS log file they are also the same as those that appeared in IMOSFLMs QuickScale task To look at thelog file itself (eg the overall merging statistics) select View Log File and it will appear in a new window
161 Looking at the AIMLESS output
The simplest way to look at the output from AIMLESS is to use loggraph on the AIMLESS log file (or via the CCP4i GUI) This can displaymany different graphs
Use Scales vs rotation range to check for smooth variation in the scale factor Check the variation in B factor with image and if there isno real variation it is best to turn off the B-factor refinement
Use the Analysis against all Batches for all runs to detect bad images (high R-factor large number of rejected spots)
Check the Analysis against resolution Fractional bias to see if there is any indication of Partial bias (A negative partial bias will resultif the mosaic spread is underestimated or if there is a lot of diffuse scatter
The Fractional bias should be less than 1-2 although it will often exceed this for weak data (eg in the high resolution bins)
The Axial reflections graphs in AIMLESS are useful for detecting systematic absences which can be used to identify the true spacegroup However the detection of screw axes is thought to be sufficiently robust in POINTLESS that these graphs are no longer necessary
It can also be useful to look at the AIMLESS log file itself in particular the table giving statistics as a function of resolution The effectiveresolution limit of the data can be estimated by looking at the Mn(I)sd column (this is the mean Iσ(I) AFTER merging symmetry matesand is the best indicator of data quality) This table also shows shell and cumulative R-factors
The Mn(I)sd values depend on having realistic values of the standard deviations (errors) in the intensities As the values that come fromMOSFLM are always underestimates of the true error these values are scaled up in AIMLESS using a three-term correction
sdcorrected = SdFac Sqrt[sd(I)2 + SdBLPI + (SdAddI)2]
Here SdFac is an overall scale factor and SdB and SdAdd are intensity dependent factors
AIMLESS will automatically work out a suitable value for all three parameters in order to make the mean value of (observedscatter)(sdestimate) equal to 10 where observed scatter is the difference between an individual estimate of intensity and the mean ofall other estimates (from symmetry mates)
Probably the best estimate of the true high resolution limit of the data can be obtained from the CC(12) values these are thecorrelations between equivalent observations that have been divided randomly into two half-datasets The resolution limit is foundwhen the CC drops below ~ 05 - 03
This table comes under the heading
ANALYSIS OF STANDARD DEVIATIONS
iMosflm Tutorial
fileUsersandrewg4MOSFLMnewgui_tutorialiMosflm_tutorial_720_ver3html[29052015 105311]
in the AIMLESS log file and Run n standard deviation v Intensity test (where n is 1 or more) in the CCP4i GUI View Files from Job -View Log Graphs display
Can you identify a bad image in this dataset Can you work out why it is bad
(Cluethe image headers contain quite a lot of information that is not used by MOSFLM including the date and time that the image wascollected)
You can exclude a given batch from the scaling using the EXCLUDE keyword
RUN ALL EXCLUDE imagenumber
In this case run number will be 1
Rerun the scaling SENDING THE OUTPUT TO A NEW LOGFILE excluding this image and see the effect on the heights in the anomalousPatterson (in the log file) DO NOT repeat the integration In the command file uncomment the line (near the top) goto aimless so itskips the integration part
In the CCP4i GUI click to highlight the AIMLESS job which is listed as FINISHED and select ldquoReRun Jobrdquo from the control buttons downthe right-hand side of the main interface window Under ldquoExcluded Datardquo in the window that appears check the box next to Excludeselected batches and pull-down on the menu button to exclude a range Give the start amp end range to exclude (eg 74 to 74) Rerunthe job as before
17 Changing the symmetryFrom the list of options at the left hand side of the main window select ldquoUtilitiesrdquo and under that SortModifyCombine MTZ Files
In the new window give a new title eg reindex as H32
Click on the Box Change space group andor reindex reflections
Use the browse option to select the input MTZ file (First orange bar) the output filename will be generated automatically (but you canchange it)
Under Reindex details
In the last option check the box next to ldquoChange space group tordquo and enter H32 in the box This is above the final item Reducereflections to the asymmetric unit which is checked by default
Select Run from the Run option button
Then go back to the scaling window and select the new MTZ file (reindexed) as the input for scaling (use Browse) CHANGE THE JOBTITLE
Then select RUN
The scaling will now be performed in space group H32 Look at the merging statistics in the log file in particular the multiplicityweighted R-factor called Rmeas in the log file
18 Looking at the CTRUNCATE outputThe CTRUNCATE program converts intensities to amplitudes and also compiles some useful statistics The LTEST and the cumulativeintensity statistics tabulated by CTRUNCATE (and plotted by loggraph) provide the only point at which you will be able to detectmerohedral twinning (when the two lattices of the twin components exactly overlap and every measured intensity is actually the sum oftwo intensities)
For a good dataset the observed distribution should be within 1 of the theoretical distribution Is this the case for this data
19 If you have time 191 Different mosaic spreads
Try repeating the processing with the mosaic spread set to a value 25 smaller than the refined one and fix it by checking the Fix boxin the Integration window in iMosflm
Can you tell from the merging statistics if this data is better
192 Checking up on outliers
iMosflm Tutorial
fileUsersandrewg4MOSFLMnewgui_tutorialiMosflm_tutorial_720_ver3html[29052015 105311]
AIMLESS writes a file called ROGUES which lists reflections which show very poor agreement between symmetry mates or which areimplausibly large
Look in this file (it is ASCII) and try to work out why this has happened The ROGUES file gives you the image (Batch) on which thereflections have been recorded (for partials this is the image nearest the centre of the reflection so you may need to look on thepreceding and following image as well) Select a reflection which shows very poor agreement with its symmetry mates (A value greaterthan 10 in the DelIsd column in the ROGUES file)
Select the offending image by double-clicking it in the Images pane of the iMosflm main window Predict the reflections then enter thehkl values into the boxes and hit Return (or click the red warning button following the entry box for l) to locate the offending reflectionin the image You must give the measured indices - the first set of values in the ROGUES file - when doing this See if there is anythingodd about the spot Remember to check adjacent images for partials
193 How accurate does the unit cell have to be
Try changing the cell parameters by (say) 10 and integrate the images again What is the effect on the merging statistics
20 Tips1 When reading images into a session DO NOT attempt to carry out any other task until ALL the images have been read2 It is often worth repeating the indexing (usually only once) as the refined direct beam coordinates from the first indexing may give
an improved solution when the indexing is repeated (lower rmsd)3 Always integrate a few degrees of data before integrating the whole dataset (see sect9) If the space group is not known in advance
run Quicksymm with a few degrees of data to check that the correct indexing solution has been chosen4 For difficult images do not attempt to refine the unit cell initially once an indexing solution has been obtained try integrating a
few images to ensure that the integration is stable If then going on to refine the cell check that the prediction looks OK for thefirst image of every segment included in the refinement If it does not look very good consider using the pattern matching(Settings -gt Processing options -gt Advanced refinement see sect84)
5 If the resolution of the data is less than 35 Aring do not use the ldquoRefine Cellrdquo task Instead use several images in indexing and use thecell that comes from the indexing
6 If iMosflm gets into a state where the activity icon(upper right) is spinning but nothing seems to be happening click on the activityicon to stop it spinning and see if the session can be continued DO NOT click on the activity icon simply to abort a task this willgive unpredictable results Use the Abort button for cell refinement or integration There is no defined way to abort indexing
7 Use the image summation option (see sect4) to get a better impression of the diffraction for very low exposure Pilatus images8 Use image summation for detector parameter refinement for fine sliced very weak Pilatus images (Settings -gt Processing options -
gt Advanced refinement see sect821)9 For large mosaic spread values (gt 10deg) or small mosaic block sizes (lt10) consider increasing the maximum allowed reflection
width to avoid having too many green predicted reflections (Settings -gt Processing options -gt Advanced integration see sect97)10 By default on selecting the Indexing task iMosflm will find spots index and (assuming a solution has been found) estimate the
mosaicity For difficult cases it is more useful to restrict this to simply finding spots and then do the indexing and mosaicityestimation by clicking the appropriate buttons To do this change the check box Automatically index after spot finding inSettings -gt Processing options -gt Indexing
11 See sect521 and sect522 for advice if the indexing fails Also consider the possibility of a reversed phi rotation direction if you arenot familiar with the beamline (Settings -gt Experiment settings -gt Experiment see sect21)
12 If the detector parameters have refined to physically unreasonable values (eg because cell refinement or integration has beencarried out using an incorrect indexing solution) be sure to reset the detector parameters before attempting further processing(Settings -gt Experiment settings -gt Detector see sect21)
13 Always set the resolution limit slightly beyond the point at which any spots are visible (see sect414 ) For very weak fine-sliceddata it can be very difficult to estimate the resolution visually so integrate to the maximum resolution (inscribed circle) and usethe merging results to set the final resolution There should be no problems integrating to a resolution ~03-05 Aring beyond theactual resolution limit but for example integrating to 3 Aring when the true resolution limit is 5-6 Aring may cause problems and theintegration should then be repeated with a more realistic resolution limit
14 Use the site file sect141 if repeatedly processing data where the direct beam position is wrong or if the phi direction is reversed etcto save having to correct this for every session
Appendix IA command script for running MOSFLM using the keywords copied from the Batch processing window of the new GUI (see Integratingas a background job sect952) Note that keyworded input for MOSFLM and other CCP4 programs is case-insensitive apart from file anddirectory names
bincsh -fv Set a unique identifier for filenames for this job
set ident = x89_mos07_blk3_smallsep
iMosflm Tutorial
fileUsersandrewg4MOSFLMnewgui_tutorialiMosflm_tutorial_720_ver3html[29052015 105311]
$ipmosflm COORDS $identcoords SUMMARY $identsummary ltlt eof-ip Insert keywords copied from iMosflm batch window here
Keywords for this run For example could involve trying different values for mosaic spread or not integrating all images etc etchklout $identmtzgenfile $identgenprocess 1 1000 goeof-ip
pointlesspointless hklin $identmtz hklout $ident_pointlessmtz
aimlessaimless hklin $ident_pointlessmtz hklout $ident_aimless_partmtz ROGUES $identrogues ltlt eof-aimless Use all default options for aimlesseof-aimless
ctruncate hklin $ident_aimlessmtz hklout $ident_truncatemtz
Harry Powell Andrew Leslie and Owen Johnson
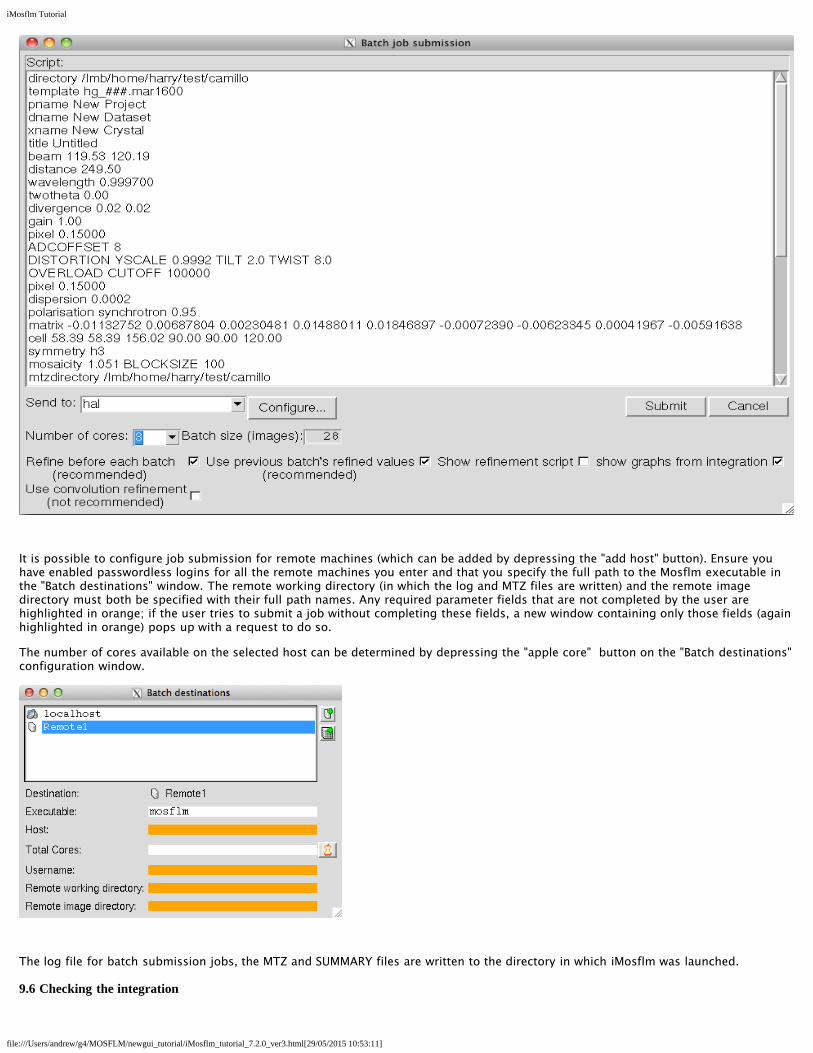
iMosflm Tutorial
fileUsersandrewg4MOSFLMnewgui_tutorialiMosflm_tutorial_720_ver3html[29052015 105311]
It is possible to configure job submission for remote machines (which can be added by depressing the add host button) Ensure youhave enabled passwordless logins for all the remote machines you enter and that you specify the full path to the Mosflm executable inthe Batch destinations window The remote working directory (in which the log and MTZ files are written) and the remote imagedirectory must both be specified with their full path names Any required parameter fields that are not completed by the user arehighlighted in orange if the user tries to submit a job without completing these fields a new window containing only those fields (againhighlighted in orange) pops up with a request to do so
The number of cores available on the selected host can be determined by depressing the apple core button on the Batch destinationsconfiguration window
The log file for batch submission jobs the MTZ and SUMMARY files are written to the directory in which iMosflm was launched
96 Checking the integration
iMosflm Tutorial
fileUsersandrewg4MOSFLMnewgui_tutorialiMosflm_tutorial_720_ver3html[29052015 105311]
The detector and crystal parameter plots should be examined carefully to check for any instability in the refinement If there are largeand random variations in some parameters (eg the detector twist and tilt) then it may be better to fix them and repeat the integration
For cases (eg very small unit cells) where there are very few suitable reflections on each image the refinement of the missetting anglesmay show significant variations from one image to the next In such cases it is best to apply smoothing to the missetting angles usingthe tick box in Settings -gt Processing options -gt Advanced Refinement
Discontinuities due to blank images should also show up and the offending images should be removed from the scaling run
If adjacent spots are incompletely resolved on the detector it may be possible to improve the processing by increasing the PROFILETOLERANCE parameters by 1-2 These parameters can be set in the Advanced integration tab of the Processing options menu (useSettings)
97 Advanced features for integration
The Settings -gt Processing options menu allows additional control over the integration Parameters such as the minimum spotseparation resolution limits excluded resolution ranges block size MTZ filename and BATCH ADD can be changed in the Processingtab
Manually decreasing the minimum spot separation can help if a large number of reflections are flagged as spatially overlapped (redboxes) The prediction must be updated to see the effect of changing the separation this can be done either by displaying the next orprevious image or double clicking on the blue circle next to the image currently displayed in the Images pane
In the Advanced integration tab the measurement box parameters profile tolerance and profile averaging parameters can be set
The measurement box parameters can be adjusted for rare cases where the estimation of the spot size has not worked correctlyresulting in a box that is too small or too large The optimisation of the background rim and corner cutoff parameters that determinewhich pixels are used for the background and which pixels for the peak can also be turned off but this is generally not recommended
Increasing the profile tolerance can help in cases where adjacent spots are not completely resolved this can be judged by examining thestandard profiles By default the profile tolerance is automatically increased if there are a large number of spatial overlaps as this hasthe effect of reducing the minimum spot separation A message will be written to the logfile if this has happened This option can beturned off using the tick box Optimise profile tolerance values to avoid spot overlap
The profile outlier exclusion parameters control the exclusion of ice spots or hot pixels which could otherwise corrupt the standardprofiles
Pixels with a value less than the Null pixel threshold are considered to belong to inactive regions of the detector
The pixel saturation value determines when a reflection is considered to be an overload The intensity of overloaded reflections isestimated by profile fitting but these reflections are rejected by the scaling program AIMLESS by default
Increasing the Maximum reflection width in φ from the default value of 5deg will reduce the number of rejected reflections (green boxes)and is worthwhile when the mosaicity is very high or the mosaic block size is very small As with the minimum spot separation theimage must be refreshed to see the effect of changing this parameter
The rejection criteria will reject reflections with too much variation in the background (BGRATIO) or where the gradient of thebackground plane is too large These should only be changed if many reflections are being rejected PKRATIO only applies to fullyrecorded reflections and reflects a very poor profile fit With current data collection protocols there will be very few (if any) fullyrecorded reflections
Additional MOSFLM parameters will be added based on user requests
98 Integrating multiple lattices
When multiple lattices have been successfully indexed each lattice can be integrated individually by selecting the appropriate latticenumber
Reflections in the chosen lattice that are overlapped by a reflection from another lattice will be integrated but the measurement box willbe expanded so that the total intensity of the two (or more) reflections is measured These reflections will be flagged for specialtreatment Reflections that are not overlapped are referred to as singletons They will be dealt with in the normal way by POINTLESSand AIMLESS
NOTE If more than one lattice has been indexed and the results of integrating just ONE of the lattices are to be checked byrunning QuickSymm or QuickScale then the multi-lattice icon in the Integration pane must be turned off otherwise an error
iMosflm Tutorial
fileUsersandrewg4MOSFLMnewgui_tutorialiMosflm_tutorial_720_ver3html[29052015 105311]
message will be given saying that all lattices must be integrated
It is often the case that by measuring both lattices (in separate integration runs) and inputting both MTZ files to QuickScale the overallcompleteness is high using ONLY the singletons To use this option ensure that the multi-lattice icon is off
To make use of the intensity estimates for overlapped reflections MTZ files for all lattices must be input to the program FECKLESSwhich will derive the best estimate of the summed intensity This is the default option if more than one lattice has been indexed and itrequires that all lattices have been integrated (in separate runs) prior to running QuickSymm or QuickScale (FECKLESS will be runautomatically)
At this time no downstream programs can make use of the summed intensities of overlapping reflections but in the future it should bepossible to use this data in REFMAC
Currently it is recommended to use only singletons from all the lattices FECKLESS is not required in this case
The MTZ filename is automatically updated to reflect which lattice has been chosen to avoid overwriting the MTZ file of the first latticewhen integrating the second one FECKLESS when run from iMosflm relies on this naming convention so do not change it
10 Running Pointless to check the symmetryOnce the images have been integrated (even a few degrees of data in many cases) the program POINTLESS can be run to determine thetrue Laue symmetry and try to determine the space group using the QuickSymm button
iMosflm Tutorial
fileUsersandrewg4MOSFLMnewgui_tutorialiMosflm_tutorial_720_ver3html[29052015 105311]
Select the QuickSymm button
A summary of the Pointless results as shown below will appear in a qtRView window
Various graphs (L test for twinning ViewHKL to view the reciprocal lattice) can also be viewed in this window
Various options for POINTLESS such as a reference MTZ file forcing the symmetry selected in iMosflm and specifying multiple input MTZfiles can be selected from the Settings -gt Processing options -gt Sort Scale and Merge tab (see below)
iMosflm Tutorial
fileUsersandrewg4MOSFLMnewgui_tutorialiMosflm_tutorial_720_ver3html[29052015 105311]
Caution The results can be ambiguous if run with a partial dataset Look in the logfile to see how many relfections are used totest each possible symmetry operator
11 Running Aimless to scale and merge the dataSelect the QuickScale button
This will first run POINTLESS then change the space group for the data to that selected by POINTLESS (unless the iMosflm symmetry isset to override POINTLESS) run AIMLESS to scale and merge the data in that space group and then run CTRUNCATE which calculates anumber of statistics from the intensity data The CCP4 UNIQUEIFY script will then be run which generates all the unique reflections forthat spacegroup to the resolution of the measured data and will flag reflections (5 by default but this can be changed) for use as theRfree set
AIMLESS can be run from the QuickScale button either treating anomalous data (the default) or ignoring anomalous data If onlyprocessing a few degrees of data it is usually better to ignore anomalous because especially for low symmetry cases no mergingstatistics may be given in AIMLESS
SCALA can be selected as an alternative to AIMLESS for scaling (not recommended)
There is limited control over running AIMLESS (see figure above) including re-setting resolution limits rejecting batches (images)changing the treatment for accepting partials changing the rejection criterion and changing the procedure for updating the standarddeviation estimates
iMosflm Tutorial
fileUsersandrewg4MOSFLMnewgui_tutorialiMosflm_tutorial_720_ver3html[29052015 105311]
The AIMLESS results will be displayed in the qtRView as shown below along with graphical output (see below) and the full log file canalso be examined
Aimless summary file
iMosflm Tutorial
fileUsersandrewg4MOSFLMnewgui_tutorialiMosflm_tutorial_720_ver3html[29052015 105311]
An example of the Aimless graphical output
The AIMLESS logfile can also be examined by selecting the Log File tab
12 History and mosflm log fileSelecting History allows the history of the session to be examined or by selecting the Log tab the full mosflmlp file can be viewed Themosflmlp file is also available in a time-stamped file mosflm_yyyymmdd_hhmmsslp (eg mosflm_20100518_131019lp) and can beread with a text editor
The History has a tree structure and will show when various parameters have been changed This has not been fully implemented and isnot generally useful
The logfile may provide useful clues when processing has failed
13 Warning MessagesAs already mentioned in Adding images sect3 and Integration sect9 warning messages are generated by MOSFLM during processing Atraffic light colour coding has now been assigned based on the warnings and is shown next to the Warnings box
A Red status implies a serious problem that will affect data quality and should be addressed
An Orange status implies minor issues that should be checked to see if things can be improved
A Green status means no significant problems messages are for information only
iMosflm Tutorial
fileUsersandrewg4MOSFLMnewgui_tutorialiMosflm_tutorial_720_ver3html[29052015 105311]
Abbreviated messages can be obtained by clicking on the Warnings icon The full warning Details together with Hints amp Notes text (ifany are available) can be obtained by double-clicking the relevant warning Details are displayed in a pop-up text box which willdisappear with the next click outside the box The same full details and suggestions are of course available in the mosflmlp files whereeven more information may be available
NOTE This is the end of the part of the tutorial which deals directly with iMosflm but see sect19 which has some suggestions forfurther work if you have time The remainder of this document deals with integrating and scaling data with MOSFLM andAimless via the CCP4i user interface examining the traditional mosflm SUMMARY file with the CCP4 utility loggraph
The Appendix contains a shell script for running MOSFLM as a traditional batch job
14 Useful command line optionsiMosflm has a number of command line options and these can be listed by typingimosflm --helpCurrent options are
--allimages -a ltfilenamegt Starts mosflm loading all files that match the template generated from ltfilenamegt--ccp4i2 Autosaves an iMosflm session file upon exit with an XML list of all iMosflm output files--debug -d Creates a large output file for debugging purposes Dont use this unless asked to by a developer--expert -e Permits access to advanced detector settings This should not normally be required--fastload -f Attempt to speed loading of many images offline while indexing two default images separated by 90 degrees--help -h Displays this message then exits--imagedir -I ltdirectorygt Starts the image browser in this directory if ltdirectorygt is given as an environment variable it will be expanded to its full value--init -i ltfilenamegt Starts Mosflm and reads from the given saved session file--startdir -S ltdirectorygt Starts mosflm in directory ltstartdirgt rather than the current directory This will only work if the directory exists and you have write permission to it otherwise iMosflm will exit All the normal mosflm output files will be in this directory--singleimage -s ltfilenamegt Starts mosflm loading only the image from ltfilenamegt--site -X ltfilenamegt Reads anyall of the following lines from the file given WAVELENGTH ltxgt DISPERSION ltxgt POLARISATION [PINHOLE | MIRRORS | MONOCHROMATOR | SYNCHROTRON ltxgt] DIVERGENCE ltxh xvgt BEAM ltbeamx beamygt DISTANCE ltxgt DISTORTION TILT ltxgt DISTORTION TWIST ltxgt GAIN ltxgt DETECTOR REVERSEPHI DETECTOR OMEGA ltxgt--version -v Displays the program version and required Mosflm version then exits
These can be abbreviated to the shortest unambiguous string
141 The site fileimosflm --site ltsitefilegt will read keywords from the file ltsitefilegt that will overwrite incorrect information in image headers Thissaves having to manually correct values in every iMosflm session The site file can also be read or written as an option from the Sessionmenu (see Drop down menus sect21) Allowed keywords areWAVELENGTH ltxgt
iMosflm Tutorial
fileUsersandrewg4MOSFLMnewgui_tutorialiMosflm_tutorial_720_ver3html[29052015 105311]
DISPERSION ltxgtPOLARISATION [PINHOLE | MIRRORS | MONO | SYNCHROTRON ltxgt]DIVERGENCE ltxh xvgtBEAM ltbeamx beamygtDISTANCE ltxgtDISTORTION TILT ltxgtDISTORTION TWIST ltxgtGAIN ltxgtDETECTOR REVERSEPHIDETECTOR OMEGA ltxgt
15 The mosflm SUMMARY fileMOSFLM produces a summary file listing refined parameters for each image and when using iMosflm this file will be date- amp time-stamped and have a name such as mosflm_20100518_131019sum This contains the same information as the plots produced by theiMOSFLM GUI which now also include the number of bad spots and overloads
This can be inspected graphically from the CCP4i GUI using the program loggraph Select the pull down menu View Files from Job andunder Output files select Additional log graphs where the _SUMMARYloggraph file will be listed Select this file to display its tablesin loggraph
This is very useful to identify rogue images (with unusually high positional residual or low Iσ(I)) If you find any read that image intoMOSFLM and see what is wrong with it
If you have done more than one integration run during your MOSFLM session you will find multiple entries of the tables Look at the lastset for integration of the 84 images
Click on the Refined detector parameter tables and check on the stability of parameters like the TILT and TWIST of the detector (unitsare hundredths of a degree) and for Mar Research (or DIP) image plate data the distortion parameters ROFF and TOFF (units are mm) Ifthey are varying a lot (more than 20 for TWISTTILT) or 015 for ROFFTOFF then it is probably a good idea to fix these parameters atthe average value (or the known values for this detector if they are available) (see Detector parameters sect821)
Click on the Post refinement table and check the missets It does not matter if they change slowly and by an amount (per image) that isless than 01mosaic spread If they are changing more than this then there could be a problem with processing the data (there is notmuch you can do about this)
Check how the mosaic spread is changing If it is unstable or if you think it is not refining to sensible values (as judged by looking atthe prediction) then you can fix the input value in the same way as the detector parameters (see Crystal parameters sect822)
BADSPOTS AND OVERLOADS
The program will set a rejection flag for those reflections that fail certain tests for example too much variation in the background levela poor profile fit an intensity that is very negative (more than 5 standard deviations) a very high gradient for the background planeThese reflections are called Bad spots and they are listed individually for each image in the mosflmlp file together with the reason forflagging them The number of bad spots is also written to the summary file Generally there should be very few (5-10) bad spots oneach image If there are more it could be because the backstop shadow is not correctly allowed for (consider using the NULLPIXkeyword)
There should also be very few overloaded reflections on each image If there are a lot then a separate low resolution data collectionpass should be made with a much shorter exposure time
IMPORTANT Both Bad spots and Overloads are written to the output MTZ file but will be rejected by default by AIMLESS Theintensity of overloaded reflections is estimated by profile fitting that part of the spot that is not saturated To include these reflections inthe final merged data use the ACCEPT keyword in AIMLESS
16 Scaling data with CCP4i ccp4i
Select Directories amp ProjectDir (top right)
In the new window select Add project
Enter the project name in the Project field and the full directory path in the uses directory field Default values may have been enteredalready here Select this project from Project for this session
Select Apply and Exit Dismiss the warning message that comes up
Select Data reduction from the pull down menu of modules (orange bar at top left)
iMosflm Tutorial
fileUsersandrewg4MOSFLMnewgui_tutorialiMosflm_tutorial_720_ver3html[29052015 105311]
Select Symmetry Scale Merge (Aimless)
In the window that appears do the following
Give a job title (top line)
Click on the box next to Separate anomalous pairs for outlier rejection amp merging statistics (the crystals have been soaked in a mercurycompound)
In the next orange bar (line starts HKLIN 1) select Browse and select the MTZ file output by MOSFLM (probably called hg_001mtz)Select OK
If you did not supply the Project name Crystal name or Dataset name to Mosflm fill in the boxes for these now
Under Scaling Protocol
From the pull-down menu on the line starting Scale select with automatic default settings
At the bottom of window from the pull-down menu named Run select RunampView Com File
This will display a new window showing the command file for running the POINTLESS step select Continue After a brief pause it willshow the command file for running AIMLESS (This can be edited before submitting the job) Select Continue
In the main window it will show that the AIMLESS job is running
When AIMLESS has finished the command file for running the CTRUNCATE step will appearselect Continue
When CTRUNCATE has run the main window will say FINISHED
At that point select the pull-down menu View Files from Job and select View Log Graphs This will give you the same graphs asrunning loggraph on the AIMLESS log file they are also the same as those that appeared in IMOSFLMs QuickScale task To look at thelog file itself (eg the overall merging statistics) select View Log File and it will appear in a new window
161 Looking at the AIMLESS output
The simplest way to look at the output from AIMLESS is to use loggraph on the AIMLESS log file (or via the CCP4i GUI) This can displaymany different graphs
Use Scales vs rotation range to check for smooth variation in the scale factor Check the variation in B factor with image and if there isno real variation it is best to turn off the B-factor refinement
Use the Analysis against all Batches for all runs to detect bad images (high R-factor large number of rejected spots)
Check the Analysis against resolution Fractional bias to see if there is any indication of Partial bias (A negative partial bias will resultif the mosaic spread is underestimated or if there is a lot of diffuse scatter
The Fractional bias should be less than 1-2 although it will often exceed this for weak data (eg in the high resolution bins)
The Axial reflections graphs in AIMLESS are useful for detecting systematic absences which can be used to identify the true spacegroup However the detection of screw axes is thought to be sufficiently robust in POINTLESS that these graphs are no longer necessary
It can also be useful to look at the AIMLESS log file itself in particular the table giving statistics as a function of resolution The effectiveresolution limit of the data can be estimated by looking at the Mn(I)sd column (this is the mean Iσ(I) AFTER merging symmetry matesand is the best indicator of data quality) This table also shows shell and cumulative R-factors
The Mn(I)sd values depend on having realistic values of the standard deviations (errors) in the intensities As the values that come fromMOSFLM are always underestimates of the true error these values are scaled up in AIMLESS using a three-term correction
sdcorrected = SdFac Sqrt[sd(I)2 + SdBLPI + (SdAddI)2]
Here SdFac is an overall scale factor and SdB and SdAdd are intensity dependent factors
AIMLESS will automatically work out a suitable value for all three parameters in order to make the mean value of (observedscatter)(sdestimate) equal to 10 where observed scatter is the difference between an individual estimate of intensity and the mean ofall other estimates (from symmetry mates)
Probably the best estimate of the true high resolution limit of the data can be obtained from the CC(12) values these are thecorrelations between equivalent observations that have been divided randomly into two half-datasets The resolution limit is foundwhen the CC drops below ~ 05 - 03
This table comes under the heading
ANALYSIS OF STANDARD DEVIATIONS
iMosflm Tutorial
fileUsersandrewg4MOSFLMnewgui_tutorialiMosflm_tutorial_720_ver3html[29052015 105311]
in the AIMLESS log file and Run n standard deviation v Intensity test (where n is 1 or more) in the CCP4i GUI View Files from Job -View Log Graphs display
Can you identify a bad image in this dataset Can you work out why it is bad
(Cluethe image headers contain quite a lot of information that is not used by MOSFLM including the date and time that the image wascollected)
You can exclude a given batch from the scaling using the EXCLUDE keyword
RUN ALL EXCLUDE imagenumber
In this case run number will be 1
Rerun the scaling SENDING THE OUTPUT TO A NEW LOGFILE excluding this image and see the effect on the heights in the anomalousPatterson (in the log file) DO NOT repeat the integration In the command file uncomment the line (near the top) goto aimless so itskips the integration part
In the CCP4i GUI click to highlight the AIMLESS job which is listed as FINISHED and select ldquoReRun Jobrdquo from the control buttons downthe right-hand side of the main interface window Under ldquoExcluded Datardquo in the window that appears check the box next to Excludeselected batches and pull-down on the menu button to exclude a range Give the start amp end range to exclude (eg 74 to 74) Rerunthe job as before
17 Changing the symmetryFrom the list of options at the left hand side of the main window select ldquoUtilitiesrdquo and under that SortModifyCombine MTZ Files
In the new window give a new title eg reindex as H32
Click on the Box Change space group andor reindex reflections
Use the browse option to select the input MTZ file (First orange bar) the output filename will be generated automatically (but you canchange it)
Under Reindex details
In the last option check the box next to ldquoChange space group tordquo and enter H32 in the box This is above the final item Reducereflections to the asymmetric unit which is checked by default
Select Run from the Run option button
Then go back to the scaling window and select the new MTZ file (reindexed) as the input for scaling (use Browse) CHANGE THE JOBTITLE
Then select RUN
The scaling will now be performed in space group H32 Look at the merging statistics in the log file in particular the multiplicityweighted R-factor called Rmeas in the log file
18 Looking at the CTRUNCATE outputThe CTRUNCATE program converts intensities to amplitudes and also compiles some useful statistics The LTEST and the cumulativeintensity statistics tabulated by CTRUNCATE (and plotted by loggraph) provide the only point at which you will be able to detectmerohedral twinning (when the two lattices of the twin components exactly overlap and every measured intensity is actually the sum oftwo intensities)
For a good dataset the observed distribution should be within 1 of the theoretical distribution Is this the case for this data
19 If you have time 191 Different mosaic spreads
Try repeating the processing with the mosaic spread set to a value 25 smaller than the refined one and fix it by checking the Fix boxin the Integration window in iMosflm
Can you tell from the merging statistics if this data is better
192 Checking up on outliers
iMosflm Tutorial
fileUsersandrewg4MOSFLMnewgui_tutorialiMosflm_tutorial_720_ver3html[29052015 105311]
AIMLESS writes a file called ROGUES which lists reflections which show very poor agreement between symmetry mates or which areimplausibly large
Look in this file (it is ASCII) and try to work out why this has happened The ROGUES file gives you the image (Batch) on which thereflections have been recorded (for partials this is the image nearest the centre of the reflection so you may need to look on thepreceding and following image as well) Select a reflection which shows very poor agreement with its symmetry mates (A value greaterthan 10 in the DelIsd column in the ROGUES file)
Select the offending image by double-clicking it in the Images pane of the iMosflm main window Predict the reflections then enter thehkl values into the boxes and hit Return (or click the red warning button following the entry box for l) to locate the offending reflectionin the image You must give the measured indices - the first set of values in the ROGUES file - when doing this See if there is anythingodd about the spot Remember to check adjacent images for partials
193 How accurate does the unit cell have to be
Try changing the cell parameters by (say) 10 and integrate the images again What is the effect on the merging statistics
20 Tips1 When reading images into a session DO NOT attempt to carry out any other task until ALL the images have been read2 It is often worth repeating the indexing (usually only once) as the refined direct beam coordinates from the first indexing may give
an improved solution when the indexing is repeated (lower rmsd)3 Always integrate a few degrees of data before integrating the whole dataset (see sect9) If the space group is not known in advance
run Quicksymm with a few degrees of data to check that the correct indexing solution has been chosen4 For difficult images do not attempt to refine the unit cell initially once an indexing solution has been obtained try integrating a
few images to ensure that the integration is stable If then going on to refine the cell check that the prediction looks OK for thefirst image of every segment included in the refinement If it does not look very good consider using the pattern matching(Settings -gt Processing options -gt Advanced refinement see sect84)
5 If the resolution of the data is less than 35 Aring do not use the ldquoRefine Cellrdquo task Instead use several images in indexing and use thecell that comes from the indexing
6 If iMosflm gets into a state where the activity icon(upper right) is spinning but nothing seems to be happening click on the activityicon to stop it spinning and see if the session can be continued DO NOT click on the activity icon simply to abort a task this willgive unpredictable results Use the Abort button for cell refinement or integration There is no defined way to abort indexing
7 Use the image summation option (see sect4) to get a better impression of the diffraction for very low exposure Pilatus images8 Use image summation for detector parameter refinement for fine sliced very weak Pilatus images (Settings -gt Processing options -
gt Advanced refinement see sect821)9 For large mosaic spread values (gt 10deg) or small mosaic block sizes (lt10) consider increasing the maximum allowed reflection
width to avoid having too many green predicted reflections (Settings -gt Processing options -gt Advanced integration see sect97)10 By default on selecting the Indexing task iMosflm will find spots index and (assuming a solution has been found) estimate the
mosaicity For difficult cases it is more useful to restrict this to simply finding spots and then do the indexing and mosaicityestimation by clicking the appropriate buttons To do this change the check box Automatically index after spot finding inSettings -gt Processing options -gt Indexing
11 See sect521 and sect522 for advice if the indexing fails Also consider the possibility of a reversed phi rotation direction if you arenot familiar with the beamline (Settings -gt Experiment settings -gt Experiment see sect21)
12 If the detector parameters have refined to physically unreasonable values (eg because cell refinement or integration has beencarried out using an incorrect indexing solution) be sure to reset the detector parameters before attempting further processing(Settings -gt Experiment settings -gt Detector see sect21)
13 Always set the resolution limit slightly beyond the point at which any spots are visible (see sect414 ) For very weak fine-sliceddata it can be very difficult to estimate the resolution visually so integrate to the maximum resolution (inscribed circle) and usethe merging results to set the final resolution There should be no problems integrating to a resolution ~03-05 Aring beyond theactual resolution limit but for example integrating to 3 Aring when the true resolution limit is 5-6 Aring may cause problems and theintegration should then be repeated with a more realistic resolution limit
14 Use the site file sect141 if repeatedly processing data where the direct beam position is wrong or if the phi direction is reversed etcto save having to correct this for every session
Appendix IA command script for running MOSFLM using the keywords copied from the Batch processing window of the new GUI (see Integratingas a background job sect952) Note that keyworded input for MOSFLM and other CCP4 programs is case-insensitive apart from file anddirectory names
bincsh -fv Set a unique identifier for filenames for this job
set ident = x89_mos07_blk3_smallsep
iMosflm Tutorial
fileUsersandrewg4MOSFLMnewgui_tutorialiMosflm_tutorial_720_ver3html[29052015 105311]
$ipmosflm COORDS $identcoords SUMMARY $identsummary ltlt eof-ip Insert keywords copied from iMosflm batch window here
Keywords for this run For example could involve trying different values for mosaic spread or not integrating all images etc etchklout $identmtzgenfile $identgenprocess 1 1000 goeof-ip
pointlesspointless hklin $identmtz hklout $ident_pointlessmtz
aimlessaimless hklin $ident_pointlessmtz hklout $ident_aimless_partmtz ROGUES $identrogues ltlt eof-aimless Use all default options for aimlesseof-aimless
ctruncate hklin $ident_aimlessmtz hklout $ident_truncatemtz
Harry Powell Andrew Leslie and Owen Johnson
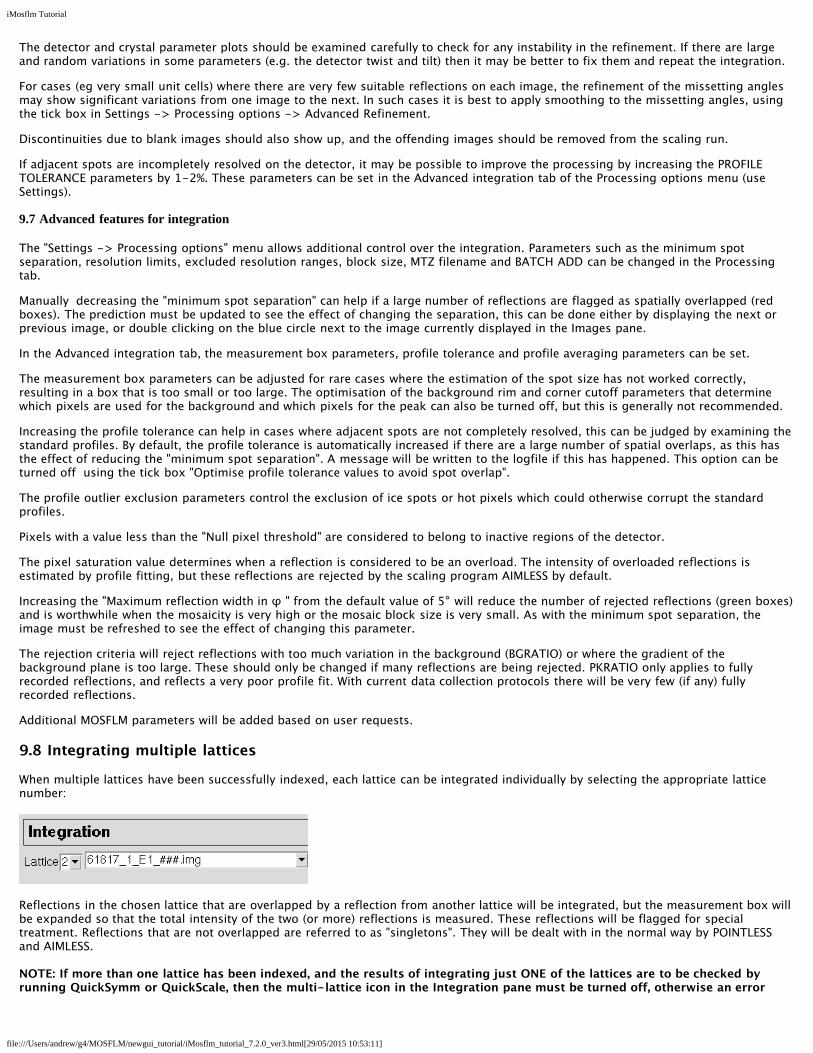
iMosflm Tutorial
fileUsersandrewg4MOSFLMnewgui_tutorialiMosflm_tutorial_720_ver3html[29052015 105311]
message will be given saying that all lattices must be integrated
It is often the case that by measuring both lattices (in separate integration runs) and inputting both MTZ files to QuickScale the overallcompleteness is high using ONLY the singletons To use this option ensure that the multi-lattice icon is off
To make use of the intensity estimates for overlapped reflections MTZ files for all lattices must be input to the program FECKLESSwhich will derive the best estimate of the summed intensity This is the default option if more than one lattice has been indexed and itrequires that all lattices have been integrated (in separate runs) prior to running QuickSymm or QuickScale (FECKLESS will be runautomatically)
At this time no downstream programs can make use of the summed intensities of overlapping reflections but in the future it should bepossible to use this data in REFMAC
Currently it is recommended to use only singletons from all the lattices FECKLESS is not required in this case
The MTZ filename is automatically updated to reflect which lattice has been chosen to avoid overwriting the MTZ file of the first latticewhen integrating the second one FECKLESS when run from iMosflm relies on this naming convention so do not change it
10 Running Pointless to check the symmetryOnce the images have been integrated (even a few degrees of data in many cases) the program POINTLESS can be run to determine thetrue Laue symmetry and try to determine the space group using the QuickSymm button
iMosflm Tutorial
fileUsersandrewg4MOSFLMnewgui_tutorialiMosflm_tutorial_720_ver3html[29052015 105311]
Select the QuickSymm button
A summary of the Pointless results as shown below will appear in a qtRView window
Various graphs (L test for twinning ViewHKL to view the reciprocal lattice) can also be viewed in this window
Various options for POINTLESS such as a reference MTZ file forcing the symmetry selected in iMosflm and specifying multiple input MTZfiles can be selected from the Settings -gt Processing options -gt Sort Scale and Merge tab (see below)
iMosflm Tutorial
fileUsersandrewg4MOSFLMnewgui_tutorialiMosflm_tutorial_720_ver3html[29052015 105311]
Caution The results can be ambiguous if run with a partial dataset Look in the logfile to see how many relfections are used totest each possible symmetry operator
11 Running Aimless to scale and merge the dataSelect the QuickScale button
This will first run POINTLESS then change the space group for the data to that selected by POINTLESS (unless the iMosflm symmetry isset to override POINTLESS) run AIMLESS to scale and merge the data in that space group and then run CTRUNCATE which calculates anumber of statistics from the intensity data The CCP4 UNIQUEIFY script will then be run which generates all the unique reflections forthat spacegroup to the resolution of the measured data and will flag reflections (5 by default but this can be changed) for use as theRfree set
AIMLESS can be run from the QuickScale button either treating anomalous data (the default) or ignoring anomalous data If onlyprocessing a few degrees of data it is usually better to ignore anomalous because especially for low symmetry cases no mergingstatistics may be given in AIMLESS
SCALA can be selected as an alternative to AIMLESS for scaling (not recommended)
There is limited control over running AIMLESS (see figure above) including re-setting resolution limits rejecting batches (images)changing the treatment for accepting partials changing the rejection criterion and changing the procedure for updating the standarddeviation estimates
iMosflm Tutorial
fileUsersandrewg4MOSFLMnewgui_tutorialiMosflm_tutorial_720_ver3html[29052015 105311]
The AIMLESS results will be displayed in the qtRView as shown below along with graphical output (see below) and the full log file canalso be examined
Aimless summary file
iMosflm Tutorial
fileUsersandrewg4MOSFLMnewgui_tutorialiMosflm_tutorial_720_ver3html[29052015 105311]
An example of the Aimless graphical output
The AIMLESS logfile can also be examined by selecting the Log File tab
12 History and mosflm log fileSelecting History allows the history of the session to be examined or by selecting the Log tab the full mosflmlp file can be viewed Themosflmlp file is also available in a time-stamped file mosflm_yyyymmdd_hhmmsslp (eg mosflm_20100518_131019lp) and can beread with a text editor
The History has a tree structure and will show when various parameters have been changed This has not been fully implemented and isnot generally useful
The logfile may provide useful clues when processing has failed
13 Warning MessagesAs already mentioned in Adding images sect3 and Integration sect9 warning messages are generated by MOSFLM during processing Atraffic light colour coding has now been assigned based on the warnings and is shown next to the Warnings box
A Red status implies a serious problem that will affect data quality and should be addressed
An Orange status implies minor issues that should be checked to see if things can be improved
A Green status means no significant problems messages are for information only
iMosflm Tutorial
fileUsersandrewg4MOSFLMnewgui_tutorialiMosflm_tutorial_720_ver3html[29052015 105311]
Abbreviated messages can be obtained by clicking on the Warnings icon The full warning Details together with Hints amp Notes text (ifany are available) can be obtained by double-clicking the relevant warning Details are displayed in a pop-up text box which willdisappear with the next click outside the box The same full details and suggestions are of course available in the mosflmlp files whereeven more information may be available
NOTE This is the end of the part of the tutorial which deals directly with iMosflm but see sect19 which has some suggestions forfurther work if you have time The remainder of this document deals with integrating and scaling data with MOSFLM andAimless via the CCP4i user interface examining the traditional mosflm SUMMARY file with the CCP4 utility loggraph
The Appendix contains a shell script for running MOSFLM as a traditional batch job
14 Useful command line optionsiMosflm has a number of command line options and these can be listed by typingimosflm --helpCurrent options are
--allimages -a ltfilenamegt Starts mosflm loading all files that match the template generated from ltfilenamegt--ccp4i2 Autosaves an iMosflm session file upon exit with an XML list of all iMosflm output files--debug -d Creates a large output file for debugging purposes Dont use this unless asked to by a developer--expert -e Permits access to advanced detector settings This should not normally be required--fastload -f Attempt to speed loading of many images offline while indexing two default images separated by 90 degrees--help -h Displays this message then exits--imagedir -I ltdirectorygt Starts the image browser in this directory if ltdirectorygt is given as an environment variable it will be expanded to its full value--init -i ltfilenamegt Starts Mosflm and reads from the given saved session file--startdir -S ltdirectorygt Starts mosflm in directory ltstartdirgt rather than the current directory This will only work if the directory exists and you have write permission to it otherwise iMosflm will exit All the normal mosflm output files will be in this directory--singleimage -s ltfilenamegt Starts mosflm loading only the image from ltfilenamegt--site -X ltfilenamegt Reads anyall of the following lines from the file given WAVELENGTH ltxgt DISPERSION ltxgt POLARISATION [PINHOLE | MIRRORS | MONOCHROMATOR | SYNCHROTRON ltxgt] DIVERGENCE ltxh xvgt BEAM ltbeamx beamygt DISTANCE ltxgt DISTORTION TILT ltxgt DISTORTION TWIST ltxgt GAIN ltxgt DETECTOR REVERSEPHI DETECTOR OMEGA ltxgt--version -v Displays the program version and required Mosflm version then exits
These can be abbreviated to the shortest unambiguous string
141 The site fileimosflm --site ltsitefilegt will read keywords from the file ltsitefilegt that will overwrite incorrect information in image headers Thissaves having to manually correct values in every iMosflm session The site file can also be read or written as an option from the Sessionmenu (see Drop down menus sect21) Allowed keywords areWAVELENGTH ltxgt
iMosflm Tutorial
fileUsersandrewg4MOSFLMnewgui_tutorialiMosflm_tutorial_720_ver3html[29052015 105311]
DISPERSION ltxgtPOLARISATION [PINHOLE | MIRRORS | MONO | SYNCHROTRON ltxgt]DIVERGENCE ltxh xvgtBEAM ltbeamx beamygtDISTANCE ltxgtDISTORTION TILT ltxgtDISTORTION TWIST ltxgtGAIN ltxgtDETECTOR REVERSEPHIDETECTOR OMEGA ltxgt
15 The mosflm SUMMARY fileMOSFLM produces a summary file listing refined parameters for each image and when using iMosflm this file will be date- amp time-stamped and have a name such as mosflm_20100518_131019sum This contains the same information as the plots produced by theiMOSFLM GUI which now also include the number of bad spots and overloads
This can be inspected graphically from the CCP4i GUI using the program loggraph Select the pull down menu View Files from Job andunder Output files select Additional log graphs where the _SUMMARYloggraph file will be listed Select this file to display its tablesin loggraph
This is very useful to identify rogue images (with unusually high positional residual or low Iσ(I)) If you find any read that image intoMOSFLM and see what is wrong with it
If you have done more than one integration run during your MOSFLM session you will find multiple entries of the tables Look at the lastset for integration of the 84 images
Click on the Refined detector parameter tables and check on the stability of parameters like the TILT and TWIST of the detector (unitsare hundredths of a degree) and for Mar Research (or DIP) image plate data the distortion parameters ROFF and TOFF (units are mm) Ifthey are varying a lot (more than 20 for TWISTTILT) or 015 for ROFFTOFF then it is probably a good idea to fix these parameters atthe average value (or the known values for this detector if they are available) (see Detector parameters sect821)
Click on the Post refinement table and check the missets It does not matter if they change slowly and by an amount (per image) that isless than 01mosaic spread If they are changing more than this then there could be a problem with processing the data (there is notmuch you can do about this)
Check how the mosaic spread is changing If it is unstable or if you think it is not refining to sensible values (as judged by looking atthe prediction) then you can fix the input value in the same way as the detector parameters (see Crystal parameters sect822)
BADSPOTS AND OVERLOADS
The program will set a rejection flag for those reflections that fail certain tests for example too much variation in the background levela poor profile fit an intensity that is very negative (more than 5 standard deviations) a very high gradient for the background planeThese reflections are called Bad spots and they are listed individually for each image in the mosflmlp file together with the reason forflagging them The number of bad spots is also written to the summary file Generally there should be very few (5-10) bad spots oneach image If there are more it could be because the backstop shadow is not correctly allowed for (consider using the NULLPIXkeyword)
There should also be very few overloaded reflections on each image If there are a lot then a separate low resolution data collectionpass should be made with a much shorter exposure time
IMPORTANT Both Bad spots and Overloads are written to the output MTZ file but will be rejected by default by AIMLESS Theintensity of overloaded reflections is estimated by profile fitting that part of the spot that is not saturated To include these reflections inthe final merged data use the ACCEPT keyword in AIMLESS
16 Scaling data with CCP4i ccp4i
Select Directories amp ProjectDir (top right)
In the new window select Add project
Enter the project name in the Project field and the full directory path in the uses directory field Default values may have been enteredalready here Select this project from Project for this session
Select Apply and Exit Dismiss the warning message that comes up
Select Data reduction from the pull down menu of modules (orange bar at top left)
iMosflm Tutorial
fileUsersandrewg4MOSFLMnewgui_tutorialiMosflm_tutorial_720_ver3html[29052015 105311]
Select Symmetry Scale Merge (Aimless)
In the window that appears do the following
Give a job title (top line)
Click on the box next to Separate anomalous pairs for outlier rejection amp merging statistics (the crystals have been soaked in a mercurycompound)
In the next orange bar (line starts HKLIN 1) select Browse and select the MTZ file output by MOSFLM (probably called hg_001mtz)Select OK
If you did not supply the Project name Crystal name or Dataset name to Mosflm fill in the boxes for these now
Under Scaling Protocol
From the pull-down menu on the line starting Scale select with automatic default settings
At the bottom of window from the pull-down menu named Run select RunampView Com File
This will display a new window showing the command file for running the POINTLESS step select Continue After a brief pause it willshow the command file for running AIMLESS (This can be edited before submitting the job) Select Continue
In the main window it will show that the AIMLESS job is running
When AIMLESS has finished the command file for running the CTRUNCATE step will appearselect Continue
When CTRUNCATE has run the main window will say FINISHED
At that point select the pull-down menu View Files from Job and select View Log Graphs This will give you the same graphs asrunning loggraph on the AIMLESS log file they are also the same as those that appeared in IMOSFLMs QuickScale task To look at thelog file itself (eg the overall merging statistics) select View Log File and it will appear in a new window
161 Looking at the AIMLESS output
The simplest way to look at the output from AIMLESS is to use loggraph on the AIMLESS log file (or via the CCP4i GUI) This can displaymany different graphs
Use Scales vs rotation range to check for smooth variation in the scale factor Check the variation in B factor with image and if there isno real variation it is best to turn off the B-factor refinement
Use the Analysis against all Batches for all runs to detect bad images (high R-factor large number of rejected spots)
Check the Analysis against resolution Fractional bias to see if there is any indication of Partial bias (A negative partial bias will resultif the mosaic spread is underestimated or if there is a lot of diffuse scatter
The Fractional bias should be less than 1-2 although it will often exceed this for weak data (eg in the high resolution bins)
The Axial reflections graphs in AIMLESS are useful for detecting systematic absences which can be used to identify the true spacegroup However the detection of screw axes is thought to be sufficiently robust in POINTLESS that these graphs are no longer necessary
It can also be useful to look at the AIMLESS log file itself in particular the table giving statistics as a function of resolution The effectiveresolution limit of the data can be estimated by looking at the Mn(I)sd column (this is the mean Iσ(I) AFTER merging symmetry matesand is the best indicator of data quality) This table also shows shell and cumulative R-factors
The Mn(I)sd values depend on having realistic values of the standard deviations (errors) in the intensities As the values that come fromMOSFLM are always underestimates of the true error these values are scaled up in AIMLESS using a three-term correction
sdcorrected = SdFac Sqrt[sd(I)2 + SdBLPI + (SdAddI)2]
Here SdFac is an overall scale factor and SdB and SdAdd are intensity dependent factors
AIMLESS will automatically work out a suitable value for all three parameters in order to make the mean value of (observedscatter)(sdestimate) equal to 10 where observed scatter is the difference between an individual estimate of intensity and the mean ofall other estimates (from symmetry mates)
Probably the best estimate of the true high resolution limit of the data can be obtained from the CC(12) values these are thecorrelations between equivalent observations that have been divided randomly into two half-datasets The resolution limit is foundwhen the CC drops below ~ 05 - 03
This table comes under the heading
ANALYSIS OF STANDARD DEVIATIONS
iMosflm Tutorial
fileUsersandrewg4MOSFLMnewgui_tutorialiMosflm_tutorial_720_ver3html[29052015 105311]
in the AIMLESS log file and Run n standard deviation v Intensity test (where n is 1 or more) in the CCP4i GUI View Files from Job -View Log Graphs display
Can you identify a bad image in this dataset Can you work out why it is bad
(Cluethe image headers contain quite a lot of information that is not used by MOSFLM including the date and time that the image wascollected)
You can exclude a given batch from the scaling using the EXCLUDE keyword
RUN ALL EXCLUDE imagenumber
In this case run number will be 1
Rerun the scaling SENDING THE OUTPUT TO A NEW LOGFILE excluding this image and see the effect on the heights in the anomalousPatterson (in the log file) DO NOT repeat the integration In the command file uncomment the line (near the top) goto aimless so itskips the integration part
In the CCP4i GUI click to highlight the AIMLESS job which is listed as FINISHED and select ldquoReRun Jobrdquo from the control buttons downthe right-hand side of the main interface window Under ldquoExcluded Datardquo in the window that appears check the box next to Excludeselected batches and pull-down on the menu button to exclude a range Give the start amp end range to exclude (eg 74 to 74) Rerunthe job as before
17 Changing the symmetryFrom the list of options at the left hand side of the main window select ldquoUtilitiesrdquo and under that SortModifyCombine MTZ Files
In the new window give a new title eg reindex as H32
Click on the Box Change space group andor reindex reflections
Use the browse option to select the input MTZ file (First orange bar) the output filename will be generated automatically (but you canchange it)
Under Reindex details
In the last option check the box next to ldquoChange space group tordquo and enter H32 in the box This is above the final item Reducereflections to the asymmetric unit which is checked by default
Select Run from the Run option button
Then go back to the scaling window and select the new MTZ file (reindexed) as the input for scaling (use Browse) CHANGE THE JOBTITLE
Then select RUN
The scaling will now be performed in space group H32 Look at the merging statistics in the log file in particular the multiplicityweighted R-factor called Rmeas in the log file
18 Looking at the CTRUNCATE outputThe CTRUNCATE program converts intensities to amplitudes and also compiles some useful statistics The LTEST and the cumulativeintensity statistics tabulated by CTRUNCATE (and plotted by loggraph) provide the only point at which you will be able to detectmerohedral twinning (when the two lattices of the twin components exactly overlap and every measured intensity is actually the sum oftwo intensities)
For a good dataset the observed distribution should be within 1 of the theoretical distribution Is this the case for this data
19 If you have time 191 Different mosaic spreads
Try repeating the processing with the mosaic spread set to a value 25 smaller than the refined one and fix it by checking the Fix boxin the Integration window in iMosflm
Can you tell from the merging statistics if this data is better
192 Checking up on outliers
iMosflm Tutorial
fileUsersandrewg4MOSFLMnewgui_tutorialiMosflm_tutorial_720_ver3html[29052015 105311]
AIMLESS writes a file called ROGUES which lists reflections which show very poor agreement between symmetry mates or which areimplausibly large
Look in this file (it is ASCII) and try to work out why this has happened The ROGUES file gives you the image (Batch) on which thereflections have been recorded (for partials this is the image nearest the centre of the reflection so you may need to look on thepreceding and following image as well) Select a reflection which shows very poor agreement with its symmetry mates (A value greaterthan 10 in the DelIsd column in the ROGUES file)
Select the offending image by double-clicking it in the Images pane of the iMosflm main window Predict the reflections then enter thehkl values into the boxes and hit Return (or click the red warning button following the entry box for l) to locate the offending reflectionin the image You must give the measured indices - the first set of values in the ROGUES file - when doing this See if there is anythingodd about the spot Remember to check adjacent images for partials
193 How accurate does the unit cell have to be
Try changing the cell parameters by (say) 10 and integrate the images again What is the effect on the merging statistics
20 Tips1 When reading images into a session DO NOT attempt to carry out any other task until ALL the images have been read2 It is often worth repeating the indexing (usually only once) as the refined direct beam coordinates from the first indexing may give
an improved solution when the indexing is repeated (lower rmsd)3 Always integrate a few degrees of data before integrating the whole dataset (see sect9) If the space group is not known in advance
run Quicksymm with a few degrees of data to check that the correct indexing solution has been chosen4 For difficult images do not attempt to refine the unit cell initially once an indexing solution has been obtained try integrating a
few images to ensure that the integration is stable If then going on to refine the cell check that the prediction looks OK for thefirst image of every segment included in the refinement If it does not look very good consider using the pattern matching(Settings -gt Processing options -gt Advanced refinement see sect84)
5 If the resolution of the data is less than 35 Aring do not use the ldquoRefine Cellrdquo task Instead use several images in indexing and use thecell that comes from the indexing
6 If iMosflm gets into a state where the activity icon(upper right) is spinning but nothing seems to be happening click on the activityicon to stop it spinning and see if the session can be continued DO NOT click on the activity icon simply to abort a task this willgive unpredictable results Use the Abort button for cell refinement or integration There is no defined way to abort indexing
7 Use the image summation option (see sect4) to get a better impression of the diffraction for very low exposure Pilatus images8 Use image summation for detector parameter refinement for fine sliced very weak Pilatus images (Settings -gt Processing options -
gt Advanced refinement see sect821)9 For large mosaic spread values (gt 10deg) or small mosaic block sizes (lt10) consider increasing the maximum allowed reflection
width to avoid having too many green predicted reflections (Settings -gt Processing options -gt Advanced integration see sect97)10 By default on selecting the Indexing task iMosflm will find spots index and (assuming a solution has been found) estimate the
mosaicity For difficult cases it is more useful to restrict this to simply finding spots and then do the indexing and mosaicityestimation by clicking the appropriate buttons To do this change the check box Automatically index after spot finding inSettings -gt Processing options -gt Indexing
11 See sect521 and sect522 for advice if the indexing fails Also consider the possibility of a reversed phi rotation direction if you arenot familiar with the beamline (Settings -gt Experiment settings -gt Experiment see sect21)
12 If the detector parameters have refined to physically unreasonable values (eg because cell refinement or integration has beencarried out using an incorrect indexing solution) be sure to reset the detector parameters before attempting further processing(Settings -gt Experiment settings -gt Detector see sect21)
13 Always set the resolution limit slightly beyond the point at which any spots are visible (see sect414 ) For very weak fine-sliceddata it can be very difficult to estimate the resolution visually so integrate to the maximum resolution (inscribed circle) and usethe merging results to set the final resolution There should be no problems integrating to a resolution ~03-05 Aring beyond theactual resolution limit but for example integrating to 3 Aring when the true resolution limit is 5-6 Aring may cause problems and theintegration should then be repeated with a more realistic resolution limit
14 Use the site file sect141 if repeatedly processing data where the direct beam position is wrong or if the phi direction is reversed etcto save having to correct this for every session
Appendix IA command script for running MOSFLM using the keywords copied from the Batch processing window of the new GUI (see Integratingas a background job sect952) Note that keyworded input for MOSFLM and other CCP4 programs is case-insensitive apart from file anddirectory names
bincsh -fv Set a unique identifier for filenames for this job
set ident = x89_mos07_blk3_smallsep
iMosflm Tutorial
fileUsersandrewg4MOSFLMnewgui_tutorialiMosflm_tutorial_720_ver3html[29052015 105311]
$ipmosflm COORDS $identcoords SUMMARY $identsummary ltlt eof-ip Insert keywords copied from iMosflm batch window here
Keywords for this run For example could involve trying different values for mosaic spread or not integrating all images etc etchklout $identmtzgenfile $identgenprocess 1 1000 goeof-ip
pointlesspointless hklin $identmtz hklout $ident_pointlessmtz
aimlessaimless hklin $ident_pointlessmtz hklout $ident_aimless_partmtz ROGUES $identrogues ltlt eof-aimless Use all default options for aimlesseof-aimless
ctruncate hklin $ident_aimlessmtz hklout $ident_truncatemtz
Harry Powell Andrew Leslie and Owen Johnson
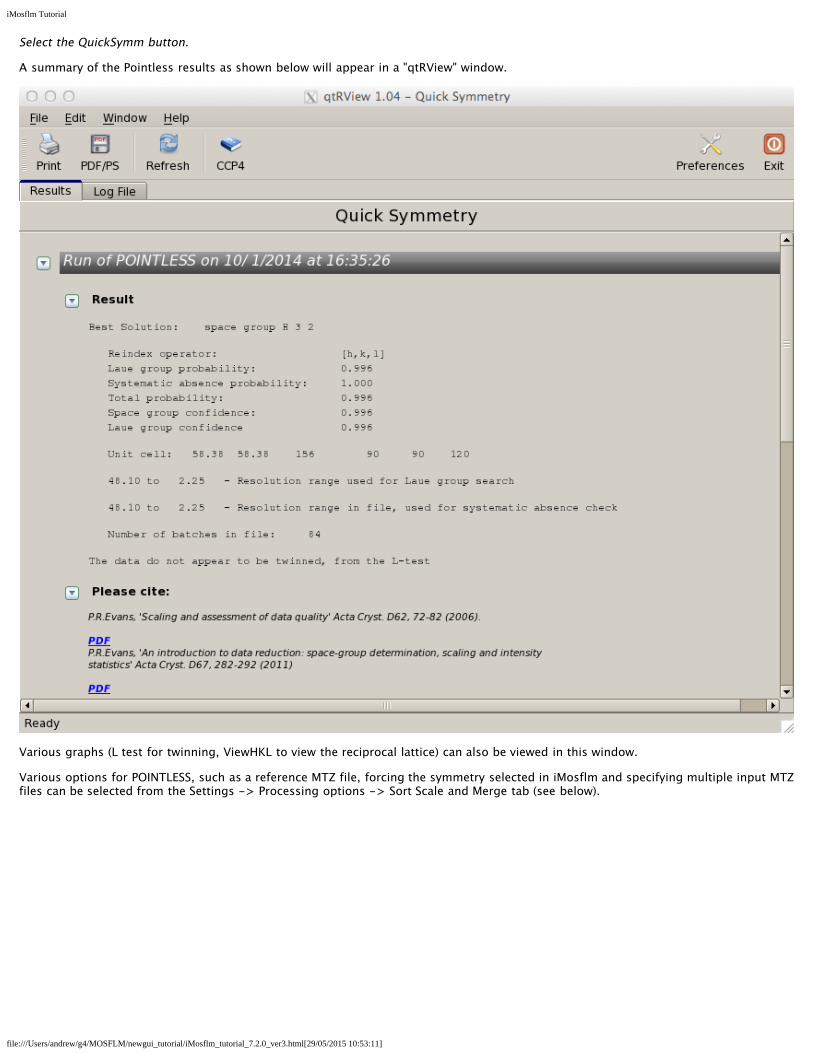
iMosflm Tutorial
fileUsersandrewg4MOSFLMnewgui_tutorialiMosflm_tutorial_720_ver3html[29052015 105311]
Caution The results can be ambiguous if run with a partial dataset Look in the logfile to see how many relfections are used totest each possible symmetry operator
11 Running Aimless to scale and merge the dataSelect the QuickScale button
This will first run POINTLESS then change the space group for the data to that selected by POINTLESS (unless the iMosflm symmetry isset to override POINTLESS) run AIMLESS to scale and merge the data in that space group and then run CTRUNCATE which calculates anumber of statistics from the intensity data The CCP4 UNIQUEIFY script will then be run which generates all the unique reflections forthat spacegroup to the resolution of the measured data and will flag reflections (5 by default but this can be changed) for use as theRfree set
AIMLESS can be run from the QuickScale button either treating anomalous data (the default) or ignoring anomalous data If onlyprocessing a few degrees of data it is usually better to ignore anomalous because especially for low symmetry cases no mergingstatistics may be given in AIMLESS
SCALA can be selected as an alternative to AIMLESS for scaling (not recommended)
There is limited control over running AIMLESS (see figure above) including re-setting resolution limits rejecting batches (images)changing the treatment for accepting partials changing the rejection criterion and changing the procedure for updating the standarddeviation estimates
iMosflm Tutorial
fileUsersandrewg4MOSFLMnewgui_tutorialiMosflm_tutorial_720_ver3html[29052015 105311]
The AIMLESS results will be displayed in the qtRView as shown below along with graphical output (see below) and the full log file canalso be examined
Aimless summary file
iMosflm Tutorial
fileUsersandrewg4MOSFLMnewgui_tutorialiMosflm_tutorial_720_ver3html[29052015 105311]
An example of the Aimless graphical output
The AIMLESS logfile can also be examined by selecting the Log File tab
12 History and mosflm log fileSelecting History allows the history of the session to be examined or by selecting the Log tab the full mosflmlp file can be viewed Themosflmlp file is also available in a time-stamped file mosflm_yyyymmdd_hhmmsslp (eg mosflm_20100518_131019lp) and can beread with a text editor
The History has a tree structure and will show when various parameters have been changed This has not been fully implemented and isnot generally useful
The logfile may provide useful clues when processing has failed
13 Warning MessagesAs already mentioned in Adding images sect3 and Integration sect9 warning messages are generated by MOSFLM during processing Atraffic light colour coding has now been assigned based on the warnings and is shown next to the Warnings box
A Red status implies a serious problem that will affect data quality and should be addressed
An Orange status implies minor issues that should be checked to see if things can be improved
A Green status means no significant problems messages are for information only
iMosflm Tutorial
fileUsersandrewg4MOSFLMnewgui_tutorialiMosflm_tutorial_720_ver3html[29052015 105311]
Abbreviated messages can be obtained by clicking on the Warnings icon The full warning Details together with Hints amp Notes text (ifany are available) can be obtained by double-clicking the relevant warning Details are displayed in a pop-up text box which willdisappear with the next click outside the box The same full details and suggestions are of course available in the mosflmlp files whereeven more information may be available
NOTE This is the end of the part of the tutorial which deals directly with iMosflm but see sect19 which has some suggestions forfurther work if you have time The remainder of this document deals with integrating and scaling data with MOSFLM andAimless via the CCP4i user interface examining the traditional mosflm SUMMARY file with the CCP4 utility loggraph
The Appendix contains a shell script for running MOSFLM as a traditional batch job
14 Useful command line optionsiMosflm has a number of command line options and these can be listed by typingimosflm --helpCurrent options are
--allimages -a ltfilenamegt Starts mosflm loading all files that match the template generated from ltfilenamegt--ccp4i2 Autosaves an iMosflm session file upon exit with an XML list of all iMosflm output files--debug -d Creates a large output file for debugging purposes Dont use this unless asked to by a developer--expert -e Permits access to advanced detector settings This should not normally be required--fastload -f Attempt to speed loading of many images offline while indexing two default images separated by 90 degrees--help -h Displays this message then exits--imagedir -I ltdirectorygt Starts the image browser in this directory if ltdirectorygt is given as an environment variable it will be expanded to its full value--init -i ltfilenamegt Starts Mosflm and reads from the given saved session file--startdir -S ltdirectorygt Starts mosflm in directory ltstartdirgt rather than the current directory This will only work if the directory exists and you have write permission to it otherwise iMosflm will exit All the normal mosflm output files will be in this directory--singleimage -s ltfilenamegt Starts mosflm loading only the image from ltfilenamegt--site -X ltfilenamegt Reads anyall of the following lines from the file given WAVELENGTH ltxgt DISPERSION ltxgt POLARISATION [PINHOLE | MIRRORS | MONOCHROMATOR | SYNCHROTRON ltxgt] DIVERGENCE ltxh xvgt BEAM ltbeamx beamygt DISTANCE ltxgt DISTORTION TILT ltxgt DISTORTION TWIST ltxgt GAIN ltxgt DETECTOR REVERSEPHI DETECTOR OMEGA ltxgt--version -v Displays the program version and required Mosflm version then exits
These can be abbreviated to the shortest unambiguous string
141 The site fileimosflm --site ltsitefilegt will read keywords from the file ltsitefilegt that will overwrite incorrect information in image headers Thissaves having to manually correct values in every iMosflm session The site file can also be read or written as an option from the Sessionmenu (see Drop down menus sect21) Allowed keywords areWAVELENGTH ltxgt
iMosflm Tutorial
fileUsersandrewg4MOSFLMnewgui_tutorialiMosflm_tutorial_720_ver3html[29052015 105311]
DISPERSION ltxgtPOLARISATION [PINHOLE | MIRRORS | MONO | SYNCHROTRON ltxgt]DIVERGENCE ltxh xvgtBEAM ltbeamx beamygtDISTANCE ltxgtDISTORTION TILT ltxgtDISTORTION TWIST ltxgtGAIN ltxgtDETECTOR REVERSEPHIDETECTOR OMEGA ltxgt
15 The mosflm SUMMARY fileMOSFLM produces a summary file listing refined parameters for each image and when using iMosflm this file will be date- amp time-stamped and have a name such as mosflm_20100518_131019sum This contains the same information as the plots produced by theiMOSFLM GUI which now also include the number of bad spots and overloads
This can be inspected graphically from the CCP4i GUI using the program loggraph Select the pull down menu View Files from Job andunder Output files select Additional log graphs where the _SUMMARYloggraph file will be listed Select this file to display its tablesin loggraph
This is very useful to identify rogue images (with unusually high positional residual or low Iσ(I)) If you find any read that image intoMOSFLM and see what is wrong with it
If you have done more than one integration run during your MOSFLM session you will find multiple entries of the tables Look at the lastset for integration of the 84 images
Click on the Refined detector parameter tables and check on the stability of parameters like the TILT and TWIST of the detector (unitsare hundredths of a degree) and for Mar Research (or DIP) image plate data the distortion parameters ROFF and TOFF (units are mm) Ifthey are varying a lot (more than 20 for TWISTTILT) or 015 for ROFFTOFF then it is probably a good idea to fix these parameters atthe average value (or the known values for this detector if they are available) (see Detector parameters sect821)
Click on the Post refinement table and check the missets It does not matter if they change slowly and by an amount (per image) that isless than 01mosaic spread If they are changing more than this then there could be a problem with processing the data (there is notmuch you can do about this)
Check how the mosaic spread is changing If it is unstable or if you think it is not refining to sensible values (as judged by looking atthe prediction) then you can fix the input value in the same way as the detector parameters (see Crystal parameters sect822)
BADSPOTS AND OVERLOADS
The program will set a rejection flag for those reflections that fail certain tests for example too much variation in the background levela poor profile fit an intensity that is very negative (more than 5 standard deviations) a very high gradient for the background planeThese reflections are called Bad spots and they are listed individually for each image in the mosflmlp file together with the reason forflagging them The number of bad spots is also written to the summary file Generally there should be very few (5-10) bad spots oneach image If there are more it could be because the backstop shadow is not correctly allowed for (consider using the NULLPIXkeyword)
There should also be very few overloaded reflections on each image If there are a lot then a separate low resolution data collectionpass should be made with a much shorter exposure time
IMPORTANT Both Bad spots and Overloads are written to the output MTZ file but will be rejected by default by AIMLESS Theintensity of overloaded reflections is estimated by profile fitting that part of the spot that is not saturated To include these reflections inthe final merged data use the ACCEPT keyword in AIMLESS
16 Scaling data with CCP4i ccp4i
Select Directories amp ProjectDir (top right)
In the new window select Add project
Enter the project name in the Project field and the full directory path in the uses directory field Default values may have been enteredalready here Select this project from Project for this session
Select Apply and Exit Dismiss the warning message that comes up
Select Data reduction from the pull down menu of modules (orange bar at top left)
iMosflm Tutorial
fileUsersandrewg4MOSFLMnewgui_tutorialiMosflm_tutorial_720_ver3html[29052015 105311]
Select Symmetry Scale Merge (Aimless)
In the window that appears do the following
Give a job title (top line)
Click on the box next to Separate anomalous pairs for outlier rejection amp merging statistics (the crystals have been soaked in a mercurycompound)
In the next orange bar (line starts HKLIN 1) select Browse and select the MTZ file output by MOSFLM (probably called hg_001mtz)Select OK
If you did not supply the Project name Crystal name or Dataset name to Mosflm fill in the boxes for these now
Under Scaling Protocol
From the pull-down menu on the line starting Scale select with automatic default settings
At the bottom of window from the pull-down menu named Run select RunampView Com File
This will display a new window showing the command file for running the POINTLESS step select Continue After a brief pause it willshow the command file for running AIMLESS (This can be edited before submitting the job) Select Continue
In the main window it will show that the AIMLESS job is running
When AIMLESS has finished the command file for running the CTRUNCATE step will appearselect Continue
When CTRUNCATE has run the main window will say FINISHED
At that point select the pull-down menu View Files from Job and select View Log Graphs This will give you the same graphs asrunning loggraph on the AIMLESS log file they are also the same as those that appeared in IMOSFLMs QuickScale task To look at thelog file itself (eg the overall merging statistics) select View Log File and it will appear in a new window
161 Looking at the AIMLESS output
The simplest way to look at the output from AIMLESS is to use loggraph on the AIMLESS log file (or via the CCP4i GUI) This can displaymany different graphs
Use Scales vs rotation range to check for smooth variation in the scale factor Check the variation in B factor with image and if there isno real variation it is best to turn off the B-factor refinement
Use the Analysis against all Batches for all runs to detect bad images (high R-factor large number of rejected spots)
Check the Analysis against resolution Fractional bias to see if there is any indication of Partial bias (A negative partial bias will resultif the mosaic spread is underestimated or if there is a lot of diffuse scatter
The Fractional bias should be less than 1-2 although it will often exceed this for weak data (eg in the high resolution bins)
The Axial reflections graphs in AIMLESS are useful for detecting systematic absences which can be used to identify the true spacegroup However the detection of screw axes is thought to be sufficiently robust in POINTLESS that these graphs are no longer necessary
It can also be useful to look at the AIMLESS log file itself in particular the table giving statistics as a function of resolution The effectiveresolution limit of the data can be estimated by looking at the Mn(I)sd column (this is the mean Iσ(I) AFTER merging symmetry matesand is the best indicator of data quality) This table also shows shell and cumulative R-factors
The Mn(I)sd values depend on having realistic values of the standard deviations (errors) in the intensities As the values that come fromMOSFLM are always underestimates of the true error these values are scaled up in AIMLESS using a three-term correction
sdcorrected = SdFac Sqrt[sd(I)2 + SdBLPI + (SdAddI)2]
Here SdFac is an overall scale factor and SdB and SdAdd are intensity dependent factors
AIMLESS will automatically work out a suitable value for all three parameters in order to make the mean value of (observedscatter)(sdestimate) equal to 10 where observed scatter is the difference between an individual estimate of intensity and the mean ofall other estimates (from symmetry mates)
Probably the best estimate of the true high resolution limit of the data can be obtained from the CC(12) values these are thecorrelations between equivalent observations that have been divided randomly into two half-datasets The resolution limit is foundwhen the CC drops below ~ 05 - 03
This table comes under the heading
ANALYSIS OF STANDARD DEVIATIONS
iMosflm Tutorial
fileUsersandrewg4MOSFLMnewgui_tutorialiMosflm_tutorial_720_ver3html[29052015 105311]
in the AIMLESS log file and Run n standard deviation v Intensity test (where n is 1 or more) in the CCP4i GUI View Files from Job -View Log Graphs display
Can you identify a bad image in this dataset Can you work out why it is bad
(Cluethe image headers contain quite a lot of information that is not used by MOSFLM including the date and time that the image wascollected)
You can exclude a given batch from the scaling using the EXCLUDE keyword
RUN ALL EXCLUDE imagenumber
In this case run number will be 1
Rerun the scaling SENDING THE OUTPUT TO A NEW LOGFILE excluding this image and see the effect on the heights in the anomalousPatterson (in the log file) DO NOT repeat the integration In the command file uncomment the line (near the top) goto aimless so itskips the integration part
In the CCP4i GUI click to highlight the AIMLESS job which is listed as FINISHED and select ldquoReRun Jobrdquo from the control buttons downthe right-hand side of the main interface window Under ldquoExcluded Datardquo in the window that appears check the box next to Excludeselected batches and pull-down on the menu button to exclude a range Give the start amp end range to exclude (eg 74 to 74) Rerunthe job as before
17 Changing the symmetryFrom the list of options at the left hand side of the main window select ldquoUtilitiesrdquo and under that SortModifyCombine MTZ Files
In the new window give a new title eg reindex as H32
Click on the Box Change space group andor reindex reflections
Use the browse option to select the input MTZ file (First orange bar) the output filename will be generated automatically (but you canchange it)
Under Reindex details
In the last option check the box next to ldquoChange space group tordquo and enter H32 in the box This is above the final item Reducereflections to the asymmetric unit which is checked by default
Select Run from the Run option button
Then go back to the scaling window and select the new MTZ file (reindexed) as the input for scaling (use Browse) CHANGE THE JOBTITLE
Then select RUN
The scaling will now be performed in space group H32 Look at the merging statistics in the log file in particular the multiplicityweighted R-factor called Rmeas in the log file
18 Looking at the CTRUNCATE outputThe CTRUNCATE program converts intensities to amplitudes and also compiles some useful statistics The LTEST and the cumulativeintensity statistics tabulated by CTRUNCATE (and plotted by loggraph) provide the only point at which you will be able to detectmerohedral twinning (when the two lattices of the twin components exactly overlap and every measured intensity is actually the sum oftwo intensities)
For a good dataset the observed distribution should be within 1 of the theoretical distribution Is this the case for this data
19 If you have time 191 Different mosaic spreads
Try repeating the processing with the mosaic spread set to a value 25 smaller than the refined one and fix it by checking the Fix boxin the Integration window in iMosflm
Can you tell from the merging statistics if this data is better
192 Checking up on outliers
iMosflm Tutorial
fileUsersandrewg4MOSFLMnewgui_tutorialiMosflm_tutorial_720_ver3html[29052015 105311]
AIMLESS writes a file called ROGUES which lists reflections which show very poor agreement between symmetry mates or which areimplausibly large
Look in this file (it is ASCII) and try to work out why this has happened The ROGUES file gives you the image (Batch) on which thereflections have been recorded (for partials this is the image nearest the centre of the reflection so you may need to look on thepreceding and following image as well) Select a reflection which shows very poor agreement with its symmetry mates (A value greaterthan 10 in the DelIsd column in the ROGUES file)
Select the offending image by double-clicking it in the Images pane of the iMosflm main window Predict the reflections then enter thehkl values into the boxes and hit Return (or click the red warning button following the entry box for l) to locate the offending reflectionin the image You must give the measured indices - the first set of values in the ROGUES file - when doing this See if there is anythingodd about the spot Remember to check adjacent images for partials
193 How accurate does the unit cell have to be
Try changing the cell parameters by (say) 10 and integrate the images again What is the effect on the merging statistics
20 Tips1 When reading images into a session DO NOT attempt to carry out any other task until ALL the images have been read2 It is often worth repeating the indexing (usually only once) as the refined direct beam coordinates from the first indexing may give
an improved solution when the indexing is repeated (lower rmsd)3 Always integrate a few degrees of data before integrating the whole dataset (see sect9) If the space group is not known in advance
run Quicksymm with a few degrees of data to check that the correct indexing solution has been chosen4 For difficult images do not attempt to refine the unit cell initially once an indexing solution has been obtained try integrating a
few images to ensure that the integration is stable If then going on to refine the cell check that the prediction looks OK for thefirst image of every segment included in the refinement If it does not look very good consider using the pattern matching(Settings -gt Processing options -gt Advanced refinement see sect84)
5 If the resolution of the data is less than 35 Aring do not use the ldquoRefine Cellrdquo task Instead use several images in indexing and use thecell that comes from the indexing
6 If iMosflm gets into a state where the activity icon(upper right) is spinning but nothing seems to be happening click on the activityicon to stop it spinning and see if the session can be continued DO NOT click on the activity icon simply to abort a task this willgive unpredictable results Use the Abort button for cell refinement or integration There is no defined way to abort indexing
7 Use the image summation option (see sect4) to get a better impression of the diffraction for very low exposure Pilatus images8 Use image summation for detector parameter refinement for fine sliced very weak Pilatus images (Settings -gt Processing options -
gt Advanced refinement see sect821)9 For large mosaic spread values (gt 10deg) or small mosaic block sizes (lt10) consider increasing the maximum allowed reflection
width to avoid having too many green predicted reflections (Settings -gt Processing options -gt Advanced integration see sect97)10 By default on selecting the Indexing task iMosflm will find spots index and (assuming a solution has been found) estimate the
mosaicity For difficult cases it is more useful to restrict this to simply finding spots and then do the indexing and mosaicityestimation by clicking the appropriate buttons To do this change the check box Automatically index after spot finding inSettings -gt Processing options -gt Indexing
11 See sect521 and sect522 for advice if the indexing fails Also consider the possibility of a reversed phi rotation direction if you arenot familiar with the beamline (Settings -gt Experiment settings -gt Experiment see sect21)
12 If the detector parameters have refined to physically unreasonable values (eg because cell refinement or integration has beencarried out using an incorrect indexing solution) be sure to reset the detector parameters before attempting further processing(Settings -gt Experiment settings -gt Detector see sect21)
13 Always set the resolution limit slightly beyond the point at which any spots are visible (see sect414 ) For very weak fine-sliceddata it can be very difficult to estimate the resolution visually so integrate to the maximum resolution (inscribed circle) and usethe merging results to set the final resolution There should be no problems integrating to a resolution ~03-05 Aring beyond theactual resolution limit but for example integrating to 3 Aring when the true resolution limit is 5-6 Aring may cause problems and theintegration should then be repeated with a more realistic resolution limit
14 Use the site file sect141 if repeatedly processing data where the direct beam position is wrong or if the phi direction is reversed etcto save having to correct this for every session
Appendix IA command script for running MOSFLM using the keywords copied from the Batch processing window of the new GUI (see Integratingas a background job sect952) Note that keyworded input for MOSFLM and other CCP4 programs is case-insensitive apart from file anddirectory names
bincsh -fv Set a unique identifier for filenames for this job
set ident = x89_mos07_blk3_smallsep
iMosflm Tutorial
fileUsersandrewg4MOSFLMnewgui_tutorialiMosflm_tutorial_720_ver3html[29052015 105311]
$ipmosflm COORDS $identcoords SUMMARY $identsummary ltlt eof-ip Insert keywords copied from iMosflm batch window here
Keywords for this run For example could involve trying different values for mosaic spread or not integrating all images etc etchklout $identmtzgenfile $identgenprocess 1 1000 goeof-ip
pointlesspointless hklin $identmtz hklout $ident_pointlessmtz
aimlessaimless hklin $ident_pointlessmtz hklout $ident_aimless_partmtz ROGUES $identrogues ltlt eof-aimless Use all default options for aimlesseof-aimless
ctruncate hklin $ident_aimlessmtz hklout $ident_truncatemtz
Harry Powell Andrew Leslie and Owen Johnson
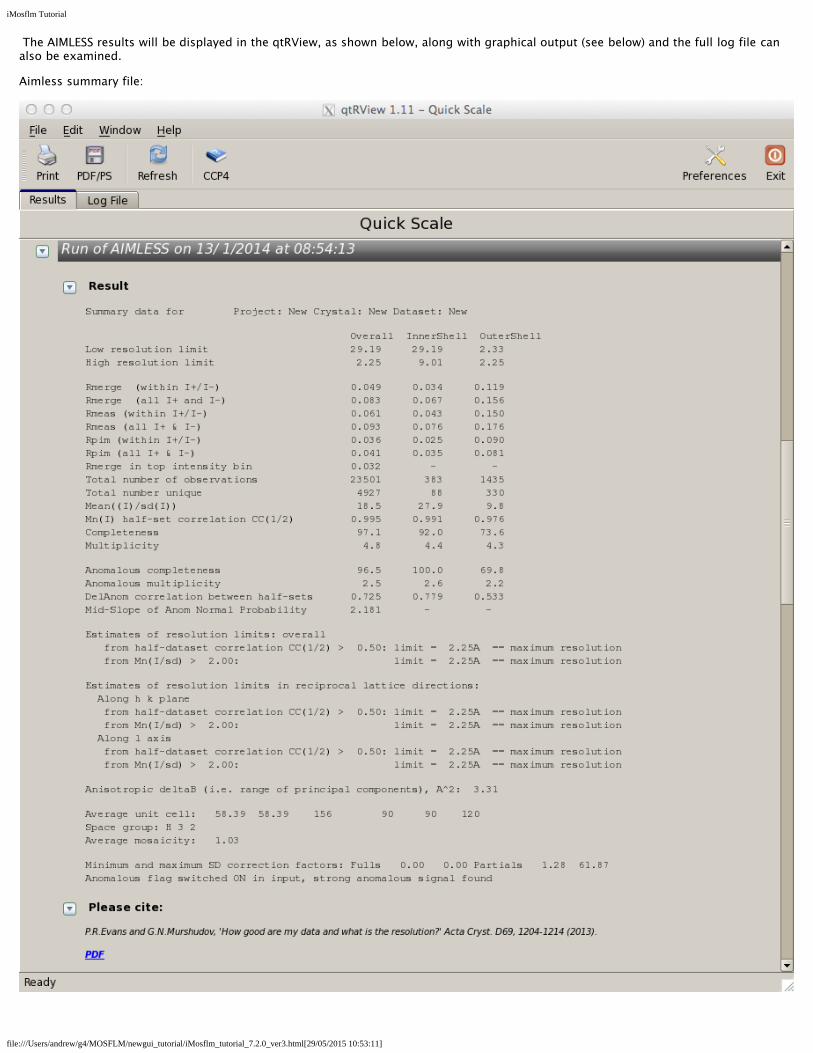
iMosflm Tutorial
fileUsersandrewg4MOSFLMnewgui_tutorialiMosflm_tutorial_720_ver3html[29052015 105311]
The AIMLESS results will be displayed in the qtRView as shown below along with graphical output (see below) and the full log file canalso be examined
Aimless summary file
iMosflm Tutorial
fileUsersandrewg4MOSFLMnewgui_tutorialiMosflm_tutorial_720_ver3html[29052015 105311]
An example of the Aimless graphical output
The AIMLESS logfile can also be examined by selecting the Log File tab
12 History and mosflm log fileSelecting History allows the history of the session to be examined or by selecting the Log tab the full mosflmlp file can be viewed Themosflmlp file is also available in a time-stamped file mosflm_yyyymmdd_hhmmsslp (eg mosflm_20100518_131019lp) and can beread with a text editor
The History has a tree structure and will show when various parameters have been changed This has not been fully implemented and isnot generally useful
The logfile may provide useful clues when processing has failed
13 Warning MessagesAs already mentioned in Adding images sect3 and Integration sect9 warning messages are generated by MOSFLM during processing Atraffic light colour coding has now been assigned based on the warnings and is shown next to the Warnings box
A Red status implies a serious problem that will affect data quality and should be addressed
An Orange status implies minor issues that should be checked to see if things can be improved
A Green status means no significant problems messages are for information only
iMosflm Tutorial
fileUsersandrewg4MOSFLMnewgui_tutorialiMosflm_tutorial_720_ver3html[29052015 105311]
Abbreviated messages can be obtained by clicking on the Warnings icon The full warning Details together with Hints amp Notes text (ifany are available) can be obtained by double-clicking the relevant warning Details are displayed in a pop-up text box which willdisappear with the next click outside the box The same full details and suggestions are of course available in the mosflmlp files whereeven more information may be available
NOTE This is the end of the part of the tutorial which deals directly with iMosflm but see sect19 which has some suggestions forfurther work if you have time The remainder of this document deals with integrating and scaling data with MOSFLM andAimless via the CCP4i user interface examining the traditional mosflm SUMMARY file with the CCP4 utility loggraph
The Appendix contains a shell script for running MOSFLM as a traditional batch job
14 Useful command line optionsiMosflm has a number of command line options and these can be listed by typingimosflm --helpCurrent options are
--allimages -a ltfilenamegt Starts mosflm loading all files that match the template generated from ltfilenamegt--ccp4i2 Autosaves an iMosflm session file upon exit with an XML list of all iMosflm output files--debug -d Creates a large output file for debugging purposes Dont use this unless asked to by a developer--expert -e Permits access to advanced detector settings This should not normally be required--fastload -f Attempt to speed loading of many images offline while indexing two default images separated by 90 degrees--help -h Displays this message then exits--imagedir -I ltdirectorygt Starts the image browser in this directory if ltdirectorygt is given as an environment variable it will be expanded to its full value--init -i ltfilenamegt Starts Mosflm and reads from the given saved session file--startdir -S ltdirectorygt Starts mosflm in directory ltstartdirgt rather than the current directory This will only work if the directory exists and you have write permission to it otherwise iMosflm will exit All the normal mosflm output files will be in this directory--singleimage -s ltfilenamegt Starts mosflm loading only the image from ltfilenamegt--site -X ltfilenamegt Reads anyall of the following lines from the file given WAVELENGTH ltxgt DISPERSION ltxgt POLARISATION [PINHOLE | MIRRORS | MONOCHROMATOR | SYNCHROTRON ltxgt] DIVERGENCE ltxh xvgt BEAM ltbeamx beamygt DISTANCE ltxgt DISTORTION TILT ltxgt DISTORTION TWIST ltxgt GAIN ltxgt DETECTOR REVERSEPHI DETECTOR OMEGA ltxgt--version -v Displays the program version and required Mosflm version then exits
These can be abbreviated to the shortest unambiguous string
141 The site fileimosflm --site ltsitefilegt will read keywords from the file ltsitefilegt that will overwrite incorrect information in image headers Thissaves having to manually correct values in every iMosflm session The site file can also be read or written as an option from the Sessionmenu (see Drop down menus sect21) Allowed keywords areWAVELENGTH ltxgt
iMosflm Tutorial
fileUsersandrewg4MOSFLMnewgui_tutorialiMosflm_tutorial_720_ver3html[29052015 105311]
DISPERSION ltxgtPOLARISATION [PINHOLE | MIRRORS | MONO | SYNCHROTRON ltxgt]DIVERGENCE ltxh xvgtBEAM ltbeamx beamygtDISTANCE ltxgtDISTORTION TILT ltxgtDISTORTION TWIST ltxgtGAIN ltxgtDETECTOR REVERSEPHIDETECTOR OMEGA ltxgt
15 The mosflm SUMMARY fileMOSFLM produces a summary file listing refined parameters for each image and when using iMosflm this file will be date- amp time-stamped and have a name such as mosflm_20100518_131019sum This contains the same information as the plots produced by theiMOSFLM GUI which now also include the number of bad spots and overloads
This can be inspected graphically from the CCP4i GUI using the program loggraph Select the pull down menu View Files from Job andunder Output files select Additional log graphs where the _SUMMARYloggraph file will be listed Select this file to display its tablesin loggraph
This is very useful to identify rogue images (with unusually high positional residual or low Iσ(I)) If you find any read that image intoMOSFLM and see what is wrong with it
If you have done more than one integration run during your MOSFLM session you will find multiple entries of the tables Look at the lastset for integration of the 84 images
Click on the Refined detector parameter tables and check on the stability of parameters like the TILT and TWIST of the detector (unitsare hundredths of a degree) and for Mar Research (or DIP) image plate data the distortion parameters ROFF and TOFF (units are mm) Ifthey are varying a lot (more than 20 for TWISTTILT) or 015 for ROFFTOFF then it is probably a good idea to fix these parameters atthe average value (or the known values for this detector if they are available) (see Detector parameters sect821)
Click on the Post refinement table and check the missets It does not matter if they change slowly and by an amount (per image) that isless than 01mosaic spread If they are changing more than this then there could be a problem with processing the data (there is notmuch you can do about this)
Check how the mosaic spread is changing If it is unstable or if you think it is not refining to sensible values (as judged by looking atthe prediction) then you can fix the input value in the same way as the detector parameters (see Crystal parameters sect822)
BADSPOTS AND OVERLOADS
The program will set a rejection flag for those reflections that fail certain tests for example too much variation in the background levela poor profile fit an intensity that is very negative (more than 5 standard deviations) a very high gradient for the background planeThese reflections are called Bad spots and they are listed individually for each image in the mosflmlp file together with the reason forflagging them The number of bad spots is also written to the summary file Generally there should be very few (5-10) bad spots oneach image If there are more it could be because the backstop shadow is not correctly allowed for (consider using the NULLPIXkeyword)
There should also be very few overloaded reflections on each image If there are a lot then a separate low resolution data collectionpass should be made with a much shorter exposure time
IMPORTANT Both Bad spots and Overloads are written to the output MTZ file but will be rejected by default by AIMLESS Theintensity of overloaded reflections is estimated by profile fitting that part of the spot that is not saturated To include these reflections inthe final merged data use the ACCEPT keyword in AIMLESS
16 Scaling data with CCP4i ccp4i
Select Directories amp ProjectDir (top right)
In the new window select Add project
Enter the project name in the Project field and the full directory path in the uses directory field Default values may have been enteredalready here Select this project from Project for this session
Select Apply and Exit Dismiss the warning message that comes up
Select Data reduction from the pull down menu of modules (orange bar at top left)
iMosflm Tutorial
fileUsersandrewg4MOSFLMnewgui_tutorialiMosflm_tutorial_720_ver3html[29052015 105311]
Select Symmetry Scale Merge (Aimless)
In the window that appears do the following
Give a job title (top line)
Click on the box next to Separate anomalous pairs for outlier rejection amp merging statistics (the crystals have been soaked in a mercurycompound)
In the next orange bar (line starts HKLIN 1) select Browse and select the MTZ file output by MOSFLM (probably called hg_001mtz)Select OK
If you did not supply the Project name Crystal name or Dataset name to Mosflm fill in the boxes for these now
Under Scaling Protocol
From the pull-down menu on the line starting Scale select with automatic default settings
At the bottom of window from the pull-down menu named Run select RunampView Com File
This will display a new window showing the command file for running the POINTLESS step select Continue After a brief pause it willshow the command file for running AIMLESS (This can be edited before submitting the job) Select Continue
In the main window it will show that the AIMLESS job is running
When AIMLESS has finished the command file for running the CTRUNCATE step will appearselect Continue
When CTRUNCATE has run the main window will say FINISHED
At that point select the pull-down menu View Files from Job and select View Log Graphs This will give you the same graphs asrunning loggraph on the AIMLESS log file they are also the same as those that appeared in IMOSFLMs QuickScale task To look at thelog file itself (eg the overall merging statistics) select View Log File and it will appear in a new window
161 Looking at the AIMLESS output
The simplest way to look at the output from AIMLESS is to use loggraph on the AIMLESS log file (or via the CCP4i GUI) This can displaymany different graphs
Use Scales vs rotation range to check for smooth variation in the scale factor Check the variation in B factor with image and if there isno real variation it is best to turn off the B-factor refinement
Use the Analysis against all Batches for all runs to detect bad images (high R-factor large number of rejected spots)
Check the Analysis against resolution Fractional bias to see if there is any indication of Partial bias (A negative partial bias will resultif the mosaic spread is underestimated or if there is a lot of diffuse scatter
The Fractional bias should be less than 1-2 although it will often exceed this for weak data (eg in the high resolution bins)
The Axial reflections graphs in AIMLESS are useful for detecting systematic absences which can be used to identify the true spacegroup However the detection of screw axes is thought to be sufficiently robust in POINTLESS that these graphs are no longer necessary
It can also be useful to look at the AIMLESS log file itself in particular the table giving statistics as a function of resolution The effectiveresolution limit of the data can be estimated by looking at the Mn(I)sd column (this is the mean Iσ(I) AFTER merging symmetry matesand is the best indicator of data quality) This table also shows shell and cumulative R-factors
The Mn(I)sd values depend on having realistic values of the standard deviations (errors) in the intensities As the values that come fromMOSFLM are always underestimates of the true error these values are scaled up in AIMLESS using a three-term correction
sdcorrected = SdFac Sqrt[sd(I)2 + SdBLPI + (SdAddI)2]
Here SdFac is an overall scale factor and SdB and SdAdd are intensity dependent factors
AIMLESS will automatically work out a suitable value for all three parameters in order to make the mean value of (observedscatter)(sdestimate) equal to 10 where observed scatter is the difference between an individual estimate of intensity and the mean ofall other estimates (from symmetry mates)
Probably the best estimate of the true high resolution limit of the data can be obtained from the CC(12) values these are thecorrelations between equivalent observations that have been divided randomly into two half-datasets The resolution limit is foundwhen the CC drops below ~ 05 - 03
This table comes under the heading
ANALYSIS OF STANDARD DEVIATIONS
iMosflm Tutorial
fileUsersandrewg4MOSFLMnewgui_tutorialiMosflm_tutorial_720_ver3html[29052015 105311]
in the AIMLESS log file and Run n standard deviation v Intensity test (where n is 1 or more) in the CCP4i GUI View Files from Job -View Log Graphs display
Can you identify a bad image in this dataset Can you work out why it is bad
(Cluethe image headers contain quite a lot of information that is not used by MOSFLM including the date and time that the image wascollected)
You can exclude a given batch from the scaling using the EXCLUDE keyword
RUN ALL EXCLUDE imagenumber
In this case run number will be 1
Rerun the scaling SENDING THE OUTPUT TO A NEW LOGFILE excluding this image and see the effect on the heights in the anomalousPatterson (in the log file) DO NOT repeat the integration In the command file uncomment the line (near the top) goto aimless so itskips the integration part
In the CCP4i GUI click to highlight the AIMLESS job which is listed as FINISHED and select ldquoReRun Jobrdquo from the control buttons downthe right-hand side of the main interface window Under ldquoExcluded Datardquo in the window that appears check the box next to Excludeselected batches and pull-down on the menu button to exclude a range Give the start amp end range to exclude (eg 74 to 74) Rerunthe job as before
17 Changing the symmetryFrom the list of options at the left hand side of the main window select ldquoUtilitiesrdquo and under that SortModifyCombine MTZ Files
In the new window give a new title eg reindex as H32
Click on the Box Change space group andor reindex reflections
Use the browse option to select the input MTZ file (First orange bar) the output filename will be generated automatically (but you canchange it)
Under Reindex details
In the last option check the box next to ldquoChange space group tordquo and enter H32 in the box This is above the final item Reducereflections to the asymmetric unit which is checked by default
Select Run from the Run option button
Then go back to the scaling window and select the new MTZ file (reindexed) as the input for scaling (use Browse) CHANGE THE JOBTITLE
Then select RUN
The scaling will now be performed in space group H32 Look at the merging statistics in the log file in particular the multiplicityweighted R-factor called Rmeas in the log file
18 Looking at the CTRUNCATE outputThe CTRUNCATE program converts intensities to amplitudes and also compiles some useful statistics The LTEST and the cumulativeintensity statistics tabulated by CTRUNCATE (and plotted by loggraph) provide the only point at which you will be able to detectmerohedral twinning (when the two lattices of the twin components exactly overlap and every measured intensity is actually the sum oftwo intensities)
For a good dataset the observed distribution should be within 1 of the theoretical distribution Is this the case for this data
19 If you have time 191 Different mosaic spreads
Try repeating the processing with the mosaic spread set to a value 25 smaller than the refined one and fix it by checking the Fix boxin the Integration window in iMosflm
Can you tell from the merging statistics if this data is better
192 Checking up on outliers
iMosflm Tutorial
fileUsersandrewg4MOSFLMnewgui_tutorialiMosflm_tutorial_720_ver3html[29052015 105311]
AIMLESS writes a file called ROGUES which lists reflections which show very poor agreement between symmetry mates or which areimplausibly large
Look in this file (it is ASCII) and try to work out why this has happened The ROGUES file gives you the image (Batch) on which thereflections have been recorded (for partials this is the image nearest the centre of the reflection so you may need to look on thepreceding and following image as well) Select a reflection which shows very poor agreement with its symmetry mates (A value greaterthan 10 in the DelIsd column in the ROGUES file)
Select the offending image by double-clicking it in the Images pane of the iMosflm main window Predict the reflections then enter thehkl values into the boxes and hit Return (or click the red warning button following the entry box for l) to locate the offending reflectionin the image You must give the measured indices - the first set of values in the ROGUES file - when doing this See if there is anythingodd about the spot Remember to check adjacent images for partials
193 How accurate does the unit cell have to be
Try changing the cell parameters by (say) 10 and integrate the images again What is the effect on the merging statistics
20 Tips1 When reading images into a session DO NOT attempt to carry out any other task until ALL the images have been read2 It is often worth repeating the indexing (usually only once) as the refined direct beam coordinates from the first indexing may give
an improved solution when the indexing is repeated (lower rmsd)3 Always integrate a few degrees of data before integrating the whole dataset (see sect9) If the space group is not known in advance
run Quicksymm with a few degrees of data to check that the correct indexing solution has been chosen4 For difficult images do not attempt to refine the unit cell initially once an indexing solution has been obtained try integrating a
few images to ensure that the integration is stable If then going on to refine the cell check that the prediction looks OK for thefirst image of every segment included in the refinement If it does not look very good consider using the pattern matching(Settings -gt Processing options -gt Advanced refinement see sect84)
5 If the resolution of the data is less than 35 Aring do not use the ldquoRefine Cellrdquo task Instead use several images in indexing and use thecell that comes from the indexing
6 If iMosflm gets into a state where the activity icon(upper right) is spinning but nothing seems to be happening click on the activityicon to stop it spinning and see if the session can be continued DO NOT click on the activity icon simply to abort a task this willgive unpredictable results Use the Abort button for cell refinement or integration There is no defined way to abort indexing
7 Use the image summation option (see sect4) to get a better impression of the diffraction for very low exposure Pilatus images8 Use image summation for detector parameter refinement for fine sliced very weak Pilatus images (Settings -gt Processing options -
gt Advanced refinement see sect821)9 For large mosaic spread values (gt 10deg) or small mosaic block sizes (lt10) consider increasing the maximum allowed reflection
width to avoid having too many green predicted reflections (Settings -gt Processing options -gt Advanced integration see sect97)10 By default on selecting the Indexing task iMosflm will find spots index and (assuming a solution has been found) estimate the
mosaicity For difficult cases it is more useful to restrict this to simply finding spots and then do the indexing and mosaicityestimation by clicking the appropriate buttons To do this change the check box Automatically index after spot finding inSettings -gt Processing options -gt Indexing
11 See sect521 and sect522 for advice if the indexing fails Also consider the possibility of a reversed phi rotation direction if you arenot familiar with the beamline (Settings -gt Experiment settings -gt Experiment see sect21)
12 If the detector parameters have refined to physically unreasonable values (eg because cell refinement or integration has beencarried out using an incorrect indexing solution) be sure to reset the detector parameters before attempting further processing(Settings -gt Experiment settings -gt Detector see sect21)
13 Always set the resolution limit slightly beyond the point at which any spots are visible (see sect414 ) For very weak fine-sliceddata it can be very difficult to estimate the resolution visually so integrate to the maximum resolution (inscribed circle) and usethe merging results to set the final resolution There should be no problems integrating to a resolution ~03-05 Aring beyond theactual resolution limit but for example integrating to 3 Aring when the true resolution limit is 5-6 Aring may cause problems and theintegration should then be repeated with a more realistic resolution limit
14 Use the site file sect141 if repeatedly processing data where the direct beam position is wrong or if the phi direction is reversed etcto save having to correct this for every session
Appendix IA command script for running MOSFLM using the keywords copied from the Batch processing window of the new GUI (see Integratingas a background job sect952) Note that keyworded input for MOSFLM and other CCP4 programs is case-insensitive apart from file anddirectory names
bincsh -fv Set a unique identifier for filenames for this job
set ident = x89_mos07_blk3_smallsep
iMosflm Tutorial
fileUsersandrewg4MOSFLMnewgui_tutorialiMosflm_tutorial_720_ver3html[29052015 105311]
$ipmosflm COORDS $identcoords SUMMARY $identsummary ltlt eof-ip Insert keywords copied from iMosflm batch window here
Keywords for this run For example could involve trying different values for mosaic spread or not integrating all images etc etchklout $identmtzgenfile $identgenprocess 1 1000 goeof-ip
pointlesspointless hklin $identmtz hklout $ident_pointlessmtz
aimlessaimless hklin $ident_pointlessmtz hklout $ident_aimless_partmtz ROGUES $identrogues ltlt eof-aimless Use all default options for aimlesseof-aimless
ctruncate hklin $ident_aimlessmtz hklout $ident_truncatemtz
Harry Powell Andrew Leslie and Owen Johnson
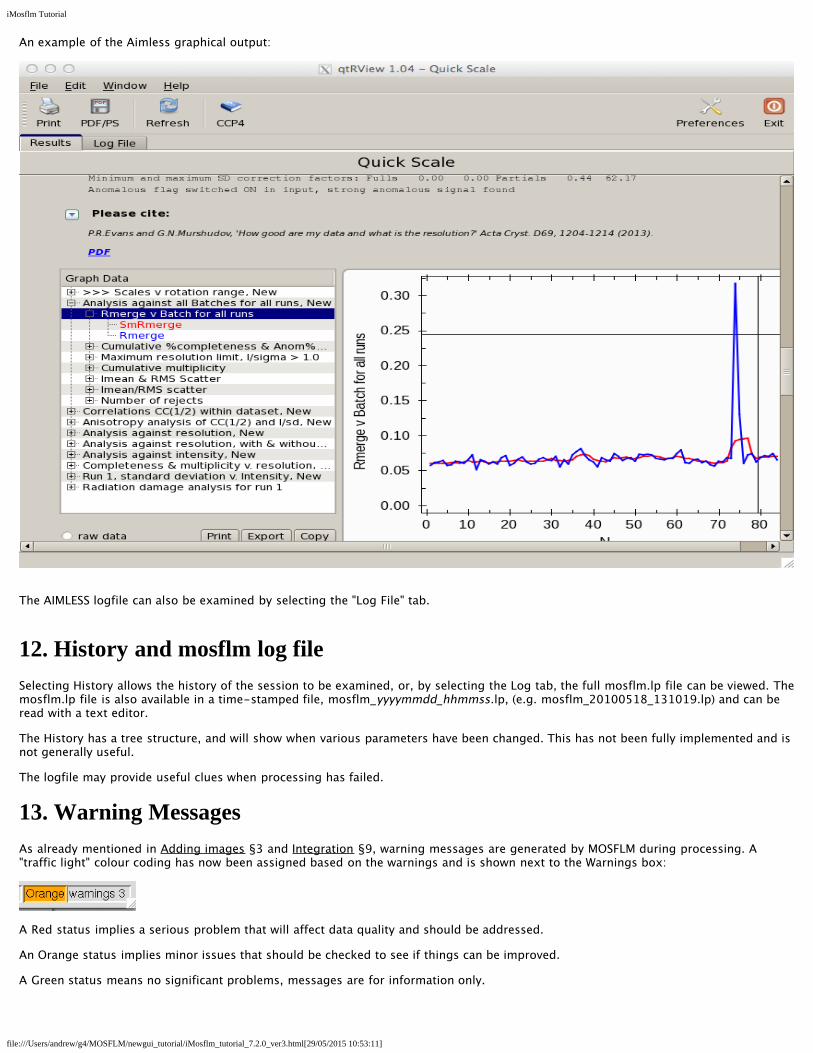
iMosflm Tutorial
fileUsersandrewg4MOSFLMnewgui_tutorialiMosflm_tutorial_720_ver3html[29052015 105311]
DISPERSION ltxgtPOLARISATION [PINHOLE | MIRRORS | MONO | SYNCHROTRON ltxgt]DIVERGENCE ltxh xvgtBEAM ltbeamx beamygtDISTANCE ltxgtDISTORTION TILT ltxgtDISTORTION TWIST ltxgtGAIN ltxgtDETECTOR REVERSEPHIDETECTOR OMEGA ltxgt
15 The mosflm SUMMARY fileMOSFLM produces a summary file listing refined parameters for each image and when using iMosflm this file will be date- amp time-stamped and have a name such as mosflm_20100518_131019sum This contains the same information as the plots produced by theiMOSFLM GUI which now also include the number of bad spots and overloads
This can be inspected graphically from the CCP4i GUI using the program loggraph Select the pull down menu View Files from Job andunder Output files select Additional log graphs where the _SUMMARYloggraph file will be listed Select this file to display its tablesin loggraph
This is very useful to identify rogue images (with unusually high positional residual or low Iσ(I)) If you find any read that image intoMOSFLM and see what is wrong with it
If you have done more than one integration run during your MOSFLM session you will find multiple entries of the tables Look at the lastset for integration of the 84 images
Click on the Refined detector parameter tables and check on the stability of parameters like the TILT and TWIST of the detector (unitsare hundredths of a degree) and for Mar Research (or DIP) image plate data the distortion parameters ROFF and TOFF (units are mm) Ifthey are varying a lot (more than 20 for TWISTTILT) or 015 for ROFFTOFF then it is probably a good idea to fix these parameters atthe average value (or the known values for this detector if they are available) (see Detector parameters sect821)
Click on the Post refinement table and check the missets It does not matter if they change slowly and by an amount (per image) that isless than 01mosaic spread If they are changing more than this then there could be a problem with processing the data (there is notmuch you can do about this)
Check how the mosaic spread is changing If it is unstable or if you think it is not refining to sensible values (as judged by looking atthe prediction) then you can fix the input value in the same way as the detector parameters (see Crystal parameters sect822)
BADSPOTS AND OVERLOADS
The program will set a rejection flag for those reflections that fail certain tests for example too much variation in the background levela poor profile fit an intensity that is very negative (more than 5 standard deviations) a very high gradient for the background planeThese reflections are called Bad spots and they are listed individually for each image in the mosflmlp file together with the reason forflagging them The number of bad spots is also written to the summary file Generally there should be very few (5-10) bad spots oneach image If there are more it could be because the backstop shadow is not correctly allowed for (consider using the NULLPIXkeyword)
There should also be very few overloaded reflections on each image If there are a lot then a separate low resolution data collectionpass should be made with a much shorter exposure time
IMPORTANT Both Bad spots and Overloads are written to the output MTZ file but will be rejected by default by AIMLESS Theintensity of overloaded reflections is estimated by profile fitting that part of the spot that is not saturated To include these reflections inthe final merged data use the ACCEPT keyword in AIMLESS
16 Scaling data with CCP4i ccp4i
Select Directories amp ProjectDir (top right)
In the new window select Add project
Enter the project name in the Project field and the full directory path in the uses directory field Default values may have been enteredalready here Select this project from Project for this session
Select Apply and Exit Dismiss the warning message that comes up
Select Data reduction from the pull down menu of modules (orange bar at top left)
iMosflm Tutorial
fileUsersandrewg4MOSFLMnewgui_tutorialiMosflm_tutorial_720_ver3html[29052015 105311]
Select Symmetry Scale Merge (Aimless)
In the window that appears do the following
Give a job title (top line)
Click on the box next to Separate anomalous pairs for outlier rejection amp merging statistics (the crystals have been soaked in a mercurycompound)
In the next orange bar (line starts HKLIN 1) select Browse and select the MTZ file output by MOSFLM (probably called hg_001mtz)Select OK
If you did not supply the Project name Crystal name or Dataset name to Mosflm fill in the boxes for these now
Under Scaling Protocol
From the pull-down menu on the line starting Scale select with automatic default settings
At the bottom of window from the pull-down menu named Run select RunampView Com File
This will display a new window showing the command file for running the POINTLESS step select Continue After a brief pause it willshow the command file for running AIMLESS (This can be edited before submitting the job) Select Continue
In the main window it will show that the AIMLESS job is running
When AIMLESS has finished the command file for running the CTRUNCATE step will appearselect Continue
When CTRUNCATE has run the main window will say FINISHED
At that point select the pull-down menu View Files from Job and select View Log Graphs This will give you the same graphs asrunning loggraph on the AIMLESS log file they are also the same as those that appeared in IMOSFLMs QuickScale task To look at thelog file itself (eg the overall merging statistics) select View Log File and it will appear in a new window
161 Looking at the AIMLESS output
The simplest way to look at the output from AIMLESS is to use loggraph on the AIMLESS log file (or via the CCP4i GUI) This can displaymany different graphs
Use Scales vs rotation range to check for smooth variation in the scale factor Check the variation in B factor with image and if there isno real variation it is best to turn off the B-factor refinement
Use the Analysis against all Batches for all runs to detect bad images (high R-factor large number of rejected spots)
Check the Analysis against resolution Fractional bias to see if there is any indication of Partial bias (A negative partial bias will resultif the mosaic spread is underestimated or if there is a lot of diffuse scatter
The Fractional bias should be less than 1-2 although it will often exceed this for weak data (eg in the high resolution bins)
The Axial reflections graphs in AIMLESS are useful for detecting systematic absences which can be used to identify the true spacegroup However the detection of screw axes is thought to be sufficiently robust in POINTLESS that these graphs are no longer necessary
It can also be useful to look at the AIMLESS log file itself in particular the table giving statistics as a function of resolution The effectiveresolution limit of the data can be estimated by looking at the Mn(I)sd column (this is the mean Iσ(I) AFTER merging symmetry matesand is the best indicator of data quality) This table also shows shell and cumulative R-factors
The Mn(I)sd values depend on having realistic values of the standard deviations (errors) in the intensities As the values that come fromMOSFLM are always underestimates of the true error these values are scaled up in AIMLESS using a three-term correction
sdcorrected = SdFac Sqrt[sd(I)2 + SdBLPI + (SdAddI)2]
Here SdFac is an overall scale factor and SdB and SdAdd are intensity dependent factors
AIMLESS will automatically work out a suitable value for all three parameters in order to make the mean value of (observedscatter)(sdestimate) equal to 10 where observed scatter is the difference between an individual estimate of intensity and the mean ofall other estimates (from symmetry mates)
Probably the best estimate of the true high resolution limit of the data can be obtained from the CC(12) values these are thecorrelations between equivalent observations that have been divided randomly into two half-datasets The resolution limit is foundwhen the CC drops below ~ 05 - 03
This table comes under the heading
ANALYSIS OF STANDARD DEVIATIONS
iMosflm Tutorial
fileUsersandrewg4MOSFLMnewgui_tutorialiMosflm_tutorial_720_ver3html[29052015 105311]
in the AIMLESS log file and Run n standard deviation v Intensity test (where n is 1 or more) in the CCP4i GUI View Files from Job -View Log Graphs display
Can you identify a bad image in this dataset Can you work out why it is bad
(Cluethe image headers contain quite a lot of information that is not used by MOSFLM including the date and time that the image wascollected)
You can exclude a given batch from the scaling using the EXCLUDE keyword
RUN ALL EXCLUDE imagenumber
In this case run number will be 1
Rerun the scaling SENDING THE OUTPUT TO A NEW LOGFILE excluding this image and see the effect on the heights in the anomalousPatterson (in the log file) DO NOT repeat the integration In the command file uncomment the line (near the top) goto aimless so itskips the integration part
In the CCP4i GUI click to highlight the AIMLESS job which is listed as FINISHED and select ldquoReRun Jobrdquo from the control buttons downthe right-hand side of the main interface window Under ldquoExcluded Datardquo in the window that appears check the box next to Excludeselected batches and pull-down on the menu button to exclude a range Give the start amp end range to exclude (eg 74 to 74) Rerunthe job as before
17 Changing the symmetryFrom the list of options at the left hand side of the main window select ldquoUtilitiesrdquo and under that SortModifyCombine MTZ Files
In the new window give a new title eg reindex as H32
Click on the Box Change space group andor reindex reflections
Use the browse option to select the input MTZ file (First orange bar) the output filename will be generated automatically (but you canchange it)
Under Reindex details
In the last option check the box next to ldquoChange space group tordquo and enter H32 in the box This is above the final item Reducereflections to the asymmetric unit which is checked by default
Select Run from the Run option button
Then go back to the scaling window and select the new MTZ file (reindexed) as the input for scaling (use Browse) CHANGE THE JOBTITLE
Then select RUN
The scaling will now be performed in space group H32 Look at the merging statistics in the log file in particular the multiplicityweighted R-factor called Rmeas in the log file
18 Looking at the CTRUNCATE outputThe CTRUNCATE program converts intensities to amplitudes and also compiles some useful statistics The LTEST and the cumulativeintensity statistics tabulated by CTRUNCATE (and plotted by loggraph) provide the only point at which you will be able to detectmerohedral twinning (when the two lattices of the twin components exactly overlap and every measured intensity is actually the sum oftwo intensities)
For a good dataset the observed distribution should be within 1 of the theoretical distribution Is this the case for this data
19 If you have time 191 Different mosaic spreads
Try repeating the processing with the mosaic spread set to a value 25 smaller than the refined one and fix it by checking the Fix boxin the Integration window in iMosflm
Can you tell from the merging statistics if this data is better
192 Checking up on outliers
iMosflm Tutorial
fileUsersandrewg4MOSFLMnewgui_tutorialiMosflm_tutorial_720_ver3html[29052015 105311]
AIMLESS writes a file called ROGUES which lists reflections which show very poor agreement between symmetry mates or which areimplausibly large
Look in this file (it is ASCII) and try to work out why this has happened The ROGUES file gives you the image (Batch) on which thereflections have been recorded (for partials this is the image nearest the centre of the reflection so you may need to look on thepreceding and following image as well) Select a reflection which shows very poor agreement with its symmetry mates (A value greaterthan 10 in the DelIsd column in the ROGUES file)
Select the offending image by double-clicking it in the Images pane of the iMosflm main window Predict the reflections then enter thehkl values into the boxes and hit Return (or click the red warning button following the entry box for l) to locate the offending reflectionin the image You must give the measured indices - the first set of values in the ROGUES file - when doing this See if there is anythingodd about the spot Remember to check adjacent images for partials
193 How accurate does the unit cell have to be
Try changing the cell parameters by (say) 10 and integrate the images again What is the effect on the merging statistics
20 Tips1 When reading images into a session DO NOT attempt to carry out any other task until ALL the images have been read2 It is often worth repeating the indexing (usually only once) as the refined direct beam coordinates from the first indexing may give
an improved solution when the indexing is repeated (lower rmsd)3 Always integrate a few degrees of data before integrating the whole dataset (see sect9) If the space group is not known in advance
run Quicksymm with a few degrees of data to check that the correct indexing solution has been chosen4 For difficult images do not attempt to refine the unit cell initially once an indexing solution has been obtained try integrating a
few images to ensure that the integration is stable If then going on to refine the cell check that the prediction looks OK for thefirst image of every segment included in the refinement If it does not look very good consider using the pattern matching(Settings -gt Processing options -gt Advanced refinement see sect84)
5 If the resolution of the data is less than 35 Aring do not use the ldquoRefine Cellrdquo task Instead use several images in indexing and use thecell that comes from the indexing
6 If iMosflm gets into a state where the activity icon(upper right) is spinning but nothing seems to be happening click on the activityicon to stop it spinning and see if the session can be continued DO NOT click on the activity icon simply to abort a task this willgive unpredictable results Use the Abort button for cell refinement or integration There is no defined way to abort indexing
7 Use the image summation option (see sect4) to get a better impression of the diffraction for very low exposure Pilatus images8 Use image summation for detector parameter refinement for fine sliced very weak Pilatus images (Settings -gt Processing options -
gt Advanced refinement see sect821)9 For large mosaic spread values (gt 10deg) or small mosaic block sizes (lt10) consider increasing the maximum allowed reflection
width to avoid having too many green predicted reflections (Settings -gt Processing options -gt Advanced integration see sect97)10 By default on selecting the Indexing task iMosflm will find spots index and (assuming a solution has been found) estimate the
mosaicity For difficult cases it is more useful to restrict this to simply finding spots and then do the indexing and mosaicityestimation by clicking the appropriate buttons To do this change the check box Automatically index after spot finding inSettings -gt Processing options -gt Indexing
11 See sect521 and sect522 for advice if the indexing fails Also consider the possibility of a reversed phi rotation direction if you arenot familiar with the beamline (Settings -gt Experiment settings -gt Experiment see sect21)
12 If the detector parameters have refined to physically unreasonable values (eg because cell refinement or integration has beencarried out using an incorrect indexing solution) be sure to reset the detector parameters before attempting further processing(Settings -gt Experiment settings -gt Detector see sect21)
13 Always set the resolution limit slightly beyond the point at which any spots are visible (see sect414 ) For very weak fine-sliceddata it can be very difficult to estimate the resolution visually so integrate to the maximum resolution (inscribed circle) and usethe merging results to set the final resolution There should be no problems integrating to a resolution ~03-05 Aring beyond theactual resolution limit but for example integrating to 3 Aring when the true resolution limit is 5-6 Aring may cause problems and theintegration should then be repeated with a more realistic resolution limit
14 Use the site file sect141 if repeatedly processing data where the direct beam position is wrong or if the phi direction is reversed etcto save having to correct this for every session
Appendix IA command script for running MOSFLM using the keywords copied from the Batch processing window of the new GUI (see Integratingas a background job sect952) Note that keyworded input for MOSFLM and other CCP4 programs is case-insensitive apart from file anddirectory names
bincsh -fv Set a unique identifier for filenames for this job
set ident = x89_mos07_blk3_smallsep
iMosflm Tutorial
fileUsersandrewg4MOSFLMnewgui_tutorialiMosflm_tutorial_720_ver3html[29052015 105311]
$ipmosflm COORDS $identcoords SUMMARY $identsummary ltlt eof-ip Insert keywords copied from iMosflm batch window here
Keywords for this run For example could involve trying different values for mosaic spread or not integrating all images etc etchklout $identmtzgenfile $identgenprocess 1 1000 goeof-ip
pointlesspointless hklin $identmtz hklout $ident_pointlessmtz
aimlessaimless hklin $ident_pointlessmtz hklout $ident_aimless_partmtz ROGUES $identrogues ltlt eof-aimless Use all default options for aimlesseof-aimless
ctruncate hklin $ident_aimlessmtz hklout $ident_truncatemtz
Harry Powell Andrew Leslie and Owen Johnson
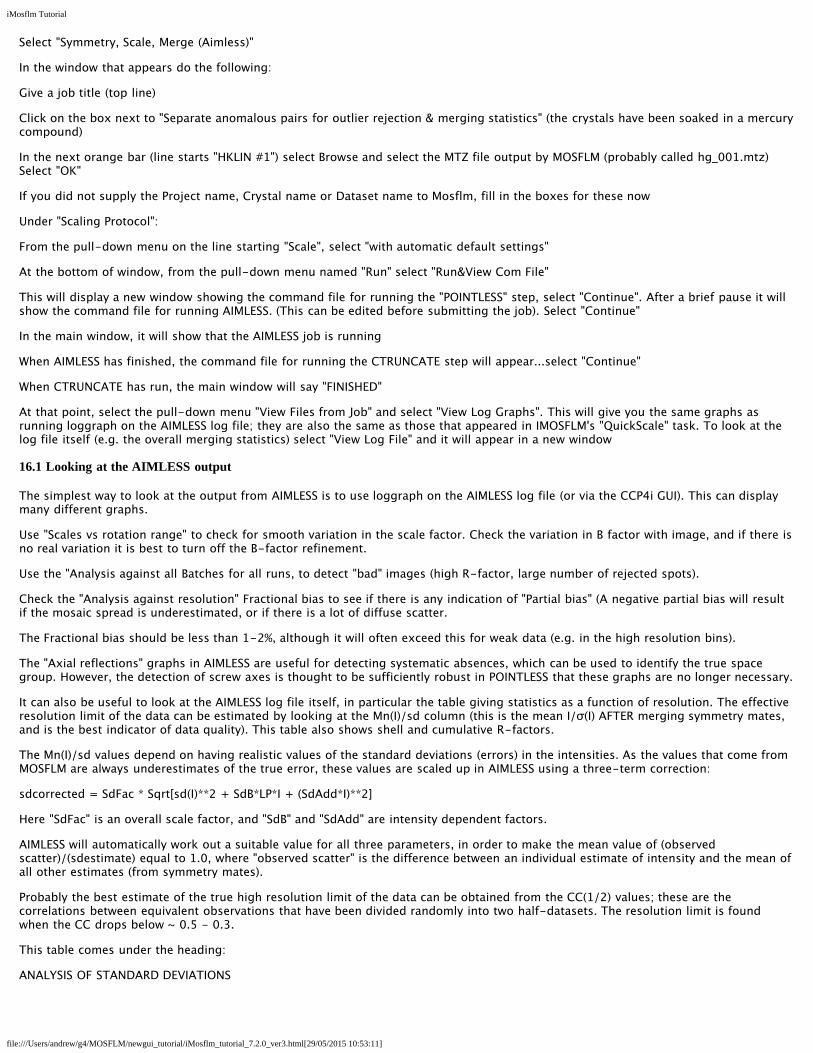
iMosflm Tutorial
fileUsersandrewg4MOSFLMnewgui_tutorialiMosflm_tutorial_720_ver3html[29052015 105311]
in the AIMLESS log file and Run n standard deviation v Intensity test (where n is 1 or more) in the CCP4i GUI View Files from Job -View Log Graphs display
Can you identify a bad image in this dataset Can you work out why it is bad
(Cluethe image headers contain quite a lot of information that is not used by MOSFLM including the date and time that the image wascollected)
You can exclude a given batch from the scaling using the EXCLUDE keyword
RUN ALL EXCLUDE imagenumber
In this case run number will be 1
Rerun the scaling SENDING THE OUTPUT TO A NEW LOGFILE excluding this image and see the effect on the heights in the anomalousPatterson (in the log file) DO NOT repeat the integration In the command file uncomment the line (near the top) goto aimless so itskips the integration part
In the CCP4i GUI click to highlight the AIMLESS job which is listed as FINISHED and select ldquoReRun Jobrdquo from the control buttons downthe right-hand side of the main interface window Under ldquoExcluded Datardquo in the window that appears check the box next to Excludeselected batches and pull-down on the menu button to exclude a range Give the start amp end range to exclude (eg 74 to 74) Rerunthe job as before
17 Changing the symmetryFrom the list of options at the left hand side of the main window select ldquoUtilitiesrdquo and under that SortModifyCombine MTZ Files
In the new window give a new title eg reindex as H32
Click on the Box Change space group andor reindex reflections
Use the browse option to select the input MTZ file (First orange bar) the output filename will be generated automatically (but you canchange it)
Under Reindex details
In the last option check the box next to ldquoChange space group tordquo and enter H32 in the box This is above the final item Reducereflections to the asymmetric unit which is checked by default
Select Run from the Run option button
Then go back to the scaling window and select the new MTZ file (reindexed) as the input for scaling (use Browse) CHANGE THE JOBTITLE
Then select RUN
The scaling will now be performed in space group H32 Look at the merging statistics in the log file in particular the multiplicityweighted R-factor called Rmeas in the log file
18 Looking at the CTRUNCATE outputThe CTRUNCATE program converts intensities to amplitudes and also compiles some useful statistics The LTEST and the cumulativeintensity statistics tabulated by CTRUNCATE (and plotted by loggraph) provide the only point at which you will be able to detectmerohedral twinning (when the two lattices of the twin components exactly overlap and every measured intensity is actually the sum oftwo intensities)
For a good dataset the observed distribution should be within 1 of the theoretical distribution Is this the case for this data
19 If you have time 191 Different mosaic spreads
Try repeating the processing with the mosaic spread set to a value 25 smaller than the refined one and fix it by checking the Fix boxin the Integration window in iMosflm
Can you tell from the merging statistics if this data is better
192 Checking up on outliers
iMosflm Tutorial
fileUsersandrewg4MOSFLMnewgui_tutorialiMosflm_tutorial_720_ver3html[29052015 105311]
AIMLESS writes a file called ROGUES which lists reflections which show very poor agreement between symmetry mates or which areimplausibly large
Look in this file (it is ASCII) and try to work out why this has happened The ROGUES file gives you the image (Batch) on which thereflections have been recorded (for partials this is the image nearest the centre of the reflection so you may need to look on thepreceding and following image as well) Select a reflection which shows very poor agreement with its symmetry mates (A value greaterthan 10 in the DelIsd column in the ROGUES file)
Select the offending image by double-clicking it in the Images pane of the iMosflm main window Predict the reflections then enter thehkl values into the boxes and hit Return (or click the red warning button following the entry box for l) to locate the offending reflectionin the image You must give the measured indices - the first set of values in the ROGUES file - when doing this See if there is anythingodd about the spot Remember to check adjacent images for partials
193 How accurate does the unit cell have to be
Try changing the cell parameters by (say) 10 and integrate the images again What is the effect on the merging statistics
20 Tips1 When reading images into a session DO NOT attempt to carry out any other task until ALL the images have been read2 It is often worth repeating the indexing (usually only once) as the refined direct beam coordinates from the first indexing may give
an improved solution when the indexing is repeated (lower rmsd)3 Always integrate a few degrees of data before integrating the whole dataset (see sect9) If the space group is not known in advance
run Quicksymm with a few degrees of data to check that the correct indexing solution has been chosen4 For difficult images do not attempt to refine the unit cell initially once an indexing solution has been obtained try integrating a
few images to ensure that the integration is stable If then going on to refine the cell check that the prediction looks OK for thefirst image of every segment included in the refinement If it does not look very good consider using the pattern matching(Settings -gt Processing options -gt Advanced refinement see sect84)
5 If the resolution of the data is less than 35 Aring do not use the ldquoRefine Cellrdquo task Instead use several images in indexing and use thecell that comes from the indexing
6 If iMosflm gets into a state where the activity icon(upper right) is spinning but nothing seems to be happening click on the activityicon to stop it spinning and see if the session can be continued DO NOT click on the activity icon simply to abort a task this willgive unpredictable results Use the Abort button for cell refinement or integration There is no defined way to abort indexing
7 Use the image summation option (see sect4) to get a better impression of the diffraction for very low exposure Pilatus images8 Use image summation for detector parameter refinement for fine sliced very weak Pilatus images (Settings -gt Processing options -
gt Advanced refinement see sect821)9 For large mosaic spread values (gt 10deg) or small mosaic block sizes (lt10) consider increasing the maximum allowed reflection
width to avoid having too many green predicted reflections (Settings -gt Processing options -gt Advanced integration see sect97)10 By default on selecting the Indexing task iMosflm will find spots index and (assuming a solution has been found) estimate the
mosaicity For difficult cases it is more useful to restrict this to simply finding spots and then do the indexing and mosaicityestimation by clicking the appropriate buttons To do this change the check box Automatically index after spot finding inSettings -gt Processing options -gt Indexing
11 See sect521 and sect522 for advice if the indexing fails Also consider the possibility of a reversed phi rotation direction if you arenot familiar with the beamline (Settings -gt Experiment settings -gt Experiment see sect21)
12 If the detector parameters have refined to physically unreasonable values (eg because cell refinement or integration has beencarried out using an incorrect indexing solution) be sure to reset the detector parameters before attempting further processing(Settings -gt Experiment settings -gt Detector see sect21)
13 Always set the resolution limit slightly beyond the point at which any spots are visible (see sect414 ) For very weak fine-sliceddata it can be very difficult to estimate the resolution visually so integrate to the maximum resolution (inscribed circle) and usethe merging results to set the final resolution There should be no problems integrating to a resolution ~03-05 Aring beyond theactual resolution limit but for example integrating to 3 Aring when the true resolution limit is 5-6 Aring may cause problems and theintegration should then be repeated with a more realistic resolution limit
14 Use the site file sect141 if repeatedly processing data where the direct beam position is wrong or if the phi direction is reversed etcto save having to correct this for every session
Appendix IA command script for running MOSFLM using the keywords copied from the Batch processing window of the new GUI (see Integratingas a background job sect952) Note that keyworded input for MOSFLM and other CCP4 programs is case-insensitive apart from file anddirectory names
bincsh -fv Set a unique identifier for filenames for this job
set ident = x89_mos07_blk3_smallsep
iMosflm Tutorial
fileUsersandrewg4MOSFLMnewgui_tutorialiMosflm_tutorial_720_ver3html[29052015 105311]
$ipmosflm COORDS $identcoords SUMMARY $identsummary ltlt eof-ip Insert keywords copied from iMosflm batch window here
Keywords for this run For example could involve trying different values for mosaic spread or not integrating all images etc etchklout $identmtzgenfile $identgenprocess 1 1000 goeof-ip
pointlesspointless hklin $identmtz hklout $ident_pointlessmtz
aimlessaimless hklin $ident_pointlessmtz hklout $ident_aimless_partmtz ROGUES $identrogues ltlt eof-aimless Use all default options for aimlesseof-aimless
ctruncate hklin $ident_aimlessmtz hklout $ident_truncatemtz
Harry Powell Andrew Leslie and Owen Johnson
iMosflm Tutorial
fileUsersandrewg4MOSFLMnewgui_tutorialiMosflm_tutorial_720_ver3html[29052015 105311]
AIMLESS writes a file called ROGUES which lists reflections which show very poor agreement between symmetry mates or which areimplausibly large
Look in this file (it is ASCII) and try to work out why this has happened The ROGUES file gives you the image (Batch) on which thereflections have been recorded (for partials this is the image nearest the centre of the reflection so you may need to look on thepreceding and following image as well) Select a reflection which shows very poor agreement with its symmetry mates (A value greaterthan 10 in the DelIsd column in the ROGUES file)
Select the offending image by double-clicking it in the Images pane of the iMosflm main window Predict the reflections then enter thehkl values into the boxes and hit Return (or click the red warning button following the entry box for l) to locate the offending reflectionin the image You must give the measured indices - the first set of values in the ROGUES file - when doing this See if there is anythingodd about the spot Remember to check adjacent images for partials
193 How accurate does the unit cell have to be
Try changing the cell parameters by (say) 10 and integrate the images again What is the effect on the merging statistics
20 Tips1 When reading images into a session DO NOT attempt to carry out any other task until ALL the images have been read2 It is often worth repeating the indexing (usually only once) as the refined direct beam coordinates from the first indexing may give
an improved solution when the indexing is repeated (lower rmsd)3 Always integrate a few degrees of data before integrating the whole dataset (see sect9) If the space group is not known in advance
run Quicksymm with a few degrees of data to check that the correct indexing solution has been chosen4 For difficult images do not attempt to refine the unit cell initially once an indexing solution has been obtained try integrating a
few images to ensure that the integration is stable If then going on to refine the cell check that the prediction looks OK for thefirst image of every segment included in the refinement If it does not look very good consider using the pattern matching(Settings -gt Processing options -gt Advanced refinement see sect84)
5 If the resolution of the data is less than 35 Aring do not use the ldquoRefine Cellrdquo task Instead use several images in indexing and use thecell that comes from the indexing
6 If iMosflm gets into a state where the activity icon(upper right) is spinning but nothing seems to be happening click on the activityicon to stop it spinning and see if the session can be continued DO NOT click on the activity icon simply to abort a task this willgive unpredictable results Use the Abort button for cell refinement or integration There is no defined way to abort indexing
7 Use the image summation option (see sect4) to get a better impression of the diffraction for very low exposure Pilatus images8 Use image summation for detector parameter refinement for fine sliced very weak Pilatus images (Settings -gt Processing options -
gt Advanced refinement see sect821)9 For large mosaic spread values (gt 10deg) or small mosaic block sizes (lt10) consider increasing the maximum allowed reflection
width to avoid having too many green predicted reflections (Settings -gt Processing options -gt Advanced integration see sect97)10 By default on selecting the Indexing task iMosflm will find spots index and (assuming a solution has been found) estimate the
mosaicity For difficult cases it is more useful to restrict this to simply finding spots and then do the indexing and mosaicityestimation by clicking the appropriate buttons To do this change the check box Automatically index after spot finding inSettings -gt Processing options -gt Indexing
11 See sect521 and sect522 for advice if the indexing fails Also consider the possibility of a reversed phi rotation direction if you arenot familiar with the beamline (Settings -gt Experiment settings -gt Experiment see sect21)
12 If the detector parameters have refined to physically unreasonable values (eg because cell refinement or integration has beencarried out using an incorrect indexing solution) be sure to reset the detector parameters before attempting further processing(Settings -gt Experiment settings -gt Detector see sect21)
13 Always set the resolution limit slightly beyond the point at which any spots are visible (see sect414 ) For very weak fine-sliceddata it can be very difficult to estimate the resolution visually so integrate to the maximum resolution (inscribed circle) and usethe merging results to set the final resolution There should be no problems integrating to a resolution ~03-05 Aring beyond theactual resolution limit but for example integrating to 3 Aring when the true resolution limit is 5-6 Aring may cause problems and theintegration should then be repeated with a more realistic resolution limit
14 Use the site file sect141 if repeatedly processing data where the direct beam position is wrong or if the phi direction is reversed etcto save having to correct this for every session
Appendix IA command script for running MOSFLM using the keywords copied from the Batch processing window of the new GUI (see Integratingas a background job sect952) Note that keyworded input for MOSFLM and other CCP4 programs is case-insensitive apart from file anddirectory names
bincsh -fv Set a unique identifier for filenames for this job
set ident = x89_mos07_blk3_smallsep
iMosflm Tutorial
fileUsersandrewg4MOSFLMnewgui_tutorialiMosflm_tutorial_720_ver3html[29052015 105311]
$ipmosflm COORDS $identcoords SUMMARY $identsummary ltlt eof-ip Insert keywords copied from iMosflm batch window here
Keywords for this run For example could involve trying different values for mosaic spread or not integrating all images etc etchklout $identmtzgenfile $identgenprocess 1 1000 goeof-ip
pointlesspointless hklin $identmtz hklout $ident_pointlessmtz
aimlessaimless hklin $ident_pointlessmtz hklout $ident_aimless_partmtz ROGUES $identrogues ltlt eof-aimless Use all default options for aimlesseof-aimless
ctruncate hklin $ident_aimlessmtz hklout $ident_truncatemtz
Harry Powell Andrew Leslie and Owen Johnson
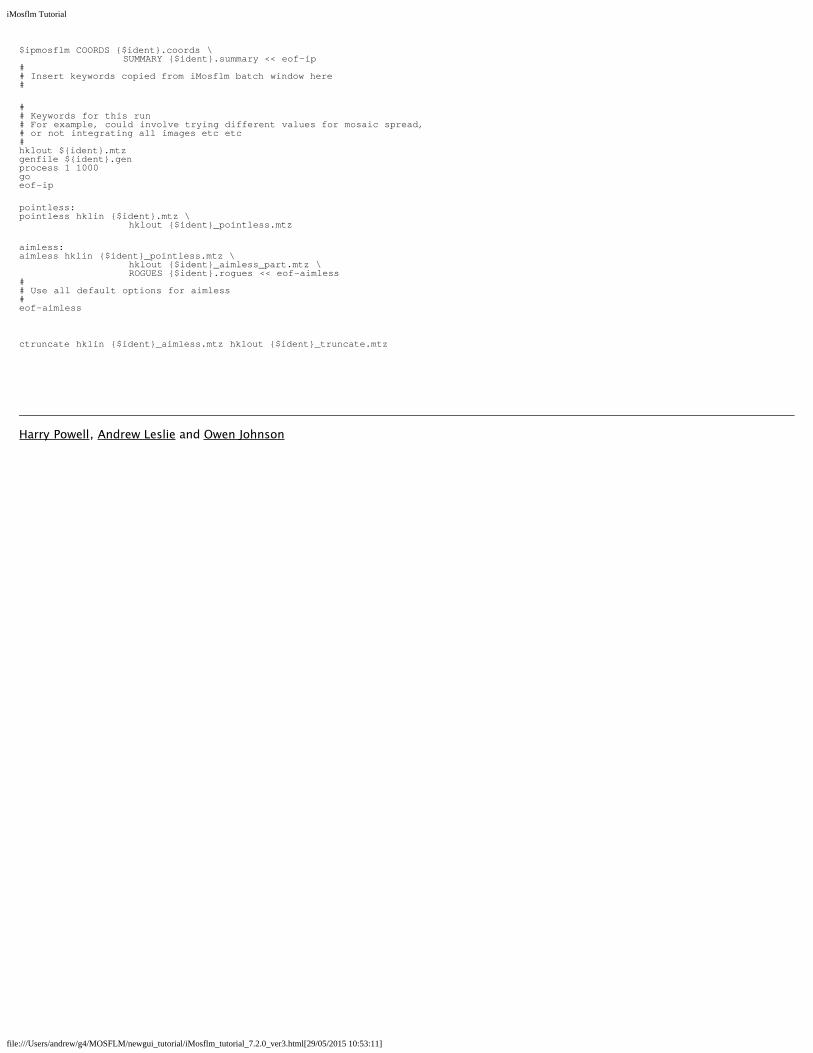