Embed Size (px)
Citation preview

For the year ended September 30, 2017
HAMAMATSU PHOTONICS K.K., Headquarters325-6, Sunayama-cho, Naka-ku, Hamamatsu City, Shizuoka Pref., 430-8587, JapanTelephone:(81)53-452-2141 Fax:(81)53-456-7889
HAMAMATSU PHOTONICS K.K. HAMAMATSU PHOTONICS K.K.www.hamamatsu.com
AnnualReport2017.indd 1 17/12/27 17:27
ANNUAL REPORT 2017For the year ended September 30, 2017
AnnualReport2017.indd 2 17/12/27 17:27

ANNUAL REPORT 2017For the year ended September 30, 2017
Table of contents FINANCIAL HIGHLIGHTS ..............................................................................2TO OUR SHAREHOLDERS ............................................................................4DIVISIONAL REVIEW .....................................................................................6RESEARCH & DEVELOPMENT .....................................................................8TOPICS ......................................................................................................... 10FINANCIAL REVIEW .................................................................................... 12FIVE-YEAR SUMMARY ................................................................................ 14CONSOLIDATED SUBSIDIARIES ................................................................ 14CONSOLIDATED BALANCE SHEET ........................................................... 15CONSOLIDATED STATEMENT OF INCOME ............................................... 17CONSOLIDATED STATEMENT OF COMPREHENSIVE INCOME .............. 17CONSOLIDATED STATEMENT OF CHANGES IN NET ASSETS ................ 18CONSOLIDATED STATEMENT OF CASH FLOWS ...................................... 19NOTES TO CONSOLIDATED FINANCIAL STATEMENTS ...........................20INDEPENDENT AUDITOR’S REPORT .........................................................29DIRECTORS AND AUDIT & SUPERVISORY BOARD MEMBERS ..............30CORPORATE DATA ...................................................................................... 31PROFILE OF THE HAMAMATSU FAMILY ...................................................32
1
AnnualReport2017.indd 1 17/12/27 17:27

FINANCIAL HIGHLIGHTS
(*) The U.S. dollar amounts above and elsewhere in this report represent translations, solely for the convenience of the reader, using the exchange rate of JPY 113 = US$ 1.
Net sales
0
20
40
60
80
100
140
120
(¥ billion)
Profit attributable toowners of parent
0
2
4
6
8
10
12
14
20
16
18
(¥ billion)
Return on assets,Return on equity
0
2
4
6
8
10
12(%) ROE ROA
13 14 15 16 17 13 14 15 16 17 13 14 15 16 17
Consolidated:
Millions of Japanese Yen
Thousands of U.S. Dollars (*)
2016 2017 2016 2017
Net sales....................................................................................... ¥ 121,852 ¥ 130,495 $ 1,078,336 $ 1,154,825 Operating income ......................................................................... 20,544 22,849 181,805 202,207 Profit before income taxes ............................................................ 20,080 23,570 177,705 208,588 Profit attributable to owners of parent........................................... 14,419 17,777 127,608 157,322
Total assets .................................................................................. 217,300 239,331 1,923,015 2,117,977 Net assets..................................................................................... 169,716 187,558 1,501,918 1,659,806
R & D expenses............................................................................ 11,873 11,776 105,074 104,214
Per share information (in Yen and U.S. Dollars)Earnings per share ................................................................ ¥ 90.23 ¥ 113.00 $ 0.79 $ 1.00 Cash dividends ....................................................................... ¥ 34.00 ¥ 34.00 $ 0.30 $ 0.30
2
AnnualReport2017.indd 2 17/12/27 17:27
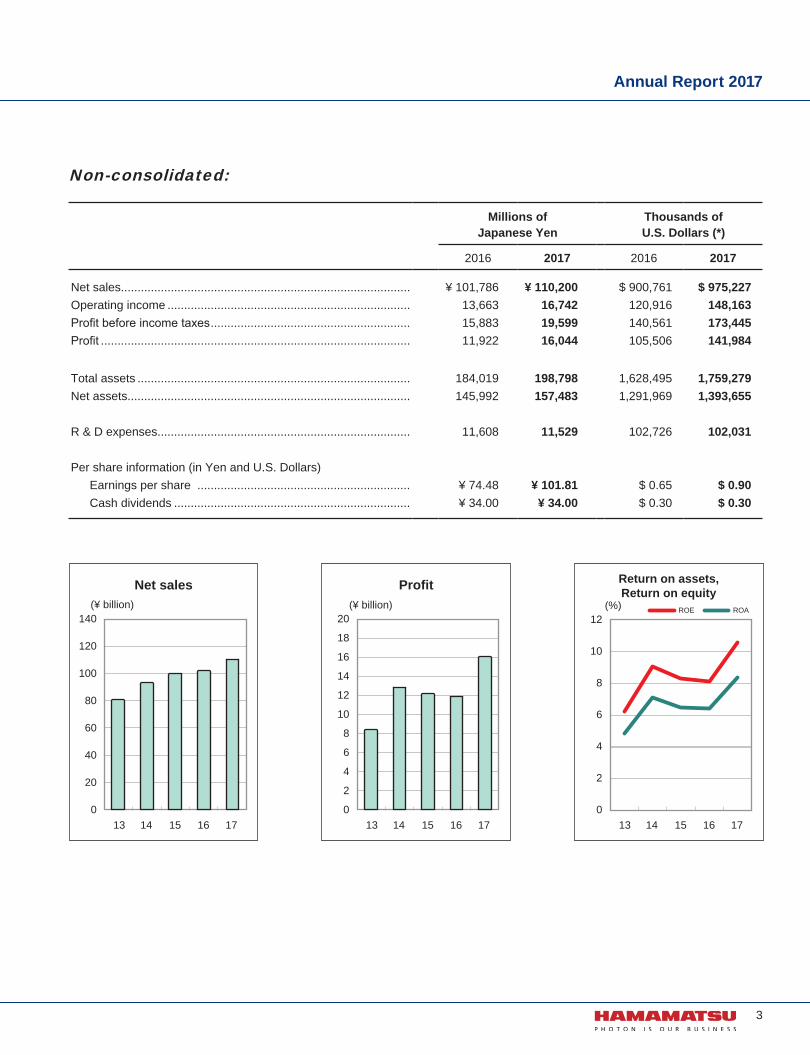
Non-consolidated:
Millions of Japanese Yen
Thousands of U.S. Dollars (*)
2016 2017 2016 2017
Net sales....................................................................................... ¥ 101,786 ¥ 110,200 $ 900,761 $ 975,227 Operating income ......................................................................... 13,663 16,742 120,916 148,163 Profit before income taxes ............................................................ 15,883 19,599 140,561 173,445 Profit ............................................................................................. 11,922 16,044 105,506 141,984
Total assets .................................................................................. 184,019 198,798 1,628,495 1,759,279 Net assets..................................................................................... 145,992 157,483 1,291,969 1,393,655
R & D expenses............................................................................ 11,608 11,529 102,726 102,031
Per share information (in Yen and U.S. Dollars)Earnings per share ................................................................ ¥ 74.48 ¥ 101.81 $ 0.65 $ 0.90 Cash dividends ....................................................................... ¥ 34.00 ¥ 34.00 $ 0.30 $ 0.30
Net sales
0
40
20
60
80
140
100
13 14 15 16 17
(¥ billion)
Profit
0
2
4
6
8
10
14
12
16
18
20
13 14 15 16 17 13 14 15 16 17
(¥ billion)
Return on assets,Return on equity
0
4
2
6
8
10
12(%) ROE ROA
120
3
Annual Report 2017
AnnualReport2017.indd 3 17/12/27 17:27
TO OUR SHAREHOLDERS
Dear Shareholders:
During the fiscal year ended September 30, 2017 (from
October 1, 2016 through September 30, 2017), Japan’s
economy generally maintained its recovery trajectory, despite
concerns that included the political instability in Europe and
the United States and elevated geopolitical risks in East Asia,
as movement toward a recovery in exports was evident, and
capital investment also exhibited modest growth as corporate
earnings improved.
Given these circumstances, our Group strove to expand
net sales and earnings by further improving the proprietary
photonics technologies we have cultivated over many years,
and continuing to make capital investments aimed at boosting
production capacity and enhancing product development
capabilities.
As a result, we closed the fiscal year 2017 with net sales of
JPY 130,495 million, up by JPY 8,643 million (7.1%), thanks to
higher domestic sales and overseas sales. From an earnings
perspective as well, operating income was JPY 22,849 million,
up by JPY 2,305 million (11.2%) from the previous year and
profit attributable to owners of parent was JPY 17,777 million,
up by JPY 3,357 million (23.3%) from the previous year.
4
AnnualReport2017.indd 4 17/12/27 17:27

Akira HirumaPresident and CEODecember 22, 2017
With regard to the business environment surrounding our Group, the economy fluctuated around a gradual recovery
trend, with an increase in capital investment against the backdrop of improved corporate earnings. Nevertheless, the
economic outlook remains to be lack of optimism by uncertain circumstances, including the future direction of the
economies of newly developing countries and the political trends in Europe and the United States.
Given such circumstances, the scope of application for the photonics technologies pursued by our Group can be
seen to be expanding on a worldwide scale, and these technologies have become a key enabling technology in the
manufacture of state-of-the-art devices in fields such as medicine and industry, improvements in performance, or new
technical innovations.
Since being established, the Company has honed the core technologies such as photodetectors that drive our business
growth, and has responded promptly and flexibly to changes and issues in the external environment. In sectors such
as the medical and industrial fields, where the pace of change is accelerating, expectations are high that photonics
technologies will lead to high-value-added products in the future as well, and our Company is being called upon to
possess ever greater capacity to meet these expectations. Together with further strengthening the Group’s domestic
and overseas organization to address this growing demand for photonics technologies, the Company will press forward
with aggressive research and development investment and capital investments aimed at broadening the scope of
application of new applications opened up by the evolution of elemental and photonics technologies.
As the Group, we will live up to our shareholders’ expectations, and contribute to the development of industry
and society, by expanding our business domain and creating a sustainable, stable and strong earnings organization
through the introduction of competitive, high-value-added products to the market, while never forgetting the venture
mentality from the Company’s conception.
We look forward to continuing to receive your unwavering support and encouragement in the future.
Sincerely,
5
Annual Report 2017
AnnualReport2017.indd 5 17/12/27 17:27
DIVISIONAL REVIEW
Electron Tube Division (Electron Tube Segment)
For over 60 years, Hamamatsu Photonics has developed and manufactured photomultiplier tubes (PMT). This technology continues to evolve today at the Electron Tube Division, one of the company’s primary manufacturing divisions. The Electron Tube Division also develops and manufactures a variety of products for use in medical applications, chemical analysis, measurement, industrial testing, and academic research. These products include PMT, electron multipliers, microchannel plates, image intensifiers, X-ray products, and a wide variety of light sources. In fiscal year 2017, sales of these products accounted for 37.4% of net sales.
Sales of PMT
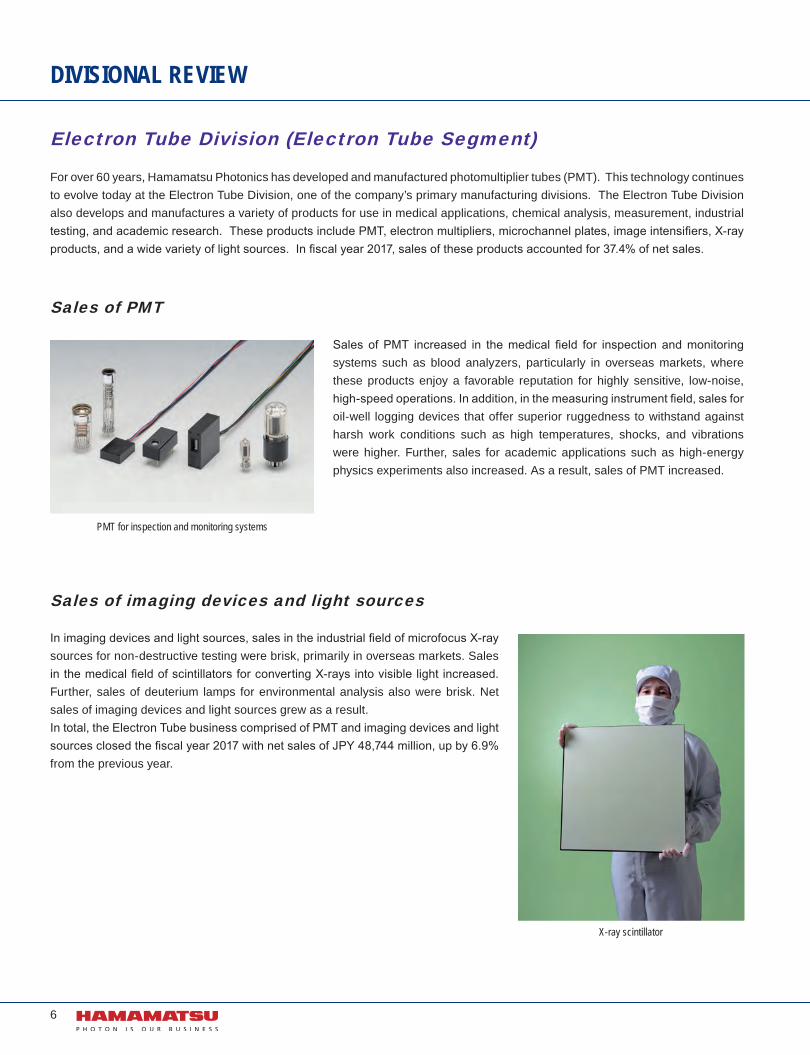
Sales of PMT increased in the medical field for inspection and monitoring systems such as blood analyzers, particularly in overseas markets, where these products enjoy a favorable reputation for highly sensitive, low-noise, high-speed operations. In addition, in the measuring instrument field, sales for oil-well logging devices that offer superior ruggedness to withstand against harsh work conditions such as high temperatures, shocks, and vibrations were higher. Further, sales for academic applications such as high-energy physics experiments also increased. As a result, sales of PMT increased.
Sales of imaging devices and light sources
In imaging devices and light sources, sales in the industrial field of microfocus X-ray sources for non-destructive testing were brisk, primarily in overseas markets. Sales in the medical field of scintillators for converting X-rays into visible light increased. Further, sales of deuterium lamps for environmental analysis also were brisk. Net sales of imaging devices and light sources grew as a result.In total, the Electron Tube business comprised of PMT and imaging devices and light sources closed the fiscal year 2017 with net sales of JPY 48,744 million, up by 6.9% from the previous year.
PMT for inspection and monitoring systems
X-ray scintillator
6
AnnualReport2017.indd 6 17/12/27 17:27

Solid State Division (Opto-semiconductor Segment)
The Solid State Division develops and manufactures opto-semiconductors for demanding applications in medical imaging, high-energy physics, and scientific measurement. Products from this division include silicon photodiodes, photo IC components, position sensitive detectors, infrared detectors, image sensors for low-light-level imaging and X-ray imaging, mini-spectrometers, and light emitting devices. In fiscal year 2017, sales of these products accounted for 46.4% of net sales.
Sales of opto-semiconductors
In opto-semiconductor devices, sales of flat panel sensors, which enjoy an excellent reputation for the high performance and superb quality, went up significantly, mainly in Europe and China, in conjunction with expansion of the dental equipment market. In the industrial field, sales of Photo ICs and LED increased mainly in domestic market in the FA (Factory Automation) sector for applications such as controls for industrial-use robots and other equipment, and sales of image sensors for semiconductor fabrication and inspection equipment turned in a strong performance as well. As a result, net sales of opto-semiconductors increased.In total, net sales for the Opto-semiconductor business were JPY 60,589 million, up by 9.0% from the previous year.
Systems Division (Imaging and Measurement Instruments Segment)
The Systems Division develops and manufactures a wide variety of cameras for scientific and industrial applications, as well as specialized instruments for use in fields such as pharmaceutical development, semiconductor manufacturing, X-ray nondestructive inspection, spectrophotometry, and optical communications. In fiscal year 2017, sales of these products accounted for 13.2% of net sales.
Sales of image processing and measurement systems
In the image processing and measurement systems, failure analysis systems for semiconductor devices were steady overseas, but domestic sales contracted, affected by constraints on semiconductor capital investment. However, sales of X-ray line sensor cameras rose strongly primarily for food inspection applications, partly due to the launch of new longer-life-type products. In addition, new products addressing customers’ needs for digital slide scanners in pathology also contributed to increased sales, particularly in Europe. As a result, net sales of image processing and measurement systems increased.As a result, net sales for the Imaging and Measurement Instruments business were JPY 17,214 million, up by 5.3% from the previous year.
Optical encoder modules using a combination of a photo IC and red LED, mainly used for factory automation applications
New digital slide scanner “NanoZoomer S60” for pathology research and diagnosis
7
Annual Report 2017
AnnualReport2017.indd 7 17/12/27 17:27
RESEARCH & DEVELOPMENT
With decades of accumulated expertise in the development of photonic technologies to rely upon, Hamamatsu Photonics conducts basic research to discover new knowledge and create new industries in the fields of biotechnology, medicine, information technology, communications, energy, materials, astronomy, and agriculture. We also strive to continuously develop exciting new products and enhance existing products with added functionality. In fiscal year 2017, funds allocated to research and development totaled JPY 11,776 million, a decrease of 0.8% over the previous fiscal year. Some highlights of our R&D efforts are presented here.
Basic research
Promoting basic research for ultrafast quantum simulators
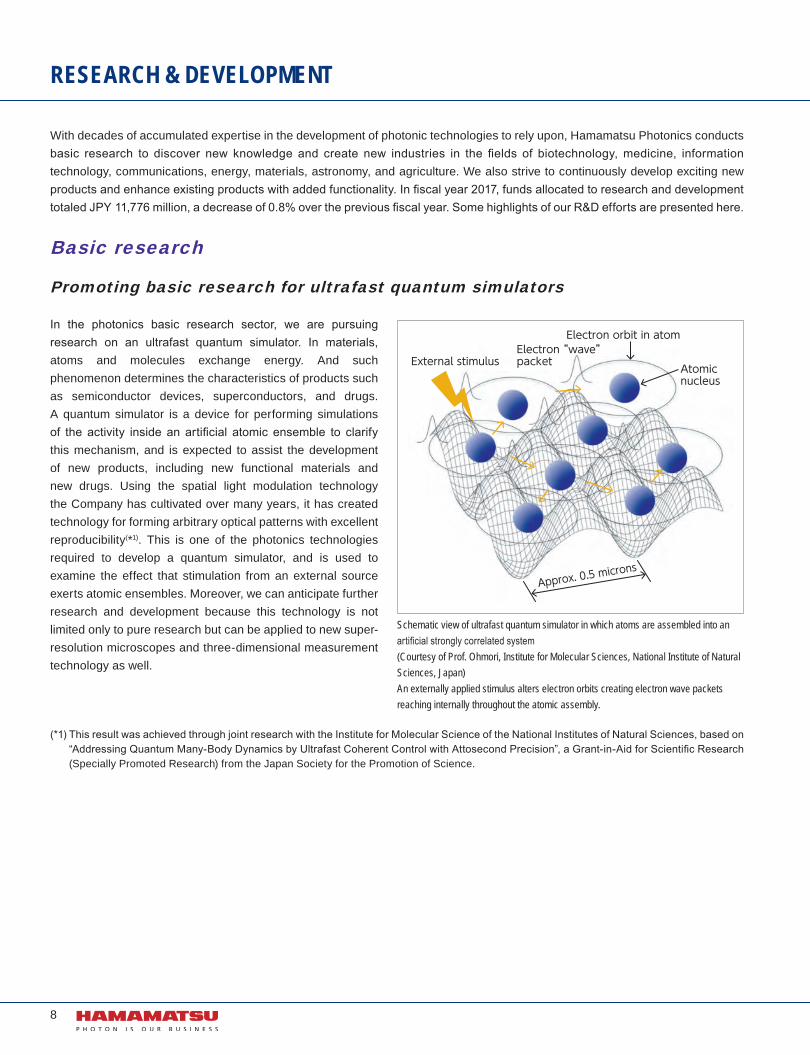
In the photonics basic research sector, we are pursuing research on an ultrafast quantum simulator. In materials, atoms and molecules exchange energy. And such phenomenon determines the characteristics of products such as semiconductor devices, superconductors, and drugs. A quantum simulator is a device for performing simulations of the activity inside an artificial atomic ensemble to clarify this mechanism, and is expected to assist the development of new products, including new functional materials and new drugs. Using the spatial light modulation technology the Company has cultivated over many years, it has created technology for forming arbitrary optical patterns with excellent reproducibility(*1). This is one of the photonics technologies required to develop a quantum simulator, and is used to examine the effect that stimulation from an external source exerts atomic ensembles. Moreover, we can anticipate further research and development because this technology is not limited only to pure research but can be applied to new super-resolution microscopes and three-dimensional measurement technology as well.
(*1) This result was achieved through joint research with the Institute for Molecular Science of the National Institutes of Natural Sciences, based on “Addressing Quantum Many-Body Dynamics by Ultrafast Coherent Control with Attosecond Precision”, a Grant-in-Aid for Scientific Research (Specially Promoted Research) from the Japan Society for the Promotion of Science.
Schematic view of ultrafast quantum simulator in which atoms are assembled into an artificial strongly correlated system(Courtesy of Prof. Ohmori, Institute for Molecular Sciences, National Institute of Natural Sciences, Japan)An externally applied stimulus alters electron orbits creating electron wave packets reaching internally throughout the atomic assembly.
Electron orbit in atom
Atomicnucleus
Electron “wave” packetExternal stimulus
Approx. 0.5 microns
8
AnnualReport2017.indd 8 17/12/27 17:27
Product development
World’s smallest high-voltage power supply module with high stability
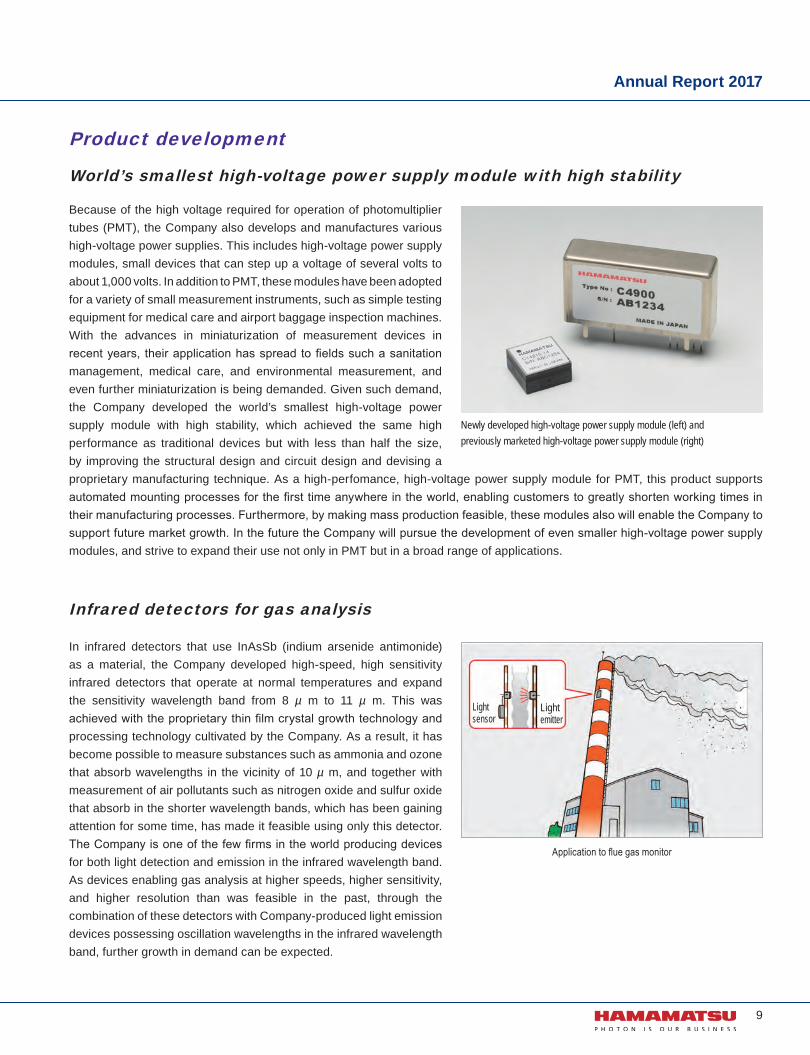
Because of the high voltage required for operation of photomultiplier tubes (PMT), the Company also develops and manufactures various high-voltage power supplies. This includes high-voltage power supply modules, small devices that can step up a voltage of several volts to about 1,000 volts. In addition to PMT, these modules have been adopted for a variety of small measurement instruments, such as simple testing equipment for medical care and airport baggage inspection machines. With the advances in miniaturization of measurement devices in recent years, their application has spread to fields such a sanitation management, medical care, and environmental measurement, and even further miniaturization is being demanded. Given such demand, the Company developed the world’s smallest high-voltage power supply module with high stability, which achieved the same high performance as traditional devices but with less than half the size, by improving the structural design and circuit design and devising a proprietary manufacturing technique. As a high-perfomance, high-voltage power supply module for PMT, this product supports automated mounting processes for the first time anywhere in the world, enabling customers to greatly shorten working times in their manufacturing processes. Furthermore, by making mass production feasible, these modules also will enable the Company to support future market growth. In the future the Company will pursue the development of even smaller high-voltage power supply modules, and strive to expand their use not only in PMT but in a broad range of applications.
Infrared detectors for gas analysis
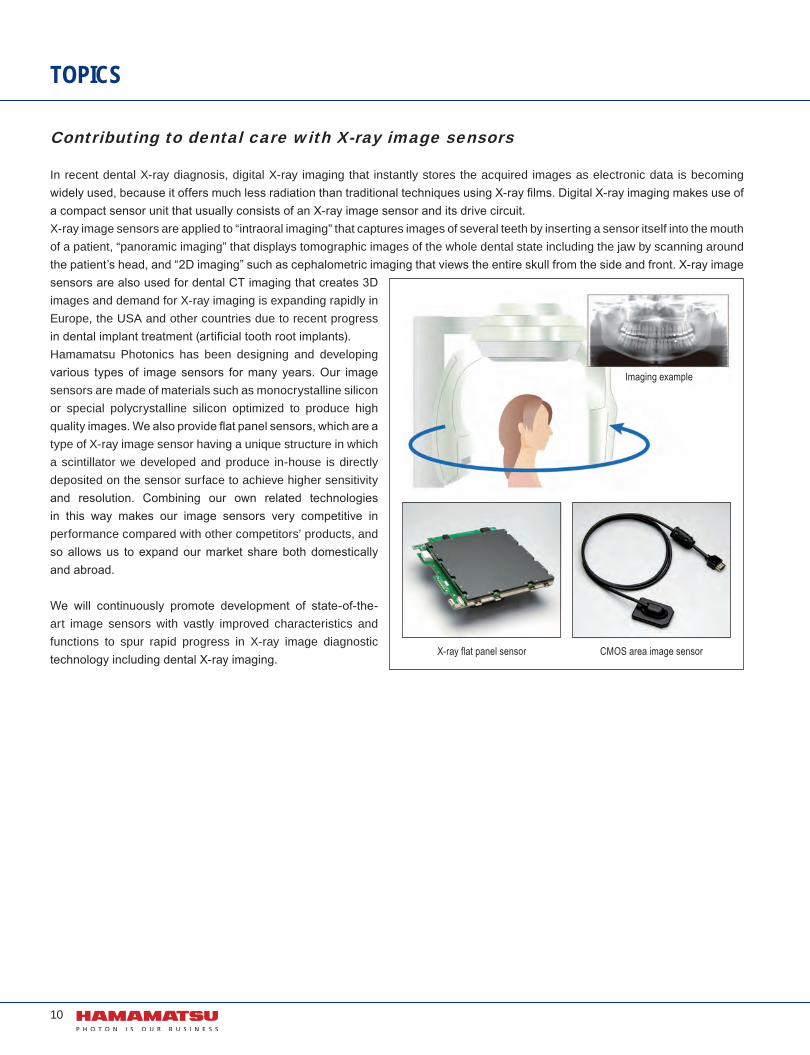
In infrared detectors that use InAsSb (indium arsenide antimonide) as a material, the Company developed high-speed, high sensitivity infrared detectors that operate at normal temperatures and expand the sensitivity wavelength band from 8 µ m to 11 µ m. This was achieved with the proprietary thin film crystal growth technology and processing technology cultivated by the Company. As a result, it has become possible to measure substances such as ammonia and ozone that absorb wavelengths in the vicinity of 10 µ m, and together with measurement of air pollutants such as nitrogen oxide and sulfur oxide that absorb in the shorter wavelength bands, which has been gaining attention for some time, has made it feasible using only this detector. The Company is one of the few firms in the world producing devices for both light detection and emission in the infrared wavelength band. As devices enabling gas analysis at higher speeds, higher sensitivity, and higher resolution than was feasible in the past, through the combination of these detectors with Company-produced light emission devices possessing oscillation wavelengths in the infrared wavelength band, further growth in demand can be expected.
Newly developed high-voltage power supply module (left) and previously marketed high-voltage power supply module (right)
Application to flue gas monitor
Lightsensor
Lightemitter
9
Annual Report 2017
AnnualReport2017.indd 9 18/01/05 16:21
Contributing to dental care with X-ray image sensors
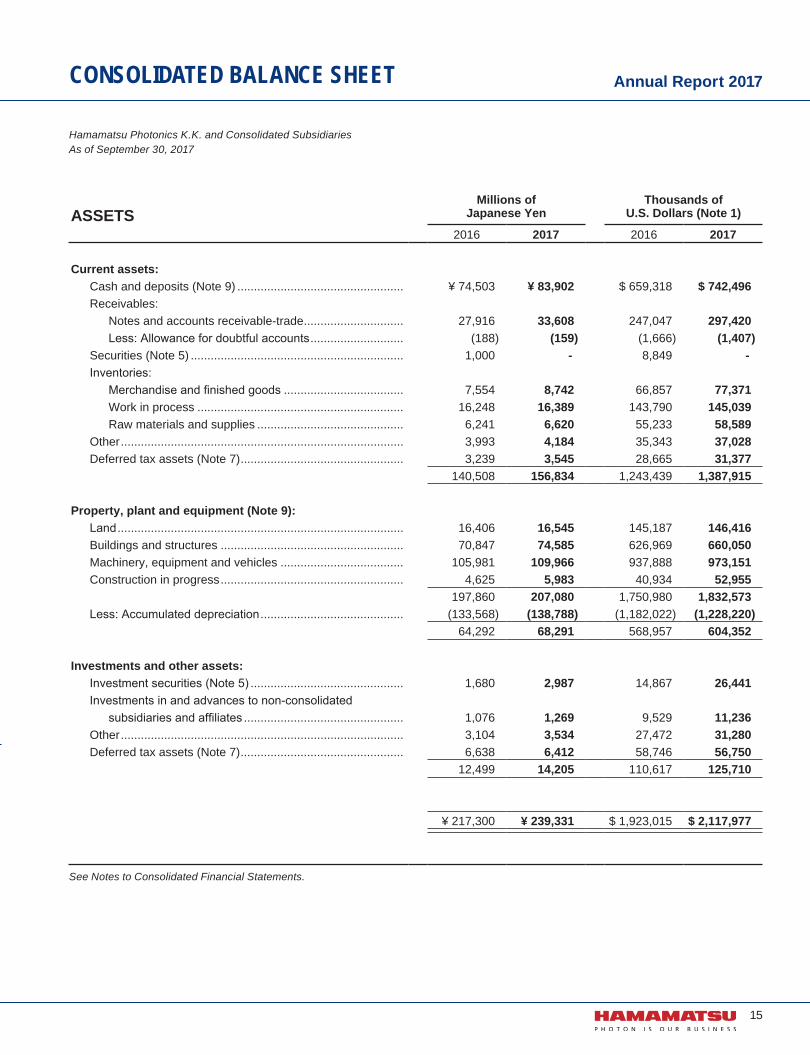
In recent dental X-ray diagnosis, digital X-ray imaging that instantly stores the acquired images as electronic data is becoming widely used, because it offers much less radiation than traditional techniques using X-ray films. Digital X-ray imaging makes use of a compact sensor unit that usually consists of an X-ray image sensor and its drive circuit.X-ray image sensors are applied to “intraoral imaging” that captures images of several teeth by inserting a sensor itself into the mouth of a patient, “panoramic imaging” that displays tomographic images of the whole dental state including the jaw by scanning around the patient’s head, and “2D imaging” such as cephalometric imaging that views the entire skull from the side and front. X-ray image sensors are also used for dental CT imaging that creates 3D images and demand for X-ray imaging is expanding rapidly in Europe, the USA and other countries due to recent progress in dental implant treatment (artificial tooth root implants).Hamamatsu Photonics has been designing and developing various types of image sensors for many years. Our image sensors are made of materials such as monocrystalline silicon or special polycrystalline silicon optimized to produce high quality images. We also provide flat panel sensors, which are a type of X-ray image sensor having a unique structure in which a scintillator we developed and produce in-house is directly deposited on the sensor surface to achieve higher sensitivity and resolution. Combining our own related technologies in this way makes our image sensors very competitive in performance compared with other competitors’ products, and so allows us to expand our market share both domestically and abroad.
We will continuously promote development of state-of-the-art image sensors with vastly improved characteristics and functions to spur rapid progress in X-ray image diagnostic technology including dental X-ray imaging.
TOPICS
X-ray flat panel sensor CMOS area image sensor
Imaging example
10
AnnualReport2017.indd 10 18/01/16 10:24

Our optical technology plays an active role in non-destructive inspection
Recently, the application of non-destructive inspection technology(*1) is becoming widespread year by year to include not only defect inspection of electronic parts and baggage inspection at airports, but also production line inspections in food processing plants due to increasing consumer awareness of food safety. We supply a diverse array of X-ray generator and sensor devices for the wide-ranging non-destructive inspection market. For example, our microfocus X-ray sources are capable of acquiring high-definition images and so are widely used for inspection of smartphones and lithium-ion batteries that are incorporating ever more sophisticated functions. Also, for security measures against terrorism that is a growing global threat, more and more baggage screening systems are becoming installed at airports and railway stations. Applying our semiconductor technology amassed over many years, we are developing products that meet diverse customer needs. In food inspection applications, X-ray line sensor cameras we developed by using the most of our advanced semiconductor sensor technology are widely used and highly rated by customers for their high speed and high sensitivity, showing a steady increase in sales. We promote the expanding non-destructive inspection market with our unique photonics technology while flexibly supporting customer needs and responding to changes in the environment around us, by merging our in-house technologies and applying existing technologies to new application fields.
(*1) Non-destructive inspection or testing is an inspection method for detecting defects and flaws in products by viewing their internal condition by way of the “light” transmitting through them, without physically affecting any item under inspection such as materials, components, or structural objects.
Signature to the “UN Global Compact”
Hamamatsu Photonics signed the UN Global Compact (UNGC) proposed by the United Nations and was registered as a member company on August 18, 2017.The companies and organizations who signed the UNGC will comply with the UNGC’s 10 principles in 4 fields including human rights, labor, environment, and anti-corruption and are making strong efforts to accomplish this.We encourage every employee to maintain high ethical standards and aim to contribute to both society and humanity and also to grow and develop as a trusted company by creating new industries through photonics technology. We will support the UNGC’s 10 principles as a global company to assist in developing a sustainable society.
Example using a microfocus X-ray source and a X-ray line sensor camera
MicrofocusX-ray source
X-ray line sensorcamera
Conveyor
11
Annual Report 2017
AnnualReport2017.indd 11 18/01/16 10:24

FINANCIAL REVIEW
Net salesDuring the fiscal year ended September 30, 2017 (from October 1, 2016 through September 30, 2017), nevertheless facing some difficulties such as geopolitical risk increasing in East Asia and political situations in the Western countries, Japan’s economy generally remained in a recovery trend as some export indexes showed recovery signs and corporate profitability is improved while capital investment gradually increases.In the context of these general situation, we closed the fiscal year 2017 with net sales of JPY 130,495 million (US$ 1,154,825 thousand), up by 7.1% from the previous year, thanks to higher sales in both of domestic and overseas business.Performance by segment, sales in the Electron Tube business comprised of Photomultiplier Tubes (PMT) and Imaging Devices and Light Sources amounted JPY 48,744 million (US$ 431,367 thousand), up by 6.9% from the previous year. Sales of Opto-semiconductor was JPY 60,589 million (US$ 536,189 thousand), up by 9.0% over the previous year. Sales of the Imaging and Measurement Instruments increased 5.3% to JPY 17,214 million (US$ 152,336 thousand). Net sales from other business, mainly semiconductor laser business, hotel operations and a business relating to the proprietary products of Beijing Hamamatsu Photon Techniques, Inc., which is a subsidiary in China, were JPY 3,947 million (US$ 34,931 thousand), down by 8.2% over last year.
Operating incomeCost of sales increased 8.0% or JPY 4,862 million (US$ 43,033 thousand) over the previous year to JPY 65,670 million (US$ 581,152 thousand). The cost of sales ratio weakened 0.4 points to 50.3% this year. Selling, general and administrative expenses were JPY 30,199 million (US$ 267,250 thousand), up by 5.5%, JPY 1,572 million (US$ 13,912 thousand). Research and development expenses were JPY 11,776 million (US$ 104,214 thousand), down by 0.8% from previous year. As a result, operating income was JPY 22,849 million (US$ 202,207 thousand), up by 11.2%. Operating income for Electron tube, Opto-semiconductor and Imaging and measurement instruments business segment was JPY 16,992 million (US$ 150,380 thousand), up by 10.8%, JPY 18,155 million (US$ 160,665 thousand), up by 12.5% and JPY 3,544 million (US$ 31,366 thousand), up by 0.2%, respectively. Other business recorded an operating income of JPY 281 million (US$ 2,488 thousand), down by 50.9%.
Profit attributable to owners of parentOther income, on net basis, was JPY 720 million (US$ 6,380 thousand), compared with JPY 463 million (US$ 4,100 thousand) net of other expenses for the previous year. Reflecting the previously cited factors, profit attributable to owners of parent for the fiscal year ended September 30, 2017 was up by 23.3% to JPY 17,777 million (US$ 157,322 thousand) from JPY 14,419 million (US$ 127,608 thousand). Consequently, earnings per share increased from JPY 90.23 (US$ 0.79) to JPY 113.00 (US$ 1.00). Dividend per share applicable to the fiscal year was JPY 34 (US$ 0.30).
Net sales
0
60
40
20
140
120
100
80
(¥ billion)
Operating income
02468
10121416182022
2624
(¥ billion)
Profit attributable toowners of parent
0
2
4
6
8
10
12
14
16
18
20(¥ billion)
15 16 17
15 16 17
15 16 17
12
AnnualReport2017.indd 12 18/01/16 10:24

Financial positionCurrent assets increased by JPY 16,325 million (US$ 144,475 thousand) from the year ended September 30, 2016. This mainly reflected an increase in cash and deposits of JPY 9,399 million (US$ 83,177 thousand), and an increase in notes and accounts receivable-trade of JPY 5,692 million (US$ 50,373 thousand), respectively. Non-current assets increased by JPY 5,705 million (US$ 50,487 thousand) from the year ended September 30, 2016, this was mainly from an increase in property, plant and equipment of JPY 3,999 million (US$ 35,394 thousand), that resulted from an increase in buildings and structures. Total assets at the fiscal year-end were JPY 239,331 million (US$ 2,117,977 thousand), up by JPY 22,030 million (US$ 194,962 thousand) from the year ended September 30, 2016. Current liabilities were up by JPY 8,182 million (US$ 72,412 thousand) from the prior fiscal year-end. Total current liabilities increased because of an increase in current portion of long-term loans payable of JPY 2,975 million (US$ 26,329 thousand) and an increase in income taxes payable of JPY 1,498 million (US$ 13,264 thousand), respectively. Non-current liabilities decreased by JPY 3,993 million (US$ 35,337 thousand) from the previous fiscal year-end, mainly due to a decrease in long-term loans payable of JPY 3,160 million (US$ 27,972 thousand).Net assets were JPY 187,558 million (US$ 1,659,806 thousand), up by JPY 17,841 million (US$ 157,888 thousand) from the previous fiscal year-end. This mainly reflected an increase in retained earnings of JPY 12,419 million (US$ 109,907 thousand) as a result of reporting profit attributable to owners of parent, and an increase of JPY 4,132 million (US$ 36,567 thousand) as a result of the foreign currency translation adjustment, respectively.
Cash flowsAt the end of this fiscal year, cash and cash equivalents stood at JPY 63,385 million (US$ 560,937 thousand), up by JPY 9,790 million (US$ 86,638 thousand) from the year ended September 30, 2016. Cash flows for the fiscal year ended September 30, 2017 (from October 1, 2016 through September 30, 2017) were as follows.Net cash provided by operating activities during the year was JPY 26,154 million (US$ 231,457 thousand), up by JPY 1,994 million (US$ 17,647 thousand) over the previous year. The increase is mainly generated from an increase in profit before income taxes in the previous fiscal year, and a decrease in income taxes paid, etc. Net cash used in investing activities was JPY 13,198 million (US$ 116,802 thousand), due mainly to expenditures in acquirement of fixed tangible assets, etc. This compares with net cash provided by investing activities in the previous fiscal year of JPY 4,186 million (US$ 37,051 thousand), increase in cancellation of time deposits for longer than three months, which are not counted as cash, in conjunction with the purchase of treasury shares.Net cash used in financing activities was JPY 5,707 million (US$ 50,505 thousand), down by JPY 9,706 million (US$ 85,896 thousand) from the previous year, due mainly to a decrease in expenditures for purchase of treasury shares.
Capital expendituresCapital expenditures during fiscal year 2017 totaled JPY 13,572 million (US$ 120,111 thousand), 45.7% or JPY 4,257 million (US$ 37,674 thousand) higher than previous fiscal year. Major investments were made in new facility for Opto-semiconductor production aimed at boosting the production. Investments were made in expanding and improving manufacturing, research and development facilities. There was no major sale or disposal of material fixed assets during this fiscal year.
R&D expenses(¥ billion)
Capital expenditures
(¥ billion)
Total assets/Net Assets
0
2
4
6
8
10
14
12
0
2
4
6
8
10
12
14
16
50
200
100
150
250(¥ billion)
15 16 17
15 16 17
15 16 17
Total assets Net assets
0
13
Annual Report 2017
AnnualReport2017.indd 13 18/01/16 10:24

FIVE-YEAR SUMMARY
Japan Koso Corporation Iwata City, Shizuoka Pref., Japan Takaoka Electronics Co., Ltd. Hamamatsu City, Shizuoka Pref., Japan Hamamatsu Electronic Press Co., Ltd. Iwata City, Shizuoka Pref., Japan Iwata Grand Hotel Inc. Iwata City, Shizuoka Pref., JapanAsia Hamamatsu Photonics (China) Co., Ltd. Beijing, China Hamamatsu Photonics Taiwan Co., Ltd. Hsinchu, Taiwan Beijing Hamamatsu Photon Techniques, Inc. Beijing, China Hamamatsu Photonics Scientific Instrument (Beijing) Co., Ltd. Beijing, China Hamamatsu Photonics Medical Technology (Lang Fang) Co., Ltd. Hebei, ChinaU.S.A. Photonics Management Corp. Bridgewater, New Jersey, U.S.A. Hamamatsu Corporation Bridgewater, New Jersey, U.S.A.Europe Hamamatsu Photonics Deutschland GmbH Herrsching, Germany Hamamatsu Photonics France S.A.R.L. Massy Cedex, France Hamamatsu Photonics Italia S.r.l. Arese, Italy Hamamatsu Photonics UK Limited Welwyn Garden City, United Kingdom Hamamatsu Photonics Norden AB Kista, Sweden Hamamatsu Photonics Europe GmbH Herrsching, Germany
Hamamatsu Photonics K.K. and Consolidated SubsidiariesYears ended September 30
Millions of Japanese Yen2013 2014 2015 2016 2017
For the year:Net sales ................................................................ ¥ 102,156 ¥ 112,092 ¥ 120,691 ¥ 121,852 ¥ 130,495 Operating income .................................................. 16,781 21,665 23,596 20,544 22,849 Profit before income taxes ..................................... 17,904 22,462 24,672 20,080 23,570 Profit attributable to owners of parent .................... 11,529 15,155 16,598 14,419 17,777
Capital expenditures .............................................. 9,184 15,499 14,338 9,315 13,572 Depreciation ........................................................... 7,769 7,396 8,561 9,888 9,441 R&D expenses ....................................................... 10,885 10,977 11,615 11,873 11,776
At year-end:Working capital ...................................................... ¥ 105,517 ¥ 106,901 ¥ 111,326 ¥ 108,631 ¥ 116,774 Total assets ........................................................... 198,278 215,412 226,179 217,300 239,331 Capital stock .......................................................... 34,928 34,928 34,928 34,928 34,928 Net assets .............................................................. 154,385 168,815 180,770 169,716 187,558
Number of shares issued (thousands) ................... 83,764 83,764 167,529 167,529 167,529 Number of employees ............................................ 4,415 4,420 4,482 4,592 4,683
Japanese YenPer share information:
Earnings per shareBasic ................................................................ ¥ 143.41 ¥ 94.26 ¥ 103.23 ¥ 90.23 ¥ 113.00 Diluted .............................................................. - - - - -
Cash dividends ...................................................... 50.00 55.00 49.00 34.00 34.00 Net assets .............................................................. 1,913.98 1,046.56 1,120.38 1,075.31 1,188.30
* Hamamatsu Photonics implemented a two-for-one stock split on April 1, 2015. Earnings per share has been calculated by assuming this stock split had been executed at the beginning of the fiscal year ended September 30, 2014.
PercentRatios:
Equity ratio ............................................................. 77.6 78.1 79.6 77.8 78.1 Return on net sales ................................................ 11.3 13.5 13.8 11.8 13.6 Return on assets .................................................... 5.9 7.3 7.5 6.5 7.8 Return on equity .................................................... 7.8 9.4 9.5 8.3 10.0
CONSOLIDATED SUBSIDIARIES
14
AnnualReport2017.indd 14 17/12/27 17:27
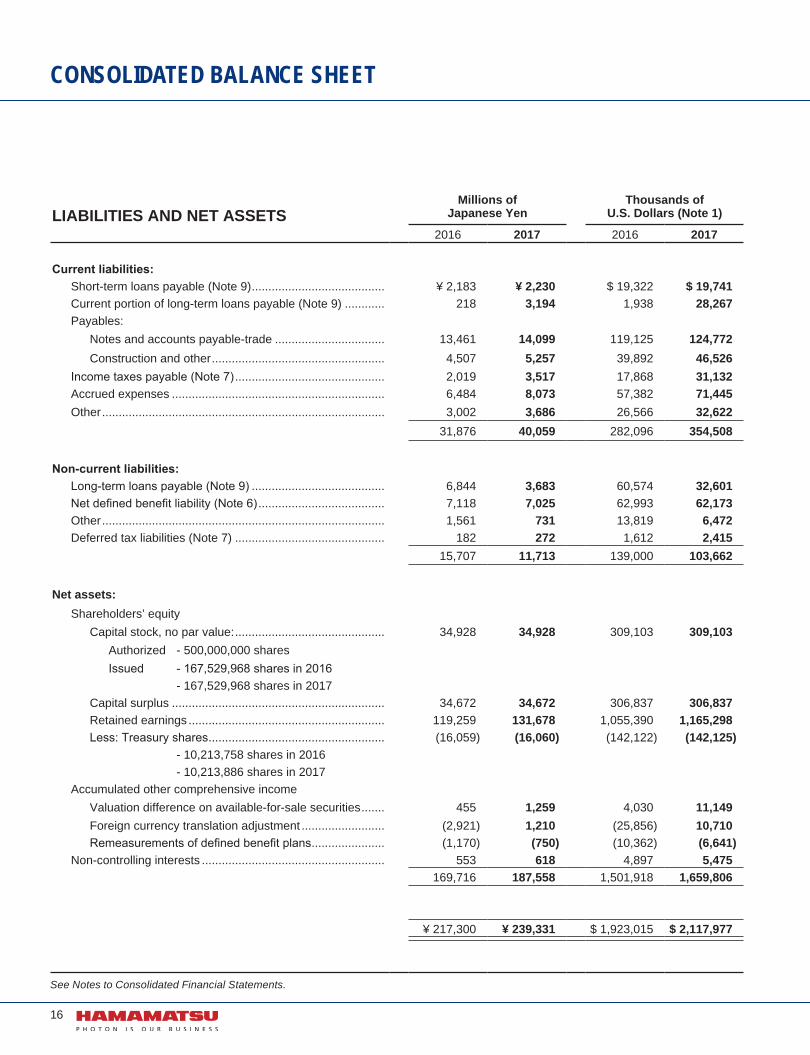
CONSOLIDATED BALANCE SHEET
Hamamatsu Photonics K.K. and Consolidated SubsidiariesAs of September 30, 2017
ASSETSMillions of
Japanese YenThousands of
U.S. Dollars (Note 1)
2016 2017 2016 2017
Current assets:Cash and deposits (Note 9) .................................................. ¥ 74,503 ¥ 83,902 $ 659,318 $ 742,496 Receivables:
Notes and accounts receivable-trade .............................. 27,916 33,608 247,047 297,420 Less: Allowance for doubtful accounts ............................ (188) (159) (1,666) (1,407)
Securities (Note 5) ................................................................ 1,000 - 8,849 -Inventories:
Merchandise and finished goods .................................... 7,554 8,742 66,857 77,371 Work in process .............................................................. 16,248 16,389 143,790 145,039 Raw materials and supplies ............................................ 6,241 6,620 55,233 58,589
Other ..................................................................................... 3,993 4,184 35,343 37,028 Deferred tax assets (Note 7) ................................................. 3,239 3,545 28,665 31,377
140,508 156,834 1,243,439 1,387,915
Property, plant and equipment (Note 9):Land ...................................................................................... 16,406 16,545 145,187 146,416 Buildings and structures ....................................................... 70,847 74,585 626,969 660,050 Machinery, equipment and vehicles ..................................... 105,981 109,966 937,888 973,151 Construction in progress ....................................................... 4,625 5,983 40,934 52,955
197,860 207,080 1,750,980 1,832,573 Less: Accumulated depreciation ........................................... (133,568) (138,788) (1,182,022) (1,228,220)
64,292 68,291 568,957 604,352
Investments and other assets:Investment securities (Note 5) .............................................. 1,680 2,987 14,867 26,441 Investments in and advances to non-consolidated
subsidiaries and affiliates ................................................ 1,076 1,269 9,529 11,236 Other ..................................................................................... 3,104 3,534 27,472 31,280 Deferred tax assets (Note 7) ................................................. 6,638 6,412 58,746 56,750
12,499 14,205 110,617 125,710
¥ 217,300 ¥ 239,331 $ 1,923,015 $ 2,117,977
See Notes to Consolidated Financial Statements.
15
Annual Report 2017
AnnualReport2017.indd 15 17/12/27 17:27
CONSOLIDATED BALANCE SHEET
LIABILITIES AND NET ASSETSMillions of
Japanese YenThousands of
U.S. Dollars (Note 1)
2016 2017 2016 2017
Current liabilities:Short-term loans payable (Note 9) ........................................ ¥ 2,183 ¥ 2,230 $ 19,322 $ 19,741 Current portion of long-term loans payable (Note 9) ............ 218 3,194 1,938 28,267 Payables:
Notes and accounts payable-trade ................................. 13,461 14,099 119,125 124,772 Construction and other .................................................... 4,507 5,257 39,892 46,526
Income taxes payable (Note 7) ............................................. 2,019 3,517 17,868 31,132 Accrued expenses ................................................................ 6,484 8,073 57,382 71,445 Other ..................................................................................... 3,002 3,686 26,566 32,622
31,876 40,059 282,096 354,508
Non-current liabilities:Long-term loans payable (Note 9) ........................................ 6,844 3,683 60,574 32,601 Net defined benefit liability (Note 6) ...................................... 7,118 7,025 62,993 62,173 Other ..................................................................................... 1,561 731 13,819 6,472 Deferred tax liabilities (Note 7) ............................................. 182 272 1,612 2,415
15,707 11,713 139,000 103,662
Net assets:Shareholders’ equity
Capital stock, no par value: ............................................. 34,928 34,928 309,103 309,103 Authorized - 500,000,000 sharesIssued - 167,529,968 shares in 2016
- 167,529,968 shares in 2017Capital surplus ................................................................ 34,672 34,672 306,837 306,837 Retained earnings ........................................................... 119,259 131,678 1,055,390 1,165,298 Less: Treasury shares ..................................................... (16,059) (16,060) (142,122) (142,125)
- 10,213,758 shares in 2016 - 10,213,886 shares in 2017
Accumulated other comprehensive incomeValuation difference on available-for-sale securities ....... 455 1,259 4,030 11,149 Foreign currency translation adjustment ......................... (2,921) 1,210 (25,856) 10,710 Remeasurements of defined benefit plans ...................... (1,170) (750) (10,362) (6,641)
Non-controlling interests ....................................................... 553 618 4,897 5,475 169,716 187,558 1,501,918 1,659,806
¥ 217,300 ¥ 239,331 $ 1,923,015 $ 2,117,977
See Notes to Consolidated Financial Statements.
16
AnnualReport2017.indd 16 17/12/27 17:27
CONSOLIDATED STATEMENT OF INCOME
Hamamatsu Photonics K.K. and Consolidated SubsidiariesYear ended September 30, 2017 Millions of
Japanese YenThousands of
U.S. Dollars (Note 1)
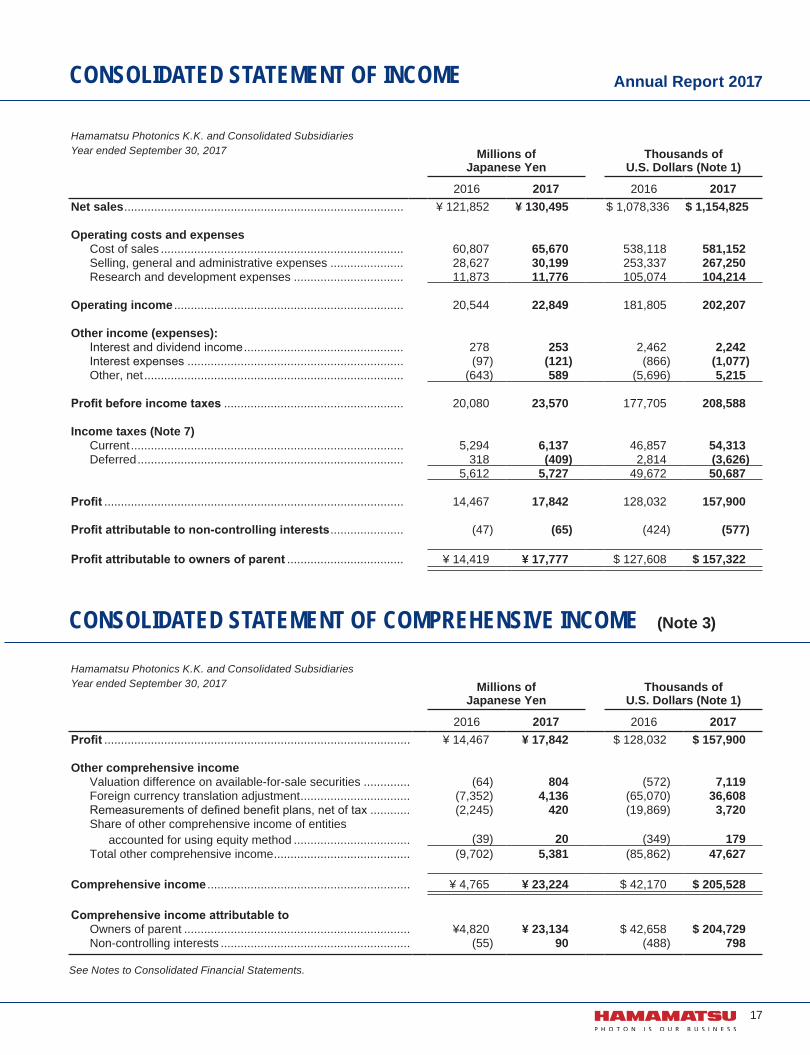
2016 2017 2016 2017Net sales .................................................................................... ¥ 121,852 ¥ 130,495 $ 1,078,336 $ 1,154,825
Operating costs and expensesCost of sales ......................................................................... 60,807 65,670 538,118 581,152 Selling, general and administrative expenses ...................... 28,627 30,199 253,337 267,250 Research and development expenses ................................. 11,873 11,776 105,074 104,214
Operating income ..................................................................... 20,544 22,849 181,805 202,207
Other income (expenses):Interest and dividend income ................................................ 278 253 2,462 2,242 Interest expenses ................................................................. (97) (121) (866) (1,077)Other, net .............................................................................. (643) 589 (5,696) 5,215
Profit before income taxes ...................................................... 20,080 23,570 177,705 208,588
Income taxes (Note 7)Current .................................................................................. 5,294 6,137 46,857 54,313 Deferred ................................................................................ 318 (409) 2,814 (3,626)
5,612 5,727 49,672 50,687
Profit .......................................................................................... 14,467 17,842 128,032 157,900
Profit attributable to non-controlling interests ...................... (47) (65) (424) (577)
Profit attributable to owners of parent ................................... ¥ 14,419 ¥ 17,777 $ 127,608 $ 157,322
CONSOLIDATED STATEMENT OF COMPREHENSIVE INCOME (Note 3)
Hamamatsu Photonics K.K. and Consolidated SubsidiariesYear ended September 30, 2017 Millions of
Japanese YenThousands of
U.S. Dollars (Note 1)
2016 2017 2016 2017Profit ............................................................................................ ¥ 14,467 ¥ 17,842 $ 128,032 $ 157,900
Other comprehensive incomeValuation difference on available-for-sale securities .............. (64) 804 (572) 7,119 Foreign currency translation adjustment ................................. (7,352) 4,136 (65,070) 36,608 Remeasurements of defined benefit plans, net of tax ............ (2,245) 420 (19,869) 3,720 Share of other comprehensive income of entities
accounted for using equity method ................................... (39) 20 (349) 179 Total other comprehensive income ......................................... (9,702) 5,381 (85,862) 47,627
Comprehensive income ............................................................. ¥ 4,765 ¥ 23,224 $ 42,170 $ 205,528
Comprehensive income attributable toOwners of parent .................................................................... ¥4,820 ¥ 23,134 $ 42,658 $ 204,729 Non-controlling interests ......................................................... (55) 90 (488) 798
See Notes to Consolidated Financial Statements.
17
Annual Report 2017
AnnualReport2017.indd 17 17/12/27 17:27
CONSOLIDATED STATEMENT OF CHANGES IN NET ASSETS
Hamamatsu Photonics K.K. and Consolidated SubsidiariesYear ended September 30, 2017
Millions ofJapanese Yen
Thousands ofU.S. Dollars (Note 1)
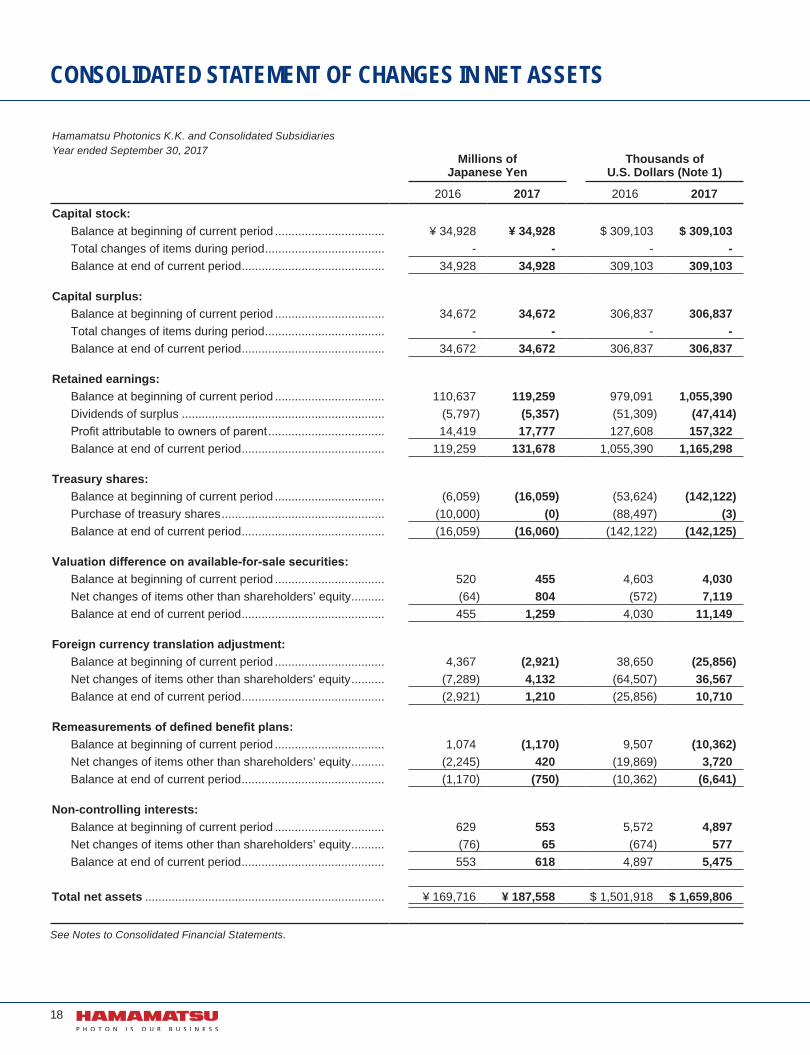
2016 2017 2016 2017Capital stock:
Balance at beginning of current period ................................. ¥ 34,928 ¥ 34,928 $ 309,103 $ 309,103 Total changes of items during period .................................... - - - -Balance at end of current period ........................................... 34,928 34,928 309,103 309,103
Capital surplus:Balance at beginning of current period ................................. 34,672 34,672 306,837 306,837 Total changes of items during period .................................... - - - -Balance at end of current period ........................................... 34,672 34,672 306,837 306,837
Retained earnings:Balance at beginning of current period ................................. 110,637 119,259 979,091 1,055,390 Dividends of surplus ............................................................. (5,797) (5,357) (51,309) (47,414)Profit attributable to owners of parent ................................... 14,419 17,777 127,608 157,322 Balance at end of current period ........................................... 119,259 131,678 1,055,390 1,165,298
Treasury shares:Balance at beginning of current period ................................. (6,059) (16,059) (53,624) (142,122)Purchase of treasury shares ................................................. (10,000) (0) (88,497) (3)Balance at end of current period ........................................... (16,059) (16,060) (142,122) (142,125)
Valuation difference on available-for-sale securities:Balance at beginning of current period ................................. 520 455 4,603 4,030 Net changes of items other than shareholders’ equity .......... (64) 804 (572) 7,119 Balance at end of current period ........................................... 455 1,259 4,030 11,149
Foreign currency translation adjustment:Balance at beginning of current period ................................. 4,367 (2,921) 38,650 (25,856)Net changes of items other than shareholders' equity .......... (7,289) 4,132 (64,507) 36,567 Balance at end of current period ........................................... (2,921) 1,210 (25,856) 10,710
Remeasurements of defined benefit plans:Balance at beginning of current period ................................. 1,074 (1,170) 9,507 (10,362)Net changes of items other than shareholders’ equity .......... (2,245) 420 (19,869) 3,720 Balance at end of current period ........................................... (1,170) (750) (10,362) (6,641)
Non-controlling interests:Balance at beginning of current period ................................. 629 553 5,572 4,897 Net changes of items other than shareholders’ equity .......... (76) 65 (674) 577 Balance at end of current period ........................................... 553 618 4,897 5,475
Total net assets ........................................................................ ¥ 169,716 ¥ 187,558 $ 1,501,918 $ 1,659,806
See Notes to Consolidated Financial Statements.
18
AnnualReport2017.indd 18 17/12/27 17:28

CONSOLIDATED STATEMENT OF CASH FLOWS
Hamamatsu Photonics K.K. and Consolidated SubsidiariesYear ended September 30, 2017
Millions ofJapanese Yen
Thousands ofU.S. Dollars (Note 1)
2016 2017 2016 2017
Cash flows from operating activities:Profit before income taxes ���������������������������������������������������������������� ¥ 20,080 ¥ 23,570 $ 177,705 $ 208,588 Depreciation �������������������������������������������������������������������������������������� 10,547 10,043 93,343 88,882 Increase (decrease) in allowance for doubtful accounts ������������������� 65 (45) 579 (398)Increase (decrease) in provision for bonuses ����������������������������������� 189 911 1,677 8,069 Increase (decrease) in net defined benefit liability ���������������������������� 2 468 22 4,148 Interest and dividend income ������������������������������������������������������������ (278) (253) (2,462) (2,242)Interest expenses ������������������������������������������������������������������������������ 97 121 866 1,077 Foreign exchange losses (gains) ������������������������������������������������������ 59 (26) 524 (235)Share of (profit) loss of entities accounted for using equity method ��� (57) (102) (506) (907)Loss on retirement of property, plant and equipment������������������������ 71 484 633 4,287Loss (gain) on sales of property, plant and equipment ��������������������� (27) (13) (242) (123)Decrease (increase) in notes and accounts receivable-trade ����������� (1,669) (4,106) (14,773) (36,340)Decrease (increase) in inventories ���������������������������������������������������� (2,369) (563) (20,965) (4,985)Increase (decrease) in notes and accounts payable-trade ��������������� 2,408 (994) 21,313 (8,803)Other, net ������������������������������������������������������������������������������������������ 812 1,193 7,194 10,565
Subtotal ��������������������������������������������������������������������������������������� 29,934 30,688 264,910 271,583 Interest and dividend income received���������������������������������������������� 280 247 2,479 2,193 Interest expenses paid ���������������������������������������������������������������������� (97) (121) (866) (1,077)Income taxes (paid) refund ��������������������������������������������������������������� (5,956) (4,660) (52,713) (41,242)Net cash provided by operating activities ������������������������������������������ 24,160 26,154 213,809 231,457
Cash flows from investing activities:Net decrease (increase) in time deposits ������������������������������������������ 14,936 590 132,183 5,222 Purchase of securities ����������������������������������������������������������������������� (1,000) - (8,849) -Proceeds from sales of securities ����������������������������������������������������� - 1,000 - 8,849Purchase of property, plant and equipment �������������������������������������� (9,144) (13,773) (80,921) (121,886)Proceeds from sales of property, plant and equipment��������������������� 47 31 419 276 Purchase of intangible assets ����������������������������������������������������������� (424) (741) (3,760) (6,565)Other, net ������������������������������������������������������������������������������������������ (228) (305) (2,020) (2,699)Net cash provided by (used in) investing activities ��������������������������� 4,186 (13,198) 37,051 (116,802)
Cash flows from financing activities:Net increase (decrease) in short-term loans payable ����������������������� 419 (29) 3,712 (258)Proceeds from long-term loans payable ������������������������������������������� 3,261 38 28,858 339 Repayments of long-term loans payable ������������������������������������������� (3,178) (224) (28,128) (1,983)Purchase of treasury shares ������������������������������������������������������������� (10,000) (0) (88,497) (3)Cash dividends paid �������������������������������������������������������������������������� (5,798) (5,359) (51,310) (47,431)Other, net ������������������������������������������������������������������������������������������ (117) (132) (1,036) (1,168)Net cash used in financing activities ������������������������������������������������� (15,413) (5,707) (136,401) (50,505)
Effect of exchange rate change on cash and cash equivalents ������� (4,894) 2,541 (43,312) 22,489 Net increase (decrease) in cash and cash equivalents ��������������������� 8,039 9,790 71,147 86,638 Cash and cash equivalents at beginning of period ���������������������������� 45,556 53,595 403,151 474,299 Cash and cash equivalents at end of period (Note 4) ������������������������ ¥ 53,595 ¥ 63,385 $ 474,299 $ 560,937
See Notes to Consolidated Financial Statements.
19
Annual Report 2017
AnnualReport2017.indd 19 18/01/18 17:21
NOTES TO CONSOLIDATED FINANCIAL STATEMENTS
(a) Principles of ConsolidationThe consolidated financial statements for the year ended September 30, 2016 and 2017 include the accounts of the Company and its 17 subsidiaries and its 3 affiliates are accounted for by the equity method. All significant intercompany balances and transactions have been eliminated in consolidation. The Company does not consolidate nor apply the equity method to subsidiaries whose total assets, net sales, profit(loss) and retained earnings are not significant to the consolidated financial statements.
(b) Cash and Cash Equivalents Cash and cash equivalents include cash on hand, readily available deposits and highly liquid investments with insignificant risk of changes in value, which have original maturities of three months or less.
(c) Investment SecuritiesMarketable securities are valued by market price method based on the fair market price at the balance sheet date (unrealized gain or loss, net of applicable income taxes, included directly in net assets) and non-marketable securities are stated at cost determined by the total average method.
(d) InventoriesInventories of the Company and consolidated subsidiaries are mainly stated at cost determined by the total average method or by reducing book value when the inventory profitability declines.
(e) Property, Plant and Equipment, and DepreciationProperty, plant and equipment are stated at cost. Significant renewals and additions are capitalized. Maintenance and repairs, including minor renewals and improvements, are charged to income as incurred. Interest expense relating to the construction of property, plant and equipment is not capitalized. Depreciation of property, plant and equipment is determined by the declining-balance method over the estimated useful lives of the individual assets for the Company and its domestic subsidiaries. The straight-line method over the estimated useful lives of the individual assets is primarily applied to the property, plant and equipment of foreign subsidiaries.
(f) Retirement BenefitsWhen calculating retirement benefit obligations, the Company applies the benefit formula method to attribute expected retirement benefits to the period until the end of the fiscal year. Prior service cost is amortized by the straight-line method over 10 years. Actuarial gain or loss is amortized by the straight-line method over 10 years from the following fiscal year.
(g) Foreign Currency TranslationMonetary assets and liabilities denominated in foreign currencies are translated into yen at the exchange rates in effect on the respective balance sheet dates and differences arising from the translation are included in the consolidated statement of income. Assets and liabilities accounts of foreign consolidated subsidiaries are translated into yen amounts at the exchange rates in effect at the each balance sheet date. Revenue and expense accounts of foreign consolidated subsidiaries are translated into yen amounts at average rates for the period for each fiscal year. Any resulting translation differences are included in Foreign currency translation adjustment and Non-controlling interests as a separate component of net assets.
(h) DerivativeThe Companies have entered into foreign forward contracts in order to manage the exposures to risk arising from fluctuations in foreign currency exchange rates. All derivative financial instruments are recognized as either assets or liabilities and measured at fair value with any changes in unrealized gain or loss recognized in the statements of income.
(i) Income TaxesDeferred income taxes are provided on the asset and liability method by which deferred tax assets and liabilities are recognized based on the temporary differences between the assets and liabilities for financial reporting and those for tax purpose, and are measured by applying currently enacted tax laws.
(j) Per share informationEarnings per share is computed based on the profit attributable to owners of parent available for distribution to the shareholders of common stock and the weighted average number of shares outstanding during the year. Cash dividends per share represent dividends declared as applicable to the respective periods.
2. Summary of Significant Accounting Policies
1. Basis of Presenting Consolidated Financial Statements
The accompanying consolidated financial statements of Hamamatsu Photonics K.K. (the “Company”) and consolidated subsidiaries are prepared on the basis of accounting principles generally accepted in Japan, which are different in certain respects as to application and disclosure requirements of International Financial Reporting Standards, and are compiled from the consolidated financial statements prepared by the Company as required by the Financial Instruments and Exchange Law of Japan. For convenience, the accompanying consolidated financial statements have been presented in U.S. dollars by arithmetically translating all Japanese yen amounts at JPY 113 = US$ 1, the exchange rate prevailing on September 30, 2017. The translations should not be construed as a representation that Japanese
yen have been, could have been, or could in the future be, converted into U.S. dollars at that or any other rate.In preparing the consolidated financial statements, certain rearrangements and reclassifications have been made and certain additional financial information has been included in the consolidated financial statements issued in Japan for the convenience of readers outside Japan. Amount less than one million yen and one thousand dollars have been omitted. As a result, the total in Japanese yen and U.S. dollars shown in the consolidated financial statements do not necessarily agree with the individual amounts.
20
AnnualReport2017.indd 20 18/01/18 17:21

3. Other Comprehensive IncomeReclassification adjustments and income tax effect allocated to each component of other comprehensive income for the years ended September 30, 2016 and 2017 were as follows:
Millions of Japanese Yen
Thousands of U.S. Dollars
2016 2017 2016 2017Valuation difference on available-for-sale securities:
Amount arising during the year �������������������������������������������������������������� ¥ (99) ¥ 1,071 $ (877) $ 9,482 Amount before income tax effect ����������������������������������������������������� (99) 1,071 (877) 9,482 Income tax effect ����������������������������������������������������������������������������� 34 (267) 304 (2,363)Valuation difference on available-for-sale securities ����������������������� (64) 804 (572) 7,119
Foreign currency translation adjustment:Amount arising during the year �������������������������������������������������������������� (7,352) 4,136 (65,070) 36,608
Foreign currency translation adjustment ������������������������������������������ (7,352) 4,136 (65,070) 36,608 Remeasurements of defined benefit plans:
Amount arising during the year �������������������������������������������������������������� (3,057) 402 (27,059) 3,562 Reclassification adjustments ������������������������������������������������������������������ (161) 198 (1,432) 1,755
Amount before income tax effect ����������������������������������������������������� (3,219) 600 (28,492) 5,317 Income tax effect ����������������������������������������������������������������������������� 974 (180) 8,622 (1,597)Remeasurements of defined benefit plans �������������������������������������� (2,245) 420 (19,869) 3,720
Share of other comprehensive income of entities accounted for using equity method:
Amount arising during the year �������������������������������������������������������������� (39) 20 (349) 179 Total other comprehensive income ���������������������������������������������������������� ¥ (9,702) ¥ 5,381 $ (85,862) $ 47,627
4. Supplementary Cash Flow InformationCash and cash equivalents in the consolidated statement of cash flows for years ended September 30,2016 and 2017 were reconciled to cash and deposits in the consolidated balance sheet as follows:
Millions of Japanese Yen
Thousands of U.S. Dollars
2016 2017 2016 2017Cash and deposits ��������������������������������������������������������������������������������� ¥ 74,503 ¥ 83,902 $ 659,318 $ 742,496 Time deposits with maturities of more than three months ���������������������� (20,907) (20,516) (185,019) (181,558)Cash and cash equivalents �������������������������������������������������������������������� ¥ 53,595 ¥ 63,385 $ 474,299 $ 560,937
5. Investment SecuritiesInformation regarding the marketable securities classified as other securities as of September 30, 2016 and 2017 were as follows:
Millions of Japanese Yen Thousands of U�S� Dollars2016 2016
Carrying amount Cost Unrealized
gainUnrealized
lossCarrying amount Cost Unrealized
gainUnrealized
lossEquity securities ¥ 1,388 ¥ 911 ¥ 483 ¥ (6) $ 12,288 $ 8,064 $ 4,279 $ (56)Other 1,000 1,000 - - 8,849 8,849 - -
¥ 2,388 ¥ 1,911 ¥ 483 ¥ (6) $ 21,137 $ 16,914 $ 4,279 $ (56)
Millions of Japanese Yen Thousands of U.S. Dollars2017 2017
Carrying amount Cost Unrealized
gainUnrealized
lossCarrying amount Cost Unrealized
gainUnrealized
lossEquity securities ¥ 2,460 ¥ 911 ¥ 1,548 - $ 21,770 $ 8,064 $ 13,705 -Other - - - - - - - -
¥ 2,460 ¥ 911 ¥ 1,548 - $ 21,770 $ 8,064 $ 13,705 -
21
Annual Report 2017
AnnualReport2017.indd 21 18/01/05 16:21
NOTES TO CONSOLIDATED FINANCIAL STATEMENTS
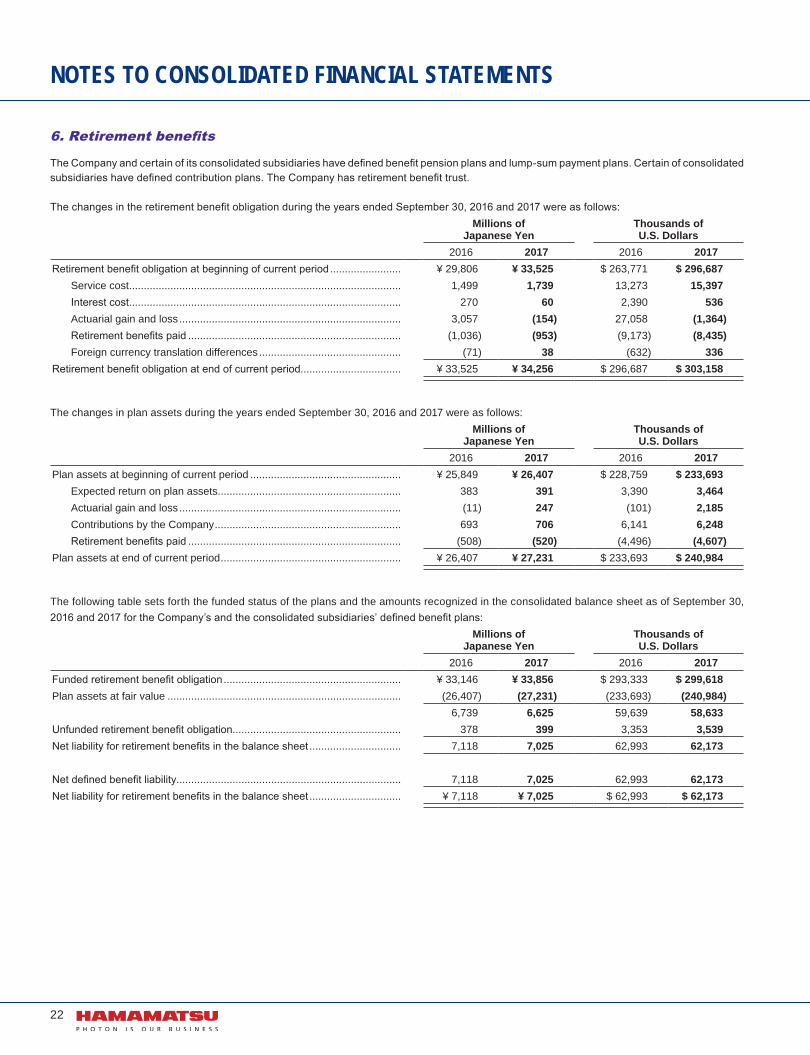
6. Retirement benefits
The Company and certain of its consolidated subsidiaries have defined benefit pension plans and lump-sum payment plans. Certain of consolidated subsidiaries have defined contribution plans. The Company has retirement benefit trust.
The changes in the retirement benefit obligation during the years ended September 30, 2016 and 2017 were as follows:Millions of
Japanese YenThousands of U.S. Dollars
2016 2017 2016 2017Retirement benefit obligation at beginning of current period ........................ ¥ 29,806 ¥ 33,525 $ 263,771 $ 296,687
Service cost ............................................................................................ 1,499 1,739 13,273 15,397 Interest cost ............................................................................................ 270 60 2,390 536 Actuarial gain and loss ........................................................................... 3,057 (154) 27,058 (1,364)Retirement benefits paid ........................................................................ (1,036) (953) (9,173) (8,435)Foreign currency translation differences ................................................ (71) 38 (632) 336
Retirement benefit obligation at end of current period.................................. ¥ 33,525 ¥ 34,256 $ 296,687 $ 303,158
The changes in plan assets during the years ended September 30, 2016 and 2017 were as follows:Millions of
Japanese YenThousands of U.S. Dollars
2016 2017 2016 2017Plan assets at beginning of current period ................................................... ¥ 25,849 ¥ 26,407 $ 228,759 $ 233,693
Expected return on plan assets .............................................................. 383 391 3,390 3,464 Actuarial gain and loss ........................................................................... (11) 247 (101) 2,185Contributions by the Company ............................................................... 693 706 6,141 6,248 Retirement benefits paid ........................................................................ (508) (520) (4,496) (4,607)
Plan assets at end of current period ............................................................. ¥ 26,407 ¥ 27,231 $ 233,693 $ 240,984
The following table sets forth the funded status of the plans and the amounts recognized in the consolidated balance sheet as of September 30, 2016 and 2017 for the Company’s and the consolidated subsidiaries’ defined benefit plans:
Millions of Japanese Yen
Thousands of U.S. Dollars
2016 2017 2016 2017Funded retirement benefit obligation ............................................................ ¥ 33,146 ¥ 33,856 $ 293,333 $ 299,618 Plan assets at fair value ............................................................................... (26,407) (27,231) (233,693) (240,984)
6,739 6,625 59,639 58,633 Unfunded retirement benefit obligation......................................................... 378 399 3,353 3,539 Net liability for retirement benefits in the balance sheet ............................... 7,118 7,025 62,993 62,173
Net defined benefit liability............................................................................ 7,118 7,025 62,993 62,173 Net liability for retirement benefits in the balance sheet ............................... ¥ 7,118 ¥ 7,025 $ 62,993 $ 62,173
22
AnnualReport2017.indd 22 17/12/27 17:28

The components of retirement benefit expense for the years ended September 30, 2016 and 2017 were as follows:Millions of
Japanese YenThousands of U.S. Dollars
2016 2017 2016 2017Service cost .................................................................................................. ¥ 1,499 ¥ 1,739 $ 13,273 $ 15,397 Interest cost .................................................................................................. 270 60 2,390 536 Expected return on plan assets .................................................................... (383) (391) (3,390) (3,464)Amortization of actuarial gain and loss ......................................................... (75) 284 (667) 2,520 Amortization of prior service cost ................................................................. (86) (86) (765) (765)Retirement benefit expense.......................................................................... ¥ 1,224 ¥ 1,607 $ 10,840 $ 14,224
Prior service cost and actuarial gain and loss included in other comprehensive income (before tax effect) for the years ended September 30, 2016 and 2017 were as follows:
Millions of Japanese Yen
Thousands of U.S. Dollars
2016 2017 2016 2017Prior service cost .......................................................................................... ¥86 ¥86 $765 $765 Actuarial gain and loss ................................................................................. 3,144 (685) 27,827 (6,070)Other............................................................................................................. (11) (1) (99) (12)Total.............................................................................................................. ¥3,219 ¥(600) $28,492 $(5,317)
Unrecognized prior service cost and unrecognized actuarial gain and loss included in accumulated other comprehensive income (before tax effect) as of September 30, 2016 and 2017 were as follows:
Millions of Japanese Yen
Thousands of U.S. Dollars
2016 2017 2016 2017Unrecognized prior service cost ................................................................... ¥ (345) ¥ (259) $ (3,061) $ (2,295)Unrecognized actuarial gain and loss........................................................... 2,023 1,336 17,906 11,823 Total.............................................................................................................. ¥ 1,677 ¥ 1,076 $ 14,845 $ 9,527
The fair value of plan assets, by major category, as a percentage of total plan assets as of September 30, 2016 and 2017 were as follows:2016 2017
Bonds ........................................................................................................... 56% 48%General accounts at life insurance companies ............................................. 26 26Stocks ........................................................................................................... 12 11Other............................................................................................................. 6 15Total.............................................................................................................. 100% 100%
The expected return on assets has been estimated based on anticipated allocation to each asset class and the expected long-term returns on assets held in each category.
The assumptions used in accounting for the above plans were as follows:2016 2017
Discount rate ................................................................................................ 0.2% 0.2%Expected rates of return on plan assets ....................................................... Principally 2.0% Principally 2.0%Estimated rate of salary increase ................................................................. 2.9% 2.9%
The amount paid to the defined contribution plans for the years ended September 30, 2016 and 2017 were ¥483 million (US$ 4,280 thousand) and ¥514 million (US$ 4,554 thousand), respectively.
23
Annual Report 2017
AnnualReport2017.indd 23 17/12/27 17:28
NOTES TO CONSOLIDATED FINANCIAL STATEMENTS
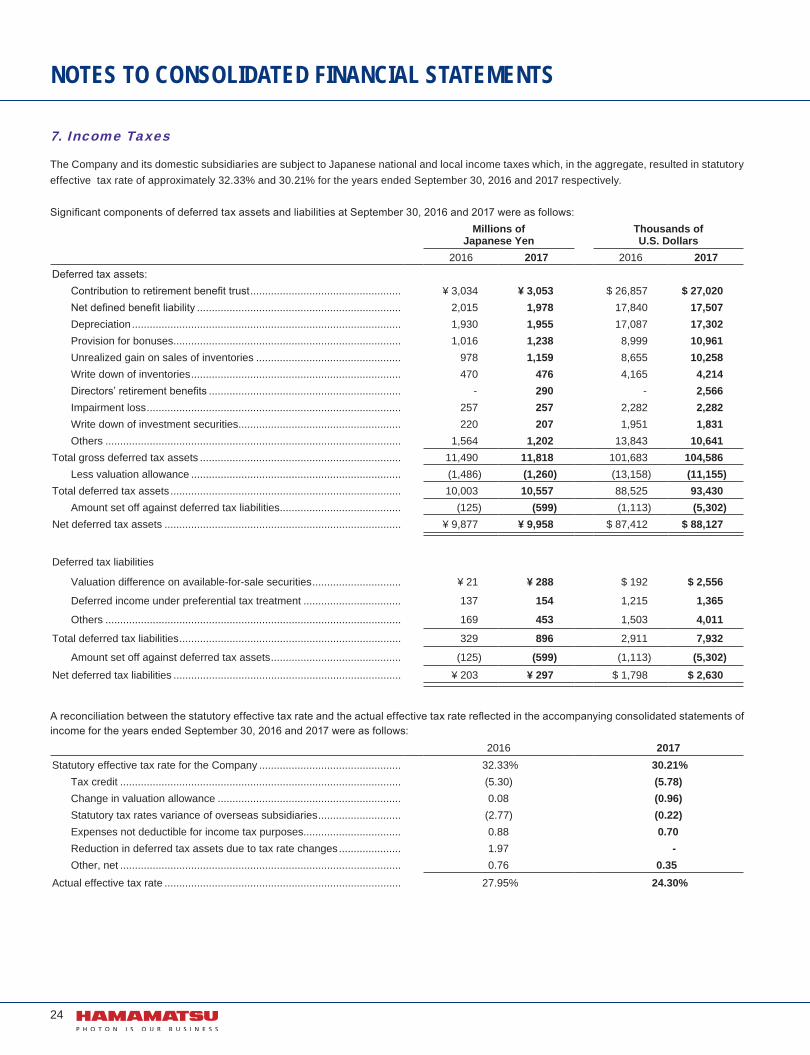
7. Income Taxes
The Company and its domestic subsidiaries are subject to Japanese national and local income taxes which, in the aggregate, resulted in statutory effective tax rate of approximately 32.33% and 30.21% for the years ended September 30, 2016 and 2017 respectively.
Significant components of deferred tax assets and liabilities at September 30, 2016 and 2017 were as follows:Millions of
Japanese YenThousands of U.S. Dollars
2016 2017 2016 2017Deferred tax assets:
Contribution to retirement benefit trust ................................................... ¥ 3,034 ¥ 3,053 $ 26,857 $ 27,020 Net defined benefit liability ..................................................................... 2,015 1,978 17,840 17,507 Depreciation ........................................................................................... 1,930 1,955 17,087 17,302 Provision for bonuses ............................................................................. 1,016 1,238 8,999 10,961 Unrealized gain on sales of inventories ................................................. 978 1,159 8,655 10,258 Write down of inventories ....................................................................... 470 476 4,165 4,214 Directors’ retirement benefits ................................................................. - 290 - 2,566 Impairment loss ...................................................................................... 257 257 2,282 2,282 Write down of investment securities ....................................................... 220 207 1,951 1,831 Others .................................................................................................... 1,564 1,202 13,843 10,641
Total gross deferred tax assets .................................................................... 11,490 11,818 101,683 104,586Less valuation allowance ....................................................................... (1,486) (1,260) (13,158) (11,155)
Total deferred tax assets .............................................................................. 10,003 10,557 88,525 93,430 Amount set off against deferred tax liabilities......................................... (125) (599) (1,113) (5,302)
Net deferred tax assets ................................................................................ ¥ 9,877 ¥ 9,958 $ 87,412 $ 88,127
Deferred tax liabilities
Valuation difference on available-for-sale securities .............................. ¥ 21 ¥ 288 $ 192 $ 2,556
Deferred income under preferential tax treatment ................................. 137 154 1,215 1,365
Others .................................................................................................... 169 453 1,503 4,011
Total deferred tax liabilities ........................................................................... 329 896 2,911 7,932
Amount set off against deferred tax assets ............................................ (125) (599) (1,113) (5,302)Net deferred tax liabilities ............................................................................. ¥ 203 ¥ 297 $ 1,798 $ 2,630
A reconciliation between the statutory effective tax rate and the actual effective tax rate reflected in the accompanying consolidated statements of income for the years ended September 30, 2016 and 2017 were as follows:
2016 2017Statutory effective tax rate for the Company ................................................ 32.33% 30.21%
Tax credit ............................................................................................... (5.30) (5.78)Change in valuation allowance .............................................................. 0.08 (0.96)Statutory tax rates variance of overseas subsidiaries ............................ (2.77) (0.22)Expenses not deductible for income tax purposes................................. 0.88 0.70Reduction in deferred tax assets due to tax rate changes ..................... 1.97 -Other, net ............................................................................................... 0.76 0.35
Actual effective tax rate ................................................................................ 27.95% 24.30%
24
AnnualReport2017.indd 24 18/01/16 10:25
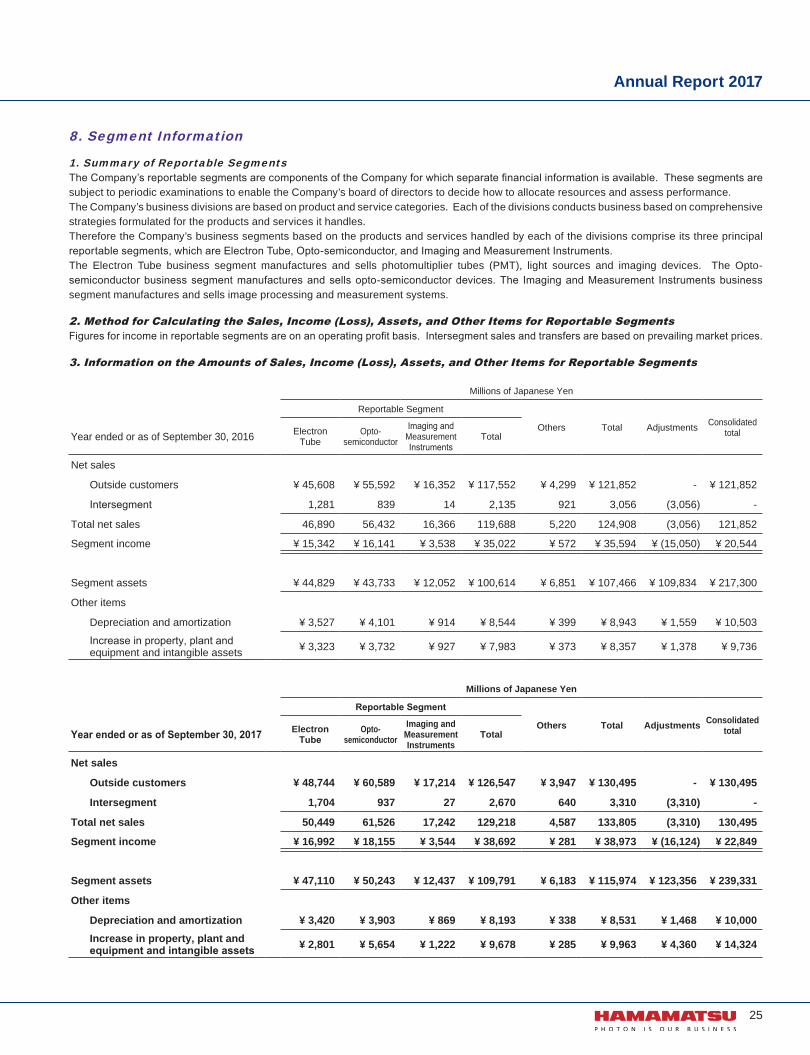
8. Segment Information
1. Summary of Reportable SegmentsThe Company’s reportable segments are components of the Company for which separate financial information is available. These segments are subject to periodic examinations to enable the Company’s board of directors to decide how to allocate resources and assess performance.The Company’s business divisions are based on product and service categories. Each of the divisions conducts business based on comprehensive strategies formulated for the products and services it handles.Therefore the Company’s business segments based on the products and services handled by each of the divisions comprise its three principal reportable segments, which are Electron Tube, Opto-semiconductor, and Imaging and Measurement Instruments.The Electron Tube business segment manufactures and sells photomultiplier tubes (PMT), light sources and imaging devices. The Opto-semiconductor business segment manufactures and sells opto-semiconductor devices. The Imaging and Measurement Instruments business segment manufactures and sells image processing and measurement systems.
2. Method for Calculating the Sales, Income (Loss), Assets, and Other Items for Reportable SegmentsFigures for income in reportable segments are on an operating profit basis. Intersegment sales and transfers are based on prevailing market prices.
3. Information on the Amounts of Sales, Income (Loss), Assets, and Other Items for Reportable Segments
Millions of Japanese Yen
Reportable Segment
Others Total Adjustments Consolidated totalYear ended or as of September 30, 2016 Electron
TubeOpto-
semiconductor
Imaging and Measurement Instruments
Total
Net sales
Outside customers ¥ 45,608 ¥ 55,592 ¥ 16,352 ¥ 117,552 ¥ 4,299 ¥ 121,852 - ¥ 121,852
Intersegment 1,281 839 14 2,135 921 3,056 (3,056) -
Total net sales 46,890 56,432 16,366 119,688 5,220 124,908 (3,056) 121,852
Segment income ¥ 15,342 ¥ 16,141 ¥ 3,538 ¥ 35,022 ¥ 572 ¥ 35,594 ¥ (15,050) ¥ 20,544
Segment assets ¥ 44,829 ¥ 43,733 ¥ 12,052 ¥ 100,614 ¥ 6,851 ¥ 107,466 ¥ 109,834 ¥ 217,300
Other items
Depreciation and amortization ¥ 3,527 ¥ 4,101 ¥ 914 ¥ 8,544 ¥ 399 ¥ 8,943 ¥ 1,559 ¥ 10,503
Increase in property, plant and equipment and intangible assets ¥ 3,323 ¥ 3,732 ¥ 927 ¥ 7,983 ¥ 373 ¥ 8,357 ¥ 1,378 ¥ 9,736
Millions of Japanese Yen
Reportable Segment
Others Total Adjustments Consolidated totalYear ended or as of September 30, 2017 Electron
TubeOpto-
semiconductorImaging and
Measurement Instruments
Total
Net sales
Outside customers ¥ 48,744 ¥ 60,589 ¥ 17,214 ¥ 126,547 ¥ 3,947 ¥ 130,495 - ¥ 130,495
Intersegment 1,704 937 27 2,670 640 3,310 (3,310) -
Total net sales 50,449 61,526 17,242 129,218 4,587 133,805 (3,310) 130,495
Segment income ¥ 16,992 ¥ 18,155 ¥ 3,544 ¥ 38,692 ¥ 281 ¥ 38,973 ¥ (16,124) ¥ 22,849
Segment assets ¥ 47,110 ¥ 50,243 ¥ 12,437 ¥ 109,791 ¥ 6,183 ¥ 115,974 ¥ 123,356 ¥ 239,331
Other items
Depreciation and amortization ¥ 3,420 ¥ 3,903 ¥ 869 ¥ 8,193 ¥ 338 ¥ 8,531 ¥ 1,468 ¥ 10,000 Increase in property, plant and equipment and intangible assets ¥ 2,801 ¥ 5,654 ¥ 1,222 ¥ 9,678 ¥ 285 ¥ 9,963 ¥ 4,360 ¥ 14,324
25
Annual Report 2017
AnnualReport2017.indd 25 17/12/27 17:28

NOTES TO CONSOLIDATED FINANCIAL STATEMENTS
Thousands of U.S. Dollars
Reportable Segment
Others Total Adjustments Consolidated totalYear ended or as of September 30, 2016 Electron
TubeOpto-
semiconductor
Imaging and Measurement Instruments
Total
Net sales
Outside customers $ 403,612 $ 491,969 $ 144,709 $ 1,040,291 $ 38,045 $ 1,078,336 - $ 1,078,336
Intersegment 11,344 7,429 126 18,900 8,151 27,052 (27,052) -
Total net sales 414,957 499,399 144,835 1,059,192 46,197 1,105,389 (27,052) 1,078,336
Segment income $ 135,773 $ 142,841 $ 31,315 $ 309,930 $ 5,065 $ 314,995 $ (133,189) $ 181,805
Segment assets $ 396,717 $ 387,017 $ 106,660 $ 890,396 $ 60,636 $ 951,032 $ 971,982 $ 1,923,015
Other items
Depreciation and amortization $ 31,213 $ 36,300 $ 8,097 $ 75,611 $ 3,538 $ 79,149 $ 13,799 $ 92,949
Increase in property, plant and equipment and intangible assets $ 29,413 $ 33,033 $ 8,205 $ 70,651 $ 3,309 $ 73,961 $ 12,200 $ 86,161
Thousands of U.S. Dollars
Reportable Segment
Others Total Adjustments Consolidated totalYear ended or as of September 30, 2017 Electron
TubeOpto-
semiconductorImaging and
Measurement Instruments
Total
Net sales
Outside customers $ 431,367 $ 536,189 $ 152,336 $ 1,119,893 $ 34,931 $ 1,154,825 - $ 1,154,825
Intersegment 15,086 8,294 247 23,628 5,669 29,298 (29,298) -
Total net sales 446,453 544,484 152,584 1,143,522 40,601 1,184,123 (29,298) 1,154,825
Segment income $ 150,380 $ 160,665 $ 31,366 $ 342,412 $ 2,488 $ 344,900 $ (142,692) $ 202,207
Segment assets $ 416,906 $ 444,631 $ 110,067 $ 971,604 $ 54,719 $ 1,026,323 $1,091,654 $ 2,117,977
Other items
Depreciation and amortization $ 30,271 $ 34,542 $ 7,692 $ 72,506 $ 2,995 $ 75,501 $ 12,998 $ 88,500 Increase in property, plant and equipment and intangible assets $ 24,788 $ 50,037 $ 10,822 $ 85,648 $ 2,526 $ 88,175 $ 38,587 $ 126,763
9. Short-Term and Long-Term Loans Payable
Short-term bank loans represent notes maturing generally within six months. The average annual interest rate applicable to the short-term bank loans at September 30, 2017 is 0.7%.
Long-term debt at September 30, 2016 and 2017 were as follows:
Millions of Japanese Yen
Thousands ofU.S. Dollars
2016 2017 2016 2017Loans principally from banks due serially through 2031............... ¥ 7,063 ¥ 6,878 $ 62,512 $ 60,869 Less current portion ...................................................................... (218) (3,194) (1,938) (28,267)
¥ 6,844 ¥ 3,683 $ 60,574 $ 32,601
At September 30, 2016 and 2017,cash & deposits and property, plant & equipment which had a carrying amount of ¥4,815 million (US$42,612 thousand) and ¥4,655 million (US$41,199 thousand) were pledged as collateral for short-term bank loans and long-term debt, respectively.
26
AnnualReport2017.indd 26 18/01/16 10:25

10. Related Party Transactions
Related party transactions for the year ended September 30, 2016 are as follows;
2016
Attribute Name Location
Amount of capital or
investment in capital
The contents of a business operation or
an occupation
Ownership (Owned) ratio (%)
Relationship Nature of transaction
Trading amount Account
Balance at the end of the fiscal
year
Director Teruo Hiruma - - Chairman of
the Board(Owned) Direct 0.6 -
Purchase of treasury
shares
¥2,870 million($25,398thousand)
- -
(Transaction terms and conditions, policy to decide such terms and conditions)The Purchase of its treasury shares by the Company is a form of stock purchase through the Tokyo Stock Exchange Trading Network Off-Auction Own Share Repurchase Trading (ToSTNeT-3) at the closing stock price on May 27, 2016.For the year ended September 30, 2017 None
11. Per Share Information
Japanese Yen U.S. Dollars2016 2017 2016 2017
Per share of common stock:Earnings per share ¥ 90.23 ¥ 113.00 $ 0.79 $ 1.00 Cash dividends 34.00 34.00 0.30 0.30
12. Subsequent Events
(Business combination through acquisition)The Company made a resolution at the Board of Directors meeting held on September 11, 2017 for Photonics Management Corp. (PMC), a consolidated subsidiary, to turn Energetiq Technology Inc. (EQ), which manufactures and sells light sources, into a subsidiary. The stock transfer agreement was concluded as of September 20, 2017. The acquisition of these shares was completed on October 16, 2017.
1. Outline of business combination(1) Name of the acquired company and the content of its business Name of the acquired company: Energetiq Technology Inc. Business content: Development, manufacture and sale of light sources for semiconductor inspections(2) Main reason for the business combination By adding of EQ’s Laser Driven Light Sources and Extreme Ultraviolet light sources to the Company’s light sources, product offerings of our
group will be expanded and our response to the demands of semiconductor inspection equipment market will be strengthened. In addition, combining the light source development technologies cultivated by both companies will increase the speed of development and lead to the development of even greater value-added products to open up new markets.
(3) Business combination date October 16, 2017(4) Legal form of the business combination Acquisition of shares with cash consideration(5) Name of the company after the combination Energetiq Technology Inc.(6) Percentage of voting rights acquired 100%(7) Main grounds for determining the acquiring company This is because Photonics Management Corp., a consolidated subsidiary of the Company, acquired shares of EQ with cash consideration.
27
Annual Report 2017
AnnualReport2017.indd 27 18/01/18 17:21

NOTES TO CONSOLIDATED FINANCIAL STATEMENTS
2. Acquisition price of the acquired company and acquisition cost breakdownAcquisition price: ¥ 6,040 million ($ 53,454 thousand) in cashAcquisition cost: ¥ 6,040 million ($ 53,454 thousand) Note: The above amount is an approximately amount at the time of the acquisition and may differ in the future due to price adjustment and other factors.
3. Details and amounts of main acquisition costsAdvisory fee etc. (approximately): ¥ 102 million ($ 908 thousand)
4. Amount, reason, amortization method and period of goodwill recognizedCurrently being determined
5. Assets acquired and liabilities assumed on the date of business combination and their major componentsCurrently being determined
(Purchase and retirement of treasury shares)At the Board of Directors meeting held on November 13, 2017, the Company resolved matters relating to the purchase of treasury shares, pursuant to the provisions of Article 156 of the Companies Act, as applied by replacing the relevant terms pursuant to the provision of Article 165, Paragraph 3 of the Companies Act. The Company also resolved to retire treasury shares, pursuant to the provisions of Article 178 of the Companies Act. 1. Reason for purchasing and retiring treasury sharesThe Company will purchase and retire treasury shares as part of implementing flexible capital policy in response to changes in the business environment, and as part of its shareholder return policy. 2. Details of matters relating to the purchase of treasury shares(1) Type of shares subject to purchase Common shares of the Company(2) Total number of shares to be purchased 3,000,000 shares (maximum) (1.90% of shares issued (excluding treasury shares))(3) Total amount of shares to be purchased ¥ 10,000million ($ 88,495 thousand) (maximum)(4) Purchase period From November 14, 2017 to March 23, 2018(5) Purchase method Open-market purchase on the Tokyo Stock Exchange 3. Details of matters relating to the retirement of treasury shares(1) Type of shares to be retired Common shares of the Company(2) Number of shares to be retired All of the treasury shares purchased in “2.” above.(3) Scheduled date of share retirement April 20, 2018
28
AnnualReport2017.indd 28 18/01/16 10:25
INDEPENDENT AUDITOR’S REPORT
29
Annual Report 2017
AnnualReport2017.indd 29 18/01/22 9:56

DIRECTORS AND AUDIT & SUPERVISORY BOARD MEMBERS
Directors and Audit & Supervisory Board Members
President and CEO
Akira Hiruma, Representative Director
Vice President
Junichi Takeuchi, Representative Director
Senior Managing Director
Koei Yamamoto, Representative Director
Managing Directors
Kenji SuzukiTsutomu HaraKenji Yoshida
Directors
Naofumi ToriyamaKazuhiko Mori
Tadashi MarunoTakayuki SuzukiKashiko KodateKen Koibuchi
Audit & Supervisory Board Members
Hiroshi MizushimaAkira Utsuyama
Yuji MakiSaburo Sano
30
AnnualReport2017.indd 30 17/12/27 17:28

Hamamatsu Photonics K.K.(Registered address)
1126-1 Ichino-cho, Higashi-ku, Hamamatsu CityShizuoka Pref., 435-8558, Japan
Telephone : (81)53-434-3311
Established: September 29, 1953
Paid-in Capital: 34,928,648,325 yen
Common Stock Authorized: 500,000,000 shares Issued: 167,529,968 shares
Stock Listing: Tokyo Stock Exchange (1st Section) ID number 6965 Trading Unit 100 shares
Number of Shareholders: 24,254
Number of Employees: 4,683
Independent Auditor: Ernst & Young ShinNihon LLC Hamamatsu City, Shizuoka Pref.
Transfer Agent and Registrar: Sumitomo Mitsui Trust Bank, Limited Chiyoda-ku, Tokyo
Annual Meeting: The annual meeting of shareholders is held in December of each year in Hamamatsu City, Japan
Price range of stock traded(¥ thousand)
10/16 11 12 1/17 2 3 4 5 6 7 8 92.4
2.6
2.8
3.0
3.2
3.4
3.6
3.8
Major shareholders Percentage to total As of September 30, 2017(*) shares outstanding (%)
The Master Trust Bank of Japan, Ltd. (Trust Account) ................................................................. 5.44Toyota Motor Corporation ............................................................................................................. 5.01State Street Bank and Trust Company ......................................................................................... 4.26Japan Trustee Services Bank. Ltd. (Trust Account 9) .................................................................. 4.13JP Morgan Chase Bank 380055 ................................................................................................... 3.86Japan Trustee Services Bank, Ltd. (Trust Account) ..................................................................... 3.35Hamamatsu Photonics K.K. employees ....................................................................................... 2.98The Nomura Trust and Banking Co., Ltd. (Investment Trust)........................................................ 1.71Japan Trustee Services Bank, Ltd. (Trust Account 5) .................................................................. 1.64State Street Bank West Client ― Treaty 505234 .......................................................................... 1.36(*) The Company holds 9,945,281 (5.94%) shares of treasury shares that is not included in the shares of the major shareholders shown above.
CORPORATE DATA
31
Annual Report 2017
AnnualReport2017.indd 31 17/12/27 17:28

PROFILE OF THE HAMAMATSU FAMILY
Hamamatsu Photonics Italia S.r.l.Main officeStrada della Moia, 1 int. 620020 Arese (Milano), ItalyTelephone: (39)02-93 58 17 33
Rome officeViale Cesare Pavese, 43500144 Roma, ItalyTelephone: (39)06-50 51 34 54
Hamamatsu Photonics UK LimitedMain office2 Howard Court, 10 Tewin Road,Welwyn Garden City,Hertfordshire AL7 1BW, UKTelephone: (44)1707-294888
South African office9 Beukes Avenue, Highway Gardens,Edenvale 1609, South AfricaTelephone: (27)11 609 0367
Europe
Hamamatsu Photonics Deutschland GmbHMain officeArzbergerstr. 10D-82211 Herrsching am Ammersee, GermanyTelephone: (49)8152-375-0
Danish officeLautruphøj 1-3DK-2750 Ballerup, DenmarkTelephone: (45)70 20-93 69
Netherlands officeTelevisieweg 2NL-1322 AC Almere, The NetherlandsTelephone: (31)36-5405384
Poland office8 St. A. Boboli Str. PL-02-525 Warsaw, PolandTelephone: (48)22-646-0016
Hamamatsu Photonics Norden ABMain officeTorshamnsgatan 3516440 Kista, SwedenTelephone: (46)8-509 031 00
Russian office11, Christoprudny Boulevard, Building 1, Office 114, 101000, Moscow, RussiaTelephone: (7)495 258 85 18
Hamamatsu Photonics France S.A.R.L.Main office19, Rue du Saule TrapuParc du Moulin de Massy91882 Massy Cedex, FranceTelephone: (33)1 69 53 71 00
Grenoble officeREGUS Center,29 Boulevard des Alpes38246 Meylan Cedex, FranceTelephone: (33)4 76 61 44 50
Swiss officeDornacherplatz 74500 Solothurn, SwitzerlandTelephone: (41)32 625 60 60
Belgian officeAxisparc Technology, Rue Andre Dumont 7 1435 Mont-Saint-Guilbert, BelgiumTelephone: (32)10 45 63 34
Spanish officeC. Argenters, 4 edif 2Parque Tecnológico del Vallés08290 Cerdanyola (Barcelona), SpainTelephone: (34)93 582 44 30
32
AnnualReport2017.indd 32 17/12/27 17:28

U.S.A.
Photonics Management Corp.360 Foothill Road,Bridgewater, NJ 08807, U.S.A.Telephone: (1)908-231-0960
Hamamatsu CorporationMain office360 Foothill Road,Bridgewater, NJ 08807, U.S.A.Telephone: (1)908-231-0960
Factory250 Wood Avenue,Middlesex, NJ 08846, U.S.A.Telephone: (1)732-356-1203
California office - Northern2875 Moorpark Avenue,San Jose, CA 95128, U.S.A.Telephone: (1)408-261-2022
California office - Southern6310 Greenwich Drive, Suite 200San Diego, CA 92122, U.S.A.Telephone: (1)858-210-6701
Chicago office4711 W. Golf Road, Suite 805Skokie, IL 60076, U.S.A.Telephone: (1)847-825-6046
Boston office20 Park Plaza, Suite 312Boston, MA 02116, U.S.A.Telephone: (1)617-536-9900
Pittsburgh office2593 Wexford Bayne Road, Suite 300, Spectra I Office Bldg.Sewickley, PA 15143, U.S.A. Telephone: (1)724-935-3600
Asia
Hamamatsu Photonics (China) Co., Ltd.1201 Tower B, Jiaming Center, No.27 Dongsanhuan Beilu, Chaoyang District, 100020 Beijing, ChinaTelephone: (86)10-6586-6006
Hamamatsu Photonics Taiwan Co., Ltd.8F-3, No.158, Section 2, Gongdao 5th Road, East District, Hsinchu, 300, Taiwan R.O.C.Telephone: (886)3-659-0080
Beijing Hamamatsu Photon Techniques Inc.Head officeRoom 903, Noble Center #3, 128 South 4th Ring Road West, Fengtai District, Beijing, 100070 ChinaTelephone: (86)10-6370-6370
Japan
Hamamatsu Photonics K.K.Headquarters325-6, Sunayama-cho, Naka-kuHamamatsu City, Shizuoka Pref.430-8587, JapanTelephone: (81)53-452-2141
Electron Tube Division314-5, ShimokanzoIwata City, Shizuoka Pref.438-0193, JapanTelephone: (81)539-62-3151
Solid State Division1126-1, Ichino-cho, Higashi-kuHamamatsu City, Shizuoka Pref.435-8558, JapanTelephone: (81)53-434-3311
Systems Division812, Joko-cho, Higashi-kuHamamatsu City, Shizuoka Pref.431-3196, JapanTelephone: (81)53-435-1560
Central Research Laboratory5000, Hirakuchi, Hamakita-kuHamamatsu City, Shizuoka Pref.434-8601, JapanTelephone: (81)53-586-7111
33
Annual Report 2017
AnnualReport2017.indd 33 17/12/27 17:28

For the year ended September 30, 2017
HAMAMATSU PHOTONICS K.K., Headquarters325-6, Sunayama-cho, Naka-ku, Hamamatsu City, Shizuoka Pref., 430-8587, JapanTelephone:(81)53-452-2141 Fax:(81)53-456-7889
HAMAMATSU PHOTONICS K.K. HAMAMATSU PHOTONICS K.K.www.hamamatsu.com
AnnualReport2017.indd 34 17/12/27 17:28