Embed Size (px)
Citation preview

BIOMECHANICAL REPORT FOR THE
200 m Men’s
Dr Lysander Pollitt, Josh Walker, Dr Catherine Tucker and Dr Athanassios Bissas
Carnegie School of Sport
Stéphane Merlino IAAF Project Leader

Event Directors Dr Lysander Pollitt Dr Athanassios Bissas
Project Director Dr Athanassios Bissas
Project Coordinator Louise Sutton
Senior Technical Support Liam Gallagher Aaron Thomas Liam Thomas
Senior Research Officer Josh Walker
Report Editor Dr Catherine Tucker
Analysis Support Dr Lysander Pollitt
Logistics Dr Zoe Rutherford
Calibration Dr Brian Hanley
Data Management Nils Jongerius
Technical Support Ashley Grindrod
Joshua Rowe Ruth O’Faolain Lewis Lawton
Joe Sails
Data Analysts
Dr Lysander Pollitt Dr Giorgios Paradisis
(National and Kapodistrian University of Athens)
Josh Walker Dr Athanassios Bissas
Parag Parelkar Pierre-Jean Vazel
Dr Catherine Tucker
Dr Tim Bennett
Helen Gravestock
Project Team Mark Cooke
Dr Alex Dinsdale
Dr Gareth Nicholson
Masalela Gaesenngwe Emily Gregg Mike Hopkinson
Rachael Bradley
Ruan Jones Dr Ian Richards Jack Whiteside
Dr Emily Williams
Amy Brightmore Jamie French
Philip McMorris William Shaw
Jessica Wilson Dr Stephen Zwolinsky
Helen Davey Callum Guest
Maria van Mierlo James Webber
Lara Wilson
Coaching Commentary Historical Analysis and Coaching Commentary
Ralph Mouchbahani Pierre-Jean Vazel

Table of Contents
INTRODUCTION 1
METHODS 2
RESULTS – FINAL 7
Performance data 7
Positional analysis 8
Individual split times 9
Completed steps and step length 12
Kinematic characteristics 15
RESULTS – SEMI-FINAL 1 22
Performance data 22
Positional analysis 22
Individual split times 23
Completed steps and step length 26
RESULTS – SEMI-FINAL 2 28
Performance data 28
Positional analysis 28
Individual split times 29
Completed steps and step length 32
RESULTS – SEMI-FINAL 3 34
Performance data 34
Positional analysis 34
Individual split times 35
Completed steps and step length 38
COACH’S COMMENTARY 40
Historical analysis and coaching commentary – Pierre-Jean Vazel 40
Coaching commentary – Ralph Mouchbahani 45
CONTRIBUTORS 47

Figures
Figure 1. Camera layout within the stadium for the men’s 200 m indicated by green in-filled circles. 2
Figure 2. Set-up of the hurdle calibration system used to determine split intervals. 3
Figure 3. The calibration frame was constructed and filmed before and after the competition. 4
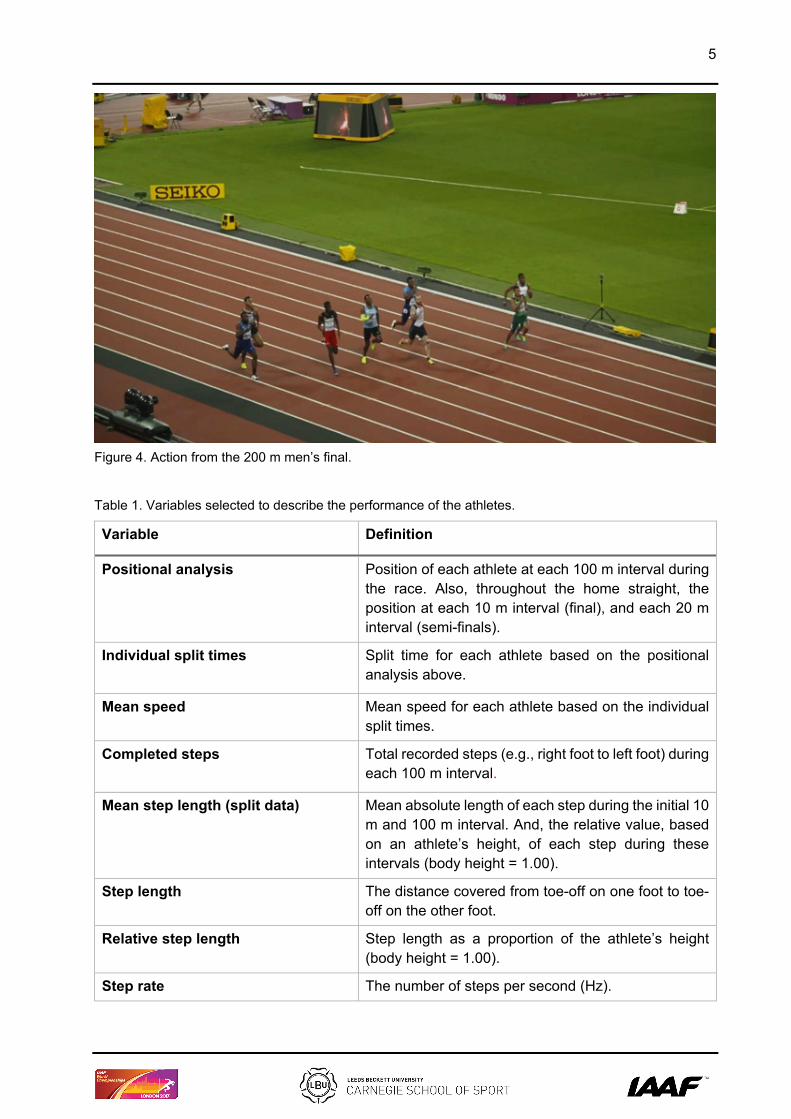
Figure 4. Action from the 200 m men’s final. 5
Figure 5. Positions at the beginning of the home straight and at the end of each 10 m split. 8
Figure 6. Individual 0-100 m split times (minus reaction time). 9
Figure 7. Individual 100-200 m split times. 9
Figure 8. Individual consecutive 10 m split times throughout the home straight. 10
Figure 9. Mean running speed during each 10 m split throughout the home straight. 11
Figure 10. Mean and relative (height) step length during the initial 10 m, 10-100 m and 100-200 m intervals. 12
Figure 11. Total number of steps during the race, within the initial 10 m, between 10 and 100 m and 100 and 200 m intervals. 13
Figure 12. Step lengths for each of the finalists around 150 m. 15
Figure 13. Relative (height) step lengths for each of the finalists around 150 m. 16
Figure 14. Swing times for each of the finalists around 150 m. 16
Figure 15. Individual contact and flight times for each of the finalists around 150 m. For each athlete, the top column (black text) represents the left foot contact and left-to-right flight time, and the bottom column (white text) represents the right foot contact (pink shading) and right-to-left flight time (black shading). 17
Figure 16. Resultant foot centre of mass (CM) velocity during the swing phase for the medallists, displayed as a percentage of swing time. 18
Figure 17. Body schematic denoting joint angles measured at touchdown. This does not represent any athlete’s posture but is merely for illustration purposes. 19
Figure 18. Body schematic denoting joint angles measured at toe-off. This does not represent any athlete’s posture but is merely for illustration purposes. 20
Figure 19. Positions at the beginning of the home straight and at each 20 m split. 22
Figure 20. Individual 0-100 m split times (minus reaction time). 23
Figure 21. Individual 100-200 m split times. 23
Figure 22. Individual consecutive 20 m split times during the home straight. 24
Figure 23. Mean running speed during each 20 m split throughout the home straight. 25
Figure 24. Mean and relative (height) step length during the initial 10 m, 10-100 m and 100-200 m intervals. 26
Figure 25. Total completed steps during the race, within the initial 10 m, between 10 and 100 m and 100 and 200 m intervals. 27

Figure 26. Positions at the beginning of the home straight and each 20 m split. 28
Figure 27. Individual 0-100 m split times (minus reaction time). 29
Figure 28. Individual 100-200 m split times. 29
Figure 29. Individual consecutive 20 m split times during the home straight. 30
Figure 30. Mean running speed during each 20 m split throughout the home straight. 31
Figure 31. Mean and relative (height) step length during the initial 10 m, 10-100 m and 100-200 m intervals. 32
Figure 32. Total completed steps during the race, within the initial 10 m, between 10 and 100 m and 100 and 200 m intervals. 33
Figure 33. Positions at the beginning of the home straight and each 20 m split. 34
Figure 34. Individual 0-100 m split times (minus reaction time). 35
Figure 35. Individual 100-200 m split times. 35
Figure 36. Individual consecutive 20 m split times during the home straight. 36
Figure 37. Mean running speed during each 20 m split throughout the home straight. 37
Figure 38. Mean and relative (height) step length during the initial 10 m, 10-100 m and 100-200 m intervals. 38
Figure 39. Total completed steps during the race, within the initial 10 m, between 10 and 100 m and 100 and 200 m intervals. 39

Tables
Table 1. Variables selected to describe the performance of the athletes. 5
Table 2. Individual season’s (SB) and personal bests (PB), and performance during the semi-final (SF). 7
Table 3. Comparison of athletes’ performance during the final compared to PB, SB and semi-finals (SF). 7
Table 4. Mean step rate, step velocity and step length for each finalist around 150 m. 15
Table 5. Horizontal distance to the centre of mass (DCM) at touchdown (TD) and toe-off (TO).17
Table 6. Peak vertical and resultant foot CM velocity, and the relative time (% phase) that each peak occurred during the swing phase. 18
Table 7. Joint angles at touchdown for the medallists. 19
Table 8. Joint angles at toe-off for the medallists. 20
Table 9. Joint angles at touchdown for the remaining five finalists. 21
Table 10. Joint angles at toe-off for the remaining five finalists. 21
Table 11. Athletes’ ranking based on SB and PB, and comparison to their semi-final performance. 22
Table 12. Athletes’ ranking based on SB and PB, and comparison to their semi-final performance. 28
Table 13. Athletes’ ranking based on SB and PB, and comparison to their semi-final performance. 34

1
INTRODUCTION
On Thursday 10th August, the men’s 200 m final was built-up around the ambitions of Wayde Van
Niekerk to complete ‘the double’ and the highly anticipated showdown with Botswana’s Isaac
Makwala; the world leader with 19.77 s. It was also the first World Championship final not to
feature Usain Bolt since 2003, and the elimination of Yohan Blake in the semi-finals meant there
was no Jamaican representative. Bolt also lost one of his many records as Japan’s Abdul Hakim
Sani Brown became the youngest men's 200 m finalist. Nevertheless, it was Ramil Guliyev, who,
after leading into the home straight held off the field to win a time of 20.09 s; became his country’s
first world gold medallist. It was also the first men’s 200 m final for 20 years not to feature a
medallist from the USA or Jamaica. Van Niekerk, who only reached the final as the slowest non-
automatic qualifier (20.28 s), secured the silver medal by the smallest of margins crossing the line
at 20.106 s just one thousandth of a second ahead of the 23-year-old Jereem Richards of Trinidad
and Tobago. Richards, seventh entering the home straight, recorded the quickest second 100 m
split (9.70 s) to push van Niekerk close. Great Britain’s 23-year-old Nethaneel Mitchell-Blake
finished fourth in 20.24 s.

2
METHODS
Eight vantage locations for camera placement were identified and secured. Six of these were
dedicated to the home straight and the additional two were strategically positioned around the
start line (Figure 1). Each of the home straight locations had the capacity to accommodate up to
five cameras placed on tripods in parallel. Five locations were situated on the broadcasting
balcony along the home straight (from the 100 m line to the 190 m line) whilst the sixth location
was located within the IAAF VIP outdoor area overlooking the finish line from a semi-frontal angle.
Two separate calibration procedures were conducted before and after each competition. First, a
series of nine interlinked training hurdles were positioned every 10 m along the home straight
ensuring that the crossbar of each hurdle, covered with black and white tape, was aligned with
the track’s transverse line (Figure 2). These hurdles were also positioned across all nine lanes on
the track markings for the 100 m interval. Second, a rigid cuboid calibration frame was positioned
on the running track between the 147-metre mark and the 155.5-metre mark (from the starting
line) multiple times over discrete predefined areas along and across the track to ensure an
accurate definition of a volume within which athletes were achieving high running speeds (Figure
3). This approach produced a large number of non-coplanar control points per individual
calibrated volume and facilitated the construction of bi-lane specific global coordinate systems.
Figure 1. Camera layout within the stadium for the men’s 200 m indicated by green in-filled circles.
3
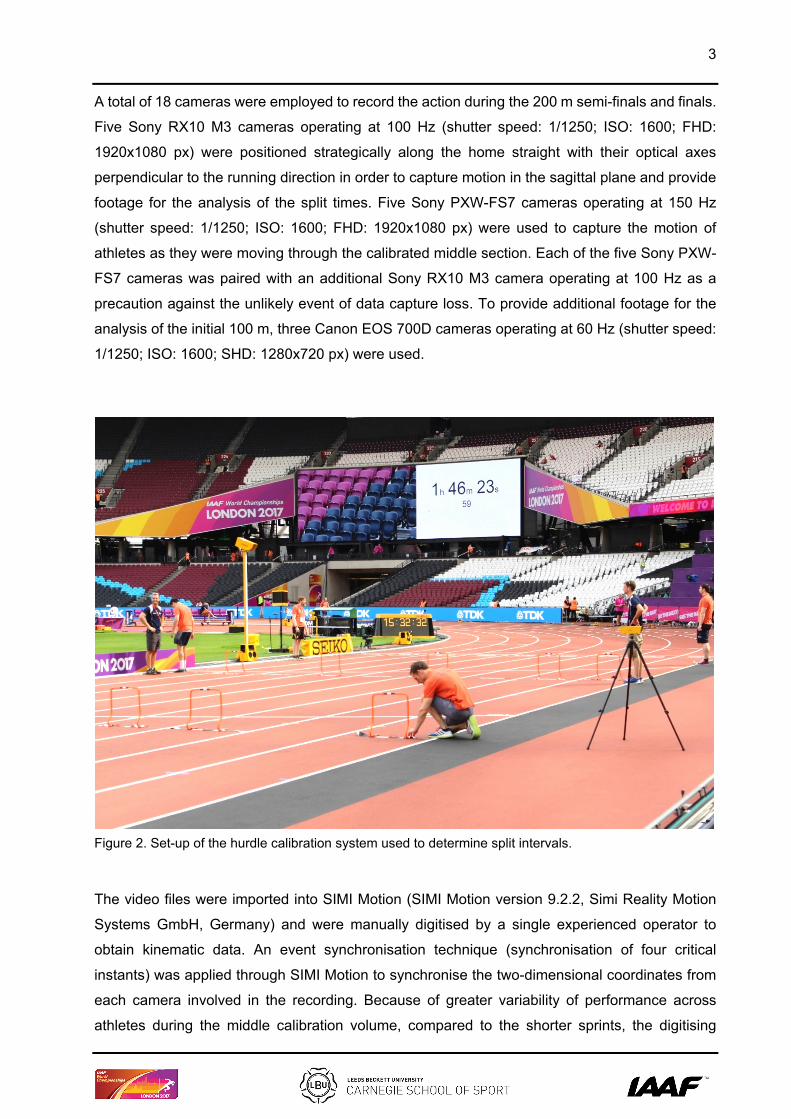
A total of 18 cameras were employed to record the action during the 200 m semi-finals and finals.
Five Sony RX10 M3 cameras operating at 100 Hz (shutter speed: 1/1250; ISO: 1600; FHD:
1920x1080 px) were positioned strategically along the home straight with their optical axes
perpendicular to the running direction in order to capture motion in the sagittal plane and provide
footage for the analysis of the split times. Five Sony PXW-FS7 cameras operating at 150 Hz
(shutter speed: 1/1250; ISO: 1600; FHD: 1920x1080 px) were used to capture the motion of
athletes as they were moving through the calibrated middle section. Each of the five Sony PXW-
FS7 cameras was paired with an additional Sony RX10 M3 camera operating at 100 Hz as a
precaution against the unlikely event of data capture loss. To provide additional footage for the
analysis of the initial 100 m, three Canon EOS 700D cameras operating at 60 Hz (shutter speed:
1/1250; ISO: 1600; SHD: 1280x720 px) were used.
Figure 2. Set-up of the hurdle calibration system used to determine split intervals.
The video files were imported into SIMI Motion (SIMI Motion version 9.2.2, Simi Reality Motion
Systems GmbH, Germany) and were manually digitised by a single experienced operator to
obtain kinematic data. An event synchronisation technique (synchronisation of four critical
instants) was applied through SIMI Motion to synchronise the two-dimensional coordinates from
each camera involved in the recording. Because of greater variability of performance across
athletes during the middle calibration volume, compared to the shorter sprints, the digitising

4
process for most of the body segments centred upon critical events (e.g., touchdown and toe-off)
rather than an analysis of the full sequence throughout the calibration volume. Each file was first
digitised frame by frame and upon completion adjustments were made as necessary using the
points over frame method. The Direct Linear Transformation (DLT) algorithm was used to
reconstruct the three-dimensional (3D) coordinates from individual camera’s x and y image
coordinates. Reliability of the digitising process was estimated by repeated digitising of one sprint
running stride with an intervening period of 48 hours. The results showed minimal systematic and
random errors and therefore confirmed the high reliability of the digitising process.
Figure 3. The calibration frame was constructed and filmed before and after the competition.
De Leva’s (1996) body segment parameter models were used to obtain data for the whole body
centre of mass and for key body segments of interest. A recursive second-order, low-pass
Butterworth digital filter (zero phase-lag) was employed to filter the raw coordinate data. The cut-
off frequencies were calculated using residual analysis. Split times and kinematic characteristics
were processed through SIMI Motion by using the 60, 100 and 150 Hz footage respectively.
Where available, athletes’ heights were obtained from ‘Athletics 2017’ (edited by Peter Matthews
and published by the Association of Track and Field Statisticians), and online sources.
5
Figure 4. Action from the 200 m men’s final.
Table 1. Variables selected to describe the performance of the athletes.
Variable Definition
Positional analysis
Position of each athlete at each 100 m interval during the race. Also, throughout the home straight, the position at each 10 m interval (final), and each 20 m interval (semi-finals).
Individual split times
Split time for each athlete based on the positional analysis above.
Mean speed Mean speed for each athlete based on the individual split times.
Completed steps
Total recorded steps (e.g., right foot to left foot) during each 100 m interval.
Mean step length (split data) Mean absolute length of each step during the initial 10 m and 100 m interval. And, the relative value, based on an athlete’s height, of each step during these intervals (body height = 1.00).
Step length The distance covered from toe-off on one foot to toe-off on the other foot.
Relative step length Step length as a proportion of the athlete’s height (body height = 1.00).
Step rate The number of steps per second (Hz).

6
Contact time The time the foot is in contact with the ground.
Flight time The time from toe-off (TO) of one foot to touchdown (TD) of the other foot.
Step time Contact time + flight time.
Step velocity Step length divided by step time.
Swing time The time that the foot is not in contact with the ground during one full stride.
DCM TD The horizontal distance between the ground contact point (foot tip) at TD and the CM.
DCM TO The horizontal distance between the ground contact point (foot tip) at TO and the CM.
Foot vertical velocity The vertical component of the foot CM velocity.
Resultant foot swing velocity The resultant linear velocity of the foot CM during the swing phase.
Trunk angle (α) The angle of the trunk relative to the horizontal and considered to be 90° in the upright position.
Knee angle (β) The angle between the thigh and lower leg and considered to be 180° in the anatomical standing position.
Contact leg hip angle (γ) The shoulder-hip-knee angle of the contact side.
Swing leg hip angle (δ) The shoulder-hip-knee angle of the swing side.
Note: angle taken at toe-off only.
Contact thigh angle (ε) The angle between the thigh of the contact leg and the vertical.
Swing thigh angle (ζ) The angle between the thigh of the swing leg and the vertical.
Thigh separation angle (η) The angle between the thighs of the contact and swing legs. This has been calculated as the difference between ε and ζ.
Shank angle (θ) The angle of the lower leg relative to the running surface and considered to be 90° when the shank is perpendicular to the running surface.
Ankle angle (ι) The angle between the lower leg and the foot and considered to be 90° in the anatomical standing position.
Note: CM = Centre of mass.

7
RESULTS – Final
Performance data
The tables below display the season’s (SB) and personal best (PB) times of each athlete
competing in the final before the World Championships, and their performance during the semi-
finals (Table 2). These values are then compared to their performance in the final itself (Table 3).
Table 2. Individual season’s (SB) and personal bests (PB), and performance during the semi-final (SF).
Athlete SB rank PB rank SF rank notes
GULIYEV 20.08 s 5 19.88 s 5 20.17 s 4
VAN NIEKERK 19.84 s 2 19.84 s 2 20.28 s 7
RICHARDS 19.97 s 3 19.97 s 7 20.14 s 2
MITCHELL-BLAKE 20.04 s 4 19.95 s 6 20.19 s 5
WEBB 20.09 s 6 19.85 s 3 20.22 s 6
MAKWALA 19.77 s 1 19.77 s 1 20.14 s 2
SANI BROWN 20.32 s 8 20.32 s 8 20.43 s 8
YOUNG 20.14 s 7 19.86 s 4 20.12 s 1 SB
Key: SB = season’s best, PB = personal best, SF = semi-final.
Table 3. Comparison of athletes’ performance during the final compared to PB, SB and semi-finals (SF).
Athlete FINAL notes vs. SF vs. SB vs. PB
GULIYEV 20.09 s −0.08 s 0.01 s 0.21 s
VAN NIEKERK 20.11 s .106 s −0.17 s 0.27 s 0.27 s
RICHARDS 20.11 s .107 s −0.03 s 0.14 s 0.14 s
MITCHELL-BLAKE 20.24 s 0.05 s 0.20 s 0.29 s
WEBB 20.26 s 0.04 s 0.17 s 0.41 s
MAKWALA 20.44 s 0.30 s 0.67 s 0.67 s
SANI BROWN 20.63 s 0.20 s 0.31 s 0.31 s
YOUNG 20.64 s 0.52 s 0.50 s 0.78 s
Key: SB = season’s best, PB = personal best, SF = semi-final, NR = national record.

8
Positional analysis
The following figure (Figure 5) shows each finalist’s race position at each 10 m interval, based on
cumulative split time data.
Figure 5. Positions at the beginning of the home straight and at the end of each 10 m split.
0
1
2
3
4
5
6
7
8
9100m 110m 120m 130m 140m 150m 160m 170m 180m 190m 200m
GULIYEV
VAN NIEKERK
RICHARDS
MITCHELLBLAKEWEBB
MAKWALA
SANI BROWN
YOUNG

9
Individual split times
The following graphs display the split times of all athletes over each: 100 m split (Figures 6 and
7; note: 0-100 m is displayed without the reaction time) and consecutive 10 m split throughout the
home straight (Figure 8). The mean speed over consecutive 10 m splits throughout the home
straight is presented in Figure 9. Please note that split times have been rounded mathematically
to two decimal places throughout this report. However, the official result is always rounded up in
accordance with the IAAF Competition Rules – this causes some instances where our total race
times differ by 0.01 seconds. Any instances of this are highlighted in the notes section of the
performance tables by an asterisk (*).
Figure 6. Individual 0-100 m split times (minus reaction time).
Figure 7. Individual 100-200 m split times.
10.13 s
10.15 s
10.26 s
10.29 s
10.25 s
10.15 s
10.20 s
10.35 s
8.4 s 8.9 s 9.4 s 9.9 s 10.4 s
GULIYEV
VAN NIEKERK
RICHARDS
MITCHELL BLAKE
WEBB
MAKWALA
SANI BROWN
YOUNG
0-100 m
9.79 s
9.80 s
9.70 s
9.80 s
9.86 s
10.12 s
10.27 s
10.14 s
8.4 s 8.9 s 9.4 s 9.9 s 10.4 s
GULIYEV
VAN NIEKERK
RICHARDS
MITCHELL BLAKE
WEBB
MAKWALA
SANI BROWN
YOUNG
100-200 m

10
Figure 8. Individual consecutive 10 m split times throughout the home straight.
0.95 s 0.95 s 0.94 s0.96 s
0.93 s0.95 s 0.96 s 0.95 s
0.8 s
0.9 s
1.0 s
1.1 s
GULIYEV VANNIEKERK
RICHARDS MITCHELLBLAKE
WEBB MAKWALA SANIBROWN
YOUNG
100-110 m
0.95 s 0.94 s 0.95 s 0.96 s0.94 s
0.97 s 0.97 s 0.98 s
0.8 s
0.9 s
1.0 s
1.1 s
GULIYEV VANNIEKERK
RICHARDS MITCHELLBLAKE
WEBB MAKWALA SANIBROWN
YOUNG
110-120 m
0.94 s 0.95 s0.93 s
0.95 s 0.94 s0.96 s
0.98 s0.96 s
0.8 s
0.9 s
1.0 s
1.1 s
GULIYEV VANNIEKERK
RICHARDS MITCHELLBLAKE
WEBB MAKWALA SANIBROWN
YOUNG
120-130 m
0.95 s 0.96 s0.94 s 0.95 s 0.96 s
0.98 s 0.99 s 0.98 s
0.8 s
0.9 s
1.0 s
1.1 s
GULIYEV VANNIEKERK
RICHARDS MITCHELLBLAKE
WEBB MAKWALA SANIBROWN
YOUNG
130-140 m
0.96 s 0.96 s 0.95 s 0.95 s0.97 s 0.98 s
1.01 s0.97 s
0.8 s
0.9 s
1.0 s
1.1 s
GULIYEV VANNIEKERK
RICHARDS MITCHELLBLAKE
WEBB MAKWALA SANIBROWN
YOUNG
140-150 m
0.99 s0.97 s 0.97 s 0.98 s 0.98 s
1.00 s1.03 s 1.02 s
0.8 s
0.9 s
1.0 s
1.1 s
GULIYEV VANNIEKERK
RICHARDS MITCHELLBLAKE
WEBB MAKWALA SANIBROWN
YOUNG
150-160 m
1.00 s 1.01 s0.99 s 1.00 s 1.00 s
1.04 s 1.04 s 1.04 s
0.8 s
0.9 s
1.0 s
1.1 s
GULIYEV VANNIEKERK
RICHARDS MITCHELLBLAKE
WEBB MAKWALA SANIBROWN
YOUNG
160-170 m
1.00 s 1.01 s 1.01 s 1.00 s1.02 s
1.05 s 1.06 s1.04 s
0.8 s
0.9 s
1.0 s
1.1 s
GULIYEV VANNIEKERK
RICHARDS MITCHELLBLAKE
WEBB MAKWALA SANIBROWN
YOUNG
170-180 m
1.00 s 1.01 s 1.01 s 1.01 s1.05 s
1.07 s1.09 s 1.08 s
0.8 s
0.9 s
1.0 s
1.1 s
GULIYEV VANNIEKERK
RICHARDS MITCHELLBLAKE
WEBB MAKWALA SANIBROWN
YOUNG
180-190 m
1.05 s 1.04 s1.01 s
1.04 s1.07 s
1.12 s1.14 s
1.12 s
0.9 s
1.0 s
1.1 s
1.2 s
GULIYEV VANNIEKERK
RICHARDS MITCHELLBLAKE
WEBB MAKWALA SANIBROWN
YOUNG
190-200 m

11
Figure 9. Mean running speed during each 10 m split throughout the home straight.
8.5
9.5
10.5
11.5
100-110m 110-120m 120-130m 130-140m 140-150m 150-160m 160-170m 170-180m 180-190m 190-200m
Run
ning
spe
ed (m
/s)
YOUNG
SANI BROWN
MAKWALA
WEBB
MITCHELL BLAKE
RICHARDS
VAN NIEKERK
GULIYEV

12
Completed steps and step length
The following graphs show step information of individual athletes, during the initial 10 m of the
race, between 10-100 m and the final 100 m intervals, for the mean step length and relative to
each athlete’s height (Figure 10). The total completed steps for the race and during each 100 m
split for each athlete is presented in Figure 11.
Figure 10. Mean and relative (height) step length during the initial 10 m, 10-100 m and 100-200 m intervals.
1.36m1.39m 1.40m 1.40m 1.40m
1.36m
1.50m
1.40m
1.10m
1.35m
1.60mMean step length: 0-10 m
0.730.76 0.74 0.75 0.77
0.74
0.80 0.78
0.50
0.70
0.90Relative mean step length: 0-10 m
2.30m2.40m
2.32m 2.35m2.41m
2.28m2.34m
2.24m
1.80m
2.20m
2.60mMean step length: 10-100 m
1.23
1.31
1.231.26
1.33
1.23 1.25 1.24
1.05
1.25
1.45Relative mean step length: 10-100 m
2.38m
2.58m
2.40m2.46m 2.49m
2.33m2.42m
2.25m
1.80m
2.20m
2.60mMean step length: 100-200 m
1.27
1.41
1.271.32
1.38
1.261.29
1.25
1.05
1.25
1.45Relative mean step length: 100-200 m

13
Figure 11. Total number of steps during the race, within the initial 10 m, between 10 and 100 m and 100 and 200 m intervals.
Note: Step based on toe-off to toe-off. Decimals indicate the step was not fully completed within the split interval.
7.34
7.19
7.15
7.14
7.13
7.34
6.66
7.12
39.10
37.43
38.85
38.23
37.42
39.50
38.52
40.21
42.02
38.81
41.74
40.71
40.18
42.93
41.39
44.39
88.5
83.4
87.7
86.1
84.7
89.8
86.6
91.7
0 20 40 60 80 100 120
GULIYEV
VAN NIEKERK
RICHARDS
MITCHELL BLAKE
WEBB
MAKWALA
SANI BROWN
YOUNG
0-10m 10-100m 100-200m Total 200m

14
GOLD MEDALLIST: Ramil Guliyev
RT 0-100 m 100-200 m RESULT Final 0.165 s 10.13 s 9.79 s 20.09 s Rank 3rd 1st 1st 1st vs. silver + 0.009 s −0.02 s −0.01 s −0.016 s vs. bronze + 0.016 s −0.13 s + 0.09 s −0.017 s
Semi-Final 0.167 s 10.15 s 9.85 s 20.17 s Rank 16th 3rd 6th 4th 100-120 m 120-140 m 140-160 m 160-180 m 180-200 m Final 1.90 s 1.89 s 1.95 s 2.00 s 2.05 s Rank 4th 2nd 5th 1st =3rd vs. fastest + 0.01 s + 0.02 s + 0.03 s + 0.04 s −0.03 s vs. silver + 0.01 s −0.02 s + 0.02 s −0.02 s 0.00 s vs. bronze −0.04 s + 0.02 s + 0.03 s 0.00 s −0.03 s
Semi-Final 1.87 s 1.88 s 1.96 s 2.01 s 2.13 s Rank =3rd 5th 12th 6th 77h

15
Kinematic characteristics
This section presents the results from the digitised data within the calibration zone (i.e., around
150 m) along the home straight. All variables have been described previously (Table 1).
Table 4. Mean step rate, step velocity and step length for each finalist around 150 m.
Step velocity (m/s)
Step rate (Hz)
Step length (m)
#relative
GULIYEV 10.60 4.42 2.40 1.28
VAN NIEKERK 10.40 4.00 2.60 1.42
RICHARDS 10.48 4.35 2.41 1.28
MITCHELL-BLAKE 10.42 4.22 2.47 1.32
WEBB 10.54 4.28 2.46 1.36
MAKWALA 10.02 4.34 2.31 1.25
SANI BROWN 9.94 4.11 2.42 1.29
YOUNG 10.09 4.41 2.29 1.27
Note: Step velocity calculated from step length and step time; # relative step length based on athlete’s height.
Figure 12. Step lengths for each of the finalists around 150 m.
2.39
2.58
2.34
2.472.43
2.28
2.49
2.27
2.40
2.61
2.47 2.462.49
2.34 2.352.30
1.9
2.1
2.3
2.5
2.7
GULIYEV VANNIEKERK
RICHARDS MITCHELLBLAKE
WEBB MAKWALA SANIBROWN
YOUNG
Step
leng
th (m
)
Left-Right Right-Left

16
Figure 13. Relative (height) step lengths for each of the finalists around 150 m.
Figure 14. Swing times for each of the finalists around 150 m.
1.28
1.41
1.24
1.321.34
1.23
1.33
1.261.28
1.42
1.31 1.31
1.37
1.26 1.261.28
0.9
1.1
1.3
1.5
GULIYEV VANNIEKERK
RICHARDS MITCHELLBLAKE
WEBB MAKWALA SANI BROWN YOUNG
Step
leng
th (h
eigh
t)Left-Right Right-Left
0.360
0.400
0.360
0.367
0.367
0.353
0.380
0.347
0.000 0.070 0.140 0.210 0.280 0.350 0.420
GULIYEV
VAN NIEKERK
RICHARDS
MITCHELL BLAKE
WEBB
MAKWALA
SANI BROWN
YOUNG
Swing time (s)
17
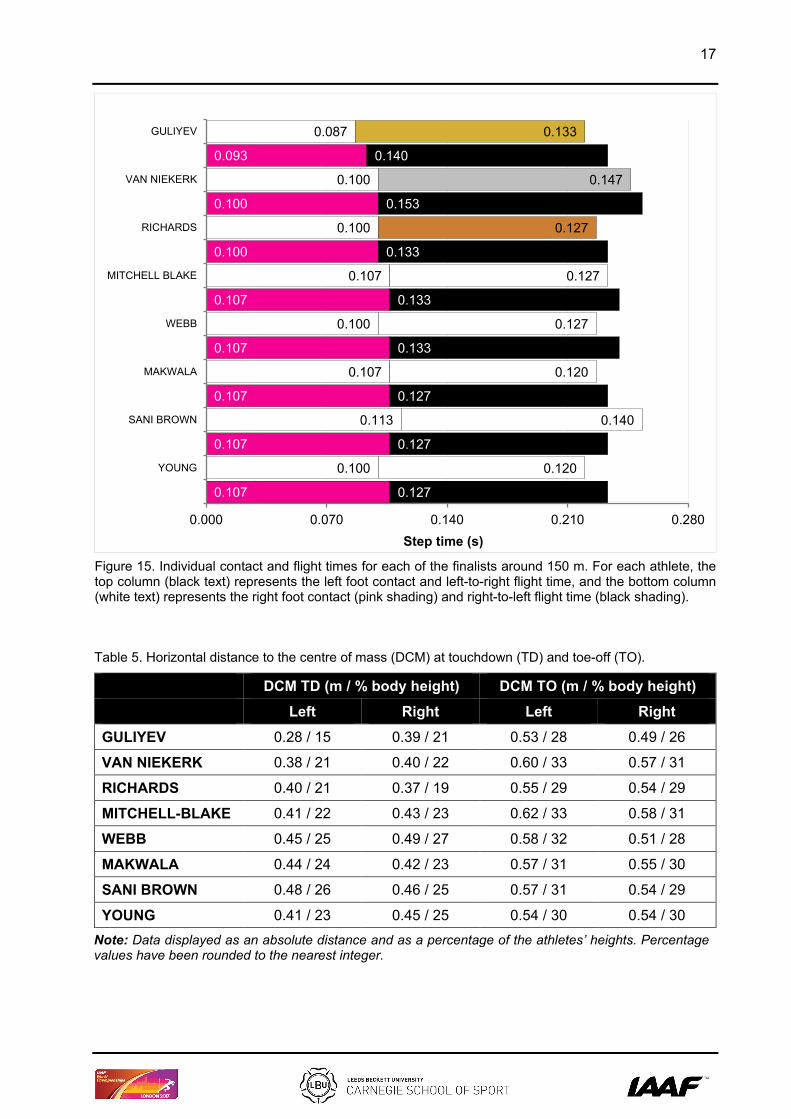
Figure 15. Individual contact and flight times for each of the finalists around 150 m. For each athlete, the top column (black text) represents the left foot contact and left-to-right flight time, and the bottom column (white text) represents the right foot contact (pink shading) and right-to-left flight time (black shading).
Table 5. Horizontal distance to the centre of mass (DCM) at touchdown (TD) and toe-off (TO).
DCM TD (m / % body height) DCM TO (m / % body height)
Left Right Left Right
GULIYEV 0.28 / 15 0.39 / 21 0.53 / 28 0.49 / 26
VAN NIEKERK 0.38 / 21 0.40 / 22 0.60 / 33 0.57 / 31
RICHARDS 0.40 / 21 0.37 / 19 0.55 / 29 0.54 / 29
MITCHELL-BLAKE 0.41 / 22 0.43 / 23 0.62 / 33 0.58 / 31
WEBB 0.45 / 25 0.49 / 27 0.58 / 32 0.51 / 28
MAKWALA 0.44 / 24 0.42 / 23 0.57 / 31 0.55 / 30
SANI BROWN 0.48 / 26 0.46 / 25 0.57 / 31 0.54 / 29
YOUNG 0.41 / 23 0.45 / 25 0.54 / 30 0.54 / 30
Note: Data displayed as an absolute distance and as a percentage of the athletes’ heights. Percentage values have been rounded to the nearest integer.
0.087
0.093
0.100
0.100
0.100
0.100
0.107
0.107
0.100
0.107
0.107
0.107
0.113
0.107
0.100
0.107
0.133
0.140
0.147
0.153
0.127
0.133
0.127
0.133
0.127
0.133
0.120
0.127
0.140
0.127
0.120
0.127
0.000 0.070 0.140 0.210 0.280
GULIYEV
VAN NIEKERK
RICHARDS
MITCHELL BLAKE
WEBB
MAKWALA
SANI BROWN
YOUNG
Step time (s)

18
The graph below contains time-series data for the resultant velocity of the foot centre of mass,
displayed as a percentage of swing time. Here, 0% represents the first frame of toe-off and 100%
represents ipsilateral touchdown. The peak vertical and resultant velocities, and the relative time
of each, during the swing phase velocity for each of the medallists are presented in Table 6.
Figure 16. Resultant foot centre of mass (CM) velocity during the swing phase for the medallists, displayed as a percentage of swing time.
Table 6. Peak vertical and resultant foot CM velocity, and the relative time (% phase) that each peak occurred during the swing phase.
Vertical velocity (m/s) % Resultant velocity
(m/s) %
GULIYEV 5.31 15 16.39 64
VAN NIEKERK 7.85 8 18.40 66
RICHARDS 8.33 11 20.01 60
Note: 0% indicates toe-off and 100% indicates the final frame before ipsilateral touchdown.
0
5
10
15
20
25
0 25 50 75 100
Foot
CM
vel
ocity
(m/s
)
Swing time (%)
GULIYEV VAN NIEKERK RICHARDS

19
Figure 17. Body schematic denoting joint angles measured at touchdown. This does not represent any athlete’s posture but is merely for illustration purposes.
Table 7. Joint angles at touchdown for the medallists.
GULIYEV VAN NIEKERK RICHARDS
Left (°) Right (°) Left (°) Right (°) Left (°) Right (°)
α 80.7 82.2 82.7 79.2 86.3 83.8
β 163.2 175.8 156.3 153.9 160.2 162.9
γ 156.7 158.6 145.7 147.9 153.7 152.1
ε 15.3 18.1 25.9 28.0 23.1 24.2
ζ 19.2 7.7 10.2 11.2 6.5 9.3
η 3.9 −10.4 −15.7 −16.8 −16.6 −14.9
θ 96.7 104.5 100.5 97.4 100.9 98.9
ι 114.8 122.2 119.6 112.7 117.7 122.3
Note: For angles ε and ζ, a positive value indicates that the thigh segment was in front of the vertical axis. For angle η, a negative value indicates that the swing leg is behind the touchdown leg at the point of contact, whereas a positive value indicates the swing thigh is in front of the contralateral thigh segment. The 2-D schematic should not be used as a model to combine angles as different landmarks have been used for defining certain angles.

20
Figure 18. Body schematic denoting joint angles measured at toe-off. This does not represent any athlete’s posture but is merely for illustration purposes.
Table 8. Joint angles at toe-off for the medallists.
GULIYEV VAN NIEKERK RICHARDS
Left (°) Right (°) Left (°) Right (°) Left (°) Right (°)
α 83.2 82.4 86.2 83.2 86.4 87.6
β 156.7 155.2 157.8 158.8 165.4 159.7
γ 190.9 196.7 202.7 205.1 211.8 206.5
δ 123.4 135.1 112.3 119.0 121.0 113.4
ε −24.7 −23.3 −30.1 −26.4 −30.5 −27.4
ζ 60.6 42.6 66.5 58.1 64.4 68.9
η 85.3 65.9 96.6 84.5 94.9 96.3
θ 45.0 42.1 38.0 43.1 45.2 42.9
ι 126.0 106.2 118.2 132.9 132.6 114.6
Note: For angles ε and ζ, a positive value indicates that the thigh segment was in front of the vertical axis. For angle η, a negative value indicates that the swing leg is behind the touchdown leg at the point of contact, whereas a positive value indicates the swing thigh is in front of the contralateral thigh segment. The 2-D schematic should not be used as a model to combine angles as different landmarks have been used for defining certain angles.
21
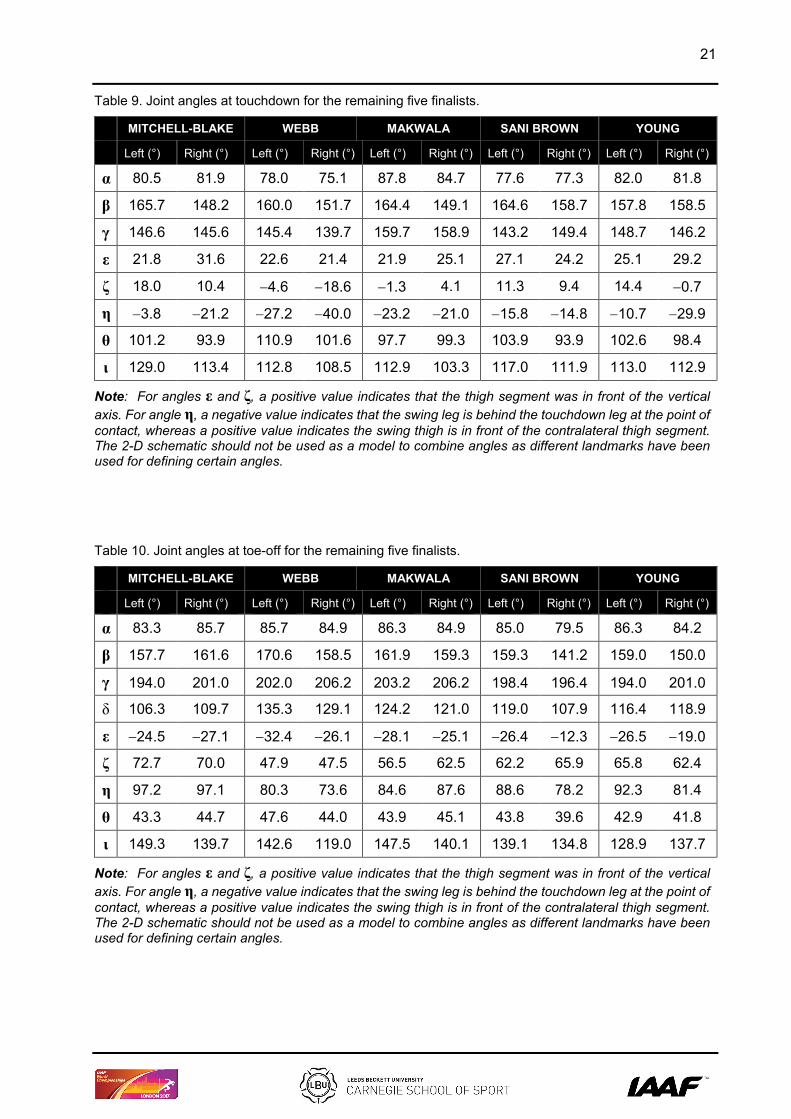
Table 9. Joint angles at touchdown for the remaining five finalists.
MITCHELL-BLAKE WEBB MAKWALA SANI BROWN YOUNG
Left (°) Right (°) Left (°) Right (°) Left (°) Right (°) Left (°) Right (°) Left (°) Right (°)
α 80.5 81.9 78.0 75.1 87.8 84.7 77.6 77.3 82.0 81.8
β 165.7 148.2 160.0 151.7 164.4 149.1 164.6 158.7 157.8 158.5
γ 146.6 145.6 145.4 139.7 159.7 158.9 143.2 149.4 148.7 146.2
ε 21.8 31.6 22.6 21.4 21.9 25.1 27.1 24.2 25.1 29.2
ζ 18.0 10.4 −4.6 −18.6 −1.3 4.1 11.3 9.4 14.4 −0.7
η −3.8 −21.2 −27.2 −40.0 −23.2 −21.0 −15.8 −14.8 −10.7 −29.9
θ 101.2 93.9 110.9 101.6 97.7 99.3 103.9 93.9 102.6 98.4
ι 129.0 113.4 112.8 108.5 112.9 103.3 117.0 111.9 113.0 112.9
Note: For angles ε and ζ, a positive value indicates that the thigh segment was in front of the vertical axis. For angle η, a negative value indicates that the swing leg is behind the touchdown leg at the point of contact, whereas a positive value indicates the swing thigh is in front of the contralateral thigh segment. The 2-D schematic should not be used as a model to combine angles as different landmarks have been used for defining certain angles.
Table 10. Joint angles at toe-off for the remaining five finalists.
MITCHELL-BLAKE WEBB MAKWALA SANI BROWN YOUNG
Left (°) Right (°) Left (°) Right (°) Left (°) Right (°) Left (°) Right (°) Left (°) Right (°)
α 83.3 85.7 85.7 84.9 86.3 84.9 85.0 79.5 86.3 84.2
β 157.7 161.6 170.6 158.5 161.9 159.3 159.3 141.2 159.0 150.0
γ 194.0 201.0 202.0 206.2 203.2 206.2 198.4 196.4 194.0 201.0
δ 106.3 109.7 135.3 129.1 124.2 121.0 119.0 107.9 116.4 118.9
ε −24.5 −27.1 −32.4 −26.1 −28.1 −25.1 −26.4 −12.3 −26.5 −19.0
ζ 72.7 70.0 47.9 47.5 56.5 62.5 62.2 65.9 65.8 62.4
η 97.2 97.1 80.3 73.6 84.6 87.6 88.6 78.2 92.3 81.4
θ 43.3 44.7 47.6 44.0 43.9 45.1 43.8 39.6 42.9 41.8
ι 149.3 139.7 142.6 119.0 147.5 140.1 139.1 134.8 128.9 137.7
Note: For angles ε and ζ, a positive value indicates that the thigh segment was in front of the vertical axis. For angle η, a negative value indicates that the swing leg is behind the touchdown leg at the point of contact, whereas a positive value indicates the swing thigh is in front of the contralateral thigh segment. The 2-D schematic should not be used as a model to combine angles as different landmarks have been used for defining certain angles.

22
RESULTS – Semi-Final 1
Performance data
Table 11 below displays the ranking of each athlete before the World Championships across all
athletes qualifying for the semi-finals, based on their season’s (SB) and personal best (PB) times,
and a comparison to their semi-final time.
Table 11. Athletes’ ranking based on SB and PB, and comparison to their semi-final performance.
Athlete SB rank PB rank SEMI-FINAL notes vs. SB vs. PB
YOUNG 10 7 20.12 s SB Q −0.02 s 0.26 s
MAKWALA 1 2 20.14 s Q 0.37 s 0.37 s
MITCHELL-BLAKE 6 9 20.19 s q 0.15 s 0.24 s
LIMA 17 20 20.56 s 0.26 s 0.26 s
IIZUKA 23 14 20.62 s .612 s* 0.21 s 0.50 s
TORTU 21 23 20.62 s .613 s* 0.27 s 0.27 s
SIMBINE 3 9 20.62 s .618 s 0.67 s 0.67 s
GREAUX 12 16 20.65 s 0.46 s 0.46 s
DWYER 9 3 20.69 s 0.58 s 0.89 s Key: Q = automatic qualifier, q = secondary qualifier, SB = season’s best, PB = personal best.
Positional analysis
Figure 19 shows the relative position of each athlete at each 20 m split along the home straight.
Figure 19. Positions at the beginning of the home straight and at each 20 m split.
0
1
2
3
4
5
6
7
8
9
10100m 120m 140m 160m 180m 200m
YOUNG
MAKWALA
MITCHELLBLAKELIMA
IIZUKA
TORTU
SIMBINE
GREAUX
DWYER

23
Individual split times
The following graphs display the split times of all athletes over each: 100 m split (Figures 20 and
21; note: 0-100 m is displayed without the reaction time), and consecutive 20 m splits during the
home straight (Figure 22). The mean speed over progressive 20 m splits throughout the home
straight is presented in Figure 23.
Figure 20. Individual 0-100 m split times (minus reaction time).
Figure 21. Individual 100-200 m split times.
10.14 s
10.22 s
10.27 s
10.53 s
10.31 s
10.40 s
10.28 s
10.42 s
10.28 s
8.6 s 9.1 s 9.6 s 10.1 s 10.6 s
YOUNG
MAKWALA
MITCHELL BLAKE
LIMA
IIZUKA
TORTU
SIMBINE
GREAUX
DWYER
0-100 m
9.82 s
9.73 s
9.75 s
9.87 s
10.14 s
10.04 s
10.16 s
10.05 s
10.24 s
8.6 s 9.1 s 9.6 s 10.1 s 10.6 s
YOUNG
MAKWALA
MITCHELL BLAKE
LIMA
IIZUKA
TORTU
SIMBINE
GREAUX
DWYER
100-200 m

24
Figure 22. Individual consecutive 20 m split times during the home straight.
1.86 s1.89 s 1.90 s 1.92 s 1.93 s 1.94 s 1.93 s
1.90 s 1.92 s
1.7 s
1.8 s
1.9 s
2.0 s
YOUNG MAKWALA MITCHELL BLAKE LIMA IIZUKA TORTU SIMBINE GREAUX DWYER
100-120 m
1.87 s 1.86 s 1.88 s1.92 s 1.93 s 1.93 s 1.94 s 1.94 s 1.95 s
1.7 s
1.8 s
1.9 s
2.0 s
YOUNG MAKWALA MITCHELL BLAKE LIMA IIZUKA TORTU SIMBINE GREAUX DWYER
120-140 m
1.95 s1.92 s 1.93 s 1.93 s
2.03 s1.99 s 2.00 s 1.98 s
2.02 s
1.8 s
1.9 s
2.0 s
2.1 s
YOUNG MAKWALA MITCHELL BLAKE LIMA IIZUKA TORTU SIMBINE GREAUX DWYER
140-160 m
2.00 s1.97 s 1.97 s 1.98 s
2.09 s2.05 s
2.09 s 2.08 s2.11 s
1.9 s
2.0 s
2.1 s
2.2 s
YOUNG MAKWALA MITCHELL BLAKE LIMA IIZUKA TORTU SIMBINE GREAUX DWYER
160-180 m
2.14 s2.09 s 2.07 s
2.12 s 2.16 s 2.13 s2.20 s
2.15 s2.24 s
1.7 s
1.9 s
2.1 s
2.3 s
YOUNG MAKWALA MITCHELL BLAKE LIMA IIZUKA TORTU SIMBINE GREAUX DWYER
180-200 m

25
Figure 23. Mean running speed during each 20 m split throughout the home straight.
8.5
9.5
10.5
11.5
100-120m 120-140m 140-160m 160-180m 180-200m
Run
ning
spe
ed (m
/s)
DWYER
GREAUX
SIMBINE
TORTU
IIZUKA
LIMA
MITCHELLBLAKE
MAKWALA
YOUNG
26
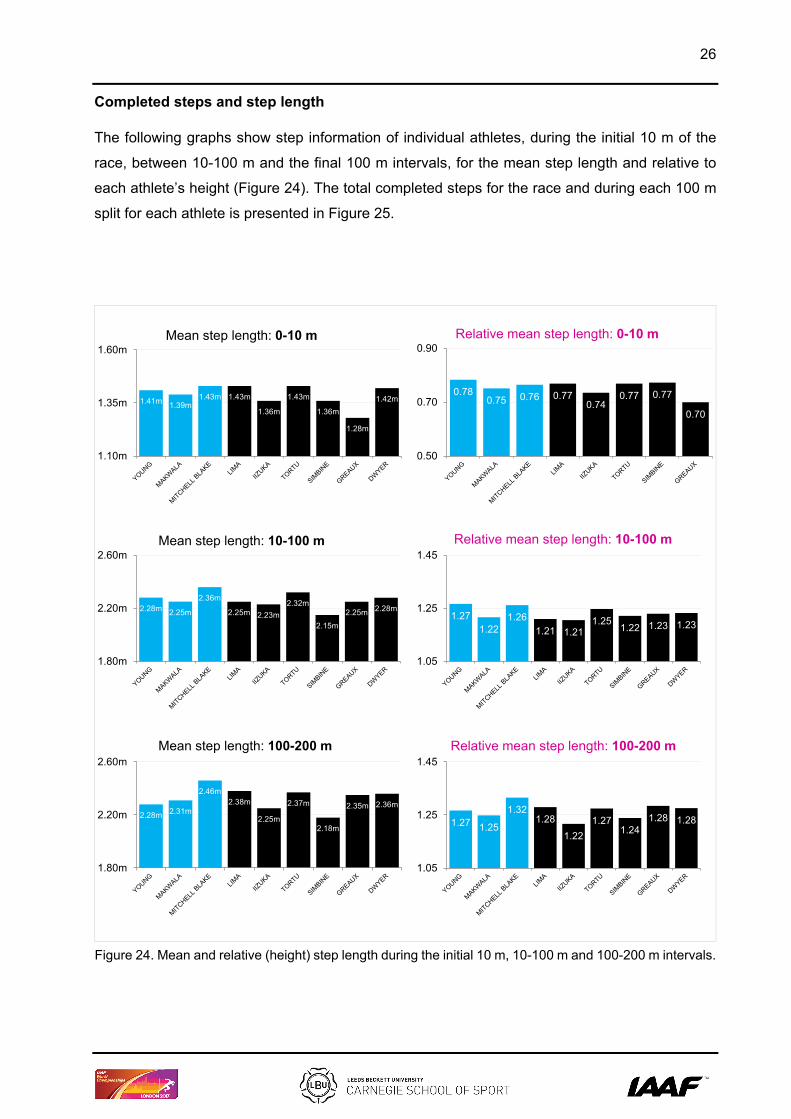
Completed steps and step length
The following graphs show step information of individual athletes, during the initial 10 m of the
race, between 10-100 m and the final 100 m intervals, for the mean step length and relative to
each athlete’s height (Figure 24). The total completed steps for the race and during each 100 m
split for each athlete is presented in Figure 25.
Figure 24. Mean and relative (height) step length during the initial 10 m, 10-100 m and 100-200 m intervals.
1.41m 1.39m1.43m 1.43m
1.36m
1.43m
1.36m
1.28m
1.42m
1.10m
1.35m
1.60mMean step length: 0-10 m
0.780.75 0.76 0.77
0.740.77 0.77
0.70
0.50
0.70
0.90Relative mean step length: 0-10 m
2.28m 2.25m
2.36m
2.25m 2.23m2.32m
2.15m2.25m 2.28m
1.80m
2.20m
2.60mMean step length: 10-100 m
1.271.22
1.261.21 1.21
1.251.22 1.23 1.23
1.05
1.25
1.45Relative mean step length: 10-100 m
2.28m 2.31m
2.46m2.38m
2.25m
2.37m
2.18m
2.35m 2.36m
1.80m
2.20m
2.60mMean step length: 100-200 m
1.27 1.25
1.321.28
1.221.27
1.241.28 1.28
1.05
1.25
1.45Relative mean step length: 100-200 m

27
Figure 25. Total completed steps during the race, within the initial 10 m, between 10 and 100 m and 100 and 200 m intervals.
7.08
7.18
7.00
7.00
7.37
7.00
7.36
7.83
7.06
39.39
39.92
38.08
40.00
40.38
38.79
41.86
39.99
39.39
43.82
43.29
40.62
42.00
44.43
42.21
45.78
42.49
42.44
90.3
90.4
85.7
89.0
92.2
88.0
95.0
90.3
88.9
0 20 40 60 80 100 120
YOUNG
MAKWALA
MITCHELL BLAKE
LIMA
IIZUKA
TORTU
SIMBINE
GREAUX
DWYER
0-10m 10-100m 100-200m Total 200m

28
RESULTS – Semi-Final 2
Performance data
Table 12 below displays the ranking of each athlete before the World Championships across all
athletes qualifying for the semi-finals, based on their season’s (SB) and personal best (PB) times,
and a comparison to their semi-final time.
Table 12. Athletes’ ranking based on SB and PB, and comparison to their semi-final performance.
Athlete SB rank PB rank SEMI-FINAL notes vs. SB vs. PB
RICHARDS 4 11 20.14 s Q 0.17 s 0.17 s
SANI BROWN 18 21 20.43 s Q 0.11 s 0.11 s
BLAKE 4 1 20.52 s 0.55 s 1.26 s
SIAME 15 19 20.54 s 0.25 s 0.25 s
KING 14 18 20.59 s 0.32 s 0.32 s
VOLKO 19 22 20.61 s 0.28 s 0.28 s
HUGHES 13 12 20.85 s 0.63 s 0.83 s
WILSON 22 24 21.22 s 0.85 s 0.85 s
Key: Q = automatic qualifier, q = secondary qualifier, SB = season’s best, PB = personal best.
Positional analysis
Figure 26 shows the relative position of each athlete at each 20 m split along the home straight.
Figure 26. Positions at the beginning of the home straight and each 20 m split.
0
1
2
3
4
5
6
7
8
9100m 120m 140m 160m 180m 200m
RICHARDS
SANIBROWNBLAKE
SIAME
KING
VOLKO
HUGHES
WILSON

29
Individual split times
The following graphs display the split times of all athletes over each: 100 m split (Figures 27 and
28; note: 0-100 m is displayed without the reaction time), and consecutive 20 m splits during the
home straight (Figure 29). The mean speed over progressive 20 m splits throughout the home
straight is presented in Figure 30.
Figure 27. Individual 0-100 m split times (minus reaction time).
Figure 28. Individual 100-200 m split times.
10.21 s
10.16 s
10.25 s
10.28 s
10.34 s
10.32 s
10.39 s
10.50 s
8.6 s 9.1 s 9.6 s 10.1 s 10.6 s
RICHARDS
SANI BROWN
BLAKE
SIAME
KING
VOLKO
HUGHES
WILSON
0-100 m
9.77 s
10.08 s
10.10 s
10.11 s
10.09 s
10.12 s
10.34 s
10.58 s
8.6 s 9.1 s 9.6 s 10.1 s 10.6 s
RICHARDS
SANI BROWN
BLAKE
SIAME
KING
VOLKO
HUGHES
WILSON
100-200 m

30
Figure 29. Individual consecutive 20 m split times during the home straight.
1.85 s
1.91 s1.88 s 1.89 s
1.92 s 1.92 s 1.94 s 1.95 s
1.7 s
1.8 s
1.9 s
2.0 s
RICHARDS SANI BROWN BLAKE SIAME KING VOLKO HUGHES WILSON
100-120 m
1.87 s 1.89 s 1.91 s 1.91 s1.94 s 1.93 s 1.95 s 1.97 s
1.7 s
1.8 s
1.9 s
2.0 s
RICHARDS SANI BROWN BLAKE SIAME KING VOLKO HUGHES WILSON
120-140 m
1.89 s
1.95 s1.92 s
1.97 s1.93 s 1.94 s
2.00 s 2.01 s
1.8 s
1.9 s
2.0 s
2.1 s
RICHARDS SANI BROWN BLAKE SIAME KING VOLKO HUGHES WILSON
140-160 m
1.97 s2.05 s
2.10 s 2.07 s 2.06 s2.11 s 2.14 s
2.22 s
1.7 s
1.9 s
2.1 s
2.3 s
RICHARDS SANI BROWN BLAKE SIAME KING VOLKO HUGHES WILSON
160-180 m
2.19 s2.28 s 2.29 s 2.27 s 2.24 s 2.22 s
2.31 s
2.44 s
1.9 s
2.1 s
2.3 s
2.5 s
RICHARDS SANI BROWN BLAKE SIAME KING VOLKO HUGHES WILSON
180-200 m

31
Figure 30. Mean running speed during each 20 m split throughout the home straight.
8.0
9.0
10.0
11.0
100-120m 120-140m 140-160m 160-180m 180-200m
Run
ning
spe
ed (m
/s)
WILSON
HUGHES
VOLKO
KING
SIAME
BLAKE
SANI BROWN
RICHARDS
32
Completed steps and step length
The following graphs show step information of individual athletes, during the initial 10 m of the
race, between 10-100 m and the final 100 m intervals, for the mean step length and relative to
each athlete’s height (Figure 31). The total completed steps for the race and during each 100 m
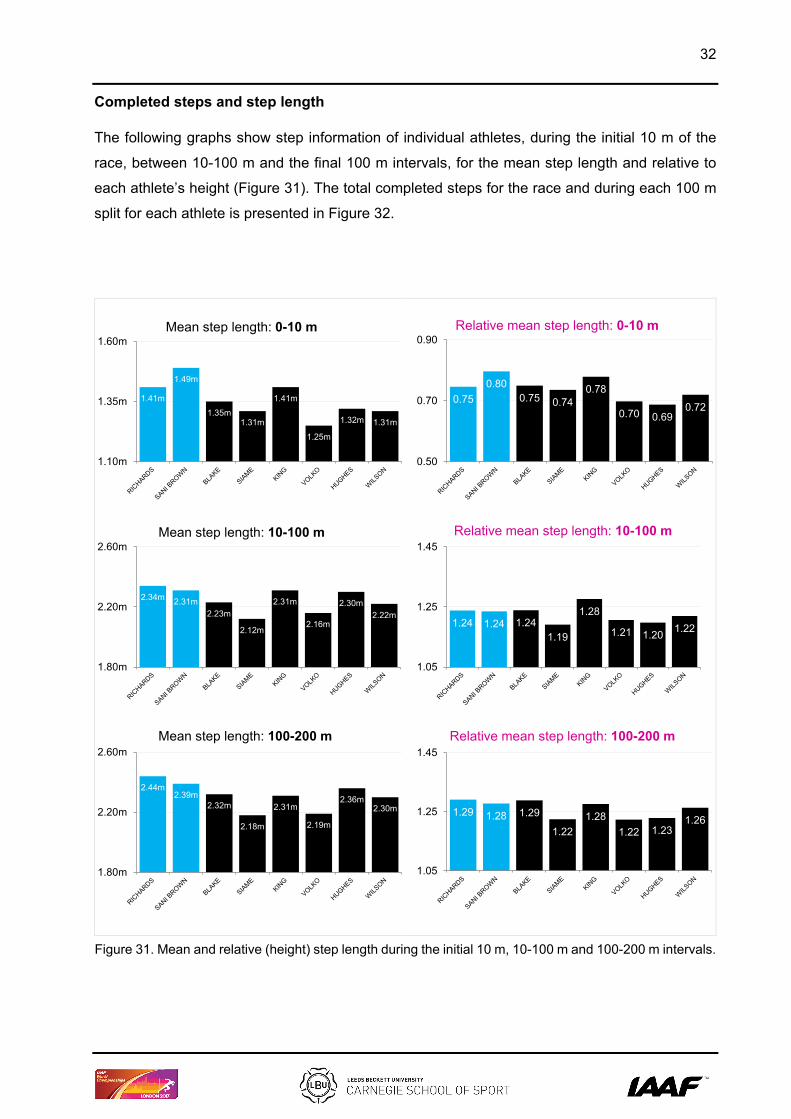
split for each athlete is presented in Figure 32.
Figure 31. Mean and relative (height) step length during the initial 10 m, 10-100 m and 100-200 m intervals.
1.41m
1.49m
1.35m1.31m
1.41m
1.25m
1.32m 1.31m
1.10m
1.35m
1.60mMean step length: 0-10 m
0.750.80
0.75 0.740.78
0.70 0.690.72
0.50
0.70
0.90Relative mean step length: 0-10 m
2.34m 2.31m2.23m
2.12m
2.31m
2.16m
2.30m2.22m
1.80m
2.20m
2.60mMean step length: 10-100 m
1.24 1.24 1.241.19
1.28
1.21 1.20 1.22
1.05
1.25
1.45Relative mean step length: 10-100 m
2.44m2.39m
2.32m
2.18m
2.31m
2.19m
2.36m2.30m
1.80m
2.20m
2.60mMean step length: 100-200 m
1.29 1.28 1.29
1.221.28
1.22 1.231.26
1.05
1.25
1.45Relative mean step length: 100-200 m

33
Figure 32. Total completed steps during the race, within the initial 10 m, between 10 and 100 m and 100 and 200 m intervals.
7.11
6.73
7.41
7.65
7.08
8.00
7.59
7.62
38.47
39.02
40.40
42.51
38.92
42.73
39.06
40.51
40.94
41.77
43.19
45.84
43.26
45.69
42.35
43.52
86.5
87.5
91.0
96.0
89.3
96.4
89.0
91.7
0 20 40 60 80 100 120
RICHARDS
SANI BROWN
BLAKE
SIAME
KING
VOLKO
HUGHES
WILSON
0-10m 10-100m 100-200m Total 200m

34
RESULTS – Semi-Final 3
Performance data
Table 13 below displays the ranking of each athlete before the World Championships across all
athletes qualifying for the semi-finals, based on their season’s (SB) and personal best (PB) times,
and a comparison to their semi-final time.
Table 13. Athletes’ ranking based on SB and PB, and comparison to their semi-final performance.
Athlete SB rank PB rank SEMI-FINAL notes vs. SB vs. PB
GULIYEV 7 8 20.17 s Q 0.09 s 0.29 s
WEBB 8 6 20.22 s Q 0.13 s 0.37 s
VAN NIEKERK 2 5 20.28 s q 0.44 s 0.44 s
LEMAITRE 15 3 20.30 s 0.01 s 0.50 s
TALBOT 11 15 20.38 s 0.22 s 0.22 s
TSÁKONAS 19 13 20.73 s 0.40 s 0.64 s
GEORGE 24 25 20.74 s 0.33 s 0.33 s
KOFFI HUA 24 17 20.80 s 0.39 s 0.55 s
Key: Q = automatic qualifier, q = secondary qualifier, SB = season’s best, PB = personal best.
Positional analysis
Figure 33 shows the relative position of each athlete at each 20 m split along the home straight.
Figure 33. Positions at the beginning of the home straight and each 20 m split.
0
1
2
3
4
5
6
7
8
9100m 120m 140m 160m 180m 200m
GULIYEV
WEBB
VANNIEKERKLEMAITRE
TALBOT
TSÁKONAS
GEORGE
KOFFI HUA
35
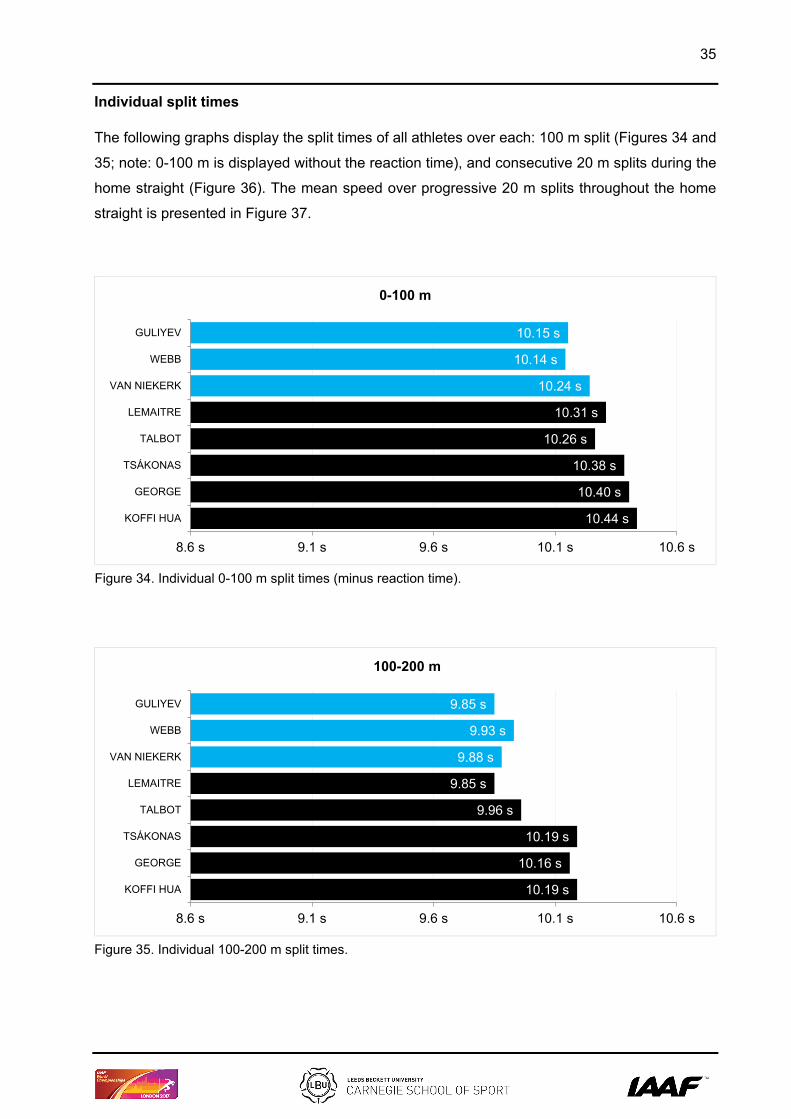
Individual split times
The following graphs display the split times of all athletes over each: 100 m split (Figures 34 and
35; note: 0-100 m is displayed without the reaction time), and consecutive 20 m splits during the
home straight (Figure 36). The mean speed over progressive 20 m splits throughout the home
straight is presented in Figure 37.
Figure 34. Individual 0-100 m split times (minus reaction time).
Figure 35. Individual 100-200 m split times.
10.15 s
10.14 s
10.24 s
10.31 s
10.26 s
10.38 s
10.40 s
10.44 s
8.6 s 9.1 s 9.6 s 10.1 s 10.6 s
GULIYEV
WEBB
VAN NIEKERK
LEMAITRE
TALBOT
TSÁKONAS
GEORGE
KOFFI HUA
0-100 m
9.85 s
9.93 s
9.88 s
9.85 s
9.96 s
10.19 s
10.16 s
10.19 s
8.6 s 9.1 s 9.6 s 10.1 s 10.6 s
GULIYEV
WEBB
VAN NIEKERK
LEMAITRE
TALBOT
TSÁKONAS
GEORGE
KOFFI HUA
100-200 m

36
Figure 36. Individual consecutive 20 m split times during the home straight.
1.87 s 1.87 s 1.88 s 1.90 s 1.88 s1.92 s 1.92 s 1.94 s
1.7 s
1.8 s
1.9 s
2.0 s
GULIYEV WEBB VAN NIEKERK LEMAITRE TALBOT TSÁKONAS GEORGE KOFFI HUA
100-120 m
1.88 s 1.89 s 1.90 s 1.89 s 1.91 s 1.92 s 1.94 s 1.94 s
1.7 s
1.8 s
1.9 s
2.0 s
GULIYEV WEBB VAN NIEKERK LEMAITRE TALBOT TSÁKONAS GEORGE KOFFI HUA
120-140 m
1.96 s 1.94 s 1.96 s 1.95 s1.98 s
2.05 s2.01 s 2.01 s
1.8 s
1.9 s
2.0 s
2.1 s
GULIYEV WEBB VAN NIEKERK LEMAITRE TALBOT TSÁKONAS GEORGE KOFFI HUA
140-160 m
2.01 s2.05 s 2.05 s 2.03 s
2.07 s2.11 s 2.11 s 2.12 s
1.9 s
2.0 s
2.1 s
2.2 s
GULIYEV WEBB VAN NIEKERK LEMAITRE TALBOT TSÁKONAS GEORGE KOFFI HUA
160-180 m
2.13 s2.18 s
2.09 s 2.08 s2.12 s
2.19 s 2.18 s 2.18 s
1.9 s
2.0 s
2.1 s
2.2 s
GULIYEV WEBB VAN NIEKERK LEMAITRE TALBOT TSÁKONAS GEORGE KOFFI HUA
180-200 m

37
Figure 37. Mean running speed during each 20 m split throughout the home straight.
8.5
9.5
10.5
11.5
100-120m 120-140m 140-160m 160-180m 180-200m
Run
ning
spe
ed (m
/s)
KOFFI HUA
GEORGE
TSÁKONAS
TALBOT
LEMAITRE
VAN NIEKERK
WEBB
GULIYEV

38
Completed steps and step length
The following graphs show step information of individual athletes, during the initial 10 m of the
race, between 10-100 m and the final 100 m intervals, for the mean step length and relative to
each athlete’s height (Figure 38). The total completed steps for the race and during each 100 m
split for each athlete is presented in Figure 39.
Figure 38. Mean and relative (height) step length during the initial 10 m, 10-100 m and 100-200 m intervals.
1.35m1.41m 1.41m 1.43m
1.36m 1.37m 1.37m1.40m
1.10m
1.35m
1.60mMean step length: 0-10 m
0.720.78 0.77 0.75 0.74 0.74
0.82
0.75
0.50
0.70
0.90Relative mean step length: 0-10 m
2.32m2.40m 2.41m
2.46m
2.15m
2.32m
2.19m
2.35m
1.80m
2.20m
2.60mMean step length: 10-100 m
1.24
1.33 1.32 1.29
1.17
1.251.31
1.26
1.05
1.25
1.45Relative mean step length: 10-100 m
2.42m2.47m
2.56m 2.57m
2.27m
2.37m
2.24m
2.42m
1.80m
2.20m
2.60mMean step length: 100-200 m
1.29
1.361.40
1.35
1.231.28
1.341.30
1.05
1.25
1.45Relative mean step length: 100-200 m

39
Figure 39. Total completed steps during the race, within the initial 10 m, between 10 and 100 m and 100 and 200 m intervals.
7.41
7.07
7.11
7.00
7.35
7.28
7.29
7.14
38.83
37.47
37.35
36.59
41.80
38.80
41.07
38.28
41.32
40.46
39.03
38.88
44.09
42.13
44.68
41.29
87.6
85.0
83.5
82.5
93.2
88.2
93.0
86.7
0 20 40 60 80 100 120
GULIYEV
WEBB
VAN NIEKERK
LEMAITRE
TALBOT
TSÁKONAS
GEORGE
KOFFI HUA
0-10m 10-100m 100-200m Total 200m

40
COACH’S COMMENTARY
Historical analysis and coaching commentary – Pierre-Jean Vazel
This commentary on London’s 200 m report will provide training information about the finalists in
order to illustrate and put into perspective the biomechanical findings on speed endurance.
Speed endurance abilities of 200-400 m types
Information regarding the speed endurance training was gathered from the top six finalists of the
London 200 m or from their coaches. Two of them, Wayde van Niekerk (silver medallist) and
Isaac Makwala (6th place), were also finalists at 400 m and obviously these 200-400 m types are
the ones who have used the longest runs in practice. However, it did not seem to provide them
with the ability to run the last segments of the 200 m final faster than the others, or display a lower
deceleration rate. Indeed, running the 200 m less than 20 s requires covering the last 50 m over
10 m/s under fatigue, a velocity that is also reached during a 400 m race, but before fatigue sets
in. This is shown in the analysis of the four fastest 400 m runners. First, van Niekerk was over 10
m/s in the 50-200 m section of his 43.03 s world record race (43.03 s in Rio 2016, Yamamoto,
2016). In addition, Michael Johnson did so in the 50 to 150 m section (43.18 s in Sevilla 1999,
Ferro, 2001), Butch Reynolds 50 to 100 m (43.29 s in Zürich 1988) and Jeremy Wariner in the 45
to 115 m section (43.45 s in Osaka 2007, Mochida, 2010). In these sections, the runners are in
the “comfort zone”, trying to run as smooth and relaxed as possible, which is different from the
effort expenditure necessary in the finish of a 200 m.
The structure of the stride reflects this search for economy during the 400 m vs. efficiency during
the 200 m. For instance, van Nierkerk ran the 100-200 m section of his 400 m final in London in
9.93 s, or at 10.07 m/s, with a 2.65 m step length at a rate of 3.80 Hz. During the 200 m final, he
covered that 100-200 m section marginally faster, 9.80 s or 10.20 m/s, but with less amplitude,
2.58 m at a higher rate of 3.95 Hz. Interestingly, two of the fastest 400 m runners ever, Reynolds
and Wariner, never ran under 20 s at 200 m. As indicated in the 400 m commentary of the
London’s 2017 report, one of the main features of successful 400 m runners is the ability to
prevent a high drop in step frequency in the 300-400 m section. Reynolds and Wariner excelled
in this area, but doing so at velocities ranging between 8.5 and 8.9 m/s, which is very different to
what is found during the 200 m. This specialisation and adaptation for 400 m did not allow them
to be able to produce a step frequency high enough under less fatigued conditions, which is
necessary for reaching higher top-speed velocity.

41
Van Niekerk has improved his running velocity at 200 m, by increasing his step rate from his
personal best whilst a teenager until his current lifetime best, the same as what he did at 400 m
(cf. commentary of London’s 200 m report). His reliance on step frequency was further
demonstrated in London as his slower time was explained by a lower rate.
Progression of Wayde van Niekerk.
Meet Age Time (s) No. of steps Step length (m) Step rate (Hz)
WJ 2010 18 21.02 82.8 2.42 3.94
Kingston 2017 24 19.84 83.4 2.40 4.20
London 2017 24 20.11 83.4 2.40 4.15 Note: WJ = World Junior Championships.
The world champion Ramil Guliyev also displays a similar reliance on step rate rather than step
length.
Progression of Ramil Guliyev.
Meet Age Time (s) No. of steps Step length (m) Step rate (Hz)
Beijing 2008 18 20.66 88.0 2.27 4.26
Zagreb 2015 25 19.88 88.2 2.27 4.44
London 2017 27 20.09 88.5 2.26 4.41
Of all the finalists from measurements at 150 m, Guliyev had the highest rate (Table 4) as he was
the only one to produce contact times below 0.100 s (Figure 15). Contact times of 0.10-0.11 s
were reported for the 1984 Olympic Games gold and silver medallists, Carl Lewis 19.80 s and
Kirk Baptiste 19.96 s at 125 m and 180 m (Mann, 1985). Guliyev managed to do so in preparing
a quick leg recovery with an abbreviated leg extension to terminate the non-productive latter
portion of ground contact (Mann, 1985), as measured at toe-off by the smallest distance of the
foot relative to the athlete’s body (Table 5) and one of the smallest knee angle among the finalists.
This led to an efficient swing of the leg as evidenced by the smallest angle between thighs at
touchdown (η angle, Table 7). This is in line with what was measured in Michael Johnson at the
1991 World Championships (Ito, 1994). These mechanical features of the leg motion are close to
the model for top speed at 100 m (Tiupa, 1988), implying that Guliyev displays very good speed
endurance with little modifications on his step parameters. A study on the 200 m 2003 World
Championship medallist, Shingo Suetsugu (Kijima, 2005) found that the main difference between
his sprint stride at maximum velocity during 100 m (11.5 m/s for a 10.13 s result) and at 150 m
into a 200 m (11.0 m/s for 20.03 s) was in the angular velocity of knee flexion when the heel goes
under the gluteus, and of the leg extension when the foot moves further away in front of the body.

42
This illustrates that one should not focus exclusively on what happens during the contact phase;
the swing of the leg also needs to be analysed to understand the mechanical adaptation of stride
during fatigue.
While step rate seems to have a high importance for success in speed endurance, athletes with
step length reliance have also found success, the main example being Usain Bolt, current world
record holder with 19.19 s.
Progression of Usain Bolt.
Meet Age Time (s) No. of steps Step length (m) Step rate (Hz)
WJ 2002 15 20.58 85.1 2.35 4.13
Berlin WC 2009 22 19.19 80.0 2.50 4.17 Note: WJ = World Junior Championships.
Speed endurance training of 100-200 m types
The fastest finisher of London’s 200 m final was Jereem Richards with a last 100 m time of 9.70
s. Whilst he has never run a 100 m in competition and is a useful 400 m runner (45.21 s and a
flying-started 43.60 s in the 4x400 m relay to win gold medal in London for Trinidad and Tobago),
he cannot really be considered as a 400 m specialist as he has never took part in the individual
400 m in championships. His training personal bests of 14.6 s at 150 m, 25.9 s at 250 m and 31.6
s at 300 m (hand timing), provide a good balance between the speed and speed endurance
required for 200 m, as he moved up in position from 5th at 130 m to 3rd place in London’s final.
Nethaneel Mitchell-Blake also had a strong finish, as he was 7th at 130 m and eventually placed
4th. He has run the 400 m only once in his career, a good 46.55 s in 2016, but is more of a short
sprint specialist with a 9.99 s at 100 m. His training times are virtually the same as Richards, 14.6
s at 150 m and 25.9 s at 250 m, but he has never been timed at 300 m. Ameer Webb is the only
other top-6 finisher in London to have no training reference at 300 m. He has only ran 250 m on
a couple of occasions in the past years, and has generally used distances longer than 150 m in
segment style, according to his coach Stuart McMillan. His best is a very fast 25.6 s, which was
ran a week before a 9.90 s and 19.91 s double in Walnut, CA in April 2016. Although the average
velocity of a 250 m race is significantly slower than of a 200 m, it is an interesting specific workout
as the first 200 m is run at sub-maximum effort (20.2 s for Webb’s training race). Yet, this was
close to competitive time at 200 m and the last 50 m is covered at full effort under fatigue, as
velocities are close to what are found in the last segments of the 200 m race, more than what
could be found in 300 or 400 m races. The times given by the top 6 finalists range between 25.5
s and 25.9 s for 250 m, and from 14.2 s to 14.8 s at 150 m. To run sub-20 s in competition, 300

43
m times may not be required, however it seems necessary to have run under 15 s 150 m and 26
s at 250 m during the preparation, although a very fast 150 m could compensate a slower 250 m,
and vice-versa. However, from a larger collection of training data from world-class sprinters, the
250 m training times are more related to 200 m results in competition than 150 m times. Indeed,
the Figure 9 shows that velocity curves drop after 150 m, confirming previous split analysis during
the 1987 and 2007 World Championships (Moravec, 1990; Tsuchie, 2010).
Besides these time trials, examples of significant speed endurance workouts were kindly given
by two of the finalists who have more a 100-200 m profile, having run under 10 s and 20 s, rather
than 200-400 m:
• Example A, running for time: two sets of two reps of 200 m, with 5- and 12-minute rests in
between runs, all timed between 21 s and 21.4 s.
• Example B, running for distance: three races in segments with about 15 minutes of rest:
first race 24 s run split in 7 s smooth, 8 s a little faster and 9 s fast; second one is 6, 7 and
8 s of the same progressive acceleration, and last rep is 5, 6 and 7 s.
As discussed before, a 150 m time-trial is not enough to predict success in 200 m competition.
As an illustration, a former world champion who still is in the all-time top 10 performers at 100 m
and 200 m, has a training best of 14.3 s at 150 m, but has been able to do 3 of them in 14.5 s
average with 8 minutes rest, which was more representative of his speed endurance abilities.
In 1979, six days before breaking the world record in 19.72 s, which still stands as a European
record, Italian Pietro Mennea was doing 6 reps of 80 m in 8.4-8.5 s with 2 minutes rest, followed
by 10 minutes rest and one 200 m in 20.7 s, followed by 12 minutes rest and one 250 m in 27.3
s (Mennea 2011). Contemporary methods of training seem to have shift towards less repetition
and faster pace than used before.
The present report provides a unique collection of biomechanical data recorded during the speed
endurance phase. It will help coaches to assess the individual needs of their athletes and plan
specific workouts for the requirements of the 200 m race in competition.

44
Bibliography
Ferro A. & al. Biomechanical analysis of the 7th World Championships in Athletics Seville 1999. IAAF New Studies in Athletics, vol. 16, n.1, p. 25-60, 2001. Ito & al. Biomechanical analysis of World top sprinters. 3rd IAAF World championships in Athletics Tokyo’91, Biomechanical report, JAAF, p. 31-56, 1994 (in Japanese). Mann R., Herman J. Kinematic Analysis of Olympic Sprint Performance: Men’s 200 meters. International Journal of Sports Biomechanics, n.1, p. 151-162, 1985. Mennea P. 19.72, a record from another time. Delta Tre edition, 203 p., 2011 (in Italian). Mochida T., Sugita M. Biomechanical analysis of the 400 metres final race at the 2007 World Championships in Athletics, in The 11th World Championships in Osaka, Technique and performance of the world’s best competitors, final complete report, JAAF Biomechanical team research group, p. 51-75, 2010. Moravec P. & al. Time analysis of the sprints, in Scientific Report on the II World Championships in Athletics Rome 1987, Second Edition, IAF, 59p. 1990. Takahashi & al. Race analysis of the Japanese and World’s leading 200m athletes. Analysis of the major men and women’s 200m races of 2015. Bulletin of Studies in Athletics of JAAF, Vol. 11, p.115-127, 2015 (in Japanese). Tiupa V. & al. Sprint races: Visual evaluation of technique. Legkaya Atletika, n. 9, p. 16-17, 1988 (in Russian). Tsuchie H. & al. Male 200 m running speed at World Championship Osaka 2007. Bulletin of Studies in Athletics of JAAF, vol. 6, p. 72-84, 2010 (in Japanese). Yamamoto & al. Analysis of the major men and women’s 400m races of 2016. Bulletin of Studies in Athletics of JAAF, Vol. 12, p.98-103, 2016 (in Japanese).

45
Coaching commentary – Ralph Mouchbahani
Looking at the data in the semi-finals, in confirms that speed-dominance is more important than
endurance-dominance through the ability of mastering the technical model throughout the race.
The winner, Guliyev, based his achievement on a fast first 100 m, increasing frequency in the
second 100 m, which was reflected through the number of steps taken in the second 100 m,
relative to the other qualifiers from this semi-final (Figure 39). Similar patterns were seen in the
final for the gold and silver medallists. Guliyev and van Niekerk based their rankings on a fast first
100 m, which is also shown in the number of steps taken (Figure 11).
In the final, the data collected for podium finishers reflects the technical execution of the stride,
showing that the quick recovery of the swing leg at touchdown (small negative angle) is important
for ground contact times. The quick recovery is reflected in the swing leg velocities from toe-off
to touchdown (see Figure 16 and Table 6).
The data shown in Table 4 (step length, step rate and step velocity), as well as the contact and
flight time data (Figure 15) show the importance of securing short contact times. This, in return
confirms that the mastery of sprinting mechanics is reflected by these athletes. The average
speed over consecutive 10 m splits throughout the home straight backs up this statement.
Consequences for training
1. Special endurance and specifically speed endurance should only back up the
maintenance of speed ability but cannot compensate for a lack of speed.
2. A fast bend based on proper running mechanics secures the maintenance of velocity and
limited loss to the finish.
3. Active preparation of the ground contact is crucial for short ground contact in
consequence.
4. The focus in the final 50 m of the race is on maintaining stride frequency rather than stride
length.

46
Recommendations for training
It would be recommended to master technique first, with special endurance to back up the ability
to reproduce the technical model over the duration of the race, and speed endurance to expose
competition demands.
Focus on the technical model in the bend:
1. Acceleration drills into the bend: fast bounds, single bounds, emphasising single track
mechanics versus dual track mechanics on the straight.
2. Transition mechanics: shuffle, combined bounds-shuffle or shuffle-step over mechanics
drills in the bend and from the bend onto the straight, switching from single track to dual
track.
3. Maintenance mechanics: step over drills with quick heel recovery underneath the body
and step over mechanics with active knee drive, focussing on maintaining frequency and
not length of the stride (hot track image).

47
CONTRIBUTORS
Dr Lysander Pollitt is a Senior Lecturer in Sport and Exercise
Biomechanics at Leeds Beckett University. His research
interests primarily focus on neuromuscular biomechanics,
particularly the impact of surface instability on performance.
Previously, Lysander has provided applied biomechanical
support to British Weight Lifting, including preparation for the
2012 Olympics in London. He was also an integral part of the
development and implementation of the talent identification
programme, which also aimed to increase awareness and
enhance participation within the sport.
Josh Walker, MSc is currently a Senior Research Project
Officer within the Carnegie School of Sport at Leeds Beckett
University. Josh joined Leeds Beckett in 2013 where he
studied at both undergraduate and postgraduate level and
has a research interest into the biomechanics of cycling and
running, particularly within the areas of muscle-tendon
architecture, neuromuscular performance and the effects of
different modes of exercise on muscle fascicle behaviour and
neuromechanical effectiveness.
Dr Catherine Tucker is a Senior Lecturer in Sport and
Exercise Biomechanics at Leeds Beckett University.
Catherine graduated with First Class Honours in Sport and
Exercise Sciences from the University of Limerick and
subsequently completed a PhD in sports biomechanics, also
at the University of Limerick. Catherine’s main research
interests centre on the biomechanics of striking movements,
particularly golf. She is also interested in movement
variability with respect to gait and how it relates to movement
outcome / injury reduction.

48
Dr Athanassios Bissas is the Head of the Biomechanics
Department in the Carnegie School of Sport at Leeds Beckett
University. His research includes a range of topics but his
main expertise is in the areas of biomechanics of sprint
running, neuromuscular adaptations to resistance training,
and measurement and evaluation of strength and power. Dr
Bissas has supervised a vast range of research projects
whilst having a number of successful completions at PhD
level. Together with his team he has produced over 100
research outputs and he is actively involved in research
projects with institutions across Europe.
Ralph Mouchbahani is a global master in implementing sport
structures for federations within a high-performance
environment. He is an editor of the IAAF Coaches Education
and Certification System and a senior IAAF and DOSB
lecturer with exceptional athletic technical knowledge and a
passion for sport research. In his career, he has coached
many elite athletes, including sprinters, helping them to
achieve podium performances at several international
competitions. Ralph is managing partner in Athletic-
Solutions, a company that focuses on bringing Sport Science
and Practice together to help coaches maximise their efforts.
Pierre-Jean Vazel is a sprint and throws coach at Athlétisme
Metz Métropole club in France. PJ is a 5th year graduate in
Fine Arts and has covered 2 Olympics, 9 World
Championships and over 300 meetings as a coach or
chronicler for Le Monde and IAAF website. Since 2004 he
coached national champions from six countries including Olu
Fasuba to the 100 m African Record (9.85 s) and 60 m world
indoor title. PJ is co-author of the ALTIS Foundation course
and has done many lectures on the history of sprint science
and training.