Embed Size (px)
Citation preview

For Review O
nly
Combustion of Microalgae Nannochloropsis oculata
Biomass: Cellular Macromolecular and Mineralogical Content Changes During Thermal Decomposition
Journal: Songklanakarin Journal of Science and Technology
Manuscript ID SJST-2017-0074.R2
Manuscript Type: Original Article
Date Submitted by the Author: 05-Sep-2017
Complete List of Authors: Sukarni, Sukarni; Universitas Negeri Malang, Department of Mechanical
Engineering Yanuhar, Uun; Universitas Brawijaya, Department of Water Resources Management, Faculty of Fisheries and Marine Sciences Wardana, I.N.G.; Universitas Brawijaya, Department of Mechanical Engineering Sudjito, Sudjito; Universitas Brawijaya, Department of Mechanical Engineering Hamidi, Nurkholis ; Universitas Brawijaya, Department of Mechanical Engineering Wijayanti, Widya ; Universitas Brawijaya, Department of Mechanical Engineering Wibisono, Yusuf ; Universitas Brawijaya, Bioprocess Engineering,
Department of Agricultural Engineering Sumarli , Sumarli ; Universitas Negeri Malang, Department of Mechanical Engineering Nauri, Imam; Universitas Negeri Malang, Department of Mechanical Engineering Suryanto, Heru ; Universitas Negeri Malang, Department of Mechanical Engineering
Keyword: combustion, microalgae, Nannochloropsis oculata, cellular macromolecular, mineralogical content
For Proof Read only
Songklanakarin Journal of Science and Technology SJST-2017-0074.R2 Sukarni

For Review O
nly
Original Article
Combustion of Microalgae Nannochloropsis oculata Biomass: Cellular
Macromolecular and Mineralogical Content Changes During Thermal
Decomposition
Sukarni Sukarni1,*, Uun Yanuhar2, I.N.G. Wardana3, Sudjito Sudjito3, Nurkholis
Hamidi3, Widya Wijayanti3, Yusuf Wibisono4, Sumarli Sumarli1, I.M. Nauri1, and Heru
Suryanto1
1 Center for Renewable and Sustainable Energy Engineering, Department of Mechanical
Engineering, Faculty of Engineering, State University of Malang, Malang 65145,
Indonesia
2 Biotechnology Laboratory, Department of Water Resources Management, Faculty of
Fisheries and Marine Sciences, University of Brawijaya, Malang 65145, Indonesia
3 Department of Mechanical Engineering, Faculty of Engineering, University of
Brawijaya, Malang 65145, Indonesia
4 Bioprocess Engineering, Department of Agricultural Engineering, Faculty of
Agricultural Technology, University of Brawijaya, Malang 65145, Indonesia
* Corresponding author, Email address: [email protected]
Abstract
Page 2 of 30
For Proof Read only
Songklanakarin Journal of Science and Technology SJST-2017-0074.R2 Sukarni
123456789101112131415161718192021222324252627282930313233343536373839404142434445464748495051525354555657585960

For Review O
nly
The cellular macromolecular and mineralogical content changes during the
combustion of Nannochloropsis oculata biomass have been investigated. A Fourier
transform infrared spectroscopy (FTIR) analyzer was used to investigate the cellular
macromolecular content changes of biomass at every stage of decomposition during
heating to 1200 ˚C. From ambient temperatures to 190 ˚C, similar spectra were
obtained, indicating a relatively little change in the chemical structure of the biomass
material. Changes in the spectra are very noticeable from 190 to 1200 ˚C. The
combustion process begins with thermal cracking of the −OH groups of silanol, and
then it escapes together with moisture at temperatures up to 190 ˚C. A subsequent
temperature increase led to decreasing intensity of the spectra, indicating thermal
degradation of the organic compounds derived from lipids, proteins, and carbohydrates.
These processes occur up to 800 ˚C. The X-ray diffraction (XRD) results showed that
the mineral constituents of biomass degraded during the combustion process, and a
portion reacted to form new compounds such as melilite (Ca6Na2O15Si4). The SEM
images show a morphological distinction between biomass and its residue at 1200 ˚C,
due to the decomposition and rearrangement of the mineral content during heating.
Fragmentation of the samples also occurred during heating, characterized by more
uniform residue at 1200 ˚C.
Keywords: combustion, microalgae, Nannochloropsis oculata, cellular
macromolecular, mineralogical content.
1. Introduction
Page 3 of 30
For Proof Read only
Songklanakarin Journal of Science and Technology SJST-2017-0074.R2 Sukarni
123456789101112131415161718192021222324252627282930313233343536373839404142434445464748495051525354555657585960

For Review O
nly
Renewable and clean energy have been investigated for replacing fossil fuel in
the interest of sustainable energy and the global environment. Microalgae are
comparable to other renewable energy sources in terms of the abundance of its yearly
production. Per unit area, the energy produced by microalgae is 30-100 times greater
than that of terrestrial crops (Demirbas, 2010). Microalgae applications in energy can
have a zero net CO2 emission because the carbon that is in the form of CO2 is fixed via
photosynthesis during the growth of microalgae. Approximately 1.83 tons of CO2 are
consumed by 1 ton of algal biomass during their cultivation (Yusuf, 2007); hence, mass
production of microalgal biomass would have a significant impact on global warming
mitigation, and the utilization of microalgal biomass in existing power plants is very
appealing.
One of the microalgae species that has been proposed as an excellent candidate
for biofuel feedstock is Nannochloropsis oculata (N. oculata) (Griffiths & Harrison,
2009). This microalga belongs to the Eustigmatophyceae class, a unicellular small green
alga characterized by coccoid forms with a diameter of 2-5 µm (Hu & Gao, 2003).
These species do not contain chlorophyll b (Hibberd, 1981) as well as cellular
xanthophyll pigment. The cell walls are present, which composed of fibrillar and
amorphous component. Cellulose, a polymer of 1,4 linked β-D-glucose, is the most
common fibrillar component. The fibril part is embedded in an amorphous
mucilaginous material arranged from polysaccharides, proteins, and lipids.
Occasionally, calcium carbonate, silica, or sporopollenin, the most extraordinarily
resistant materials, are also present as encrusting substances (Barsanti & Gualtieri,
2006). There is chloroplast without girdle lamella and outer chloroplast endoplasmic
reticulum membrane with a direct membrane connection to the outer nuclear envelope
Page 4 of 30
For Proof Read only
Songklanakarin Journal of Science and Technology SJST-2017-0074.R2 Sukarni
123456789101112131415161718192021222324252627282930313233343536373839404142434445464748495051525354555657585960

For Review O
nly
membrane. It is commonly cultivated in aquaculture industries to rear aquatic animals,
especially live food organisms such as rotifers.
The potential of N. oculata as a solid fuel feedstock in terms of its abundance
and physicochemical properties was demonstrated previously (Sukarni, Sudjito, Hamidi,
Yanuhar, & Wardana, 2014). It is clear that with traditionally natural and low-cost
nutrient cultivation, the productivity of this algae is higher than that of Dunaliella salina
(García-González, Moreno, Manzano, Florencio, & Guerrero, 2005), Scenedesmus
obliquus (de Morais & Costa, 2007), and Chlorella vulgaris (Converti, Casazza, Ortiz,
Perego, & Del Borghi, 2009). It revealed that this strain is a viable candidate for
providing a continuous supply of renewable solid fuel feedstock.
Recently, very few studies have focused on microalgal combustion. López-
González, Fernandez-Lopez, Valverde, and Sanchez-Silva (2014) studied the thermal
characteristics of three different microalgae species: Nannochloropsis gaditana,
Scenedesmus almeriensis and Chlorella vulgaris, under oxidizing conditions using
thermogravimetric analysis and differential scanning calorimetry (TGA–DSC). The
results indicated that two main stages of microalgae combustion occurred during
thermal degradation, i.e., devolatilization and char oxidation. Tahmasebi, Kassim, Yu,
and Bhattacharya (2013) investigated the co-combustion behavior and reaction kinetics
of Tetraselmis suecica microalgae and its blend with a Victorian brown coal in O2/N2
and O2/CO2 atmospheres using the thermogravimetric method. During combustion of
microalgae, two peaks at 265 and 485 ˚C were found, in agreement with the combustion
of a protein and carbohydrate with lipid, respectively. Chen, Ma, and Liu (2011)
investigated the combustion characteristics of Chlorella vulgaris under different oxygen
supply concentrations and found that the combustion process of this algae can be
Page 5 of 30
For Proof Read only
Songklanakarin Journal of Science and Technology SJST-2017-0074.R2 Sukarni
123456789101112131415161718192021222324252627282930313233343536373839404142434445464748495051525354555657585960

For Review O
nly
divided into three stages. Furthermore, in our previous paper (Sukarni, Sudjito, Hamidi,
Yanuhar, & Wardana, 2015) we examined the combustion of N. oculata biomass and
showed that this algae decomposed in five stages during the thermal process from
ambient temperature to 1200 ˚C. Overall, the previous research was concerned with the
thermal decomposition behavior of the algal biomass, and it was determined that there
be differences in the thermal decomposition stages among various algae species,
probably due to differences in their compartmental contents. However, to the best of our
knowledge, the details of macromolecular and mineralogical changes due the increase in
temperature during the combustion process have not been investigated, and the residue
morphology and chemical composition have not been studied. Hence, to optimize the
usefulness of this biomass related to the appropriate combustion technology and the
potential applications of its unique waste ashes, further in-depth research is required.
This article presents a study of the thermal decomposition of N. oculata biomass
in terms of macromolecular and mineralogical content changes as a function of
temperature to describe the step by step decomposition of biomass elements. The
characteristics of biomass and its residue at 1200 ˚C were also examined in relation to
their morphology and composition.
2. Materials and Methods
2.1 Material and its physicochemical properties
The details of culturing, harvesting, drying and preparing microalgal biomass
have been reported elsewhere (Sukarni et al., 2014, 2015). The original of N. oculata
species was prepared by the Institute of Brackish Water Aquaculture (Balai Budidaya
Page 6 of 30
For Proof Read only
Songklanakarin Journal of Science and Technology SJST-2017-0074.R2 Sukarni
123456789101112131415161718192021222324252627282930313233343536373839404142434445464748495051525354555657585960

For Review O
nly
Air Payau-BBAP) Situbondo, East Java, Indonesia. An open pond filled with 8 m3
filtered sterilized seawater with a pH and salinity of 8.6 and 34 ‰, respectively, and
enriched with 0.1% (v/v) Walne’s fertilizer, was used for sample culturing. The
fertilizer compositions were KNO3=1 kg, NaH2PO4=100 g, Na2 EDTA=100 g,
FeCl3=13 g, which were dissolved in 10 liters of water. The algae was cultured for 7
days, and then it was harvested.
A chemical flocculation technique using caustic soda (NaOH) was performed for
microalgal biomass harvesting. The precipitation process was done overnight, and then
the sample was flowed for filtering and washing with distilled water. In due course, the
drying of the collected sediment was performed using an oven at 80 ˚C for 24 h,
resulting in dried algal chunks. A fine algal powder of 1.75 kg was obtained by crushing
dried chunks using a mortar. Subsequently, this powder was stored in a vacuum
desiccator to keep it dry.
Algal biomass physicochemical properties in relation to chemical composition,
proximate analysis results, and the heating value are presented in Table 1. These
respective data were quoted from Sukarni et al. (2014).
2.2 Thermal analysis method and the residual characterization
Thermogravimetric (TG) and derivative thermogravimetric (DTG) analysis were
conducted using STA PT1600 (Linseis STA Simultaneous Thermal Analysis,
Germany). The sample with an initial weight of 20 mg was loaded into an Al2O3
ceramic crucible under non-isothermal conditions and then heated at a rate of 10 ˚C/min
from ambient temperature to 1200 ˚C. A constant air atmosphere flow rate of 100
ml/min supplied a continuous flow through the sample chamber.
Page 7 of 30
For Proof Read only
Songklanakarin Journal of Science and Technology SJST-2017-0074.R2 Sukarni
123456789101112131415161718192021222324252627282930313233343536373839404142434445464748495051525354555657585960

For Review O
nly
Corresponding to TG and DTG curves resulting from thermogravimetric
experiments, the decomposition temperature of each stage could subsequently be
defined to find the characteristic parameters. The overall characteristic parameters were
specified in accordance with the approximate starting and ending points of DTG curve
changes, which indicated that the elemental components of the samples had undergone
the thermal breakdown. These parameters were presented in Sukarni et al. (2015).
Based on the characteristic parameters, a new sample was heated in a STA
Thermal Analyzer in accordance with each stage of the decomposition temperature, and
then the residual material was analyzed using Fourier transform infrared spectroscopy
(FTIR) and X-ray diffraction (XRD) to determine their chemical macromolecular
compounds and mineralogical changes, respectively. The morphological changes of
biomass and residue at 1200 ˚C were studied by scanning electron microscopy (SEM),
and their elements were analyzed using energy-dispersive X-ray (EDX) spectrometry.
The FTIR technique, as well as the EDX method, have been presented elsewhere
(Sukarni et al., 2014).
2.3 FTIR analysis
Shimadzu FTIR spectroscopy was used to investigate the infrared spectra of
dried algal biomass and its residue. Potassium bromide (KBr) powder was mixed with
each sample and then pressed into tablets before measurement. Scanning of the samples
was performed from 400 to 4,000 cm-1.
2.4 Energy-dispersive X-ray (EDX) spectrometry
Page 8 of 30
For Proof Read only
Songklanakarin Journal of Science and Technology SJST-2017-0074.R2 Sukarni
123456789101112131415161718192021222324252627282930313233343536373839404142434445464748495051525354555657585960

For Review O
nly
The EDX spectrometry for determining the elemental composition of algal
biomass and its residue at 1200 ˚C were conducted with an FEI Inspect S50 equipped
with X-ray microanalysis capabilities (AMETEK EDAXTSL). Gold coating was
performed on the samples prior to analysis to minimize image distortion due to
electronic charging of the surfaces, and then the images from the scanning electron
microscope were obtained and evaluated. For each sample, 3 points or area EDX
analyses were performed, and then the results were averaged.
2.5 SEM (Scanning Electron Microscopy)
To determine the physical distinctions between biomass raw material and the
residue at 1200 ˚C in terms of morphology changes, a scanning electron microscope
(SEM) was used. An imaging SEM (Inspect-S50-type, FEI scanning electron
microscope) was employed to take sample images at four different magnifications:
4,000×, 5,000×, 7,000×, and 10,000×. Two magnified images of biomass and residue at
1200 ˚C, 7,000× and 10,000×, were displayed in this paper.
2.6 XRD analyses
XRD patterns for identifying the mineral composition of each sample were
obtained using a PAN Analytical X’Pert Pro Diffractometer system with CuKα
radiation (λ=1.54 Å). Samples were scanned with a goniometer from 10° to 90° (2θ
angle range) in 0.02° steps at 40 kV and 30 mA. Peak identification was done with the
PANanalytical X'Pert HighScore Plus software package.
3. Results and Discussion
Page 9 of 30
For Proof Read only
Songklanakarin Journal of Science and Technology SJST-2017-0074.R2 Sukarni
123456789101112131415161718192021222324252627282930313233343536373839404142434445464748495051525354555657585960

For Review O
nly
3.1 Cellular macromolecular content changes
The decomposition profile of a 20 mg sample is shown in the TG and DTG
curves in Figure 1. This figure demonstrates that the onset of an initial volatilization
stage at approximately 190 ˚C was terminated at 461 ˚C. This was followed by a
transition stage in which the remaining volatile and char burned simultaneously,
reaching completion at 673 ˚C. Subsequently, a char decomposition and oxidation stage
occurred, and this was completed at approximately 762 ˚C. Each temperature was used
to study the macromolecular and mineralogical changes in the sample.
The macromolecular content change of the sample at each stage of biomass
decomposition was observed with FTIR spectra by heating the sample from ambient
temperature to the end of each stage according to Figure 1. Figure 2 shows the FTIR
spectra of the samples, each of which was obtained from the decomposition of 20 mg of
biomass at a 10 °C/min heating rate.
As shown in Figure 2, the change of the cellular macromolecular content at each
stage of decomposition was determined by transmission bands ranging from 4000 to
400 cm-1. The assignment of these bands to specified macromolecular changes was done
tentatively on the basis of biochemical reference standards and published FTIR spectra
as quoted in our previous work (Sukarni et al., 2014).
The peak at 3694 cm-1 resulted from the O−H stretching of silanol and adsorbed
water bonded to silica in the cell wall, which was lost through heating over 190 ˚C. This
indicates that most of the H2O and −OH groups first escape from the sample particles at
a temperature above 190 ˚C, which is consistent with the results obtained from samples
of rice straw (Peng et al., 2009) and oil shale (B. Chen, Han, & Jiang, 2016), which
Page 10 of 30
For Proof Read only
Songklanakarin Journal of Science and Technology SJST-2017-0074.R2 Sukarni
123456789101112131415161718192021222324252627282930313233343536373839404142434445464748495051525354555657585960

For Review O
nly
released H2O and −OH groups at approximately 200 ˚C. However, a similar peak
appeared at 1200 ˚C. This might be due to the absorption of water while ash was
transferred from the combustion chamber to the desiccator, considering that silica is a
hydrophilic element. The extensive IR band in Zone I remained stable up to 762 ˚C and
disappeared at 1200 ˚C. This band was due to proteins, i.e., the N−H bond in the amide
A group (Duygu et al., 2012).
The two weak peaks at 2916 and 2849 cm-1 (Zone II) were gradually weakened
with the increase of temperature, and they disappeared above 673 ˚C. This revealed a
methylene group in the lipid that decomposed above this temperature. The featured
band at 2523 cm-1 (Zone III), associated with the –NH3+ group of a protein, became
weaker at 762 ˚C and vanished at 1200 ˚C.
The spectral band at 1788 cm-1 (Zone IV) was enfeebled at 762 ˚C and
subsequently disappeared at 1200 ˚C. This was attributed to the C=O group of an ester,
which is present in fatty acids or proteins. In Zone V, the pronounced band at 1651 cm-1
was associated with C=O stretching of amide I. It remained constant in intensity up to
673 ˚C, declined above 762 ˚C and then vanished at 1200 ˚C.
The band at 1504 cm-1 shifted at 762 ˚C and 1200 ˚C toward 1409 cm-1. This was
mainly due to C−H stretching and N−H bending modes of protein amide II. The
subsequent heating caused a rearrangement of chemical bonds and formed a new
compound. The transmission band at 1409 cm-1 was due to calcium carbonate (Bellamy,
1975).
Many bands in Zone VI with various peaks were associated with inorganic
elements such as phosphorus (P) contained in the phospholipids in the form of P=O.
These bands were also correlated with the silicon (Si) that was bonded in silicate
Page 11 of 30
For Proof Read only
Songklanakarin Journal of Science and Technology SJST-2017-0074.R2 Sukarni
123456789101112131415161718192021222324252627282930313233343536373839404142434445464748495051525354555657585960

For Review O
nly
frustules of cell wall polysaccharide in the form of Si−OH, and to the C−O and
C−O−C bonds in carbohydrates. The band spectra changed in this region in line with
the increasing temperature that was correlated with the decomposition of silanol silicate
frustules. This phenomenon was also associated with the decomposition of carbon and
oxygen bonds in carbohydrates. Subsequently, silicon, carbon, oxygen and hydrogen
reacted with alkali metals such as Ca, Mg and Na, to form new compounds such as
silicon dioxide (SiO2), hillebrandite (Ca2(SiO3)(OH)2), Na2(MgSi)Si4O12, melilite
(Ca6Na2O15Si4) and magnesite (MgCO3). This result was further discussed in the
mineralogical changes section.
Based on the TG, DTG and FTIR spectra curves (as shown in Figure 1 and
Figure 2), it can be concluded that N. oculata biomass was effectively decomposed in
the combustion process below 800 ˚C. Above 800 ˚C, the ash decomposed, especially at
approximately 850 ˚C, as shown in Figure 1.
3.2 Mineralogical changes
The mineralogical change of the sample at each stage of biomass decomposition
was observed using X-ray diffraction (XRD) to study the crystalline species present in
the solid residue. The solid sample residual was obtained in the same manner as the
FTIR samples, i.e., biomass was heated from ambient temperature to the end of each
stage in accordance with Figure 1. Figure 3 shows X-ray diffraction patterns of N.
oculata biomass and the residue, where every sample was acquired from the
decomposition of 20 mg of biomass at a 10 °C/min heating rate under a 100 ml/min air
atmosphere flow rate.
Page 12 of 30
For Proof Read only
Songklanakarin Journal of Science and Technology SJST-2017-0074.R2 Sukarni
123456789101112131415161718192021222324252627282930313233343536373839404142434445464748495051525354555657585960
For Review O
nly
Figure 3 shows that the diffraction patterns of biomass and residue at 190 ˚C
were nearly identical. The minerals present in the biomass were primarily aragonite
(CaCO3), silanetetrayl (C8Si), doyleite (Al(OH)3), natrolite (Na₂Al₂Si₃O₁₀·2H₂O),
magnesium perchlorate dihydrate (Cl2H8MgO12) and silicon dioxide (SiO2). The only
distinct peak, found at 2� = 31.6o, was associated with antigorite –T (Mg48O147Si34).
The feature of the residue at 461 ˚C presented a new diffraction peak at 2� =
23.15o related to Al6Ca9NaO18. The intensity loss of the two adjacent peaks at 2� =
26.34 and 27.32o correlated with the decomposition of tricalcium silicate (Ca3SiO5). A
stronger peak at 2� = 29.48o was associated with dicalcium silicate (Ca2SiO4) or calcite
(CaCO3). The disappearance of the peak at 2� = 33.25o was due to tricalcium silicate
(Ca3SiO5) decomposition. Likewise, anorthite (Al2CaO8Si2) decomposition results in
the loss of peaks at 2� = 50.32 and 50.96o.
The diffraction pattern of the residue at 673 ˚C was almost identical with that at
461 ˚C. However, the stronger intensities at 2� = 29.41, 42.91, and 62.50˚ were
associated with CaCO3, SiO2 and Na2(MgSi)Si4O12, respectively. An increase in
intensity with the escalation in combustion temperature was due to an increase in the
relative inorganic concentration of the residue at higher temperature (Dodson, Hunt,
Budarin, Matharu, & Clark, 2011). The two adjacent peaks at 2� = 26.34 and 27.32˚
associated with tricalcium silicate were no longer detected.
Figure 3 also showed that the spectrum of the residue at 762 ˚C exhibited a
decrease in intensity at 2� = 29.41˚. This was correlated to the decomposition of
CaCO3. Additionally, the new compound melilite (Ca6Na2O15Si4) was formed, which
was characterized by the appearance of new peaks at 2� = 17.8 and 37.3˚. Moreover, the
presence of a new and prominent peak at 2� = 53.80˚ was also associated with the
Page 13 of 30
For Proof Read only
Songklanakarin Journal of Science and Technology SJST-2017-0074.R2 Sukarni
123456789101112131415161718192021222324252627282930313233343536373839404142434445464748495051525354555657585960

For Review O
nly
forming of a new compound, i.e., calcium oxide (CaO). An extensive discussion
regarding melilite formation is presented in section 3.3 (morphology and composition of
biomass and residue at 1200 ˚C).
The diffraction pattern of the residue at 1200 ˚C showed an increasing intensity
at 2� = 17.94, 33.34, 46.78, 50.88 and 53.90˚ (d), which resulted from an increasing
relative concentration of melilite (Ca6Na2O15Si4), in line with the increasing
temperature. Likewise, an increase in intensity at 2� = 42.91 and 78.63o (a) resulted
from an increase in the relative concentration of SiO2. An intensity increase at 2� =
62.30˚ (c) and 27.04˚ (b) was associated with Na2(MgSi)Si4O12 and dicalcium silicate
(Ca2SiO5) (in the form of hillebrandite (Ca2(SiO3)(OH)2)), respectively. The weak
intensities at 2� = 32.53, 38.81, 46.78, 53.61 and 62.30˚ were associated with MgCO3.
3.3 Morphology and composition of biomass and residue at 1200 ˚C
The material characteristics of biomass and residue at 1200 ˚C were analyzed in
terms of their morphology and their composition using SEM and EDX, respectively.
Figure 6 visualized the morphology of biomass and residue at 1200 ˚C that was
generated from combustion at a 10 o C/min heating rate.
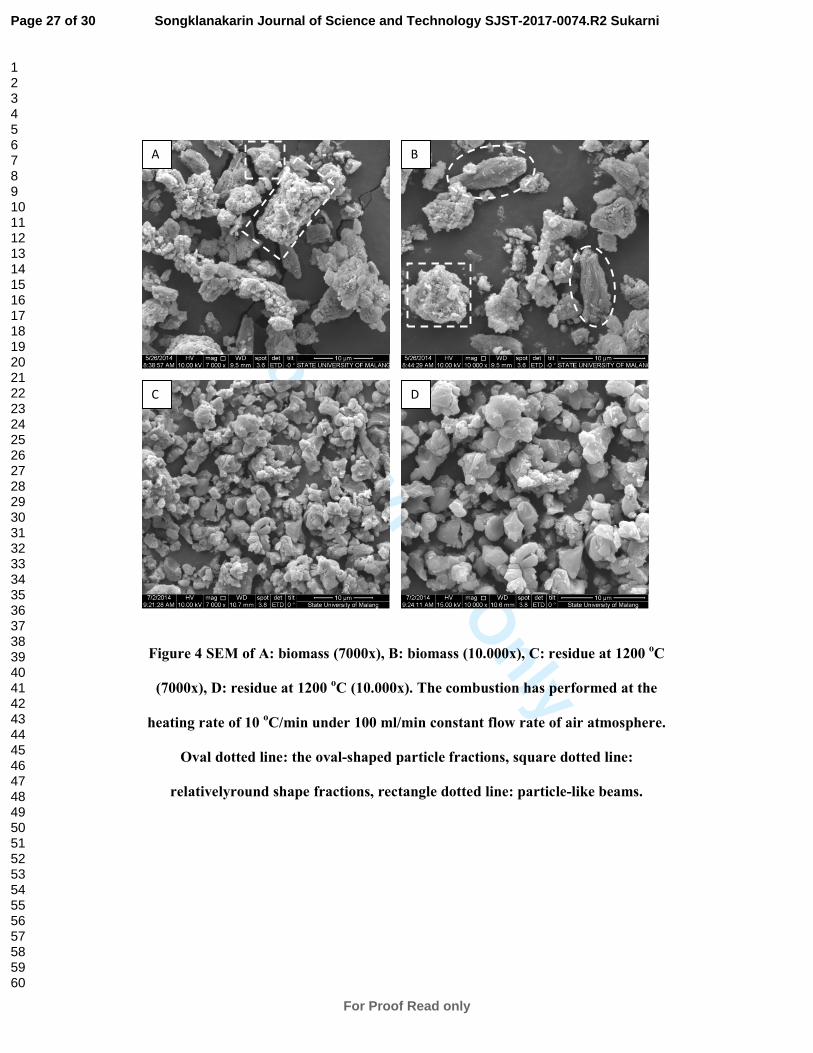
Figure 4A-B showed the biomass after drying and pulverization with mortar,
which varied in size. The morphology showed oval-shaped particle fractions with a
fibrous structure (marked with an oval dotted line), relatively round-shaped fractions of
biomass particles with rough and overhanging surface contours (marked with a square
dotted line) and particle-like beams with rough and overhanging surface contours
(marked with a rectangle dotted line). The remaining particles were small particle
Page 14 of 30
For Proof Read only
Songklanakarin Journal of Science and Technology SJST-2017-0074.R2 Sukarni
123456789101112131415161718192021222324252627282930313233343536373839404142434445464748495051525354555657585960

For Review O
nly
fractions with similar shapes compared to the large ones, i.e., oval, relatively round and
alike to the beam.
In contrast to the biomass material, the particles of the residue at 1200 ˚C
(Figure 4C-D) became more uniform, with a rhombohedral fractional form most
dominant. Surface residues also appeared shinier and resembled a star stone (calcite).
Changes in the shape and surface of the residue particles were due to the heating
effect. As indicated in Figure 1, most N. oculata mass decomposed during combustion.
The onset of biomass decomposition began with the release of inherent moisture and
light volatile compounds (Sukarni et al., 2015). Subsequent heating caused the matrix
structure of the solid particles to undergo a softening process. The trapped volatiles
could cause swelled surfaces, thus, changing the shape of the particles (Biagini,
Narducci, & Tognotti, 2008). Further heating at higher temperatures resulted in the
thermal decomposition of chemical bonds and melted some compounds. In turn, it
destroyed the structure of the fibrillar component (cellulose, a polymer of 1,4 linked β-
D-glucose) and amorphous material that composed the cell wall matrix. Furthermore,
the cell components evaporated due to heating, and then the volatiles evolved. Most
volatiles were released in the devolatilization stage, leading to rearrangement of
chemical bonds, which caused particle shrinkage or even fragmentation or splitting.
This phenomenon resulted in the formation of smaller and more uniform residual
fractions.
Figure 4 also indicates that the heating process caused the surface of the residue
to become shinier than the biomass surface. This was because volatile combustion
resulted in an increasing temperature of the solid particle. Hence, it brought on the
coalescence of graphite nuclei within the solid structure. Furthermore, the internal
Page 15 of 30
For Proof Read only
Songklanakarin Journal of Science and Technology SJST-2017-0074.R2 Sukarni
123456789101112131415161718192021222324252627282930313233343536373839404142434445464748495051525354555657585960

For Review O
nly
reactions that occurred in the ash at high temperatures resulted in the formation of
colored compounds.
At approximately 850 ˚C, the DTG curve (see Figure 2) showed the last basin
during the entire the combustion process. This was attributable to the decomposition of
ash (Sukarni et al., 2015). The decomposition that occurred between 850-1200 ˚C was
related to the dissociation of alkali carbonate (Arvelakis, Frandsen, Pomeroy, & Dam-
Johansen, 2005). The EDX analyses of N. oculata biomass (Sukarni et al., 2014)
indicated that its alkali content was sodium, whereas potassium was not detected,
possibly due to its low content. Hence, the dissociated alkali was predominantly due to
Na2CO3 degradation. Between 600-800 ˚C, the decomposed mineral compound was
mainly attributed to the gradual decomposition of CaCO3 (Ali & Strand, 2013) to CaO
and CO2(g). In the complex reaction mechanism within the ash, the decomposed
Na2CO3 subsequently reacted with CaO and SiO2, resulting in the formation of a new
compound, Ca6Na2O15Si4 (melilite). The reaction mechanism is shown in Eq. 1.
4SiO2 + 6CaO + Na2CO3 → Ca6Na2O15Si4 + CO2(g) (1)
Internal reactions occurred in the ash at high temperature via Eq. 1, leading to
the formation of colored compounds. The formation of melilite compounds agreed with
the XRD analysis presented in the previous section.
As specified in Figure 5, a portion of the residue at 1200 ˚C formed
agglomerates (indicated by an arrow). This occurred because ash compounds,
containing alkali metals (Na) and alkaline earth metals (Ca and Mg), melted and
coalesced with silica (Si) at high temperatures (McKendry, 2002). The melted
compounds could adhere to the contact area of separate inter-particle surfaces, which
resulted in the formation of particle clusters that were difficult to separate.
Page 16 of 30
For Proof Read only
Songklanakarin Journal of Science and Technology SJST-2017-0074.R2 Sukarni
123456789101112131415161718192021222324252627282930313233343536373839404142434445464748495051525354555657585960

For Review O
nly
Figure 6 shown the elemental composition of biomass and residue at 1200 ˚C
originated from 20 mg samples that were observed using EDX spectroscopy. A
significant amount of C and O, 82.46 and 68.32 wt%, respectively, decomposed during
combustion. In agreement with the results of FTIR (Figure 2) and XRD (Figure 3), the
remainder of the C and O, together with Mg, were bonded in the form of MgCO3, while
H and O together with Ca and Si composed a hillebrandite compound. The remaining
O, together with Na, Ca, Mg and Si were brought into being compounds of
Na2(MgSi)Si4O12, melilite (Ca6Na2O15Si4) or formed slags such as SiO2, MgO, and
CaO.
According to the analysis of the residue at 1200 ˚C, the byproducts of N. oculata
biomass combustion have prospects for the following compounds: (1) melilite
compounds, which can be used for glass materials. (2) silicon dioxide compounds,
which are extensively used as electronic industrial raw materials. (3) dicalcium silicate
(Ca2SiO5), which is one of the essential elements of Portland cement. (4) magnesium
carbonate, which was once widely utilized to produce magnesium oxide by calcination.
Magnesite is also the principal component in refractory bricks and fireproofing.
Moreover, the byproducts of N. oculata combustion provided a large amount of Mg and
Ca (see Figure 6), which allows the N. oculata residue to be a reliable alternative to
fertilizers.
4. Conclusions
Cellular macromolecular and mineralogical content changes during thermal
decomposition of N. oculata biomass were examined using FTIR and XRD,
respectively. The FTIR result, as well as specified by TG curve, indicated that the
Page 17 of 30
For Proof Read only
Songklanakarin Journal of Science and Technology SJST-2017-0074.R2 Sukarni
123456789101112131415161718192021222324252627282930313233343536373839404142434445464748495051525354555657585960

For Review O
nly
decomposition of N. oculata biomass effectively occurred below 800 ˚C. Furthermore,
the remaining ash mineral compounds were degraded over 800 ˚C. The mineralogical
analyses reveal that the mineral compounds of the biomass decomposed and formed
new compounds during combustion. Morphological analysis using SEM indicated the
occurrence of sample fragmentation during heating, which was characterized by more
uniform residue particles at 1200 ˚C. The shinier residue surfaces at 1200 ˚C also
indicate that heating affected the formation of new mineral compounds, mainly melilite.
This study shows that the use of N. oculata as a fuel is feasible and the residual material
obtained after its combustion has potential as feedstocks for various purposes, such as
glass materials, electronic raw materials, Portland cement, refractory bricks, even
fertilizers. Therefore, N. oculata is not only a potential energy resource but also a value-
added by-product.
Acknowledgments
This research was supported by the Fundamental Research Grant
023.04.1.673,453/2012 from the Directorate General of Higher Education, Republic of
Indonesia.
References
Ali, S., & Strand, M. (2013). Melting Characteristics and Morphology of Bottom Ash
and Filter Ash of the Circulating Fluidized Bed Boiler. 21st European Biomass
Conference and Exhibition, 1189–1191.
Arvelakis, S., Frandsen, F. J., Pomeroy, M., & Dam-Johansen, K. (2005). A Study on
the Chemistry of Ash Fractions From MSW Incineration. 13th North American
Page 18 of 30
For Proof Read only
Songklanakarin Journal of Science and Technology SJST-2017-0074.R2 Sukarni
123456789101112131415161718192021222324252627282930313233343536373839404142434445464748495051525354555657585960

For Review O
nly
Waste-to-Energy Conference, 29–42. doi:10.1115/NAWTEC13-3150
Barsanti, L., & Gualtieri, P. (2006). Algae: anatomy, biochemistry, and biotechnology.
Boca Raton: CRC Press.
Bellamy, L. J. (1975). The Infra-red Spectra of Complex Molecules. Dordrecht:
Springer Netherlands.
Biagini, E., Narducci, P., & Tognotti, L. (2008). Size and structural characterization of
lignin-cellulosic fuels after the rapid devolatilization. Fuel, 87(2), 177–186.
doi:10.1016/j.fuel.2007.04.010
Chen, B., Han, X., & Jiang, X. (2016). In-situ FTIR analysis of the evolution of
functional groups of oil shale during the pyrolysis. Energy Fuels.
doi:10.1021/acs.energyfuels.6b00885
Chen, C., Ma, X., & Liu, K. (2011). Thermogravimetric analysis of microalgae
combustion under different oxygen supply concentrations. Applied Energy, 88(9),
3189–3196. doi:10.1016/j.apenergy.2011.03.003
Converti, A., Casazza, A. a., Ortiz, E. Y., Perego, P., & Del Borghi, M. (2009). Effect
of temperature and nitrogen concentration on the growth and lipid content of
Nannochloropsis oculata and Chlorella vulgaris for biodiesel production. Chemical
Engineering and Processing: Process Intensification, 48(6), 1146–1151.
de Morais, M. G., & Costa, J. A. V. (2007). Biofixation of carbon dioxide by Spirulina
sp. and Scenedesmus obliquus cultivated in a three-stage serial tubular
photobioreactor. Journal of Biotechnology, 129(3), 439–45.
Page 19 of 30
For Proof Read only
Songklanakarin Journal of Science and Technology SJST-2017-0074.R2 Sukarni
123456789101112131415161718192021222324252627282930313233343536373839404142434445464748495051525354555657585960
For Review O
nly
doi:10.1016/j.jbiotec.2007.01.009
Demirbas, A. (2010). Use of algae as biofuel sources. Energy Conversion and
Management, 51(12), 2738–2749. doi:10.1016/j.enconman.2010.06.010
Dodson, J. R., Hunt, A. J., Budarin, V. L., Matharu, A. S., & Clark, J. H. (2011). The
chemical value of wheat straw combustion residues. RSC Advances, 1(3), 523.
doi:10.1039/c1ra00271f
Duygu, D. Y., Udoh, A. U., Ozer, T. B., Akbulut, A., Acikgoz, I., Yildiz, K., & Guler,
D. (2012). Fourier transform infrared (FTIR) spectroscopy for identification of
Chlorella vulgaris Beijerinck 1890 and Scenedesmus obliquus (Turpin) Kützing
1833. African Journal of Biotechnology, 11(16), 3817–3824.
García-González, M., Moreno, J., Manzano, J. C., Florencio, F. J., & Guerrero, M. G.
(2005). Production of Dunaliella salina biomass rich in 9-cis-beta-carotene and
lutein in a closed tubular photobioreactor. Journal of Biotechnology, 115(1), 81–
90. doi:10.1016/j.jbiotec.2004.07.010
Griffiths, M. J., & Harrison, S. T. L. (2009). Lipid productivity as a key characteristic
for choosing algal species for biodiesel production. Journal of Applied Phycology,
21(5), 493–507. doi:10.1007/s10811-008-9392-7
Hibberd, D. J. (1981). Notes on the taxonomy and nomenclature of the algal classes
Eustigmatophyceae and Tribophyceae (synonym Xanthophyceae). Botanical
Journal of the Linnean Society, 82(2), 93–119. doi:10.1111/j.1095-
8339.1981.tb00954.x
Page 20 of 30
For Proof Read only
Songklanakarin Journal of Science and Technology SJST-2017-0074.R2 Sukarni
123456789101112131415161718192021222324252627282930313233343536373839404142434445464748495051525354555657585960
For Review O
nly
Hu, H., & Gao, K. (2003). Optimization of growth and fatty acid composition of a
unicellular marine picoplankton, Nannochloropsis sp., with enriched carbon
sources. Biotechnology Letters, 25(5), 421–425.
López-González, D., Fernandez-Lopez, M., Valverde, J. L., & Sanchez-Silva, L. (2014).
Kinetic analysis and thermal characterization of the microalgae combustion
process by thermal analysis coupled to mass spectrometry. Applied Energy, 114,
227–237. doi:10.1016/j.apenergy.2013.09.055
McKendry, P. (2002). Energy production from biomass (part 1): Overview of biomass.
Bioresource Technology, 83(1), 37–46. doi:10.1016/S0960-8524(01)00118-3
Peng, F. U., Song, H. U., Jun, X., Lushi, S. U. N., Tao, Y., Anchao, Z., & Junying, Z.
(2009). Mechanism Study of Rice Straw Pyrolysis by Fourier Transform. Chinese
Journal of Chemical Engineering, 17(3), 522–529.
Sukarni, Sudjito, Hamidi, N., Yanuhar, U., & Wardana, I. N. G. (2014). Potential and
properties of marine microalgae Nannochloropsis oculata as biomass fuel
feedstock. International Journal of Energy and Environmental Engineering, 5(4),
279–290. doi:10.1007/s40095-014-0138-9
Sukarni, Sudjito, Hamidi, N., Yanuhar, U., & Wardana, I. N. G. (2015).
Thermogravimetric kinetic analysis of Nannochloropsis oculata combustion in air
atmosphere. Frontiers in Energy, 9(2), 125–133. doi:10.1007/s11708-015-0346-x
Tahmasebi, A., Kassim, M. A., Yu, J., & Bhattacharya, S. (2013). Thermogravimetric
study of the combustion of Tetraselmis suecica microalgae and its blend with a
Victorian brown coal in O2/N2 and O2/CO2 atmospheres. Bioresource
Page 21 of 30
For Proof Read only
Songklanakarin Journal of Science and Technology SJST-2017-0074.R2 Sukarni
123456789101112131415161718192021222324252627282930313233343536373839404142434445464748495051525354555657585960

For Review O
nly
Technology, 150, 15–27. doi:10.1016/j.biortech.2013.09.113
Yusuf, C. (2007). Biodiesel from microalgae. Biotechnology Advances, 25(3), 294–306.
doi:10.1016/j.biotechadv.2007.02.001
Page 22 of 30
For Proof Read only
Songklanakarin Journal of Science and Technology SJST-2017-0074.R2 Sukarni
123456789101112131415161718192021222324252627282930313233343536373839404142434445464748495051525354555657585960

For Review O
nly
A figure caption list
Figure 1 TG and DTG curves of N.oculata combustion at 10 oC/min (adapted from
Sukarni et al., (2015))
Figure 2 FTIR spectra of N. Oculata biomass and residue after heating at various
temperatures
Figure 3 XRD patterns of N.oculata biomass and residue after heating at various
temperatures a:SiO2; b:Ca2(SiO3)(OH)2; c:Na2(MgSi)Si4O12; d:Ca6Na2O15Si4
Figure 4 SEM of A: biomass (7000x), B: biomass (10.000x), C: residue at 1200 oC
(7000x), D: residue at 1200 oC (10.000x). The combustion has performed at the
heating rate of 10 oC/min under 100 ml/min constant flow rate of air atmosphere.
Oval dotted line: the oval-shaped particle fractions, square dotted line: relatively
round shape fractions, rectangle dotted line: particle-like beams.
Figure 5 The agglomeration due to melting of alkali and alkaline earth metals indicated
by white arrow
Figure 6 The elemental composition of biomass and 1200 oC residue as it was observed
by using EDX spectroscopy. Error bars denoted the standard deviation obtained
from three replicates.
Page 23 of 30
For Proof Read only
Songklanakarin Journal of Science and Technology SJST-2017-0074.R2 Sukarni
123456789101112131415161718192021222324252627282930313233343536373839404142434445464748495051525354555657585960

For Review O
nly
Figure 1 TG and DTG curves of N.oculata combustion at 10 oC/min (adapted from
Sukarni et al., (2015)).
Page 24 of 30
For Proof Read only
Songklanakarin Journal of Science and Technology SJST-2017-0074.R2 Sukarni
123456789101112131415161718192021222324252627282930313233343536373839404142434445464748495051525354555657585960

For Review O
nly
Figure 2 FTIR spectra of N. Oculata biomass and residue after heating at various
temperatures.
Page 25 of 30
For Proof Read only
Songklanakarin Journal of Science and Technology SJST-2017-0074.R2 Sukarni
123456789101112131415161718192021222324252627282930313233343536373839404142434445464748495051525354555657585960

For Review O
nly
Figure 3 XRD patterns of N.oculata biomass and residue after heating at various
temperatures a:SiO2; b:Ca2(SiO3)(OH)2; c:Na2(MgSi)Si4O12; d:Ca6Na2O15Si4.
Page 26 of 30
For Proof Read only
Songklanakarin Journal of Science and Technology SJST-2017-0074.R2 Sukarni
123456789101112131415161718192021222324252627282930313233343536373839404142434445464748495051525354555657585960
For Review O
nly
Figure 4 SEM of A: biomass (7000x), B: biomass (10.000x), C: residue at 1200 oC
(7000x), D: residue at 1200 oC (10.000x). The combustion has performed at the
heating rate of 10 oC/min under 100 ml/min constant flow rate of air atmosphere.
Oval dotted line: the oval-shaped particle fractions, square dotted line:
relativelyround shape fractions, rectangle dotted line: particle-like beams.
A B
C D
Page 27 of 30
For Proof Read only
Songklanakarin Journal of Science and Technology SJST-2017-0074.R2 Sukarni
123456789101112131415161718192021222324252627282930313233343536373839404142434445464748495051525354555657585960

For Review O
nly
Figure 5 The agglomeration due to melting of alkali and alkaline earth metals
indicated by white arrow.
Page 28 of 30
For Proof Read only
Songklanakarin Journal of Science and Technology SJST-2017-0074.R2 Sukarni
123456789101112131415161718192021222324252627282930313233343536373839404142434445464748495051525354555657585960

For Review O
nly
Figure 6 The elemental composition of biomass and 1200 oC residue as it was
observed by using EDX spectroscopy. Error bars denoted the standard deviation
obtained from three replicates
Page 29 of 30
For Proof Read only
Songklanakarin Journal of Science and Technology SJST-2017-0074.R2 Sukarni
123456789101112131415161718192021222324252627282930313233343536373839404142434445464748495051525354555657585960

For Review O
nly
Table 1 Physicochemical properties of N. oculata biomass (quoted from Sukarni et al., (2014))
EDX analysis (wt%) Proximate analysis
(% by dry basis)
HHV
(MJ/kg)
C O Na Mg Al Si Cl Ca Volatile
matter
Fixed
carbon Ash
28.32 43.80 2.04 13.16 0.92 1.60 1.97 8.20 67.45 8.08 24.47 16.80
Table 1 Physicochemical properties of N. oculata biomass
Page 30 of 30
For Proof Read only
Songklanakarin Journal of Science and Technology SJST-2017-0074.R2 Sukarni
123456789101112131415161718192021222324252627282930313233343536373839404142434445464748495051525354555657585960