Embed Size (px)
Citation preview
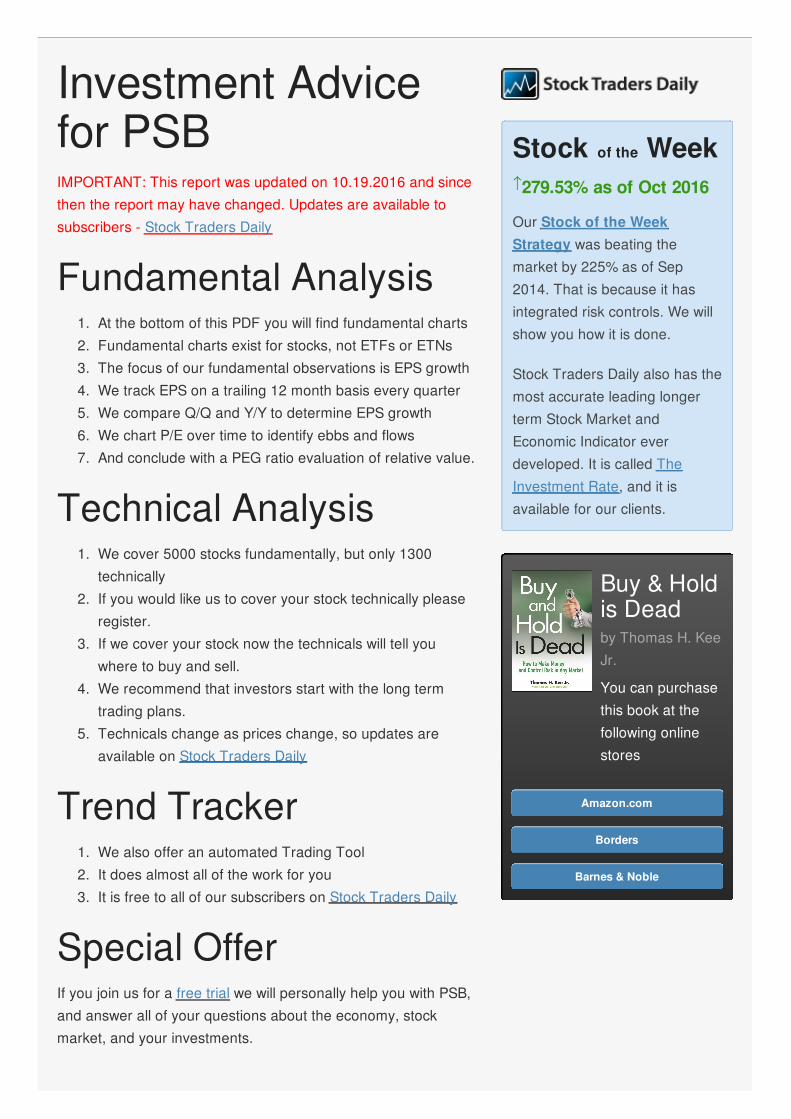
IMPORTANT This report was updated on 10192016 and since
then the report may have changed Updates are available to
subscribers - Stock Traders Daily
1 At the bottom of this PDF you will find fundamental charts
2 Fundamental charts exist for stocks not ETFs or ETNs
3 The focus of our fundamental observations is EPS growth
4 We track EPS on a trailing 12 month basis every quarter
5 We compare QQ and YY to determine EPS growth
6 We chart PE over time to identify ebbs and flows
7 And conclude with a PEG ratio evaluation of relative value
1 We cover 5000 stocks fundamentally but only 1300
technically
2 If you would like us to cover your stock technically please
register
3 If we cover your stock now the technicals will tell you
where to buy and sell
4 We recommend that investors start with the long term
trading plans
5 Technicals change as prices change so updates are
available on Stock Traders Daily
1 We also offer an automated Trading Tool
2 It does almost all of the work for you
3 It is free to all of our subscribers on Stock Traders Daily
If you join us for a free trial we will personally help you with PSB
and answer all of your questions about the economy stock
market and your investments
Investment Advicefor PSB
Fundamental Analysis
Technical Analysis
Trend Tracker
Special Offer
Our Stock of the WeekStrategy was beating the
market by 225 as of Sep
2014 That is because it has
integrated risk controls We will
show you how it is done
Stock Traders Daily also has the
most accurate leading longer
term Stock Market and
Economic Indicator ever
developed It is called The
Investment Rate and it is
available for our clients
Stock of the Week27953 as of Oct 2016shy
by Thomas H Kee
Jr
You can purchase
this book at the
following online
stores
Buy amp Holdis Dead
Amazoncom
Borders
Barnes amp Noble
If you like this report please share it
Like us on Facebook
Follow us on Twitter
Join us on LinkedIn
If you like this report please share it
Additional ServicesWe Will Teach You How to TradeWe Will Teach You How to Trade
How to Trade Stocks amp MarketsHow to Trade Stocks amp Markets
Understand TrendsUnderstand Trends
Make MoneyMake Money
Sign Up NowIco Std
Market Analysis Technical
DOW SampP
NASDAQ RUSSELL
Our Proprietary macroeconomicanalysis has identified everymajor economic and market cyclein US History in advance Seewhat is says about todaysenvironment MORE
The Investment Rate
Stock Finder
Find a Stock to Buy or Short
Stock Report
Enter Symbol Go
PSB (PS Business Parks)Recently trading at 10646 October 20 2016 206 am ET
(Fundamental charts offered below)

PSB (PS Business Parks)Recently trading at 10646 October 20 2016 206 am ET
(Fundamental charts offered below)