Embed Size (px)
Citation preview

2015 Annual Report
ABN: 42 122 919 948
Experience. Innovation. Growth
For
per
sona
l use
onl
y

Contents Pacific Environment Limited Annual Report 2015Aii
Contents
1 Corporate Directory
2 About PEH
3 Our Markets
4 Chairman’s Statement
6 Founders’ Message
8 Executive Team & Board
10 CEO Report
14 Technologies
18 Science & Innovation
20 Our People
23 Consulting & Monitoring
26 Directors’ Report
40 Corporate Governance Statement
44 Auditor’s Independence Declaration
45 Consolidated Statement of Profit or Loss & Other Comprehensive Income
46 Consolidated Statement of Financial Position
47 Consolidated Statement of Changes in Equity
48 Consolidated Statement of Cash Flows
50 Notes to Financial Statements
100 Directors’ Declaration
102 Independent Auditor’s Report
104 Shareholder Information
For
per
sona
l use
onl
y

Pacific Environment Limited Annual Report 2015 1Corporate Directory
Pacific Environment LimitedABN: 42 122 919 948
Company SecretaryAdam Gallagher
Registered office and principal place of businessLevel 1, 146 Arthur StreetNorth Sydney, New South Wales 2060Phone: 02 9870 0950
Share RegistryBoardroom Pty LimitedGrosvenor Place, Level 12, 225 George StreetSydney, New South Wales 2000Phone: 02 9290 9600
AuditorWPIAS Pty Ltd4 Helensvale RoadHelensvale, Queensland 4212Phone: 07 5580 4700
Stock Exchange ListingPacific Environment Limited shares are listed on the Australian Securities Exchange (Code PEH)
Website Addresswww.pacific-environment.com
Corporate Directory
Executive Chairman
Murray d’Almeida
Director
Robin Ormerod
Non-Executive Director
David Johnstone
Company Secretary & Director
Adam Gallagher
For
per
sona
l use
onl
y

About PEH Pacific Environment Limited Annual Report 20152
About PEH
At Pacific Environment, we are committed to improving environmental performance of production, development and policy. Our experts provide environmental consulting, monitoring, predictive management and automated reporting solutions from Australasia to the Americas and Europe.
Experience, innovation and successful delivery are at the core of our technology and environmental solutions. Our services and solutions are evaluated for every project so that we improve outcomes by minimising risk, managing liability and ensuring environmental compliance.
All of this is made possible by our people - a team that is solution seeking and that confidently tackle any challenge to help clients succeed in their changing environment. Our approach benefits our clients, the environment and the global community.
Our internationally recognised team provides quality service, built on decades of successful delivery on even the most challenging projects. We also consult to governments as independent experts.
Our clients benefit from the group’s 50+ years of experience, reliability and ability to develop quality, practical solutions in environmental consulting.
Pacific Environment believes and operates by the following principles:
Core Values• We strive for scientific excellence and innovation
• We respect and invest in our people
• We practise our discipline with integrity and through teamwork
MissionTo become the premier global technology and environmental company that clients trust and choose to engage and where employees are empowered and love to work.
Our Outcomes
Ensure Compliance
Minimise Risk
Reduce Cost & Improve Outcomes
Improve Operational
Efficiency
Maximise Development
Potential
Manage Liability
VisionWe will be at the forefront of global
scientific excellence providing quality innovative and advanced environmental
technologies and solutions.
Our workplace culture will be empowering, enabling and
collaborative.
For
per
sona
l use
onl
y

Pacific Environment Limited Annual Report 2015 3Our Markets
Our Markets
Agricultural enterprises are increasingly mindful of the importance of community relationships and the potential impacts of their operations e.g. odour, aerial spraying, urban encroachment and resource allocation. With long range predictive weather analysis, odour management and groundwater analysis; our solutions assist clients in managing their environmental compliance while maximising their production yield. We are expanding our environmental and technology services in line with the growth of this sector.
Research and innovation in minimising environmental impacts and at the same time increasing productivity is key to the future of manufacturing in Australia. Our manufacturing clientele includes metals refining and smelting, oil refining, petrochemical industries, paper and wood manufacturing, food and beverage processing, and fibreglass manufacturing. We are helping this industry drive value and environmental performance. Our experts assist in licensing, obtaining development approvals, managing community complaints and assist with legal obligations.
Environmental policy is based on sound science. We continue to provide informed support to all levels of government by turning complex technical concepts and data into useful information and practical advice for use in legislative programs and policy development. Our work includes development of the National Pollutant Inventory (NPI), several of the National Environment Protection Measures (NEPM) and international programs such as the Stockholm Convention for Persistent Organic Pollutants (POPs).
Density-per-capita is on the rise in most urban regions of Australia spurring the rejuvenation of many brownfield properties on city fringes intended for redevelopment. This often includes land reclamation, contaminated site assessment and remediation. We provide services to assist in property transfers including due diligence audits, third party validations and project management support. We also assist in refurbishment of ageing properties that may require asbestos mitigation or further site assessments.
Urban and regional development is driving the infrastructure growth in Australia. Our projects include roads and tunnels, ports and shipping, railways and airports. Involvement in these projects start from the feasibility assessment through to design, construction and long-term operation. Our team brings a wealth of experience from state, national and international projects and working groups. We are also experienced in dealing with site contamination, community concerns and noise solution design.
The Australian resources sector continues to face both challenges and opportunities in the coming financial year. Highly regulated, we are well positioned to help this sector respond to environmental and operational issues now and well into the future. Our approach to modelling, assessment and monitoring helps to reduce environmental risk and achieve operational efficiencies. Our clients find the predictive capabilities of our environmental technology highly effective in the current economic climate.
Agribusiness
Manufacturing
Government
Property
Infrastructure
Resources & Energy
For
per
sona
l use
onl
y

Chairman's Statement Pacific Environment Limited Annual Report 20154
Dear Shareholder,I am pleased to present the Annual Report for Pacific Environment Limited and its subsidiaries (the Group) for the 2015 Financial Year. I am also very pleased to announce a 43% increase in our Net Profit After Tax from continuing operations and a 25% increase in our year on year EBITDA from continuing operations. This result has been achieved notwithstanding the significant investment in our technologies over the financial year and the “boarding” costs of our DLA Environmental acquisition.
In my third annual report since joining the Group I have pleasure informing you about the significant progress we have made in becoming a global environmental technology company.
While again delivering a net profit for the third consecutive year, the Company has also transitioned in the scale and nature of its activities through both acquisition and the complete rebuild of our technology platform known as ‘EnviroSuite’.
During the second quarter of the financial year DLA Environmental joined the Group providing an expansion from our air related disciplines to offer services in soil and water that are also current development areas for further modules of EnviroSuite. I would like to thank the founder and CEO of DLA Environmental, Mr David Lane for his efforts and enthusiasm in working with us over the past 9 months to transition and grow his business within the Group.
During the 2015 financial year EnviroSuite was transformed from a practical and widely used domestic software platform to a world-class, modular system with global scalability. The successful completion of this key project consumed significant time and financial resources across the Group that we are pleased to report were funded internally and on-budget in accordance with our strategy.
Chairman’s Statement
EnviroSuite 2.0 is now complete. This is a milestone in our plans for the international roll-out of our Technology.
For
per
sona
l use
onl
y

Pacific Environment Limited Annual Report 2015 5Chairman's Statement
In May this year the Group successfully raised funding to accelerate the global distribution of EnviroSuite, a process that has already begun and will continue to be a top priority for the board and management through the 2016 financial year and beyond.
During the financial year, as the scale of the Group increased and our attentions turned to the USA as a major market for our Technology, we welcomed Group co-founder, chemical engineer and Head of Marketing, Ms Kristin Zeise to the board. Kristin’s industry knowledge and expertise as well as her US upbringing, education and professional contact network brought a valuable dimension to the board and helped frame our global sales strategy. Kristin has led several trips to the USA and introduced a number of key prospects for distribution and collaboration that we are continuing to work with.
Late in the financial year, as Kristin’s time and efforts in the US on behalf of the Group became increasingly valuable, she decided to resign from the board and we welcomed back her fellow Group co-founder Mr Robin Ormerod. Robin also serves as the Head of Science and Innovation guiding our development team to ensure EnviroSuite remains relevant and progressive with industry requirements.
My fellow board members and our dedicated team of professionals led by Chief Executive Peter White have worked hard under challenging market circumstances in the domestic Environmental sector. They have risen to this challenge through a positive attitude, innovation and enthusiasm for improving the lives of
communities in which our clients operate by delivering optimal environmental outcomes.
The world has opened up for the Group in the current financial year. Software knows no borders and neither do environmental concerns. EnviroSuite has a strong place in the global environmental technology market and we at Pacific Environment are determined to realise it. The Board continues to strive to grow shareholder value, we welcome any comments or questions and we thank you for your interest in the Group.
Sincerely,
Chairman 28 August 2015
Murray d’Almeida
2015 $’000
2014 $’000 Variance
Continuing operations
Revenue 14,805 9,618 5,187
Other income 1,645 1,090 555
Employee benefits expense (8,633) (6,283) (2,350)
Consultants expense (692) (277) (415)
Other operating expenses (4,653) (2,171) (2,482)
EBITDA from continuing operations 2,472 1,977 495
EBIT from continuing operations 2,082 1,515 567
NPAT from continuing operations 1,822 1,277 545
Discontinued operations (415) 34 (449)
NPAT 1,407 1,311 96
Results
SALES FROM CONTINUINGOPERATIONS INCREASED54% TO
$14.8mFor
per
sona
l use
onl
y

Founder's Message Pacific Environment Limited Annual Report 20156
Founder’s MessageF
or p
erso
nal u
se o
nly
Pacific Environment Limited Annual Report 2015 7Founder's Message
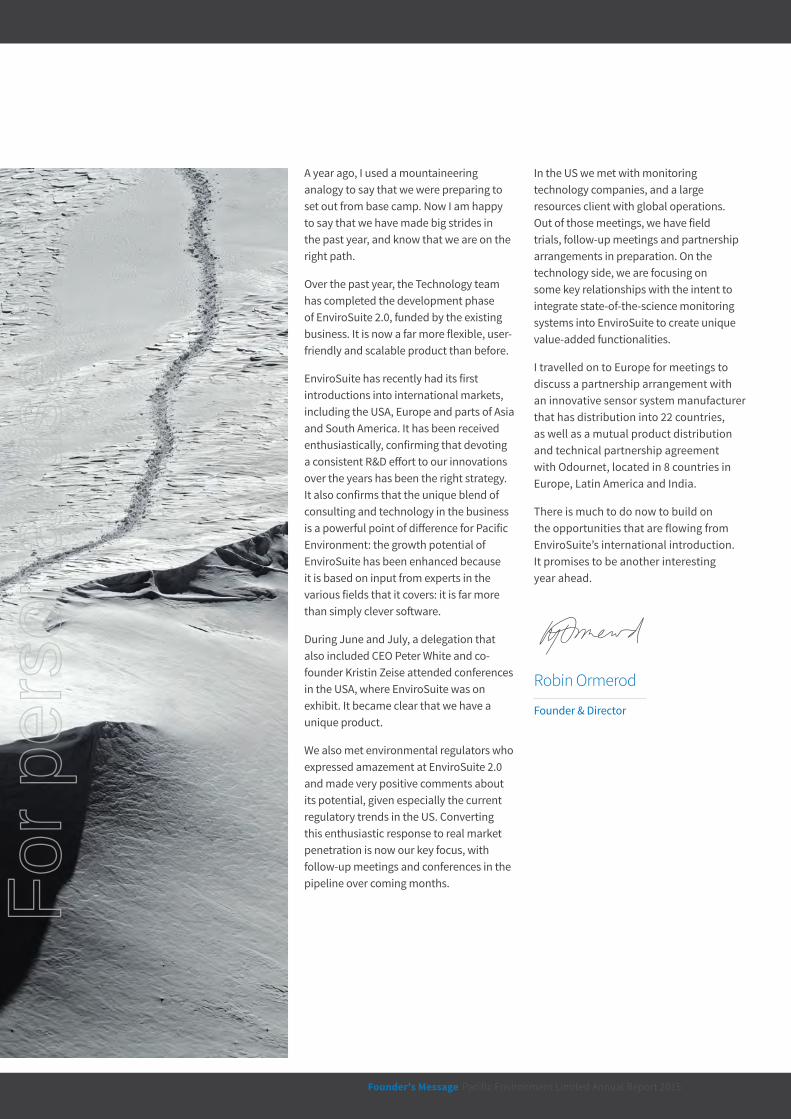
A year ago, I used a mountaineering analogy to say that we were preparing to set out from base camp. Now I am happy to say that we have made big strides in the past year, and know that we are on the right path.
Over the past year, the Technology team has completed the development phase of EnviroSuite 2.0, funded by the existing business. It is now a far more flexible, user-friendly and scalable product than before.
EnviroSuite has recently had its first introductions into international markets, including the USA, Europe and parts of Asia and South America. It has been received enthusiastically, confirming that devoting a consistent R&D effort to our innovations over the years has been the right strategy. It also confirms that the unique blend of consulting and technology in the business is a powerful point of difference for Pacific Environment: the growth potential of EnviroSuite has been enhanced because it is based on input from experts in the various fields that it covers: it is far more than simply clever software.
During June and July, a delegation that also included CEO Peter White and co-founder Kristin Zeise attended conferences in the USA, where EnviroSuite was on exhibit. It became clear that we have a unique product.
We also met environmental regulators who expressed amazement at EnviroSuite 2.0 and made very positive comments about its potential, given especially the current regulatory trends in the US. Converting this enthusiastic response to real market penetration is now our key focus, with follow-up meetings and conferences in the pipeline over coming months.
In the US we met with monitoring technology companies, and a large resources client with global operations. Out of those meetings, we have field trials, follow-up meetings and partnership arrangements in preparation. On the technology side, we are focusing on some key relationships with the intent to integrate state-of-the-science monitoring systems into EnviroSuite to create unique value-added functionalities.
I travelled on to Europe for meetings to discuss a partnership arrangement with an innovative sensor system manufacturer that has distribution into 22 countries, as well as a mutual product distribution and technical partnership agreement with Odournet, located in 8 countries in Europe, Latin America and India.
There is much to do now to build on the opportunities that are flowing from EnviroSuite’s international introduction. It promises to be another interesting year ahead.
Founder & Director
Robin Ormerod
For
per
sona
l use
onl
y

Executive Team Pacific Environment Limited Annual Report 20158
Peter White
Chief Executive Officer Chief Operating Officer
Peter was appointed in 2012 and has led a turnaround in the Company’s performance and subsequent growth both organically and through acquisition. In previous roles, he specialised in growing and developing solutions and services companies in the technology sector.
He has experience working in large multinational technology companies managing major development and distribution projects. Peter’s previous senior executive roles include Country Manager, Director of Services and Operations, and Sales Director at companies including Tandem, Siemens, Motorola, and Hewlett Packard across Australia, Asia, and Europe.
With a strong existing structure in place, Peter’s forward focus is the international expansion and continued development of EnviroSuite.
Ainsley was appointed as the Company’s Chief Operating Officer in February 2015. She manages the Company’s actively growing multi-office consultancy. Her focus is on developing market opportunities across consulting and monitoring business units, leading a culture that embraces change and driving business improvements that will deliver on the company’s growth ambitions.
Ainsley brings first-hand experience in understanding the economic challenges our clients face in balancing environmental compliance needs with rigours of the market.
Her previous roles in working at an executive level, developing client acquisition strategies and expanding market presence equip her the ability to mentor her team, collaborate with clients, and manage the operational challenges of rapid expansion.
Ainsley Simpson
Executive TeamF
or p
erso
nal u
se o
nly

Pacific Environment Limited Annual Report 2015 9Executive Team
Mr. d’Almeida has over 36 years of diverse national and international business experience. He commenced his career in Perth with a firm of Chartered Accountants before moving into a broad range of commercial and financial reporting positions with two major USA based mining companies. He founded the Australian and international retailer, Retail Food Group and developed their presence in seven countries. He has maintained Executive and Board positions in a range of financial services, mining, commercial, academic, government, sporting businesses and organisations.
Robin Ormerod, a co-founder of Pacific Environment, is the Head of Science & Innovation. Robin’s 35 years as an environmental consultant underpins the company’s active phase of business building and practice development. He has extensive expert witness experience in Australia and New Zealand, and is a Certified Consulting Meteorologist (American Meteorological Society), the only CCM in the environmental consulting field in Australia. He is a Life Member of the Clean Air Society of Australia & New Zealand and is currently the Chair of its Modelling Special Interest Group (ModSIG).
David is an experienced company director and CEO. He was previously CEO and Group Head of Corporate Development of Professional Investment Services Ltd, a subsidiary of Centrepoint Alliances. David is a past Chairman of the International Reciprocal Trade Association, a Global Industry Association based in the US. He continues to provide consulting and non-executive director services to many businesses both listed and unlisted. Over the past 20 years he has successfully managed many mergers and acquisitions, and the Board intends to use this expertise in the company’s stated strategy of growth.
Mr. Gallagher began his professional career as a commercial banking graduate with the Commonwealth Bank and later ANZ before starting his own Corporate Advisory Business in 2006. He is a Director of Scintilla Strategic Investments Limited, a microcap-focused investment company. Through this role he is involved in strategy formulation and advice, market communications, and corporate transactions with investee companies. Adam assists businesses across a range of industries through transitional phases including listings, mergers, growth management and corporate governance development. He also acts as Company Secretary for a number of public companies.
Board
Executive Chairman
Director
Non-Executive Director
Company Secretary & Director
Murray d’Almeida
Robin Ormerod
David Johnstone
Adam Gallagher
For
per
sona
l use
onl
y

CEO Report Pacific Environment Limited Annual Report 201510
CEO Report
The 2014-15 financial year has been a year of transition for Pacific Environment, which has seen the completion of the building of the operational platform which now enables us to enter an exciting phase of international and new market expansion. We have grown in both scale, through organic growth and acquisition, and also through the development of EnviroSuite 2.0, our world leading environmental software platform.
Yearly HighlightsReflecting on the year, there have been some notable milestones achieved, each of which will continue to drive our success into the coming year:
• The internally funded commercialisation of our EnviroSuite platform to produce a world-class suite of modules with broad application completed in August 2015. We have received validation of the world-leading nature of EnviroSuite 2.0 from respected international industry participants including regulators, clients, equipment suppliers and research groups.
• The first international contract for EnviroSuite with a sale to the Canterbury Regional Council, New Zealand.
• A Share Purchase Plan raise, and an institutional placement, totalling $1.5 million in funding were completed in May which provided existing and new shareholders with the opportunity to participate in funding for the international distribution of EnviroSuite for the 2015-16 financial year.
• The acquisition of DLA Environmental in September 2014 added scale, new skill-sets and industry diversity to our
Revenue from continuing operations has increased from $9.6 million to $14.8 million, an increase of 54%. NPAT has increased 7% to $1.4 million. The company has grown in skill sets and in industry sectors addressed. Our focus on Group collaboration at the project and business development level is gaining traction and is a defining part of our team culture. More than ever before in the history of the Group, our people are functioning as one with a central focus on consolidated Group performance.
Research and Development continues to play a fundamental role in our operations especially with the increased focus on technology. This emphasis on R&D will continue as it is a necessary investment to keep the company at the leading edge of science and innovation.
For
per
sona
l use
onl
y

Pacific Environment Limited Annual Report 2015 11CEO Report
offering, and importantly, broadened our Consulting revenue model to a higher margin fee for service.
• The securing of the second phase contract with the WestConnex Development Authority for air quality monitoring and analysis for the M5 Main Works project. The project is valued at approximately $4 million over 5 years and is significantly larger than any previous contract in the Company’s history.
• Several international projects were won including projects in Greenland and Colombia. We also were the only Australian company to be appointed to the NZ EPA Panel.
• Completion of Port Hedland Industries Council project, confirming our strategic position in Port Hedland, Western Australia.
• Use of our phytocapping methodology at three landfill sites in NSW, Victoria, and Queensland.
• We are making a notable contribution to the contaminated land industry, having secured two key projects which will form part of the national framework to guide remediation. We are leading the development of site specific remediation objectives as well as the guidance of the assessment, remediation and management of MTBE, a component of gasoline.
• The Group achieved ISO9001 Quality certification as well as AS4801 Health and Safety certification late in the financial year. This is a key milestone as it will assist in securing further government and large project work and ensure clients continue to receive consistent delivery of our services and solutions.
• The appointment of a Chief Operating Officer in March 2015 to manage and grow our Consulting Business.
• A full enterprise resource planning system was implemented across the business in the third quarter. This provides a new level of analytical understanding for management and enables targeted responses to opportunities and issues.
Industry SectorsTwo years ago we began a strategy to diversify both the mix of client industry sectors and, at the same time, broaden our offering to increase relevancy to our end clients. This strategy has resulted in a broader balance through property, infrastructure, agribusiness, resources & energy, manufacturing and government sectors.
The two graphs below provide a telling improvement in our on-going efforts to reach industry balance:
Industry Sectors - 2015 vs 2014
Resources and Energy
Property
Infrastructure
Manufacturing
Government
Agribusiness
FY 2015 FY 2014
For
per
sona
l use
onl
y

CEO Report Pacific Environment Limited Annual Report 201512
We continue to have a steady state of work flowing from resources and energy with expanded production as their priority. Our work in infrastructure continues to grow; which is well aligned with our solid entry into property. Urbanisation and population dynamics will continue to create demand in these industries. Agribusiness is an emerging growth market for Australia and will expand based on long standing relationship with primary producers. Recognised as leaders in abiotic niche disciplines, we will continue to work with government on policy development and regulatory reform.
Practice BreakdownSimilarly, we have a wider range of services and solutions to support our clients. Contaminated land, and the surface and groundwater practices, have been a complementary fit to our core capabilities. Acoustics, toxicology and health risk assessment have all seen steady growth year on year. Over the next year, our acoustics, water and landfill practices are all set to expand. See graphs below.
AcquisitionsWe have invested heavily to structure the Group for growth. We are at a point in the business life cycle where we have strong confidence in the robust nature of our internal systems and the quality of our leadership such that we can invite other quality companies to join our Group.
The small acquisition of Waste Solutions Australia in the 2014 financial year was followed by a larger acquisition of Sydney-based DLA Environmental (DLA). DLA is a long-standing, highly profitable company servicing the property and infrastructure sector predominantly with assessing and managing contaminated sites. The acquisition and integration process was a smooth process and I thank both our existing team and the DLA team, under the stewardship of founder David Lane, for their efforts in the successful union.
During the third quarter we divested our emissions monitoring business. This decision was taken after a review of all business units and their alignment with our stated strategy of an environmental technology company supported by highly skilled scientific consultancy.
We are in continuing discussions with several other acquisition prospects and we will maintain our highly selective approach to ensure that any additions to the Group provide strong leverage to the growth of our existing businesses with an emphasis on our technology.
CEO Report (Continued)
Practice breakdown - 2015 vs 2014
Air Quality & Meteorology
Contaminated Land
Toxicology & Health
Technologies
Groundwater
Landfill
Acoustics
FY 2014FY 2015
For
per
sona
l use
onl
y

Pacific Environment Limited Annual Report 2015 13CEO Report
Strategy – the Year aheadThe technologies group has the potential to become the major growth engine for the company via international sales. This will increase the proportion of revenues from the technologies group compared to the consulting and monitoring groups. Overall, we remain focused on concentrating our efforts on the area of overlap between environmental technology, consulting, and monitoring. This is where we deliver maximum value to our clients, ensuring the best shareholder return. The intention is to accelerate the growth we achieved over the past year. Given a more robust corporate structure is now in place, this growth will result in better returns at the bottom line.
To achieve this growth the Company will continue its three-pillared approach to growth through:
• Technologies expansion
• Organic growth of the existing business streams
• Acquisition
Technologies ExpansionEnviroSuite is a proactive environmental management system that combines real-time monitoring and predictive air quality modelling based upon high resolution weather forecasting. The market need for EnviroSuite can be divided into three key drivers:
• To improve operational efficiency through proactive management practices.
• To meet and manage corporate risk and regulatory compliance and requirements
• To maintain and build social and corporate licence to operate.
The commercialisation project for our EnviroSuite technology is now complete. Our next challenge is to take this technology to the global market place.
Domestic sales are made via a direct sales force, and with the new product and a doubling of the sales force, 50% organic growth is expected for domestic market during the coming year.
For international expansion, the company proposes to adopt an indirect sales model through partners and resellers to fulfil this demand. Highly strategic deals will still be addressed through direct sales. The funds raised in June 2015 will be directed to accelerate this global expansion.
The solution will be offered through a Software as a Service (SaaS) model, supplied from the “cloud”. As such it has global reach with little implementation work associated with it.
The opportunity for Pacific Environment is considerable. If we can take advantage of our first mover position, EnviroSuite will become the default “Internet of Things” platform for the environmental industry.
Organic Growth The existing business have been tasked with a high level of organic growth for the coming year. This is expected to be achieved by increasing cross-selling across the group, as well as by broadening domain expertise in our different offices. During the past year, emphasis and training have been placed on better opportunity and project management which will see increased return on efforts during this coming year.
Growth through AcquisitionsAcquisition targets will be those companies in the environmental sector that have the potential to broaden the current domain area of expertise or to help the company expand into new geographic areas. New expertise bought in will provide a further source for transferring intellectual property into the EnviroSuite platform. These companies will also provide diversification in our markets and revenue model.
ConclusionThe year has proven to be another successful one for the Company, which is now poised for expansion both in the domestic and international markets. I would like to thank our people who have worked diligently throughout the year to always keep our clients’ top priorities as their own. They are a diverse group of dedicated and highly skilled scientists, engineers and support staff who are the key to our success in the coming years.
Chief Executive Officer 28 August 2015
Peter White
For
per
sona
l use
onl
y

Technologies Pacific Environment Limited Annual Report 201514
EnviroSuite
EnviroSuite ensures clients maximise their operational efficiencies and manage risks to health and amenity whilst maintaining environmental regulatory compliance.
14
For
per
sona
l use
onl
y

Pacific Environment Limited Annual Report 2015 15Technologies
CommercialisationEnviroSuite has been successfully deployed over the past three years. However, its growth was constrained due to a lack of scalability in EnviroSuite 1.0. In mid 2014 a full commercialisation project for the product was instigated and has just been completed. The resulting product is EnviroSuite 2.0 which now has the following features:
• Optimised modelling algorithms to produce a scalable system.
• Implemented as a cloud-based (Amazon Web Services) platform. Available on all continents.
• Redesigned user interface including a mobile (tablet and smartphone) version.
• Compartmentalised the solution into discrete, functional modules, targeting different industry sectors.
The result is a state of the art technology that can scale to service thousands of customers and hundreds of thousands of monitoring devices, and is available globally through Amazon Web Services. The solution aggregates environmental and operational data with the potential to become the “Internet of Things” (IoT) platform for environmental management.
Structured for GrowthTo further enable growth and maintain focus the Technologies business unit has been restructured along functional lines. Specialised skills in product management and software development were brought in, dedicated sales people were hired, and units focused on implementation and client support were established. Strong subject matter expertise and a focus on R&D ensures that EnviroSuite remains a market-leading software product for the long-term.
EnviroSuite is a proactive environmental management system that combines real-time monitoring and predictive air quality modelling based upon high resolution weather forecasting. It has been installed in multiple industry sectors:
Mining Ports Manufacturing Hospitals Local Government Energy
EnviroSuite now creates a big dataset that in future can be analysed for relationships between weather, environmental performance, operational performance and compliance. This will become the focus for clients’ operational intelligence.
International Sales
Domestic Sales
Implementation & Support
Product Management
Digital Marketing
Research & Development
Technologies
Data acquisition & repository
System & service monitoring
Device management
Alerts
Reporting
Monitoring
Mon
itorin
g
Layers
Modules
System Modelling
Fore
cast
Now
cast
Back
trac
k
Scen
ario
Blas
t fum
e
Blas
t O/P
Complaints
Com
plai
nts
Regulatory
NPI
NGE
R
For
per
sona
l use
onl
y

Technologies Pacific Environment Limited Annual Report 201516
EnviroSuite Success Stories
Canterbury Regional CouncilCanterbury Regional Council (CRC) regularly receives odour complaints from the community where the cause and source is often difficult to determine. Traditional methods of analysis are both time consuming and costly, yielding low results.
Using EnviroSuite’s advanced backtrack technology, based on real-time meteorological modelling at fine scale, CRC is able to instantly plot the trajectory of a complaint, identifying its likely cause. Adoption of our technology allows CRC to confidently manage the issue throughout the region.
BHP Billiton Iron OreBHP Billiton Iron Ore, an early adopter of EnviroSuite’s automated dust management and boundary monitoring system solutions, have recently extended their contract, at both their port and inland mine sites.
EnviroSuite provides an hour-by-hour weather forecast (two days in advance), automated daily risk reports based on predictive triggers, integrated real-time monitoring data from a number of boundary monitors, real-time trigger alerts, automated and predictive modelling and integrated feedback to the operations control system along with recommended mitigation measures. Alerts via SMS and email, along with a range of automated custom reports assist operators in their day to day management of dust.
The Wesley Hospital - Ward and Emergency Theatre RedevelopmentOver the past 18 months The Wesley Hospital in Brisbane has been undergoing a series of major redevelopment works to upgrade their facilities. Given these works were in close proximity to active operating theatres and preparation areas, Pacific Environment was engaged to assist in the monitoring of airborne particles using EnviroSuite technology. Monitors were sited to provide an early warning by SMS and email of any potential failures in dust management measures. Daily reports and a web-based data repository were also used routinely by project management and hospital staff to report on the effectiveness of dust management measures, ensuring patient safety.
Gladstone Ports CorporationGladstone Ports Corporation uses EnviroSuite to manage air quality issues. Three day hour-by-hour weather forecasts are used to prepare for high-risk conditions and avoid non-compliance events. Our monitoring module is used to provide real-time analysis of environmental data for pro-active management.
Wollongong CoalWollongong Coal uses an EnviroSuite solution for managing air and noise impacts on sensitive nearby locations from its mining operations. The solution includes a predictive hour-by-hour weather forecast (for the next 2 days), automated daily risk reports, real-time monitoring from a weather station, real-time dust monitoring and real-time noise monitoring. Graphical reports, alerts and access to audio files from the EnviroSuite website aid operations.
Anglo American Anglo American sites in Queensland and New South Wales use EnviroSuite to pro-actively manage dust and blasting emissions from their mining operations, as well as annual environmental compliance reporting.
In addition to the dust management components (outlined in the examples above) EnviroSuite enables Anglo American to simulate the potential impacts of each planned blast and to set the most appropriate blast plan that minimises risks to employees, nearby neighbours and the community.
"The implementation of the EnviroSuite real-time monitoring and proactive dust management system approach enables Anglo American to pro-actively manage dust impacts from day-to-day operations.”
Dr Carl Grant, Regional Manager Environment, Anglo American Metallurgical Coal
For
per
sona
l use
onl
y

Pacific Environment Limited Annual Report 2015 17Technologies
Partnerships and AlliancesPacific Environment’s technology sales are currently restricted to the ANZ market. We are now poised to take EnviroSuite to a global market. Our challenge is to do this most effectively and to achieve growth and scale with international sales.
The company has adopted a three-tiered structure to maximise sales:
• Domestic sales will continue to operate via a direct sales model.
• Corporate-wide sales will be made directly to our large multinational clients. This would involve direct sales to big corporates for multiple sites, especially where we have demonstrated value with EnviroSuite at individual sites.
• International sales will be fulfilled through partners and a reseller network.
A channel establishment project has been resourced and financed. A key component of our success will be the ability to attract and retain key partners and to foster these relationships. We have identified potential partner organisations that can extend the value that they provide to their clients by integrating EnviroSuite
with their current offerings. These partners may include environmental equipment suppliers, industry sector specialists or consulting organisations.
In recent trips to the United States and Europe there was a high level of interest in EnviroSuite from multi-national companies, technology providers and government agencies. This has provided strong validation of the market leading position of our technology platform and Pacific Environment’s ability to grow its international presence. Discussions were held with global companies and joint venture technology proposals are being pursued.
Subsequently, a collaboration agreement with OdourNet was completed in August 2015. OdourNet is an international consulting and technology group specialising in the fields of odour management, air quality and acoustics, and is the global leader in the design and development of odour measurement equipment and proficiency testing schemes. OdourNet has operations and offices in eight countries including the Netherlands, France, Spain, Germany, UK, Brazil, Mexico and India.
Beyond the USA and European developments noted above, we are actively engaged in developing other opportunities for EnviroSuite distribution globally.
Roadmap developmentsEnviroSuite 2.0 is now complete. A Roadmap process has been implemented to frame the future development of the product, including new modules as well as system improvements. Each module is owned by a Business Owner to represent and champion client requests for functionality and system performance feedback. Modules planned for the near future include a water module as well as a contaminated land module.
For
per
sona
l use
onl
y

Science & Innovation Pacific Environment Limited Annual Report 201518
Innovation is a key driver of economic growth, which applies just as validly at the company level as it does at the national. In our case the application of scientific knowledge and experience in dealing with real-world issues is the wellspring of our most vital innovative processes. Innovative companies are more likely to achieve better performance in the long run then those that simply follow the standard approaches. Australian Bureau of Statistics surveys show that innovative companies tend to report increased revenue, reduced costs, improved customer service and a competitive edge.
However, it is a common experience for businesses, both large and small, that making innovation an integral part of a company’s fabric is a challenging, long-term undertaking that doesn’t just happen on its own. Rather, it needs a sustained process to achieve best results. The mature outcome of this process is an enterprise-wide approach to innovation that stretches beyond the core and beyond new products, to a holistic approach that builds the capabilities for innovation everywhere in the company, hence driving business value.
In Pacific Environment’s case, the exemplar of innovation and associated R&D is our EnviroSuite technology. Our longer term task is to create an environment in which we might develop other potentially game-changing innovations that can manifest in different opportunities for the Company. But for now, the priority is supporting the needs of EnviroSuite as it both enters the international market and broadens in scope.
An integral part of the innovation enterprise is Research &
I’m pleased to provide shareholders with a summary of some key aspects of the Company’s activities relating to the Office of Science & Innovation. In terms of numbers, the OSI is only small, comprising Dr Peter D’Abreton and myself, but it is an important focal point for the Company’s growth and interacts with many parts of the business. Innovation influences how we move forward with technology products, provide consulting services, conduct internal processes and identify partners for collaboration or acquisition. We plan to infuse the whole business with an innovative culture, and the past year has seen progress in that regard, with more to come.
Science & InnovationF
or p
erso
nal u
se o
nly

Pacific Environment Limited Annual Report 2015 19Science & Innovation
Development. In the past year the Company has grown its level of R&D activity to support the Technologies group - particularly with regard to EnviroSuite 2.0 - and to a lesser extent to support the Consulting group through research-based consulting projects and technical improvements that enhance the quality and efficiency of internal consulting processes.
The past year also brought increasing diversification of the skills base in the company, with the addition of expertise in the fields of surface water management, landfill phytocapping and nanotoxicology, for example. This ongoing diversification is not only widening Pacific Environment’s service offering and client base, but also brings new perspectives and ideas for the enhancement of EnviroSuite from within the group. New modules either are being developed or have a place on the EnviroSuite Roadmap as a direct result of this skills broadening.
Our innovation process includes a procedure for screening new ideas, targeting projects that are rated best in terms of expected technical feasibility, cost of development and financial return. This process aims to maximise the efficiency of the Company’s R&D and the return on investment of innovation activity. After all, the definition of an innovation is that it yields a benefit to business performance, and is not just a clever idea.
In June and July this year, delegations from Pacific Environment made visits to targeted international conferences in the USA, key potential clients or influencers in the USA and Europe, and potential partners in the distribution of EnviroSuite. These visits, as
a prelude to the market release of EnviroSuite 2.0, tested responses and provided market research findings that confirmed EnviroSuite is of great interest to both industry and government.
We were advised on multiple occasions that it is unique, ahead of any competition and squarely in the direction that regulators (and hence industry) are heading.
Our priority now is following up these enthusiastic responses with formalised partnerships and commercial contracts. Already we have signed a Collaboration Agreement with Odournet in Europe, a potential platform for distribution to eight countries, and other negotiations are well advanced. Several international prospects for EnviroSuite contracts are also in process.
We are looking forward to a year full of new ideas and great results.
Founder & Director
Robin OrmerodFor
per
sona
l use
onl
y

Our People Pacific Environment Limited Annual Report 201520
Our the Regional General Manager for Queensland and South Australia. Adrian (PhD, MBA) is a surface water specialist with over 24 years’ experience gained both internationally and domestically. Before joining Pacific Environment Adrian managed his own environmental engineering company that employed 340 people, and later on held senior team management and technical roles in consulting firms based in Brisbane. Among his many projects, Adrian has worked on several high profile coal seam gas and mining projects in Queensland and New South Wales. During the course of this year, Adrian will grow Pacific Environment’s surface water consulting capability to complement existing groundwater and ecotoxicology services. He is actively involved in developing the EnviroSuite water modules that will enable our clients to manage surface and groundwater resources more effectively.
Environmental engineer with 13 years’ consulting experience focusing on noise and vibration assessment, management and approvals. Aaron leads Pacific Environment’s acoustic practice and enjoys the challenge of solving noise related problems often associated with the growing demands of more productive cities and compact urban environments coupled with the need for greater connectivity provided by transport infrastructure. Working across the manufacturing, resources and transport infrastructure sectors, recent projects have included the Bylong Coal Project, road upgrades in Metropolitan and Regional NSW as well as various industrial operations in Queensland, NSW and Victoria. Transport noise assessment and management is expected to be a significant focus over the coming year with a growing team looking to support clients in optimising their noise management strategies.
A senior consultant with over 14 years of experience specialising in regulatory toxicology within the federal government and as a consultant to the chemical industry in Australia and internationally. Griffin has been involved in the development and implementation of federal government regulatory reform. Griffin enables our clients to make the best strategic decisions by translating complex toxicology data into usable knowledge. He is currently completing a PhD degree that will inform the societal discourse regarding safety in the emerging field of nanotechnology. In the year ahead, Griffin will focus on growing the toxicology and nanotoxicology practice area.
Our People
Adrian ZammitAaron McKenzie Griffin D’CostaOur culture drives our rapid growth.
It stems from our people who are solution seeking and confidently tackle any challenge to help clients succeed in their changing environment.
For
per
sona
l use
onl
y

Pacific Environment Limited Annual Report 2015 21Our People
A Principal Environmental Engineer (MSc equiv.) with over 12 years of experience in hydrological modelling for the mining, government and agricultural sectors in Switzerland and Australia. Recent projects she has contributed to include the phytocapping design for an East Gippsland Shire Council and the groundwater compliance monitoring for Anglo Coal. While specialising in groundwater and contaminant transport modelling as well as water resource assessment, Ines has successfully applied her numerical skills to soil moisture modelling for alternative landfill capping and irrigation management applications. The irrigation management project will help our agricultural clients with environmental compliance whilst maximising yields and farm profitability. Helping clients manage surface and groundwater obligations more efficiently through modelling is Ines’ outlook for the next year.
Jane is one of our most senior air quality professionals supporting our clients through the approvals process. Having been with the Pacific Environment team for 20 years, she has been an integral part in seeking new ways to improve our core strengths and to branch into new areas that complement them. In Sydney, she is a core part of the team recognised as the leading air assessment and advice provider for some of the largest transport infrastructure projects in NSW. One such project is WestConnex where we are advancing the approach to major roadway assessment in Australia. This will ensure that while the transport infrastructure will improve connectivity, ease congestion and support urban renewal, local air quality impacts will be quantified and managed effectively for commuters and the community.
As a senior consultant and project manager in Perth, Jose takes pride in being able to mobilise rapidly for clients in Western Australia. With expertise in environmental approvals, auditing, air quality assessments and project management (BSc. MEnv Mang), he is instrumental in helping the company to deliver projects, manage key client relationships and develop new business opportunities. Jose is expanding the Company’s profile in South America with an inherent understanding of the local context; applying his skills to solve environmental compliance challenges through cost-effective monitoring technology.
Simon provides advice on in-ground issues affecting property projects and he delivers contaminated land assessment, environmental remediation, validation support. He is the Deputy General Manager of our contaminated land business unit in NSW, DLA Environmental Services. Central to his role is assisting clients in achieving acceptable environmental and project outcomes by interfacing with the NSW waste industry, and relevant regulatory authorities. Recent projects have involved wide scale remediation and validation of brownfield sites ranging from 126ha to 530ha earmarked to meet the growing residential demand in the state. As the key contact for several local and international property developers, Simon will continue working together with clients to maximise the development potential of their sites.
Ines Epari Jane Barnett Jose Villamizar Simon Spyrdz
For
per
sona
l use
onl
y

Consulting & Monitoring Pacific Environment Limited Annual Report 201522
For
per
sona
l use
onl
y

Pacific Environment Limited Annual Report 2015 23Consulting & Monitoring
Consulting & MonitoringCase Studies
Transport Infrastructure: Management of Regional Air Quality Impacts WestConnex is the largest transport project in Australia, linking Sydney’s west and south-west with the CBD, Sydney Airport and Port Botany. The development of the motorway will alleviate congestion on local roads and improve connectivity between major hubs. Spanning a ten year timeline, the project will be delivered in three stages; stage one is currently underway and stage three will be open to traffic in 2023.
Strategic Advisor to the WestConnex Delivery Authority
Our role as strategic advisor to the WestConnex Delivery Authority is to optimise air quality outcomes and measuring related performance. Over the last twelve months, we have been integral to the production of the air quality impact assessments for the M4 East (Strathfield to Haberfield) and New M5 (Beverly Hills to St Peters) road tunnels.
Expansion of Ambient Air Quality Monitoring Network
The past year has also seen the expansion of the ambient air quality monitoring network for the project from six to twelve monitoring locations, strategically placed to monitor air quality performance along the route. These monitoring stations represent high accuracy, laboratory grade instrumentation to provide accurate information on air quality performance through construction into operation of the motorway. Additional field investigations are on tunnel user exposure are underway.
Responsive support for production: Monitoring Impacts from Power Station Emissions Working alongside Roy Hill for many years, we have assisted them in gaining environmental approvals for their iron ore export facility in Port Hedland and advising on appropriate dust abatement strategies.
Due to current constraints in the local power supply a temporary power supply is needed to support these operations. Roy Hill requires a temporary power station to operate for up to five years and will be seeking an operating licence for this period.
Ambient air monitoring: An operational requirement
The Western Australia Department of Environment and Resources required that Roy Hill initiate a boundary monitoring program for NO2 as part of the management plan for operating the power station.
Pacific Environment established the monitoring regime and is using EnviroSuite as the interface with Roy Hill, providing real-time SMS and email alerts to allow for rapid response.
For
per
sona
l use
onl
y

Consulting & Monitoring Pacific Environment Limited Annual Report 201524
Consulting & Monitoring - Case Studies (Continued)
Urban Revitalisation: Crown Green SquareAfter years of planning, The City of Sydney is actively developing The Green Square Town Centre. The City has committed $440 million over the next 10 years, transforming what was once an industrial area into a sustainable urban environment in the heart of the city.
Our initial site characterisation determined that in excess of 60,0000 tonnes of material is to be removed to accommodate the development of Infinity by Crown, the Crown Group’s 20-storey $575 million iconic development.
Looking Ahead: The Long-term Material Management Strategy
We are developing long-term strategy options to minimise costs associated with resource recovery, materials handling and the related costs of disposal. We will devise a beneficial reuse strategy that is innovative and sustainable, aligning with both UrbanGrowth NSW and the City of Sydney’s policy objectives for urban revitalisation.
Ensuing positive outcomes for the community: Air Quality Assessment for MIM’s Copper Smelter MIM recently submitted an application to Queensland Department of Environment and Heritage Protection to extend the operation of the Copper Smelter Extension Project. The focus of the project is to extend the life of the Copper Smelter by six years, creating additional employment and revenue to Mount Isa.
Expanded production with impact reduction
We provided a series of air quality assessments to support the application. These assessments incorporated site-specific weather and emissions data and are considered to be the most sophisticated and intricate models produced for the site to date.
The results are an increased understanding of the air quality issues in Mount Isa and new information to control the facility’s emissions to further reduce any impacts on the community. During public exhibition, the Copper Smelter Extension Project application received only positive submissions, which is a testament to the commitment of Mount Isa Mines, and our collective effort, to provide the public with a comprehensive understanding of the complex air quality issues.F
or p
erso
nal u
se o
nly

Pacific Environment Limited Annual Report 2015 25Consulting & Monitoring
Technical support to the Commonwealth: International Conventions Australia is required to implement strategies for the phase out of the use of chemicals ratified under the Stockholm Convention for Persistent Organic Pollutants (POPs). Five substances have recently been listed in the Convention and are being assessed by the Commonwealth Department of Environment as part of Australia’s response to the listing.
Together with a well-respected economics consultancy we are conducting a cost benefit analysis to inform the Governments decision making process on the appropriate responses for Australia in phasing out the use of these chemicals.
Health Risk Assessment for POPs under the Stockholm Convention
Our risk assessment team evaluated the risks that the listed substances currently pose to the Australian population and environment. The results estimated the potential increase in ADHD and IQ loss in children that is associated with current chemical exposure. The costs of these impacts were then assessed by our project partners to complete the overall cost-benefit analysis.
Safety and Risk: Landfill Gas Mitigation using On-site Gas Combustion Underground fires in landfills are caused through spontaneous combustion, that is, a buried heat source, resulting from biological decomposition or chemical oxidation, producing ‘thermal runaway’, a dangerous condition that is difficult to manage. LFG must be managed to not only prevent underground fires but also problems such as gas offsite gas migration into confined spaces such as garages, houses and buildings.
Use of GCS to mitigate offsite LFG soil intrusion and fugitive emissions
Working with the ‘Western Region Waste Management Authority (WRWM) under licence by the South Australian Environmental Protection Agency we aim to extract and safely combust LFG using our low-calorific flaring technology.
Our solution extracts gas more safely to a lower gas recovery rate than the standard high calorific; ideally suited for closed landfill sites. The use of this specific approach will result in mitigating risk by reducing potential off-site migration.
For
per
sona
l use
onl
y

Directors' Report Pacific Environment Limited Annual Report 201526
Directors’ Report
Your directors present their report, together with the financial statements of the consolidated entity (referred to hereafter as the Group) consisting of Pacific Environment Limited (ABN: 42 122 919 948) (referred to hereafter as the Company) and its controlled entities, for the financial year ended 30 June 2015.
DirectorsThe following persons were directors of the Company at any time during, or since the end of, the financial year up to the date of this report:
Murray d’Almeida (Chairman) Adam Gallagher (Director and Company Secretary) David Johnstone (Director) Robin Ormerod – appointed as a Director 22 May 2015 Kristin Zeise – appointed as a Director 3 December 2014, resigned 22 May 2015
Directors have been in office since the start of the financial year to the date of this report unless otherwise stated.
Particulars of each director’s experience and qualifications are set out later in this report.
Principal activities and significant changes in nature of activitiesDuring the year the principal continuing activities of the Group consisted of the provision of environmental consulting and technology services. There were no significant changes in the nature of the Group’s activities during the financial year.
Dividends paid or recommendedNo dividends were paid by the Company to members during the financial year. No dividends were recommended or declared for payment, but not paid, to members during the financial year.
Operating results and review of operations for the year
Operating Results
Revenues from continuing operations for Pacific Environment Limited (the Group) for the year ended 30 June 2015 were $14,805,000 a significant increase due to growth and acquisitions compared to prior year revenue of $9,618,000. Net profit after tax from continuing operations was $1,822,000 compared to a profit in the prior year of $1,277,000, an increase of 43% reflecting a year of company consolidation and investment. During FY15, the Group acquired the business of DLA Environmental Services (October 2014) as well as divesting the non-core Queensland-based stack emissions measurement business unit (March 2015). This non-core business unit has been treated as a discontinued operation. Net profit after tax was $1,407,000 compared to prior year after tax profit of $1,311,000.
Financial Position
The net assets of the consolidated Group have increased by $3,615,000 from $9,521,000 at 30 June 2014 to $13,136,000 as at 30 June 2015. This improvement is due to the capital raising that occurred in May and June 2015. In addition, fixed assets have increased due to strategic debt-funded asset purchases along with an increase in intangible assets associated with the acquisition of the Waste Solutions and DLA Environmental Services businesses.
Further discussion is contained in the Chairman’s Letter and the Chief Executive Officer’s Report of this Annual Report.
Significant changes in the state of affairsSignificant changes in the state of affairs of the Group during the financial year were as follows:
1. Acquisition of the DLA business in October 2014.
2. Divestment of the non-core Queensland-based stack emissions measurement business unit in April 2015.
3. Total equity increased to $13,136,000 from $9,521,000, an increase of $3,615,000. The movement was largely the result of the profits generated during the period as well as the increase in fixed and intangible assets.
Events after the reporting periodNo matters or circumstances have arisen since the end of the financial year that significantly affected, or could significantly affect, the operations of the consolidated Group, the results of those operations, or the state of affairs of the consolidated Group in future financial years.
Likely developments and expected results of operationsThere are no likely developments in the operations of the Group that were not finalised at the date of this report.
Additional comments on expected results of certain operations of the Group are included in this annual report under the Chairman’s Statement and CEO Report.
Environmental regulationThe Group is not subject to any significant environmental regulation under a law of the Commonwealth or of a State or Territory.
For
per
sona
l use
onl
y

Pacific Environment Limited Annual Report 2015 27Directors' Report
Information on Directors
Murray d’Almeida Chairman
Experience and expertise
Mr. d’Almeida has over 36 years of diverse national and international business experience. He commenced his career in Perth with a firm of Chartered Accountants before moving into a broad range of commercial and financial reporting positions with two major USA based mining companies. He founded the Australian and international retailer, Retail Food Group and developed their presence in seven overseas countries. He has maintained operating and board positions within a range of financial services, mining, commercial, academic, government, sporting businesses and organisations.
Current Directorships
Chairman of BPS Technology Limited, Chairman of Bartercard Australia Pty Ltd, Chairman of Management Resource Solutions plc, Chairman of Barrack Street Investments Limited
Previous Directorships
Director of Beacon Hill Resources plc, Director of Hyperion Holdings Limited, Director of Hyperion Asset Management Limited, Founder/Director of Retail Food Group (Aust.), Chairman of Allied Brands Limited, Chairman of ECT Limited, Director of Capricorn Resources NL, Director Gold Pacific Resources Limited, Director of Institute of Business Leaders
Mr. d’Almeida is a member of the Gold Coast Light Rail Business Advisory Group and a Trustee of the Currumbin Wildlife Foundation. He was a board member of the Commonwealth Games Business Advisory Board, Vice President of Queensland Rugby Union, a board member of Griffith University Business Advisory Board, a director of the Franchisor Association (Aust/NZ) and has held other local and state government positions.
Special responsibilities
Chair of the Board Chair of the Acquisition Committee
Interest in shares and options
7,000,000 options in Pacific Environment Limited
Adam Gallagher – B Econ., M Com., GDip IS., GDip ACG. Director and Company Secretary
Experience and expertise
Mr. Gallagher began his professional career as a commercial banking
graduate with the Commonwealth Bank and later ANZ before starting his own Corporate Advisory Business in 2006. He is a Director of Scintilla Strategic Investments Limited, a microcap-focused investment company. Through this role he is involved in strategy formulation and advice, market communications, and corporate transactions with investee companies. Adam assists businesses across a range of industries through transitional phases including listings, mergers, growth management and corporate governance development. He also acts as company secretary for a number of public companies.
Mr. Gallagher holds a Bachelor of Economics, Masters in Commerce and Graduate Diploma in Information Systems, as well as a Graduate Diploma in Applied Corporate Governance.
Other current directorships of listed companies
Director of Agenix Ltd
Former directorships of listed companies in last 3 years
None
Special responsibilities
Chairman of the Audit and Risk Management Committee Chairman of the Remuneration and Nomination Committee Member of the Acquisition Committee
Interest in shares and options
4,500,000 options in Pacific Environment Limited
David Johnstone Director
Experience and expertise
Mr. Johnstone is an experienced executive who has been actively involved in business for more than 31 years. He has successfully started, owned and operated a vast range of businesses. With experience gained nationally and internationally in selling, licensing, merging and acquiring businesses he has arranged significant funding for management buy outs, leveraged buyouts along with the successful placement/listing of companies on the London Stock Exchange and the Australian Stock Exchange. Mr. Johnstone, whilst consulting to ASX listed Centrepoint Alliance Ltd was previously Group Head of Corporate Development and prior to that CEO of Centrepoint Alliances’ largest subsidiary Professional Investment Services Ltd. He was also CEO of Bartercard Ltd after he successfully sold and merged Trade Ltd, a business he founded with Bartercard Ltd. Mr. Johnstone is a past Chairman of the International Reciprocal Trade Association, a Global Industry Association, which is based in the USA. He continues to provide consulting and non-executive director
For
per
sona
l use
onl
y

Directors' Report Pacific Environment Limited Annual Report 201528
services to medium to large businesses in the financial services, IT, property development, and franchising sectors.
Mr. Johnstone’s specialties include: Financial Services, Funding, Investment, Corporate Development, Mergers & Acquisitions, Negotiations, Resolution of Company Disputes, Leadership Mentoring, and Non-Executive Directorships.
Other current directorships of listed companies
None
Former directorships of listed companies in last 3 years
None
Special responsibilities
Member of the Audit and Risk Management Committee Member of the Remuneration and Nomination Committee
Interest in shares and options
2,000,000 options in Pacific Environment Limited
Kristin Zeise appointed as a Director 3 December 2014, resigned 22 May 2015
Experience and expertise
Ms Zeise is a founder and inaugural Director of the Company, and was a founder of Pacific Air & Environment, one of the initial businesses forming part of the Pacific Environment group. She continues as a full-time contractor to the group. Ms Zeise is a Chemical Engineer who immigrated to Australia from California in the early 1990s. She has successfully grown consulting businesses in the Environmental Sector and worked on many high profile projects in the last two decades, both in Australia and internationally. She has a keen understanding of the business drivers in the environmental sector and her ongoing US connections are relevant to the Company’s growth plans.
Other current directorships of listed companies
None
Former directorships of listed companies in last 3 years
None
Special responsibilities
None
Interest in shares and options
13,478,488
Robin Ormerod – B Sc (Hons) Managing Director appointed as a director 22 May 2015
Experience and expertise
Mr. Ormerod co-founded Pacific Air & Environment (PAE), the foundation business of Pacific Environment, in 1995 and helped lead it to a successful and respected position among air quality consultancies in Australia. He directed PAE’s research and development activities, which created the precursor to Pacific Environment’s EnviroSuite technology. He has developed a wide national and international network of business and scientific contacts over his 33 years of environmental consulting. He was Pacific Environment Limited’s Director of Innovation and R&D and the company’s Air Quality & Meteorology Practice Leader.
Mr. Ormerod is the only Certified Consulting Meteorologist, accredited by the American Meteorological Society, practising in environmental consultancy in Australia. He is well known in his profession, and in 2004 was presented with the Distinguished Service Award and Life Membership by the Clean Air Society of Australia & New Zealand for contributions over many years.
He was twice (1985 and 1988) elected to local government (Logan City Council, Qld) where he served on finance, planning, health and environment committees.
Other current directorships of listed companies
None
Former directorships of listed companies in last 3 years
None
Special responsibilities
None
Interest in shares and options
Interest in 24,378,720 ordinary shares, comprising:
(i) 11,333,193 held by R. Ormerod (both legally and beneficially)
(ii) 26,091,054 held by Zeise Ormerod Superannuation Fund (registered holders: R. Ormerod and K. Zeise) of which R. Ormerod is beneficially entitled to 13,045,527.
Company SecretaryMr. Gallagher is the Company Secretary and held the position at the end of the financial year.
For
per
sona
l use
onl
y

Pacific Environment Limited Annual Report 2015 29Directors' Report
Meetings of directorsThe numbers of meetings of the Company’s Board of directors and committees of the Board held during the year ended 30 June 2015, and the numbers of meetings attended by each director were:
Full Meetings of Directors Audit and Risk Management Committee
Remuneration and Nomination Committee
Acquisition Committee
A B A B A B A BMurray d’Almeida 22 20 1 1 2 2 1 1Adam Gallagher 22 22 2 2 2 2 6 6David Johnstone 22 22 1 1 - - 5 5Robin Ormerod 2 2 - - - - - -Kristin Zeise 8 8 - - - - - -
A - Number of meetings attended. B - Number of meetings held during the time the director held office or was a member of the committee during the year (number eligible to attend).
Shares under optionUnissued ordinary shares of Pacific Environment Limited under option at the date of this report are as follows:
Expiry date Issue price of shares ($) Number under option08/05/17 0.05 500,000
08/05/17 0.03 300,000
05/02/18 1.50 100,000
05/02/18 1.25 150,000
05/02/18 1.00 150,000
05/02/18 0.75 250,000
10/02/18 1.00 100,000
10/02/18 0.75 680,000
10/02/18 0.55 100,000
10/02/18 0.75 100,000
19/04/18 0.06 6,025,000
31/10/18 0.08 1,000,000
31/10/18 0.10 1,000,000
31/10/18 0.12 1,500,000
31/10/18 0.15 1,500,000
31/10/18 0.16 2,000,000
31/10/18 0.20 2,000,000
12/11/18 0.03 5,000,000
31/10/19 0.10 1,000,000
31/10/19 0.15 1,000,000
12/11/19 0.07 2,000,000
09/04/20 0.06 2,000,000
12/11/20 0.05 1,000,000
04/02/21 0.09 2,800,000
04/02/21 0.11 5,350,000
Total 37,605,000
No option holder has any right under the options to participate in any other share issue of the Company or any other related entity.
For
per
sona
l use
onl
y

Directors' Report Pacific Environment Limited Annual Report 201530
Shares issued on the exercise of optionsOn 22 April 2015, 875,000 ordinary shares of Pacific Environment Limited were issued on the exercise of options. No further shares have been issued on the exercise of options since that date.
Indemnification and insurance of officers or auditorDuring the financial year, Pacific Environment Limited paid a premium of $32,079 (2014: $32,079) to insure the directors and officers of the Group.
The liabilities insured are legal costs that may be incurred in defending civil or criminal proceedings that may be brought against the officers in their capacity as officers of entities in the Group, and any other payments arising from liabilities incurred by the officers in connection with such proceedings. This does not include such liabilities that arise from conduct involving a willful breach of duty by the officers or the improper use by the officers of their position or of information to gain advantage for themselves or someone else or to cause detriment to the Company. It is not possible to apportion the premium between amounts relating to the insurance against legal costs and those relating to other liabilities.
No indemnities have been given or insurance premiums paid, during or since the end of the financial year for the auditor of the consolidated Group.
Proceedings on behalf of the CompanyNo person has applied for leave of the Court to bring proceedings on behalf of the Company, or to intervene in any proceedings to which the Company is a party, for the purpose of taking responsibility on behalf of the Company for all or part of those proceedings.
The Company was not a party to any such proceedings during the year.
Non audit servicesThe Company may decide to employ the auditor on assignments additional to their statutory audit duties where the auditor’s expertise and experience with the Company and/or the Group are important.
The Board of directors has considered the position and is satisfied that the provision of the non-audit services is compatible with the general standard of independence for auditors imposed by the Corporations Act 2001. The directors are satisfied that the provision of non-audit services by the auditor, as set out below, did not compromise the auditor independence requirements of the Corporations Act 2001 for the following reasons:
• all non-audit services have been reviewed to ensure they do not impact the impartiality and objectivity of the auditor APES110(290).• none of the services undermine the general principles relating to auditor independence as set out in APES 110 Code of Ethics for
Professional Accountants.
During the year no fees were paid or payable for non-audit services provided by WPIAS Pty Ltd.
Auditor’s independence declarationA copy of the auditor’s independence declaration as required under section 307C of the Corporations Act 2001 is set out on page 44.
ASIC Class Order 98/100 - Rounding of amountsThe Company is an entity to which ASIC Class Order 98/100 applies and accordingly amounts in the financial statements and directors’ report have been rounded to the nearest thousand dollars.F
or p
erso
nal u
se o
nly

Pacific Environment Limited Annual Report 2015 31Directors' Report
Remuneration report (audited)The information provided in this remuneration report has been audited as required by section 308(3C) of the Corporations Act 2001.
A. Principles used to determine the nature and amount of remunerationThe objective of the Group’s executive reward framework is to ensure reward for performance is competitive and appropriate for the results delivered. The framework aligns executive reward with achievement of strategic objectives and the creation of value for shareholders, and conforms to market practice for delivery of reward.
The Board ensures that executive reward satisfies the following key criteria for good reward governance practices:
• competitiveness and reasonableness• acceptability to shareholders• performance linkage / alignment of executive compensation• transparency
• capital management
The Group has structured an executive remuneration framework that is market competitive and complementary to the reward strategy of the organisation.
Alignment to shareholders’ interests:
• has economic profit as a core component of plan design• focuses on sustained growth in shareholder wealth, consisting of dividends and growth in share price, and delivering constant return on
assets as well as focusing the executive on key non- financial drivers of value
• attracts and retains high calibre executives
Alignment to program participants’ interests:
• rewards capability and experience
• provides recognition for contribution
(i) Non-executive directors
Fees and payments to non-executive directors reflect the demands which are made on, and the responsibilities of, the directors. Non-executive directors’ fees and payments are reviewed annually by the Board.
Non-executive directors have received incentive share options or shares subject to certain terms and conditions determined by the Board.
Non-executive director’s fees are determined within an aggregate directors’ fee pool limit. The current pool limit is $200,000 per annum. The following fees applied:
Base fees
Chair $60,000
Other directors $30,000 - $40,000
Directors appointed to chair a board committee are paid an additional fee of $5,000 per committee.
(ii) Retirement allowances for directors
There are no retirement allowances for directors of the Group.
For
per
sona
l use
onl
y

Directors' Report Pacific Environment Limited Annual Report 201532
(iii) Executive pay
The executive pay and reward framework has three components:
• base pay and benefits, including superannuation; • short-term incentives linked to the attainment of performance targets; and
• long-term incentives through participation in various Pacific Environment Limited Employee Share and Option schemes.
The combination of these comprises an executive’s total remuneration.
Base pay
Base pay is structured as a total employment cost package which may be delivered as a combination of cash and prescribed non-financial benefits at the executives’ discretion.
Executives are offered a competitive base pay that comprises the fixed component of pay and rewards.
There are no guaranteed base pay increases included in any executives’ contracts.
Superannuation
Retirement benefits are delivered under the Australian superannuation legislation at 9.5% of base salary for the financial year ended 30 June 2015, up to the maximum superannuation contribution base.
Short-term incentives
Short-term incentives are provided to certain employees, where payment is dependent on the satisfaction of performance conditions.
Long-term incentives
Long-term incentives are provided to certain employees via various Pacific Environment Limited Employee Share and Option schemes; see page 35 for further information.
(iv) Chief Executive Officer’s remuneration
Base pay
Peter White is paid a base payment of $250,000 annually, inclusive of superannuation.
Short-term incentive
Mr. White will be paid a bonus of 2.5% of the Company’s audited EBIT, and receive shares, as detailed below, if specific revenue criteria are met in a financial year.
Long-term incentive
Shares will be issued to Mr. White as follows:
• 1 million shares upon the Company reaching $13m revenue in a financial year for the first time• 1 million shares upon the Company reaching $20m revenue in a financial year for the first time• 1 million shares upon the Company reaching $30m revenue in a financial year for the first time• 1 million shares upon the Company reaching $40m revenue in a financial year for the first time• 1 million shares upon the Company reaching $60m revenue in a financial year for the first time
For
per
sona
l use
onl
y

Pacific Environment Limited Annual Report 2015 33Directors' Report
Mr. White will also be issued fully paid ordinary shares based upon the Company’s audited revenue each financial year as follows:
• 200,000 shares for revenue between $13m and $20m• 250,000 shares for revenue between $20m and $30m• 333,000 shares for revenue between $30m and $40m• 500,000 shares for revenue between $40m and $60m
• 1,000,000 shares for revenue over $60m
Escrow of shares
Any shares issued to Mr. White pursuant to the CEO agreement will be subject to voluntary escrow for two years from the date of issue or until a Change of Control Event (essentially (i) a takeover of the Company; (ii) sale of the Company’s business; or (iii) other reorganisation of the PEL Group of companies which results in Mr. White ceasing to be CEO) occurs, whichever is the earlier.
As at 30 June 2015, with the company reaching the specific revenue criteria targets, Mr. White was granted 1,200,000 fully paid ordinary shares in the Company.
Effect of a Change of Control Event
If a Change of Control Event occurs Mr. White will be issued ordinary shares as follows (less the number of Incentive Shares already issued to him):
• 4,000,000 shares if the event occurs after 30 June 2014 but before 30 June 2015
• 5,000,000 shares if the event occurs after 30 June 2015
Share options
In November 2012, Mr. White was granted 5,000,000 options over 5,000,000 fully paid ordinary shares in the Company, exercisable at $0.03 (3 cents) each. The options will expire 6 years after date of grant and will vest in 1,666,667 parcels, one year, two years and three years after grant.
In April 2012, Mr. White received 2,000,000 options over 2,000,000 fully paid ordinary shares in the Company, exercisable at $0.055 (5.5 cents) each. The options will expire 8 years after date of issue and will vest in 500,000 parcels, one year, two years, three years and four years after issue, even if Mr. White ceases to be employed as CEO by the Company before the final vesting dates.
Mr White received 50,000 options previously in his role as Director.
Termination benefits
The company, should it wish to do so, must provide 3 months’ written notice of termination. No other terminations benefits are applicable.
B. Details of remuneration(i) Amounts of remuneration
Details of the remuneration of the directors, the key management personnel of the Group (as defined in AASB 124 Related Party Disclosures) and specified executives of the Company and the Group are set out in the following tables.
The key management personnel of the Group are the directors and company secretary of Pacific Environment Limited (see page 26 above) and the Chief Executive Officer.
(ii) Changes since the end of the reporting period
No changes to the Board have been made since the end of the reporting period.
For
per
sona
l use
onl
y

Directors' Report Pacific Environment Limited Annual Report 201534
2015 Short-term employee benefits
Long term benefits
Share-based payments
Cash Salary
and fees $
Non-monetary benefits
$Other
$
Super-annuation
$
Long service Leave
$Shares
$Options
$Total
$
Directors
Murray d’Almeida 60,000 - - - - - 11,769 71,769
David Johnstone 40,000 - - - - - 5,158 45,158
Kristin Zeise (appointed 3 December 2014, resigned 22 May 2015)
- - - - - - - -
Managing director
Robin Ormerod (appointed 22 May 2015) - - - - - - - -
Director and company secretary
Adam Gallagher 60,000 - - - - - 7,094 67,094
Other key management personnel
Peter White 268.373 - - 18,783 - - 11,016 298,172
Total key management personnel compensation 428,373 - - 18,783 - - 35,037 482,193
2014 Short-term employee benefits
Long term benefits
Share-based payments
Cash Salary
and fees $
Non-monetary benefits
$Other
$
Super-annuation
$
Long service Leave
$Shares
$Options
$Total
$
Directors
Murray d’Almeida 60,000 - - - - - 7,474 67,474
David Johnstone (appointed 10 February 2014) 14,896 - - - - - - 14,896
Managing director
Robin Ormerod (resigned 10 February 2014) - - - - - - - -
Director and company secretary
Adam Gallagher 60,000 - - - - - 4,729 64,729
Other key management personnel
Peter White 243,340 - - 17,775 - - 14,542 275,657
Total key management personnel compensation 378,236 - - 17,775 - - 26,745 422,756
(iii) Key management personnel of the Group and other executives of the Company and the Group
No portion of remuneration for directors is linked to performance for both the current and prior financial years. Peter White’s remuneration includes short and long term incentives linked to performance as detailed above in Section A(iv) of the Remuneration Report.
For
per
sona
l use
onl
y

Pacific Environment Limited Annual Report 2015 35Directors' Report
C. Service AgreementsOn appointment to the Board, all directors enter into a service agreement with the Company in the form of a letter of appointment. The letter summarises the Board policies and terms, including compensation, relevant to the office of director.
Remuneration and other terms of employment for other key management personnel are also formalised in service agreements. Each of these agreements provides for the provision of performance related cash bonuses, other benefits, and participation, when eligible, in various Pacific Environment Limited Employee Share and Option schemes.
All current appointments for key management personnel are listed below. All service agreements are reviewed annually by the Board of directors.
Name Commencement date*Annual base salary including
superannuation*
Key management personnel
Peter White – Chief Executive Officer ^ 10 April 2012 $250,000
* All service agreements are ongoing.** Base salaries quoted are for the year ended 30 June 2015; they are reviewed annually.^ Details of Peter White’s remuneration are shown in section A of the remuneration report on page 32.
D. Share based compensation(i) Options
Options over shares in the Company are granted under various Pacific Environment Limited Employee Share and Option schemes.
These plans are designed to provide long-term incentives for employees to deliver long-term shareholder returns. Participation in the Plans is at the Board’s discretion and no individual has a contractual right to participate in the Plan or to receive any guaranteed benefits.
The Pacific Environment Limited Employee Share Option Plan was approved by the Board prior to the public listing of the Company. Under this plan participants are granted options which only vest if the employees are still employed by the Group at the end of the vesting period. Under the Pacific Environment Limited Executive Share Option Scheme, participants are granted options that are not forfeitable upon the employee ceasing employment with Pacific Environment Limited. Where an employee ceases employment all non-vested options immediately vest (accelerated vesting); the employee has seven days after termination to exercise the options (otherwise the options then lapse) and the exercise price upon accelerated vesting alters to the greater of the current market value and the original exercise price.
Under both plans, options granted, once converted to ordinary shares, carry standard dividend or voting rights available to ordinary shareholders. When exercisable, each option is convertible into one ordinary share either at the next Board meeting or within 15 business days of vesting, whichever is earlier.
Details of options over ordinary shares in the Company provided as remuneration to each director of Pacific Environment Limited and each of the key management personnel of the parent entity and the Group are set out below. When exercisable, each option is convertible into one ordinary share of Pacific Environment Limited. Further information on the options is set out in note 35 to the financial statements.
The assessed fair value at grant date of options granted to the individuals is allocated equally over the period from grant date to vesting date, and the amount is included in the remuneration tables above. Fair values at grant date are determined using a Black Scholes option pricing model that takes into account the exercise price, the term of the option, the impact of dilution, the share price at grant date and expected price volatility of the underlying share, the expected dividend yield and the risk free interest rate for the term of the option.
No options granted to key management personnel were exercised during the year (2014: nil).
For
per
sona
l use
onl
y

Directors' Report Pacific Environment Limited Annual Report 201536
2015 Balance at start of the
yearGranted as
compensation Exercised Forfeited
Balance at end of the
yearVested and exercisable Unvested
Directors of Pacific Environment Limited
Murray d’Almeida 5,000,000 2,000,000 - - 7,000,000 500,000 6,500,000
David Johnstone - 2,000,000 - - 2,000,000 - 2,000,000
Other key management personnel of the Group
Peter White 7,050,000 - - - 7,050,000 4,883,334 2,166,666
Director and Company SecretaryAdam Gallagher 4,500,000 - - - 4,500,000 - 4,500,000
2014 Balance at start of the
yearGranted as
compensation Exercised Forfeited
Balance at end of the
yearVested and exercisable Unvested
Directors of Pacific Environment Limited
Murray d’Almeida 500,000 4,500,000 - - 5,000,000 500,000 4,500,000
Other key management personnel of the Group
Peter White 7,050,000 - - - 7,050,000 2,716,667 4,333,333
Company SecretaryAdam Gallagher - 4,500,000 - - 4,500,000 - 4,500,000
(ii) Shares
Shares in the Company are granted under the Pacific Environment Limited Employee Share Plan which was approved by the Board prior to the public listing of the Company and on an individual basis for the directors and Company secretary.
The Employee Share Plan is designed to provide long-term incentives for executives to deliver long-term shareholder returns. Under the Plan participants are granted shares that carry the same rights and obligations as other shares. Participation in the Plan is at the Board’s discretion and no individual has a contractual right to participate in the plan or to receive any guaranteed benefits.
No shares were granted to key management personnel under the Employee Share Plan during the year.
For
per
sona
l use
onl
y

Pacific Environment Limited Annual Report 2015 37Directors' Report
E. Shareholdings of Key Management PersonnelThe numbers of shares in the Company held during the financial year by each director of Pacific Environment Limited and other key management personnel of the Group, including their personally related parties, are set out below. Details of shares granted during the reporting period as compensation can be found in note 35.
2015 Balance at start of the
yearGranted as
compensation
Other changes during the
year
Balance at end of the
year
Directors of Pacific Environment Limited
Murray d’Almeida - - - -
David Johnstone - - - -
Kristin Zeise (appointed 3 December 2014, resigned 22 May 2015) 13,478,000 - - 13,478,488
Robin Ormerod (appointed 22 May 2015) 15,632,841 - 8,745,879 24,378,720
Other key management personnel of the Group
Peter White 220,447 - - 220,447
Director and Company SecretaryAdam Gallagher - - - -
2014 Balance at start of the
yearGranted as
compensation
Other changes during the
year
Balance at end of the
year
Directors of Pacific Environment Limited
Murray d’Almeida - - - -
David Johnstone (appointed 10 February 2014) - - - -
Robin Ormerod (resigned 10 February 2014) 15,007,841 - 625,000 15,632,841
Other key management personnel of the Group
Peter White 220,447 - - 220,447
Director and Company SecretaryAdam Gallagher - - - -
F. Loans to key management personnelThere were no loans to key management personnel during the reporting period.
For
per
sona
l use
onl
y

Directors' Report Pacific Environment Limited Annual Report 201538
G. Other transactions with key management personnelA director, Robin Ormerod, and a former director, Kristin Zeise, are directors and shareholders of ROKZair Pty Ltd. This entity has provided the Group with environmental consultancy services during the reporting period.
Adam Gallagher is a director and the company secretary of the Company. His fees are paid to DG Capital Partners Pty Ltd, an associate of Adam Gallagher. DG Capital Partners provided additional services to the Company in relation to the research and qualification of potential company acquisitions.
Murray d’Almeida is the chairman of the company. His fees are paid to MC Consultancy Pty Ltd, an associate of Murray d’Almeida. MC Consultancy provide additional services to the Company in relation to marketing communications and business development.
Aggregate amounts of each of the above types of other transactions with key management personnel of Pacific Environment Limited:
2015 $
2014 $
Amounts recognised as expense
Consultancy fees - ROKZair Pty Ltd* 230,105 276,293
Consultancy fees - DG Capital Partners Pty Ltd 96,000 80,000
Consultancy services - MC Consultancy Pty Limited 30,000 -
356,105 356,293
* 2015 amount relates to the periods for which Kristin Zeise was a director (3 December 2014 to 22 May 2015) and the periods for which Robin Ormerod was a director (22 May 2015 to 30 June 2015) and 2014 amount disclosed relates to the period for which Robin Ormerod was a director (1 July 2013 to 10 February 2014). The entity continues to provide the group with environmental consultancy services.
This Director’s report, incorporating the Remuneration Report, is signed in accordance with a resolution of the Board of Directors
Chairman 28 August 2015
Murray d’Almeida
For
per
sona
l use
onl
y

For
per
sona
l use
onl
y

Corporate Governance Statement Pacific Environment Limited Annual Report 201540
The ASX Listing Rules require that the Company’s annual report contain a statement disclosing the extent to which the Company has followed the corporate governance ”recommendations” (“Recommendations”) of the ASX Corporate Governance Council during the financial year. Pacific Environment Limited (the Company) and its board of directors (the Board) are committed to achieving and demonstrating the highest standards of corporate governance. The Board continues to review the framework and practices to ensure they meet the interests of shareholders. The Company and its controlled entities together are referred to as “the Group” in this statement.
Principle 1
Lay solid foundations for management and oversightThe Company’s Board of Directors (“the Board”) has adopted a Corporate Governance Charter (“the Corporate Governance Charter”) which details the functions reserved to the Board. A copy of the Corporate Governance Charter is published on the Group’s website.
• The Board’s broad functions are to:• chart strategy and set financial targets for the Group;• monitor the implementation and execution of strategy and performance against financial targets;• appoint and oversee the performance of executive management; and• generally take an effective leadership role in relation to the Group.
• The Company’s senior executives are charged with the day to day management of the Company.
The Company’s process for evaluating the performance of its senior executives is set out in Section 2.8 of the Corporate Governance Charter.
A formal performance evaluation of senior executives in accordance with the procedure provided for in the Corporate Governance Charter took place during the reporting period. In addition, ongoing informal evaluation is undertaken by the Company’s Chairman and Chief Executive Officer.
Principle 2
Structure the Board to add valueA majority of the Board were not independent directors (as defined in the guidance notes to the Recommendations) for the last four months of the reporting period following the appointment of Murray d’Almeida as Executive Chairman in March 2015. David Johnstone is the sole remaining independent director on the board. The Board believes the number of directors and composition of the Board is appropriate given the size of the Company and the nature of the Company’s operations. As the Company continues to grow the composition of the Board will be reviewed and further appointments may be made as appropriate.
During the reporting period:
• the Company’s chair was an independent director until March 2015 until becoming Executive Chairman; and
• the roles of Chairman and Chief Executive Officer were not exercised by the same individual.
The Company’s process for evaluating the performance of the Board, its committees and individual directors is set out in Section 2.8 of the Corporate Governance Charter.
The relevant skills, experience and expertise possessed by each of the Company’s directors are set out in the Directors’ Report. The Board considers that during the reporting period Murray d’Almeida (until March 2016) and David Johnstone were independent directors. The Board has adopted the definition of “Independent Director” in Section 2.6 of the Corporate Governance Charter. The Board considers that Adam Gallagher is not an independent director because he is a material supplier of company secretarial and advisory services to the Company. Kristin Zeise and Robin Ormerod are not considered independent directors as they are substantial shareholders and employed in an executive capacity.
Corporate Governance StatementF
or p
erso
nal u
se o
nly

Pacific Environment Limited Annual Report 2015 41Corporate Governance Statement
The period of office held by each director is set out in the Directors’ Report.
Informal performance evaluations of the board, its committees and directors took place during the reporting period. The nature and appropriateness of the performance evaluation processes will be reviewed periodically in line with the growth of the Group.
The procedure for the selection and appointment of new directors and the re-election of incumbent directors, and the Board’s policy for the nomination and appointment of directors, is contained in Section 2.7 of the Corporate Governance Charter.
Principle 3
Promote ethical and responsible decision-makingA code of conduct for the Company’s directors is contained in Section 3 of the Corporate Governance Charter. The stated objective of the Code is to give the Company’s directors mandatory directions to follow when performing their duties, to enable them to achieve the highest possible standards in meeting their obligations, and to give them a clear understanding of best practice in corporate governance.
The Company has a general code of conduct for employees that is available for all employees to access on the company intranet.
The Company has a Diversity Policy which is contained in Section 5 of the Corporate Governance Charter. The Diversity Policy does not include requirements for the Board to establish measurable objectives for achieving gender diversity or for the Board to assess annually both the objectives and progress in achieving them. The Diversity Policy states however that:
• the Group is committed to employing and retaining the best technical and non-technical staff based on their capacity to perform well for the Group;
• all employment decisions within the Group will be based upon choosing the best person for the position irrespective of race, religion, gender, age, or any other irrelevant point of difference; and
• all advancement and reward decisions within the Group will be based upon what is best for each individual person taking into account the needs of the Company, irrespective of race, religion, gender, age, or any other irrelevant point of difference.
The Diversity Policy further states that:
• The Board has resolved that:
i. it is satisfied that current employment, advancement and reward decisions regarding staff within the Group are made irrespective of race, religion, gender, age, etc., therefore no measurable objectives have been put in place at this time to specifically change or increase staff diversity, and;
ii. since gender is one of the twelve key attributes that the Board considers when appointing new Directors and with a small Board at present no measurable objectives are to be put in place at this time to specifically change or increase gender diversity on the Board.
The Board has also resolved that it will review the matter regularly, and:
i. if there is any noticeable decrease in diversity of staff at any level across the Company, or;
ii. the size of the Board increases to five or more members, then;
measurable diversity objectives will be put in place. During the reporting period there was one women on the board (25%) from December 2014 to May 2015. For the remainder of the financial year there were no women on the Board. The proportion of women employees in the Group is 38% and in senior executive positions is 27% including the Company’s Chief Operating Officer. In addition to gender diversity, the Group also employs staff from a number of ethnic backgrounds and different age groups.
As mentioned above, a copy of the Corporate Governance Charter is published on the Group’s website.
For
per
sona
l use
onl
y

Corporate Governance Statement Pacific Environment Limited Annual Report 201542
Principle 4
Safeguard integrity in financial reportingThe Board had an Audit and Risk Management Committee and a charter for that committee during the period. A copy of that charter is published on the Group’s website. The Audit and Risk Management Committee:
• consisted of two directors however contrary to Recommendation 4.1 there are no independent directors on the Committee; and
• was chaired by a non-independent chair who nevertheless is not chair of the Board;
To the extent that the composition of the Audit and Risk Management Committee did not comply with the Recommendations the Board believes this is justified due to the small size of the Company and the Board.
The Board appointed the auditor (Williams Partners Independent Audit Specialists) at the 2012 AGM. The firm became a corporate entity and now operates as WPIAS Pty Ltd (“WPIAS”). WPIAS’s policy is to rotate the audit engagement partner and quality control reviewer at least every five years for a period of at least two years. The auditor attends the Company’s AGM and is available to answer questions from security holders relevant to the audit.
Principle 5
Make timely and balanced disclosureRequirements relating to ASX continuous disclosure are contained in paragraph 2.16(a) of the Corporate Governance Charter. The Company’s directors have each entered into a contract with the Company pursuant to which they have undertaken to advise the Company of all dealings by them in the Company’s securities and of interests in contracts relating to the Company’s securities.
Principle 6
Respect the rights of security holdersThe Company has a policy regarding informing shareholders of all major activities affecting the Company. That policy is contained in Section 2.16 of the Corporate Governance Charter. Essentially Section 2.16 covers continuous disclosure, preparation and dissemination of the annual report to shareholders, and conduct of the Company’s annual general meeting.
Principle 7
Recognise and manage riskThe Board’s policy in relation to risk management is set out in Section 2.15 of the Corporate Governance Charter.
Specifically Section 2.15 provides that:
• the Audit and Risk Management Committee reports to the Board on material business risks and mitigation strategies. Contrary to Recommendation 7.1 the committee is comprised of only 2 directors. The Chair is not an independent director however they are not the Chairman of the Group;
• the Board reviews the Audit and Risk Management Committee’s reports;• the Company’s management is charged with implementing any risk mitigation strategies identified; and• the Group’s Chief Executive Officer and Chief Financial Officer are charged with ensuring the Group’s risk management and internal
compliance and control systems are operating efficiently and effectively in all material respects, and must report to the Board on any matters incidental to the preparation of the Group’s annual financial accounts.
The Group’s Chief Executive Officer (CEO) and Chief Financial Officer (CFO) have provided a declaration to the Board in accordance with section 295A Corporations Act.
Pacific Environment is a relatively small publicly listed company by comparison to other listed entities which is reflected by the size of its operations, board structure and composition. Given its size the Company considers that it does not have exposure to economic, environmental or social sustainability risks.
For
per
sona
l use
onl
y

Pacific Environment Limited Annual Report 2015 43Corporate Governance Statement
Principle 8
Remunerate fairly and responsiblyThe Board has a Remuneration and Nomination Committee and a copy of the Remuneration and Nomination Committee charter is published on the Company’s website. Due to the small size of the company the Remuneration Committee consists of only two board members which the board acknowledges is contrary to Recommendation 8.1. The Chair of the committee is not an independent director however they are not the Chairman of the Group.
The Committee’s responsibilities include making recommendations to the Board on appropriate remuneration, both the amount and its composition, for executive and non-executive directors, the Chairman, and the Chief Executive Officer, as well as reviewing the recommendations of the Chief Executive Officer in relation to appropriate remuneration for direct reports to the Chief Executive Officer.
The Group’s senior executives are remunerated by a combination of salary and performance-based incentive options.
The company’s directors have each been issued, or are to be issued, with incentive options, subject to shareholder approval as required. The Board recognises that the grant of options to directors is contrary to the guidelines in Recommendation 8.3 of the ASX Corporate Governance Council’s Principles and Recommendations. However:
• the issue of options as part of the remuneration packages of directors is an established practice of junior public listed companies, and provides those companies with a means of conserving cash whilst attracting and properly rewarding directors; and
• the exercise prices for the options issued to directors are designed to align any return to those directors with enhanced shareholder value in the form of an increased price of the Company’s shares.
Details of the Group’s remuneration policies are set out in the Remuneration Report contained in the Directors’ Report.
No schemes exist for retirement benefits for non-executive directors, other than statutory superannuation.
The Company has a policy on prohibiting entering into transactions in associated products which limit the economic risk of participating in unvested entitlements under any equity-based remuneration schemes. This is contained in section 4.14 of the Corporate Governance Charter.
For
per
sona
l use
onl
y
Auditor's Independence Declaration Pacific Environment Limited Annual Report 201544
PACIFIC ENVIRONMENT LIMITED ABN 42 122 919 948 AND CONTROLLED ENTITIES
AUDITOR’S INDEPENDENCE DECLARATION UNDER SECTION 307C OF THE CORPORATIONS ACT 2001
TO THE DIRECTORS OF PACIFIC ENVIRONMENT LIMITED I declare that, to the best of my knowledge and belief, during the year ended 30 June 2015, there have been:
(i) no contraventions of the auditor independence requirements as set out in the Corporations Act 2001 in relation to the audit; and
(ii) no contraventions of any applicable code of professional conduct in relation to the audit.
WPIAS Pty Ltd Authorised Audit Company No. 440306
LEE-ANN DIPPENAAR BCom CA RCA DIRECTOR Dated this 28th day of August 2015 4 Helensvale Road Helensvale Qld 4212
44
For
per
sona
l use
onl
y

Pacific Environment Limited Annual Report 2015 45Consolidated Statements
PACIFIC ENVIRONMENT LIMITED ABN 42 122 919 948 AND CONTROLLED ENTITIES
AUDITOR’S INDEPENDENCE DECLARATION UNDER SECTION 307C OF THE CORPORATIONS ACT 2001
TO THE DIRECTORS OF PACIFIC ENVIRONMENT LIMITED I declare that, to the best of my knowledge and belief, during the year ended 30 June 2015, there have been:
(i) no contraventions of the auditor independence requirements as set out in the Corporations Act 2001 in relation to the audit; and
(ii) no contraventions of any applicable code of professional conduct in relation to the audit.
WPIAS Pty Ltd Authorised Audit Company No. 440306
LEE-ANN DIPPENAAR BCom CA RCA DIRECTOR Dated this 28th day of August 2015 4 Helensvale Road Helensvale Qld 4212
Other comprehensive income Other comprehensive income for the year, net of tax
-
-
Total comprehensive income for the year 1,407 1,311
Net profit attributed to: Members of Pacific Environment Limited 23 1,407 1,311
Total comprehensive income attributable to: Members of Pacific Environment Limited 23 1,407 1,311
Continuing Operations Notes2015
$’0002014
$’000
Revenue 4 14,805 9,618
Other income 5 1,645 1,090
Interest Income 5 21
Changes in inventories of finished goods and work in progress 211 22
Client and project related costs (1,163) (683)
Employee benefits expense (8,633) (6,283)
Consultants expense 6 (692) (277)
Travel expense (447) (126)
Rental expense 6 (554) (451)
Directors’ expense (140) (115)
Laboratory expense (1,459) (381)
Depreciation and amortisation expense 6 (685) (462)
Finance costs 6 (311) (238)
Reversal of impairment - capitalised software 6 295 -
Other expenses (1,106) (458)
Profit before income tax 1,771 1,277
Income tax benefit / (expense) 7 51 -
Net profit for the year from continuing operations 1,822 1,277
Discontinued Operations
(Loss)/Profit from discontinued operations after tax 8 (415) 34
Net profit for the year 1,407 1,311
Consolidated Group
Consolidated Statement of Profit or Loss and Other Comprehensive Income
Earnings per share from continuing and discontinued operations attributable to the members of Pacific Environment Limited Cents Cents
Basic earnings per share from continuing and discontinued operations 34 1.3 1.3
Diluted earnings per share from continuing and discontinued operations 34 1.3 1.3
Basic earnings per share from continuing operations 34 1.7 1.3
Diluted earnings per share from continuing operations 34 1.7 1.3
Basic (loss)/earnings per share from discontinued operations 34 (0.4) -
FOR THE FINANCIAL YEAR ENDED 30 JUNE 2015
The accompanying notes form part of these financial statements.
For
per
sona
l use
onl
y

Consolidated Statements Pacific Environment Limited Annual Report 201546
Consolidated Statement of Financial Position
Notes2015
$’0002014
$’000
ASSETS
Current Assets
Cash and cash equivalents 9 1,695 1,283
Trade and other receivables 10 5,408 3,000
Other Assets 11 105 121
Inventories 12 307 229
Total current assets 7,515 4,633
Non-current Assets
Property, plant and equipment 13 2,611 1,473
Deferred tax asset 20 350 -
Intangible assets 14 11,798 9,141
Total non-current assets 14,759 10,614
Total Assets 22,274 15,247
LIABILITIES
Current Liabilities
Trade and other payables 15 3,251 1,429
Borrowings 16 1,140 650
Provisions 17 742 684
Total current liabilities 5,133 2,763
Non-current Liabilities
Trade and other payables 18 695 161
Borrowings 19 3,074 2,678
Deferred tax liability 20 92 -
Provisions 21 144 124
Total non-current liabilities 4,005 2,963
Total liabilities 9,138 5,726
Net assets 13,136 9,521
EQUITY
Issued capital 22(b) 19,820 17,772
Reserves 23(a) 503 343
Retained losses 23(b) (7,187) (8,594)
Total equity 13,136 9,521
AS AT 30 JUNE 2015
The accompanying notes form part of these financial statements.
Consolidated Group
For
per
sona
l use
onl
y

Pacific Environment Limited Annual Report 2015 47Consolidated Statements
Consolidated Statement of Changes in Equity
Consolidated Group
Ordinary shares
$’000
Reserves
$’000
Retained losses $’000
Total Equity
$’000
At 30 June 2013 17,732 303 (9,905) 8,130
Comprehensive income
Profit for the year - - 1,311 1,311
Other comprehensive income for the year - - - -
Total comprehensive income for the year - - 1,311 1,311
Transactions with owners, in their capacity as owners, and other transfers
Shares issued to directors and employees 40 - - 40
Employee share options – value of employee services - 40 - 40
Total transactions with owners and other transfers 40 40 - 80
At 30 June 2014 17,772 343 (8,594) 9,521
Comprehensive income
Profit for the year - - 1,407 1,407
Other comprehensive income for the year - - - -
Total comprehensive income for the year - - 1,407 1,407
Transactions with owners, in their capacity as owners, and other transfers
Shares issued on partial conversion of Convertible Loan 540 - - 540
Shares issued to employees on exercising of options 53 - - 53
Issue of shares (Institutional Placement) 1,208 - - 1,208
Issue of shares (Share Purchase Plan) 314 - - 314
Transaction costs of capital raising (67) - - (67)
Shares to be issued to employees - 98 - 98
Employee share options – value of employee services - 62 - 62
Total transactions with owners and other transfers 2,048 160 - 2,208
At 30 June 2015 19,820 503 (7,187) 13,136
FOR THE FINANCIAL YEAR ENDED 30 JUNE 2015
The accompanying notes form part of these financial statements.
For
per
sona
l use
onl
y

Consolidated Statements Pacific Environment Limited Annual Report 201548
Consolidated Statement of Cash Flows
Notes 2015 $’000
2014 $’000
Cash flows from operating activities
Receipts from customers 16,352 12,765
Payments to suppliers and employees (15,693) (12,732)
659 33
Other revenue 565 914
Interest received 5 21
Interest paid (300) (254)
Net cash provided by operating activities 33(a) 929 714
Cash flows from investing activities
Payments for property, plant and equipment (343) (194)
Payments for acquisition of business 30 (1,063) (201)
Payments for intangible assets (1,143) -
Proceeds from sale of business 8 470 -
Net cash used in investing activities (2,079) (395)
Cash flows from financing activities
Proceeds from borrowings 882 429
Repayment of borrowings (800) (242)
Proceeds from issue of shares 1,574 -
Share issue transaction costs (94) -
Net cash provided by financing activities 1,562 187
Net increase in cash and cash equivalents 412 506
Cash and cash equivalents at the beginning of the financial year 1,283 777
Cash and cash equivalents at the end of the financial year 9(a) 1,695 1,283
The accompanying notes form part of these financial statements.
FOR THE FINANCIAL YEAR ENDED 30 JUNE 2015 Consolidated Group
For
per
sona
l use
onl
y
Pacific Environment Limited Annual Report 2015 49Contents Page
Contents
50 (1.) Summary of significant accounting policies
62 (2.) Financial risk management
66 (3.) Segment information
66 (4.) Revenue
66 (5.) Other income
67 (6.) Expenses
68 (7.) Income tax expense
69 (8.) Discontinued operations
70 (9.) Current assets – Cash and cash equivalents
70 (10.) Current assets – Trade and other receivables
72 (11.) Current assets – Other assets
72 (12.) Current assets – Inventories
72 (13.) Non-current assets – Property, plant and equipment
73 (14.) Non-current assets – Intangible assets
76 (15.) Current liabilities – Trade and other payables
77 (16.) Current liabilities – Borrowings
77 (17.) Current liabilities – Provisions
78 (18.) Non-current liabilities – Trade and other payables
78 (19.) Non-current liabilities – Borrowings
80 (20.) Tax
81 (21.) Non-current liabilities – Provisions
82 (22.) Issued Capital
84 (23.) Reserves and retained losses
84 (24.) Dividends
85 (25.) Key management personnel compensation
85 (26.) Remuneration of auditors
86 (27.) Contingencies
86 (28.) Commitments
87 (29.) Related party transactions
89 (30.) Business combinations
91 (31.) Controlled entities
92 (32.) Events occurring after the reporting period
92 (33.) Cash flow statement reconciliation
93 (34.) Earnings / (losses) per share
94 (35.) Share based payments
99 (36.) Parent entity financial information
Notes to Financial StatementsF
or p
erso
nal u
se o
nly

Notes to Financial Statements FOR THE FINANCIAL YEAR ENDED 30 JUNE 2015
These consolidated financial statements and notes represent those of Pacific Environment Limited and controlled entities (the “Consolidated Group” or “Group”).
The separate financial statements of the parent entity, Pacific Environment Limited, have not been presented within this financial report as permitted by the Corporations Act 2001.
The financial statements were authorised for issue on 28 August 2015 by the directors of the company.
1. Summary of significant accounting policies
Basis of preparation
The consolidated financial statements are general purpose financial statements that have been prepared in accordance with Australian Accounting Standards and Interpretations of the Australian Accounting Standards Board and the Corporations Act 2001. The Group is a for-profit entity for financial reporting purposes under Australian Accounting Standards.
Australian Accounting Standards set out accounting policies that the Australian Accounting Standards Board has concluded would result in financial statements containing relevant and reliable information about transactions, events and conditions. Material accounting policies adopted in the preparation of these financial statements are presented below and have been consistently applied unless stated otherwise.
Except for cash flow information, the financial statements have been prepared on an accruals basis and are based on historical costs, modified, where applicable, by the measurement at fair value of selected non-current assets, financial assets and financial liabilities.
(a) Principles of consolidation
The consolidated financial statements incorporate all of the assets, liabilities and results of the parent (Pacific Environment Limited) and all of the subsidiaries. Subsidiaries are entities the parent controls. The parent controls an entity when it is exposed to, or has rights to, variable returns from its involvement with the entity and has the ability to affect those returns through its power over the entity.
A list of subsidiaries is contained in note 31 to the financial statements.
The assets, liabilities and results of all subsidiaries are fully consolidated into the financial statements of the Group from the date on which control is obtained by the Group. The consolidation of a subsidiary is discontinued from the date that control ceases.
Intercompany transactions, balances and unrealised gains or losses on transactions between entities in the Consolidated Group are eliminated in full on consolidation. Accounting policies of subsidiaries have been changed and adjustments made where necessary to ensure consistency with the policies adopted by the Group.
Investments in subsidiaries are accounted for at cost in the individual financial statements of Pacific Environment Limited.
Business Combinations
Business combinations occur where an acquirer obtains control over one or more businesses. The acquisition method of accounting is used to account for all business combinations, unless it is a combination involving entities or businesses under common control. The business combination will be accounted for from the date that control is attained, whereby the fair value of identifiable assets acquired and liabilities (including contingent liabilities) assumed is recognised (subject to certain limited exemptions).
When measuring the consideration transferred in the business combination, any asset or liability resulting from a contingent consideration arrangement is also included. Subsequent to initial recognition, contingent consideration classified as equity is not remeasured and its subsequent settlement is accounted for within equity. Contingent consideration classified as an asset or liability is remeasured in each reporting period to fair value, with changes in fair value recognised in profit or loss, unless the change in fair value can be identified as existing at acquisition date.
All transaction costs incurred in relation to business combinations, other than those associated with the issue of a financial instrument, are recognised as expenses in the profit and loss when incurred. The acquisition of a business may result in the recognition of goodwill or a gain from a bargain purchase.
Goodwill
Goodwill is carried at cost less any accumulated impairment losses. Goodwill is calculated as the excess of the sum of:
(i) the consideration transferred; (ii) any non-controlling interests; and (iii) the acquisition date fair value of any previously held equity interest; over the
acquisition date fair value of net identifiable assets acquired. Goodwill on acquisitions of subsidiaries is included in intangible assets. Goodwill is not amortised. Instead, goodwill is tested for impairment annually or more frequently if events or changes in circumstances indicate that it might be impaired, and is carried at cost less accumulated impairment losses.
Gains and losses on the disposal of an entity include the carrying amount of goodwill relating to the entity sold.
Goodwill is allocated to cash generating units for the purpose of impairment testing. The allocation is made to those cash-generating units or groups of cash-generating units that are expected to benefit from the business combination in which the goodwill arose.
Changes in the ownership interests in a subsidiary that do not result in a loss of control are accounted for as equity transactions and do not affect the carrying amount of goodwill.
(b) Segment reporting
Operating segments are reported in a manner consistent with the internal reporting provided to the chief operating decision maker. The chief operating decision maker, who is responsible for allocating resources and assessing performance of the operating segments, has been identified as the Chief Executive Officer and the board of directors. Refer Note 3 for segment information.
The Group aggregates two or more operating segments when they have similar economic characteristics, and the segments are similar in each of the following respects:
• nature of the products and services;
• nature of the production processes;
• type or class of customer for the products and services;
• methods used to distribute the products or provide the services; and if applicable
• nature of the regulatory environment.
Operating segments that meet the quantitative criteria as prescribed by AASB 8 are reported separately. However, an operating segment that does not meet the quantitative criteria is still reported separately where information about the segment would be useful to users of the financial statements.
Notes to Financial Statements Pacific Environment Limited Annual Report 201550
For
per
sona
l use
onl
y

When measuring the consideration transferred in the business combination, any asset or liability resulting from a contingent consideration arrangement is also included. Subsequent to initial recognition, contingent consideration classified as equity is not remeasured and its subsequent settlement is accounted for within equity. Contingent consideration classified as an asset or liability is remeasured in each reporting period to fair value, with changes in fair value recognised in profit or loss, unless the change in fair value can be identified as existing at acquisition date.
All transaction costs incurred in relation to business combinations, other than those associated with the issue of a financial instrument, are recognised as expenses in the profit and loss when incurred. The acquisition of a business may result in the recognition of goodwill or a gain from a bargain purchase.
Goodwill
Goodwill is carried at cost less any accumulated impairment losses. Goodwill is calculated as the excess of the sum of:
(i) the consideration transferred; (ii) any non-controlling interests; and (iii) the acquisition date fair value of any previously held equity interest; over the
acquisition date fair value of net identifiable assets acquired. Goodwill on acquisitions of subsidiaries is included in intangible assets. Goodwill is not amortised. Instead, goodwill is tested for impairment annually or more frequently if events or changes in circumstances indicate that it might be impaired, and is carried at cost less accumulated impairment losses.
Gains and losses on the disposal of an entity include the carrying amount of goodwill relating to the entity sold.
Goodwill is allocated to cash generating units for the purpose of impairment testing. The allocation is made to those cash-generating units or groups of cash-generating units that are expected to benefit from the business combination in which the goodwill arose.
Changes in the ownership interests in a subsidiary that do not result in a loss of control are accounted for as equity transactions and do not affect the carrying amount of goodwill.
(b) Segment reporting
Operating segments are reported in a manner consistent with the internal reporting provided to the chief operating decision maker. The chief operating decision maker, who is responsible for allocating resources and assessing performance of the operating segments, has been identified as the Chief Executive Officer and the board of directors. Refer Note 3 for segment information.
The Group aggregates two or more operating segments when they have similar economic characteristics, and the segments are similar in each of the following respects:
• nature of the products and services;
• nature of the production processes;
• type or class of customer for the products and services;
• methods used to distribute the products or provide the services; and if applicable
• nature of the regulatory environment.
Operating segments that meet the quantitative criteria as prescribed by AASB 8 are reported separately. However, an operating segment that does not meet the quantitative criteria is still reported separately where information about the segment would be useful to users of the financial statements.
Pacific Environment Limited Annual Report 2015 51Notes to Financial Statements
For
per
sona
l use
onl
y

(c) Revenue recognition
Revenue is measured at the fair value of the consideration received or receivable. Amounts disclosed as revenue are net of returns, trade allowances, rebates and amounts collected on behalf of third parties.
The Group recognises revenue when the amount of revenue can be reliably measured, it is probable that future economic benefits will flow to the entity and specific criteria have been met for each of the Group's activities as described below. The amount of revenue is not considered to be reliably measurable until all contingencies relating to the sale have been resolved. The Group bases its estimates on historical results, taking into consideration the type of customer, the type of transaction and the specifics of each arrangement.
Revenue is recognised for the major business activities as follows:
(i) Time and material activities
Revenue from time and material activities is recognised in the same period the hours worked and expenses charged are invoiced.
(ii) Milestone projects
Labour costs and other expenses associated with a milestone project are captured as work in progress until a milestone invoicing event occurs, at which time the revenue is recognised.
(iii) Prebilled activities
Where the service undertaken is required to be provided over multiple periods, the contract is prebilled and revenue is recognised on a monthly basis over the term of the service.
(iv) Interest income
Interest income is recognised on a time proportion basis using the effective interest method.
(d) Government grants
Grants from the government are recognised at their fair value where there is a reasonable assurance that the grant will be received and the Group will comply with all the attached conditions.
Government grants relating to costs are deferred and recognised as income over the period necessary to match them with the costs that they are intended to compensate.
Government grants relating to the purchase of property, plant and equipment and the development of IT and software capital costs are included in non-current liabilities as deferred income and are credited to income on a straight line basis over the expected lives of the related assets.
(e) Income tax
The income tax expense/(income) for the year comprises current income tax expense/(income) and deferred tax expense/(income).
Current income tax expense charged to the profit or loss is the tax payable on taxable income. Current tax liabilities/(assets) are measured at the amounts expected to be paid to/(recovered from) the relevant taxation authority.
Deferred income tax expense reflects movements in deferred tax asset and deferred tax liability balances during the year as well as unused tax losses.
Deferred income tax is provided in full, using the liability method, on temporary differences arising between the tax bases of assets and liabilities and their carrying amounts in the consolidated financial statements. However, the deferred income tax is not accounted for if it arises from initial recognition of an asset or liability in a transaction other than a business combination that at the time of the transaction affects neither accounting nor taxable profit nor loss. Deferred income tax is determined using tax rates (and laws) that have been enacted or substantially enacted by the reporting date and are expected to apply when the related deferred income tax asset is realised or the deferred income tax liability is settled.
Deferred tax assets are recognised for deductible temporary differences and unused tax losses only if it is probable that future taxable amounts will be available to utilise those temporary differences and losses.
Deferred tax assets and liabilities are offset when a legally enforceable right of set-off exists and when the deferred tax balances relate to the same taxation authority. Current tax assets and tax liabilities are offset where the entity has a legally enforceable right to offset and intends either to settle on a net basis, or to realise the asset and settle the liability simultaneously.
Pacific Environment Limited and its wholly-owned Australian controlled entities have implemented the tax consolidation legislation. As a consequence, these entities are taxed as a single entity and the deferred tax assets and liabilities of these entities are set off in the consolidated financial statements. In addition to its own current and deferred tax amounts, Pacific Environment Limited also recognises the current tax liabilities and the deferred tax amounts arising from unused tax losses and unused tax credits assumed from controlled entities in the tax Consolidated Group.
Current and deferred tax is recognised in profit or loss, except to the extent that it relates to items recognised in other comprehensive income or directly in equity. In this case, the tax is also recognised in other comprehensive income or directly in equity, respectively.
(f) Leases
Leases of property, plant and equipment where the Group, as lessee, has substantially all the risks and rewards of ownership, are classified as finance leases (note 28). Finance leases are capitalised at the lease's inception at the fair value of the leased property or, if lower, the present value of the minimum lease payments. The corresponding rental obligations, net of finance charges, are included in other short term and long term payables. Each lease payment is allocated between the liability and finance cost. The finance cost is expensed over the lease period so as to produce a constant periodic rate of interest on the remaining balance of the liability for each period. The property, plant and equipment acquired under finance leases is depreciated over the asset's useful life or over the shorter of the asset's useful life and the lease term if there is no reasonable certainty that the Group will obtain ownership at the end of the lease term.
Leases in which a significant portion of the risks and rewards of ownership are not transferred to the Group as lessee are classified as operating leases (note 28). Payments made under operating leases (net of any incentives received from the lessor) are expensed on a straight line basis over the period of the lease.
(g) Impairment of assets
At the end of each reporting period, the Group assess whether there is any indication that an asset may be impaired. The assessment will include the consideration of external and internal sources. If such an indication exists, an impairment test is carried out on the asset by comparing the assets carrying value to its recoverable amount being the higher of an asset's fair value less costs to sell and value in use. For the purposes of assessing impairment, assets are grouped at the lowest levels for which there are separately identifiable cash inflows which are largely independent of the cash inflows from other assets or groups of assets (cash generating units).
Goodwill and intangible assets that have an indefinite useful life are not subject to amortisation and are tested annually for impairment, or more frequently if events or changes in circumstances indicate that they might be impaired.
(h) Cash and cash equivalents
Cash and cash equivalents includes cash on hand, deposits held at call with financial institutions, other short term, highly liquid investments with original maturities of three months or less that are readily convertible to known amounts of cash and which are subject to an insignificant risk of changes in value.
Notes to Financial Statements Pacific Environment Limited Annual Report 201552
For
per
sona
l use
onl
y

Deferred tax assets are recognised for deductible temporary differences and unused tax losses only if it is probable that future taxable amounts will be available to utilise those temporary differences and losses.
Deferred tax assets and liabilities are offset when a legally enforceable right of set-off exists and when the deferred tax balances relate to the same taxation authority. Current tax assets and tax liabilities are offset where the entity has a legally enforceable right to offset and intends either to settle on a net basis, or to realise the asset and settle the liability simultaneously.
Pacific Environment Limited and its wholly-owned Australian controlled entities have implemented the tax consolidation legislation. As a consequence, these entities are taxed as a single entity and the deferred tax assets and liabilities of these entities are set off in the consolidated financial statements. In addition to its own current and deferred tax amounts, Pacific Environment Limited also recognises the current tax liabilities and the deferred tax amounts arising from unused tax losses and unused tax credits assumed from controlled entities in the tax Consolidated Group.
Current and deferred tax is recognised in profit or loss, except to the extent that it relates to items recognised in other comprehensive income or directly in equity. In this case, the tax is also recognised in other comprehensive income or directly in equity, respectively.
(f) Leases
Leases of property, plant and equipment where the Group, as lessee, has substantially all the risks and rewards of ownership, are classified as finance leases (note 28). Finance leases are capitalised at the lease's inception at the fair value of the leased property or, if lower, the present value of the minimum lease payments. The corresponding rental obligations, net of finance charges, are included in other short term and long term payables. Each lease payment is allocated between the liability and finance cost. The finance cost is expensed over the lease period so as to produce a constant periodic rate of interest on the remaining balance of the liability for each period. The property, plant and equipment acquired under finance leases is depreciated over the asset's useful life or over the shorter of the asset's useful life and the lease term if there is no reasonable certainty that the Group will obtain ownership at the end of the lease term.
Leases in which a significant portion of the risks and rewards of ownership are not transferred to the Group as lessee are classified as operating leases (note 28). Payments made under operating leases (net of any incentives received from the lessor) are expensed on a straight line basis over the period of the lease.
(g) Impairment of assets
At the end of each reporting period, the Group assess whether there is any indication that an asset may be impaired. The assessment will include the consideration of external and internal sources. If such an indication exists, an impairment test is carried out on the asset by comparing the assets carrying value to its recoverable amount being the higher of an asset's fair value less costs to sell and value in use. For the purposes of assessing impairment, assets are grouped at the lowest levels for which there are separately identifiable cash inflows which are largely independent of the cash inflows from other assets or groups of assets (cash generating units).
Goodwill and intangible assets that have an indefinite useful life are not subject to amortisation and are tested annually for impairment, or more frequently if events or changes in circumstances indicate that they might be impaired.
(h) Cash and cash equivalents
Cash and cash equivalents includes cash on hand, deposits held at call with financial institutions, other short term, highly liquid investments with original maturities of three months or less that are readily convertible to known amounts of cash and which are subject to an insignificant risk of changes in value.
Pacific Environment Limited Annual Report 2015 53Notes to Financial Statements
For
per
sona
l use
onl
y

(i) Trade receivables
Trade receivables are recognised initially at fair value and subsequently measured at amortised cost using the effective interest method, less provision for impairment. Trade receivables are generally due for settlement within 30 days. They are presented as current assets unless collection is not expected for more than 12 months after the reporting date.
(j) Inventories
Inventories are measured at the lower of cost and net realisable value.
(i) Work in progress
Work in progress represents the sales value of unbilled labour and disbursements less provision for amounts considered non-recoverable, plus any amounts withheld due to milestone projects or prebillings.
(k) Investments and other financial assets
(i) Loans and receivables
Loans and receivables are non-derivative financial assets with fixed or determinable payments that are not quoted in an active market. They are included in current assets, except for those with maturities greater than 12 months after the reporting date which are classified as non-current assets. Loans and receivables are included in trade and other receivables (note 10) in the consolidated statement of financial position.
(ii) Recognition and de-recognition
Investments are initially recognised at fair value plus transaction costs for all financial assets not carried at fair value through profit or loss. Financial assets carried at fair value through profit or loss are initially recognised at fair value, and transaction costs are expensed in the statement of comprehensive income. Financial assets are derecognised when the rights to receive cash flows from the financial assets have expired or have been transferred and the Group has transferred substantially all the risks and rewards of ownership.
(iii) Subsequent measurement
Loans and receivables are carried at amortised cost using the effective interest method.
(iv) Impairment
The Group assesses at each reporting date whether there is objective evidence that a financial asset or group of financial assets is impaired.
(l) Plant and equipment
Plant and equipment is measured on the cost basis and therefore carried at cost less accumulated depreciation and any accumulated impairment. Cost includes expenditure that is directly attributable to the acquisition of the items. In the event the carrying amount of plant and equipment is greater than the estimated recoverable amount, the carrying amount is written down immediately to the estimated recoverable amount and impairment losses are recognised in profit or loss. A formal assessment of recoverable amount is made when impairment indicators are present (refer Note 1(g) for details of impairment).
Subsequent costs are included in the asset's carrying amount or recognised as a separate asset, as appropriate, only when it is probable that future economic benefits associated with the item will flow to the Group and the cost of the item can be measured reliably. The carrying amount of any component accounted for as a separate asset is derecognised when replaced. All other repairs and maintenance are recognised in the profit or loss during the financial period in which they are incurred.
The carrying amount of plant and equipment is reviewed annually by directors to ensure it is not in excess of the recoverable amount from these assets. The recoverable amount is assessed on the basis of the expected net cash flows that will be received from the asset’s employment and subsequent disposal. The expected net cash flows have been discounted to their present values in determining recoverable amounts.
Depreciation
Depreciation is calculated using the straight line method to allocate their cost or re-valued amounts, net of their residual values, over their estimated useful lives or, in the case of leasehold improvements and certain leased plant and equipment, the shorter lease term as follows:
• vehicles 3 - 8 years
• furniture, fittings and equipment 2 - 20 years
• leased plant and equipment 3 - 11 years
The assets' residual values and useful lives are reviewed, and adjusted if appropriate, at the end of each reporting period.
An asset's carrying amount is written down immediately to its recoverable amount if the asset's carrying amount is greater than its estimated recoverable amount.
(m) Intangible assets other than Goodwill
(i) Trademarks and licences
Trademarks and licences have a finite useful life and are carried at cost less accumulated amortisation and impairment losses. Amortisation is calculated using the straight-line method to allocate the cost of trademarks and licences over their estimated useful lives, which vary from 3 to 20 years.
(ii) IT development and software
Costs incurred in developing products or systems and costs incurred in acquiring software and licenses that will contribute to future period financial benefits through revenue generation and/or cost reduction are capitalised to software and systems.
Costs capitalised include external direct costs of materials and service and direct payroll and payroll related costs of employees' time spent on the project. Amortisation is calculated on a straight line basis over 10 years.
(iii) Research and development
Research expenditure is recognised as an expense as incurred. Costs incurred on development projects (relating to the design and testing of new or improved products) are recognised as intangible assets when it is probable that the project will, after considering its commercial and technical feasibility, be completed and generate future economic benefits and its costs can be measured reliably. The expenditure capitalised comprises all directly attributable costs, including costs of materials, services, direct labour and an appropriate proportion of overheads. Other development expenditures that do not meet these criteria are recognised as an expense as incurred. Development costs previously recognised as an expense are not recognised as an asset in a subsequent period. Capitalised development costs are recorded as intangible assets and amortised from the point at which the asset is ready for use on a straight line basis over its useful life, which is currently 10 years.
(n) Trade and other payables
These amounts represent liabilities for goods and services provided to the Group prior to the end of financial year which are unpaid. The amounts are unsecured and are usually paid within 30 days of recognition. Trade and other payables are presented as current liabilities unless payment is not due within 12 months from the reporting date. They are recognised initially at their fair value and subsequently measured at amortised cost using the effective interest method.
Notes to Financial Statements Pacific Environment Limited Annual Report 201554
For
per
sona
l use
onl
y

The carrying amount of plant and equipment is reviewed annually by directors to ensure it is not in excess of the recoverable amount from these assets. The recoverable amount is assessed on the basis of the expected net cash flows that will be received from the asset’s employment and subsequent disposal. The expected net cash flows have been discounted to their present values in determining recoverable amounts.
Depreciation
Depreciation is calculated using the straight line method to allocate their cost or re-valued amounts, net of their residual values, over their estimated useful lives or, in the case of leasehold improvements and certain leased plant and equipment, the shorter lease term as follows:
• vehicles 3 - 8 years
• furniture, fittings and equipment 2 - 20 years
• leased plant and equipment 3 - 11 years
The assets' residual values and useful lives are reviewed, and adjusted if appropriate, at the end of each reporting period.
An asset's carrying amount is written down immediately to its recoverable amount if the asset's carrying amount is greater than its estimated recoverable amount.
(m) Intangible assets other than Goodwill
(i) Trademarks and licences
Trademarks and licences have a finite useful life and are carried at cost less accumulated amortisation and impairment losses. Amortisation is calculated using the straight-line method to allocate the cost of trademarks and licences over their estimated useful lives, which vary from 3 to 20 years.
(ii) IT development and software
Costs incurred in developing products or systems and costs incurred in acquiring software and licenses that will contribute to future period financial benefits through revenue generation and/or cost reduction are capitalised to software and systems.
Costs capitalised include external direct costs of materials and service and direct payroll and payroll related costs of employees' time spent on the project. Amortisation is calculated on a straight line basis over 10 years.
(iii) Research and development
Research expenditure is recognised as an expense as incurred. Costs incurred on development projects (relating to the design and testing of new or improved products) are recognised as intangible assets when it is probable that the project will, after considering its commercial and technical feasibility, be completed and generate future economic benefits and its costs can be measured reliably. The expenditure capitalised comprises all directly attributable costs, including costs of materials, services, direct labour and an appropriate proportion of overheads. Other development expenditures that do not meet these criteria are recognised as an expense as incurred. Development costs previously recognised as an expense are not recognised as an asset in a subsequent period. Capitalised development costs are recorded as intangible assets and amortised from the point at which the asset is ready for use on a straight line basis over its useful life, which is currently 10 years.
(n) Trade and other payables
These amounts represent liabilities for goods and services provided to the Group prior to the end of financial year which are unpaid. The amounts are unsecured and are usually paid within 30 days of recognition. Trade and other payables are presented as current liabilities unless payment is not due within 12 months from the reporting date. They are recognised initially at their fair value and subsequently measured at amortised cost using the effective interest method.
Pacific Environment Limited Annual Report 2015 55Notes to Financial Statements
For
per
sona
l use
onl
y

(o) Borrowings
Borrowings are initially recognised at fair value, net of transaction costs incurred. Borrowings are subsequently measured at amortised cost. Any difference between the proceeds (net of transaction costs) and the redemption amount is recognised in the statement of comprehensive income over the period of the borrowings using the effective interest method. Fees paid on the establishment of loan facilities are recognised as transaction costs of the loan to the extent that it is probable that some or all of the facility will be drawn down. In this case, the fee is deferred until the draw down occurs. To the extent there is no evidence that it is probable that some or all of the facility will be drawn down, the fee is capitalised as a prepayment for liquidity services and amortised over the period of the facility to which it relates.
The fair value of the liability portion of a convertible bond is determined using a market interest rate for an equivalent non-convertible bond. This amount is recorded as a liability on an amortised cost basis until extinguished on conversion or maturity of the bonds. The remainder of the proceeds is allocated to the conversion option. This is recognised and included in shareholders' equity, net of income tax effects.
Borrowings are removed from the statement of financial position when the obligation specified in the contract is discharged, cancelled or expired. The difference between the carrying amount of a financial liability that has been extinguished or transferred to another party and the consideration paid, including any non-cash assets transferred or liabilities assumed, is recognised in other income or finance costs.
Borrowings are classified as current liabilities unless the Group has an unconditional right to defer settlement of the liability for at least 12 months after the reporting date.
(p) Borrowing costs
Borrowing costs incurred for the construction of any qualifying asset are capitalised during the period of time that is required to complete and prepare the asset for its intended use or sale. Other borrowing costs are expensed.
(q) Provisions
Provisions for legal claims and make good obligations are recognised when the Group has a present legal or constructive obligation as a result of past events, it is probable that an outflow of resources will be required to settle the obligation and the amount has been reliably estimated. Provisions are not recognised for future operating losses.
Where there are a number of similar obligations, the likelihood that an outflow will be required in settlement is determined by considering the class of obligations as a whole. A provision is recognised even if the likelihood of an outflow with respect to any one item included in the same class of obligations may be small.
Provisions are measured at the present value of management's best estimate of the expenditure required to settle the present obligation at the reporting date. The discount rate used to determine the present value reflects current market assessments of the time value of money and the risks specific to the liability. The increase in the provision due to the passage of time is recognised as interest expense.
(r) Employee benefits
(i) Short-term obligations
Liabilities for wages and salaries, including non-monetary benefits and annual leave expected to be settled within 12 months after the end of the period in which the employees render the related service are recognised in respect of employees' services up to the end of the reporting period and are measured at the amounts expected to be paid when the liabilities are settled. The liability for annual leave is recognised in the provision for employee benefits. All other short-term employee benefit obligations are presented as payables.
(ii) Other long-term employee benefit obligations
The liability for long service leave and annual leave which is not expected to be settled within 12 months after the end of the period in which the employees render the related service is recognised in the provision for employee benefits and measured as the present value of expected future payments to be made in respect of services provided by employees up to the end of the reporting period. Consideration is given to expected future wage and salary levels, experience of employee departures and periods of service. Expected future payments are discounted using market yields at the end of the reporting period on national government bonds with terms to maturity and currency that match, as closely as possible, the estimated future cash outflows.
(iii) Share based payments
Share based compensation benefits are provided to employees and directors via the Pacific Environment Limited Employee Share Option Plan and the Pacific Environment Limited Employee Share Plan. Information relating to these schemes is set out in note 35.
The fair value of options granted under the Pacific Environment Limited Employee Share Option Plan is recognised as an employee benefit expense with a corresponding increase in equity. The total amount to be expensed is determined by reference to the fair value of the options granted, which includes any market performance conditions but excludes the impact of any service and non-market performance vesting conditions and the impact of any non-vesting conditions.
Non-market vesting conditions are included in assumptions about the number of options that are expected to vest. The total expense is recognised over the vesting period, which is the period over which all of the specified vesting conditions are to be satisfied. At the end of each period, the entity revises its estimates of the number of options that are expected to vest based on the non-marketing vesting conditions. It recognises the impact of the revision to original estimates, if any, in profit or loss, with a corresponding adjustment to equity.
Under the Pacific Environment Limited Employee Share Plan, shares issued to employees for no cash consideration vest immediately on grant date. On this date, the market value of the shares issued is recognised as an employee benefits expense with a corresponding increase in equity.
(iv) Termination benefits
Termination benefits are payable when employment is terminated before the normal retirement date, or when an employee accepts voluntary redundancy in exchange for these benefits. The Group recognises termination benefits when it is demonstrably committed to either terminating the employment of current employees according to a detailed formal plan without possibility of withdrawal or providing termination benefits as a result of an offer made to encourage voluntary redundancy. Benefits falling due more than 12 months after reporting date are discounted to present value.
(s) Contributed equity
Ordinary shares are classified as equity.
Incremental costs directly attributable to the issue of new shares or options are shown in equity as a deduction, net of tax, from the proceeds. Incremental costs directly attributable to the issue of new shares or options for the acquisition of a business are not included in the cost of the acquisition as part of the purchase consideration.
If the entity reacquires its own equity instruments, for example as the result of a share buyback, those instruments are deducted from equity and the associated shares are cancelled. No gain or loss is recognised in the profit or loss and the consideration paid including any directly attributable incremental costs (net of income taxes) is recognised directly in equity.
Notes to Financial Statements Pacific Environment Limited Annual Report 201556
For
per
sona
l use
onl
y

(ii) Other long-term employee benefit obligations
The liability for long service leave and annual leave which is not expected to be settled within 12 months after the end of the period in which the employees render the related service is recognised in the provision for employee benefits and measured as the present value of expected future payments to be made in respect of services provided by employees up to the end of the reporting period. Consideration is given to expected future wage and salary levels, experience of employee departures and periods of service. Expected future payments are discounted using market yields at the end of the reporting period on national government bonds with terms to maturity and currency that match, as closely as possible, the estimated future cash outflows.
(iii) Share based payments
Share based compensation benefits are provided to employees and directors via the Pacific Environment Limited Employee Share Option Plan and the Pacific Environment Limited Employee Share Plan. Information relating to these schemes is set out in note 35.
The fair value of options granted under the Pacific Environment Limited Employee Share Option Plan is recognised as an employee benefit expense with a corresponding increase in equity. The total amount to be expensed is determined by reference to the fair value of the options granted, which includes any market performance conditions but excludes the impact of any service and non-market performance vesting conditions and the impact of any non-vesting conditions.
Non-market vesting conditions are included in assumptions about the number of options that are expected to vest. The total expense is recognised over the vesting period, which is the period over which all of the specified vesting conditions are to be satisfied. At the end of each period, the entity revises its estimates of the number of options that are expected to vest based on the non-marketing vesting conditions. It recognises the impact of the revision to original estimates, if any, in profit or loss, with a corresponding adjustment to equity.
Under the Pacific Environment Limited Employee Share Plan, shares issued to employees for no cash consideration vest immediately on grant date. On this date, the market value of the shares issued is recognised as an employee benefits expense with a corresponding increase in equity.
(iv) Termination benefits
Termination benefits are payable when employment is terminated before the normal retirement date, or when an employee accepts voluntary redundancy in exchange for these benefits. The Group recognises termination benefits when it is demonstrably committed to either terminating the employment of current employees according to a detailed formal plan without possibility of withdrawal or providing termination benefits as a result of an offer made to encourage voluntary redundancy. Benefits falling due more than 12 months after reporting date are discounted to present value.
(s) Contributed equity
Ordinary shares are classified as equity.
Incremental costs directly attributable to the issue of new shares or options are shown in equity as a deduction, net of tax, from the proceeds. Incremental costs directly attributable to the issue of new shares or options for the acquisition of a business are not included in the cost of the acquisition as part of the purchase consideration.
If the entity reacquires its own equity instruments, for example as the result of a share buyback, those instruments are deducted from equity and the associated shares are cancelled. No gain or loss is recognised in the profit or loss and the consideration paid including any directly attributable incremental costs (net of income taxes) is recognised directly in equity.
Pacific Environment Limited Annual Report 2015 57Notes to Financial Statements
For
per
sona
l use
onl
y

(t) Dividends
Provision is made for the amount of any dividend declared, being appropriately authorised and no longer at the discretion of the entity, on or before the end of the financial year but not distributed at balance date.
(u) Earnings per share
(i) Basic earnings per share
Basic earnings per share is calculated by dividing:
• the profit attributable to equity holders of the Company, excluding any costs of servicing equity other than ordinary shares
• by the weighted average number of ordinary shares outstanding during the financial year, adjusted for bonus elements in ordinary shares issued during the year.
(ii) Diluted earnings per share
Diluted earnings per share adjusts the figures used in the determination of basic earnings per share to take into account:
• the after income tax effect of interest and other financing costs associated with dilutive potential ordinary shares, and
• the weighted average number of additional ordinary shares that would have been outstanding assuming the conversion of all dilutive potential ordinary shares.
(v) Goods and Services Tax (GST)
Revenues, expenses and assets are recognised net of the amount of associated GST, unless the GST incurred is not recoverable from the taxation authority. In this case it is recognised as part of the cost of acquisition of the asset or as part of the expense.
Receivables and payables are stated inclusive of the amount of GST receivable or payable. The net amount of GST recoverable from, or payable to, the taxation authority is included with other receivables or payables in the statement of financial position.
Cash flows are presented on a gross basis. The GST components of cash flows arising from investing or financing activities which are recoverable from, or payable to the taxation authority, are presented as operating cash flows included in receipts from customers or payments to suppliers.
(w) Rounding of amounts
The Company is of a kind referred to in Class Order 98/100, issued by the Australian Securities and Investments Commission, relating to the ''rounding off'' of amounts in the financial report. Amounts in the financial report have been rounded off in accordance with that Class Order to the nearest thousand dollars, or in certain cases, the nearest dollar.
(x) Critical accounting estimates and judgements
The directors evaluate estimates and judgements incorporated into the financial statements based on historical knowledge and best available current information. Estimates assume a reasonable expectation of future events and are based on current trends and economic data, obtained both externally and within the Group.
Key estimates
(i) Impairment of goodwill and other intangible assets
The Group tests annually whether goodwill has suffered any impairment in accordance with the accounting policy stated in note 1(g). The recoverable amounts of subsidiaries have been determined based on value in use calculations. These calculations require the use of assumptions. Refer to note 14 for details of these assumptions and the potential impact of changes to the assumptions.
(ii) Income taxes
The Group’s accounting policy for taxation requires management’s judgement as to the types of arrangements considered to be a tax on income in contrast to an operating cost. Judgement is also required in assessing whether deferred tax assets and certain deferred tax liabilities are recognised on the statement of financial position. Deferred tax assets, including those arising from un-recouped tax losses, capital losses and temporary differences are recognised only where it is considered more likely than not that they will be recovered, which is dependent on the generation of sufficient future taxable profits.
Assumptions about the generation of future taxable profits depend on management’s estimates of future cash flows. These depend on estimates of future sales volumes, operating costs, capital expenditure, dividends and other capital management transactions. Judgements are also required about the application of income tax legislation. These judgements and assumptions are subject to risk and uncertainty, hence there is a possibility that changes in circumstances will alter expectations, which may impact the amount of deferred tax assets and deferred tax liabilities recognised on the statement of financial position and the amount of other tax losses and temporary differences not yet recognised. In such circumstances, some or all of the carrying amounts of recognised deferred tax assets and liabilities may require adjustment, resulting in a corresponding credit or charge to the statement of comprehensive income.
(iii) Fair value of share options
In calculating the fair value of the director and employee share options, the Company has made a number of assumptions in determining the inputs for the Black-Scholes option pricing module. Refer to note 35 for details of these assumptions.
(iv) Fair value of convertible instruments
In calculating the fair value of the convertible instruments, the Company has made a number of assumptions in determining the inputs for the fair value discount model. The discount rates applied was 11%, which was assessed as being an appropriate representation of the rate at which funds would have been borrowed at had the Company been required to borrow the funds in the market, as well as the various risks and rewards associated with the convertible instruments.
After determining the fair value of the convertible instruments issued, the excess of the principal was treated as an additional equity instrument, representing the fair value of the option to convert associated with the convertible instruments. In accordance with AASB 139, the fair value of the option to convert is required to be unwound over the period on which the instruments are on offer. During the year, $169,000 (2014: $198,000) was recognised as an interest expense in the consolidated statement of comprehensive income of the Group.
(v) Recovery of deferred tax assets
Deferred tax assets are recognised for deductible temporary differences if management considers that it is probable that future taxable profits will be available to utilise those temporary differences. Sufficient management judgement is required to determine the amount of deferred tax assets that can be recognised, based upon the likely timing and the level of future taxable profits over the next two years together with future tax planning strategies.
Notes to Financial Statements Pacific Environment Limited Annual Report 201558
For
per
sona
l use
onl
y

Key estimates
(i) Impairment of goodwill and other intangible assets
The Group tests annually whether goodwill has suffered any impairment in accordance with the accounting policy stated in note 1(g). The recoverable amounts of subsidiaries have been determined based on value in use calculations. These calculations require the use of assumptions. Refer to note 14 for details of these assumptions and the potential impact of changes to the assumptions.
(ii) Income taxes
The Group’s accounting policy for taxation requires management’s judgement as to the types of arrangements considered to be a tax on income in contrast to an operating cost. Judgement is also required in assessing whether deferred tax assets and certain deferred tax liabilities are recognised on the statement of financial position. Deferred tax assets, including those arising from un-recouped tax losses, capital losses and temporary differences are recognised only where it is considered more likely than not that they will be recovered, which is dependent on the generation of sufficient future taxable profits.
Assumptions about the generation of future taxable profits depend on management’s estimates of future cash flows. These depend on estimates of future sales volumes, operating costs, capital expenditure, dividends and other capital management transactions. Judgements are also required about the application of income tax legislation. These judgements and assumptions are subject to risk and uncertainty, hence there is a possibility that changes in circumstances will alter expectations, which may impact the amount of deferred tax assets and deferred tax liabilities recognised on the statement of financial position and the amount of other tax losses and temporary differences not yet recognised. In such circumstances, some or all of the carrying amounts of recognised deferred tax assets and liabilities may require adjustment, resulting in a corresponding credit or charge to the statement of comprehensive income.
(iii) Fair value of share options
In calculating the fair value of the director and employee share options, the Company has made a number of assumptions in determining the inputs for the Black-Scholes option pricing module. Refer to note 35 for details of these assumptions.
(iv) Fair value of convertible instruments
In calculating the fair value of the convertible instruments, the Company has made a number of assumptions in determining the inputs for the fair value discount model. The discount rates applied was 11%, which was assessed as being an appropriate representation of the rate at which funds would have been borrowed at had the Company been required to borrow the funds in the market, as well as the various risks and rewards associated with the convertible instruments.
After determining the fair value of the convertible instruments issued, the excess of the principal was treated as an additional equity instrument, representing the fair value of the option to convert associated with the convertible instruments. In accordance with AASB 139, the fair value of the option to convert is required to be unwound over the period on which the instruments are on offer. During the year, $169,000 (2014: $198,000) was recognised as an interest expense in the consolidated statement of comprehensive income of the Group.
(v) Recovery of deferred tax assets
Deferred tax assets are recognised for deductible temporary differences if management considers that it is probable that future taxable profits will be available to utilise those temporary differences. Sufficient management judgement is required to determine the amount of deferred tax assets that can be recognised, based upon the likely timing and the level of future taxable profits over the next two years together with future tax planning strategies.
Pacific Environment Limited Annual Report 2015 59Notes to Financial Statements
For
per
sona
l use
onl
y

Key Judgements
Provision for impairment of receivables
No provision for impairment of receivables was considered necessary as at the end of the 2015 reporting period (2014:$20,000).
(y) New accounting standards for application in future periods
Accounting Standards and Interpretations issued by the AASB that are not yet mandatorily applicable to the Group, together with an assessment of the potential impact of such pronouncements on the Group when adopted in future periods, are discussed below:
• AASB 9: Financial Instruments and associated Amending Standards (applicable to annual reporting periods beginning on or after 1 January 2018).
The Standard will be applicable retrospectively (subject to the provisions on hedge accounting outlined below) and includes revised requirements for the classification and measurement of financial instruments, revised recognition and derecognition requirements for financial instruments and simplified requirements for hedge accounting.
The key changes that may affect the Group on initial application include certain simplifications to the classification of financial assets, simplifications to the accounting of embedded derivatives, upfront accounting for expected credit loss, and the irrevocable election to recognise gains and losses on investments in equity instruments that are not held for trading in other comprehensive income. AASB 9 also introduces a new model for hedge accounting that will allow greater flexibility in the ability to hedge risk, particularly with respect to hedges of non-financial items. Should the entity elect to change its hedge policies in line with the new hedge accounting requirements of the Standard, the application of such accounting would be largely prospective.
Although the directors anticipate that the adoption of AASB 9 may have an impact on the Group’s financial instruments it is impracticable at this stage to provide a reasonable estimate of such impact.
• AASB 15: Revenue from Contracts with Customers (applicable to annual reporting periods commencing on or after 1 January 2017).
When effective, this Standard will replace the current accounting requirements applicable to revenue with a single, principles-based model. Except for a limited number of exceptions, including leases, the new revenue model in AASB 15 will apply to all contracts with customers as well as non-monetary exchanges between entities in the same line of business to facilitate sales to customers and potential customers.
The core principle of the Standard is that an entity will recognise revenue to depict the transfer of promised goods or services to customers in an amount that reflects the consideration to which the entity expects to be entitled in exchange for the goods or services. To achieve this objective, AASB 15 provides the following five-step process:
• identify the contract(s) with a customer;
• identify the performance obligations in the contract(s);
• determine the transaction price;
• allocate the transaction price to the performance obligations in the contract(s); and
• recognise revenue when (or as) the performance obligations are satisfied.
This Standard will require retrospective restatement, as well as enhanced disclosures regarding revenue.
Although the directors anticipate that the adoption of AASB 15 may have an impact on the Group’s financial statements, it is impracticable at this stage to provide a reasonable estimate of such impact.
(z) Parent entity financial information
The financial information for the parent entity, Pacific Environment Limited, disclosed in note 36 has been prepared on the same basis as the consolidated financial statements, except as set out below.
(i) Investments in subsidiaries, associates and joint venture entities
Investments in subsidiaries are accounted for at cost in the financial statements of Pacific Environment Limited.
(ii) Tax consolidation legislation
Pacific Environment Limited and its wholly-owned Australian controlled entities have implemented the tax consolidation legislation.
The head entity, Pacific Environment Limited, and the controlled entities in the tax consolidated group account for their own current and deferred tax amounts. These tax amounts are measured as if each entity in the tax consolidated group continues to be a standalone taxpayer in its own right.
In addition to its own current and deferred tax amounts, Pacific Environment Limited also recognises the current tax liabilities (or assets) and the deferred tax assets arising from unused tax losses and unused tax credits assumed from controlled entities in the tax consolidated group.
The wholly-owned entities fully compensate Pacific Environment Limited for any current tax payable assumed and are compensated by Pacific Environment Limited for any current tax receivable and deferred tax assets (where recognised) relating to unused tax losses or unused tax credits that are transferred to Pacific Environment Limited under the tax consolidation legislation. The funding amounts are determined by reference to the amounts recognised in the wholly-owned entities' financial statements.
The amounts receivable/payable are due upon receipt of the funding advice from the head entity, which is issued as soon as practicable after the end of each financial year. The head entity may also require payment of interim funding amounts to assist with its obligations to pay tax instalments.
Assets or liabilities arising under tax funding agreements with the tax consolidated entities are recognised as current amounts receivable from or payable to other entities in the group. Any difference between the amounts assumed and amounts receivable or payable under the tax funding agreement are recognised as a contribution to (or distribution from) wholly-owned tax consolidated entities.
Notes to Financial Statements Pacific Environment Limited Annual Report 201560
For
per
sona
l use
onl
y

Although the directors anticipate that the adoption of AASB 15 may have an impact on the Group’s financial statements, it is impracticable at this stage to provide a reasonable estimate of such impact.
(z) Parent entity financial information
The financial information for the parent entity, Pacific Environment Limited, disclosed in note 36 has been prepared on the same basis as the consolidated financial statements, except as set out below.
(i) Investments in subsidiaries, associates and joint venture entities
Investments in subsidiaries are accounted for at cost in the financial statements of Pacific Environment Limited.
(ii) Tax consolidation legislation
Pacific Environment Limited and its wholly-owned Australian controlled entities have implemented the tax consolidation legislation.
The head entity, Pacific Environment Limited, and the controlled entities in the tax consolidated group account for their own current and deferred tax amounts. These tax amounts are measured as if each entity in the tax consolidated group continues to be a standalone taxpayer in its own right.
In addition to its own current and deferred tax amounts, Pacific Environment Limited also recognises the current tax liabilities (or assets) and the deferred tax assets arising from unused tax losses and unused tax credits assumed from controlled entities in the tax consolidated group.
The wholly-owned entities fully compensate Pacific Environment Limited for any current tax payable assumed and are compensated by Pacific Environment Limited for any current tax receivable and deferred tax assets (where recognised) relating to unused tax losses or unused tax credits that are transferred to Pacific Environment Limited under the tax consolidation legislation. The funding amounts are determined by reference to the amounts recognised in the wholly-owned entities' financial statements.
The amounts receivable/payable are due upon receipt of the funding advice from the head entity, which is issued as soon as practicable after the end of each financial year. The head entity may also require payment of interim funding amounts to assist with its obligations to pay tax instalments.
Assets or liabilities arising under tax funding agreements with the tax consolidated entities are recognised as current amounts receivable from or payable to other entities in the group. Any difference between the amounts assumed and amounts receivable or payable under the tax funding agreement are recognised as a contribution to (or distribution from) wholly-owned tax consolidated entities.
Pacific Environment Limited Annual Report 2015 61Notes to Financial Statements
For
per
sona
l use
onl
y
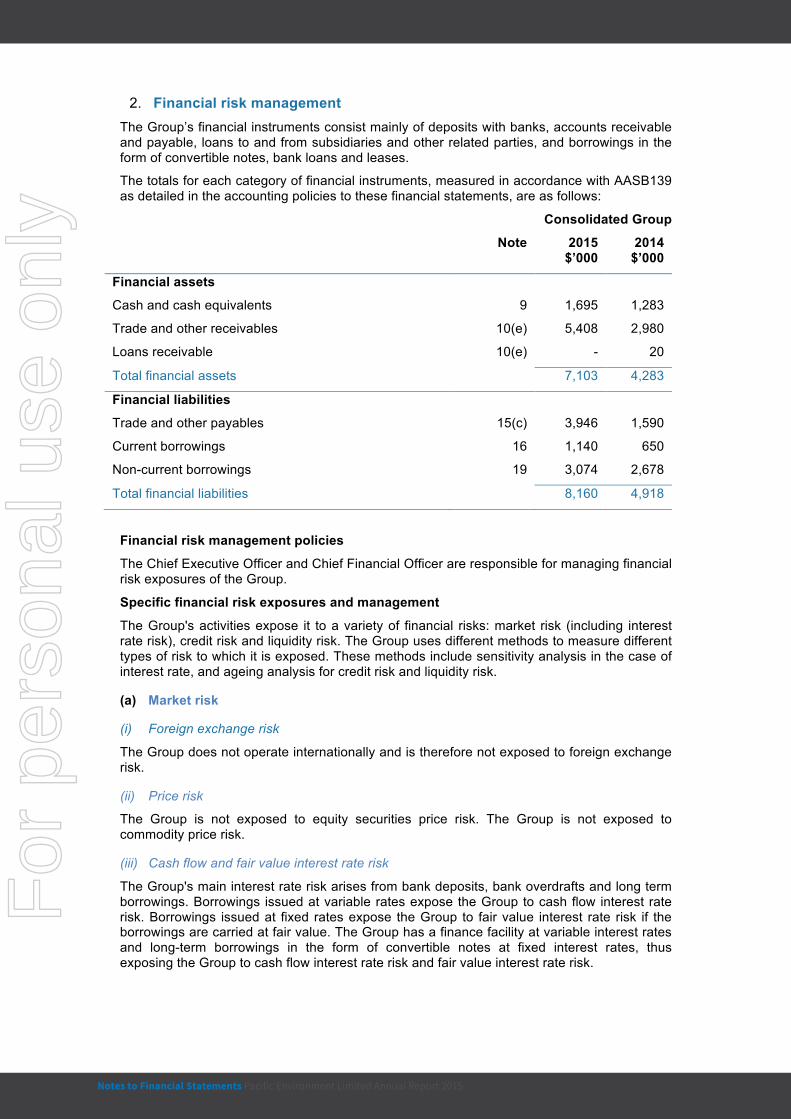
2. Financial risk management The Group’s financial instruments consist mainly of deposits with banks, accounts receivable and payable, loans to and from subsidiaries and other related parties, and borrowings in the form of convertible notes, bank loans and leases.
The totals for each category of financial instruments, measured in accordance with AASB139 as detailed in the accounting policies to these financial statements, are as follows:
Consolidated Group
Note 2015 $’000
2014 $’000
Financial assets
Cash and cash equivalents 9 1,695 1,283
Trade and other receivables 10(e) 5,408 2,980
Loans receivable 10(e) - 20
Total financial assets 7,103 4,283
Financial liabilities
Trade and other payables 15(c) 3,946 1,590
Current borrowings 16 1,140 650
Non-current borrowings 19 3,074 2,678
Total financial liabilities 8,160 4,918
Financial risk management policies
The Chief Executive Officer and Chief Financial Officer are responsible for managing financial risk exposures of the Group.
Specific financial risk exposures and management
The Group's activities expose it to a variety of financial risks: market risk (including interest rate risk), credit risk and liquidity risk. The Group uses different methods to measure different types of risk to which it is exposed. These methods include sensitivity analysis in the case of interest rate, and ageing analysis for credit risk and liquidity risk.
(a) Market risk
(i) Foreign exchange risk
The Group does not operate internationally and is therefore not exposed to foreign exchange risk.
(ii) Price risk
The Group is not exposed to equity securities price risk. The Group is not exposed to commodity price risk.
(iii) Cash flow and fair value interest rate risk
The Group's main interest rate risk arises from bank deposits, bank overdrafts and long term borrowings. Borrowings issued at variable rates expose the Group to cash flow interest rate risk. Borrowings issued at fixed rates expose the Group to fair value interest rate risk if the borrowings are carried at fair value. The Group has a finance facility at variable interest rates and long-term borrowings in the form of convertible notes at fixed interest rates, thus exposing the Group to cash flow interest rate risk and fair value interest rate risk.
As at the reporting date, the Group had the following variable rate borrowings and fixed interest rate borrowings outstanding:
2015 2014
Weighted average interest
rate %
Balance $’000
Weighted average interest
rate %
Balance $’000
Cash and cash equivalents 1% 1,695 2% 1,283 Bank loans 3% (741) 4% (229) Convertible instruments (interest bearing) – face value
11% (1,260) 11% (1,800)
Other loans – current 6% (162) 7% (146) Other loans – non-current 0% - 0% - Lease liabilities 6% (2,085) 6% (1,203)
Net exposure to cash flow interest rate risk (2,553) (2,095)
The Group manages its interest rate risk by analysing ‘what if’ scenarios simulated where the Group calculates the impact on profit and loss of a defined interest rate shift. The scenarios are run only for liabilities that represent the major interest bearing positions. The simulation is done half yearly to verify that the maximum loss potential is within the limit given by management.
Group sensitivity
At 30 June 2015, if interest rates had decreased by 2% or increased by 2% from the year end rates with all other variables held constant, post-tax profit for the year would have been $35,000 lower / $35,000 higher (2014: changes of -2% / +2%: $15,000 lower / $15,000 higher), mainly as a result of higher / lower interest income from cash and cash equivalents.
Summarised sensitivity analysis
The following table summarises the sensitivity of the Group's financial assets and financial liabilities to interest rate risk:
Interest rate risk
At 30 June 2015
Carrying amount
$’000
-2% Profit $’000
Other Equity
$’000
+2% Profit $’000
Other Equity
$’000
Financial assets
Cash and cash equivalents 1,695 24 - (24) - Trade and other receivables 5,408 - - - - Financial liabilities
Trade and other payables 3,946 - - - - Borrowings 4,214 (59) 59 -
Total (increase) / decrease (35) - 35 -
Notes to Financial Statements Pacific Environment Limited Annual Report 201562
For
per
sona
l use
onl
y

As at the reporting date, the Group had the following variable rate borrowings and fixed interest rate borrowings outstanding:
2015 2014
Weighted average interest
rate %
Balance $’000
Weighted average interest
rate %
Balance $’000
Cash and cash equivalents 1% 1,695 2% 1,283 Bank loans 3% (741) 4% (229) Convertible instruments (interest bearing) – face value
11% (1,260) 11% (1,800)
Other loans – current 6% (162) 7% (146) Other loans – non-current 0% - 0% - Lease liabilities 6% (2,085) 6% (1,203)
Net exposure to cash flow interest rate risk (2,553) (2,095)
The Group manages its interest rate risk by analysing ‘what if’ scenarios simulated where the Group calculates the impact on profit and loss of a defined interest rate shift. The scenarios are run only for liabilities that represent the major interest bearing positions. The simulation is done half yearly to verify that the maximum loss potential is within the limit given by management.
Group sensitivity
At 30 June 2015, if interest rates had decreased by 2% or increased by 2% from the year end rates with all other variables held constant, post-tax profit for the year would have been $35,000 lower / $35,000 higher (2014: changes of -2% / +2%: $15,000 lower / $15,000 higher), mainly as a result of higher / lower interest income from cash and cash equivalents.
Summarised sensitivity analysis
The following table summarises the sensitivity of the Group's financial assets and financial liabilities to interest rate risk:
Interest rate risk
At 30 June 2015
Carrying amount
$’000
-2% Profit $’000
Other Equity
$’000
+2% Profit $’000
Other Equity
$’000
Financial assets
Cash and cash equivalents 1,695 24 - (24) - Trade and other receivables 5,408 - - - - Financial liabilities
Trade and other payables 3,946 - - - - Borrowings 4,214 (59) 59 -
Total (increase) / decrease (35) - 35 -
Pacific Environment Limited Annual Report 2015 63Notes to Financial Statements
For
per
sona
l use
onl
y

(b) Credit risk
Credit risk is managed on a Group basis. Credit risk arises from credit exposures to customers, including outstanding receivables and committed transactions. If customers are independently rated, these ratings are used. Otherwise, if there is no independent rating, credit control assesses the credit quality of the customer, taking into account its financial position, past experience and other factors. Currently there are no individual credit limits set, however going forward this will be considered by the Audit and Risk Committee and the Board to improve controls over credit risk.
The maximum exposure to credit risk at the reporting date is the carrying amount of the financial assets as summarised above. For some trade receivables, given that the customers are generally without external credit ratings, the Group obtains comfort in the form of executed proposal agreements and quotations detailing fees and billing schedules.
The credit quality of financial assets that are neither past due nor impaired can be assessed by reference to historical information about payment history and any default rates.
Consolidated Group
2015 $’000
2014 $’000
Trade receivables
Counterparties without external credit rating *
� A customers (aged 0 – 30 days) 2,357 1,581
� B customers (aged 31 – 60 days) 509 485
� C customers (aged 61 – 120 days) 652 311
� D customers (aged 120+ days) 293 76
Total trade receivables 3,811 2,453
*Existing customers (more than 6 months) with no major defaults in the past. All amounts are considered fully recoverable.
(c) Liquidity risk
Prudent liquidity risk management implies maintaining sufficient cash and the availability of funding through an adequate amount of committed credit facilities to meet obligations when due to close out market positions. The Group manages liquidity risk by continuously monitoring forecast and actual cash flows.
Financing arrangements
The Group had access to the following undrawn borrowing facilities at the reporting date:
2015 $’000
2014 $’000
Floating rate
Bank overdraft facility 750 500
Financial liability and financial asset maturity analysis The table below analyses the Group's financial liabilities and assets into relevant maturity groupings based on the remaining period at the reporting date to the contractual maturity date. The amounts disclosed in the table are the contractual undiscounted cash flows.
Within 1 Year 1 to 5 Years Over 5 Years Total
Consolidated Group 2015
$’000 2014
$’000 2015
$’000 2014
$’000 2015
$’000 2014
$’000 2015
$’000 2014
$’000
Financial liabilities due for payment
Bank facilities and loans 321 83 419 146 - - 740 229
Trade and other payables 3,251 2,002 695 161 - - 3,946 2,163
Finance lease liabilities 657 421 1,428 782 - - 2,085 1,203
Amounts payable to related parties
- 6 1,227 1,750 - - 1,227 1,756
Other loans 162 146 - - - - 162 146
Total expected outflows 4,391 2,658 3,769 2,839 - - 8,160 5,497
Financial assets – cash flows realisable
Cash and cash equivalents
1,695 1,283 - - - - 1,695 1,283
Trade and other receivables
5,408 2,980 - - - - 5,408 2,980
Other investments - - - - - - - -
Amounts receivable from related parties
- 20 - - - - - 20
Total anticipated inflows 7,103 4,283 - - - - 7,103 4,283
Net inflow/(outflow)on financial instruments 2,712 1,625 (3,769) (2,839) - - (1,057) (1,214)
(d) Fair value measurements
The fair value of financial assets and financial liabilities must be estimated for recognition and measurement or for disclosure purposes.
The carrying value less impairment provision of trade receivables and payables are assumed to approximate their fair values due to their short term nature. The fair value of financial liabilities for disclosure purposes is estimated by discounting the future contractual cash flows at the current market interest rate that is available to the Group for similar financial instruments.
Notes to Financial Statements Pacific Environment Limited Annual Report 201564
For
per
sona
l use
onl
y

Financial liability and financial asset maturity analysis The table below analyses the Group's financial liabilities and assets into relevant maturity groupings based on the remaining period at the reporting date to the contractual maturity date. The amounts disclosed in the table are the contractual undiscounted cash flows.
Within 1 Year 1 to 5 Years Over 5 Years Total
Consolidated Group 2015
$’000 2014
$’000 2015
$’000 2014
$’000 2015
$’000 2014
$’000 2015
$’000 2014
$’000
Financial liabilities due for payment
Bank facilities and loans 321 83 419 146 - - 740 229
Trade and other payables 3,251 2,002 695 161 - - 3,946 2,163
Finance lease liabilities 657 421 1,428 782 - - 2,085 1,203
Amounts payable to related parties
- 6 1,227 1,750 - - 1,227 1,756
Other loans 162 146 - - - - 162 146
Total expected outflows 4,391 2,658 3,769 2,839 - - 8,160 5,497
Financial assets – cash flows realisable
Cash and cash equivalents
1,695 1,283 - - - - 1,695 1,283
Trade and other receivables
5,408 2,980 - - - - 5,408 2,980
Other investments - - - - - - - -
Amounts receivable from related parties
- 20 - - - - - 20
Total anticipated inflows 7,103 4,283 - - - - 7,103 4,283
Net inflow/(outflow)on financial instruments 2,712 1,625 (3,769) (2,839) - - (1,057) (1,214)
(d) Fair value measurements
The fair value of financial assets and financial liabilities must be estimated for recognition and measurement or for disclosure purposes.
The carrying value less impairment provision of trade receivables and payables are assumed to approximate their fair values due to their short term nature. The fair value of financial liabilities for disclosure purposes is estimated by discounting the future contractual cash flows at the current market interest rate that is available to the Group for similar financial instruments.
Pacific Environment Limited Annual Report 2015 65Notes to Financial Statements
For
per
sona
l use
onl
y

6. Expenses Profit before income tax from continuing operations includes the following specific expenses:
Consolidated Group
Notes 2015 $’000
2014 $’000
Consultants expense Audit and accounting 76 57 Corporate support and company secretarial 18 20 Information Technology 16 3 Legal 32 22 Strategic consultancy 550 175
Total consultants expense 692 277 Depreciation
Plant and equipment 158 114 Plant and equipment under finance leases 250 84
Total depreciation 13 408 198 Amortisation
Software 277 262 Other - 2
Total amortisation 14 277 264
Total depreciation and amortisation expense 685 462 Finance costs Interest and finance charges paid/payable for financial liabilities not at fair value through profit or loss
311 238
Rental expense relating to operating leases Minimum lease payments 554 451 Impairment losses Reversal of impairment – capitalised software 14 (295) -
Defined contribution superannuation expense 598 442
Share based payment expenses 160 40
3. Segment information The Group provides superior environmental consulting, advice, solutions and services to help clients comply with environmental regulations, meet corporate responsibilities and improve operations and planning.
Management has determined that the consulting services are comprehensive, and complement each other. The structure of the operations views the services offerings as unified and therefore the requirement for segment reporting does not apply. This has been based on the reports reviewed by the Board of Directors (chief operating decision makers) that are used to make strategic decisions.
4. Revenue Consolidated
Group Notes 2015
$’000 2014
$’000
From continuing operations
Sales revenue 14,805 9,618
Total revenue 14,805 9,618
From discontinued operations
Sales revenue 1,105 2,220
Total revenue 1,105 2,220
5. Other income 2015
$’000 2014
$’000
Government Grants: Research & Development Tax Incentives 5(a) 1,597 1,083 Other income 48 7
Total other income 1,645 1,090
(a) Research and Development Tax Incentives Research and Development Tax Incentives includes the FY2014-15 claim of $1,597,000. The FY2014-15 research and development activities have not yet been registered with AusIndustry and the claim has not yet been lodged, however the amount has been calculated in accordance with processes similar to those followed in previous years which is based on external advice received. The receivable amount has been included in other receivables, refer Note 10.
Notes to Financial Statements Pacific Environment Limited Annual Report 201566
For
per
sona
l use
onl
y

6. Expenses Profit before income tax from continuing operations includes the following specific expenses:
Consolidated Group
Notes 2015 $’000
2014 $’000
Consultants expense Audit and accounting 76 57 Corporate support and company secretarial 18 20 Information Technology 16 3 Legal 32 22 Strategic consultancy 550 175
Total consultants expense 692 277 Depreciation
Plant and equipment 158 114 Plant and equipment under finance leases 250 84
Total depreciation 13 408 198 Amortisation
Software 277 262 Other - 2
Total amortisation 14 277 264
Total depreciation and amortisation expense 685 462 Finance costs Interest and finance charges paid/payable for financial liabilities not at fair value through profit or loss
311 238
Rental expense relating to operating leases Minimum lease payments 554 451 Impairment losses Reversal of impairment – capitalised software 14 (295) -
Defined contribution superannuation expense 598 442
Share based payment expenses 160 40
Pacific Environment Limited Annual Report 2015 67Notes to Financial Statements
For
per
sona
l use
onl
y

7. Income tax expense Consolidated
Group 2015
$’000 2014
$’000 (a) The components of Income tax (benefit)/expense comprise:
Current tax - - Deferred tax 649 - Under-provision of prior year tax losses (878) -
Income tax (benefit)/expense (229) -
2015 $’000
2014 $’000
(b) Numerical reconciliation of income tax expense to prima facie tax payable
Prima facie tax on profit from continuing operations before income tax is reconciled to income tax as follows:
Prima facie tax payable on profit from continuing operations before income tax at 30% (2014:30%)
531 393
Add:
Tax effect of:
- non-allowable items (including R&D expenditure) 816 384
- share options expensed during the year 48 12
Less:
Tax effect of:
- R&D income non-assessable (479) (325)
- revaluation of assets not subject to income tax (89) -
- under-provision for income tax in prior year (273) -
- recoupment of prior year tax losses not previously brought to account (605) (464)
Income tax (benefit)/expense (51) -
8. Discontinued Operations On 8 April 2015, the consolidated group announced the divestment of its Queensland-based stack emissions measurement business unit via a management buy-out, thereby discontinuing its operations in this non-core business.
The financial performance of the discontinued operation to the date of sale, which is included in profit / (loss) from discontinued operations per the statement of comprehensive income, is as follows:
Consolidated Group
2015 $’000
2014 $’000
Revenue & other income 1,191 2,189 Expenses (1,337) (2,155) (Loss) / Profit before income tax (146) 34 Income tax expense 44 - (Loss) / Profit after tax attributable to the discontinued operation (102) 34 (Loss) on sale before income tax (447) - Income tax expense 134 - (Loss) on sale after income tax (313) - Total (Loss) / Profit after tax attributable to the discontinued operation (415) 34 2015
$’000 2014
$’000 The net cash flows of the discontinued operation, which have been incorporated into the statement of cash flows, are as follows:
Net cash inflow/(outflow) from operating activities (123) 121 Net cash inflow/(outflow) from investing activities (8) (38) Net cash inflow/(outflow) from financing activities - - Net cash (decrease)/increase generated by the discontinued operation (131) 83
Notes to Financial Statements Pacific Environment Limited Annual Report 201568
For
per
sona
l use
onl
y
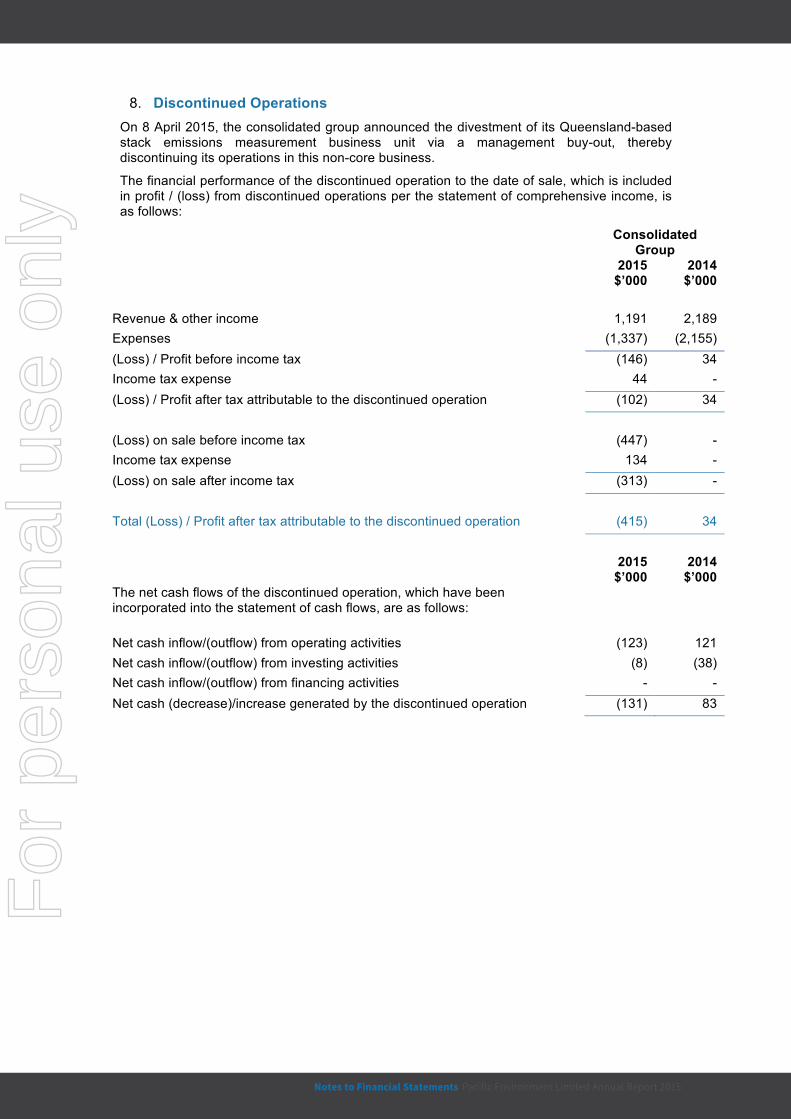
8. Discontinued Operations On 8 April 2015, the consolidated group announced the divestment of its Queensland-based stack emissions measurement business unit via a management buy-out, thereby discontinuing its operations in this non-core business.
The financial performance of the discontinued operation to the date of sale, which is included in profit / (loss) from discontinued operations per the statement of comprehensive income, is as follows:
Consolidated Group
2015 $’000
2014 $’000
Revenue & other income 1,191 2,189 Expenses (1,337) (2,155) (Loss) / Profit before income tax (146) 34 Income tax expense 44 - (Loss) / Profit after tax attributable to the discontinued operation (102) 34 (Loss) on sale before income tax (447) - Income tax expense 134 - (Loss) on sale after income tax (313) - Total (Loss) / Profit after tax attributable to the discontinued operation (415) 34 2015
$’000 2014
$’000 The net cash flows of the discontinued operation, which have been incorporated into the statement of cash flows, are as follows:
Net cash inflow/(outflow) from operating activities (123) 121 Net cash inflow/(outflow) from investing activities (8) (38) Net cash inflow/(outflow) from financing activities - - Net cash (decrease)/increase generated by the discontinued operation (131) 83
Pacific Environment Limited Annual Report 2015 69Notes to Financial Statements
For
per
sona
l use
onl
y

9. Current assets – Cash and cash equivalents
2015 $’000
2014 $’000
Cash at bank and in hand 1,695 1,283
(a) Reconciliation to cash at the end of the year
The above figures are reconciled to cash at the end of financial year as shown in the statement of cash flows as follows:
Note
2015 $’000
2014 $’000
Balances as above 1,695 1,283 Bank overdraft 16 - -
Balance per statement of cash flows 1,695 1,283
(b) Risk exposure
The Group’s exposure to interest rate risk is discussed in note 2. The maximum exposure to credit risk at the reporting date is the carrying amount of each class of cash and cash equivalents mentioned above.
10. Current assets – Trade and other receivables 2015
$’000 2014
$’000 Trade receivables 3,811 2,472 Provision for impairment of receivables (note (a)) - (20) 3,811 2,452 Research and Development Tax Incentive receivable 1,597 506 Other receivables (note (b)) - 22 Loans to related parties (note (c)) - 20
Trade and other receivables 5,408 3,000
Notes to Financial Statements Pacific Environment Limited Annual Report 201570
For
per
sona
l use
onl
y

(a) Impaired Trade Receivables
Past Due but Not Impaired
(Days Overdue)
Gross Amount
$000
Past Due and
Impaired
$000
< 30
$000
31 – 60
$000
61 – 90
$000
> 90
$000
Within Initial Trade
Terms
$000 2015
Trade & term receivables 3,811 - 894 481 171 293 1,972
Other receivables 1,597 - - - - - 1,597
Total 5,408 - 894 481 171 293 3,569
2014
Trade & term receivables 2,452 20 485 311 26 50 1,580
Other receivables 548 - - - - - 548
Total 3,000 20 485 311 26 50 2,128
(b) Other receivables
These amounts generally arise from transactions outside the usual operating activities of the group.
(c) Loans to related parties
Loans to related parties relate to amounts owing by the original founders of the subsidiaries acquired during prior periods. These loans were written off in 2015 (refer to note 29).
(d) Fair value and credit risk
Due to the short term nature of these receivables, the carrying amount is assumed to approximate their fair value.
The maximum exposure to credit risk at the reporting date is the carrying amount of each class of receivables mentioned above. The fair value of securities held for certain trade receivable is insignificant as is the fair value of any collateral sold or re-pledged. Refer to note 2 for more information on the risk management policy of the Group and the credit quality of the Group's trade receivables.
(e) Financial assets classified as loans and receivables Consolidated
Group
Note 2015
$’000 2014
$’000 Trade and other receivables 5,408 2,980 Loans receivable - 20
Financial Assets 5,408 3,000
Pacific Environment Limited Annual Report 2015 71Notes to Financial Statements
For
per
sona
l use
onl
y

11. Current assets – Other assets
Consolidated Group
2015 $’000
2014 $’000
Prepayments 105 121
12. Current assets – Inventories
2015 $’000
2014 $’000
Work in Progress at cost 307 229
13. Non-current assets – Property, plant and equipment
Consolidated Group
Motor Vehicles
$’000
Furniture fittings and equipment
$’000
Leased Assets
$’000 Total $’000
Year ended 30 June 2014 Opening net book amount 19 408 181 608 Additions 57 170 941 1,168 Disposals - (17) - (17) Depreciation charge (14) (188) (84) (286)
Closing net book amount 62 373 1,038 1,473 At 30 June 2014 Cost or fair value 113 1,338 1,405 2,856 Accumulated depreciation (51) (965) (367) (1,383) Accumulated impairment - - - -
Net book amount 62 373 1,038 1,473 Year ended 30 June 2015 Opening net book amount 62 373 1,038 1,473 Additions - 444 1,201 1,645 Disposals - (76) - (76) Transfer between classes 26 (1) (25) - Depreciation charge (30) (151) (250) (431)
Closing net book amount 58 589 1,964 2,611 At 30 June 2015 Cost or fair value 115 1,304 2,400 3,819 Accumulated depreciation (57) (715) (436) (1,208) Accumulated impairment - - - -
Net book amount 58 589 1,964 2,611
Total impairment losses recognised in the statement of comprehensive income was nil (2014:nil).
Notes to Financial Statements Pacific Environment Limited Annual Report 201572
For
per
sona
l use
onl
y
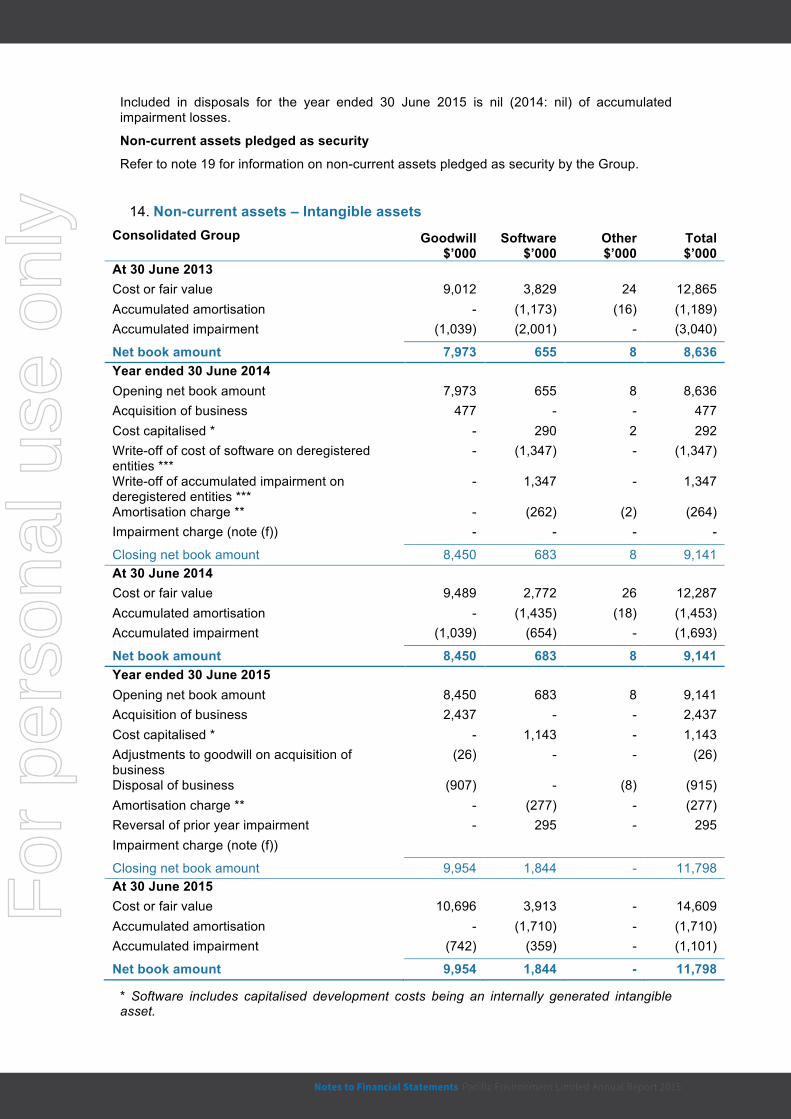
11. Current assets – Other assets
Consolidated Group
2015 $’000
2014 $’000
Prepayments 105 121
12. Current assets – Inventories
2015 $’000
2014 $’000
Work in Progress at cost 307 229
13. Non-current assets – Property, plant and equipment
Consolidated Group
Motor Vehicles
$’000
Furniture fittings and equipment
$’000
Leased Assets
$’000 Total $’000
Year ended 30 June 2014 Opening net book amount 19 408 181 608 Additions 57 170 941 1,168 Disposals - (17) - (17) Depreciation charge (14) (188) (84) (286)
Closing net book amount 62 373 1,038 1,473 At 30 June 2014 Cost or fair value 113 1,338 1,405 2,856 Accumulated depreciation (51) (965) (367) (1,383) Accumulated impairment - - - -
Net book amount 62 373 1,038 1,473 Year ended 30 June 2015 Opening net book amount 62 373 1,038 1,473 Additions - 444 1,201 1,645 Disposals - (76) - (76) Transfer between classes 26 (1) (25) - Depreciation charge (30) (151) (250) (431)
Closing net book amount 58 589 1,964 2,611 At 30 June 2015 Cost or fair value 115 1,304 2,400 3,819 Accumulated depreciation (57) (715) (436) (1,208) Accumulated impairment - - - -
Net book amount 58 589 1,964 2,611
Total impairment losses recognised in the statement of comprehensive income was nil (2014:nil).
Included in disposals for the year ended 30 June 2015 is nil (2014: nil) of accumulated impairment losses.
Non-current assets pledged as security
Refer to note 19 for information on non-current assets pledged as security by the Group.
14. Non-current assets – Intangible assets Consolidated Group Goodwill
$’000 Software
$’000 Other $’000
Total $’000
At 30 June 2013 Cost or fair value 9,012 3,829 24 12,865 Accumulated amortisation - (1,173) (16) (1,189) Accumulated impairment (1,039) (2,001) - (3,040)
Net book amount 7,973 655 8 8,636 Year ended 30 June 2014 Opening net book amount 7,973 655 8 8,636 Acquisition of business 477 - - 477 Cost capitalised * - 290 2 292 Write-off of cost of software on deregistered entities ***
- (1,347) - (1,347)
Write-off of accumulated impairment on deregistered entities ***
- 1,347 - 1,347
Amortisation charge ** - (262) (2) (264) Impairment charge (note (f)) - - - -
Closing net book amount 8,450 683 8 9,141 At 30 June 2014 Cost or fair value 9,489 2,772 26 12,287 Accumulated amortisation - (1,435) (18) (1,453) Accumulated impairment (1,039) (654) - (1,693)
Net book amount 8,450 683 8 9,141 Year ended 30 June 2015 Opening net book amount 8,450 683 8 9,141 Acquisition of business 2,437 - - 2,437 Cost capitalised * - 1,143 - 1,143 Adjustments to goodwill on acquisition of business
(26) - - (26)
Disposal of business (907) - (8) (915) Amortisation charge ** - (277) - (277) Reversal of prior year impairment - 295 - 295 Impairment charge (note (f))
Closing net book amount 9,954 1,844 - 11,798 At 30 June 2015 Cost or fair value 10,696 3,913 - 14,609 Accumulated amortisation - (1,710) - (1,710) Accumulated impairment (742) (359) - (1,101)
Net book amount 9,954 1,844 - 11,798
* Software includes capitalised development costs being an internally generated intangible asset.
Pacific Environment Limited Annual Report 2015 73Notes to Financial Statements
For
per
sona
l use
onl
y
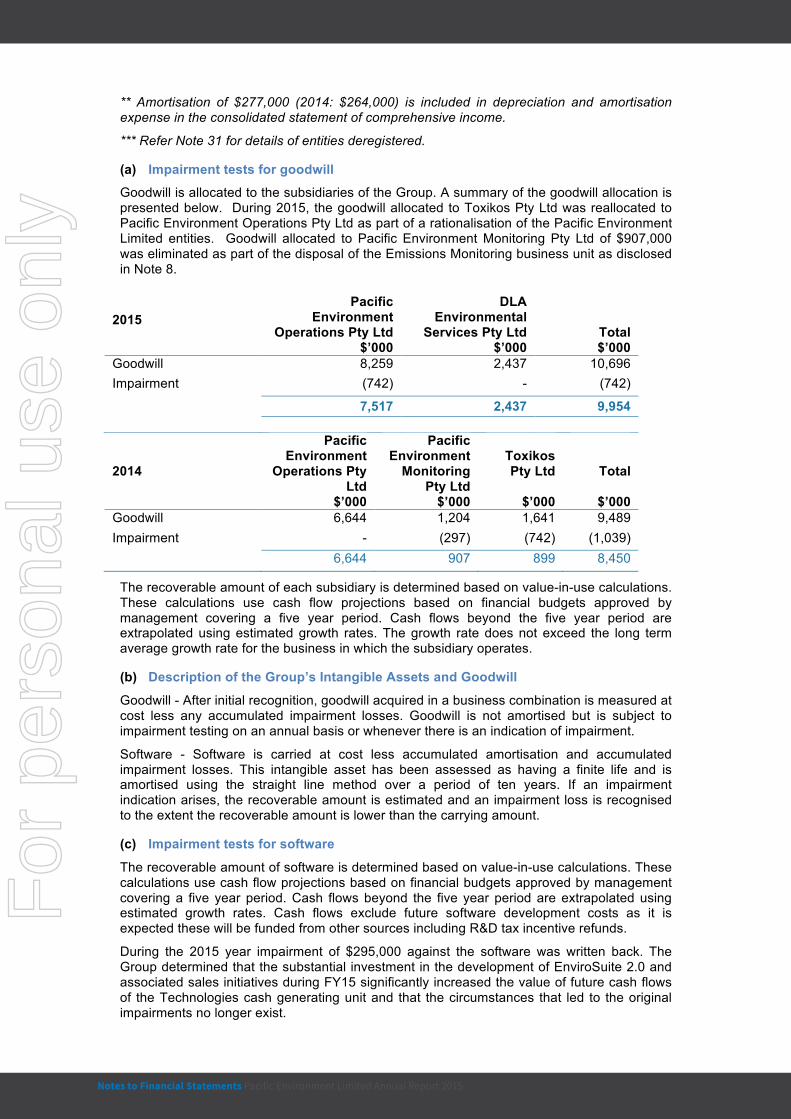
** Amortisation of $277,000 (2014: $264,000) is included in depreciation and amortisation expense in the consolidated statement of comprehensive income.
*** Refer Note 31 for details of entities deregistered.
(a) Impairment tests for goodwill
Goodwill is allocated to the subsidiaries of the Group. A summary of the goodwill allocation is presented below. During 2015, the goodwill allocated to Toxikos Pty Ltd was reallocated to Pacific Environment Operations Pty Ltd as part of a rationalisation of the Pacific Environment Limited entities. Goodwill allocated to Pacific Environment Monitoring Pty Ltd of $907,000 was eliminated as part of the disposal of the Emissions Monitoring business unit as disclosed in Note 8.
2015 Pacific
Environment Operations Pty Ltd
$’000
DLA Environmental
Services Pty Ltd $’000
Total $’000
Goodwill 8,259 2,437 10,696 Impairment (742) - (742) 7,517 2,437 9,954
2014
Pacific Environment
Operations Pty Ltd
$’000
Pacific Environment
Monitoring Pty Ltd
$’000
Toxikos Pty Ltd
$’000
Total
$’000 Goodwill 6,644 1,204 1,641 9,489 Impairment - (297) (742) (1,039) 6,644 907 899 8,450
The recoverable amount of each subsidiary is determined based on value-in-use calculations. These calculations use cash flow projections based on financial budgets approved by management covering a five year period. Cash flows beyond the five year period are extrapolated using estimated growth rates. The growth rate does not exceed the long term average growth rate for the business in which the subsidiary operates.
(b) Description of the Group’s Intangible Assets and Goodwill
Goodwill - After initial recognition, goodwill acquired in a business combination is measured at cost less any accumulated impairment losses. Goodwill is not amortised but is subject to impairment testing on an annual basis or whenever there is an indication of impairment.
Software - Software is carried at cost less accumulated amortisation and accumulated impairment losses. This intangible asset has been assessed as having a finite life and is amortised using the straight line method over a period of ten years. If an impairment indication arises, the recoverable amount is estimated and an impairment loss is recognised to the extent the recoverable amount is lower than the carrying amount.
(c) Impairment tests for software
The recoverable amount of software is determined based on value-in-use calculations. These calculations use cash flow projections based on financial budgets approved by management covering a five year period. Cash flows beyond the five year period are extrapolated using estimated growth rates. Cash flows exclude future software development costs as it is expected these will be funded from other sources including R&D tax incentive refunds.
During the 2015 year impairment of $295,000 against the software was written back. The Group determined that the substantial investment in the development of EnviroSuite 2.0 and associated sales initiatives during FY15 significantly increased the value of future cash flows of the Technologies cash generating unit and that the circumstances that led to the original impairments no longer exist.
(d) Key assumptions used for value-in-use calculations
Growth rate expense* Growth rate revenue* Discount rate **
CGU 2015 %
2014 %
2015 %
2014 %
2015 %
2014 %
Consulting 5.0 2.0 – 5.0 7.0 5.0 – 7.0 10.1 14.6 Technologies 14.0 – 42.0 2.0 – 5.0 31.0 – 51.0 5.0 – 7.0 10.1 14.6 DLA 5.0 - 5.0 - 10.1 -
* Weighted average growth rate used to extrapolate cash flows beyond the budget period.
** In performing the value-in-use calculations for each CGU, the Group has applied pre-tax discount rates to discount the forecast future attributable pre-tax cash flows. The pre-tax discount rates are disclosed above. The movements in the pre-tax discount rates between 2015 and 2014 reflect changes in the anticipated timing of future cash flows.
The value-in-use calculations are most sensitive to the following assumptions:
• gross margins,
• discount rates, and
• growth rates used to extrapolate cash flows beyond the budget period.
Gross margins - Gross margins are based on past performance and management’s expectations for the future.
Discount rates - Discount rates reflect management’s estimate of the time value of money and the risks specific to each CGU (cash generating unit) that are not already reflected in the cash flows. In determining appropriate discount rates for each CGU, regard has been given to the weighted average cost of capital of the entity as a whole and adjusted for specific risks relating to the industry in which the businesses operate.
Growth rate estimates - growth rate estimates used are based on published industry research.
(e) Impact of possible changes in key assumptions
The implications of the key assumptions on the recoverable amounts are discussed below:
Gross margins – Management considers a change in the assumptions to be possible, yet have selected the most appropriate assumptions at this time. However, the calculated fair value of the CGU’s exceed the carrying amounts as follows:
• Consulting: $33,467,000
• Technologies: $18,626,000
• DLA Environmental Services: $17,188,000
It is considered unlikely that any significant changes in the gross margins would cause the recoverable amounts to fall below the carrying values.
Discount rates – Management recognises that actual time value of money may vary to what they have estimated. Management notes that the discount rate applied of 10.1% would have to increase to the following percentages for each of the CGU’s for the recoverable amounts to fall below the carrying values:
• Consulting: 34%
• Technologies: 47%
• DLA Environmental Services: 100%
Notes to Financial Statements Pacific Environment Limited Annual Report 201574
For
per
sona
l use
onl
y

(d) Key assumptions used for value-in-use calculations
Growth rate expense* Growth rate revenue* Discount rate **
CGU 2015 %
2014 %
2015 %
2014 %
2015 %
2014 %
Consulting 5.0 2.0 – 5.0 7.0 5.0 – 7.0 10.1 14.6 Technologies 14.0 – 42.0 2.0 – 5.0 31.0 – 51.0 5.0 – 7.0 10.1 14.6 DLA 5.0 - 5.0 - 10.1 -
* Weighted average growth rate used to extrapolate cash flows beyond the budget period.
** In performing the value-in-use calculations for each CGU, the Group has applied pre-tax discount rates to discount the forecast future attributable pre-tax cash flows. The pre-tax discount rates are disclosed above. The movements in the pre-tax discount rates between 2015 and 2014 reflect changes in the anticipated timing of future cash flows.
The value-in-use calculations are most sensitive to the following assumptions:
• gross margins,
• discount rates, and
• growth rates used to extrapolate cash flows beyond the budget period.
Gross margins - Gross margins are based on past performance and management’s expectations for the future.
Discount rates - Discount rates reflect management’s estimate of the time value of money and the risks specific to each CGU (cash generating unit) that are not already reflected in the cash flows. In determining appropriate discount rates for each CGU, regard has been given to the weighted average cost of capital of the entity as a whole and adjusted for specific risks relating to the industry in which the businesses operate.
Growth rate estimates - growth rate estimates used are based on published industry research.
(e) Impact of possible changes in key assumptions
The implications of the key assumptions on the recoverable amounts are discussed below:
Gross margins – Management considers a change in the assumptions to be possible, yet have selected the most appropriate assumptions at this time. However, the calculated fair value of the CGU’s exceed the carrying amounts as follows:
• Consulting: $33,467,000
• Technologies: $18,626,000
• DLA Environmental Services: $17,188,000
It is considered unlikely that any significant changes in the gross margins would cause the recoverable amounts to fall below the carrying values.
Discount rates – Management recognises that actual time value of money may vary to what they have estimated. Management notes that the discount rate applied of 10.1% would have to increase to the following percentages for each of the CGU’s for the recoverable amounts to fall below the carrying values:
• Consulting: 34%
• Technologies: 47%
• DLA Environmental Services: 100%
Pacific Environment Limited Annual Report 2015 75Notes to Financial Statements
For
per
sona
l use
onl
y
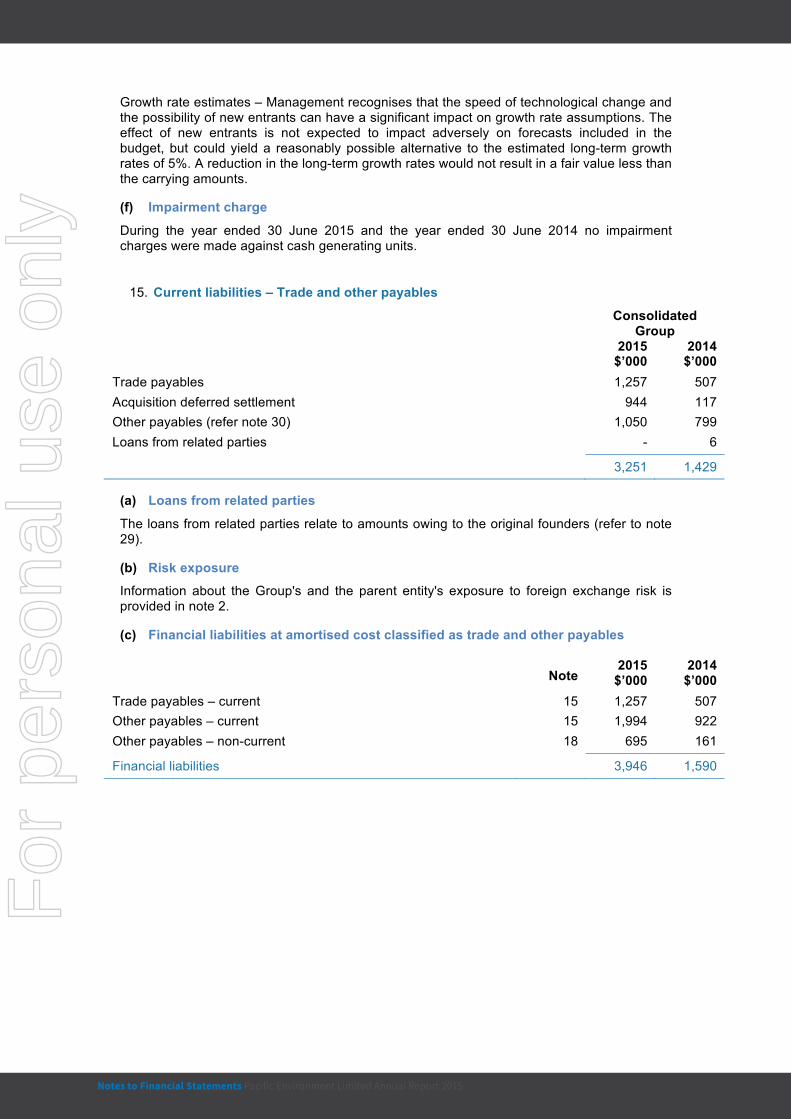
Growth rate estimates – Management recognises that the speed of technological change and the possibility of new entrants can have a significant impact on growth rate assumptions. The effect of new entrants is not expected to impact adversely on forecasts included in the budget, but could yield a reasonably possible alternative to the estimated long-term growth rates of 5%. A reduction in the long-term growth rates would not result in a fair value less than the carrying amounts.
(f) Impairment charge
During the year ended 30 June 2015 and the year ended 30 June 2014 no impairment charges were made against cash generating units.
15. Current liabilities – Trade and other payables
Consolidated Group
2015 $’000
2014 $’000
Trade payables 1,257 507 Acquisition deferred settlement 944 117 Other payables (refer note 30) 1,050 799 Loans from related parties - 6
3,251 1,429
(a) Loans from related parties
The loans from related parties relate to amounts owing to the original founders (refer to note 29).
(b) Risk exposure
Information about the Group's and the parent entity's exposure to foreign exchange risk is provided in note 2.
(c) Financial liabilities at amortised cost classified as trade and other payables
Note
2015 $’000
2014 $’000
Trade payables – current 15 1,257 507 Other payables – current 15 1,994 922 Other payables – non-current 18 695 161
Financial liabilities 3,946 1,590
16. Current liabilities – Borrowings
Consolidated
Group
Notes 2015
$’000 2014
$’000 Secured Bank overdraft 9 - - Bank loans 321 83 Lease liabilities 28 657 421 Other loans 162 146 1,140 650
(a) Security and fair value disclosures
Information about the security relating to each of the secured liabilities and the fair value of each of the borrowings is provided in note 19.
(b) Risk exposures
Details of the Group's exposure to risks arising from current and non-current borrowings are set out in note 2.
17. Current liabilities – Provisions
Employee Benefits
$’000
Deferred Lease
Incentive $’000
Total $’000
Opening balance at 1 July 2014 657 27 684 Additional provisions 271 - 271 Amounts used (199) (14) (213) Balance at 30 June 2015 729 13 742
Amounts not expected to be settled within the next 12 months
The current provision for long service leave includes all unconditional entitlements where employees have completed ten years of service and also those where employees are entitled to pro-rata payments in certain circumstances. The entire amount is presented as current, since the Group does not have an unconditional right to defer settlement. However, based on past experience, the Group does not expect all employees to take the full amount of accrued long service leave or require payment within the next 12 months.
The following amounts reflect leave that is not to be expected to be taken or paid within the next 12 months.
2015 $’000
2014 $’000
Long service leave obligations expected to be settled after 12 months (refer note 21)
144 111
Notes to Financial Statements Pacific Environment Limited Annual Report 201576
For
per
sona
l use
onl
y

16. Current liabilities – Borrowings
Consolidated
Group
Notes 2015
$’000 2014
$’000 Secured Bank overdraft 9 - - Bank loans 321 83 Lease liabilities 28 657 421 Other loans 162 146 1,140 650
(a) Security and fair value disclosures
Information about the security relating to each of the secured liabilities and the fair value of each of the borrowings is provided in note 19.
(b) Risk exposures
Details of the Group's exposure to risks arising from current and non-current borrowings are set out in note 2.
17. Current liabilities – Provisions
Employee Benefits
$’000
Deferred Lease
Incentive $’000
Total $’000
Opening balance at 1 July 2014 657 27 684 Additional provisions 271 - 271 Amounts used (199) (14) (213) Balance at 30 June 2015 729 13 742
Amounts not expected to be settled within the next 12 months
The current provision for long service leave includes all unconditional entitlements where employees have completed ten years of service and also those where employees are entitled to pro-rata payments in certain circumstances. The entire amount is presented as current, since the Group does not have an unconditional right to defer settlement. However, based on past experience, the Group does not expect all employees to take the full amount of accrued long service leave or require payment within the next 12 months.
The following amounts reflect leave that is not to be expected to be taken or paid within the next 12 months.
2015 $’000
2014 $’000
Long service leave obligations expected to be settled after 12 months (refer note 21)
144 111
Pacific Environment Limited Annual Report 2015 77Notes to Financial Statements
For
per
sona
l use
onl
y

18. Non-current liabilities – Trade and other payables Consolidated
Group 2015
$’000 2014
$’000 Acquisition deferred settlement (refer note 30) 695 161
19. Non-current liabilities – Borrowings
2015 $’000
2014 $’000
Secured Bank loans 419 146 Lease liabilities 1,428 782 Total secured non-current borrowings 1,847 928 Unsecured Other loans - - Convertible loan (note (a)) 1,227 1,750 Total unsecured non-current borrowings 1,227 1,750
Total non-current borrowings 3,074 2,678
(a) Convertible loan
Date
issued
Face value $’000
Repayment Date
Interest bearing convertible loan
Robin Ormerod 17/11/2010 1,260 30/06/2017
In November 2010, the Group secured a loan of $1.8 million. The loan was a fixed rate, Australian-dollar denominated loan.
On 29 December 2012 the Company entered into a new Loan agreement to replace the existing agreement that was due to expire on the 27 November 2013. The new loan expires on 30 June 2017. The loan is in the form of a convertible note arrangement with Mr. Robin Ormerod.
The company may repay the loan earlier at its discretion. The effective interest rate of the loan is 11% including a 2% discount that applies while the loan is not in default. The Financier may convert some or all of the loan amount to shares at a share price calculated at the Volume Weighted Average Price for the three months prior to the signing of the Loan deed, subject to any necessary shareholder approval. The number of converted shares that can be traded is restricted to 10% of the issued share capital of the Company per year in each of the first four years.
On 18 December 2014, Robin Ormerod requested a partial conversion of his convertible note with the Group. The conversion of $540,000 of outstanding principal into fully paid shares in the Group was executed on 18 December 2014, which resulted in an issue of 16,023,738 new shares and a reduction in the outstanding loan amount to $1,260,000 with an associated reduction in interest charges to the Group.
The loan is determined to be a compound financial instrument under AASB132 (18), as it combines features associated with both equity instruments and financial liabilities.
The convertible instruments are presented in the consolidated statement of financial position as follows:
Consolidated Group
2015 $’000
2014 $’000
Face value of notes issues 1,800 1,800 Other equity securities – value of conversion rights (109) (109) 1,691 1,691 Interest expense* 717 552 Amortisation 77 60 Conversion to equity (540) - Interest paid (713) (544) 1,232 1,759 Less: Interest owing (included in other payables) (5) (9) Less: Convertible note liability included in current borrowings - -
Total convertible note liability included in non-current borrowings 1,227 1,750
* Interest expense is calculated by applying the effective interest rate of 11% (convertible loan) to the face value of notes issued.
(b) Secured liabilities and assets pledged as security
The total secured liabilities (current and non-current) are as follows:
2015 $’000
2014 $’000
Bank overdraft - - Bank loans 740 229 Lease liabilities 2,085 1,203 Convertible loan – face value 1,260 1,800
Total secured liabilities 4,085 3,232
Lease liabilities are effectively secured as the rights to the leased assets recognised in the financial statements and revert to the lessor in the event of default.
The bank overdraft and bank loans are secured by general security agreements between ANZ and Pacific Environment Limited, Pacific Environment Operations Pty Ltd and DLA Environmental Services Pty Ltd as well as an unlimited corporate guarantee and indemnity by and on account of each of the three entities listed.
Notes to Financial Statements Pacific Environment Limited Annual Report 201578
For
per
sona
l use
onl
y
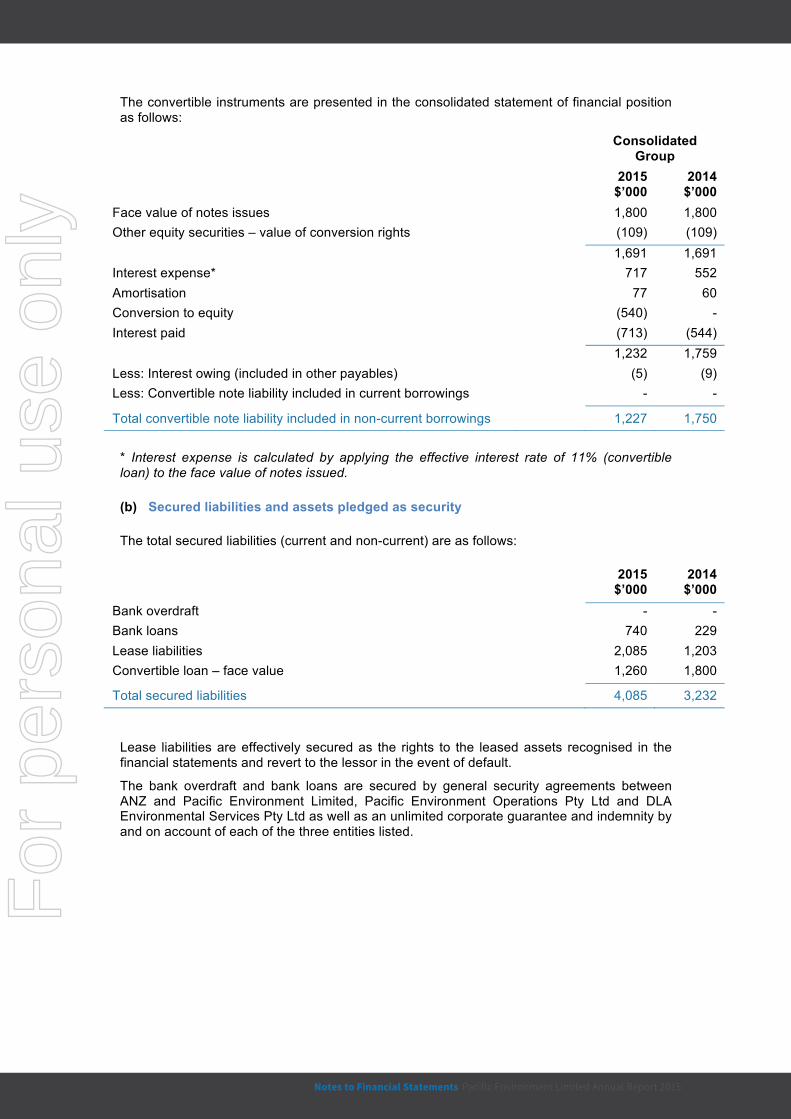
The convertible instruments are presented in the consolidated statement of financial position as follows:
Consolidated Group
2015 $’000
2014 $’000
Face value of notes issues 1,800 1,800 Other equity securities – value of conversion rights (109) (109) 1,691 1,691 Interest expense* 717 552 Amortisation 77 60 Conversion to equity (540) - Interest paid (713) (544) 1,232 1,759 Less: Interest owing (included in other payables) (5) (9) Less: Convertible note liability included in current borrowings - -
Total convertible note liability included in non-current borrowings 1,227 1,750
* Interest expense is calculated by applying the effective interest rate of 11% (convertible loan) to the face value of notes issued.
(b) Secured liabilities and assets pledged as security
The total secured liabilities (current and non-current) are as follows:
2015 $’000
2014 $’000
Bank overdraft - - Bank loans 740 229 Lease liabilities 2,085 1,203 Convertible loan – face value 1,260 1,800
Total secured liabilities 4,085 3,232
Lease liabilities are effectively secured as the rights to the leased assets recognised in the financial statements and revert to the lessor in the event of default.
The bank overdraft and bank loans are secured by general security agreements between ANZ and Pacific Environment Limited, Pacific Environment Operations Pty Ltd and DLA Environmental Services Pty Ltd as well as an unlimited corporate guarantee and indemnity by and on account of each of the three entities listed.
Pacific Environment Limited Annual Report 2015 79Notes to Financial Statements
For
per
sona
l use
onl
y

The current and non-current allocation of the Group’s finance leases are as follows:
Consolidated Group
Note
2015 $’000
2014 $’000
Current Finance lease
Plant and equipment 28(b) 657 421 Non-current Finance lease
Plant and equipment 28(b) 1,428 782
Total lease liability 2,085 1,203
(c) Fair value
There is no difference between the carrying amounts and fair values of borrowings at balance date.
(d) Risk exposures
Information about the Group's exposure to interest rate and foreign currency changes is provided in note 2.
20. Tax
2015 $’000
2014 $’000
Current
Income tax receivable – Research & Development 1,597 1,084
Non Current Opening Balance
$’000
Charged to Income
$’000
Charged directly to
Equity $’000
Changes in Tax
Rate $’000
Exchange Differences
$’000
Closing Balance
$’000
Deferred tax liabilities Balance at 30 June 2014 - - - - - - Other - (92) - - - (92) Balance at 30 June 2015 - (92) - - - (92)
Non Current Opening Balance
$’000
Charged to Income
$’000
Charged directly to
Equity $’000
Changes in Tax
Rate $’000
Exchange Differences
$’000
Closing Balance
$’000
Deferred tax assets Balance at 30 June 2014 - - - - - - Provisions - 298 - - - 298 Transaction costs on equity issue
- - 29 - - 29
Other - 23 - - - 23 Balance at 30 June 2015 - 321 29 - - 350
The amount of deductible temporary differences and unused tax losses for which no deferred tax assets have been brought to account:
• temporary differences $0 (2014: $0)
• tax losses: operating losses $1,973,000 (2014: $3,989,000)
• tax losses: capital losses $962,000 (2014: $962,000)
The benefits of the above temporary differences and unused tax losses will only be realised if the conditions for deductibility set out in note 1(e). These amounts have no expiry date.
21. Non-current liabilities – Provisions
Consolidated Group
Employee
Benefits $’000
Deferred Lease
Incentive $’000
Total $’000
Opening balance at 1 July 2014 111 13 124
Additional provisions 33 - 33
Amounts used - (13) (13)
Balance at 30 June 2015 144 - 144
Notes to Financial Statements Pacific Environment Limited Annual Report 201580
For
per
sona
l use
onl
y

Non Current Opening Balance
$’000
Charged to Income
$’000
Charged directly to
Equity $’000
Changes in Tax
Rate $’000
Exchange Differences
$’000
Closing Balance
$’000
Deferred tax assets Balance at 30 June 2014 - - - - - - Provisions - 298 - - - 298 Transaction costs on equity issue
- - 29 - - 29
Other - 23 - - - 23 Balance at 30 June 2015 - 321 29 - - 350
The amount of deductible temporary differences and unused tax losses for which no deferred tax assets have been brought to account:
• temporary differences $0 (2014: $0)
• tax losses: operating losses $1,973,000 (2014: $3,989,000)
• tax losses: capital losses $962,000 (2014: $962,000)
The benefits of the above temporary differences and unused tax losses will only be realised if the conditions for deductibility set out in note 1(e). These amounts have no expiry date.
21. Non-current liabilities – Provisions
Consolidated Group
Employee
Benefits $’000
Deferred Lease
Incentive $’000
Total $’000
Opening balance at 1 July 2014 111 13 124
Additional provisions 33 - 33
Amounts used - (13) (13)
Balance at 30 June 2015 144 - 144
Pacific Environment Limited Annual Report 2015 81Notes to Financial Statements
For
per
sona
l use
onl
y

22. Issued Capital 2015
Shares 2014
Shares 2015
$’000 2014
$’000 (a) Share capital
Ordinary shares (notes (c) and (d)) Fully Paid 132,934,978 99,129,598 19,683 17,635 (b) Other equity securities
Value of conversion rights, convertible loan (note (g))
- - 109 109
Value of conversion rights, convertible notes - - 28 28
Total consolidated contributed equity 132,934,978 99,129,598 19,820 17,772
(c) Movements in ordinary shares
Date Details Number of
shares Issue price
$’000
30/06/2013 Balance 98,629,598 17,595 9/10/2013 Shares issued to employee – value of services 500,000 0.08 40
30/06/2014 Balance 99,129,598 17,635 18/12/2014 Partial conversion of convertible notes 16,023,738 0.03 540 22/04/2015 Conversion of employee options 875,000 0.06 53 14/05/2015 Institutional Placement 13,417,777 0.09 1,208 07/05/2015 Share Purchase Plan to existing shareholders 3,488,865 0.09 314 Less: Transaction costs of capital raising (67)
30/06/2015 Balance 132,934,978 19,683
(d) Ordinary shares
Ordinary shares entitle the holder to participate in dividends and the proceeds on winding up of the Company in proportion to the number of and amounts paid on the shares held.
Every holder of ordinary shares present at a meeting in person or by proxy, is entitled to one vote, and upon a poll each share is entitled to one vote.
During the year ended 30 June 2015, 16,023,738 shares were issued upon partial conversion of the convertible note to the value of $540,000.
During the year ended 30 June 2015, 875,000 shares were issued upon exercise of employee options to the value of $53,000.
During the year ended 30 June 2015, 13,417,777 shares were issued at 9 cents per share through an institutional placement raising $1,208,000. In addition, 3,488,865 shares were issued at 9 cents per share to existing shareholders through a share purchase plan raising $314,000. Transaction costs for the capital raisings (net of tax) were $67,000.
During the year ended 30 June 2014, 500,000 ordinary shares valued at 8 cents per share were issued to a former employee for no consideration. The total charge to the Statement of Profit or Loss and Other Comprehensive Income in relation to these shares was $40,000.
(e) Options
During the year ended 30 June 2015, 4,000,000 options were issued to directors and 8,150,000 options were issued to employees. Information relating to the options, including details of options issued, exercised and lapsed during the financial year and options outstanding at the end of the financial year, is set out in note 35.
(f) Share based payments
Certain shares were issued for no cash consideration for the provision of services, details of which are shown in note 35.
(g) Other equity securities
The amount shown for other equity securities is the value of the conversion rights relating to the convertible instruments, details of which are shown in note 19(a).
(h) Capital risk management
The Group's objectives when managing capital are to safeguard its ability to continue as a going concern, so that it can continue to provide returns for shareholders and benefits for other stakeholders and to maintain an optimal capital structure to reduce the cost of capital.
In order to maintain or adjust the capital structure, the Group may adjust the amount of dividends paid to shareholders, return capital to shareholders, issue new shares or sell assets to reduce debt.
Consistent with others in the industry, the Group monitors capital on the basis of the gearing ratio. This ratio is calculated as net debt divided by total capital. Net debt is calculated as total borrowings (including 'borrowings' and ‘trade and other payables' as shown in the statement of financial position) less cash and cash equivalents. Total capital is calculated as ‘issued capital' as shown in the statement of financial position (including minority interest) plus net debt.
The gearing ratios at 30 June 2015 and 30 June 2014 were as follows:
Consolidated Group
Note
2015 $’000
2014 $’000
Total borrowings 15,16,18,19 8,160 5,497 Less: cash and cash equivalents 9 (1,695) (1,283)
Net debt 6,465 4,214 Total equity 13,136 9,521 Total capital 19,601 13,735 Gearing Ratio 33% 31%
Notes to Financial Statements Pacific Environment Limited Annual Report 201582
For
per
sona
l use
onl
y

(e) Options
During the year ended 30 June 2015, 4,000,000 options were issued to directors and 8,150,000 options were issued to employees. Information relating to the options, including details of options issued, exercised and lapsed during the financial year and options outstanding at the end of the financial year, is set out in note 35.
(f) Share based payments
Certain shares were issued for no cash consideration for the provision of services, details of which are shown in note 35.
(g) Other equity securities
The amount shown for other equity securities is the value of the conversion rights relating to the convertible instruments, details of which are shown in note 19(a).
(h) Capital risk management
The Group's objectives when managing capital are to safeguard its ability to continue as a going concern, so that it can continue to provide returns for shareholders and benefits for other stakeholders and to maintain an optimal capital structure to reduce the cost of capital.
In order to maintain or adjust the capital structure, the Group may adjust the amount of dividends paid to shareholders, return capital to shareholders, issue new shares or sell assets to reduce debt.
Consistent with others in the industry, the Group monitors capital on the basis of the gearing ratio. This ratio is calculated as net debt divided by total capital. Net debt is calculated as total borrowings (including 'borrowings' and ‘trade and other payables' as shown in the statement of financial position) less cash and cash equivalents. Total capital is calculated as ‘issued capital' as shown in the statement of financial position (including minority interest) plus net debt.
The gearing ratios at 30 June 2015 and 30 June 2014 were as follows:
Consolidated Group
Note
2015 $’000
2014 $’000
Total borrowings 15,16,18,19 8,160 5,497 Less: cash and cash equivalents 9 (1,695) (1,283)
Net debt 6,465 4,214 Total equity 13,136 9,521 Total capital 19,601 13,735 Gearing Ratio 33% 31%
Pacific Environment Limited Annual Report 2015 83Notes to Financial Statements
For
per
sona
l use
onl
y
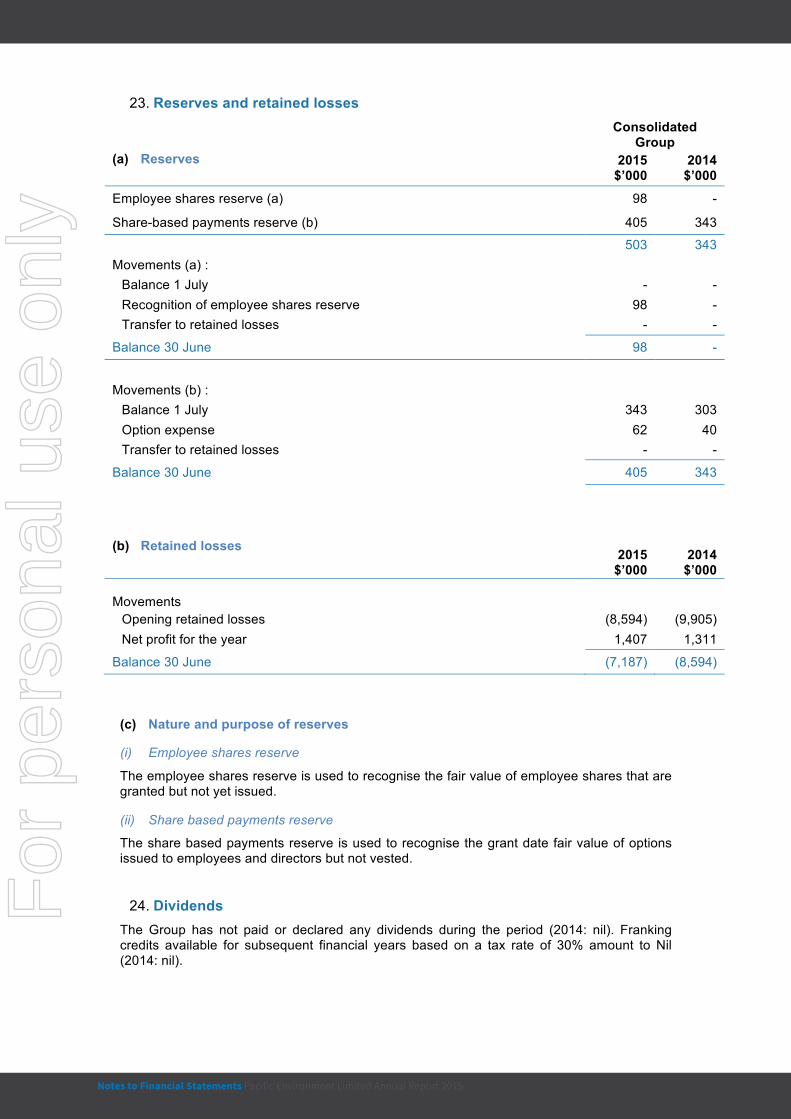
23. Reserves and retained losses
Consolidated Group
(a) Reserves 2015 $’000
2014 $’000
Employee shares reserve (a) 98 -
Share-based payments reserve (b) 405 343
503 343 Movements (a) :
Balance 1 July - - Recognition of employee shares reserve 98 - Transfer to retained losses - -
Balance 30 June 98 -
Movements (b) :
Balance 1 July 343 303 Option expense 62 40 Transfer to retained losses - -
Balance 30 June 405 343
(b) Retained losses 2015
$’000
2014
$’000 Movements
Opening retained losses (8,594) (9,905) Net profit for the year 1,407 1,311
Balance 30 June (7,187) (8,594)
(c) Nature and purpose of reserves
(i) Employee shares reserve
The employee shares reserve is used to recognise the fair value of employee shares that are granted but not yet issued.
(ii) Share based payments reserve
The share based payments reserve is used to recognise the grant date fair value of options issued to employees and directors but not vested.
24. Dividends The Group has not paid or declared any dividends during the period (2014: nil). Franking credits available for subsequent financial years based on a tax rate of 30% amount to Nil (2014: nil).
25. Key management personnel compensation Refer to the remuneration report contained in the directors’ report for details of the remuneration paid or payable to each member of the Group’s key management personnel (KMP) for the year ended 30 June 2015.
The totals of remuneration paid to KMP of the company and the Group during the year are as follows:
Consolidated Group 2015
$’000 2014
$’000
Short-term employee benefits 428 378 Post-employment benefits 19 18 Other long term benefits - - Share-based payments 35 27
Total KMP compensation 482 423
(i) Short-term employee benefits
These amounts include fees and benefits paid to the Chair and directors as well as all salary, paid leave benefits, fringe benefits and cash bonuses awarded to executive directors and other KMP.
(ii) Post-employment benefits
These amounts are the current year’s estimated cost of providing for the Group’s superannuation contributions made during the year and post-employment life insurance benefits.
(iii) Other long-term benefits
These amounts represent long service leave benefits accruing during the year, long-term disability benefits and deferred bonus payments.
(iv) Share-based payments
These amounts represent the expense related to the participation of KMP in equity-settled benefit schemes as measured by the fair value of the options, rights and shares granted on grant date.
Further information in relation to KMP remuneration can be found in the directors’ report.
26. Remuneration of auditors During the year the following fees were paid or payable for services provided by the auditor of the parent entity, its related practices and non-related audit firms:
(a) WPIAS Pty Ltd
2015 $
2014 $
Audit and other assurance services Audit and review of financial reports 60,086 60,620 Other assurance services - -
Total auditors remuneration 60,086 60,620
Notes to Financial Statements Pacific Environment Limited Annual Report 201584
For
per
sona
l use
onl
y

25. Key management personnel compensation Refer to the remuneration report contained in the directors’ report for details of the remuneration paid or payable to each member of the Group’s key management personnel (KMP) for the year ended 30 June 2015.
The totals of remuneration paid to KMP of the company and the Group during the year are as follows:
Consolidated Group 2015
$’000 2014
$’000
Short-term employee benefits 428 378 Post-employment benefits 19 18 Other long term benefits - - Share-based payments 35 27
Total KMP compensation 482 423
(i) Short-term employee benefits
These amounts include fees and benefits paid to the Chair and directors as well as all salary, paid leave benefits, fringe benefits and cash bonuses awarded to executive directors and other KMP.
(ii) Post-employment benefits
These amounts are the current year’s estimated cost of providing for the Group’s superannuation contributions made during the year and post-employment life insurance benefits.
(iii) Other long-term benefits
These amounts represent long service leave benefits accruing during the year, long-term disability benefits and deferred bonus payments.
(iv) Share-based payments
These amounts represent the expense related to the participation of KMP in equity-settled benefit schemes as measured by the fair value of the options, rights and shares granted on grant date.
Further information in relation to KMP remuneration can be found in the directors’ report.
26. Remuneration of auditors During the year the following fees were paid or payable for services provided by the auditor of the parent entity, its related practices and non-related audit firms:
(a) WPIAS Pty Ltd
2015 $
2014 $
Audit and other assurance services Audit and review of financial reports 60,086 60,620 Other assurance services - -
Total auditors remuneration 60,086 60,620
Pacific Environment Limited Annual Report 2015 85Notes to Financial Statements
For
per
sona
l use
onl
y

27. Contingencies
(a) Contingent liabilities
The Group had contingent liabilities at 30 June 2015 in respect of:
(i) Unsecured guarantees
The Group has given unsecured guarantees in respect of potential leases amounting to $191,913 (2014: $103,447) in aggregate.
No liability has been recognised by the Group in relation to these financial guarantees as the guarantees are in the event that further leases are required. The fair value of the leases obtained during the reporting period has been reflected in the Group’s balance sheet; the fair value of the leases guaranteed by the Group is immaterial.
(ii) Litigation
There are no litigation proceedings in process at the reporting date.
28. Commitments
(a) Capital commitments
The Group has no capital expenditure contracted for at the reporting date but not recognised as liabilities in the reporting period.
(b) Lease commitments: Group as lessee
(i) Non-cancellable operating leases
The Group leases various offices under non-cancellable operating leases expiring within two to five years. The leases have varying terms, escalation clauses and renewal rights. On renewal, the terms of the leases are renegotiated.
2015 $’000
2014 $’000
Commitments for minimum lease payments in relation to non-cancellable operating leases are payable as follows:
Within one year 518 528 Later than one year but not later than five years 241 246
759 774
(ii) Finance leases
The Group leases various plant and equipment with a carrying amount of $1,781,000 (2014: $1,038,000) under finance leases expiring within one to four years. Under the terms of the leases, the Group has various options to either extend the lease subject to conditions, pay the residual and make an offer to purchase the asset, or to return the plant and equipment to the lessor to be sold with any profit or loss realised from the sale passed back to the lessee.
Note 2015 $’000
2014 $’000
Commitments in relation to finance leases are payable as follows: Within one year 765 488 Later than one year but not later than five years 1,561 840 Later than five years - -
Minimum lease payments 2,326 1,328 Future finance charges (241) (125) Total lease liabilities 2,085 1,203
Representing lease liabilities: Current 16 657 421 Non-current 19 1,428 782
2,085 1,203 The present value of finance lease liabilities is as follows:
Within one year 763 469 Later than one year but not later than five years 1,558 820
Minimum lease payments 2,321 1,289
29. Related party transactions
(a) Parent entities
The parent entity within the Group is Pacific Environment Limited.
(b) Subsidiaries
Interests in subsidiaries are set out in note 31.
(c) Key management personnel
Disclosures relating to key management personnel are set out in note 25.
Notes to Financial Statements Pacific Environment Limited Annual Report 201586
For
per
sona
l use
onl
y

(ii) Finance leases
The Group leases various plant and equipment with a carrying amount of $1,781,000 (2014: $1,038,000) under finance leases expiring within one to four years. Under the terms of the leases, the Group has various options to either extend the lease subject to conditions, pay the residual and make an offer to purchase the asset, or to return the plant and equipment to the lessor to be sold with any profit or loss realised from the sale passed back to the lessee.
Note 2015 $’000
2014 $’000
Commitments in relation to finance leases are payable as follows: Within one year 765 488 Later than one year but not later than five years 1,561 840 Later than five years - -
Minimum lease payments 2,326 1,328 Future finance charges (241) (125) Total lease liabilities 2,085 1,203
Representing lease liabilities: Current 16 657 421 Non-current 19 1,428 782
2,085 1,203 The present value of finance lease liabilities is as follows:
Within one year 763 469 Later than one year but not later than five years 1,558 820
Minimum lease payments 2,321 1,289
29. Related party transactions
(a) Parent entities
The parent entity within the Group is Pacific Environment Limited.
(b) Subsidiaries
Interests in subsidiaries are set out in note 31.
(c) Key management personnel
Disclosures relating to key management personnel are set out in note 25.
Pacific Environment Limited Annual Report 2015 87Notes to Financial Statements
For
per
sona
l use
onl
y

(d) Transactions with other related parties
The following transactions occurred with other related parties:
Consolidated Group
2015 $’000
2014 $’000
Purchases of services
Consultancy services – ROKZair Pty Ltd 400 407 Consultancy services – DG Capital Partners 96 80 Design & photography services – Alex Ormerod Photography 106 33
Consultancy services - MC Consultancy Pty Limited 30 -
Marketing services - Ian Edgehill 56 5
Other transactions
Interest paid on convertible loan – R Ormerod 169 198 Partial conversion of convertible note 540 -
Transactions between related parties are on normal commercial terms and conditions no more favourable than those available to other parties, unless otherwise stated.
(e) Outstanding balances arising from transactions with other related parties
The following balances are outstanding at the reporting date in relation to transactions with other related parties:
2015 $’000
2014 $’000
Current payables
Purchase of services 51 46
(f) Loans to / from related parties 2015
$’000 2014
$’000
Loans to related parties Beginning of the year 20 27 Loans advanced - - Loan written-off (20) (7)
End of the year - 20
Loans from related parties Beginning of the year 6 7 Loan written-off (6) (1)
End of the year - 6
There is no allowance account for impaired receivables in relation to any outstanding balances from related parties. During the year $20,000 expense has been recognised in respect of impaired receivables due from related parties (2014: $7,000).
(g) Borrowings from related parties
Consolidated Group
2015 $’000
2014 $’000
Beginning of the year 1,750 1,733 Loans repaid (540) - Other 17 17
End of the year 1,227 1,750
30. Business combinations (a) Acquisition of Business – DLA Environmental Services
On 1 October 2014, DLA Environmental Services Pty Ltd, a wholly owned subsidiary of Pacific Environment Limited, acquired the assets of DLA Environmental (DLA) as a going concern.
Purchase consideration: Fair value
$’000
- Cash 1,021 - Deferred consideration (i) 1,435 2,456 Less: Property, plant and equipment 101 Employee benefits (82)
Identifiable assets acquired and liabilities assumed 19
Goodwill (ii) 2,437
(i) The consideration paid to acquire DLA consists of deferred payments if maintainable profits targets are met. Subject to the profit targets being met, the additional consideration is due to be paid on 14 November 2015 and 14 November 2016.
Included in current trade and other payables
Amount due 14 November 2015 $827,000 Discounted value $827,000 Included in non-current trade and other payables
Amount due 14 November 2016 $827,000 Discounted value $608,000 A discount rate of 14.45% was applied to determine the present value of the deferred consideration at the date of acquisition. As such, a $1,435,000 deferred consideration has been recognised as part of the consideration transferred to acquire DLA.
(ii) The goodwill is attributable to the profitability of the acquired business and the significant synergies expected to arise after the Group’s acquisition of DLA. No amount of the goodwill is deductible for tax purposes.
Notes to Financial Statements Pacific Environment Limited Annual Report 201588
For
per
sona
l use
onl
y

(g) Borrowings from related parties
Consolidated Group
2015 $’000
2014 $’000
Beginning of the year 1,750 1,733 Loans repaid (540) - Other 17 17
End of the year 1,227 1,750
30. Business combinations (a) Acquisition of Business – DLA Environmental Services
On 1 October 2014, DLA Environmental Services Pty Ltd, a wholly owned subsidiary of Pacific Environment Limited, acquired the assets of DLA Environmental (DLA) as a going concern.
Purchase consideration: Fair value
$’000
- Cash 1,021 - Deferred consideration (i) 1,435 2,456 Less: Property, plant and equipment 101 Employee benefits (82)
Identifiable assets acquired and liabilities assumed 19
Goodwill (ii) 2,437
(i) The consideration paid to acquire DLA consists of deferred payments if maintainable profits targets are met. Subject to the profit targets being met, the additional consideration is due to be paid on 14 November 2015 and 14 November 2016.
Included in current trade and other payables
Amount due 14 November 2015 $827,000 Discounted value $827,000 Included in non-current trade and other payables
Amount due 14 November 2016 $827,000 Discounted value $608,000 A discount rate of 14.45% was applied to determine the present value of the deferred consideration at the date of acquisition. As such, a $1,435,000 deferred consideration has been recognised as part of the consideration transferred to acquire DLA.
(ii) The goodwill is attributable to the profitability of the acquired business and the significant synergies expected to arise after the Group’s acquisition of DLA. No amount of the goodwill is deductible for tax purposes.
Pacific Environment Limited Annual Report 2015 89Notes to Financial Statements
For
per
sona
l use
onl
y

Revenue of DLA included in the consolidated revenue of the Group since acquisition date on 1 October 2014 amounted to $3,612,000. Profit of DLA included in consolidated profit of the Group since the acquisition date amounted to $725,000. It is impractical to provide an estimate of the revenues and profit for the previous year including the DLA business unit as the acquisition was an asset purchase only from a non-reporting entity and as such significant estimates of amounts would be required.
Included within expenses in the statement of profit or loss are acquisition-related costs totaling $102,000. The costs include advisory, legal, accounting and other professional fees.
(b) Acquisition of Business – Waste Solutions Australia
On 1 May 2014, Pacific Environment Operations Pty Ltd acquired the assets of Waste Solutions Australia (WSA) as a going concern.
Fair value
$000’s Purchase consideration: - Cash 220
- Deferred consideration (i) 278
498 Less:
Property, plant and equipment 63
Employee benefits (42)
Identifiable assets acquired and liabilities assumed 21
Goodwill (ii) 477
(i) The consideration paid to acquire WSA consists of deferred payments if maintainable profits targets are met.
In May 2015, a payment of $50,000 was made in relation to the first deferred payment. The difference between the estimated first payment of $117,000 and the actual first payment was an adjustment to goodwill.
Subject to the profit targets being met, the additional consideration is due to be paid on 31 May 2016 and 31 May 2017.
Included in current trade and other payables Amount due 31 May 2016 $117,000 Discounted value $117,000 Included in non-current trade and other payables Amount due 31 May 2017 $117,000 Discounted value $ 86,000
A discount rate of 14.54% was applied to determine the present value of the deferred consideration at the date of acquisition.
As such, a $203,000 deferred consideration has been recognised as part of the consideration transferred to acquire WSA.
(ii) The goodwill is attributable to the profitability of the acquired business and the significant synergies expected to arise after the Group’s acquisition of WSA. No amount of the goodwill is deductible for tax purposes.
31. Controlled Entities
(a) Information about Controlled Entities
Percentage Owned ($) *
Controlled Entities Consolidated Note Country of incorporation
2015 %
2014 %
Parent Entity Pacific Environment Limited Australia 100 100 Subsidiaries of Pacific Environment Limited Pacific Environment Operations Pty Ltd Australia 100 100 Pacific Environment Holdings Pty Ltd Australia 100 100 DLA Environmental Services Pty Ltd Australia 100 100 Pacific Environment Monitoring Pty Ltd (i) Australia 100 100 Toxikos Pty Ltd (i) Australia 100 100 Pacific Air & Environment Pty Ltd (i) Australia 0 100 Ecovision Holdings Pty Ltd (i) Australia 0 100 Karpelo Holdings Pty Ltd (i) Australia 0 100 Subsidiaries of Ecovision Holdings Pty Ltd Ecovision Solutions Pty Ltd (i) Australia 0 100 Ecovision Operations Pty Ltd (i) Australia 0 100 Other Ecovision Systems Unit Trust (ii) Australia 0 100
* Percentage of voting power in proportion to ownership
Subsidiary financial statements used in the preparation of these consolidated financial statements have also been prepared as at the same reporting date as the Group’s financial statements.
(i) Controlled entities with ownership interest of 100%
Pacific Air & Environment Pty Ltd, Ecovision Holdings Pty Ltd, Karpelo Holdings Pty Ltd, Ecovision Solutions Pty Ltd and Ecovision Operations Pty Ltd were deregistered as at 30 June 2014.
During 2014 the business activities transacted through Pacific Environment Monitoring Pty Ltd and Toxikos Pty Ltd were transferred to Pacific Environment Operations Pty Ltd as part of a rationalisation of legal entities within the consolidated group.
Pacific Environment Monitoring Pty Ltd and Toxikos Pty Ltd have applied to ASIC for voluntary deregistration and ASIC strike off action is currently in process. As the entities operated during the year ended 30 June 2015 their transactions/balances are included in the 30 June 2015 financial statements.
(ii) Dissolution of Unit Trust
On 14 November 2012, Application for Voluntary Deregistration of a Company was made by Ecovision Systems Pty Ltd. The company was deregistered by ASIC on 16 January 2013. Ecovision Systems Pty ltd was the trustee of the Ecovision Systems Unit Trust. The Unit Trust has been dissolved and had nil operating activity for the year ended 30 June 2014 or subsequently.
Notes to Financial Statements Pacific Environment Limited Annual Report 201590
For
per
sona
l use
onl
y

31. Controlled Entities
(a) Information about Controlled Entities
Percentage Owned ($) *
Controlled Entities Consolidated Note Country of incorporation
2015 %
2014 %
Parent Entity Pacific Environment Limited Australia 100 100 Subsidiaries of Pacific Environment Limited Pacific Environment Operations Pty Ltd Australia 100 100 Pacific Environment Holdings Pty Ltd Australia 100 100 DLA Environmental Services Pty Ltd Australia 100 100 Pacific Environment Monitoring Pty Ltd (i) Australia 100 100 Toxikos Pty Ltd (i) Australia 100 100 Pacific Air & Environment Pty Ltd (i) Australia 0 100 Ecovision Holdings Pty Ltd (i) Australia 0 100 Karpelo Holdings Pty Ltd (i) Australia 0 100 Subsidiaries of Ecovision Holdings Pty Ltd Ecovision Solutions Pty Ltd (i) Australia 0 100 Ecovision Operations Pty Ltd (i) Australia 0 100 Other Ecovision Systems Unit Trust (ii) Australia 0 100
* Percentage of voting power in proportion to ownership
Subsidiary financial statements used in the preparation of these consolidated financial statements have also been prepared as at the same reporting date as the Group’s financial statements.
(i) Controlled entities with ownership interest of 100%
Pacific Air & Environment Pty Ltd, Ecovision Holdings Pty Ltd, Karpelo Holdings Pty Ltd, Ecovision Solutions Pty Ltd and Ecovision Operations Pty Ltd were deregistered as at 30 June 2014.
During 2014 the business activities transacted through Pacific Environment Monitoring Pty Ltd and Toxikos Pty Ltd were transferred to Pacific Environment Operations Pty Ltd as part of a rationalisation of legal entities within the consolidated group.
Pacific Environment Monitoring Pty Ltd and Toxikos Pty Ltd have applied to ASIC for voluntary deregistration and ASIC strike off action is currently in process. As the entities operated during the year ended 30 June 2015 their transactions/balances are included in the 30 June 2015 financial statements.
(ii) Dissolution of Unit Trust
On 14 November 2012, Application for Voluntary Deregistration of a Company was made by Ecovision Systems Pty Ltd. The company was deregistered by ASIC on 16 January 2013. Ecovision Systems Pty ltd was the trustee of the Ecovision Systems Unit Trust. The Unit Trust has been dissolved and had nil operating activity for the year ended 30 June 2014 or subsequently.
Pacific Environment Limited Annual Report 2015 91Notes to Financial Statements
For
per
sona
l use
onl
y
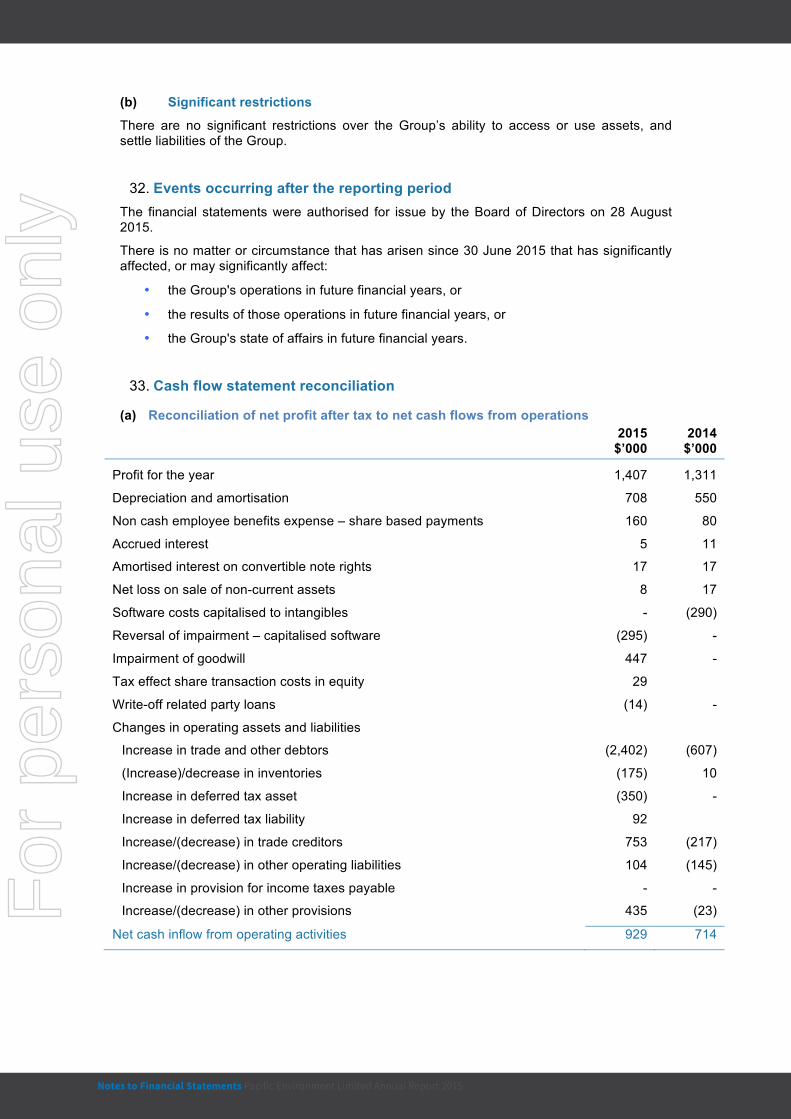
(b) Significant restrictions
There are no significant restrictions over the Group’s ability to access or use assets, and settle liabilities of the Group.
32. Events occurring after the reporting period The financial statements were authorised for issue by the Board of Directors on 28 August 2015.
There is no matter or circumstance that has arisen since 30 June 2015 that has significantly affected, or may significantly affect:
• the Group's operations in future financial years, or
• the results of those operations in future financial years, or
• the Group's state of affairs in future financial years.
33. Cash flow statement reconciliation
(a) Reconciliation of net profit after tax to net cash flows from operations
2015 $’000
2014 $’000
Profit for the year 1,407 1,311
Depreciation and amortisation 708 550
Non cash employee benefits expense – share based payments 160 80
Accrued interest 5 11
Amortised interest on convertible note rights 17 17
Net loss on sale of non-current assets 8 17
Software costs capitalised to intangibles - (290)
Reversal of impairment – capitalised software (295) -
Impairment of goodwill 447 -
Tax effect share transaction costs in equity 29
Write-off related party loans (14) -
Changes in operating assets and liabilities
Increase in trade and other debtors (2,402) (607)
(Increase)/decrease in inventories (175) 10
Increase in deferred tax asset (350) -
Increase in deferred tax liability 92
Increase/(decrease) in trade creditors 753 (217)
Increase/(decrease) in other operating liabilities 104 (145)
Increase in provision for income taxes payable - -
Increase/(decrease) in other provisions 435 (23)
Net cash inflow from operating activities 929 714
(b) Non-cash financing and investing activities
(i) Share issues
During the year ended 30 June 2015, 16,024,000 ordinary shares to the value of $540,000 were issued as partial conversion of the convertible note at 3 cents per share. During the year ended 30 June 2014, 500,000 ordinary shares to the value of $40,000 were issued to a former employee at 8 cents per share.
(ii) Finance leases
During the year the Group acquired plant and equipment with an aggregate value of $1,201,000 (2014: $974,000) by means of finance leases. These acquisitions are not reflected in the statement of cash flows.
(iii) Credit standing arrangements with banks
2015 $’000
2014 $’000
Credit facility 6,212 3,450
Amount used 2,819 1,422
Undrawn facility 3,393 2,028
On 4 March 2014, the Group secured a $2,600,000 financing facility with Australia and New Zealand Banking Group Limited, incorporating facilities for lease financing, overdrafts, standby letters of credit, an electronic payway facility and a commercial card facility. The unutilised debtor financing facility with Bank of Queensland was cancelled on the same date.
On 20 June 2014, the ANZ facility was increased to $3,450,000 incorporating an increase to the lease financing facility and a new tailored commercial facility. The increased facilities are a lease financing facility of $1,600,000, an overdraft facility of $500,000, a standby letter of credit facility of $500,000, an electronic payway facility of $500,000, a commercial card facility of $100,000 and a tailored commercial facility of $250,000.
During 2015, the ANZ facility was increased to $6,211,600 incorporating an increase to the lease financing facility and a new tailed commercial facility for the acquisition of the DLA Environmental Services business. The facilities are now an asset financing facility of $3,100,000, a group overdraft facility of $750,000, a standby letter of credit facility of $500,000, an electronic payway facility of $1,000,000, a commercial card facility of $100,000 and a tailored commercial facility of $761,600.
34. Earnings / (losses) per share
(a) Basic earnings / (losses) per share 2015
cents 2014
cents Basic earnings / (losses) per share attributable to the ordinary equity holders of the Company
From continuing operations 1.7 1.3 From discontinued operations (0.4) -
(b) Diluted earnings / (losses) per share
The diluted earnings / (losses) per share is equal to the basic earnings / (losses) per share, as per AASB 131.
Notes to Financial Statements Pacific Environment Limited Annual Report 201592
For
per
sona
l use
onl
y

(b) Non-cash financing and investing activities
(i) Share issues
During the year ended 30 June 2015, 16,024,000 ordinary shares to the value of $540,000 were issued as partial conversion of the convertible note at 3 cents per share. During the year ended 30 June 2014, 500,000 ordinary shares to the value of $40,000 were issued to a former employee at 8 cents per share.
(ii) Finance leases
During the year the Group acquired plant and equipment with an aggregate value of $1,201,000 (2014: $974,000) by means of finance leases. These acquisitions are not reflected in the statement of cash flows.
(iii) Credit standing arrangements with banks
2015 $’000
2014 $’000
Credit facility 6,212 3,450
Amount used 2,819 1,422
Undrawn facility 3,393 2,028
On 4 March 2014, the Group secured a $2,600,000 financing facility with Australia and New Zealand Banking Group Limited, incorporating facilities for lease financing, overdrafts, standby letters of credit, an electronic payway facility and a commercial card facility. The unutilised debtor financing facility with Bank of Queensland was cancelled on the same date.
On 20 June 2014, the ANZ facility was increased to $3,450,000 incorporating an increase to the lease financing facility and a new tailored commercial facility. The increased facilities are a lease financing facility of $1,600,000, an overdraft facility of $500,000, a standby letter of credit facility of $500,000, an electronic payway facility of $500,000, a commercial card facility of $100,000 and a tailored commercial facility of $250,000.
During 2015, the ANZ facility was increased to $6,211,600 incorporating an increase to the lease financing facility and a new tailed commercial facility for the acquisition of the DLA Environmental Services business. The facilities are now an asset financing facility of $3,100,000, a group overdraft facility of $750,000, a standby letter of credit facility of $500,000, an electronic payway facility of $1,000,000, a commercial card facility of $100,000 and a tailored commercial facility of $761,600.
34. Earnings / (losses) per share
(a) Basic earnings / (losses) per share 2015
cents 2014
cents Basic earnings / (losses) per share attributable to the ordinary equity holders of the Company
From continuing operations 1.7 1.3 From discontinued operations (0.4) -
(b) Diluted earnings / (losses) per share
The diluted earnings / (losses) per share is equal to the basic earnings / (losses) per share, as per AASB 131.
Pacific Environment Limited Annual Report 2015 93Notes to Financial Statements
For
per
sona
l use
onl
y

(c) Reconciliation of earnings used in calculating earnings / (losses) per share 2015
$’000 2014
$’000 Benefits/(losses) attributable to the ordinary equity holders of the Company used in calculating basic earnings / (losses) per share
From continuing operations 1,822 1,277 From discontinued operations (415) 34
(d) Weighted average number of shares used as the denominator
2015 Number
2014 Number
Weighted average number of ordinary shares used as the denominator in calculating basic earnings/(losses) per share 110,343,716 98,992,235
(e) Information concerning the classification of securities
(i) Options
Options granted to employees under the Pacific Environment Limited Employee Share Option Plan are not considered to be potential ordinary shares, as including such securities in the calculation would result in a decreased earnings per share. The options have not been included in the determination of basic earnings per share.
(ii) Convertible instruments
Convertible instruments issued are not considered to be potential ordinary shares, as including such securities in the calculation would result in a decreased earnings per share. The instruments have not been included in the determination of basic earnings per share.
35. Share based payments
(a) Employee share option plan
The establishment of the Pacific Environment Limited Employee Share Option Plan was approved by the Board prior to the IPO of Pacific Environment Limited. The plan is designed to provide long term incentives for employees and executive directors to deliver long term shareholder returns. Participation in the plan is at the Board's discretion and no individual has a contractual right to participate in the plan or to receive any guaranteed benefits.
The amount of options that will vest depends on the individual contracts agreed by Pacific Environment Limited. Once vested, the options remain exercisable for a period of up to ten years after the grant date. When exercisable, each option is convertible into one ordinary share on the day of the next Board meeting or within 15 business days, whichever is earlier. The exercise price of options is pre-determined in the individual option agreements.
(b) Executive share option scheme
In April 2013, options were issued to employees under the Pacific Environment Limited Executive Share Option Scheme. Under this scheme, options granted vest equally over four years, at 25% per year on each anniversary of the grant date. The options are not forfeitable but lapse after five years. If an employee ceases employment the options vest immediately and the employee has seven days to exercise the option at the current market price or the original exercise price, whichever is greater. If the employee does not exercise the options, the options lapse.
Set out on the following pages are summaries of options granted.
Notes to Financial Statements Pacific Environment Limited Annual Report 201594
For
per
sona
l use
onl
y
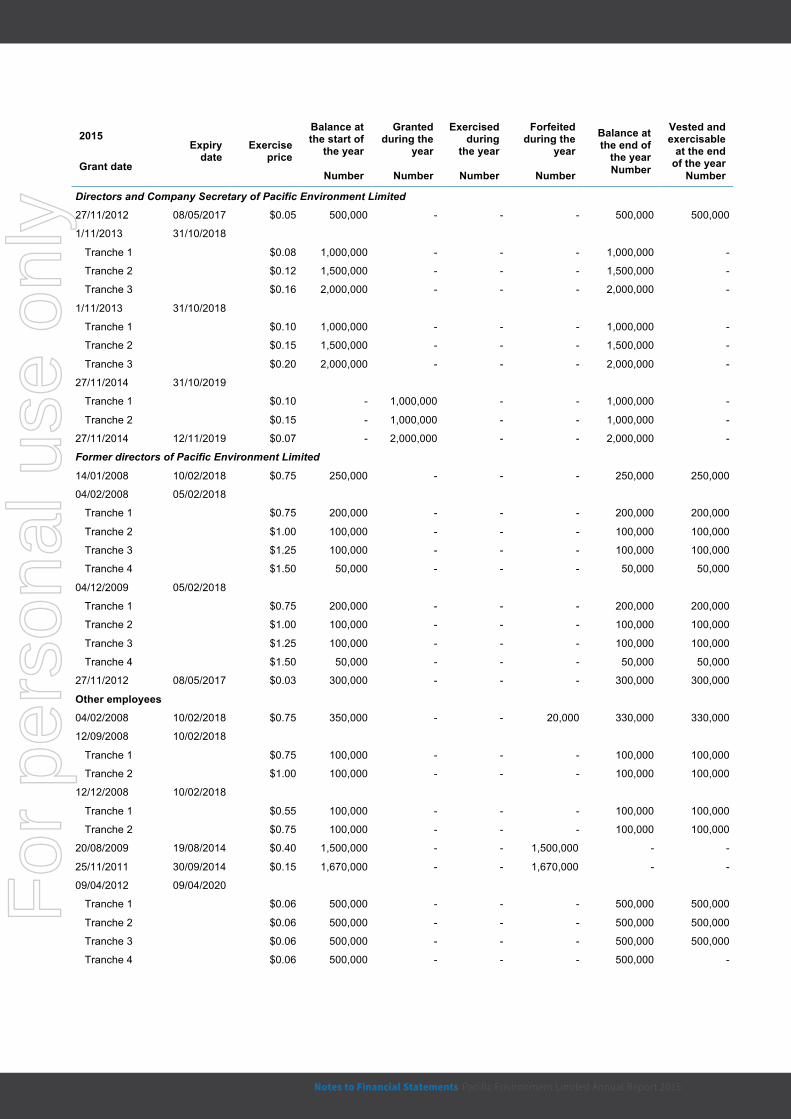
2015
Grant date
Expiry date
Exercise price
Balance at the start of
the year
Number
Granted during the
year
Number
Exercised during
the year
Number
Forfeited during the
year
Number
Balance at the end of
the year Number
Vested and exercisable
at the end of the year
Number
Directors and Company Secretary of Pacific Environment Limited
27/11/2012 08/05/2017 $0.05 500,000 - - - 500,000 500,000
1/11/2013 31/10/2018
Tranche 1 $0.08 1,000,000 - - - 1,000,000 -
Tranche 2 $0.12 1,500,000 - - - 1,500,000 -
Tranche 3 $0.16 2,000,000 - - - 2,000,000 -
1/11/2013 31/10/2018
Tranche 1 $0.10 1,000,000 - - - 1,000,000 -
Tranche 2 $0.15 1,500,000 - - - 1,500,000 -
Tranche 3 $0.20 2,000,000 - - - 2,000,000 -
27/11/2014 31/10/2019
Tranche 1 $0.10 - 1,000,000 - - 1,000,000 -
Tranche 2 $0.15 - 1,000,000 - - 1,000,000 -
27/11/2014 12/11/2019 $0.07 - 2,000,000 - - 2,000,000 -
Former directors of Pacific Environment Limited
14/01/2008 10/02/2018 $0.75 250,000 - - - 250,000 250,000
04/02/2008 05/02/2018
Tranche 1 $0.75 200,000 - - - 200,000 200,000
Tranche 2 $1.00 100,000 - - - 100,000 100,000
Tranche 3 $1.25 100,000 - - - 100,000 100,000
Tranche 4 $1.50 50,000 - - - 50,000 50,000
04/12/2009 05/02/2018
Tranche 1 $0.75 200,000 - - - 200,000 200,000
Tranche 2 $1.00 100,000 - - - 100,000 100,000
Tranche 3 $1.25 100,000 - - - 100,000 100,000
Tranche 4 $1.50 50,000 - - - 50,000 50,000
27/11/2012 08/05/2017 $0.03 300,000 - - - 300,000 300,000
Other employees
04/02/2008 10/02/2018 $0.75 350,000 - - 20,000 330,000 330,000
12/09/2008 10/02/2018
Tranche 1 $0.75 100,000 - - - 100,000 100,000
Tranche 2 $1.00 100,000 - - - 100,000 100,000
12/12/2008 10/02/2018
Tranche 1 $0.55 100,000 - - - 100,000 100,000
Tranche 2 $0.75 100,000 - - - 100,000 100,000
20/08/2009 19/08/2014 $0.40 1,500,000 - - 1,500,000 - -
25/11/2011 30/09/2014 $0.15 1,670,000 - - 1,670,000 - -
09/04/2012 09/04/2020
Tranche 1 $0.06 500,000 - - - 500,000 500,000
Tranche 2 $0.06 500,000 - - - 500,000 500,000
Tranche 3 $0.06 500,000 - - - 500,000 500,000
Tranche 4 $0.06 500,000 - - - 500,000 -
Pacific Environment Limited Annual Report 2015 95Notes to Financial Statements
For
per
sona
l use
onl
y

2015
Grant date
Expiry date
Exercise price
Balance at the start of
the year
Number
Granted during the
year
Number
Exercised during the
year
Number
Forfeited during the
year
Number
Balance at the end of
the year Number
Vested and exercisable
at the end of the year
Number 12/11/2012 12/11/2018
Tranche 1 $0.03 1,666,667 - - - 1,666,667 1,666,667
Tranche 2 $0.03 1,666,667 - - - 1,666,667 1,666,667
Tranche 3 $0.03 1,666,666 - - - 1,666,666 -
12/11/2012 12/11/2020
Tranche 1 $0.05 500,000 - - - 500,000 500,000
Tranche 2 $0.05 500,000 - - - 500,000 500,000
01/04/2013 19/04/2018
Tranche 1 $0.06 2,000,000 - 437,500 275,000 1,287,500 1,287,500
Tranche 2 $0.06 2,000,000 - 437,500 275,000 1,287,500 1,287,500
Tranche 3 $0.06 2,000,000 - - 275,000 1,725,000 -
Tranche 4 $0.06 2,000,000 - - 275,000 1,725,000 -
01/04/2014 04/02/2021
Tranche 1 $0.09 - 500,000 - - 500,000 -
Tranche 2 $0.09 - 500,000 - - 500,000 -
Tranche 3 $0.09 - 500,000 - - 500,000 -
Tranche 4 $0.09 - 500,000 - - 500,000 -
14/07/2014 04/02/2021
Tranche 1 $0.09 - 200,000 - - 200,000 -
Tranche 2 $0.09 - 200,000 - - 200,000 -
Tranche 3 $0.09 - 200,000 - - 200,000 -
Tranche 4 $0.09 - 200,000 - - 200,000 -
04/02/2015 04/02/2021
Tranche 1 $0.11 - 1,337,500 - - 1,337,500 -
Tranche 2 $0.11 - 1,337,500 - - 1,337,500 -
Tranche 3 $0.11 - 1,337,500 - - 1,337,500 -
Tranche 4 $0.11 - 1,337,500 - - 1,337,500 -
Total 30,620,000 12,150,000 875,000 4,290,000 37,605,000 10,838,334
Weighted average exercise price $0.14 $0.10 $0.06 $0.22 $0.12 $0.17
2014
Grant date Expiry date Exercise
price
Balance at the start of
the year
Number
Granted during the
year
Number
Exercised during the
year
Number
Forfeited during the
year
Number
Balance at the end of
the year Number
Vested and exercisable
at the end of the year Number
Directors and Company Secretary of Pacific Environment Limited
27/11/2012 08/05/2017 $0.05 500,000 - - - 500,000 500,000
1/11/2013 31/10/2018
Tranche 1 $0.08 - 1,000,000 - - 1,000,000 -
Tranche 2 $0.12 - 1,500,000 - - 1,500,000 -
Tranche 3 $0.16 - 2,000,000 - - 2,000,000 -
1/11/2013 31/10/2018
Tranche 1 $0.10 - 1,000,000 - - 1,000,000 -
Tranche 2 $0.15 - 1,500,000 - - 1,500,000 -
Tranche 3 $0.20 - 2,000,000 - - 2,000,000 -
2014
Grant date Expiry date Exercise
price
Balance at the start of
the year
Number
Granted during the
year
Number
Exercised during the
year
Number
Forfeited during the
year
Number
Balance at the end of
the year Number
Vested and exercisable
at the end of the year Number
Former directors of Pacific Environment Limited
14/01/2008 10/02/2018 $0.75 250,000 - - - 250,000 250,000
04/02/2008 05/02/2018
Tranche 1 $0.75 200,000 - - - 200,000 200,000
Tranche 2 $1.00 100,000 - - - 100,000 100,000
Tranche 3 $1.25 100,000 - - - 100,000 100,000
Tranche 4 $1.50 50,000 - - - 50,000 50,000
04/12/2009 05/02/2018
Tranche 1 $0.75 50,000 - - - 50,000 50,000
Tranche 2 $1.00 50,000 - - - 50,000 50,000
Tranche 3 $1.25 50,000 - - - 50,000 50,000
Tranche 4 $1.50 50,000 - - - 50,000 50,000
27/11/2012 08/05/2017 $0.03 300,000 - - - 300,000 300,000
Other employees
04/02/2008 10/02/2018 $0.75 350,000 - - - 350,000 350,000
12/09/2008 10/02/2018
Tranche 1 $0.75 100,000 - - - 100,000 100,000
Tranche 2 $1.00 100,000 - - - 100,000 100,000
12/12/2008 10/02/2018
Tranche 1 $0.55 100,000 - - - 100,000 100,000
Tranche 2 $0.75 100,000 - - - 100,000 100,000
04/12/2009 31/12/2013 $0.40 150,000 - - 150,000 - -
20/08/2009 19/08/2014 $0.40 1,500,000 - - - 1,500,000 1,500,000
25/11/2011 30/09/2014 $0.15 1,670,000 - - - 1,670,000 1,670,000
09/04/2012 09/04/2020
Tranche 1 $0.06 500,000 - - - 500,000 500,000
Tranche 2 $0.06 500,000 - - - 500,000 500,000
Tranche 3 $0.06 500,000 - - - 500,000 -
Tranche 4 $0.06 500,000 - - - 500,000 -
12/11/2012 12/11/2018
Tranche 1 $0.03 1,666,667 - - - 1,666,667 1,666,667
Tranche 2 $0.03 1,666,667 - - - 1,666,667 -
Tranche 3 $0.03 1,666,666 - - - 1,666,666 -
12/11/2012 12/11/2020
Tranche 1 $0.05 500,000 - - - 500,000 500,000
Tranche 2 $0.05 500,000 - - - 500,000 -
01/04/2013 19/04/2018
Tranche 1 $0.06 2,125,000 - - 125,000 2,000,000 2,000,000
Tranche 2 $0.06 2,125,000 - - 125,000 2,000,000 -
Tranche 3 $0.06 2,125,000 - - 125,000 2,000,000 -
Tranche 4 $0.06 2,125,000 - - 125,000 2,000,000 -
Total 22,270,000 9,000,000 - 650,000 30,620,000 10,786,667 Weighted average exercise price $0.14 $0.15 - $0.14 $0.14 $0.24
The weighted average remaining contractual life of share options outstanding at the end of the period was 3.93 years (2014: 3.86 years).
Notes to Financial Statements Pacific Environment Limited Annual Report 201596
For
per
sona
l use
onl
y

2014
Grant date Expiry date Exercise
price
Balance at the start of
the year
Number
Granted during the
year
Number
Exercised during the
year
Number
Forfeited during the
year
Number
Balance at the end of
the year Number
Vested and exercisable
at the end of the year Number
Former directors of Pacific Environment Limited
14/01/2008 10/02/2018 $0.75 250,000 - - - 250,000 250,000
04/02/2008 05/02/2018
Tranche 1 $0.75 200,000 - - - 200,000 200,000
Tranche 2 $1.00 100,000 - - - 100,000 100,000
Tranche 3 $1.25 100,000 - - - 100,000 100,000
Tranche 4 $1.50 50,000 - - - 50,000 50,000
04/12/2009 05/02/2018
Tranche 1 $0.75 50,000 - - - 50,000 50,000
Tranche 2 $1.00 50,000 - - - 50,000 50,000
Tranche 3 $1.25 50,000 - - - 50,000 50,000
Tranche 4 $1.50 50,000 - - - 50,000 50,000
27/11/2012 08/05/2017 $0.03 300,000 - - - 300,000 300,000
Other employees
04/02/2008 10/02/2018 $0.75 350,000 - - - 350,000 350,000
12/09/2008 10/02/2018
Tranche 1 $0.75 100,000 - - - 100,000 100,000
Tranche 2 $1.00 100,000 - - - 100,000 100,000
12/12/2008 10/02/2018
Tranche 1 $0.55 100,000 - - - 100,000 100,000
Tranche 2 $0.75 100,000 - - - 100,000 100,000
04/12/2009 31/12/2013 $0.40 150,000 - - 150,000 - -
20/08/2009 19/08/2014 $0.40 1,500,000 - - - 1,500,000 1,500,000
25/11/2011 30/09/2014 $0.15 1,670,000 - - - 1,670,000 1,670,000
09/04/2012 09/04/2020
Tranche 1 $0.06 500,000 - - - 500,000 500,000
Tranche 2 $0.06 500,000 - - - 500,000 500,000
Tranche 3 $0.06 500,000 - - - 500,000 -
Tranche 4 $0.06 500,000 - - - 500,000 -
12/11/2012 12/11/2018
Tranche 1 $0.03 1,666,667 - - - 1,666,667 1,666,667
Tranche 2 $0.03 1,666,667 - - - 1,666,667 -
Tranche 3 $0.03 1,666,666 - - - 1,666,666 -
12/11/2012 12/11/2020
Tranche 1 $0.05 500,000 - - - 500,000 500,000
Tranche 2 $0.05 500,000 - - - 500,000 -
01/04/2013 19/04/2018
Tranche 1 $0.06 2,125,000 - - 125,000 2,000,000 2,000,000
Tranche 2 $0.06 2,125,000 - - 125,000 2,000,000 -
Tranche 3 $0.06 2,125,000 - - 125,000 2,000,000 -
Tranche 4 $0.06 2,125,000 - - 125,000 2,000,000 -
Total 22,270,000 9,000,000 - 650,000 30,620,000 10,786,667 Weighted average exercise price $0.14 $0.15 - $0.14 $0.14 $0.24
The weighted average remaining contractual life of share options outstanding at the end of the period was 3.93 years (2014: 3.86 years).
Pacific Environment Limited Annual Report 2015 97Notes to Financial Statements
For
per
sona
l use
onl
y

(i) Fair value of options granted
The assessed fair value at grant date of options granted is allocated equally over the period from the grant date to the vesting date. The fair value at grant date is independently determined using a Black Scholes option pricing model that takes into account the exercise price, the term of the option, the impact of dilution, the share price at grant date and expected price volatility of the underlying share, the expected dividend yield and the risk free interest rate for the term of the option.
During the year ended 30 June 2015, 4,000,000 options were issued to directors and 8,150,000 options were issued to employees. During the year ended 30 June 2014, 9,000,000 options were issued to directors.
(c) Shares issued to employees - value of services
On 9 October 2013, 500,000 ordinary shares were issued by the Company to a former employee for no cash consideration in recognition of service to the Company. The fair value of the shares issued, determined by reference to the market price was $40,000 or 8 cents per share.
(d) Expenses arising from share based payment transactions
Total expenses arising from share based payment transactions recognised during the period as part of employee benefit expense were as follows:
2015 $’000
2014 $’000
Options issued under employee share option plan 62 40 Shares issued to employees – value of services - 40 Shares to be issued to employees – value of services 98 -
Total purchase consideration 160 80
(e) Liabilities arising from share based payment transactions
Total payables at reporting date arising from share based payment transactions are as follows:
2015 $’000
2014 $’000
Shares to be issued to employees – value of services - -
36. Parent entity financial information
The following information has been extracted from the books and records of the parent entity and has been prepared in accordance with Australian Accounting Standards.
(a) Statement of financial position
2015 $’000
2014 $’000
Assets Current assets 1,619 614 Non-current assets 7,051 28,014 Total assets 8,669 28,628 Liabilities Current liabilities 288 200 Non-current liabilities 1,417 27,684 Total liabilities 1,705 27,884 Equity Issued Capital 19,820 17,772 Reserves 503 343 Retained losses (13,359) (17,371) Total equity 6,964 744
Non-current assets and non-current liabilities in the parent entity include intercompany payables and receivables. Legacy balances in these intercompany accounts were written off during the period as part of the rationalisation of the Group’s legal entities, in accordance with Deeds of Forgiveness entered into between the relevant entities. There was no impact to the financial statements of the Consolidated Group as a result of these transactions.
(b) Statement of profit or loss and other comprehensive income
Profit / (Loss) for the year 3,923 163 Total comprehensive profit/(loss) for the year 3,923 163
(c) Guarantees entered into by the parent entity
The parent entity has given unsecured guarantees in respect of potential leases of subsidiaries amounting to $nil (2014: nil) in aggregate.
No liability has been recognised by the parent of the consolidated entity in relation to these financial guarantees as the guarantees are in the event that the subsidiary requires further leases.
(d) Contingent liabilities of the parent entity
The parent entity did not have any contingent liabilities as at 30 June 2015.
(e) Contractual commitments
At 30 June 2015, Pacific Environment Limited had not entered into any contractual commitments for the acquisition of property, plant and equipment (2014: Nil).
Notes to Financial Statements Pacific Environment Limited Annual Report 201598
For
per
sona
l use
onl
y

36. Parent entity financial information
The following information has been extracted from the books and records of the parent entity and has been prepared in accordance with Australian Accounting Standards.
(a) Statement of financial position
2015 $’000
2014 $’000
Assets Current assets 1,619 614 Non-current assets 7,051 28,014 Total assets 8,669 28,628 Liabilities Current liabilities 288 200 Non-current liabilities 1,417 27,684 Total liabilities 1,705 27,884 Equity Issued Capital 19,820 17,772 Reserves 503 343 Retained losses (13,359) (17,371) Total equity 6,964 744
Non-current assets and non-current liabilities in the parent entity include intercompany payables and receivables. Legacy balances in these intercompany accounts were written off during the period as part of the rationalisation of the Group’s legal entities, in accordance with Deeds of Forgiveness entered into between the relevant entities. There was no impact to the financial statements of the Consolidated Group as a result of these transactions.
(b) Statement of profit or loss and other comprehensive income
Profit / (Loss) for the year 3,923 163 Total comprehensive profit/(loss) for the year 3,923 163
(c) Guarantees entered into by the parent entity
The parent entity has given unsecured guarantees in respect of potential leases of subsidiaries amounting to $nil (2014: nil) in aggregate.
No liability has been recognised by the parent of the consolidated entity in relation to these financial guarantees as the guarantees are in the event that the subsidiary requires further leases.
(d) Contingent liabilities of the parent entity
The parent entity did not have any contingent liabilities as at 30 June 2015.
(e) Contractual commitments
At 30 June 2015, Pacific Environment Limited had not entered into any contractual commitments for the acquisition of property, plant and equipment (2014: Nil).
Pacific Environment Limited Annual Report 2015 99Notes to Financial Statements
For
per
sona
l use
onl
y

Directors’ Declaration FOR THE FINANCIAL YEAR ENDED 30 JUNE 2015
In accordance with a resolution of the directors of Pacific Environment Limited, the directors of the company declare that: (a) the financial statements and notes set out on pages 45 to 99 are in accordance with the
Corporations Act 2001, and:
(i) comply with Australian Accounting Standards, and
(ii) give a true and fair view of the financial position as at 30 June 2015 and of the performance for the year ended on that date of the Consolidated Group; and
(b) there are reasonable grounds to believe that the Company will be able to pay its debts as and when they become due and payable.
Murray d’Almeida Chairman Sydney
28 August 2015
Directors' Declaration Pacific Environment Limited Annual Report 2015100
For
per
sona
l use
onl
y

Directors’ Declaration FOR THE FINANCIAL YEAR ENDED 30 JUNE 2015
In accordance with a resolution of the directors of Pacific Environment Limited, the directors of the company declare that: (a) the financial statements and notes set out on pages 45 to 99 are in accordance with the
Corporations Act 2001, and:
(i) comply with Australian Accounting Standards, and
(ii) give a true and fair view of the financial position as at 30 June 2015 and of the performance for the year ended on that date of the Consolidated Group; and
(b) there are reasonable grounds to believe that the Company will be able to pay its debts as and when they become due and payable.
Murray d’Almeida Chairman Sydney
28 August 2015
This page was intentionally left blank
For
per
sona
l use
onl
y

PACIFIC ENVIRONMENT LIMITED ABN 42 122 919 948 AND CONTROLLED ENTITIES
INDEPENDENT AUDITOR’S REPORT
TO THE MEMBERS OF PACIFIC ENVIRONMENT LIMITED Report on the Financial Report We have audited the accompanying financial report of Pacific Environment Limited (the entity), which comprises the consolidated statement of financial position as at 30 June 2015, the consolidated statement of profit or loss and other comprehensive income, the consolidated statement of changes in equity and the consolidated statement of cash flows for the year then ended, notes comprising a summary of significant accounting policies and other explanatory information and the directors’ declaration of the consolidated entity comprising the company and the entities it controlled at the year’s end or from time to time during the financial year.
Directors' Responsibility for the Financial Report The directors of the company are responsible for the preparation of the financial report that gives a true and fair view in accordance with Australian Accounting Standards and the Corporations Act 2001 and for such internal control as the directors determine is necessary to enable the preparation of the financial report that is free from material misstatement, whether due to fraud or error. Auditor's Responsibility Our responsibility is to express an opinion on the financial report based on our audit. We conducted our audit in accordance with Australian Auditing Standards. Those standards require that we comply with relevant ethical requirements relating to audit engagements and plan and perform the audit to obtain reasonable assurance whether the financial report is free from material misstatement. An audit involves performing procedures to obtain audit evidence about the amounts and disclosures in the financial report. The procedures selected depend on the auditor's judgment, including the assessment of the risks of material misstatement of the financial report, whether due to fraud or error. In making those risk assessments, the auditor considers internal control relevant to the entity's preparation and fair presentation of the financial report in order to design audit procedures that are appropriate in the circumstances, but not for the purpose of expressing an opinion on the effectiveness of the entity's internal control. An audit also includes evaluating the appropriateness of accounting policies used and the reasonableness of accounting estimates made by the directors, as well as evaluating the overall presentation of the financial report. We believe that the audit evidence we have obtained is sufficient and appropriate to provide a basis for our audit opinion. Matters Relating to the Electronic Presentation of the Audited Financial Report This auditor’s report relates to the financial report of Pacific Environment Limited for the year ended 30 June 2015, intended to be included on the entity's website. The entity's directors are responsible for the integrity of the entity's website. We have not been engaged to report on the integrity of the entity's website. The auditor’s report refers only to the statements named above. It does not provide an opinion on any other information which may have been hyperlinked to/from these statements. If users of this report are concerned with the inherent risks arising from electronic data communications they are advised to refer to the hard copy of the audited financial report to confirm the information included in the audited financial report presented on the website.
102
For
per
sona
l use
onl
y

PACIFIC ENVIRONMENT LIMITED ABN 42 122 919 948 AND CONTROLLED ENTITIES
INDEPENDENT AUDITOR’S REPORT
TO THE MEMBERS OF PACIFIC ENVIRONMENT LIMITED Report on the Financial Report We have audited the accompanying financial report of Pacific Environment Limited (the entity), which comprises the consolidated statement of financial position as at 30 June 2015, the consolidated statement of profit or loss and other comprehensive income, the consolidated statement of changes in equity and the consolidated statement of cash flows for the year then ended, notes comprising a summary of significant accounting policies and other explanatory information and the directors’ declaration of the consolidated entity comprising the company and the entities it controlled at the year’s end or from time to time during the financial year.
Directors' Responsibility for the Financial Report The directors of the company are responsible for the preparation of the financial report that gives a true and fair view in accordance with Australian Accounting Standards and the Corporations Act 2001 and for such internal control as the directors determine is necessary to enable the preparation of the financial report that is free from material misstatement, whether due to fraud or error. Auditor's Responsibility Our responsibility is to express an opinion on the financial report based on our audit. We conducted our audit in accordance with Australian Auditing Standards. Those standards require that we comply with relevant ethical requirements relating to audit engagements and plan and perform the audit to obtain reasonable assurance whether the financial report is free from material misstatement. An audit involves performing procedures to obtain audit evidence about the amounts and disclosures in the financial report. The procedures selected depend on the auditor's judgment, including the assessment of the risks of material misstatement of the financial report, whether due to fraud or error. In making those risk assessments, the auditor considers internal control relevant to the entity's preparation and fair presentation of the financial report in order to design audit procedures that are appropriate in the circumstances, but not for the purpose of expressing an opinion on the effectiveness of the entity's internal control. An audit also includes evaluating the appropriateness of accounting policies used and the reasonableness of accounting estimates made by the directors, as well as evaluating the overall presentation of the financial report. We believe that the audit evidence we have obtained is sufficient and appropriate to provide a basis for our audit opinion. Matters Relating to the Electronic Presentation of the Audited Financial Report This auditor’s report relates to the financial report of Pacific Environment Limited for the year ended 30 June 2015, intended to be included on the entity's website. The entity's directors are responsible for the integrity of the entity's website. We have not been engaged to report on the integrity of the entity's website. The auditor’s report refers only to the statements named above. It does not provide an opinion on any other information which may have been hyperlinked to/from these statements. If users of this report are concerned with the inherent risks arising from electronic data communications they are advised to refer to the hard copy of the audited financial report to confirm the information included in the audited financial report presented on the website.
PACIFIC ENVIRONMENT LIMITED ABN 42 122 919 948 AND CONTROLLED ENTITIES
INDEPENDENT AUDITOR’S REPORT
TO THE MEMBERS OF PACIFIC ENVIRONMENT LIMITED
Independence In conducting our audit, we have complied with the independence requirements of the Corporations Act 2001. Auditor's Opinion In our opinion the financial report of Pacific Environment Limited is in accordance with the Corporations Act 2001, including:
(a) giving a true and fair view of the consolidated entity’s financial position as at 30 June 2015 and of its performance for the year ended on that date; and
(b) complying with Australian Accounting Standards and the Corporations Regulations 2001. Report on the Remuneration Report We have audited the remuneration report included in pages 31 to 38 of the directors’ report for the year ended 30 June 2015. The directors of the entity are responsible for the preparation and presentation of the remuneration report in accordance with s300A of the Corporations Act 2001. Our responsibility is to express an opinion on the remuneration report, based on our audit conducted in accordance with Australian Auditing Standards. Auditor’s Opinion In our opinion the remuneration report of Pacific Environment Limited for the year ended 30 June 2015 complies with s300A of the Corporations Act 2001. WPIAS Pty Ltd Authorised Audit Company No. 440306
LEE-ANN DIPPENAAR BCom CA RCA DIRECTOR Dated this 28th day of August 2015 4 Helensvale Road Helensvale Qld 4212
103
For
per
sona
l use
onl
y

Shareholder Information For the financial year ended 30 June 2015
Shareholder Information
The shareholder information set out below was applicable as at 13 August 2015.
1. Distribution of equity securities
Analysis of numbers of equity security holders by size of holding:
Class of equity
Ordinary shares
Holding Shares Options
1 – 1,000 13 -
1,001 – 5,000 168 -
5,001 – 10,000 164 -
10,001 – 100,000 524 3
100,001 and over 159 32
1,028 35
2. Equity security holders
(a) Twenty largest quoted equity security holders
The names of the twenty largest holders of quoted equity securities are listed below:
Ordinary shares
Name Number held Percentage of issued
shares
Robin Ormerod & Kristin Zeise 26,091,054 19,63% Robin Ormerod 11,333,193 8.53%
Jean Vincent 4,222,300 3,18%
Nigel & Kerry Holmes 4,071,428 3.06%
Herft Accounting Australia Number 2 Pty Ltd
3,468,149 2.61%
Coterie Nominees Pty Ltd 3,000,000 2.26%
Amma Fep Pty Ltd 2,500,000 1.88%
Roger Drew & Susanne Tepe 2,608,543 1.96%
Comsec Nominees Pty Ltd 2,255,636 1.70%
Northstar Global Pty Ltd 1,900,000 1.43%
Meis Supertee pty Ltd 1,800,000 1.35%
Comserv (No 1157) Pty Ltd 1,600,000 1.20%
Ellamax Pty Ltd 1,531,023 1.15%
Cryptogenix Services Pty Ltd 1,470,429 1.11%
Jummysue Pty Ltd 1,447,683 1.09%
John Frangos 1,304,270 0.98%
Chinta Holdings Pty Ltd 1,117,330 0.84%
Gusto2 Pty Limited 1,000,000 0.75%
Home Loans Pronto Pty Ltd 1,000,000 0.75%
Melissa Pace 954,250 0.72%
74,675.288 56.17%
Shareholder Information Pacific Environment Limited Annual Report 2015104
For
per
sona
l use
onl
y

2. Equity security holders
(a) Twenty largest quoted equity security holders
The names of the twenty largest holders of quoted equity securities are listed below:
Ordinary shares
Name Number held Percentage of issued
shares
Robin Ormerod & Kristin Zeise 26,091,054 19,63% Robin Ormerod 11,333,193 8.53%
Jean Vincent 4,222,300 3,18%
Nigel & Kerry Holmes 4,071,428 3.06%
Herft Accounting Australia Number 2 Pty Ltd
3,468,149 2.61%
Coterie Nominees Pty Ltd 3,000,000 2.26%
Amma Fep Pty Ltd 2,500,000 1.88%
Roger Drew & Susanne Tepe 2,608,543 1.96%
Comsec Nominees Pty Ltd 2,255,636 1.70%
Northstar Global Pty Ltd 1,900,000 1.43%
Meis Supertee pty Ltd 1,800,000 1.35%
Comserv (No 1157) Pty Ltd 1,600,000 1.20%
Ellamax Pty Ltd 1,531,023 1.15%
Cryptogenix Services Pty Ltd 1,470,429 1.11%
Jummysue Pty Ltd 1,447,683 1.09%
John Frangos 1,304,270 0.98%
Chinta Holdings Pty Ltd 1,117,330 0.84%
Gusto2 Pty Limited 1,000,000 0.75%
Home Loans Pronto Pty Ltd 1,000,000 0.75%
Melissa Pace 954,250 0.72%
74,675.288 56.17%
Pacific Environment Limited Annual Report 2015 105Shareholder Information
For
per
sona
l use
onl
y

(b) Unquoted equity securities
Number held
Pacific Environment Limited unlisted options
37,605,000
(c) Substantial holders
Substantial holders in the Company are set out below:
Ordinary Shares Number held Percentage
Robin Ormerod & Kristin Zeise 26,091,054 19.63% Robin Ormerod 11,333,193 8.53%
3. Voting rights
The voting rights attaching to each class of equity securities are set out below
(a) Ordinary shares
Every member present at a meeting in person or by proxy shall have one vote and upon a poll each share shall have one vote.
(b) Convertible notes
Convertible notes do not carry any voting rights.
(c) Options
Options carry the standard voting rights available to ordinary shareholders when converted to ordinary shares.
Shareholder Information Pacific Environment Limited Annual Report 2015106
For
per
sona
l use
onl
y

For
per
sona
l use
onl
y

ASX: PEH
Australian Head Office
Level 1, 146 Arthur StreetNorth Sydney 2060P: +61 2 9870 0950E: [email protected]
www.pacific-environment.com
For
per
sona
l use
onl
y
![Panasonic...Durian odour 6 Natural reduction 60tmin.] Sweat odour Nonanoic acid Natural reduction 120[min.] Garbage odour Methylmercaptan Natural reduction 601minJ Scalp odour Panasonic](https://img.dokumen.tips/doc/110x75/60d72199474aa2073d394000/panasonic-durian-odour-6-natural-reduction-60tmin-sweat-odour-nonanoic-acid.jpg)