Embed Size (px)
Citation preview
A N N U A L R E P O RT 2 0 1 8
For
per
sona
l use
onl
y

MMA Offshore Limited 1
About the cover
The Multipurpose Support Vessel MMA Prestige is one of MMA’s flagship vessels and has operated successfully in South East Asia and the Middle
East since delivery from MMA’s Batam Shipyard in 2016. The MMA Prestige has been designed and constructed to provide customers the opportunity
for faster, more efficient and cost-effective project mobilisation times. MMA Prestige offers superior ultra-deep water lift capabilities and has been
designed with on-board systems and infrastructure to be on location longer with minimised external support, and maximum shipboard facilities for
productive offshore work.
Contents
Overview
About Us 3
Chairman’s Address 4
Managing Director’s Report 6
Operating & Financial Review
Financial Position 10
Risks 14
Operations
Vessel Operations 16
Health, Safety, Environment & Quality 20
Our People 22
Our Community 23
Governance
Board of Directors 24
Corporate Governance 26
Directors’ Report 31
Auditor’s Independence Declaration 45
Audit Report 46
Directors’ Declaration 51
2018 Financial Report 52
Shareholder Information
Additional Securities
Exchange Information 91
Total Recordable Case Frequency (“TRCF”) of 0.28 in FY2018 (rate per
million hours worked)
World Class Safety Performance
Key
Office
Onshore Facility
South East Asia
Austral ia/ New ZealandFremantle
Dampier
SingaporeMalaysia
Batam
We own and operate a specialised, high specification fleet of 28 core vessels with an average age of approximately 6 years
Our vessel service offering is supported by two strategically located onshore
facilities in South East Asia
Strong project management capability delivering innovative and fit for purpose
marine solutions
Specialised Offshore Fleet
Marine Logistics Support
Technical Expertise
Providing vessel solutions and marine expertise
to the offshore oil and gas industry.
East & West Africa
Middle East
Dubai
For
per
sona
l use
onl
y
2 Annual Report 2018 MMA Offshore Limited 3
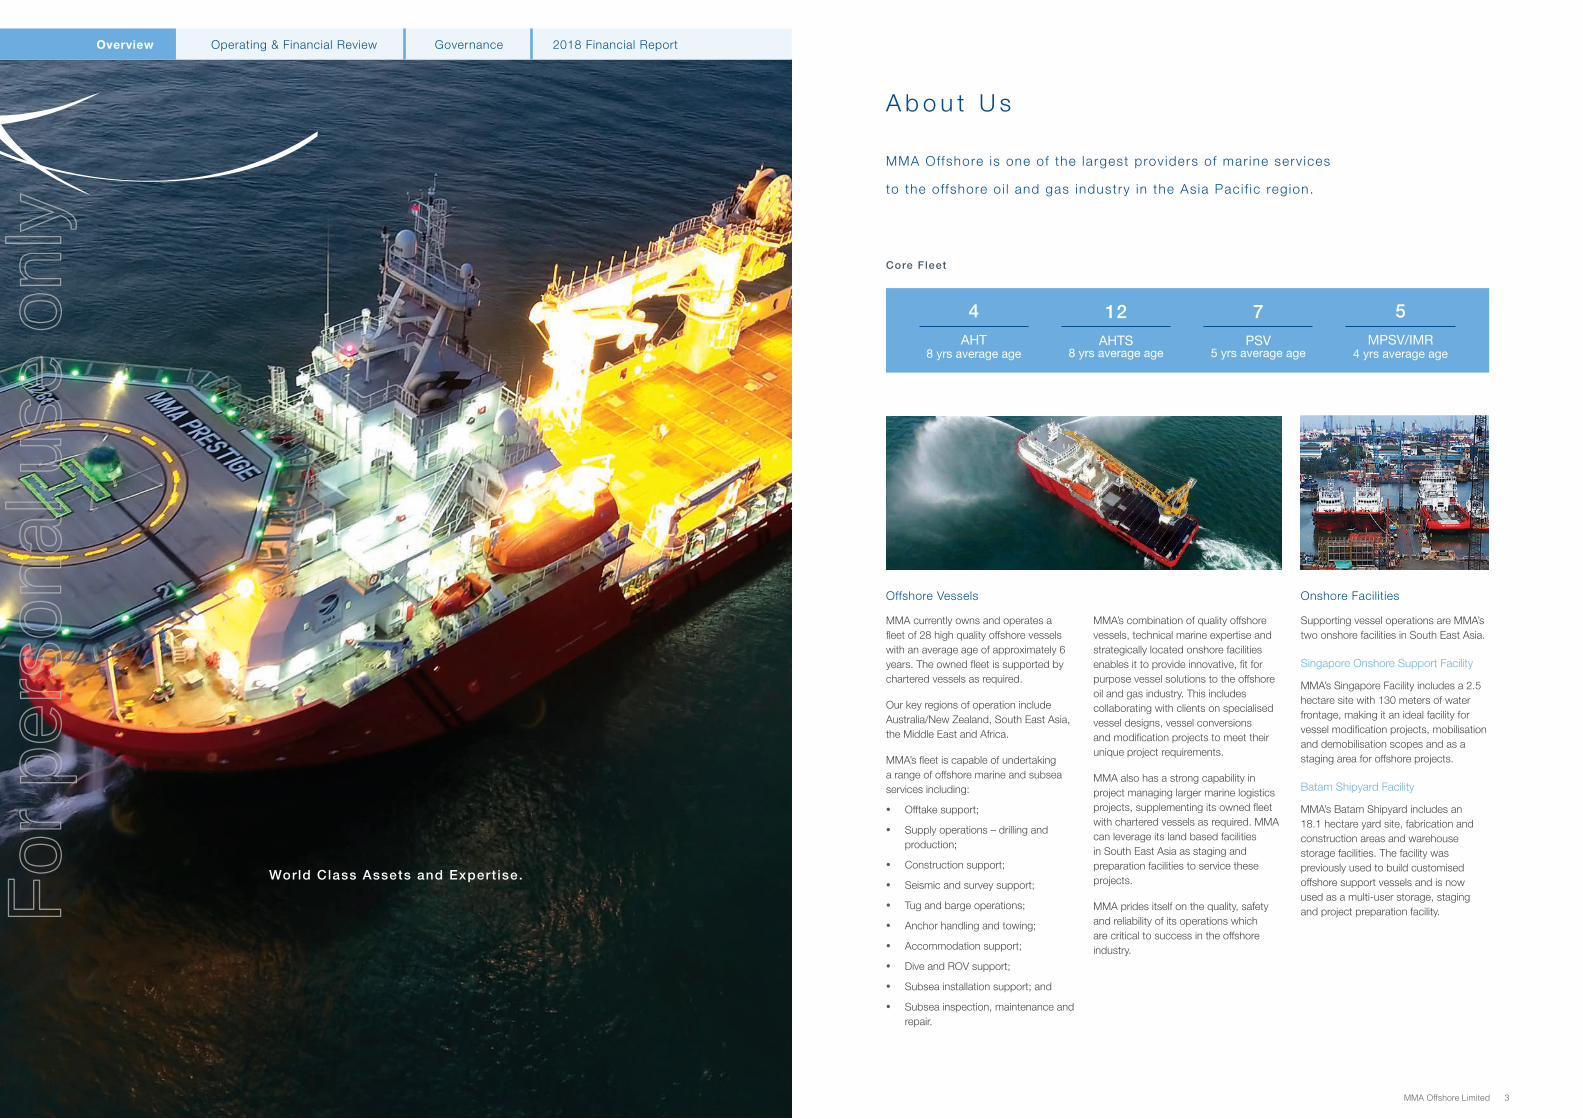
MMA currently owns and operates a fleet of 28 high quality offshore vessels with an average age of approximately 6 years. The owned fleet is supported by chartered vessels as required.
Our key regions of operation include Australia/New Zealand, South East Asia, the Middle East and Africa.
MMA’s fleet is capable of undertaking a range of offshore marine and subsea services including:
• Offtake support;
• Supply operations – drilling and production;
• Construction support;
• Seismic and survey support;
• Tug and barge operations;
• Anchor handling and towing;
• Accommodation support;
• Dive and ROV support;
• Subsea installation support; and
• Subsea inspection, maintenance and repair.
MMA’s combination of quality offshore vessels, technical marine expertise and strategically located onshore facilities enables it to provide innovative, fit for purpose vessel solutions to the offshore oil and gas industry. This includes collaborating with clients on specialised vessel designs, vessel conversions and modification projects to meet their unique project requirements.
MMA also has a strong capability in project managing larger marine logistics projects, supplementing its owned fleet with chartered vessels as required. MMA can leverage its land based facilities in South East Asia as staging and preparation facilities to service these projects.
MMA prides itself on the quality, safety and reliability of its operations which are critical to success in the offshore industry.
Offshore Vessels Onshore Facilities
Supporting vessel operations are MMA’s two onshore facilities in South East Asia.
Singapore Onshore Support Facility
MMA’s Singapore Facility includes a 2.5 hectare site with 130 meters of water frontage, making it an ideal facility for vessel modification projects, mobilisation and demobilisation scopes and as a staging area for offshore projects.
Batam Shipyard Facility
MMA’s Batam Shipyard includes an 18.1 hectare yard site, fabrication and construction areas and warehouse storage facilities. The facility was previously used to build customised offshore support vessels and is now used as a multi-user storage, staging and project preparation facility.
World Class Assets and Expert ise.
A b o u t U s
MMA Offshore is one of the largest prov iders of mar ine serv ices
to the offshore o i l and gas industry in the Asia Paci f ic region.
4AHT
8 yrs average age
12AHTS
8 yrs average age
7PSV
5 yrs average age
5MPSV/IMR
4 yrs average age
Core Fleet
2018 Financial ReportOverview GovernanceOperating & Financial ReviewF
or p
erso
nal u
se o
nly

4 Annual Report 2018 MMA Offshore Limited 5
Following the strategic repositioning of the fleet, MMA is now focused on the more complex and higher margin sectors of the industry where it can leverage its marine expertise to generate higher returns on its assets. The core fleet now comprises 28 high quality vessels with an average age of approximately six years, young by industry standards. We have been diligent in maintaining our vessels to a high standard during the downturn which will position these vessels well to compete for contracts as market activity increases.
In addition to the asset sales mentioned above, MMA further strengthened its balance sheet in December 2017 through an equity raising under which the Company raised $97 million (before costs) and concurrently secured valuable amendments to the terms of the Company’s debt facilities. These amendments included an extension of the term of the facilities by two years through to September 2021, amended covenants including a covenant holiday until June 2019, a reduced interest rate and revised amortisation profile.
The equity raising was oversubscribed and the funds raised at a very modest discount to the share price at the time which was pleasing. MMA now has an improved cash buffer and a stronger platform to take advantage of future opportunities.
Notwithstanding the strengthened balance sheet, MMA’s net debt as a multiple of its current earnings remains well above our target level.
A key focus is to improve the returns on our assets to acceptable levels which will in turn improve our debt metrics.
Returns should improve through increased utilisation and rates as the market normalises. However, we are not relying solely on this to drive improved returns on our assets. We are also focused on boosting returns through providing additional services to clients, chartering in additional vessels, managing large logistics projects and increasing our presence in the subsea vessel market. Whilst we have made progress on these initiatives in FY18 we plan to accelerate these efforts in the current year as we strive to improve financial performance as quickly as possible.
Fundamental to our success is our operational excellence and service delivery to clients. MMA has a strong reputation as a quality operator with a unique skill in delivering innovative marine solutions to our clients. This has translated into a number of very significant contract wins over the past three years in a highly competitive market.
Safety is core to our operations and pleasingly MMA maintained its excellent safety performance in FY2018 with a total recordable case frequency of 0.28 per million hours worked. This truly is a world class safety performance and significantly better than the marine industry average of 1.8.
We expect market conditions in terms of vessel utilisation to improve during the course of FY2019. It will, however, take time for higher utilisation to translate into higher day rates.
We are targeting a cash flow neutral position for the business in FY2019 while we continue to position the Company to take advantage of improved market conditions and opportunities as they emerge.
I would like to conclude by thanking my fellow Board members for their valuable contribution and stewardship of the business over what continues to be a challenging time for our industry. I would like to welcome our newest Board member, Mr Peter Kennan, who joined the Board in September 2017. Peter is the Managing Partner and CIO of Black Crane Capital, MMA’s largest shareholder and we welcome his valuable expertise to the Board of Directors.
I would also like to pay tribute to Mr Tony Howarth AO, who retired from the Board in November 2017. Tony made a tremendous contribution to MMA during his 16 years on the Board, 11 of which he served as Chairman.
We are very lucky to have an excellent team of people at MMA. I would like to acknowledge our Managing Director, Mr Jeff Weber and all management and staff for their ongoing dedication and commitment to MMA.
Finally, I would like to thank you, our shareholders for your ongoing support of the Company.
Andrew EdwardsChairman
Whilst we continue to feel the impact of the prolonged downturn in the offshore vessel market, the broader oil and gas market has improved over the course of FY2018 with the oil price recovering and holding over US$70 per barrel (Brent) for the past six months.
The outlook for the oil price appears to be more positive with industry experts now predicting a tightening in the supply-demand balance with limited spare production capacity in the market. Notwithstanding this, we can expect the oil market to remain volatile and be subjected to ongoing supply and demand fluctuations.
The outlook for LNG has also improved with increased demand expected over the coming years, particularly from China.
The improved oil price, in conjunction with significant reductions in operating costs has begun to translate to oil company earnings, with the majors recently reporting large profit increases. In addition, project FIDs are expected to increase significantly in 2018 and 2019, as previously deferred projects are sanctioned in an effort to replace depleting reserves. This bodes well for an increase in vessel activity over time.
On the supply side, the vessel market remains oversupplied, however there is increasing consensus that a large number of vessels which have been laid up during the downturn may not return to service due to prohibitive reactivation costs and a reluctance by oil companies to contract vessels which have been out of service for long periods of time. These circumstances should reduce some of the supply overhang.
MMA has had a focused strategy over the past three years to manage its cash flow and debt obligations and to position the Company for a return to more normal trading conditions.
As part of our ongoing cost reduction programme, we have significantly reduced our direct operating costs and overheads with corporate and vessel overheads reduced by 50% since FY2015.
A key part of our strategy was the disposal of assets which were considered to not be core to the business going forward. This included the Company’s Australian Supply Base assets which were sold for $52.8 million in the previous financial year. In addition, we reviewed our fleet and sold 36 of our smaller, older and more commoditised vessels realising cash of approximately $100 million. The proceeds from these asset sales were predominantly used to reduce debt, improving our gearing and reducing our interest costs. The sales programme has also stemmed the ongoing operating losses and cash drain from these underutilised vessels, an estimated cumulative saving of $20 million.
C h a i r m a n ’s A d d r e s s
MMA has streaml ined i ts business and strengthened i ts balance sheet
to posi t ion the Company for an improvement in market condi t ions
2018 Financial ReportOverview GovernanceOperating & Financial ReviewF
or p
erso
nal u
se o
nly

6 Annual Report 2018 MMA Offshore Limited 7
Market conditions for the
offshore vessel market continued
to be challenging during FY2018
although the signs of a recovery
continue to be positive
The broader oil and gas market has improved with the oil price increasing 60% since the beginning of the financial year.
As a result of the downturn over the past few years, there has been significant underinvestment by oil and gas companies in the replacement of depleting reserves. We are starting to see some signs of this changing with Rystad Energy recently predicting that project FIDs will rise significantly in 2018 and 2019 as previously deferred projects are sanctioned.
Seismic and subsea companies are also reporting increases in activity, all of which are early indicators of an increase in vessel activity over time.
Offshore maintenance expenditure, which has been deferred during the downturn should also increase as conditions improve, increasing demand in the IMR market.
Whilst the broader oil and gas market is improving, this has yet to translate to the offshore vessel sector due to the lag between investment decisions by oil companies and an increase in vessel demand. However, the indicators are positive and we do appear to be at the bottom of the cycle with utilisation, rates and asset values appearing to have stabilised over the past 12 months.
FY2018 saw an improvement in
EBITDA and utilisation over the
previous financial year
Revenue for the year was $200.4 million, down 9.6% on FY2017. EBITDA was up 2% at $18.5 million, including a $2.3 million loss from Dampier Slipway which ceased operations in June 2018. Excluding this loss, the business produced an EBITDA of $20.8 million up 15.6% on the previous year.
Australian operations contributed revenue of $142.2 million during FY2018, down slightly on the $148.8 million generated in FY2017. Revenue from international operations was $58.2 million, down from $72.9 million in FY2017.
Average utilisation for the year was 56% up from 52% in FY2017. Second half utilisation was stronger at 65% (1H 47%) as a number of our non-core vessels were disposed of. The sale of these vessels reduced the drag on utilisation and also improved our margins as holding costs were eliminated. Excluding vessels held for sale, utilisation for the core fleet was 69%.
Strategic repositioning of the
fleet completed
MMA’s strategic repositioning of its fleet through its non-core vessel sales programme has been very successful, saving cash and reducing MMA’s exposure to vessels which are not expected to generate a satisfactory return on assets over time.
Nine vessels were sold during the FY2018 financial year for a total of approximately A$27 million with a further vessel sold in July 2018 for A$5.1 million. Since FY2016, MMA has disposed of 36 vessels for a total of approximately $100 million.
The programme has resulted in the elimination of cumulative cash operating losses on these vessels of approximately $20 million from date of sale through to 30 June 2018. In addition, there have been substantial savings in interest costs and docking costs.
The majority of vessels sold have been older tonnage not relevant to the future market, or more commoditised vessels which we anticipate will be the slowest market to recover. The sales programme has freed up operational capacity to focus on higher margin and more complex sectors of the industry where MMA can leverage its marine expertise to generate better returns.
2018 Financial ReportOverview GovernanceOperating & Financial Review
1 EBIT and Normalised NPAT exclude a reversal of prior period impairment charges of $8.4m. MMA’s Financial Report complies with Australian Accounting Standards and International Financial Reporting Standards (“IFRS”). The pre-impairment reported EBIT and NPAT are unaudited but are derived from audited accounts by removing the impact of the impairment reversal from the reported IFRS audited results. MMA believes the non-IFRS disclosures reflect a more meaningful measure of the Company’s underlying performance.
Operating summary
Financial result in line with expectations (EBITDA of $18.5m including Slipway loss of $2.3m)
Utilisation 56% (FY17 52%)
Rates at historic lows
Slipway operation ceased in Jun-18
Maintained our world class safety performance
Strengthened the Balance Sheet through $97m equity raising and debt amendments
Secured a number of significant contracts during the year
Signed 3 year contract for MMA Pinnacle commencing Q2 FY2019
Strategy
Strategically repositioned the fleet
Focused on higher margin and more complex market segments
Focused on operating scale in key geographic regions
Building our subsea capability
Leveraging our onshore assets and experience in project logistics
Focused on achieving economic returns on our assets and improving our debt metrics
Outlook
Market conditions for offshore vessels remain challenging but the market is improving
Expect higher utilisation through the course of FY2019 with only modest improvement in day rates this financial year
Goal to be cash flow neutral in FY2019
M a n a g i n g D i r e c t o r ’s R e p o r t
MMA has strategical ly reposit ioned i ts business
and is now wel l placed to benefit f rom a recovery
in market condit ions.
Financial summary
$200.4mRevenue
$18.5mEBITDA
$(13.4)mEBIT(1)
$(36.3)mNormalised NPAT(1)
$(2.3)mOperating Cashflow
60.7%Gearing
$69.6mCash at Bank
$0.38NTA per Share
For
per
sona
l use
onl
y
8 Annual Report 2018 MMA Offshore Limited 9
Our people are key to
our success
At MMA we understand that our people are critical to our success.
The last four years have been very challenging for MMA from a people perspective as market conditions necessitated a significant reduction in our workforce. I would like to acknowledge all those who contributed to MMA over the years who are no longer with the Company.
I would like to thank my Senior Management Team who have shown strong leadership and commitment and all MMA staff for their valuable contribution to the business over what has been a difficult time.
We had a number of changes to the Board of Directors during the year. I would like to pay special tribute to Tony Howarth our former Chairman who retired in November 2017 after 16 years on the Board. I would also like to formally acknowledge our new Chairman Andrew Edwards who has seamlessly transitioned into the role. I would also like to welcome our most recent appointment to the Board, Mr Peter Kennan who joined the Board during the year. Peter is the representative of a major shareholder, Black Crane Capital and brings a wealth of investment and corporate finance skills to the Company. I would like to take this opportunity to thank the Board of Directors for their valuable guidance and stewardship.
Refined strategy focused on core
vessel operations
MMA has strategically repositioned its business over the past 2 years with the sale of its Australian supply base assets and non-core vessels.
MMA’s strategy is now focused on a core fleet of 28 high quality vessels targeting more specialised and complex projects where MMA can leverage its marine expertise to extract the most value from its assets.
The owned fleet will be supplemented by chartered vessels as required to boost earnings.
MMA has a strong project management capability and will continue to leverage this expertise to project manage larger marine logistics projects. MMA’s land based facilities in South East Asia provide additional capability and resources to mobilise and deliver these types of projects.
MMA is also focused on building its subsea capability focusing on the light construction, inspection maintenance and repair and dive support sectors of the market. MMA currently has 5 vessels working in this sector and is seeking to grow its fleet and internal capability to meet expected increased demand.
Regionally, we continue to focus on maintaining operating scale in our key regions of Australia/New Zealand, the Middle East and South East Asia, with operations in Africa on the back of long term contracts.
Market Outlook
Market sentiment continues to be positive around a recovery in market conditions for offshore vessels. We are already starting to see improved conditions in the broader oil and gas market and early signs of a recovery in oil and gas investment including increased FIDs, seismic and subsea orders.
Unfortunately there is a lag between investment decisions by oil and gas companies and an increase in vessel demand so we expect market conditions to remain challenging in FY2019.
The oversupply of offshore vessels in the market is still an issue, although we anticipate that a large proportion of the global cold stacked fleet will not return to service which will eliminate some of the supply overhang.
MMA currently has 18 of its 28 core vessels under contract with the remaining vessels operating in the spot market. As at 30 June 2018, MMA had 41% of total vessel days contracted for FY2019 (58% for the PSV fleet, 51% for the MPSV/IMR fleet and 30% for the AHT/AHTS fleet).
We expect utilisation to increase across the course of FY2019 with only modest improvement in day rates this financial year.
Jeff WeberManaging Director
Under the amendments to MMA’s debt facilities which were agreed in November 2017, the Company committed to $30 million in amortisation from vessel sales by 31 December 2018. As at the date of this report, the full $30 million target has been met.
The vessel sales programme is almost complete with two vessels remaining on the sales list with one of these currently under a sales contract.
Ongoing cost reduction
programme has resulted in a
significantly reduced cost base
MMA has taken significant steps to sustainably reduce its cost base over the past three years with corporate and vessel overheads down 50% since FY2015.
There has also been a major focus on reducing our direct costs through retendering key expense items and ongoing supplier renegotiations.
MMA continues to review all aspects of its business for improvements and efficiencies.
As mentioned previously the non-core vessel sales programme has been a major initiative to reduce holding costs on underutilised vessels.
MMA also actively manages costs on its vessels between contracts to minimise operating costs.
The decision to close the Dampier Slipway on 30 June 2018, which posted a loss of $2.3 million for FY18, will reduce costs in FY2019. Unfortunately the volume of activity in the region made it no longer sustainable to have an in-house vessel maintenance facility in Australia.
MMA continues to focus on reducing costs in all areas of the business whilst maintaining high safety and operating standards which are essential to success in the offshore oil and gas industry.
Strengthened Balance Sheet
In December 2017, MMA completed a balance sheet recapitalisation, raising $97m in equity combined with amendments to the Company’s debt facilities.
The equity component was fully underwritten and comprised a $22.4 million institutional placement and a $74.6 million 1 for 1, pro-rata, accelerated, non-renounceable entitlement offer.
The proceeds of the equity raising were used to repay, in part, $30 million of debt and provide an improved cash buffer and stronger capital structure for the Company.
As part of the recapitalisation, MMA’s existing lenders agreed to a number of important amendments to the Company’s debt facilities including:
• An extension of the term to 30 September 2021;
• A reduction in the interest rate and removal of the payment in kind (PIK) interest;
• Amended covenants including a covenant holiday until 30 June 2019; and
• A revised amortisation profile with scheduled amortisation commencing in June 2020 including a cash sweep above $70 million.
Full details of the equity raising and debt facility amendments can be found in the Equity Raising Investor Presentation, dated 16 November 2017, which can be found on the Company’s website.
Following the equity raising and debt amendments, MMA’s cash at bank as at 30 June 2018 was $69.6 million and Net Debt (Interest Bearing Liabilities less Cash at Bank) was $199.0 million. Gearing (Net debt / Equity) has reduced from 115.2% as at 30 June 2017 to 60.7% as at 30 June 2018.
MMA reviewed the carrying value of its fleet as at 31 December 2017, in line with accounting standards, which resulted in a small reversal of the previous impairment charge of $8.4m. No further adjustments to the carrying value of MMA’s assets were required on 30 June 2018.
World class safety performance
MMA continues to improve its safety performance. MMA’s Total Recordable Case Frequency (“TRCF”) for FY2018 was 0.28 per million hours worked, the Company’s best ever performance and significantly better than the marine industry average.
MMA continues to strive for ‘A Perfect Day Every Day’, that is a day free of recordable injuries or illness and material incidents. In FY2018, we achieved 339 Perfect Days across the organisation, up from 310 perfect days in FY2017. We continue to strive for our target of 365 perfect days, a target we believe is achievable.
We also completed a comprehensive review of our Target 365 Critical Controls during the year, to ensure that they remain relevant to our changing business.
Safety is a critical focus area for MMA and we will continue to drive improvements in safety across the organisation.
2018 Financial ReportOverview GovernanceOperating & Financial ReviewF
or p
erso
nal u
se o
nly
10 Annual Report 2018 MMA Offshore Limited 11
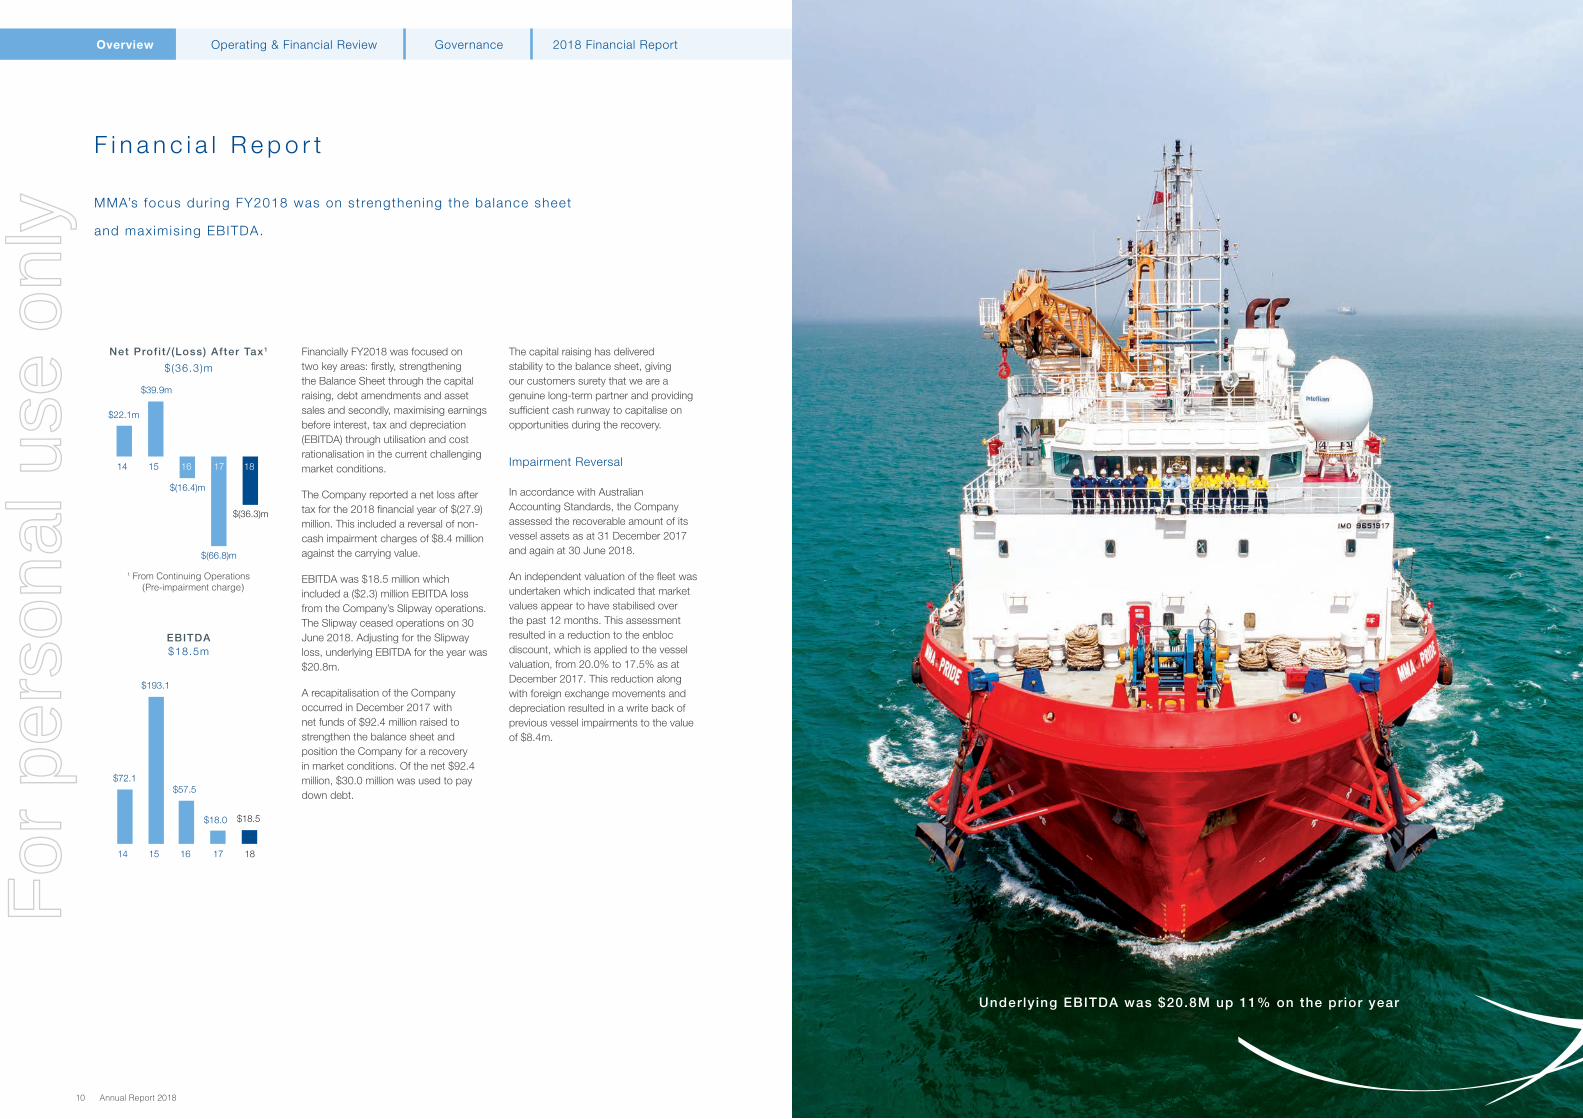
Underlying EBITDA was $20.8M up 11% on the prior year
Financially FY2018 was focused on two key areas: firstly, strengthening the Balance Sheet through the capital raising, debt amendments and asset sales and secondly, maximising earnings before interest, tax and depreciation (EBITDA) through utilisation and cost rationalisation in the current challenging market conditions.
The Company reported a net loss after tax for the 2018 financial year of $(27.9) million. This included a reversal of non-cash impairment charges of $8.4 million against the carrying value.
EBITDA was $18.5 million which included a ($2.3) million EBITDA loss from the Company’s Slipway operations. The Slipway ceased operations on 30 June 2018. Adjusting for the Slipway loss, underlying EBITDA for the year was $20.8m.
A recapitalisation of the Company occurred in December 2017 with net funds of $92.4 million raised to strengthen the balance sheet and position the Company for a recovery in market conditions. Of the net $92.4 million, $30.0 million was used to pay down debt.
The capital raising has delivered stability to the balance sheet, giving our customers surety that we are a genuine long-term partner and providing sufficient cash runway to capitalise on opportunities during the recovery.
Impairment Reversal
In accordance with Australian Accounting Standards, the Company assessed the recoverable amount of its vessel assets as at 31 December 2017 and again at 30 June 2018.
An independent valuation of the fleet was undertaken which indicated that market values appear to have stabilised over the past 12 months. This assessment resulted in a reduction to the enbloc discount, which is applied to the vessel valuation, from 20.0% to 17.5% as at December 2017. This reduction along with foreign exchange movements and depreciation resulted in a write back of previous vessel impairments to the value of $8.4m.
F i n a n c i a l R e p o r t
MMA’s focus dur ing FY2018 was on strengthening the balance sheet
and maximis ing EBITDA.
Net Prof i t/ (Loss) After Tax1
$(36.3)m
$(36.3)m
1814 15
$22.1m
$39.9m
$(16.4)m
$(66.8)m
1716
EBITDA$18.5m
18
$18.5
14 15 16 17
$72.1
$193.1
$57.5
$18.0
2018 Financial ReportOverview GovernanceOperating & Financial Review
1 From Continuing Operations (Pre-impairment charge)
For
per
sona
l use
onl
y

12 Annual Report 2018 MMA Offshore Limited 13
Gearing 60.7%
• A revised amortisation profile with scheduled amortisation commencing in June 2020 including a cash sweep above $70 million.
The Company has the ongoing support of its Banking Syndicate who continue to work with the Company during these challenging trading conditions.
Balance Sheet
The Company continues to have a strong asset base comprising its core fleet of high quality vessels with an average age of just over six years. At 30 June 2018, the Company reported Total Assets of $639.8 million, Net Assets of $328.3 million and a NTA backing of $0.38 per share.
At 30 June 2018 the Company had cash reserves totalling $69.6 million.
The Company’s gearing ratio (net debt to equity) at 30 June 2018 following the impairment reversal for the year decreased to 60.7%, compared to 115.2% the previous year.
Dividends
No dividends have been declared for the 2018 financial year.
Cash At Bank $69.6m
18
$69.6m
14 15 16 17
$174.8m
$124.5m
$49.7m
$28.8m
18
60.7%
14 15 16 17
37.1%41.6%
55.0%
115.2%
Cashflow
In addition to the capital raising, the Company received net proceeds of $25.3 million during the year from asset sales which included the sale of nine non-core vessels in the fleet during FY2018.
A further $6.0 million of funds from prior year sales, which were on balance sheet at 30 June 2017, were also remitted to the banking syndicate over the year.
Total repayment of borrowings during the year including the funds from the capital raising was $61.3 million.
Cash flow from operations for the 2018 financial year was negative $(2.3) million after meeting interest and cash costs on the Company’s debt facilities of $(16.9) million.
Capital Expenditure
Capital expenditure for the year of $9.2 million represented sustaining capital expenditure only. Sustaining capital expenditure is required to maintain the Company’s vessels as well as its licence to operate to generate income.
No growth capital expenditure was incurred during the financial year due to the prevailing market conditions and availability of assets to charter in, limiting the need for MMA to deploy capital to secure contracts in the short term.
Debt Management
In December 2017, MMA undertook a recapitalisation of the Company, raising $97m in equity before costs, $30m of which was used to repay debt.
As part of the recapitalisation MMA secured the following key amendments to the Company’s existing debt facilities:
• A facility extension to 30 Sept 2021;
• Reduced interest rate including the removal of payment in kind (PIK) interest;
• Amended covenants including a covenant holiday to 30 June 2019;
Interest Bearing Liabi l i t ies1
$269mOperating Cashflow
$(2.3)m
$(2.3)m$(6.1)m
1814 15 16 17
$54.4m
$185.4m
$120.2m
Capital Expenditure$9.2m
$9.2m
1814 15 16
$68.0m
$247.2m
$159.3m
$31.9m
17
$269.0m
1814 15 16
$448.0m $448.5m
$398.7m
$324.2m
17
MMA strengthened its balance sheet during the year through a $97M equity
raising and amendments to the company’s debt faci l i t ies
2018 Financial ReportOverview GovernanceOperating & Financial Review
NTA Per Share $0.38
18
$0.38
14 15 16 17
$1.95$2.10
$1.70
$0.69
1 (excluding unamortised fees)
For
per
sona
l use
onl
y
14 Annual Report 2018 MMA Offshore Limited 15
Competition, vessel oversupply and fleet composition misalignment with market demand
Demand for MMA’s vessels is also affected by the number of vessels available in the market and the competitive landscape.
In the current market, there is an oversupply of vessels and a corresponding misalignment with demand. This has led to an increase in competition which adversely impacts vessel utilisation, rates and contract terms, thereby impacting MMA’s earnings and profitability.
MMA seeks to manage this risk by having a clear strategic plan including an ongoing review of its asset mix and capability to meet market demand. To this end, MMA has disposed of a number of non-core vessels from the fleet which are commoditised in nature to focus on more technically sophisticated vessels where MMA can utilise its marine expertise to extract the most value out of both its own assets and those assets bareboat chartered from third party owners.
MMA also has an active lay-up programme to minimise holding costs for vessels between contracts. These laid-up vessels are either cold or warm stacked predominantly at our land based facilities in Batam and Singapore to minimise costs.
MMA’s strategic plan to manage this risk also focuses on regional strategies to position itself in the most advantageous areas to operate (both in terms of demand and clients).
MMA’s strategy is to differentiate itself from its competitors through operational excellence, proactive and innovative solutions, long-term customer relationships and responsive account management - whilst remaining competitive on price.
Operational risks
The Company’s operations are subject to various risks inherent in servicing the offshore oil and gas industry. Our international operations broaden our risk exposure in terms of both opportunities and threats.
Operational risks include (but are not limited to):
• Health and safety incidents;
• Loss of key customers/contracts;
• Failure by customers to pay for services contracted and/or performed;
• Redeployment costs of assets that are unable to be used in their current geography for a period of time;
• Equipment damage, technical failures or human error;
• Industrial unrest;
• Capsizing, sinking, grounding, collisions, fires and explosions, piracy, vessel seizures or arrests and acts of terrorism;
• Environmental pollution/contamination and other related accidents;
• Regulatory and legislative non-compliance;
• Fraud and theft;
• Increases in input costs;
• Loss of key personnel; and
• Contractual assumptions of risk.
Potential consequences associated with these risks include the loss of human life or serious injury, pollution, environmental damage, significant damage to or loss of assets and equipment, business disruption, client dissatisfaction, loss of contracts, damage to our reputation and legal and regulatory action, including fines. This could expose MMA to significant liabilities, a loss of utilisation, revenue and/or the incurrence of additional costs and therefore may have a materially adverse impact on the Company’s financial position and profitability.
We employ a number of well executed controls to manage these risks, including, but not limited to, appropriate insurance coverage, hazard and risk management processes, quality audits, planned maintenance programmes, compliance programmes, tender and contract management processes, access to in-house and external legal expertise, industrial relations strategies, emergency preparedness and contingency plans, preferred supplier and subcontractor processes, counterparty risk assessments and a host of engineering and operational controls.
Geopolitical, government and regulatory factors
Our international operations are subject to challenging geopolitical climates to varying degrees. Changes in the geopolitical climate in our market areas, such as the outbreak or resolution of war, nationalisation of a customer’s oil and gas project and changes to industry related legislation, protectionist measures and economic sanctions, may open up more advantageous areas to operate or could require us to discontinue operating in that area, leading to corresponding impacts on vessel and service utilisation.
MMA may face restrictions on its ability to win work in certain countries due to changing cabotage regulations and/or may be required to form joint ventures in some countries in order to access the local offshore oil and gas markets. Joint ventures may introduce a higher level of operational, financial and counterparty risk.
MMA’s strategic plan considers such risks and operationally we risk assess market areas and clients regularly to limit negative and optimise positive impacts.
Industry news, experienced personnel and industry relationships are leveraged to ensure we base our decisions on up to date geopolitical and market information. Contingency plans for fast emerging geopolitical risks are used to limit business disruption.
Foreign exchange
The majority of MMA’s revenues are paid in either Australian or US Dollars and the Company’s operating costs are primarily denominated in a combination of Australian, Singaporean and US Dollars, providing a natural hedge for our activities. MMA also has a combination of Australian Dollar and US Dollar debt.
Adverse movements in these currencies may result in a negative impact on MMA’s earnings.
MMA’s treasury policy and contract management processes further mitigate this risk. The Board also considers from time to time whether to manage currency fluctuation risk through appropriate hedging.
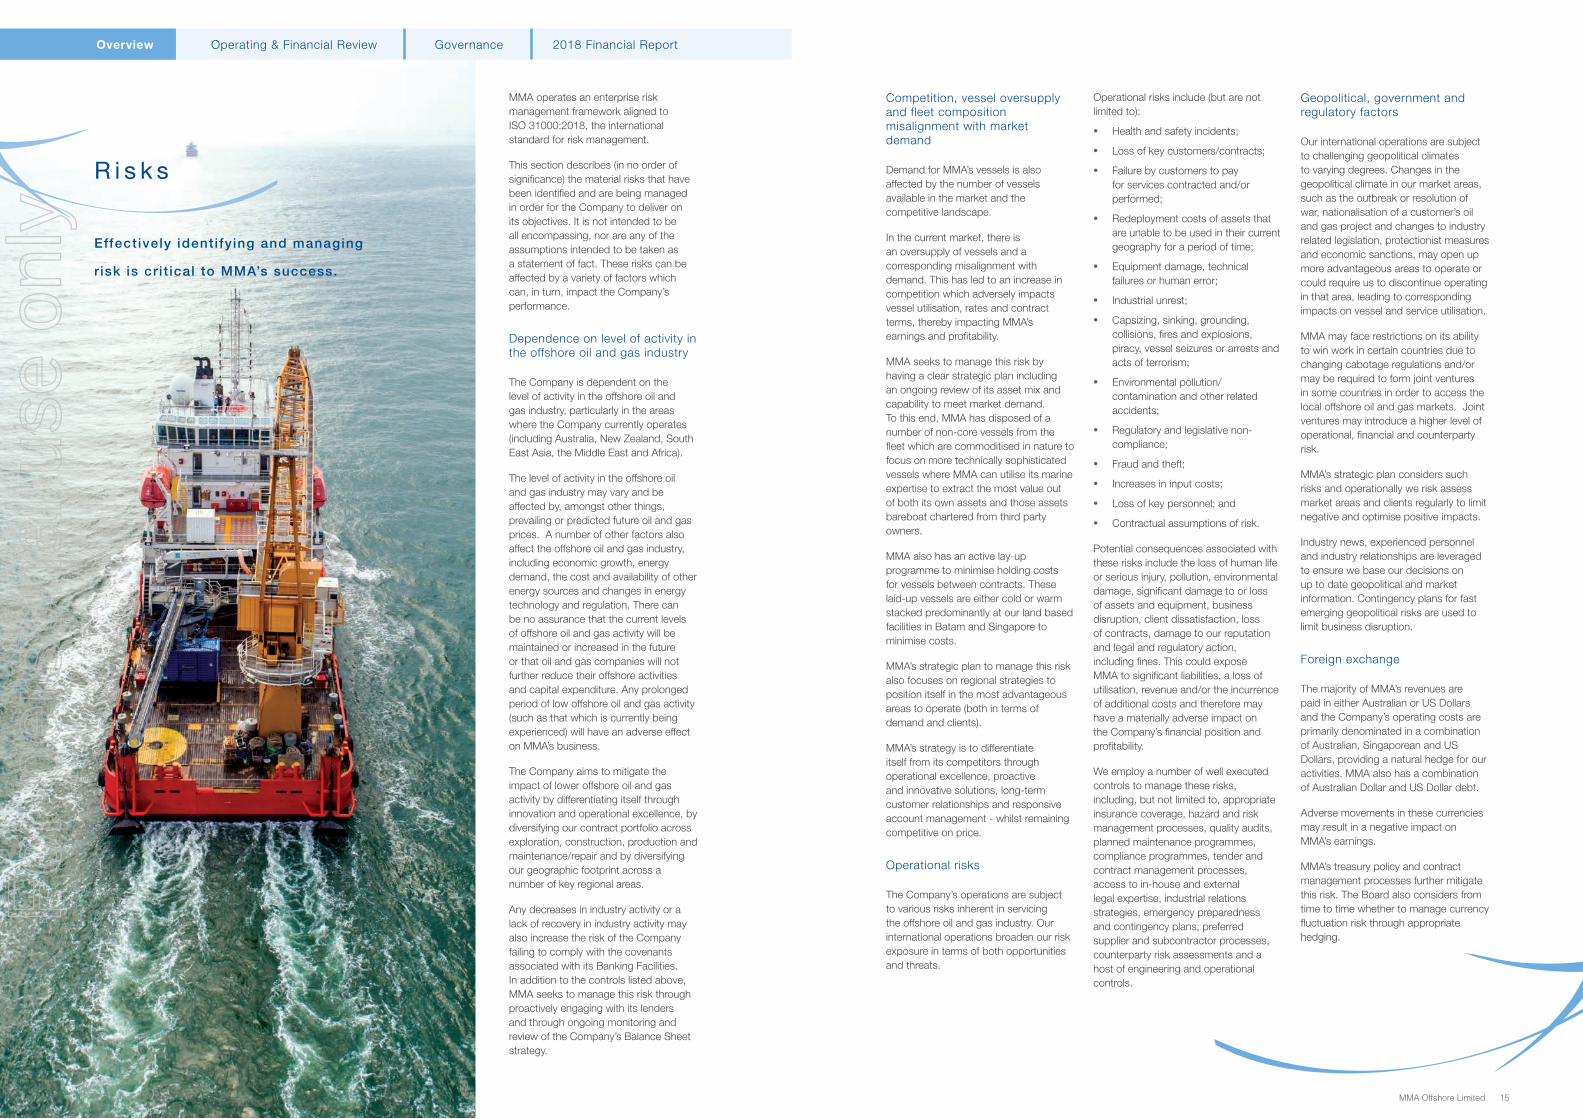
MMA operates an enterprise risk management framework aligned to ISO 31000:2018, the international standard for risk management.
This section describes (in no order of significance) the material risks that have been identified and are being managed in order for the Company to deliver on its objectives. It is not intended to be all encompassing, nor are any of the assumptions intended to be taken as a statement of fact. These risks can be affected by a variety of factors which can, in turn, impact the Company’s performance.
Dependence on level of activity in the offshore oil and gas industry
The Company is dependent on the level of activity in the offshore oil and gas industry, particularly in the areas where the Company currently operates (including Australia, New Zealand, South East Asia, the Middle East and Africa).
The level of activity in the offshore oil and gas industry may vary and be affected by, amongst other things, prevailing or predicted future oil and gas prices. A number of other factors also affect the offshore oil and gas industry, including economic growth, energy demand, the cost and availability of other energy sources and changes in energy technology and regulation. There can be no assurance that the current levels of offshore oil and gas activity will be maintained or increased in the future or that oil and gas companies will not further reduce their offshore activities and capital expenditure. Any prolonged period of low offshore oil and gas activity (such as that which is currently being experienced) will have an adverse effect on MMA’s business.
The Company aims to mitigate the impact of lower offshore oil and gas activity by differentiating itself through innovation and operational excellence, by diversifying our contract portfolio across exploration, construction, production and maintenance/repair and by diversifying our geographic footprint across a number of key regional areas.
Any decreases in industry activity or a lack of recovery in industry activity may also increase the risk of the Company failing to comply with the covenants associated with its Banking Facilities. In addition to the controls listed above, MMA seeks to manage this risk through proactively engaging with its lenders and through ongoing monitoring and review of the Company’s Balance Sheet strategy.
R i s k s
Effect ively identi fy ing and managing
r isk is cr i t ical to MMA’s success.
2018 Financial ReportOverview GovernanceOperating & Financial ReviewF
or p
erso
nal u
se o
nly
16 Annual Report 2018 MMA Offshore Limited 17
During the year, MMA was also contracted by Subsea7 for the provision, management and operation of tug and barge support vessels to transport project materials and equipment for Woodside’s Greater Western Flank-2 Subsea Installation Project. The vessel spread includes a combination of owned and sub-contracted vessels including two of MMA’s 8,000bhp AHTSs, the MMA Coral and MMA Crystal, in addition to two smaller chartered in tugs and 2 chartered cargo barges. MMA managed and carried out the required mobilisation for the barges at its onshore facility in Batam, Indonesia. The project commenced in June 2018 and is expected to continue through to September 2018.
In addition to the project work described above, MMA’s long term production support contracts in Australia continue to provide full utilisation for a number of our vessels. The MMA Brewster, MMA Plover, MMA Inscription, MMA Sound, MMA Strait and MMA Cove all experienced close to full utilisation during the year.
There has also been a slight uptick in the amount of seismic work in the region with the MMA Searcher, which was relocated to New Zealand, completing seismic work for Shell and Schlumberger. The vessel has since returned to Australia to continue operations as a seismic support vessel. The MMA Vantage was also mobilised to support the seismic market and has been active during the year conducting a number of scopes in Australia for Polarcus and other clients.
MMA currently has 15 vessels working in Australia / New Zealand.
South East Asia
We are seeing a reasonable amount of activity in Brunei and Malaysia and our two large AHTS vessels, the Jaya Majestic and Sea Hawk 1, were active in those markets on a number of projects during the year achieving utilisation of over 60%.
The MMA Almighty, a smaller AHTS, completed its long term production support with Ophir in Thailand early in the financial year and spent most of the remainder of the year idle. The contract was retendered and awarded at less than cash breakeven rates, an indication of the competitive nature of the South East Asian market for these more commoditised vessels.
Our IMR vessels, the MMA Pinnacle and Prestige, are building a solid reputation in the IMR and dive support market, completing a number of short term work scopes across all of our operating regions during the first half. The South East Asian monsoon impacted demand towards the end of the calendar year with both vessels idle from the latter half of December and through most of the third quarter. Utilisation for the first half for these two vessels was 75% dropping to 52% in the second half. The lower utilisation in the second half had a significant impact on our financial result as the holding costs on these vessels are relatively high. As mentioned previously, the MMA Pinnacle has secured a three year contract with iTech/Subsea 7, commencing in Oct 2018, which will secure a baseload of utilisation for that vessel over the contract period.
O p e r a t i o n s
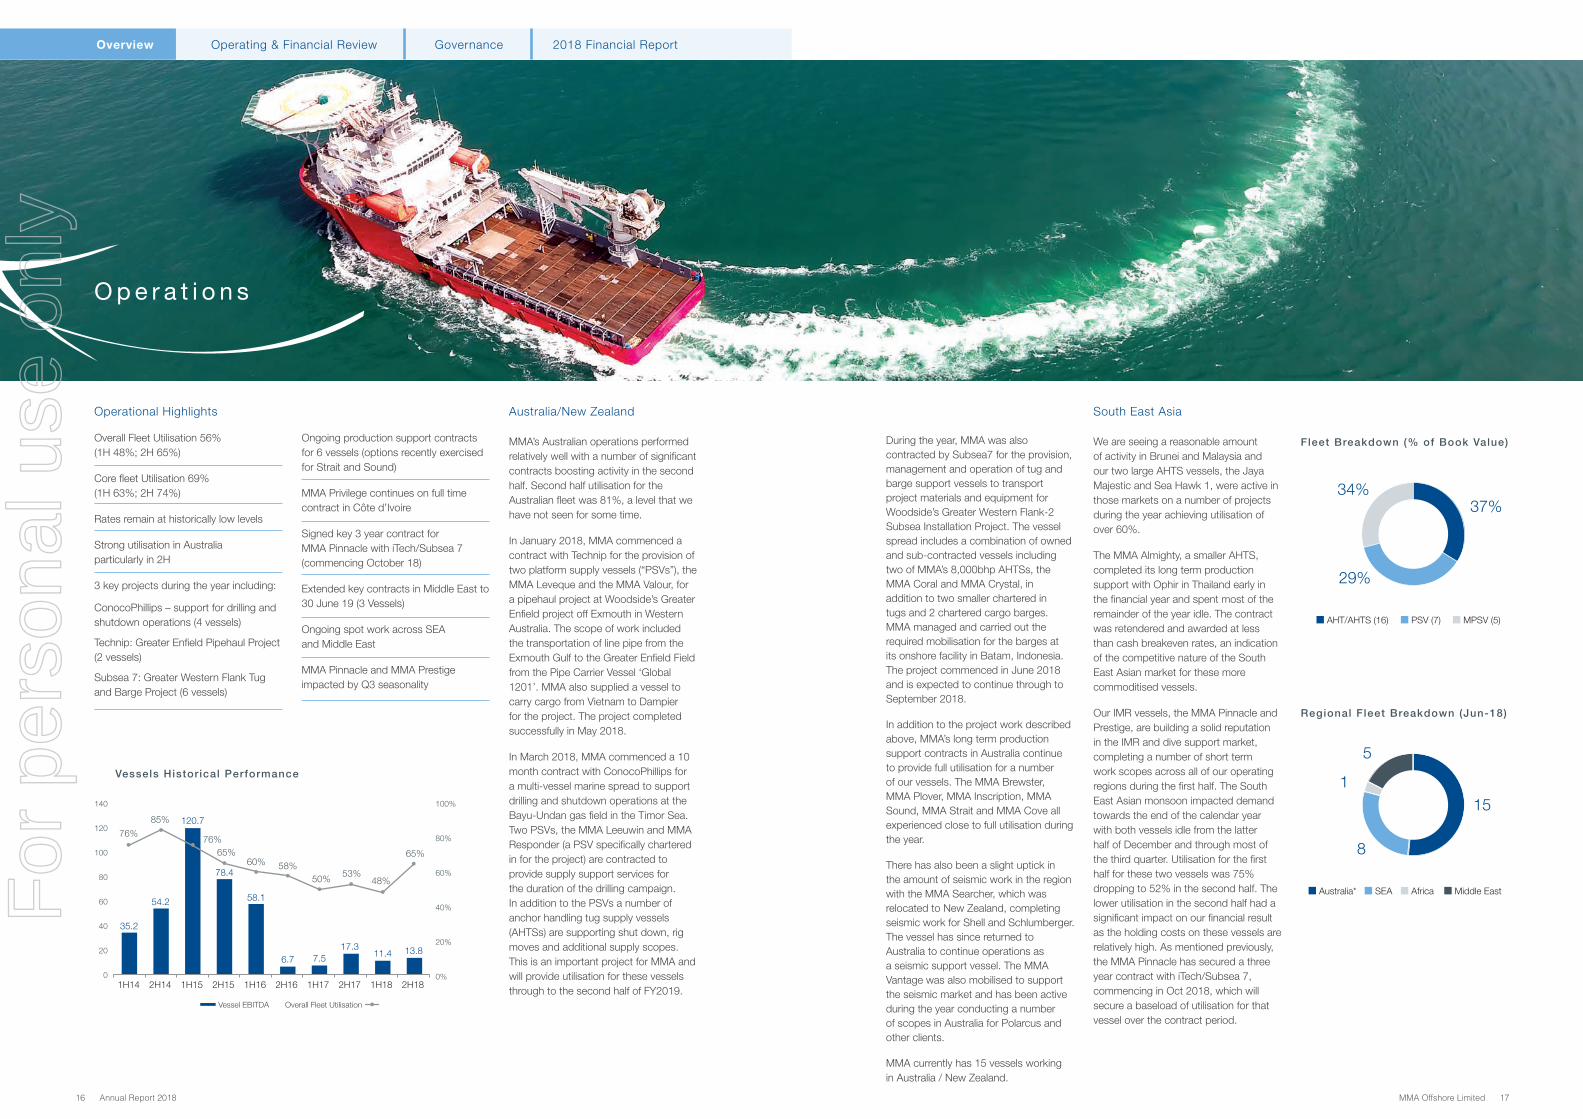
Operational Highlights
Overall Fleet Utilisation 56% (1H 48%; 2H 65%)
Core fleet Utilisation 69% (1H 63%; 2H 74%)
Rates remain at historically low levels
Strong utilisation in Australia particularly in 2H
3 key projects during the year including:
ConocoPhillips – support for drilling and shutdown operations (4 vessels)
Technip: Greater Enfield Pipehaul Project (2 vessels)
Subsea 7: Greater Western Flank Tug and Barge Project (6 vessels)
Ongoing production support contracts for 6 vessels (options recently exercised for Strait and Sound)
MMA Privilege continues on full time contract in Côte d’Ivoire
Signed key 3 year contract for MMA Pinnacle with iTech/Subsea 7 (commencing October 18)
Extended key contracts in Middle East to 30 June 19 (3 Vessels)
Ongoing spot work across SEA and Middle East
MMA Pinnacle and MMA Prestige impacted by Q3 seasonality
Australia/New Zealand
MMA’s Australian operations performed relatively well with a number of significant contracts boosting activity in the second half. Second half utilisation for the Australian fleet was 81%, a level that we have not seen for some time.
In January 2018, MMA commenced a contract with Technip for the provision of two platform supply vessels (“PSVs”), the MMA Leveque and the MMA Valour, for a pipehaul project at Woodside’s Greater Enfield project off Exmouth in Western Australia. The scope of work included the transportation of line pipe from the Exmouth Gulf to the Greater Enfield Field from the Pipe Carrier Vessel ‘Global 1201’. MMA also supplied a vessel to carry cargo from Vietnam to Dampier for the project. The project completed successfully in May 2018.
In March 2018, MMA commenced a 10 month contract with ConocoPhillips for a multi-vessel marine spread to support drilling and shutdown operations at the Bayu-Undan gas field in the Timor Sea. Two PSVs, the MMA Leeuwin and MMA Responder (a PSV specifically chartered in for the project) are contracted to provide supply support services for the duration of the drilling campaign. In addition to the PSVs a number of anchor handling tug supply vessels (AHTSs) are supporting shut down, rig moves and additional supply scopes. This is an important project for MMA and will provide utilisation for these vessels through to the second half of FY2019.
Fleet Breakdown (% of Book Value)
AHT/AHTS (16) PSV (7) MPSV (5)
34%37%
29%
Australia* SEA Africa Middle East
Regional Fleet Breakdown (Jun-18)
5
115
8
2018 Financial ReportOverview GovernanceOperating & Financial Review
Vessels Histor ical Performance
2H161H16 1H17 1H182H17 2H181H14 2H14 1H15 2H15
76%
35.2
54.2
120.7
78.4
58.1
6.7 7.517.3
11.4 13.8
85%
65%60% 58%
50%53%
48%
65%
140
120
100
80
60
40
20
0
100%
80%
60%
40%
20%
0%
Vessel EBITDA
76%
Overall Fleet Utilisation
For
per
sona
l use
onl
y
18 Annual Report 2018 MMA Offshore Limited 19
South East Asia (continued)
The remainder of the international spot fleet had low utilisation of approximately 30%, excluding vessels held for sale, reflective of the ongoing difficult market conditions.
Tendering activity has increased somewhat in recent months with both volume of tenders and quality of counterparties improving.
We are also starting to see the impact of long term laid up vessels on market availability, with some owners’ vessels being disqualified from tender awards due to lack of maintenance and compliance standards. We anticipate that a large proportion of long term laid up vessels will never return to the market due to the significant costs associated with bringing them back to acceptable operating standards. MMA has been diligent in maintaining its vessels throughout the downturn to ensure that they are available for work as and when required.
At this stage it is difficult to say when market conditions will improve, although the region is set for a number of FIDs which should increase activity over time.
MMA currently has 8 vessels working in South East Asia.
Middle East
The MMA Centurion and MMA Chieftain continued their long term contracts for a client in Saudi Arabia achieving full utilisation during the year. A third vessel, the MMA Concordia went back on hire on this contract during the second half following an extended period off hire due to technical difficulties. Pleasingly, these contracts have been extended for a further year and will run through to Jun-19 with a further 1 year option.
The MMA Pride and MMA Cavalier are currently positioned in the Middle East and are working the spot market. These vessels are also mobilised to other regions for specific contracts, for example the Pride has recently been mobilised to Brunei for a 90 day contract.
We are currently seeing strong tendering activity out of the Middle East region although competition remains intense. The Middle East requires a high level of technical and operational expertise and is well suited to MMA’s skillset. As such, MMA is focused on growing our presence in this region.
Africa
The MMA Privilege, a large multipurpose maintenance vessel, is currently on a long term maintenance support contract in Côte d’Ivoire in West Africa. The vessel has been operating in Côte d’Ivoire since it was delivered from MMA’s Batam shipyard in 2016. MMA secured a further one year contract for the vessel in April 2018.
MMA currently does not have any vessels operating in the West African spot market due to the current market conditions but we will transfer vessels into this market on the back of long term contracts.
Whilst market activity in West Africa remains subdued, the longer term prospects for East Africa remain promising with a number of LNG projects flagged for development. In June 2017, ENI sanctioned its Coral South FLNG project in offshore Mozambique. Key EPC contracts have been awarded and the project is targeting first gas in 2022. A final investment decision is also expected on Anadarko’s Mozambique LNG Project in 2019. East Africa is an emerging region with significant gas discoveries and MMA will seek to leverage its experience in frontier LNG developments in Australia to support these projects.
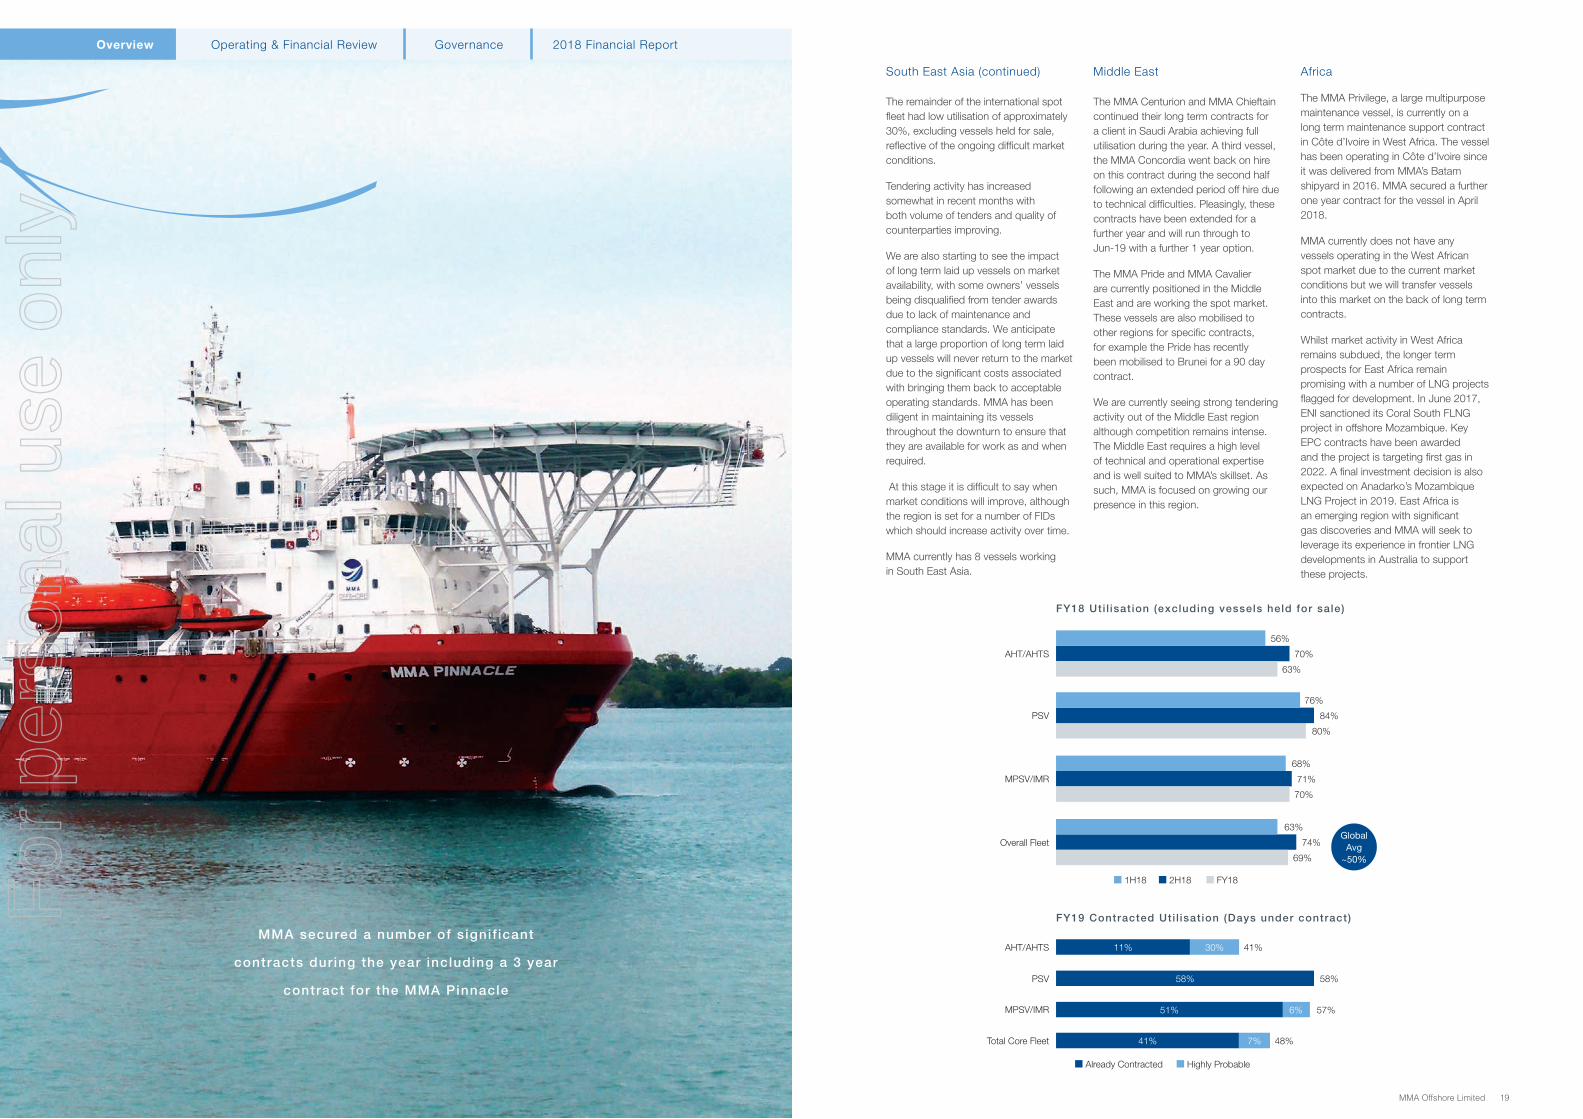
MPSV/IMR
Total Core Fleet
AHT/AHTS
PSV
Already Contracted Highly Probable
FY19 Contracted Uti l isat ion (Days under contract)
30%
58%
51%
41% 7%
6%
11% 41%
58%
57%
48%
MMA secured a number of signif icant
contracts during the year including a 3 year
contract for the MMA Pinnacle
2018 Financial ReportOverview GovernanceOperating & Financial Review
70%
84%
80%
68%
71%
74%
69%
70%
63%
56%
AHT/AHTS
PSV
MPSV/IMR
Overall Fleet
63%
76%
1H18 2H18 FY18
FY18 Uti l isat ion (excluding vessels held for sale)
Global Avg
~50%
For
per
sona
l use
onl
y
20 Annual Report 2018 MMA Offshore Limited 21
• Continued to embed and completed a comprehensive review of our Target 365 Critical Controls. We will roll out an updated set of Target 365 Critical Control’s in FY2019, which have been benchmarked against industry standards; and
• Undertaking our largest ever review of our management systems. In FY2019, we will complete a significant change to our systems to ensure efficient and effective global operations.
MMA continues to be active in industry HSEQ forums by openly sharing lessons learned and through active involvement in events and forums across our global operations. MMA contributed to the International Marine Contractors Association (“IMCA”) Global HSSE Committee as the representative for the Asia Pacific region and is an active member of Safer Together WA/NT in Australia.
Environment
MMA remains committed to achieving the highest standard of environmental performance across all of its business activities.
MMA completed a programme of environmental monitoring and reporting during FY2018, in compliance with our onshore environmental licences.
Quality
During FY2018, MMA attained global accreditation to the revised ISO 9001:2015 Standard and maintained ISO 14001:2015 and OSHAS 18001:2007 internationally.
MMA continues to improve its systems and processes to ensure that they reduce risk and are operationally efficient. In FY2019, we will complete a significant project to align management systems to new industry frameworks.
At MMA Offshore, the health and safety of our employees, contractors, visitors and clients is fundamental to the way we do business.
Our operations are underpinned by our Target 365 Culture, our relentless commitment to the systematic management of health and safety and the environment in which we operate in.
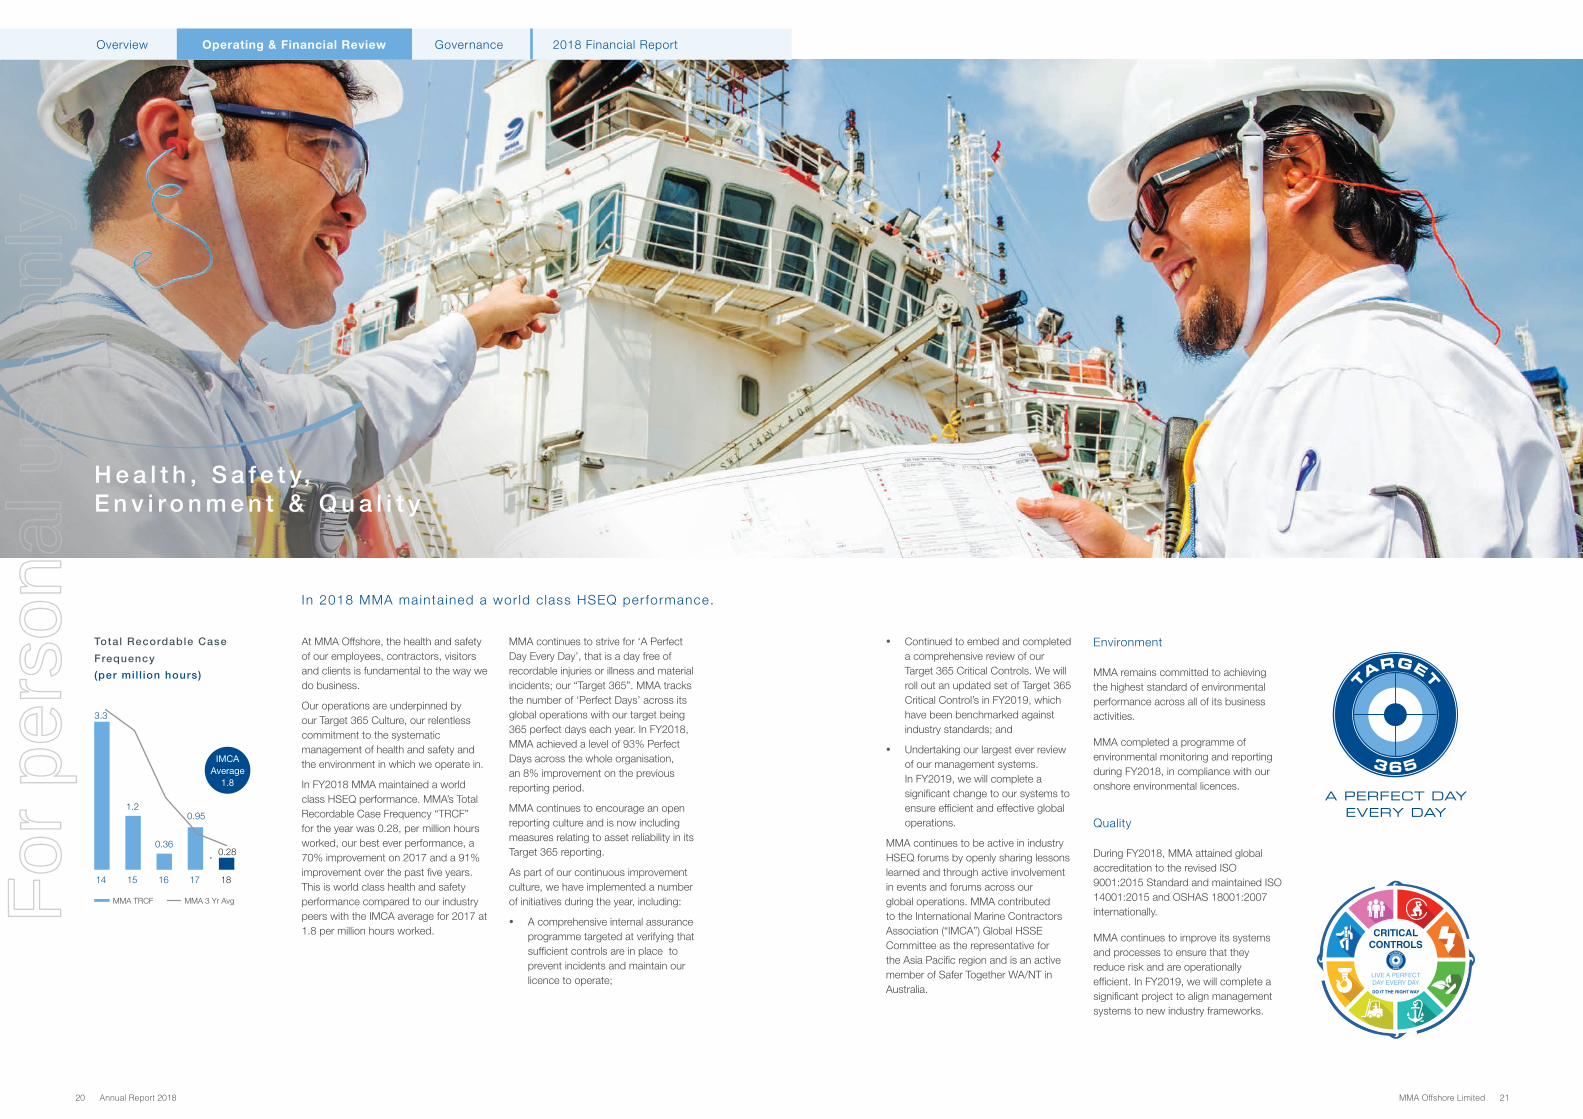
In FY2018 MMA maintained a world class HSEQ performance. MMA’s Total Recordable Case Frequency “TRCF” for the year was 0.28, per million hours worked, our best ever performance, a 70% improvement on 2017 and a 91% improvement over the past five years. This is world class health and safety performance compared to our industry peers with the IMCA average for 2017 at 1.8 per million hours worked.
MMA continues to strive for ‘A Perfect Day Every Day’, that is a day free of recordable injuries or illness and material incidents; our “Target 365”. MMA tracks the number of ‘Perfect Days’ across its global operations with our target being 365 perfect days each year. In FY2018, MMA achieved a level of 93% Perfect Days across the whole organisation, an 8% improvement on the previous reporting period.
MMA continues to encourage an open reporting culture and is now including measures relating to asset reliability in its Target 365 reporting.
As part of our continuous improvement culture, we have implemented a number of initiatives during the year, including:
• A comprehensive internal assurance programme targeted at verifying that sufficient controls are in place to prevent incidents and maintain our licence to operate;
2018 Financial ReportOverview GovernanceOperating & Financial Review
In 2018 MMA mainta ined a wor ld c lass HSEQ performance.
Total Recordable Case
Frequency
(per mil l ion hours)
0.95
0.28
17 18
MMA TRCF MMA 3 Yr Avg
1.2
3.3
0.36
1514 16
CRITICAL CONTROLS
LIVE A PERFECT DAY EVERY DAYDO IT THE RIGHT WAY
IMCA Average
1.8
H e a l t h , S a f e t y,E n v i r o n m e n t & Q u a l i t y
For
per
sona
l use
onl
y

22 Annual Report 2018 MMA Offshore Limited 23
To support its community engagement goals MMA is committed to:
• Investing in local community projects that have a positive and sustainable benefit;
• Seeking business opportunities with local suppliers and subcontractors;
• Striving to be good corporate citizens, conducting business in an ethical manner;
• Developing long term relationships with local indigenous communities in order to increase indigenous participation in our workforce and promote opportunities for training and development; and
• Creating and maintaining cross cultural awareness throughout the business
MMA strives to enhance community participation through the procurement of local goods and services as well as through the promotion of opportunities for training and development. MMA also continues its participation in locally-based industry network groups to enhance its interaction with local stakeholders.
Procurement
Supporting local contractors and vendors (including indigenous businesses) is a key priority for MMA.
Where practical, MMA aims to procure at least 80% of its operational spend through localised supply and service agreements.
We also actively look for ways to develop new capabilities in the communities in which we operate.
Typically, we identify opportunities where local providers have the ability to directly service MMA’s requirements and where this is not possible, we work with counterparties to develop these offerings.
In FY2018 MMA continued to engage with Aboriginal and Torres Strait Islander (“ATSI”) enterprises to support its operations offshore Australia.
The range of products and services supplied by ATSI businesses includes waste management services, office supplies, personal protective equipment, lifting and rigging equipment and consumables, victualling supplies, facilities maintenance, graphic design, and payroll and recruitment services.
Employment
As a business with a global focus, MMA aims to have a workforce that best represents the communities in which we operate.
MMA has a number of targeted employment opportunities and programmes in place including a Timor-Leste Local Content Strategy and an ATSI traineeship programme.
MMA’s operations increased in the Timor Sea during FY2018, as a result of its contract to support operations at ConocoPhillips’ Bayu-Undan project. Through its activities in this region, MMA is committed to providing a marine career pathway for Timorese nationals.
Two STCW-rated cadets have graduated from the Akademi Laut Malaysia Seafarer Program. An additional five Timorese cadets have been recruited and will undertake their study during 2018/19.These graduates will then have the opportunity to enter our international fleet to gain valuable sea time as well as have access to ongoing positions within the fleet.
MMA’s ATSI Traineeship programme is providing marine careers to ATSI people in Northern Australia. With a growing number of vessels operating from Darwin, ATSI communities are a key stakeholder in our operations.
In the last 12 months, one ATSI trainee has successfully completed a Certificate III in Maritime Operations (Integrated Rating) at South Metropolitan TAFE. This trainee has progressed to sea time in order to gain eligibility for an Integrated Rating Certificate of Proficiency. An additional ATSI trainee has commenced the on-shore study component of the traineeship.
Sponsorship
As part of MMA’s ongoing Target 365 rewards programme, business units contributed donations to a range of charities during FY2018 including Motor Neuron Disease Australia, The Starlight Children’s Foundation, Red Nose, The Royal Flying Doctor Service and a range of fundraisers through Everyday Hero.
MMA recognises that supporting community endeavours, either in kind or monetarily, is a responsibility we have to the communities in which we operate. We look forward to continuing our corporate citizenship in FY2019.
MMA is committed to making a posi t ive contr ibut ion to the communit ies in which we operate.
O u r P e o p l e
MMA’s strength l ies in i ts abi l i ty to at t ract and reta in the best people in the business
Top Ten Employee
NationalitiesAustral ia342
Indonesia 123
India 156
Phil ippines 85
Malaysia 81Singapore 58
Ukraine 25Thai land 14Myanmar 13
Timor Leste 5Russian Federat ion 5
At MMA we strive to provide a diverse, high performance workplace built on trust, cooperation and mutual respect.
The key to our success is our ability to attract and retain the best people in the business. This is in part due to a strong culture that unites our people across business groups, countries and vessels, as well as the professional development opportunities that come with a career at MMA.
MMA’s workforce planning principles continue to be based on a dynamic model that plans for the right person, to be in the right job, with the right skills, at the right time.
In 2017, we finalised new Enterprise Agreements covering our Australian marine personnel for a period of four years. The agreements have now been in operation for over a year and will continue to provide certainty to our clients and employees through to 2021.
Additionally, FY2018 saw the continued refinement of MMA’s resource planning and utilisation analysis tools, which has enabled the business to optimise the scheduling of our offshore employees.
Training and Development
MMA is committed to the development of our people through performance feedback, internal development opportunities and training programmes.
MMA continues to focus on providing our people with the right skills so that they can perform their roles safely and competently.
During FY2018, MMA redesigned and renewed its focus on our Performance Management framework with the aim of further embedding a high performance culture within the business.
We have continued with the commitment to providing in-house training activities during the year, with several new training programmes developed to meet specific needs or risks within the business.Throughout the year, 820 employees completed 7,014 individual training programmes. Of these, 80% were developed in-house using MMA’s online learning environment and 859 were verification of competencies completed by our crew onboard a vessel.
MMA also resumed its cadet training programme during the year emphasising its commitment to developing the next generation of ocean going seafarers in Australia. Four Deck and Engineering Officer Graduates commenced with MMA during the past twelve months, with each of these undertaking on-shore study at the Australian Maritime College in Launceston Tasmania.
Aligned closely to their study, each Graduate is gaining valuable sea time experience on vessels from our Australian based fleet.
Diversity
As a business with a global focus, MMA aims to have a workforce that best represents the communities in which we do business.
MMA’s employees are made up of 22 different nationalities, with 519 of our people coming from non-English speaking backgrounds.
Employment opportunities for Timor Leste citizens have increased in line with the company’s increased operational presence in the region.
Increasing the employment opportunities for Indigenous Australians continues to be a focus as well as providing opportunities for women in non-traditional seafaring roles.
In terms of gender diversity, the percentage of women holding senior management positions within the company for FY2018 was as follows:
• Board of Directors - 20%
• Executive Management - 20%
• Senior Management - 26.8%
% Of Women Employed
39.4
Total Organisation
Board of Directors
20.0
Executive Management
20.0
16.7
Senior Management
26.8
18 18 18 18
20.0
28.2
17 17 17 17
42.8
2018 Financial ReportOverview GovernanceOperating & Financial Review
O u r C o m m u n i t y
For
per
sona
l use
onl
y
24 Annual Report 2018 MMA Offshore Limited 25
2018 Financial ReportOverview Operating & Financial Review Governance
Mr Anthony (Tony) John Howarth AO
Former Chairman / Non-Executive Director – Appointed 5 July 2001 – Retired 30 November 2017
Tony was appointed as a Director of the Company on 5 July 2001 and as Chairman of the Company on 1 August 2006. Tony stood down as Chairman of the Company on 27 October 2017 and retired as a Director of the Company on 30 November 2017.
Tony is a Life Fellow of the Financial Services Institute of Australasia, a Fellow of the AICD and has more than 30 years’ experience in the banking and finance industry. He has held several senior management positions during his career, including Managing Director of Challenge Bank Limited and Chief Executive Officer of Hartley’s Limited.
Tony is currently a Non-Executive Director of Wesfarmers Limited, Alinta Energy Pty Limited and BWP Management Limited (the responsible entity for the BWP Trust).
Tony was previously Chairman of Home Building Society Limited, Deputy Chairman of Bank of Queensland Limited and a director of AWB Limited. He is also the former Chairman of St John of God Health Care Inc. and the former Chairman of the West Australian Rugby Union Inc.
He is an Adjunct Professor (Financial Management) at The University of Western Australia Business School and a former member of The University of Western Australia Business School Advisory Board.
Mr Peter Kennan
Non-Executive Director – Appointed 22 September 2017
Peter is currently Managing Partner and CIO of Black Crane Capital. He has 23 years of corporate finance experience across a diverse range of sectors and transactions with Black Crane and previously with UBS Asia and Australia.
The Black Crane Asia Opportunities Fund, managed by Black Crane Capital, is a major shareholder of MMA.
Peter established Black Crane in 2009. Prior to that, he was the Head of Asian Industrials Group for UBS Asia, a corporate finance sector team covering energy, infrastructure, resources, consumer/retail and general industrial companies.
Peter was also the Head of Telecoms and Media sector team for UBS Australia specialising in M&A, advising on many large, complex transactions. Prior to UBS, Peter spent seven years with BP in a variety of engineering and commercial roles.
Peter graduated from Monash University with a Bachelor of Engineering (Honours). He also has completed a Graduate Diploma in Applied Corporate Finance with the Securities Institute of Australia.
Peter is a member of both the Company’s Audit and Risk Committee and the Company’s Nomination and Remuneration Committee.
Mr Chiang Gnee Heng
Non-Executive Director – Appointed 5 July 2012
Chiang Gnee graduated as a Marine Engineer in July 1977 from the University of Newcastle Upon Tyne (UK) and spent almost 30 years working in Singapore government linked companies and in various industries including shipyards, ordnance equipment manufacturing, aircraft engine component manufacturing, amusement and lifestyle businesses and environment management.
In June 1989, Chiang Gnee attended the Sloan School of Management at MIT (USA) and graduated with a Masters in Management in July 1990. He was formerly the CEO of Sembawang Shipyard for 10 years and CEO of Sembcorp Environment Management Pte Ltd for two years until August 2007. Chiang Gnee was also formerly the Executive Director of the Singapore Maritime Institute (SMI) which focuses on the development of the Singapore maritime industry through research. Chiang Gnee was engaged in workplace health and safety management until 31 March 2018 and in vocational technical education in Singapore. He was Chairman of the Singapore Workplace Safety and Health Council and Deputy Chairman of the Institute of Technical Education (ITE) Board of Governors until 30 June 2018.
Chiang Gnee is also a Director of MMA Offshore Asia Pte Ltd (Singapore) and all of its subsidiaries/related companies in Singapore, Malaysia and Indonesia.
In addition, Chiang Gnee is Chair of the Company’s Nomination and Remuneration Committee.
B o a r d o f D i r e c t o r s
Mr Hugh Andrew Jon (Andrew)
Edwards
Chairman – Appointed 27 October 2017
Andrew was appointed as a Director of the Company on 18 December 2009 and as Chairman of the Company on 27 October 2017.
Andrew currently serves as Non-Executive Chairman of MACA Limited and a Non-Executive Director of Nido Petroleum (delisted 26 June 2017).
Andrew is a former Managing Partner of PriceWaterhouseCoopers’ Perth Office (PwC), a former National Vice President of the Securities Institute of Australia (now the Financial Services Institute of Australasia) and a former President of the Western Australian division of that Institute. He is a Fellow of the Australian Institute of Company Directors, a Fellow of Chartered Accountants Australia and New Zealand and has served as a State Councillor of that organisation. Andrew graduated from the University of Western Australia with a Bachelor of Commerce degree.
Andrew is a member of both the Company’s Audit and Risk Committee and the Company’s Nomination and Remuneration Committee.
Ms Eva Alexandra (Eve) Howell
Non-Executive Director – Appointed 27 February 2012
Eve has over 40 years of experience in the Australian and international oil and gas industry in a number of technical and managerial roles. Eve is currently a Non-Executive Director of Buru Energy Ltd. She is also a Senior Adviser to African Geopolitics, a socio-political advisory group helping enterprises work successfully in Africa.
Eve was an Executive Vice President for Woodside Energy Ltd for over five years, initially as the executive in charge of the North West Shelf Project (Australia’s largest petroleum resource project). In addition to her Woodside role, she was also CEO of the North West Shelf Venture (BP, BHP, Chevron, Shell, Woodside and Mitsubishi/Mitsui) from 2006 to 2010. In her final eighteen months with Woodside, she served as the Executive Vice President for Health, Safety & Security for all Woodside’s activities worldwide. Prior to Woodside, she held the position of Managing Director at Apache Energy Ltd.
Eve has previously served on a number of Boards, including Downer EDI Ltd, Tangiers Petroleum Ltd, the Fremantle Port Authority, the Australian Petroleum Production & Exploration Association and was a Board member and President of the Australian Mines and Metals Association. Eve holds a Bachelor of Science (with Honours in Geology and Mathematics) from the University of London and an MBA from Edinburgh Business School and is a graduate of the Australian Institute of Company Directors.
Eve is Chair of the Company’s Audit and Risk Committee and a member of the Company’s Nomination and Remuneration Committee.
Mr Jeffrey Andrew Weber
Managing Director – Appointed 31 December 2002
Jeff began his career as a Marine Engineer with BHP Transport. He went on to complete a degree in this field in 1993 and in 1994 graduated with a Master’s in Engineering and Technology Management from the University of Queensland. During his 19 years with BHP, Jeff gained comprehensive project management experience and helped develop new business for BHP Transport in Australia and South East Asia. He also managed a major initiative with BHP’s steel division, reviewing its logistics arrangements and developing processes to improve services and reduce costs. In 1998, Jeff joined Riverside Marine in Queensland and helped expand its operations Australia wide. This included forming a joint venture company with Wijsmuller International Towage BV, RiverWijs and negotiating with Woodside Petroleum to take over that company’s harbour towage operation in Dampier, Western Australia. Jeff is also a Non-Executive Director of Maritime Super Pty Ltd, a superannuation fund dedicated to employees in the maritime industry.
As Managing Director of MMA, Jeff is responsible for the financial and operational performance of all of the Company’s business lines.
For
per
sona
l use
onl
y
26 Annual Report 2018 MMA Offshore Limited 27
2018 Financial ReportOverview Operating & Financial Review Governance
3rd Edition ASX Corporate Governance Principles and Recommendations Comply
1.5 A listed entity should:
(a) have a diversity policy which includes requirements for the board or a relevant committee of
the board to set measurable objectives for achieving gender diversity and to assess annually
both the objectives and the entity’s progress in achieving them;
Yes
(b) disclose that policy or a summary of it; and Yes
(c) disclose as at the end of each reporting period the measurable objectives for achieving
gender diversity set by the board or a relevant committee of the board in accordance with the
entity’s diversity policy and its progress towards achieving them, and either:
Yes
(1) the respective proportions of men and women on the board, in senior executive positions
and across the whole organisation (including how the entity has defined “senior executive”
for these purposes); or
Yes
(2) if the entity is a “relevant employer” under the Workplace Gender Equality Act, the entity’s
most recent “Gender Equality Indicators”, as defined in and published under that Act.
Yes
1.6 A listed entity should:
(a) have and disclose a process for periodically evaluating the performance of the board, its
committees and individual directors; and
Yes
(b) disclose, in relation to each reporting period, whether a performance evaluation was
undertaken in the reporting period in accordance with that process.
Yes
1.7 A listed entity should:
(a) have and disclose a process for periodically evaluating the performance of its senior
executives; and
Yes
(b) disclose, in relation to each reporting period, whether a performance evaluation was
undertaken in the reporting period in accordance with that process.
Yes
Principle 2: Structure the Board to add value
2.1 The board of a listed entity should:
(a) have a nomination committee which: Yes
(1) has at least three members, a majority of whom are independent directors; and Yes
(2) is chaired by an independent director, Yes
and disclose:
(3) the charter of the committee; Yes
(4) the members of the committee; and. Yes
(5) as at the end of each reporting period, the number of times the committee met
throughout the period and the individual attendances of the members at those meetings;
or
Yes
(b) if it does not have a nomination committee, disclose that fact and the processes it employs
to address board succession issues and to ensure that the board has the appropriate
balance of skills, knowledge, experience, independence and diversity to enable it to
discharge its duties and responsibilities effectively.
N/A
C o r p o r a t e G o v e r n a n c e
Corporate Governance
The Board of Directors (“Board”) of MMA Offshore Limited (“Company” or “MMA”) is responsible for the corporate governance of the consolidated entity. The Board is a strong advocate of good corporate governance.
Compliance with Australian Corporate Governance Standards
The Board believes that the Company follows the 3rd edition of the Corporate Governance Principles and Recommendations (“3rd Edition ASX Principles”) set by the ASX Corporate Governance Council, or where it does not, has sound reasons for not doing so as explained in the Company’s Corporate Governance Statement.
Access to Corporate Governance Statement
The Company’s Corporate Governance Statement which outlines the Company’s corporate governance policies and practices for the year ended 30 June 2018, can be found on the Company’s website at www.mmaoffshore.com/investor-centre/corporate-governance.
The Company’s Corporate Governance Statement is current as at 20 September 2018 and has been approved by the Board.
ASX Corporate Governance Council Recommendations Checklist
ASX Listing Rule 4.10.3 requires companies to disclose the extent to which they have complied with the 3rd Edition ASX Principles and the reason for any departure from the 3rd Edition ASX Principles.
The table below lists each of the 3rd Edition ASX Principles and the Company’s assessment of its compliance with these for the year ended 30 June 2018. The Company’s Corporate Governance Statement sets out in greater detail the Company’s assessment of its compliance with the 3rd Edition ASX Principles.
3rd Edition ASX Corporate Governance Principles and Recommendations Comply
Principle 1: Lay solid foundations for management and oversight
1.1 A listed entity should disclose:
(a) the respective roles and responsibilities of its board and management; and Yes
(b) those matters expressly reserved to the board and those delegated to management. Yes
1.2 A listed entity should:
(a) undertake appropriate checks before appointing a person, or putting forward to security
holders a candidate for election as a director; and
Yes
(b) provide security holders with all material information in its possession relevant to a decision
on whether or not to elect or re-elect a director.
Yes
1.3 A listed entity should have a written agreement with each director and senior executive setting
out the terms of their appointment.
Yes
1.4 The company secretary of a listed entity should be accountable directly to the board, through the
chair, on all matters to do with the proper functioning of the board.
Yes
For
per
sona
l use
onl
y

MMA Offshore Limited 29
2018 Financial ReportOverview Operating & Financial Review Governance
28 Annual Report 2018
3rd Edition ASX Corporate Governance Principles and Recommendations Comply
4.2 The board of a listed entity should, before it approves the entity’s financial statements for a financial period, receive from its CEO and CFO a declaration that, in their opinion, the financial records of the entity have been properly maintained and that the financial statements comply with the appropriate accounting standards and give a true and fair view of the financial position and performance of the entity and that the opinion has been formed on the basis of a sound system of risk management and internal control which is operating effectively.
Yes
4.3 A listed entity that has an AGM should ensure that its external auditor attends its AGM and is available to answer questions from security holders relevant to the audit.
Yes
Principle 5: Make timely and balanced disclosure
5.1 A listed entity should:
(a) have a written policy for complying with its continuous disclosure obligations under the
Listing Rules; and
Yes
(b) disclose that policy or a summary of it. Yes
Principle 6: Respect the rights of shareholders
6.1 A listed entity should provide information about itself and its governance to investors via its website.
Yes
6.2 A listed entity should design and implement an investor relations programme to facilitate effective two-way communications with investors.
Yes
6.3 A listed entity should disclose the policies and procedures it has in place to facilitate and encourage participation at meetings of security holders.
Yes
6.4 A listed entity should give security holders the option to receive communication from and send communications to, the entity and its security registry electronically.
Yes
Principle 7: Recognise and manage risk
7.1 The board of a listed entity should:
(a) have a committee or committees to oversee risk, each of which: Yes
(1) has at least three members, a majority of whom are independent directors; and; Yes, but a brief period of non-compliance during the reporting period
(2) is chaired by an independent director, Yes, but a brief period of non-compliance during the reporting period
and disclose:
(3) the charter of the committee; Yes
(4) the members of the committee; and; Yes
(5) as at the end of each reporting period, the number of times the committee met
throughout the period and the individual attendances of the members at those meetings;
or
Yes
(b) if it does not have a risk committee or committees that satisfy (a) above, disclose that fact
and the processes it employs for overseeing the entity’s risk management framework.
N/A
3rd Edition ASX Corporate Governance Principles and Recommendations Comply
2.2 A listed entity should have and disclose a board skills matrix setting out the mix of skills and
diversity that the board currently has or is looking to achieve in its membership.
Yes
2.3 A listed entity should disclose:
(a) the names of the directors considered by the board to be independent directors; Yes
(b) if a director has an interest, position, association or relationship of the type described in
Box 2.3 (Factors relevant to assessing the independence of a director) but the board is of
the opinion that it does not compromise the independence of the director, the nature of the
interest, position, association or relationship in question and an explanation of why the board
is of that opinion; and.
Yes
(c) the length of service of each director. Yes
2.4 A majority of the board of a listed entity should be independent directors. Yes
2.5 The chair of the board of a listed entity should be an independent director and, in particular,
should not be the same person as the CEO of the entity.
Yes
2.6 A listed entity should have a programme for inducting new directors and provide appropriate
professional development opportunities for directors to develop and maintain the skills and
knowledge needed to perform their role as directors effectively.
Yes
Principle 3: Act Ethically and Responsibly
3.1 A listed entity should:
(a) have a code of conduct for its directors, senior executives and employees; and Yes
(b) disclose that code or a summary of it. Yes
Principle 4: Safeguard Integrity in Corporate Reporting
4.1 The board of a listed entity should:
(a) have an audit committee which: Yes
(1) has a least three members, all of whom are non-executive directors and a majority of
whom are independent directors; and
Yes, but a brief period of non-compliance during the reporting period
(2) is chaired by an independent director who is not the chair of the board, Yes, but a brief period of non-compliance during the reporting period
and disclose:
(3) the charter of the committee; Yes
(4) the relevant qualifications and experience of the members of committee; and Yes
(5) in relation to each reporting period, the number of times the committee met throughout
the period and the individual attendances of the members at those meetings; or
Yes
(b) if it does not have an audit committee, disclose that fact and the processes it employs that
independently verify and safeguard the integrity of its corporate reporting, including the
processes for the appointment and removal of the external auditor and the rotation of the
audit engagement partner.
N/A
For
per
sona
l use
onl
y
30 Annual Report 2018 MMA Offshore Limited 31
2018 Financial ReportOverview Operating & Financial Review Governance
3rd Edition ASX Corporate Governance Principles and Recommendations Comply
7.2 The board or a committee of the board should:
(a) review the entity’s risk management framework at least annually to satisfy itself that it
continues to be sound; and
Yes
(b) disclose, in relation to each reporting period, whether such a review has taken place. Yes
7.3 A listed entity should disclose:
(a) if it has an internal audit function, how the function is structured and what role it performs; or Yes
(b) if it does not have an internal audit function, that fact and the processes it employs for
evaluating and continually improving the effectiveness of its risk management and internal
control processes.
N/A
7.4 A listed entity should disclose whether it has any material exposure to economic, environmental and social sustainability risks, and if it does, how it manages or intends to manage those risks.
Yes
Principle 8: Remunerate fairly and responsibly
8.1 The board of a listed entity should:
(a) have a remuneration committee which: Yes
(1) has at least three members, a majority of whom are independent directors; and Yes
(2) is chaired by an independent director, Yes
and disclose:
(3) the charter of the committee; Yes
(4) the members of the committee; and; Yes
(5) as at the end of each reporting period, the number of times the committee met
throughout the period and the individual attendances of the members at those meetings;
or
Yes
(b) if it does not have a remuneration committee, disclose that fact and the processes it employs
for setting the level and composition of remuneration for directors and senior executives and
ensuring that such remuneration is appropriate and not excessive.
N/A
8.2 A listed entity should separately disclose its policies and practices regarding the remuneration of non-executive directors and the remuneration of executive directors and other senior executives.
Yes
8.3 A listed entity which has an equity-based remuneration scheme should:
(a) have a policy on whether participants are permitted to enter into transactions (whether
through the use of derivatives or otherwise) which limit the economic risk of participating in
the scheme; and
Yes
(b) disclose that policy or a summary of it. Yes
D i r e c t o r s ’ R e p o r t
The Directors of MMA Offshore Limited (“Company” or “MMA”) present their Directors’ Report (including the Remuneration Report) together with the Financial Statements of the consolidated entity, being the Company and its controlled entities, for the financial year ended 30 June 2018.
Directors
During the financial year, as part of the Board renewal program:
• Mr Peter Kennan was appointed as a Non-Executive Director of the Company on 22 September 2017;
• Mr Andrew Edwards assumed the role of Chairman from Mr Tony Howarth on 27 October 2017; and
• Mr Tony Howarth retired as a Non-Executive Director of the Company on 30 November 2017.
The names and particulars of the Company’s Directors in office during or since the end of the financial year are set out on pages 24 to 25 (including their qualifications, experience and special responsibilities).
With the exception of Mr Tony Howarth (who retired as a director on 30 November 2017) and Mr Peter Kennan (who was appointed as a director on 22 September 2017), the Directors of the Company held office during the whole of the financial year and since the end of the financial year.
Directorships of Other Listed Companies
Directorships of other listed companies held by the Directors in the three years immediately before and since the end of the financial year are as follows:
Name Company Period of Directorship
Mr A Edwards Nido Petroleum Limited (delisted 26 June 2017) Since December 2009
MACA Limited Since October 2010
Mr A Howarth(1) Wesfarmers Limited Since July 2007
BWP Management Limited Since October 2012
Ms E Howell Downer EDI Limited January 2012 – November 2017
Buru Energy Limited Since July 2014
(1) Mr A Howarth retired as a Director on 30 November 2017
Directors’ Shareholdings
The following table sets out each current Director’s relevant interest in the securities of the Company as at the date of this report:
NameFully paid ordinary
shares directFully paid ordinary
shares indirectPerformance rights direct
Mr A Edwards - 231,360 -
Mr J Weber - 3,815,916 -
Ms E Howell - 247,058 -
Mr C G Heng 200,000 - -
Mr P Kennan(1) - 77,419,000 -
(1) Mr P Kennan was appointed as a Director on 22 September 2017
The Directors do not have any interests in shares, options or rights of any related body corporate of the Company as at the date of this report.
For
per
sona
l use
onl
y

32 Annual Report 2018 MMA Offshore Limited 33
2018 Financial ReportOverview Operating & Financial Review Governance
Remuneration of Key Management Personnel
Information about the remuneration of key management personnel is set out in the Remuneration Report section of this Directors’ Report on pages 35 to 44.
Rights Granted to Directors and Senior Management
During the financial year, no performance rights were granted to either the Managing Director or any key management personnel as part of their remuneration.
Company Secretary
Dylan Darbyshire-Roberts, solicitor, held the position of Company Secretary of the Company at the end of the financial year.
Dylan joined the Company in May 2007 in the role of Commercial Manager and was appointed as Company Secretary of MMA Offshore Limited on 19 August 2008.
Previously, he was a Senior Associate with the law firm DLA Piper where he practised in the areas of insurance, corporate and marine law. After obtaining a Bachelor of Commerce degree (1995) and a LLB degree (1997) at the University of Natal (PMB), Dylan qualified as a Solicitor in South Africa, New South Wales and Western Australia. Dylan has worked in a legal capacity in all of these jurisdictions as well as the UK over the past 20 years. He holds a Graduate Diploma of Applied Corporate Governance and is a Fellow of the Institute of Chartered Secretaries and Administrators and the Governance Institute of Australia.
Principal Activities
The principal activities and operations of the consolidated entity during the financial year were the provision of marine logistics and marine services to the offshore oil and gas industry.
During the financial year, the Company completed an equity raise and amendments to its debt facilities. Details of these are contained in notes 3.8 and 4.1 to the financial statements. Other than as previously referred to in the annual report, there were no other significant changes in the nature of the activities of the consolidated entity during the financial year.
Review of Operations
A review of the operations of the consolidated entity during the financial year and the results of those operations are set out in the Chairman’s Address and the Managing Director’s Report on pages 4 - 9.
Changes in State of Affairs
The Chairman’s Address and the Managing Director’s Report (on pages 4 - 9) sets out a number of matters which have had a significant effect on the state of affairs of the consolidated entity. Other than those matters, there was no significant change in the state of affairs of the consolidated entity.
Subsequent Events
There has not been any matter or circumstance occurring subsequent to the end of the financial year that has significantly affected, or may significantly affect, the operations of the consolidated entity, the results of those operations, or the state of affairs of the consolidated entity in future financial years.
Future Developments
In general terms, the Chairman’s Address and the Managing Director’s Report (on pages 4 - 9) gives an indication of likely developments and the expected results of those operations.
Environmental Regulations
The Company continues to conduct its operations within the parameters of the Department of Environmental and Conservation Licence and Ministerial requirements. There were no known breaches of licence conditions for the year ended 30 June 2018.
Dividends
In respect of the financial year ended 30 June 2017, as detailed in the Directors’ Report for that financial year, the Directors suspended the payment of dividends (both interim and final) in order to retain cash to support business operations until market conditions improve.
This position remains the same in respect of the financial year ended 30 June 2018. Accordingly, no interim or final dividend has been recommended, declared or paid for the 2018 financial year.
Unissued Shares under Rights
As at the date of this report, there are no unissued shares under rights.
Shares Issued on Vesting of Rights
No shares were issued during or since the end of the financial year as a result of the vesting of rights.
Insurance and Indemnification of Directors and Officers
During the financial year, the Company paid a premium in respect of a contract insuring the Directors of the Company, the Company Secretary and all Executive Officers of the Company and of any related body corporate against a liability incurred in acting in their capacity as a Director, Company Secretary or Executive Officer of the Company to the extent permitted by the Corporations Act 2001 (Cth). The relevant contract of insurance prohibits disclosure of the nature of the liability and the amount of the premium.
The Company’s Constitution requires the Company, so far as permitted under applicable law and to the extent the person is not otherwise indemnified, to indemnify each officer of the Company and its wholly owned subsidiaries, and may indemnify its auditors, against a liability incurred as such by an officer or auditor to any person (other than the Company or a related body corporate) including a liability incurred as a result of appointment or nomination by the Company or subsidiary as trustee or as an officer of another corporation, unless the liability arises out of conduct involving a lack of good faith. The Company has entered into Deeds of Indemnity, Insurance and Access with each of the Directors of the Company and its wholly owned subsidiaries in terms of the indemnity provided under the Company’s Constitution.
The Company has not otherwise, during or since the end of the financial year, except to the extent permitted by law, indemnified or agreed to indemnify an officer or auditor of the Company or of any related body corporate against any liability incurred in acting in their capacity as such an officer of the Company.
No indemnity payment has been made under any of the documents referred to above during or since the end of the financial year.
Indemnification of Auditors
The Company’s auditor is Deloitte.
The Company has agreed with Deloitte, as part of its terms of engagement, to indemnify Deloitte against certain liabilities to third parties arising from the audit engagement. The indemnity does not extend to any liability resulting from the wilful misconduct or fraudulent act or omission by Deloitte.
During the financial year:
• The Company has not paid, or agreed to pay, any premium in relation to any insurance for Deloitte or a body corporate related to Deloitte.
• No indemnity payment has been made under any of the documents referred to above during or since the end of the financial year.
• There were no officers of the Company who were former partners or directors of Deloitte, whilst Deloitte conducted audits of the Company.F
or p
erso
nal u
se o
nly

34 Annual Report 2018 MMA Offshore Limited 35
2018 Financial ReportOverview Operating & Financial Review Governance
Directors’ Meetings
The following table sets out the number of Directors’ meetings (including meetings of Committees of Directors) held during the financial year and the number of meetings attended by each Director (while they were a Director or Committee member). During the financial year, 9 Board meetings, 4 Audit and Risk Committee meetings and 3 Nomination and Remuneration Committee meetings were held.
Board of Directors Audit and Risk CommitteeNomination and
Remuneration Committee
Name Held Attended Held Attended Held Attended
Mr A Edwards 9 9 4 4 3 3
Mr A Howarth(1) 6 6 2 2 1 1
Mr J Weber 9 9 4 4 3 3
Ms E Howell 9 9 4 4 3 3
Mr CG Heng 9 9 4 4 3 3
Mr P Kennan(2) 6 6 2 2 2 2
(1) Mr A Howarth retired as a Director on 30 November 2017.(2) Mr P Kennan was appointed as a Director on 22 September 2017
Proceedings on Behalf of the Company
No proceedings have been brought on behalf of the Company, nor has any application been made in respect of the Company, under section 237 of the Corporations Act 2001 (Cth).
Non-Audit Services
Details of the amounts paid or payable to the external auditor for non-audit services provided during the year are outlined in note 5.5 to the Financial Statements.
During the year, the Company paid Deloitte the sum of $300,497 for the provision of non-audit services (being extensive debt restructuring advice) and the sum of $600,258 for the provision of audit services. The Directors are satisfied that the provision of non-audit services during the year by the external auditor (or by another person or firm on the auditor’s behalf) is compatible with the general standard of independence for auditors imposed by the Corporations Act 2001 (Cth).
The Directors are of the opinion that the services as disclosed in note 5.5 to the Financial Statements do not compromise the external auditor’s independence, based on advice received from the Audit and Risk Committee, for the following reasons:
• All non-audit services have been reviewed and approved to ensure that they do not impact the integrity and objectivity of the auditor; and
• None of the services undermine the general principles relating to auditor independence as set out in APES 110 ‘Code of Ethics for Professional Accountants’ issued by the Accounting Professional & Ethical Standards Board, including reviewing or auditing the auditor’s own work, acting in a management or decision making capacity for the Company, acting as an advocate for the Company or jointly sharing economic risks and rewards.
Auditor’s Independence Declaration
The Auditor’s Independence Declaration is included on page 45 of this Annual Report.
Rounding Off of Amounts
The Company is a company of the kind referred to in ASIC Corporations (Rounding in Financials/Directors’ Reports) Instrument 2016/191, dated 24 March 2016, and in accordance with that Corporations Instrument, amounts in the Directors’ Report and the Financial Statements are rounded off to the nearest thousand dollars, unless otherwise indicated.
Remuneration Report
This Remuneration Report, which forms part of the Directors’ Report, outlines the remuneration of the Company’s key management personnel for the financial year ended 30 June 2018.
The Company’s ‘key management personnel’ are those persons who have authority and responsibility for planning, directing and controlling the activities of the consolidated entity, either directly or indirectly, including any Director (whether executive or otherwise) of the consolidated entity.
The prescribed details for each person covered by this Remuneration Report are detailed below under the following headings:
• Key Management Personnel;
• Remuneration Policy;
• Relationship between the Remuneration Policy and Company Performance;
• Remuneration of Key Management Personnel; and
• Key Terms of Employment Contracts.
Key Management Personnel
The Directors and other key management personnel of the consolidated entity during and since the end of the financial year were:
Executive Director Non-Executive Directors
Mr J Weber (Managing Director) Mr A Edwards (Chairman)(1)
Mr A Howarth (former Chairman) – retired(2)
Ms E Howell
Mr CG Heng
Mr P Kennan(3)
Other Key Management Personnel
Current KMP
Mr D Ross (Chief Operating Officer)
Mr D Cavanagh (Chief Financial Officer)(4)
Mr D Roberts (General Manager Legal/Company Secretary)
Ms L Buckey (General Manager Corporate Development)
Mr D Thomas (General Manager People and Safety)(5)
Former KMP
Mr P Raynor (former Chief Financial Officer)(6)
Mr M Gillett (former General Manager Human Resources)(7)
(1) Appointed as Chairman on 27 October 2017(2) Retired on 30 November 2017(3) Appointed on 22 September 2017(4) Appointed on 4 December 2017(5) Appointed to the position of General Manager People and Safety on 22 March 2018(6) Ceased employment on 21 December 2017(7) Ceased employment on 22 March 2018
Apart from Mr A Edwards, Mr A Howarth, Mr P Kennan, Mr D Cavanagh, Mr D Thomas, Mr P Raynor and Mr M Gillett (who only held their respective positions for part of the financial year), the above named persons held their current position for the whole of the financial year and since the end of the financial year.F
or p
erso
nal u
se o
nly
36 Annual Report 2018 MMA Offshore Limited 37
2018 Financial ReportOverview Operating & Financial Review Governance
Remuneration Policy
The Nomination and Remuneration Committee is delegated responsibility by the Board for reviewing the remuneration packages of all Directors and key management personnel on an annual basis and making recommendations to the Board in this regard. The specific responsibilities of the Nomination and Remuneration Committee are set out in the Committee’s Charter, which can be found on the Corporate Governance page of our website at www.mmaoffshore.com/investor-centre/corporate-governance.
Remuneration packages are typically reviewed and determined with due regard to current market rates and are benchmarked against comparable industry salaries and are adjusted to reflect changes in the performance of the Company.
Given current financial constraints, the Nomination and Remuneration Committee carried out an internal review of the remuneration packages of the Managing Director and non-director key management personnel for the 2018 financial year, without engaging the services of an independent remuneration consultant. The Board is satisfied that the remuneration recommendations made by the Nomination and Remuneration Committee were free from undue influence by any member of the key management personnel to whom the recommendations relate.
Key Remuneration Outcomes
Having regard to the overall performance of the Company during the 2018 financial year and current market conditions, the key remuneration outcomes for the Company’s key management personnel in 2018 were as follows:
Fixed Annual Remuneration (FAR)
• The Managing Director, Chief Financial Officer (former) and Chief Operating Officer accepted a 10% decrease in FAR for the 2018 financial year.
• The other Senior Management of the Company did not receive any increase in FAR for the 2018 financial year.
Short-term Incentive (STI)
• The Board exercised its discretion to suspend the STI component in relation to the Managing Director and other key management personnel for the 2018 financial year.
Long-term Incentive (LTI)
• The Board exercised its discretion to suspend the LTI component in relation to the Managing Director and other key management personnel for the 2018 financial year.
Remuneration Report 2017
MMA Offshore Limited’s Remuneration Report for the 2017 financial year was adopted at the Annual General Meeting on 19 December 2017 with a clear majority of 396,521,717 votes in favour of the motion (representing 77% of the votes received).
Non-Executive Directors’ Remuneration
Non-Executive Directors’ fees are determined within an aggregate Directors’ fee pool which is periodically recommended for approval by shareholders. The maximum fees payable to Non-Executive Directors are currently $950,000 per annum in aggregate (as approved by shareholders at the Company’s AGM on 22 November 2012).
Non-Executive Directors are paid fixed fees for their services in accordance with the Company’s Constitution. Fees paid to Non-Executive Directors are set at levels which reflect both the responsibilities of, and time commitments required from each Non-Executive Director to discharge their duties. Non-Executive Directors’ fees are reviewed annually by the Board to ensure they are appropriate for the duties performed, including Board committee duties, and are in line with the market. Non-Executive Directors do not receive performance-based remuneration. Other than statutory superannuation, Directors are not entitled to retirement allowances.
For the 2018 financial year, there was a general 10% decrease in Non-Executive Directors’ fees, with the Chairman agreeing to a 27% decrease in fees for the 2018 financial year.
In addition, following a review by the Nomination and Remuneration Committee, there has been no increase in Non-Executive Directors’ fees for the 2019 financial year.
Other Key Management Personnel
Remuneration of the Managing Director and other executive key management personnel generally comprises both a fixed component and an incentive or “at-risk” component, which is designed to remunerate key management personnel for increasing shareholder value and for achieving financial targets and business strategies set by the Board.
The remuneration of the Managing Director and other key management personnel has the following three components:
No. Remuneration Component Details
1 Fixed Annual Remuneration (FAR) • Comprising base salary and superannuation.
• In setting FAR, consideration is given to current market rates and industry benchmarking against appropriate comparator groups (including the median market rates within the sector and industry peers), Company performance and individual performance.
• As previously reported, the Managing Director, Chief Financial Officer (former) and Chief Operating Officer accepted a 10% decrease in FAR for the 2018 financial year. The other Senior Management of the Company did not receive any increase in FAR for the 2018 financial year.
• Given the performance of the Company and current market conditions, the Board has determined that for the 2019 financial year:
(a) The Managing Director, Chief Financial Officer (current) and Chief Operating Officer will not receive any increase in FAR; and
(b) The other key management personnel will receive a general increase in FAR of 2.9% - with some additional realignment for those key management personnel whose roles changed.
2 Short-term Incentive (STI) • An annual “at-risk” cash component designed to reward performance against the achievement of key performance indicators (KPIs) set by the Board.
• The invitation to participate in the STI is at the absolute discretion of the Board and is subject to such conditions which the Board may prescribe from time to time.
• As previously reported, given the performance of the Company and current market conditions, the Board exercised its discretion to suspend the STI component for the 2018 financial year.
• Once again, the Board has exercised its discretion to suspend the STI component for the 2019 financial year (subject always to the Board’s discretion to reinstate the STI component if the Company’s performance or market conditions change).
3 Long-term Incentive (LTI) • The Company grants rights over its ordinary shares under the LTI.
• The vesting of these rights is based on the achievement of stipulated performance criteria targets over a 3 year period.
• The LTI also aims to align executives’ long-term interests with those of shareholders and to retain executives.
• Given the performance of the Company and current market conditions, the Board exercised its discretion to suspend the LTI component for the 2018 financial year.
• The Board has exercised its discretion to reinstate the LTI component for the 2019 financial year. The Board is currently developing a new LTI plan. It is anticipated that the new LTI Plan – which will have a 3 year performance period (expiring 1 July 2021) – will include performance hurdles relating to Relative TSR (50% weighting), Net Debt to EBITDA ratio (25% weighting) and Debt Refinancing (25% weighting) targets. The new LTI Plan for the Managing Director will be presented for shareholder approval at the Company’s 2018 AGM. The Board considers that the reinstatement of the LTI Plan and the selection of these performance hurdles is appropriate in the current circumstances to achieve its business turnaround strategy, to retain key management personnel within the Company and to achieve the strategic objectives of the Company.
For
per
sona
l use
onl
y

38 Annual Report 2018 MMA Offshore Limited 39
2018 Financial ReportOverview Operating & Financial Review Governance
Allocation of Executive Remuneration between Fixed and Variable Remuneration
The allocation of total executive remuneration between fixed and variable remuneration for the 2018 financial year is as follows:
Relationship between the Remuneration Policy and Company Performance
The table below summarises information about the Company’s earnings for the 2018 financial year and the Company’s earnings and movements in shareholder wealth for the five years to 30 June 2018, which is a key factor in the Board’s decision to suspend both the STI and LTI remuneration components for the 2018 financial year.
30 June 2018 $’000
30 June 2017 $’000
30 June 2016 $’000
30 June 2015 $’000
30 June 2014 $’000
Revenue 200,444 256,396 481,123 796,666 594,597
Net profit/(loss) before tax (27,376)(3) (379,791)(3) (155,262)(3) (48,219) 77,112
Net profit/(loss) after tax (27,909) (378,032) (143,962) (51,291) 53,884
Share price at start of the year $0.15 $0.31 $0.54 $2.06 $3.52
Share price at end of the year $0.25 $0.15 $0.31 $0.54 $2.06
Interim dividend(1) 0cps 0cps 0cps 4.0cps 5.5cps
Final dividend(1) 0cps 0cps 0cps 1.5cps 7.0cps
Basic earnings per share (4.11cps) (93.86cps)(4) (38.64 cps) (13.91 cps) 18.78cps
Diluted earnings per share (4.11cps) (93.86cps)(4) (38.64 cps) (13.91 cps) 18.76cps
3 year compound annual TSR(2) (21%) (49%) (46%) (32%) (9%)
(1 ) Franked to 100% at 30% corporate income tax rate.(2) TSR comprises share price growth and dividends.(3) This includes a non-cash impairment reversal of $8.4 million against the carrying value of the Company’s assets as at 30 June 2018 [2017: $312
million impairment charge and 2016: $139 million impairment charge].(4) The calculations of the 30 June 2017 basic and diluted earnings per share have been retrospectively adjusted to reflect the impact of the capital
raising during this reporting period.
2%
98%
Managing Director Other Executives (Maximum)
FAR LTI FAR LTI
2%
98%
Remuneration of Key Management Personnel
In this Annual Report, remuneration outcomes are presented based on the requirements of accounting standards (which has the benefit of being readily comparable with other companies) rather than the actual “take-home” pay received by executive key management personnel (being cash, other benefits and the value of equity vesting during the relevant financial year).
An example of this includes LTI awards which are recognised and accounted for over the performance period (3 years) based on their assessed value when originally granted to the executive. This may be significantly different to their value, if and when the incentive vests to that executive.
The following tables disclose:
(A) The actual remuneration of the Directors and other key management personnel of the Company for the 2018 financial year (i.e. the actual “take-home” pay received by key management personnel for the 2018 financial year); and
(B) The statutory presentation of the remuneration of the Directors and other key management personnel of the Company for the 2018 financial year and for the previous financial year based on the requirements of accounting standards.
(A) Key Management Personnel Remuneration (Actual)
Short-term employee benefits Post-employment benefits
Share based
payments Total
2018Salary &
feesCash
bonusNon-
monetary(2) Superannuation Termination
Annual/Long Service Leave
Payout Rights(3)
$ $ $ $ $ $ $ $DirectorsMr A Howarth(1) 70,271 - 19 6,676 - - - 76,966Mr A Edwards 143,116 - - 13,596 - - 156,712Mr J Weber 847,747 - 1,237 25,000 - - - 873,984Mr P Kennan(1) 71,399 - - - - - 71,399Ms E Howell 100,569 - - 9,554 - - 110,123Mr CG Heng 99,457 - - 5,648 - - 105,105Senior ManagementMr D Ross 504,999 - 48,925 17,308 - - - 571,232Mr P Raynor(1) 238,828 - 2,608 12,212 - 247,421 - 501,069Mr D Cavanagh(1) 192,083 - - 12,067 - - - 204,150Mr D Roberts 310,633 - 3,929 20,049 - - - 334,611Mr M Gillett(1) 247,359 - 120 14,651 216,011 67,321 - 545,462Ms L Buckey(4) 201,379 - - 19,131 - - - 220,510Mr D Thomas 296,892 - - 20,049 - - - 316,941Total 3,324,732 - 56,838 175,941 216,011 314,742 - 4,088,264
(B) Key Management Personnel Remuneration (Statutory Presentation)
Short-term employee benefits Post-employment benefits
Share based
payments Total
2018 Salary & fees
Cash bonus
Non-monetary(2) Superannuation Termination
Long Service Leave Rights(3)
$ $ $ $ $ $ $ $DirectorsMr A Howarth(1) 70,271 - 19 6,676 - - - 76,966Mr A Edwards 143,116 - - 13,596 - - - 156,712Mr J Weber 847,747 - 1,237 25,000 - 14,546 18,647 907,177Mr P Kennan(1) 71,399 - - - - - - 71,399Ms E Howell 100,569 - - 9,554 - - - 110,123Mr CG Heng 99,457 - - 5,648 - - - 105,105Senior ManagementMr D Ross 504,999 - 48,925 17,308 - 8,705 8,775 588,712Mr P Raynor(1) 238,828 - 2,608 12,212 - 4,137 4,183 261,968Mr D Cavanagh(1) 192,083 - - 12,067 - - - 204,150Mr D Roberts 310,633 - 3,929 20,049 - 5,512 1,477 341,600Mr M Gillett(1) 247,359 - 120 14,651 216,011 3,972 1,073 483,186Ms L Buckey(4) 201,379 - - 19,131 - 11,867 1,274 233,651Mr D Thomas 296,892 - - 20,049 - 15,848 1,423 334,212Total 3,324,732 - 56,838 175,941 216,011 64,587 36,852 3,874,961
For
per
sona
l use
onl
y

40 Annual Report 2018 MMA Offshore Limited 41
2018 Financial ReportOverview Operating & Financial Review Governance
Short-term employee benefits Post-employment benefits
Share based
payments Total
2017Salary &
feesCash
bonusNon-
monetary(2) Superannuation Termination
Long Service
Leave Rights(3)
$ $ $ $ $ $ $ $
Directors
Mr A Howarth 227,164 - 1,628 19,616 - - 248,407
Mr A Edwards 111,600 - - 10,602 - - 122,202
Mr J Weber 926,456 - 2,158 34,231 - 16,012 120,440 1,099,297
Mr M Bradley(1) 45,928 - - 4,363 - - 50,291
Ms E Howell 107,485 - - 10,211 - - 117,696
Mr CG Heng 104,987 - - 6,174 - - 111,161
Senior Management
Mr D Ross 535,495 - 2,198 29,615 - 9,419 88,480 665,207
Mr P Raynor 540,110 - 2,002 25,000 - 9,419 88,480 665,011
Mr D Lofthouse(1) 144,920 - 816 12,826 302,342 994 23,326 485,224
Mr D Roberts 308,980 - 2,497 19,616 - 5,477 19,327 355,897
Mr M Gillett 308,980 - - 19,616 - 7,636 19,327 355,559
Ms L Buckey(4) 214,061 - - 19,616 - 6,263 16,662 256,601
Mr D Thomas 296,892 - - 19,616 - - 18,615 335,123
Total 3,873,057 - 11,300 231,100 302,342 55,220 394,657 4,867,676
(1) These salaries & fees are only for part of the financial year as Mr A Howarth retired from the Company on 30 November 2017, Mr P Kennan was appointed as a director on 22 September 2017, Mr D Cavanagh commenced employment with the Company on 4 December 2017, Mr P Raynor ceased employment with the Company on 21 December 2017, Mr M Gillett ceased employment with the Company on 22 March 2018 and Mr D Lofthouse ceased employment with the Company on 15 November 2016.
(2) These non-monetary benefits comprise the provision of housing, relocation costs, fuel, travel and other benefits, as applicable.(3) The value of the rights granted to key management personnel as part of their remuneration is calculated as at the grant date using the binomial
pricing model. The amounts disclosed as part of remuneration for the financial year have been determined by allocating the grant date value on a straight-line basis over the period from the grant date to the vesting date (i.e. 3 years).
(4) Ms Buckey is employed on a part-time basis.
The table below sets out the relative proportions of the elements of statutory remuneration of key management personnel that are linked to performance:
Fixed Remuneration Remuneration linked to Performance
2018 2017 2018 2017
Non-Executive Directors
Mr A Edwards 100% 100% 0% 0%
Mr A Howarth(1) 100% 100% 0% 0%
Ms E Howell 100% 100% 0% 0%
Mr CG Heng 100% 100% 0% 0%
Mr P Kennan(2) 100% 100% 0% 0%
Executive Directors
Mr J Weber 98% 89% 2% 11%
Senior Management
Mr D Ross 98% 87% 2% 13%
Mr D Cavanagh(3) 100% - 0% -
Mr P Raynor(4) 98% 87% 2% 13%
Mr D Roberts 99% 95% 1% 5%
Mr M Gillett(5) 100% 95% 0% 5%
Ms L Buckey 100% 94% 0% 6%
Mr D Thomas 100% 94% 0% 6%
(1) Retired on 30 November 2017(2) Appointed on 22 September 2017(3) Appointed on 4 December 2017(4) Ceased employment on 21 December 2017(5) Ceased employment on 22 March 2018
No key management personnel appointed during the period received a payment as part of his or her consideration for agreeing to hold the position.
Bonus and Share-based payments granted as compensation for the current financial year
STI (Cash Bonuses)
As noted above, having regard to the overall performance of the Company and current market conditions, the Board has, in relation to the Managing Director and other key management personnel, exercised its discretion to:
• Suspend the STI component for the 2018 financial year; and
• Once again, suspend the STI component for the 2019 financial year (subject to the Board’s discretion to reinstate the STI component if the Company’s performance or market conditions change).
LTI (Performance Rights/Share Based Payments)
During the financial year:
• No performance rights were granted to either the Managing Director or the other key management personnel;
• No share-based payments were granted as compensation to either the Managing Director or the other key management personnel; and
• No performance rights granted to either the Managing Director or the other key management personnel as part of their compensation in previous financial years vested.
During the financial year, the following rights schemes were in existence:
Series Number issued Grant date Expiry date
Exercise price
$
Fair value at grant date
$ Vesting date
(1) 22 Oct 2014 (a) 1,052,625 22 Oct 2014 1 Jul 2017 0.00 1.09 1 Jul 2017
(2) 1 Dec 2014 (a) 11,382 1 Dec 2014 1 Jul 2017 0.00 1.09 1 Jul 2017
(3) 1 Dec 2014 (a) 430,075 18 Nov 2014 1 Jul 2017 0.00 0.75 1 Jul 2017
(4) 10 Feb 2016 (b) 2,001,432 18 Nov 2015 1 Jul 2020 0.00 0.02 1 Jul 2018
(5) 10 Feb 2016 (b) 8,037,836 7 Dec 2015 1 Jul 2020 0.00 0.02 1 Jul 2018
(6) 7 Jun 2016 (b) 220,284 18 Apr 2016 1 Jul 2020 0.00 0.02 1 Jul 2018
(a) In accordance with the terms of the Mermaid Marine Australia Limited Performance Rights Plan – 2014 (issued by the Board on 22 October 2014 and 1 December 2014) and the Mermaid Marine Australia Limited Managing Director’s Performance Rights Plan – 2014 (as approved by the shareholders at the Company’s Annual General Meeting on 18 November 2014) the number of performance rights which vested on 1 July 2017 depended on growth in the Earnings per Share of MMA Offshore Limited and the total shareholder return of the Company relative to a selected peer group of companies as set out in note 24 of the Financial Statements. These performance hurdles have not been met. As such, all of these performance rights have lapsed in accordance with the terms of the relevant plan rules.
(b) In accordance with the terms of the MMA Offshore Limited Performance Rights Plan – 2015 (issued by the Board on 7 December 2015 and 18 April 2016) and the MMA Offshore Limited Managing Director’s Performance Rights Plan – 2015 (as approved by the shareholders at the Company’s Annual General Meeting on 18 November 2015) the number of performance rights which vested on 1 July 2018 depended on the Company achieving the specified share price target(s) for MMA Offshore Limited and the total shareholder return of the Company relative to a selected peer group of companies as set out in note 24 of the Financial Statements. These performance hurdles have not been met. As such, all of these performance rights have lapsed in accordance with the terms of the relevant plan rules.
There has been no alteration of the terms and conditions of the above share-based payment arrangements since the grant date.
For
per
sona
l use
onl
y

42 Annual Report 2018 MMA Offshore Limited 43
2018 Financial ReportOverview Operating & Financial Review Governance
The following table summarises the number of performance rights that lapsed during the financial year, in relation to performance rights granted to key management personnel as part of their remuneration:
Name
Financial year in which rights were granted
No. of rights lapsed during the
current year
Mr J Weber 2014 430,075
Mr D Ross 2014 202,388
Mr P Raynor 2014 202,388
Mr D Roberts 2014 55,476
Mr M Gillett 2014 55,476
Ms L Buckey 2014 47,825
Mr D Thomas 2014 42,548
Key Management Personnel Equity Holdings
Details of the fully paid ordinary shares of the Company held by key management personnel are as follows:
2018Balance at
1 July 2017Granted as
compensationReceived on vesting of
Performance RightsNet other
changeBalance at
30 June 2018Balance held
nominally
Mr A Edwards 115,680 - - 115,680 231,360 -
Mr J Weber 1,907,958 - - 1,907,958 3,815,916 -
Mr P Kennan(1) 38,709,500 - - 38,709,500 77,419,000 77,419,000
Ms E Howell 123,529 - - 123,529 247,058 -
Mr CG Heng 100,000 - - 100,000 200,000 -
Mr D Ross 765,785 - - 765,785 1,531,570 -
Mr D Cavanagh(2) 21,000 - - - 21,000 -
Mr D Roberts - - - - - -
Ms L Buckey 1,475 - - 1,475 -
Mr D Thomas - - - - -
2017Balance at
1 July 2016Granted as
compensationReceived on vesting of
Performance RightsNet other
changeBalance at
30 June 2017Balance held
nominally
Mr A Edwards 115,680 - - - 115,680 -
Mr J Weber 1,907,958 - - - 1,907,958 -
Ms E Howell 123,529 - - - 123,529 -
Mr CG Heng - - - 100,000 100,000 -
Mr D Ross 765,785 - - - 765,785 -
Mr D Roberts - - - - -
Ms L Buckey 1,475 - - 1,475 -
Mr D Thomas - - - - -
(1) Appointed on 22 September 2017(2) Appointed on 4 December 2017
Details of the performance rights held by executive key management personnel are as follows:
2018Executives
Balance at 1 July 2017
Granted as compensation Vested
Net other change (lapsed)
Balance at 30 June 2018
Vested but not exercisable
Rights vested during year
Mr J Weber 2,431,507 - - (430,075) 2,001,432 - -
Mr D Ross 1,144,238 - - (202,388) 941,850 - -
Mr D Cavanagh(1) - - - - - - -
Mr P Raynor 1,144,238 - - (202,388) 941,850 - -
Mr D Roberts 307,602 - - (55,476) 252,126 - -
Mr M Gillett 307,602 - - (55,476) 252,126 - -
Ms L Buckey 265,175 - - (47,825) 217,350 - -
Mr D Thomas 296,259 - - (53,431) 242,828 - -
2017Executives
Balance at 1 July 2016
Granted as compensation Vested
Net other change (lapsed)
Balance at 30 June 2017
Vested but not exercisable
Rights vested during year
Mr J Weber 2,943,329 - - (511,822) 2,431,507 - -
Mr D Ross 1,395,131 - - (250,893) 1,144,238 - -
Mr P Raynor 1,395,131 - - (250,893) 1,144,238 - -
Mr D Roberts 375,403 - - (67,801) 307,602 - -
Mr M Gillett 375,403 - - (67,801) 307,602 - -
Ms L Buckey 300,244 - - (35,069) 265,175 - -
Mr D Thomas 338,807 - - (42,548) 296,259 - -(1) Appointed on 4 December 2017
During the financial year, no performance rights vested in favour of the Managing Director or other key management personnel.
In addition, all performance rights held by executive key management personnel as at 30 June 2018 have since lapsed in accordance with the terms or the 2015 Performance Rights Plan Rules.
Further details of the share based payment arrangements during the 2018 and 2017 financial years are contained in note 5.2 of the Financial Statements.
Loans to Key Management Personnel
The Company has provided a member of its key management personnel with a short-term loan. This loan is unsecured.
The following table outlines aggregate amounts in respect of loans made to key management personnel of the Group.
Balance as at 1 July 2017Interest
chargedAllowance for
doubtful receivables Balance as at 30 June 2018
Number of key management personnel
24,732 870 - 25,602 1
For
per
sona
l use
onl
y
44 Annual Report 2018 MMA Offshore Limited 45
2018 Financial ReportOverview Operating & Financial Review Governance
Share Trading Restrictions
The Company’s Share Trading Policy requires key management personnel proposing to enter into arrangements that limit the economic risk of a vested holding in the Company’s securities to first obtain approval from the Chairman of the Board (for directors), approval of the Chairman of the Audit and Risk Committee (for the Chairman of the Board), and approval from the Managing Director (for other executives), and subsequently provide details of the dealing within five business days of the dealing taking place. Any breach of the Share Trading Policy is taken very seriously by the Company and is subject to disciplinary action, including possible termination of a person’s employment or appointment. A copy of the Company’s Share Trading Policy can be found on the Corporate Governance page of our website at www.mmaoffshore.com/investor-centre/corporate-governance.
Key Terms of Employment Contracts
As at the date of this report, the Managing Director and other executive key management personnel are all employed by the Company under an employment contract, none of which are of fixed-term duration.
These employment contracts may be terminated by either party giving the required notice and subject to termination payments as detailed in the table below:
Name Termination notice period Termination benefits payable
Mr J Weber 6 months Yes(1)
Mr D Ross 6 months Yes(1)
Mr D Cavanagh 12 weeks Yes(2)
Mr D Roberts 6 weeks No
Ms L Buckey 30 days No
Mr D Thomas 12 weeks No
(1) If the employee is made redundant as a result of a material diminution in the nature and level of responsibilities or functions of the employee’s position including, without limitation, through a change in control of the Company, the employee will be entitled to a payment being the lesser of either:• 1.5 times the Fixed Annual Remuneration in the relevant year (excluding any short-term incentives or long-term incentives); or• The maximum amount that may be paid to the employee under the Corporations Act and ASX Listing Rules without prior shareholder approval.
(2) If the employee is made redundant as a result of a material diminution in the nature and level of responsibilities or functions of the employee’s position including, without limitation, through a change in control of the Company, the employee will be entitled to a payment equal to 0.5 times the
Fixed Annual Remuneration in the relevant year (excluding any short-term incentives or long-term incentives).
Under these employment contracts, the remuneration package for:
• The Managing Director and Chief Operating Officer consists of an annual base salary and a short-term incentive component and a long-term incentive component at the discretion of the Nomination and Remuneration Committee and the Board; and
• Other executive key management personnel consists of an annual base salary and statutory superannuation contributions. Participation in the Company’s incentive schemes is at the discretion of the Board.
This Directors’ Report is signed in accordance with a resolution of Directors made pursuant to section 298(2) of the Corporations Act 2001 (Cth).
On behalf of the Directors,
Andrew Edwards Chairman Fremantle, 20 September 2018
A u d i t o r ’s I n d e p e n d e n c e D e c l a r a t i o n
Liability limited by a scheme approved under Professional Standards Legislation.
Member of Deloitte Touche Tohmatsu Limited
Dear Board Members
Auditor’s Independence Declaration to MMA Offshore Limited In accordance with section 307C of the Corporations Act 2001, I am pleased to provide the following declaration of independence to the directors of MMA Offshore Limited. As lead audit partner for the audit of the financial report of MMA Offshore Limited for the year ended 30 June 2018, I declare that to the best of my knowledge and belief, there have been no contraventions of: • the auditor independence requirements of the Corporations Act 2001 in relation to the audit • any applicable code of professional conduct in relation to the audit. Yours faithfully DELOITTE TOUCHE TOHMATSU John Sibenaler Partner Chartered Accountants Perth, 20 September 2018
Deloitte Touche Tohmatsu ABN 74 490 121 060 Tower 2 Brookfield Place 123 St Georges Terrace Perth WA 6000 GPO Box A46 Perth WA 6837 Australia Tel: +61 8 9365 7000 Fax: +61 8 9365 7001 www.deloitte.com.au
The Board of Directors MMA Offshore Limited 1 Mews Road Fremantle WA 6160 20 September 2018
For
per
sona
l use
onl
y

46 Annual Report 2018 MMA Offshore Limited 47
2018 Financial ReportOverview Operating & Financial Review Governance
A u d i t R e p o r t
Liability limited by a scheme approved under Professional Standards Legislation.
Member of Deloitte Touche Tohmatsu Limited
Report on the Audit of the Financial Report Opinion We have audited the financial report of MMA Offshore Limited (the “Company”) and its subsidiaries (the “Group”) which comprises the consolidated statement of financial position as at 30 June 2018, the consolidated statement of profit or loss and other comprehensive income, the consolidated statement of changes in equity and the consolidated statement of cash flows for the year then ended, and notes to the financial statements, including a summary of significant accounting policies and other explanatory information, and the directors’ declaration. In our opinion, the accompanying financial report of the Group is in accordance with the Corporations Act 2001, including: (i) giving a true and fair view of the Group’s financial position as at 30 June 2018 and of its financial
performance for the year then ended; and
(ii) complying with Australian Accounting Standards and the Corporations Regulations 2001. Basis for Opinion We conducted our audit in accordance with Australian Auditing Standards. Our responsibilities under those standards are further described in the Auditor’s Responsibilities for the Audit of the Financial Report section of our report. We are independent of the Group in accordance with the auditor independence requirements of the Corporations Act 2001 and the ethical requirements of the Accounting Professional and Ethical Standards Board’s APES 110 Code of Ethics for Professional Accountants (the Code) that are relevant to our audit of the financial report in Australia. We have also fulfilled our other ethical responsibilities in accordance with the Code. We confirm that the independence declaration required by the Corporations Act 2001, which has been given to the directors of the Company, would be in the same terms if given to the directors as at the time of this auditor’s report. We believe that the audit evidence we have obtained is sufficient and appropriate to provide a basis for our opinion. Key Audit Matters Key audit matters are those matters that, in our professional judgement, were of most significance in our audit of the financial report for the current period. These matters were addressed in the context
Deloitte Touche Tohmatsu ABN 74 490 121 060 Tower 2 Brookfield Place 123 St Georges Terrace Perth WA 6000 GPO Box A46 Perth WA 6837 Australia Tel: +61 8 9365 7000 Fax: +61 8 9365 7001 www.deloitte.com.au
Independent Auditor’s Report to the members of MMA Offshore Limited
of our audit of the financial report as a whole, and in forming our opinion thereon, and we do not provide a separate opinion on these matters.
Key Audit Matter How the scope of our audit responded to the Key Audit Matter
Carrying value of the Vessel Cash Generating Unit As disclosed in Note 3.6, the assessment of the recoverable amount of the Vessels Cash Generating Unit (“Vessel CGU”) requires management to exercise judgement and has been based on a Fair Value Less Cost of Disposal (“FVLCOD”) approach. The Group appointed external valuers to perform a valuation of the Vessel CGU. Key assumptions used in assessing recoverable amount include current and forecast economic conditions including potential movements in the market as a consequence of commodity prices and the application of an ‘en bloc’ discount to the vessel fleet.
Our procedures included, but were not limited to: Understanding the process management
undertakes to evaluate the recoverability of the Vessel CGU;
Assessing management’s determination of the Vessel CGU based on our understanding of the nature of the Group’s business and the economic environment in which the segments operate;
Assessing the objectivity and competence of the external valuers;
Evaluating the external valuations obtained by the Group by assessing the valuation methodology adopted and the assumptions used;
Comparing actual sales prices, including ‘en bloc’ discounts, of vessels during and post the reporting period to evaluate the reasonableness of the valuation; and
Assessing the appropriateness of the disclosures in Note 3.6 to the financial statements.
Recoverability of trade receivables As disclosed in Note 3.2, the carrying value of trade receivables is $61.6 million, net of an allowance for doubtful debts of $2.6 million Significant judgment is required in assessing the recoverability of trade receivables. This includes assessing the credit risk of trade receivables which have been outstanding for a period longer than average payment terms.
Our procedures included, but were not limited to: Understanding the process management
undertakes to evaluate the recoverability of trade receivables;
Assessing the recoverability of a sample of trade receivables by reviewing cash received subsequent to year end;
Reviewing other evidence including customer correspondence and holding discussions with management to challenge their knowledge of future conditions that may impact expected customer receipts; and
Assessing the appropriateness of the disclosures in Note 3.2 to the financial statements.
For
per
sona
l use
onl
y

48 Annual Report 2018 MMA Offshore Limited 49
2018 Financial ReportOverview Operating & Financial Review Governance
Other Information The directors are responsible for the other information. The other information comprises the information included in the annual report, but does not include the financial report and our auditor’s report thereon. Our opinion on the financial report does not cover the other information and we do not express any form of assurance conclusion thereon. In connection with our audit of the financial report, our responsibility is to read the other information and, in doing so, consider whether the other information is materially inconsistent with the financial report or our knowledge obtained in the audit or otherwise appears to be materially misstated. If, based on the work we have performed, we conclude that there is a material misstatement of this other information; we are required to report that fact. We have nothing to report in this regard. Responsibilities of the Directors for the Financial Report The directors of the Company are responsible for the preparation of the financial report that gives a true and fair view in accordance with Australian Accounting Standards and the Corporations Act 2001 and for such internal control as the directors determine is necessary to enable the preparation of the financial report that gives a true and fair view and is free from material misstatement, whether due to fraud or error. In preparing the financial report, the directors are responsible for assessing the ability of the Group to continue as a going concern, disclosing, as applicable, matters related to going concern and using the going concern basis of accounting unless the directors either intend to liquidate the Group or to cease operations, or has no realistic alternative but to do so. Auditor’s Responsibilities for the Audit of the Financial Report Our objectives are to obtain reasonable assurance about whether the financial report as a whole is free from material misstatement, whether due to fraud or error, and to issue an auditor’s report that includes our opinion. Reasonable assurance is a high level of assurance, but is not a guarantee that an audit conducted in accordance with the Australian Auditing Standards will always detect a material misstatement when it exists. Misstatements can arise from fraud or error and are considered material if, individually or in the aggregate, they could reasonably be expected to influence the economic decisions of users taken on the basis of this financial report. As part of an audit in accordance with the Australian Auditing Standards, we exercise professional judgement and maintain professional scepticism throughout the audit. We also: Identify and assess the risks of material misstatement of the financial report, whether due to fraud
or error, design and perform audit procedures responsive to those risks, and obtain audit evidence that is sufficient and appropriate to provide a basis for our opinion. The risk of not detecting a material misstatement resulting from fraud is higher than for one resulting from error, as fraud
of our audit of the financial report as a whole, and in forming our opinion thereon, and we do not provide a separate opinion on these matters.
Key Audit Matter How the scope of our audit responded to the Key Audit Matter
Carrying value of the Vessel Cash Generating Unit As disclosed in Note 3.6, the assessment of the recoverable amount of the Vessels Cash Generating Unit (“Vessel CGU”) requires management to exercise judgement and has been based on a Fair Value Less Cost of Disposal (“FVLCOD”) approach. The Group appointed external valuers to perform a valuation of the Vessel CGU. Key assumptions used in assessing recoverable amount include current and forecast economic conditions including potential movements in the market as a consequence of commodity prices and the application of an ‘en bloc’ discount to the vessel fleet.
Our procedures included, but were not limited to: Understanding the process management
undertakes to evaluate the recoverability of the Vessel CGU;
Assessing management’s determination of the Vessel CGU based on our understanding of the nature of the Group’s business and the economic environment in which the segments operate;
Assessing the objectivity and competence of the external valuers;
Evaluating the external valuations obtained by the Group by assessing the valuation methodology adopted and the assumptions used;
Comparing actual sales prices, including ‘en bloc’ discounts, of vessels during and post the reporting period to evaluate the reasonableness of the valuation; and
Assessing the appropriateness of the disclosures in Note 3.6 to the financial statements.
Recoverability of trade receivables As disclosed in Note 3.2, the carrying value of trade receivables is $61.6 million, net of an allowance for doubtful debts of $2.6 million Significant judgment is required in assessing the recoverability of trade receivables. This includes assessing the credit risk of trade receivables which have been outstanding for a period longer than average payment terms.
Our procedures included, but were not limited to: Understanding the process management
undertakes to evaluate the recoverability of trade receivables;
Assessing the recoverability of a sample of trade receivables by reviewing cash received subsequent to year end;
Reviewing other evidence including customer correspondence and holding discussions with management to challenge their knowledge of future conditions that may impact expected customer receipts; and
Assessing the appropriateness of the disclosures in Note 3.2 to the financial statements.
may involve collusion, forgery, intentional omissions, misrepresentations, or the override of internal control.
Obtain an understanding of internal control relevant to the audit in order to design audit procedures that are appropriate in the circumstances, but not for the purpose of expressing an opinion on the effectiveness of the Group’s internal control.
Evaluate the appropriateness of accounting policies used and the reasonableness of accounting estimates and related disclosures made by the directors.
Conclude on the appropriateness of the director’s use of the going concern basis of accounting and, based on the audit evidence obtained, whether a material uncertainty exists related to events or conditions that may cast significant doubt on the Group’s ability to continue as a going concern. If we conclude that a material uncertainty exists, we are required to draw attention in our auditor’s report to the related disclosures in the financial report or, if such disclosures are inadequate, to modify our opinion. Our conclusions are based on the audit evidence obtained up to the date of our auditor’s report. However, future events or conditions may cause the Group to cease to continue as a going concern.
Evaluate the overall presentation, structure and content of the financial report, including the disclosures, and whether the financial report represents the underlying transactions and events in a manner that achieves fair presentation.
Obtain sufficient appropriate audit evidence regarding the financial information of the entities or business activities within the Group to express an opinion on the financial report. We are responsible for the direction, supervision and performance of the Group’s audit. We remain solely responsible for our audit opinion.
We communicate with the directors regarding, among other matters, the planned scope and timing of the audit and significant audit findings, including any significant deficiencies in internal control that we identify during our audit. We also provide the directors with a statement that we have complied with relevant ethical requirements regarding independence, and to communicate with them all relationships and other matters that may reasonably be thought to bear on our independence, and where applicable, related safeguards. From the matters communicated with the directors, we determine those matters that were of most significance in the audit of the financial report of the current period and are therefore the key audit matters. We describe these matters in our auditor’s report unless law or regulation precludes public disclosure about the matter or when, in extremely rare circumstances, we determine that a matter should not be communicated in our report because the adverse consequences of doing so would reasonably be expected to outweigh the public interest benefits of such communication.
of our audit of the financial report as a whole, and in forming our opinion thereon, and we do not provide a separate opinion on these matters.
Key Audit Matter How the scope of our audit responded to the Key Audit Matter
Carrying value of the Vessel Cash Generating Unit As disclosed in Note 3.6, the assessment of the recoverable amount of the Vessels Cash Generating Unit (“Vessel CGU”) requires management to exercise judgement and has been based on a Fair Value Less Cost of Disposal (“FVLCOD”) approach. The Group appointed external valuers to perform a valuation of the Vessel CGU. Key assumptions used in assessing recoverable amount include current and forecast economic conditions including potential movements in the market as a consequence of commodity prices and the application of an ‘en bloc’ discount to the vessel fleet.
Our procedures included, but were not limited to: Understanding the process management
undertakes to evaluate the recoverability of the Vessel CGU;
Assessing management’s determination of the Vessel CGU based on our understanding of the nature of the Group’s business and the economic environment in which the segments operate;
Assessing the objectivity and competence of the external valuers;
Evaluating the external valuations obtained by the Group by assessing the valuation methodology adopted and the assumptions used;
Comparing actual sales prices, including ‘en bloc’ discounts, of vessels during and post the reporting period to evaluate the reasonableness of the valuation; and
Assessing the appropriateness of the disclosures in Note 3.6 to the financial statements.
Recoverability of trade receivables As disclosed in Note 3.2, the carrying value of trade receivables is $61.6 million, net of an allowance for doubtful debts of $2.6 million Significant judgment is required in assessing the recoverability of trade receivables. This includes assessing the credit risk of trade receivables which have been outstanding for a period longer than average payment terms.
Our procedures included, but were not limited to: Understanding the process management
undertakes to evaluate the recoverability of trade receivables;
Assessing the recoverability of a sample of trade receivables by reviewing cash received subsequent to year end;
Reviewing other evidence including customer correspondence and holding discussions with management to challenge their knowledge of future conditions that may impact expected customer receipts; and
Assessing the appropriateness of the disclosures in Note 3.2 to the financial statements.
For
per
sona
l use
onl
y
50 Annual Report 2018 MMA Offshore Limited 51
2018 Financial ReportOverview Operating & Financial Review Governance
The Directors declare that:
(a) in the Directors’ opinion, there are reasonable grounds to believe that the Company will be able to pay its debts as and when they become due and payable;
(b) in the Directors’ opinion, the attached Financial Statements are in compliance with International Financial Reporting Standards, as stated in note 1.1 to the Financial Statements;
(c) in the Directors’ opinion, the attached Financial Statements and notes thereto are in accordance with the Corporations Act 2001 (Cth), including compliance with accounting standards and giving a true and fair view of the financial position and performance of the consolidated entity; and
(d) the Directors have been given the declarations required by section 295A of the Corporations Act 2001 (Cth).
At the date of this declaration, the Company is within the class of companies affected by ASIC Class Order 98/1418. The nature of the deed of cross guarantee is such that each company, which is party to the deed, guarantees to each creditor payment in full of any debt in accordance with the deed of cross guarantee.
In the Directors’ opinion, there are reasonable grounds to believe that the Company and the companies to which the ASIC Class Order applies, as detailed in note 5.6 to the Financial Statements will, as a Group, be able to meet any obligations or liabilities to which they are, or may become, liable for by virtue of the deed of cross guarantee.
Signed in accordance with a resolution of the Directors made pursuant to section 295(5) of the Corporations Act 2001 (Cth).
On behalf of the Directors,
Andrew Edwards Chairman Fremantle, 20 September 2018
D i r e c t o r s ’ D e c l a r a t i o n
Report on the Remuneration Report Opinion on the Remuneration Report We have audited the Remuneration Report included in pages 39 to 43 of the Director’s Report for the year ended 30 June 2018. In our opinion, the Remuneration Report of MMA Offshore Limited, for the year ended 30 June 2018, complies with section 300A of the Corporations Act 2001. Responsibilities The directors of the Company are responsible for the preparation and presentation of the Remuneration Report in accordance with section 300A of the Corporations Act 2001. Our responsibility is to express an opinion on the Remuneration Report, based on our audit conducted in accordance with Australian Auditing Standards. DELOITTE TOUCHE TOHMATSU John Sibenaler Partner Chartered Accountants Perth, 20 September 2018
Report on the Remuneration Report Opinion on the Remuneration Report We have audited the Remuneration Report included in pages 39 to 43 of the Director’s Report for the year ended 30 June 2018. In our opinion, the Remuneration Report of MMA Offshore Limited, for the year ended 30 June 2018, complies with section 300A of the Corporations Act 2001. Responsibilities The directors of the Company are responsible for the preparation and presentation of the Remuneration Report in accordance with section 300A of the Corporations Act 2001. Our responsibility is to express an opinion on the Remuneration Report, based on our audit conducted in accordance with Australian Auditing Standards. DELOITTE TOUCHE TOHMATSU John Sibenaler Partner Chartered Accountants Perth, 20 September 2018
For
per
sona
l use
onl
y

52 Annual Report 2018 MMA Offshore Limited 53
Overview Operating & Financial Review Governance 2018 Financial Report
Note2018 $’000
2017 $’000
Continuing Operations
Revenue 2.1 200,444 221,766
Investment income 463 133
Other gains/(losses) 2.2 87 (14,960)
Vessel expenses (206,484) (241,636)
Administration expenses (7,092) (7,377)
Impairment reversal/(charge) 2.1 8,407 (287,542)
Finance costs (23,201) (26,444)
Loss before tax from continuing operations (27,376) (356,060)
Income tax (expense)/benefit 2.4 (533) 1,729
Loss for the Year from continuing operations (27,909) (354,331)
Discontinued Operations
Loss from discontinued operations 2.3 - (23,701)
Loss for the Year (27,909) (378,032)
Other Comprehensive Income, net of tax
Items that may be reclassified subsequently to profit or loss:
Exchange differences on translation of foreign operations 13,302 (6,906)
Gain/(loss) on hedge of net investment in a foreign operation (6,087) 7,142
Other comprehensive income for the year, net of tax 7,215 236
Total Comprehensive Loss for the Year (20,694) (377,796)
Loss attributable to owners of the Company (27,909) (378,032)
Total comprehensive loss attributable to owners of the Company (20,694) (377,796)
Cents Per Share Cents Per Share
Earnings/(loss) per share
From continuing operations
Basic 2.5 (4.11) (87.97)
From continuing and discontinued operations
Basic 2.5 (4.11) (93.86)
The above Consolidated Statement of Profit or Loss and Other Comprehensive Income should be read in conjunction with the accompanying notes.
F i n a n c i a l
R e p o r t
2 0 1 8
Consolidated Statement of Profit or Loss and Other Comprehensive IncomeFor the year ended 30 June 2018Consolidated Statement of Profit or Loss and
Other Comprehensive Income 53
Consolidated Statement of Financial Position 54
Consolidated Statement of Changes in Equity 55
Consolidated Statement of Cash Flows 56
Notes to the Financial Statements
1. General Notes 57
1.1 Statement of Compliance 57
1.2 Basis of Preparation 57
1.3 Basis of Consolidation 57
1.4 New Accounting Standards 58
1.5 Critical Accounting Judgements and Key Sources of Estimation Uncertainty 59
2. Financial Performance 60
2.1 Segment Information 60
2.2 Other Income and Expenses 62
2.3 Discontinued Operations 63
2.4 Income Taxes 64
2.5 Earnings per Share 65
2.6 Dividends Provided for or Paid 65
3. Assets and Liabilities 66
3.1 Cash 66
3.2 Trade and Other Receivables 67
3.3 Inventories 68
3.4 Assets Classified as Held for Sale 68
3.5 Property, Plant and Equipment 69
3.6 Impairment of Non-current Assets 70
3.7 Trade and Other Payables 72
3.8 Borrowings 73
3.9 Provisions 74
3.10 Deferred Tax Balances 75
4. Capital Structure 77
4.1 Issued Capital 77
4.2 Reserves 77
4.3 Capital Risk Management 78
5. Other Notes 79
5.1 Commitments for Expenditure 79
5.2 Share Based Payments 81
5.3 Key Management Personnel Compensation 82
5.4 Related Party Transactions 83
5.5 Remuneration of Auditors 83
5.6 Subsidiaries 84
5.7 Parent Company Information 86
5.8 Financial Instruments 86
5.9 Events After the Reporting Period 90
Additional Securities Exchange Information 91
For
per
sona
l use
onl
y

54 Annual Report 2018 MMA Offshore Limited 55
Overview Operating & Financial Review Governance 2018 Financial Report
Consolidated Statement of Financial PositionAs at 30 June 2018
Note2018 $’000
2017 $’000
Current Assets
Cash and cash equivalents 3.1 69,648 28,757
Trade and other receivables 3.2 61,641 65,317
Inventories 3.3 1,615 3,032
Prepayments 1,062 1,254
Assets classified as held for sale 3.4 9,397 35,944
Total Current Assets 143,363 134,304
Non-Current Assets
Property, plant and equipment 3.5 496,421 498,386
Total Non-Current Assets 496,421 498,386
Total Assets 639,784 632,690
Current Liabilities
Trade and other payables 3.7 32,309 37,386
Unearned revenue 375 66
Borrowings 3.8 1,739 5
Provisions 3.9 10,665 10,208
Current tax liabilities 1,186 2,607
Customer deposits - 2,000
Total Current Liabilities 46,274 52,272
Non-Current Liabilities
Trade payables 5,020 8,597
Borrowings 3.8 259,933 314,447
Provisions 3.9 262 885
Total Non-Current Liabilities 265,215 323,929
Total Liabilities 311,489 376,201
Net Assets 328,295 256,489
Equity
Issued capital 4.1 654,735 561,275
Reserves 4.2 121,454 115,199
Accumulated losses (447,894) (419,985)
Total Equity 328,295 256,489
Issued Capital
Employee Equity
Settled Benefits Reserve
Hedging Reserve
Foreign Currency
Translation Reserve
Retained Earnings/
(Accumulated Losses) Total
Year Ended 30 June 2018 $’000 $’000 $’000 $’000 $’000 $’000
Balance at 1 July 2017 561,275 1,114 (51,203) 165,288 (419,985) 256,489
Comprehensive income/(loss) for the year:
Loss for the year - - - - (27,909) (27,909)
Other comprehensive income/(loss) for the year - - (6,087) 13,302 - 7,215
Total Comprehensive Income/(Loss) for the Year - - (6,087) 13,302 (27,909) (20,694)
Issue of shares under institutional placement 22,385 - - - - 22,385
Issue of shares under institutional entitlement offer 15,605 - - - - 15,605
Issue of shares under retail entitlement offer 59,010 - - - - 59,010
Share issue costs (4,558) - - - - (4,558)
Transfer to share capital 1,018 (1,018) - - - -
Recognition of share based payments - 58 - - - 58
Balance at 30 June 2018 654,735 154 (57,290) 178,590 (447,894) 328,295
Issued Capital
Employee Equity
Settled Benefits Reserve
Hedging Reserve
Foreign Currency
Translation Reserve
Retained Earnings/
(Accumulated Losses) Total
Year Ended 30 June 2017 $’000 $’000 $’000 $’000 $’000 $’000
Balance at 1 July 2016 556,566 5,704 (58,345) 172,194 (41,953) 634,166
Comprehensive income/(loss) for the year:
Loss for the year - - - - (378,032) (378,032)
Other comprehensive income/(loss) for the year - - 7,142 (6,906) - 236
Total Comprehensive Income/(Loss) for the Year - - 7,142 (6,906) (378,032) (377,796)
Transfer to share capital 4,709 (4,709) - - - -
Recognition of share based payments - 285 - - - 285
Related income tax benefit - (166) - - - (166)
Balance at 30 June 2017 561,275 1,114 (51,203) 165,288 (419,985) 256,489
The above Consolidated Statement of Financial Position should be read in conjunction with the accompanying notes.
Consolidated Statement of Changes in EquityFor the year ended 30 June 2018
The above Consolidated Statement of Changes in Equity should be read in conjunction with the accompanying notes.
For
per
sona
l use
onl
y
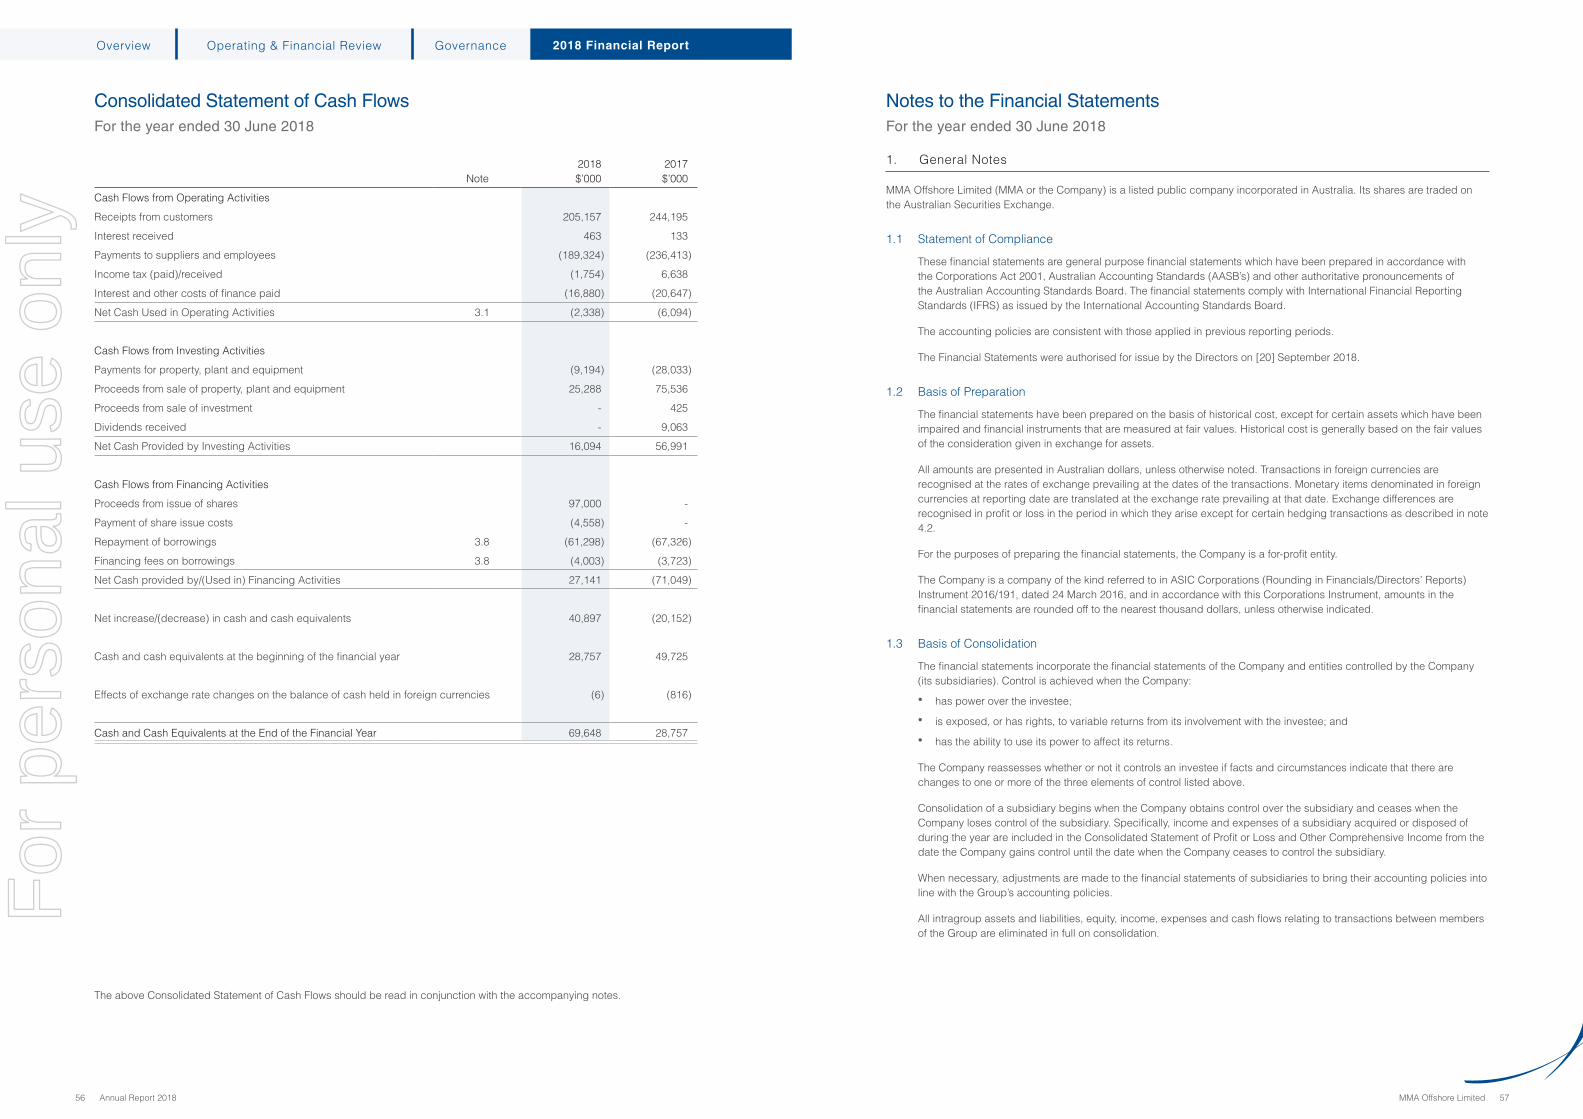
56 Annual Report 2018 MMA Offshore Limited 57
Overview Governance 2018 Financial ReportOperating & Financial Review
The above Consolidated Statement of Cash Flows should be read in conjunction with the accompanying notes.
Consolidated Statement of Cash FlowsFor the year ended 30 June 2018
Note2018 $’000
2017 $’000
Cash Flows from Operating Activities
Receipts from customers 205,157 244,195
Interest received 463 133
Payments to suppliers and employees (189,324) (236,413)
Income tax (paid)/received (1,754) 6,638
Interest and other costs of finance paid (16,880) (20,647)
Net Cash Used in Operating Activities 3.1 (2,338) (6,094)
Cash Flows from Investing Activities
Payments for property, plant and equipment (9,194) (28,033)
Proceeds from sale of property, plant and equipment 25,288 75,536
Proceeds from sale of investment - 425
Dividends received - 9,063
Net Cash Provided by Investing Activities 16,094 56,991
Cash Flows from Financing Activities
Proceeds from issue of shares 97,000 -
Payment of share issue costs (4,558) -
Repayment of borrowings 3.8 (61,298) (67,326)
Financing fees on borrowings 3.8 (4,003) (3,723)
Net Cash provided by/(Used in) Financing Activities 27,141 (71,049)
Net increase/(decrease) in cash and cash equivalents 40,897 (20,152)
Cash and cash equivalents at the beginning of the financial year 28,757 49,725
Effects of exchange rate changes on the balance of cash held in foreign currencies (6) (816)
Cash and Cash Equivalents at the End of the Financial Year 69,648 28,757
1. General Notes
MMA Offshore Limited (MMA or the Company) is a listed public company incorporated in Australia. Its shares are traded on the Australian Securities Exchange.
1.1 Statement of Compliance
These financial statements are general purpose financial statements which have been prepared in accordance with the Corporations Act 2001, Australian Accounting Standards (AASB’s) and other authoritative pronouncements of the Australian Accounting Standards Board. The financial statements comply with International Financial Reporting Standards (IFRS) as issued by the International Accounting Standards Board.
The accounting policies are consistent with those applied in previous reporting periods.
The Financial Statements were authorised for issue by the Directors on [20] September 2018.
1.2 Basis of Preparation
The financial statements have been prepared on the basis of historical cost, except for certain assets which have been impaired and financial instruments that are measured at fair values. Historical cost is generally based on the fair values of the consideration given in exchange for assets.
All amounts are presented in Australian dollars, unless otherwise noted. Transactions in foreign currencies are recognised at the rates of exchange prevailing at the dates of the transactions. Monetary items denominated in foreign currencies at reporting date are translated at the exchange rate prevailing at that date. Exchange differences are recognised in profit or loss in the period in which they arise except for certain hedging transactions as described in note 4.2.
For the purposes of preparing the financial statements, the Company is a for-profit entity.
The Company is a company of the kind referred to in ASIC Corporations (Rounding in Financials/Directors’ Reports) Instrument 2016/191, dated 24 March 2016, and in accordance with this Corporations Instrument, amounts in the financial statements are rounded off to the nearest thousand dollars, unless otherwise indicated.
1.3 Basis of Consolidation
The financial statements incorporate the financial statements of the Company and entities controlled by the Company (its subsidiaries). Control is achieved when the Company:
• has power over the investee;
• is exposed, or has rights, to variable returns from its involvement with the investee; and
• has the ability to use its power to affect its returns.
The Company reassesses whether or not it controls an investee if facts and circumstances indicate that there are changes to one or more of the three elements of control listed above.
Consolidation of a subsidiary begins when the Company obtains control over the subsidiary and ceases when the Company loses control of the subsidiary. Specifically, income and expenses of a subsidiary acquired or disposed of during the year are included in the Consolidated Statement of Profit or Loss and Other Comprehensive Income from the date the Company gains control until the date when the Company ceases to control the subsidiary.
When necessary, adjustments are made to the financial statements of subsidiaries to bring their accounting policies into line with the Group’s accounting policies.
All intragroup assets and liabilities, equity, income, expenses and cash flows relating to transactions between members of the Group are eliminated in full on consolidation.
Notes to the Financial Statements For the year ended 30 June 2018
For
per
sona
l use
onl
y

58 Annual Report 2018 MMA Offshore Limited 59
Overview Operating & Financial Review 2018 Financial ReportGovernance
Notes to the Financial Statements For the year ended 30 June 2018
Notes to the Financial Statements For the year ended 30 June 2018
1. General Notes (continued)
1.4 New Accounting Standards
Adoption of New and Revised Accounting Standards and Interpretations
In the current year, the Group has applied the following new and amended AASBs that are mandatorily effective for an accounting period that begins on or after 1 July 2017:
AASB 2016-2 Amendments to Australian Accounting Standards – Disclosure Initiative: Amendments to AASB 107
The amendments require an entity to provide disclosures that enable users of financial statements to evaluate changes in liabilities arising from financing activities, including both cash and non-cash changes.
In the year ended 30 June 2018, the Directors have reviewed all of the new and revised Standards and Interpretations issued by the AASB that are relevant to the Company and effective for the current annual reporting period. As a result of this review the Directors have determined that there is no material impact of the new and revised Standards and Interpretations on the Company, and therefore, no material change is necessary to the Group accounting policies.
Standards and Interpretations issued but not yet effective
At the date of authorisation of the Financial Statements, the Standards and Interpretations listed below relevant to the Group’s operations, were issued but not yet effective:
AASB 15 Revenue from Contracts with Customers (effective from 1 July 2018)
AASB 15 establishes a single comprehensive model to use in accounting for revenue arising from contracts with customers. The core principal of AASB 15 is that revenue is recognised as the promised goods or services are provided to customers in an amount that reflects the consideration expected to be received in exchange for those goods or services. The standard introduces a five-step process for applying this principle which includes guidance in respect of identifying the performance obligations under the contract, allocation of the revenue across those performance obligations and recognising the revenue as those performance obligations are satisfied.
The Group plans to adopt the new standard from 1 July 2018 using the modified transitional approach where any adjustment on initial recognition is recognised in retained earnings at 1 July 2018 without adjustment to comparatives. It will only be applied to contracts that remain in place at that date.
The Group’s revenue is mainly derived from the time charter of vessels. The supply of each vessel is considered to be a single performance obligation provided over time for a contracted day rate. Apart from providing more extensive disclosures on the Group’s revenue transactions the application of AASB 15 will not have an impact on the financial position or financial performance of the Group.
AASB 9 Financial Instruments (effective from 1 July 2018)
In relation to the impairment of financial assets, AASB 9 requires an expected credit loss model as opposed to an incurred credit loss model under AASB 139. The expected credit loss model requires an entity to account for expected credit losses and changes in expected losses to reflect changes in credit risk since initial recognition. It is no longer necessary for a credit event to have occurred before credit losses are recognised.
In general, the directors anticipate that the application of the expected credit loss model will result in earlier recognition of any credit losses. However, given the credit risk management approach on our current customers and receivables we do not anticipate this having a significant impact on the financial position or financial performance of the Group.
AASB 16 Leases (effective from 1 July 2019)
AASB 16 introduces a new model for the accounting for lessees which will require the recognition of assets and liabilities for all leases. The standard removes the current distinction of between operating and finance leases and is replaced by a model where a right of use asset and a corresponding liability are recognised for all leases except for short term leases and leases of low value assets. The right of use asset will be depreciated over the lease term and the lease liability will be adjusted for lease payments and interest charged. The impact on the financial performance of the company will be to reduce administration expenses with a related increase in finance costs.
A preliminary assessment of the Group’s leases at 30 June 2018 has indicated that some existing non cancellable operating leases, for example office leases, would qualify as leases under the new standard resulting in recognition of right of use assets and corresponding liabilities. Due to the potential changing nature of these agreements we have not yet quantified the potential impact of applying the new standard.
1. General Notes (continued)
1.5 Critical Accounting Judgements and Key Sources of Estimation Uncertainty
In the application of the Group’s accounting policies, the Directors are required to make judgements, estimates and assumptions about carrying values of assets and liabilities that are not readily apparent from other sources. The estimates and associated assumptions are based on historical experience and other factors that are considered to be relevant. Actual results may differ from these estimates.
The estimates and underlying assumptions are reviewed on an ongoing basis. Revisions to accounting estimates are recognised in the period in which the estimate is revised if the revision affects only that period, or in the period of the revision and future periods if the revision affects both current and future periods.
Critical judgements in applying accounting policies
The following critical judgement has been made by the Directors in the process of applying the Group’s accounting policies.
Allowance for doubtful debts – refer note 3.2
Key sources of estimation uncertainty
The following are the key assumptions concerning the future, and other key sources of estimation uncertainty at the end of the reporting period, that have a significant risk of causing a material adjustment to the carrying amounts of assets and liabilities within the next financial year.
Useful lives of property, plant and equipment – refer note 3.5
Impairment of property, plant and equipment – refer note 3.6
For
per
sona
l use
onl
y

60 Annual Report 2018 MMA Offshore Limited 61
Notes to the Financial Statements For the year ended 30 June 2018
Notes to the Financial Statements For the year ended 30 June 2018
Overview Operating & Financial Review Governance 2018 Financial Report
2. Financial Performance
2.1 Segment Information
An operating segment is a component of a group that engages in business activities from which it may earn revenue and incur expenses and whose operating results are regularly reviewed by the chief operating decision maker (The Board of Directors) for the purposes of resource allocation and assessment of segment performance. For the current reporting period the Group had one reportable segment in continuing operations being its Vessel operations.
The Group’s previously reportable Supply Base and Slipway segments were sold during the prior reporting period and were classified as discontinued operations (see note 2.3).
Information regarding the Vessel operating segment is presented below. The accounting policies of the reportable segment are the same as the Group’s accounting policies.
Segment revenues and results
The following is an analysis of the Group’s revenue and results by reportable segment:
Revenue from external customers
Impairment reversal/(charge)
Profit/(loss)after impairment
2018 $’000
2017 $’000
2018 $’000
2017 $’000
2018 $’000
2017 $’000
Continuing Operations
Vessels 200,444 221,766 8,407 (287,542) 2,367 (307,412)
Investment income 463 133
Other gains/(losses) 87 (14,960)
Administration expenses (7,092) (7,377)
Finance costs (23,201) (26,444)
Loss from continuing operations before income tax (27,376) (356,060)
Segment profit/(loss) represents the profit/(loss) earned by the Vessel segment without allocation of investment revenue, other gains and losses, administration costs, finance costs and income tax expense. This is the measure reported to the chief operating decision maker for the purposes of resource allocation and assessment of segment performance.
Revenue from a contract to provide services is recognised by reference to the stage of completion of the contract. The stage of completion of the contract is determined progressively at contractual rates as service hours are delivered and direct expenses incurred.
Segment Assets
The following is an analysis of the Group’s assets by reportable segment:
2018 $’000
2017 $’000
Vessel segment assets(i) 566,129 582,002
Unallocated assets 73,655 41,742
Total continuing assets 639,784 623,744
Assets relating to discontinued operations(ii) - 8,946
Total 639,784 632,690
(i) Vessel segment assets include vessels held for sale (see note 3.4)
(ii) Trade receivables outstanding at 30 June 2017 related to Supply Base and Slipway.
For the purposes of monitoring segment performance and allocating resources between segments, all assets are allocated to reportable segments other than cash and central administration assets.
2. Financial Performance (continued)
2.1 Segment Information (continued)
Other segment information
Depreciation and amortisation
Additions to non-current assets
2018 $’000
2017 $’000
2018 $’000
2017 $’000
Vessel assets 31,300 44,708 9,108 31,010
Unallocated assets 603 833 86 49
Total 31,903 45,541 9,194 31,059
Impairment reversals/(charges) from continuing operations
In addition to the depreciation charges reported above, the Group also recognised impairment reversals/(charges) (see note 3.6) in respect of vessels as set out below:
2018 $’000
2017 $’000
Vessels held for continuing operations 8,236 (158,089)
Vessels held for sale 171 (129,453)
Total 8,407 (287,542)
Geographical information
The Group is based in two principal geographical areas – Australia (country of domicile) and Singapore, however the fleet is traded around the world as a single fleet and moves between all geographical areas.
During the year, the Group operated vessels in a number of countries outside Australia. The Group’s revenue from continuing operations from external customers by location of operations and information about its non-current assets by location of assets are detailed in the following table:
Revenue from external customers Non-current assets
2018 $’000
2017 $’000
2018 $’000
2017 $’000
Location
Australia 142,155 148,804 183,478 187,018
Other 58,289 72,962 312,943 311,368
Total 200,444 221,766 496,421 498,386
Information about major customers for continuing operations
Included in revenues arising from vessel services are revenues of approximately $28.8 million (2017: $30.5 million) which arose from sales to the Group’s largest customer, revenues of approximately $25.9 million (2017: $28.7 million) which arose from sales to the Group’s second largest customer and revenues of approximately $22.1 million (2017: $26.5 million) which arose from sales to the Group’s third largest customer.F
or p
erso
nal u
se o
nly
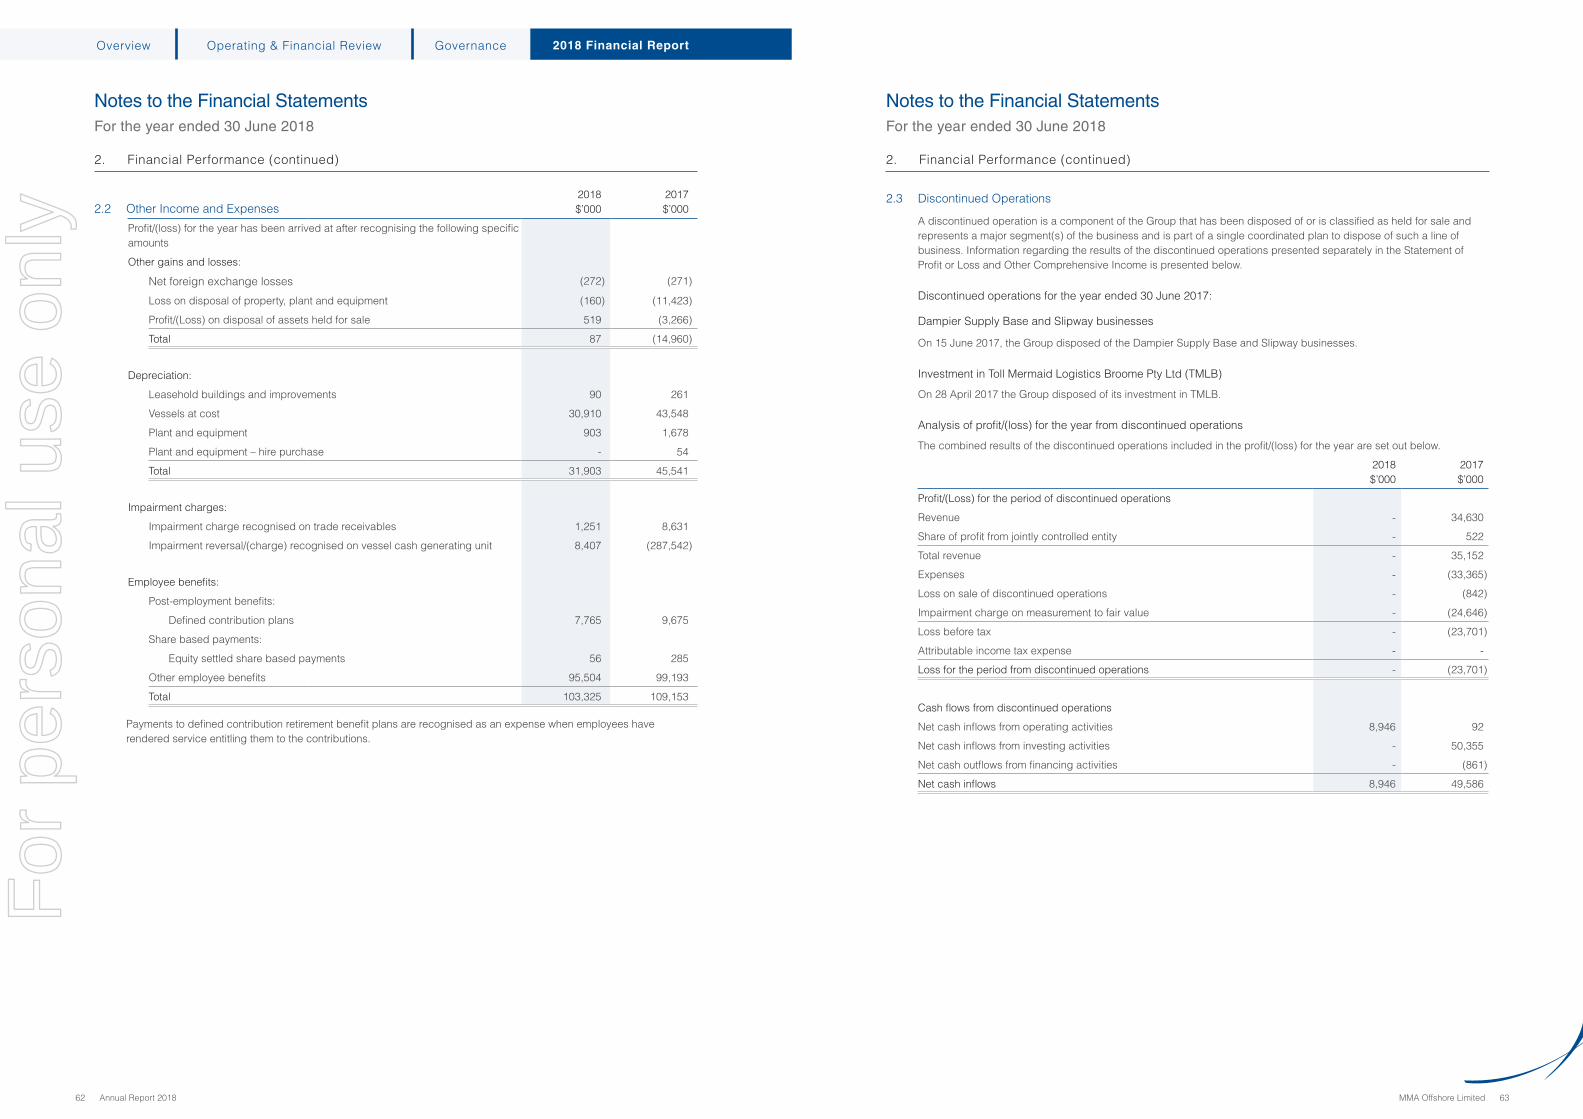
62 Annual Report 2018 MMA Offshore Limited 63
Notes to the Financial Statements For the year ended 30 June 2018
Notes to the Financial Statements For the year ended 30 June 2018
Overview Operating & Financial Review Governance 2018 Financial Report
2. Financial Performance (continued)
2.2 Other Income and Expenses2018 $’000
2017 $’000
Profit/(loss) for the year has been arrived at after recognising the following specific amounts
Other gains and losses:
Net foreign exchange losses (272) (271)
Loss on disposal of property, plant and equipment (160) (11,423)
Profit/(Loss) on disposal of assets held for sale 519 (3,266)
Total 87 (14,960)
Depreciation:
Leasehold buildings and improvements 90 261
Vessels at cost 30,910 43,548
Plant and equipment 903 1,678
Plant and equipment – hire purchase - 54
Total 31,903 45,541
Impairment charges:
Impairment charge recognised on trade receivables 1,251 8,631
Impairment reversal/(charge) recognised on vessel cash generating unit 8,407 (287,542)
Employee benefits:
Post-employment benefits:
Defined contribution plans 7,765 9,675
Share based payments:
Equity settled share based payments 56 285
Other employee benefits 95,504 99,193
Total 103,325 109,153
Payments to defined contribution retirement benefit plans are recognised as an expense when employees have rendered service entitling them to the contributions.
2. Financial Performance (continued)
2.3 Discontinued Operations
A discontinued operation is a component of the Group that has been disposed of or is classified as held for sale and represents a major segment(s) of the business and is part of a single coordinated plan to dispose of such a line of business. Information regarding the results of the discontinued operations presented separately in the Statement of Profit or Loss and Other Comprehensive Income is presented below.
Discontinued operations for the year ended 30 June 2017:
Dampier Supply Base and Slipway businesses
On 15 June 2017, the Group disposed of the Dampier Supply Base and Slipway businesses.
Investment in Toll Mermaid Logistics Broome Pty Ltd (TMLB)
On 28 April 2017 the Group disposed of its investment in TMLB.
Analysis of profit/(loss) for the year from discontinued operations
The combined results of the discontinued operations included in the profit/(loss) for the year are set out below.
2018 $’000
2017 $’000
Profit/(Loss) for the period of discontinued operations
Revenue - 34,630
Share of profit from jointly controlled entity - 522
Total revenue - 35,152
Expenses - (33,365)
Loss on sale of discontinued operations - (842)
Impairment charge on measurement to fair value - (24,646)
Loss before tax - (23,701)
Attributable income tax expense - -
Loss for the period from discontinued operations - (23,701)
Cash flows from discontinued operations
Net cash inflows from operating activities 8,946 92
Net cash inflows from investing activities - 50,355
Net cash outflows from financing activities - (861)
Net cash inflows 8,946 49,586
For
per
sona
l use
onl
y
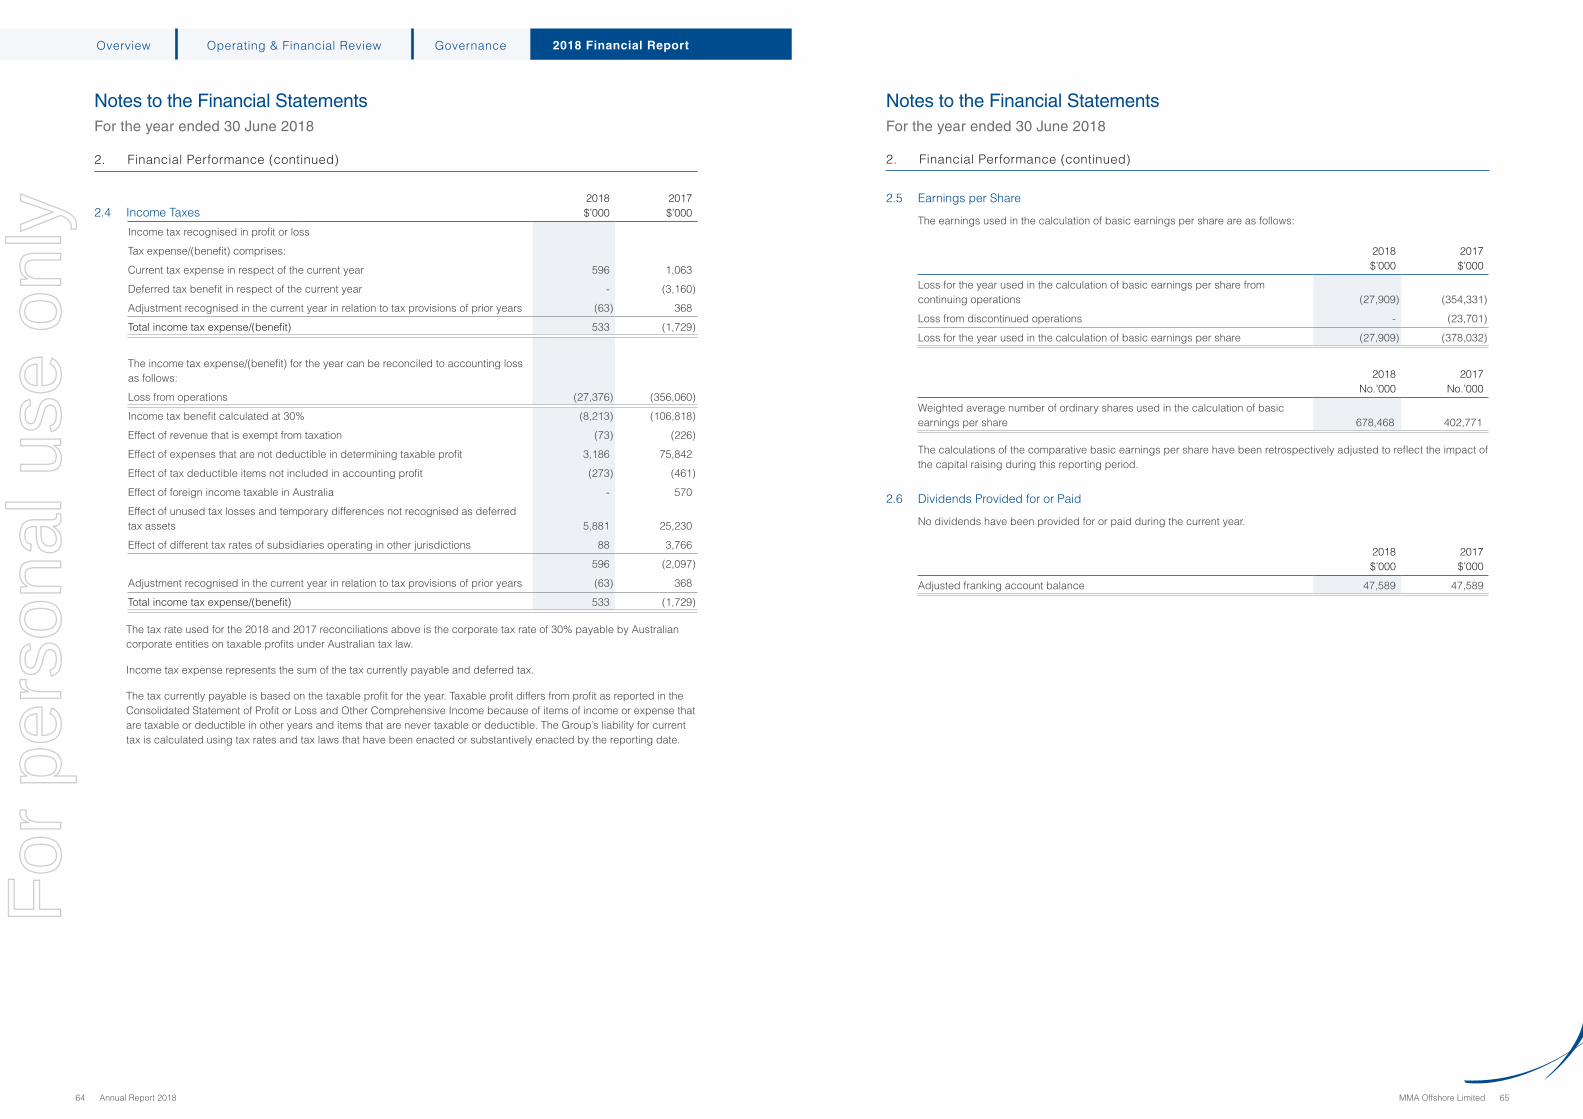
64 Annual Report 2018 MMA Offshore Limited 65
Notes to the Financial Statements For the year ended 30 June 2018
Notes to the Financial Statements For the year ended 30 June 2018
Overview Operating & Financial Review Governance 2018 Financial Report
2. Financial Performance (continued)
2.4 Income Taxes2018 $’000
2017 $’000
Income tax recognised in profit or loss
Tax expense/(benefit) comprises:
Current tax expense in respect of the current year 596 1,063
Deferred tax benefit in respect of the current year - (3,160)
Adjustment recognised in the current year in relation to tax provisions of prior years (63) 368
Total income tax expense/(benefit) 533 (1,729)
The income tax expense/(benefit) for the year can be reconciled to accounting loss as follows:
Loss from operations (27,376) (356,060)
Income tax benefit calculated at 30% (8,213) (106,818)
Effect of revenue that is exempt from taxation (73) (226)
Effect of expenses that are not deductible in determining taxable profit 3,186 75,842
Effect of tax deductible items not included in accounting profit (273) (461)
Effect of foreign income taxable in Australia - 570
Effect of unused tax losses and temporary differences not recognised as deferred tax assets 5,881 25,230
Effect of different tax rates of subsidiaries operating in other jurisdictions 88 3,766
596 (2,097)
Adjustment recognised in the current year in relation to tax provisions of prior years (63) 368
Total income tax expense/(benefit) 533 (1,729)
The tax rate used for the 2018 and 2017 reconciliations above is the corporate tax rate of 30% payable by Australian corporate entities on taxable profits under Australian tax law.
Income tax expense represents the sum of the tax currently payable and deferred tax.
The tax currently payable is based on the taxable profit for the year. Taxable profit differs from profit as reported in the Consolidated Statement of Profit or Loss and Other Comprehensive Income because of items of income or expense that are taxable or deductible in other years and items that are never taxable or deductible. The Group’s liability for current tax is calculated using tax rates and tax laws that have been enacted or substantively enacted by the reporting date.
2. Financial Performance (continued)
2.5 Earnings per Share
The earnings used in the calculation of basic earnings per share are as follows:
2018 $’000
2017 $’000
Loss for the year used in the calculation of basic earnings per share from continuing operations (27,909) (354,331)
Loss from discontinued operations - (23,701)
Loss for the year used in the calculation of basic earnings per share (27,909) (378,032)
2018 No.’000
2017 No.’000
Weighted average number of ordinary shares used in the calculation of basic earnings per share 678,468 402,771
The calculations of the comparative basic earnings per share have been retrospectively adjusted to reflect the impact of the capital raising during this reporting period.
2.6 Dividends Provided for or Paid
No dividends have been provided for or paid during the current year.
2018 $’000
2017 $’000
Adjusted franking account balance 47,589 47,589
For
per
sona
l use
onl
y
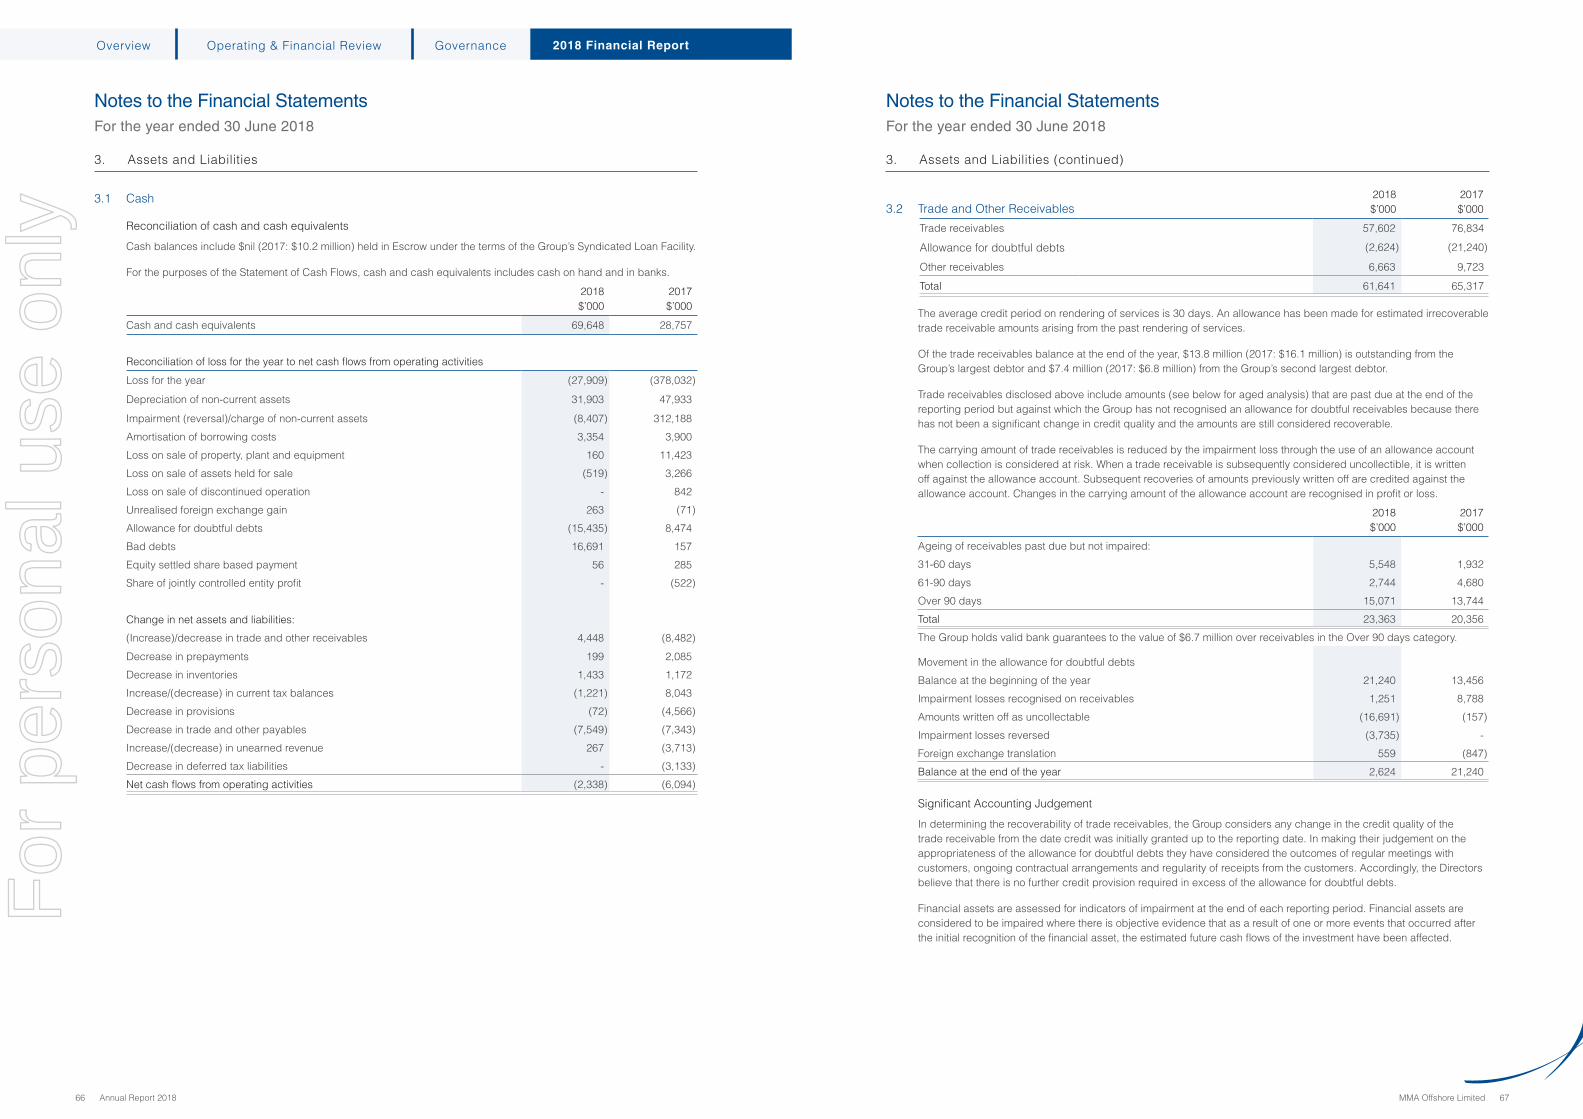
66 Annual Report 2018 MMA Offshore Limited 67
Notes to the Financial Statements For the year ended 30 June 2018
Notes to the Financial Statements For the year ended 30 June 2018
Overview Operating & Financial Review Governance 2018 Financial Report
3. Assets and Liabilities
3.1 Cash
Reconciliation of cash and cash equivalents
Cash balances include $nil (2017: $10.2 million) held in Escrow under the terms of the Group’s Syndicated Loan Facility.
For the purposes of the Statement of Cash Flows, cash and cash equivalents includes cash on hand and in banks.
2018 $’000
2017 $’000
Cash and cash equivalents 69,648 28,757
Reconciliation of loss for the year to net cash flows from operating activities
Loss for the year (27,909) (378,032)
Depreciation of non-current assets 31,903 47,933
Impairment (reversal)/charge of non-current assets (8,407) 312,188
Amortisation of borrowing costs 3,354 3,900
Loss on sale of property, plant and equipment 160 11,423
Loss on sale of assets held for sale (519) 3,266
Loss on sale of discontinued operation - 842
Unrealised foreign exchange gain 263 (71)
Allowance for doubtful debts (15,435) 8,474
Bad debts 16,691 157
Equity settled share based payment 56 285
Share of jointly controlled entity profit - (522)
Change in net assets and liabilities:
(Increase)/decrease in trade and other receivables 4,448 (8,482)
Decrease in prepayments 199 2,085
Decrease in inventories 1,433 1,172
Increase/(decrease) in current tax balances (1,221) 8,043
Decrease in provisions (72) (4,566)
Decrease in trade and other payables (7,549) (7,343)
Increase/(decrease) in unearned revenue 267 (3,713)
Decrease in deferred tax liabilities - (3,133)
Net cash flows from operating activities (2,338) (6,094)
3. Assets and Liabilities (continued)
3.2 Trade and Other Receivables2018 $’000
2017 $’000
Trade receivables 57,602 76,834
Allowance for doubtful debts (2,624) (21,240)
Other receivables 6,663 9,723
Total 61,641 65,317
The average credit period on rendering of services is 30 days. An allowance has been made for estimated irrecoverable trade receivable amounts arising from the past rendering of services.
Of the trade receivables balance at the end of the year, $13.8 million (2017: $16.1 million) is outstanding from the Group’s largest debtor and $7.4 million (2017: $6.8 million) from the Group’s second largest debtor.
Trade receivables disclosed above include amounts (see below for aged analysis) that are past due at the end of the reporting period but against which the Group has not recognised an allowance for doubtful receivables because there has not been a significant change in credit quality and the amounts are still considered recoverable.
The carrying amount of trade receivables is reduced by the impairment loss through the use of an allowance account when collection is considered at risk. When a trade receivable is subsequently considered uncollectible, it is written off against the allowance account. Subsequent recoveries of amounts previously written off are credited against the allowance account. Changes in the carrying amount of the allowance account are recognised in profit or loss.
2018 $’000
2017 $’000
Ageing of receivables past due but not impaired:
31-60 days 5,548 1,932
61-90 days 2,744 4,680
Over 90 days 15,071 13,744
Total 23,363 20,356
The Group holds valid bank guarantees to the value of $6.7 million over receivables in the Over 90 days category.
Movement in the allowance for doubtful debts
Balance at the beginning of the year 21,240 13,456
Impairment losses recognised on receivables 1,251 8,788
Amounts written off as uncollectable (16,691) (157)
Impairment losses reversed (3,735) -
Foreign exchange translation 559 (847)
Balance at the end of the year 2,624 21,240
Significant Accounting Judgement
In determining the recoverability of trade receivables, the Group considers any change in the credit quality of the trade receivable from the date credit was initially granted up to the reporting date. In making their judgement on the appropriateness of the allowance for doubtful debts they have considered the outcomes of regular meetings with customers, ongoing contractual arrangements and regularity of receipts from the customers. Accordingly, the Directors believe that there is no further credit provision required in excess of the allowance for doubtful debts.
Financial assets are assessed for indicators of impairment at the end of each reporting period. Financial assets are considered to be impaired where there is objective evidence that as a result of one or more events that occurred after the initial recognition of the financial asset, the estimated future cash flows of the investment have been affected.
For
per
sona
l use
onl
y

68 Annual Report 2018 MMA Offshore Limited 69
Notes to the Financial Statements For the year ended 30 June 2018
Notes to the Financial Statements For the year ended 30 June 2018
Overview Operating & Financial Review Governance 2018 Financial Report
3. Assets and Liabilities (continued)
3.3 Inventories2018 $’000
2017 $’000
Fuel – at cost 1,289 2,501
Consumables 326 511
Work in progress - 20
Total 1,615 3,032
Inventories are stated at the lower of cost or net realisable value. Net realisable value represents the estimated selling price for inventories less all estimated costs of completion and costs necessary to make the sale.
3.4 Assets Classified as Held for Sale
Non-current assets are classified as held for sale if their carrying amount will be recovered principally through a sale transaction rather than through continuing use and a sale is considered highly probable. They are measured at the lower of their carrying amount or fair value less costs to sell. An impairment loss is recognised for any initial write-down of the asset to fair value less costs to sell. Information regarding the assets held for sale in the Statement of Financial Position is presented below.
At 31 December 2016, the Group resolved to dispose of a number of non-core vessels within the fleet.
At 30 June 2018, the carrying value of the vessels not yet sold was $9.4 million (2017: $35.9million).
3. Assets and Liabilities (continued)
3.5 Property, Plant and Equipment
Leasehold Buildings and Improvements
at cost $’000
Vessels at cost
$’000
Plant and Equipment
at cost $’000
Plant and Equipment
– Hire Purchase
at cost $’000
Fixed Assets under
Construction at cost
$’000Total
$’000
Gross carrying amount:
Balance at 1 July 2016 155,363 1,243,937 32,763 11,195 111,645 1,554,903
Additions 194 12,162 106 569 18,834 31,865
Disposals (964) (73,088) (106) (690) - (74,848)
Transfers - 134,202 160 (135) (134,227) -
Reclassification of assets held for sale (140,363) (349,852) (16,625) (10,426) - (517,266)
Net currency exchange differences (284) 48,399 (242) (513) 3,748 51,108
Balance at 1 July 2017 13,946 1,015,760 16,056 - - 1,045,762
Additions 109 8,977 108 - - 9,194
Disposals (46) (87,981) (131) - - (88,158)
Net currency exchange differences (13) 16,001 432 - - 16,420
Balance at 30 June 2018 13,996 952,757 16,465 - - 983,218
Accumulated depreciation:
Balance at 1 July 2016 (93,319) (462,912) (18,520) (6,940) (17,430) (599,121)
Disposals 291 45,256 72 431 - 46,050
Impairment charge (21,457) (275,126) (3,494) (1,256) (10,855) (312,188)
Depreciation expense (1,738) (43,549) (2,311) (335) - (47,933)
Transfers - (27,616) (125) 101 27,640 -
Reclassification of assets held for sale 105,683 292,472 12,318 7,913 - 418,386
Net currency exchange differences (1,981) (51,468) 148 86 645 (52,570)
Balance at 1 July 2017 (12,521) (522,943) (11,912) - - (547,376)
Disposals 44 87,981 3 - - 88,028
Impairment reversal - 8,236 - - - 8,236
Depreciation expense (90) (30,910) (903) - - (31,903)
Net currency exchange differences (186) (3,331) (265) - - (3,782)
Balance at 30 June 2018 (12,753) (460,967) (13,077) - - (486,797)
Net book value:
As at 30 June 2017 1,425 492,817 4,144 - - 498,386
As at 30 June 2018 1,243 491,790 3,388 - - 496,421
Leasehold buildings and improvements, vessels, plant and equipment and equipment under finance lease are stated at cost less, where applicable, accumulated depreciation and impairment losses. Cost includes expenditure that is directly attributed to the acquisition of the item.
Depreciation is recognised so as to write off the cost or valuation of assets less their residual values over their useful lives. Leasehold buildings and improvements are depreciated over the period of the lease or estimated useful life, whichever is the shorter, using the straight-line method.
Assets held under finance leases are depreciated over their expected useful lives on the same basis as owned assets.
For
per
sona
l use
onl
y
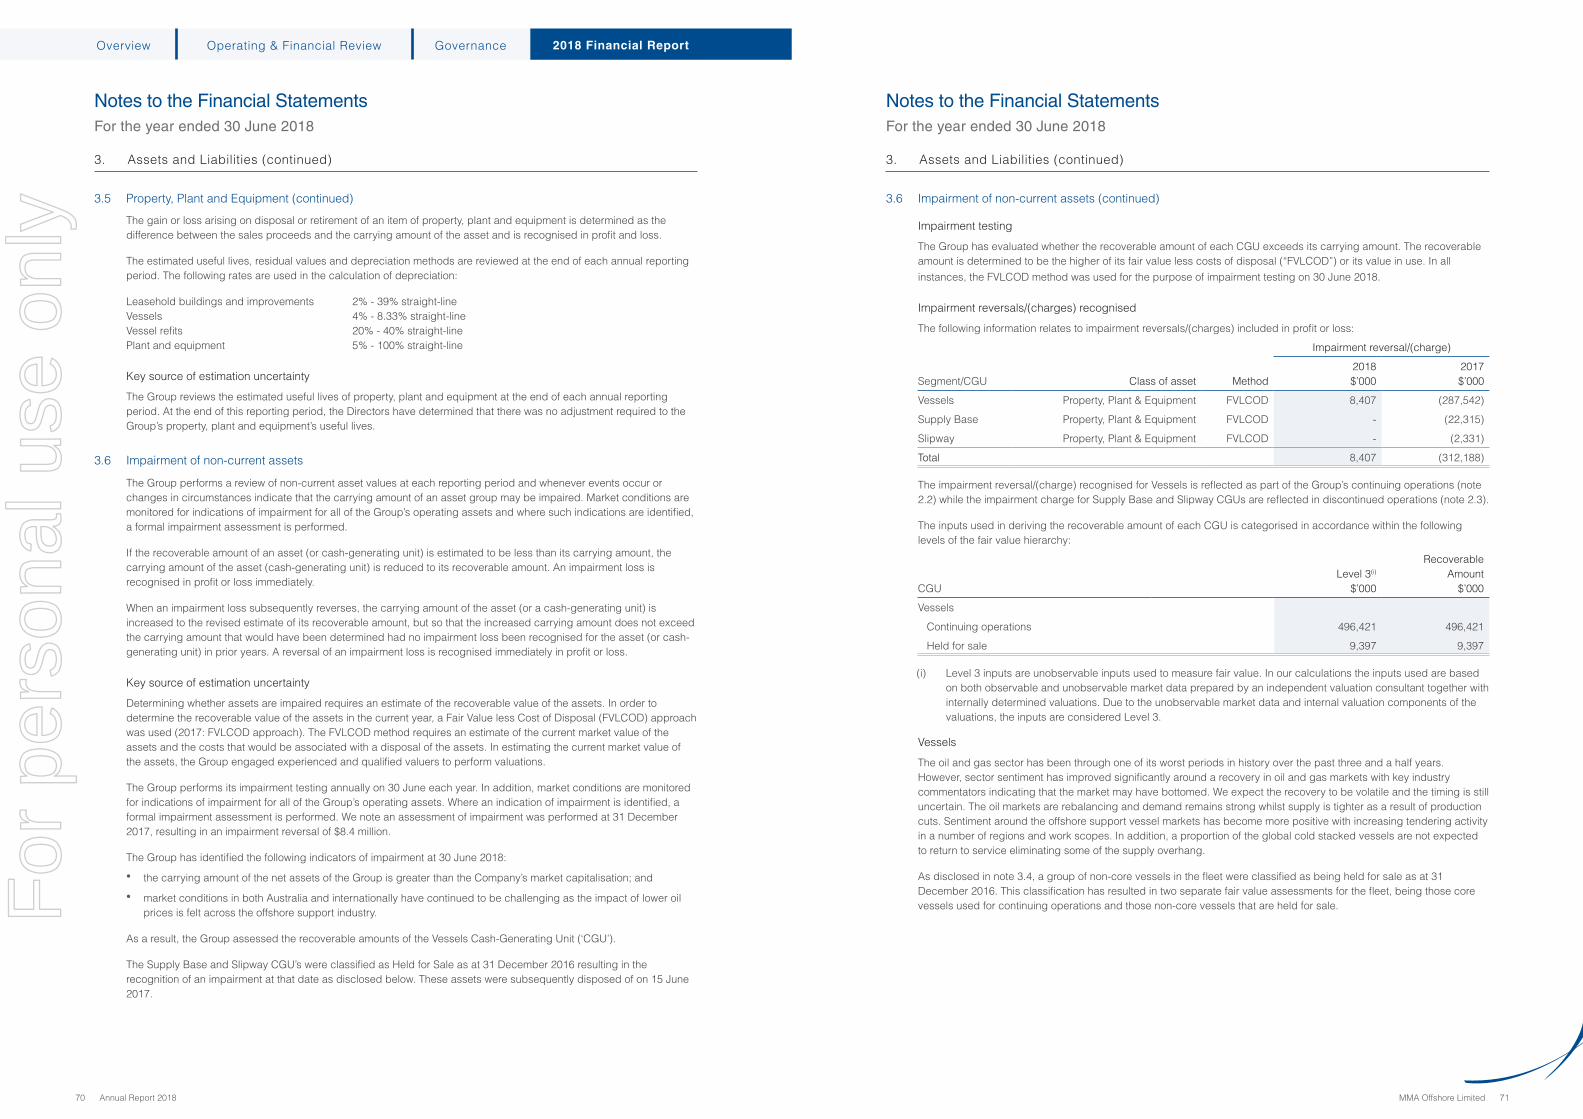
70 Annual Report 2018 MMA Offshore Limited 71
Notes to the Financial Statements For the year ended 30 June 2018
Notes to the Financial Statements For the year ended 30 June 2018
Overview Operating & Financial Review Governance 2018 Financial Report
3. Assets and Liabilities (continued)
3.5 Property, Plant and Equipment (continued)
The gain or loss arising on disposal or retirement of an item of property, plant and equipment is determined as the difference between the sales proceeds and the carrying amount of the asset and is recognised in profit and loss.
The estimated useful lives, residual values and depreciation methods are reviewed at the end of each annual reporting period. The following rates are used in the calculation of depreciation:
Leasehold buildings and improvements 2% - 39% straight-lineVessels 4% - 8.33% straight-lineVessel refits 20% - 40% straight-linePlant and equipment 5% - 100% straight-line
Key source of estimation uncertainty
The Group reviews the estimated useful lives of property, plant and equipment at the end of each annual reporting period. At the end of this reporting period, the Directors have determined that there was no adjustment required to the Group’s property, plant and equipment’s useful lives.
3.6 Impairment of non-current assets
The Group performs a review of non-current asset values at each reporting period and whenever events occur or changes in circumstances indicate that the carrying amount of an asset group may be impaired. Market conditions are monitored for indications of impairment for all of the Group’s operating assets and where such indications are identified, a formal impairment assessment is performed.
If the recoverable amount of an asset (or cash-generating unit) is estimated to be less than its carrying amount, the carrying amount of the asset (cash-generating unit) is reduced to its recoverable amount. An impairment loss is recognised in profit or loss immediately.
When an impairment loss subsequently reverses, the carrying amount of the asset (or a cash-generating unit) is increased to the revised estimate of its recoverable amount, but so that the increased carrying amount does not exceed the carrying amount that would have been determined had no impairment loss been recognised for the asset (or cash-generating unit) in prior years. A reversal of an impairment loss is recognised immediately in profit or loss.
Key source of estimation uncertainty
Determining whether assets are impaired requires an estimate of the recoverable value of the assets. In order to determine the recoverable value of the assets in the current year, a Fair Value less Cost of Disposal (FVLCOD) approach was used (2017: FVLCOD approach). The FVLCOD method requires an estimate of the current market value of the assets and the costs that would be associated with a disposal of the assets. In estimating the current market value of the assets, the Group engaged experienced and qualified valuers to perform valuations.
The Group performs its impairment testing annually on 30 June each year. In addition, market conditions are monitored for indications of impairment for all of the Group’s operating assets. Where an indication of impairment is identified, a formal impairment assessment is performed. We note an assessment of impairment was performed at 31 December 2017, resulting in an impairment reversal of $8.4 million.
The Group has identified the following indicators of impairment at 30 June 2018:
• the carrying amount of the net assets of the Group is greater than the Company’s market capitalisation; and
• market conditions in both Australia and internationally have continued to be challenging as the impact of lower oil prices is felt across the offshore support industry.
As a result, the Group assessed the recoverable amounts of the Vessels Cash-Generating Unit (‘CGU’).
The Supply Base and Slipway CGU’s were classified as Held for Sale as at 31 December 2016 resulting in the recognition of an impairment at that date as disclosed below. These assets were subsequently disposed of on 15 June 2017.
3. Assets and Liabilities (continued)
3.6 Impairment of non-current assets (continued)
Impairment testing
The Group has evaluated whether the recoverable amount of each CGU exceeds its carrying amount. The recoverable amount is determined to be the higher of its fair value less costs of disposal (“FVLCOD”) or its value in use. In all instances, the FVLCOD method was used for the purpose of impairment testing on 30 June 2018.
Impairment reversals/(charges) recognised
The following information relates to impairment reversals/(charges) included in profit or loss:
Impairment reversal/(charge)
Segment/CGU Class of asset Method2018 $’000
2017 $’000
Vessels Property, Plant & Equipment FVLCOD 8,407 (287,542)
Supply Base Property, Plant & Equipment FVLCOD - (22,315)
Slipway Property, Plant & Equipment FVLCOD - (2,331)
Total 8,407 (312,188)
The impairment reversal/(charge) recognised for Vessels is reflected as part of the Group’s continuing operations (note 2.2) while the impairment charge for Supply Base and Slipway CGUs are reflected in discontinued operations (note 2.3).
The inputs used in deriving the recoverable amount of each CGU is categorised in accordance within the following levels of the fair value hierarchy:
CGULevel 3(i)
$’000
Recoverable Amount
$’000
Vessels
Continuing operations 496,421 496,421
Held for sale 9,397 9,397
(i) Level 3 inputs are unobservable inputs used to measure fair value. In our calculations the inputs used are based on both observable and unobservable market data prepared by an independent valuation consultant together with internally determined valuations. Due to the unobservable market data and internal valuation components of the valuations, the inputs are considered Level 3.
Vessels
The oil and gas sector has been through one of its worst periods in history over the past three and a half years. However, sector sentiment has improved significantly around a recovery in oil and gas markets with key industry commentators indicating that the market may have bottomed. We expect the recovery to be volatile and the timing is still uncertain. The oil markets are rebalancing and demand remains strong whilst supply is tighter as a result of production cuts. Sentiment around the offshore support vessel markets has become more positive with increasing tendering activity in a number of regions and work scopes. In addition, a proportion of the global cold stacked vessels are not expected to return to service eliminating some of the supply overhang.
As disclosed in note 3.4, a group of non-core vessels in the fleet were classified as being held for sale as at 31 December 2016. This classification has resulted in two separate fair value assessments for the fleet, being those core vessels used for continuing operations and those non-core vessels that are held for sale.F
or p
erso
nal u
se o
nly

72 Annual Report 2018 MMA Offshore Limited 73
Notes to the Financial Statements For the year ended 30 June 2018
Notes to the Financial Statements For the year ended 30 June 2018
Overview Operating & Financial Review Governance 2018 Financial Report
3. Assets and Liabilities (continued)
3.6 Impairment of non-current assets (continued)
Continuing Operations
The recoverable amount of the core vessels was determined using a market based approach, reflecting the value which could be expected to be realised through the disposal of the vessels, in an orderly market, on an “as is where is” basis between a willing buyer and willing seller.
An independent valuation of the fleet was undertaken by a specialist marine valuation consultancy and shipbroking company. In preparing their valuation report, some of the factors they considered include the current market conditions in which the vessels operate, a review of recent market sales of similar vessels, consideration of the specification and earnings potential of each vessel and the inherent value and replacement cost of each vessel.
A key input into the recoverable amount of the CGU was the application of a discount to the independent vessel valuation to reflect the amount which would be achieved if the fleet was disposed of in one single transaction. In the June 2017 impairment assessment, the company used a discount of 20%. Given the stabilisation of the market, where we are in the cycle and taking into account the independent valuers assessment of the fleet, the Board have applied a discount of 17.5% to the value for the fleet which reflects recoverable value.
The following factors were taken into account in determining this value:
• The stable rising trend in oil prices during the 2018 financial year• An increase in project and development commitments by the oil and gas majors• Increasing tender opportunities in the market• Increasing activity in the vessel sales market• Acknowledging the increased activity in the industry is still at an early stage in the market cycle and there is
uncertainty about the extent and timing of recovery• Acknowledging the impact of the significant vessel tonnage in the industry
A 2.5% increase or decrease in the ‘en bloc discount rate would result in a corresponding $15 million increase or decrease in the impairment reversal or charge.
Another key input was the estimated costs of disposal. The Company has adopted a selling cost equal to 2% of the sale value of each vessel based on actual selling costs of between 1.5% and 2.5% for previous vessel sales.
Inputs in determining the classification level within the fair value hierarchy are reassessed at each reporting period as part of the impairment process. The inputs used within calculations are assessed and discussed internally to determine the extent to which they can be compared to observable market information and classified accordingly.
Held for Sale
The recoverable amount of the non-core vessels was determined using a market based approach, reflecting the value which could be expected to be realised through an accelerated sale program.
In assessing the fair value of these non-core vessels the Company has taken into consideration the following factors:
• actual sales of the non-core vessels that have been completed to date • current sale contracts and negotiations on the remaining non-core vessels• market sales evidence for similar vessels over the past 6 months
The price that would be expected to be received in these circumstances for these non-core vessels would be less than if sold in an orderly transaction with no time restrictions to complete the sale.
A 5% increase or decrease of expected sale proceeds would result in corresponding $0.5 million decrease or increase in the fair value for these non-core vessels.
3.7 Trade and Other Payables2018 $’000
2017 $’000
Trade payables 5,017 7,826
Other payables and accruals 26,379 24,390
Goods and services tax payable 913 5,170
Total 32,309 37,386
The average credit period on purchases of all goods is 30 days. The Group monitors payments to ensure that all payables are paid within the credit time frame.
3. Assets and Liabilities (continued)
3.8 Borrowings2018 $’000
2017 $’000
Secured – at amortised cost
Current
Hire purchase liability(i) 6 5
Bank loans(ii) 3,992 -
Unamortised loan fees(iii) (2,259) -
Total 1,739 5
Non-CurrentHire purchase liability(i) 4 8
Bank loans(ii) 265,009 324,209
Unamortised loan fees(iii) (5,080) (9,770)
Total 259,933 314,447
Summary of borrowing arrangements:
(i) The hire purchase liabilities are fixed interest rate debt with repayment periods not exceeding 3 years. The current weighted average interest rate on the hire purchase liabilities is 2.9% (2017: 2.9%).
(ii) In conjunction with the capital raising that occurred during this reporting period, the Group was able to renegotiate the terms of its Syndicated Debt Facility with its existing lenders. The key amendments to the Facility included:
• Extending the term for a further 2 years from maturity on 30 September 2019 to 30 September 2021
• Reducing the interest rate
• Agreeing certain amendments and holidays to specified covenants
• Cash sweep of excess cash above $70.0 million from 30 June 2020, 31 December 2020 and 30 June 2021
• Agreeing to a revised amortisation profile
The revised amortisation profile includes:
• A payment of $30.0 million by 31 December 2017 which was linked with the capital raising and was paid
• $5.0 million by 30 June 2020
• $7.5 million by 31 December 2020
• $7.5 million by 30 June 2021
• The balance is to be repaid on maturity at 30 September 2021
In addition, proceeds from the sale of non-core vessels will continue to be applied against the outstanding amount with $30.0 million to be repaid by 31 December 2018. Any shortfall is to be funded from the Group’s cash reserves. This obligation has now been met as a result of the successful completion of vessel sales, with $26.0 million repaid prior to 30 June 2018 and a further $5.1 million repaid in July 2018.
The facility is fully secured by fixed and floating charges given by controlled entities within the Group, registered ship mortgages over a number of vessels owned by certain entities and real property mortgages.
The current weighted average interest rate on the bank loans is 6.08% (2017: 7.6%).
(iii) The unamortised loan fees are in relation to the Syndicated Facility Agreement.
Other financial liabilities including borrowings are initially measured at fair value, net of transaction costs.
Other financial liabilities are subsequently measured at amortised cost using the effective interest method, with interest expense recognised on an effective yield basis. The effective interest method is a method of calculating the amortised cost of a financial liability and of allocating interest expense over the relevant period. The effective interest rate is the rate that exactly discounts estimated future cash payments through the expected life of the financial liability, or, where appropriate, a shorter period to the net carrying amount on initial recognition.
The Group derecognises financial liabilities when, and only when, the Group’s obligations are discharged, cancelled or they expire. The difference between the carrying amount of the financial liability derecognised and the consideration paid or payable is recognised in the profit and loss.
For
per
sona
l use
onl
y
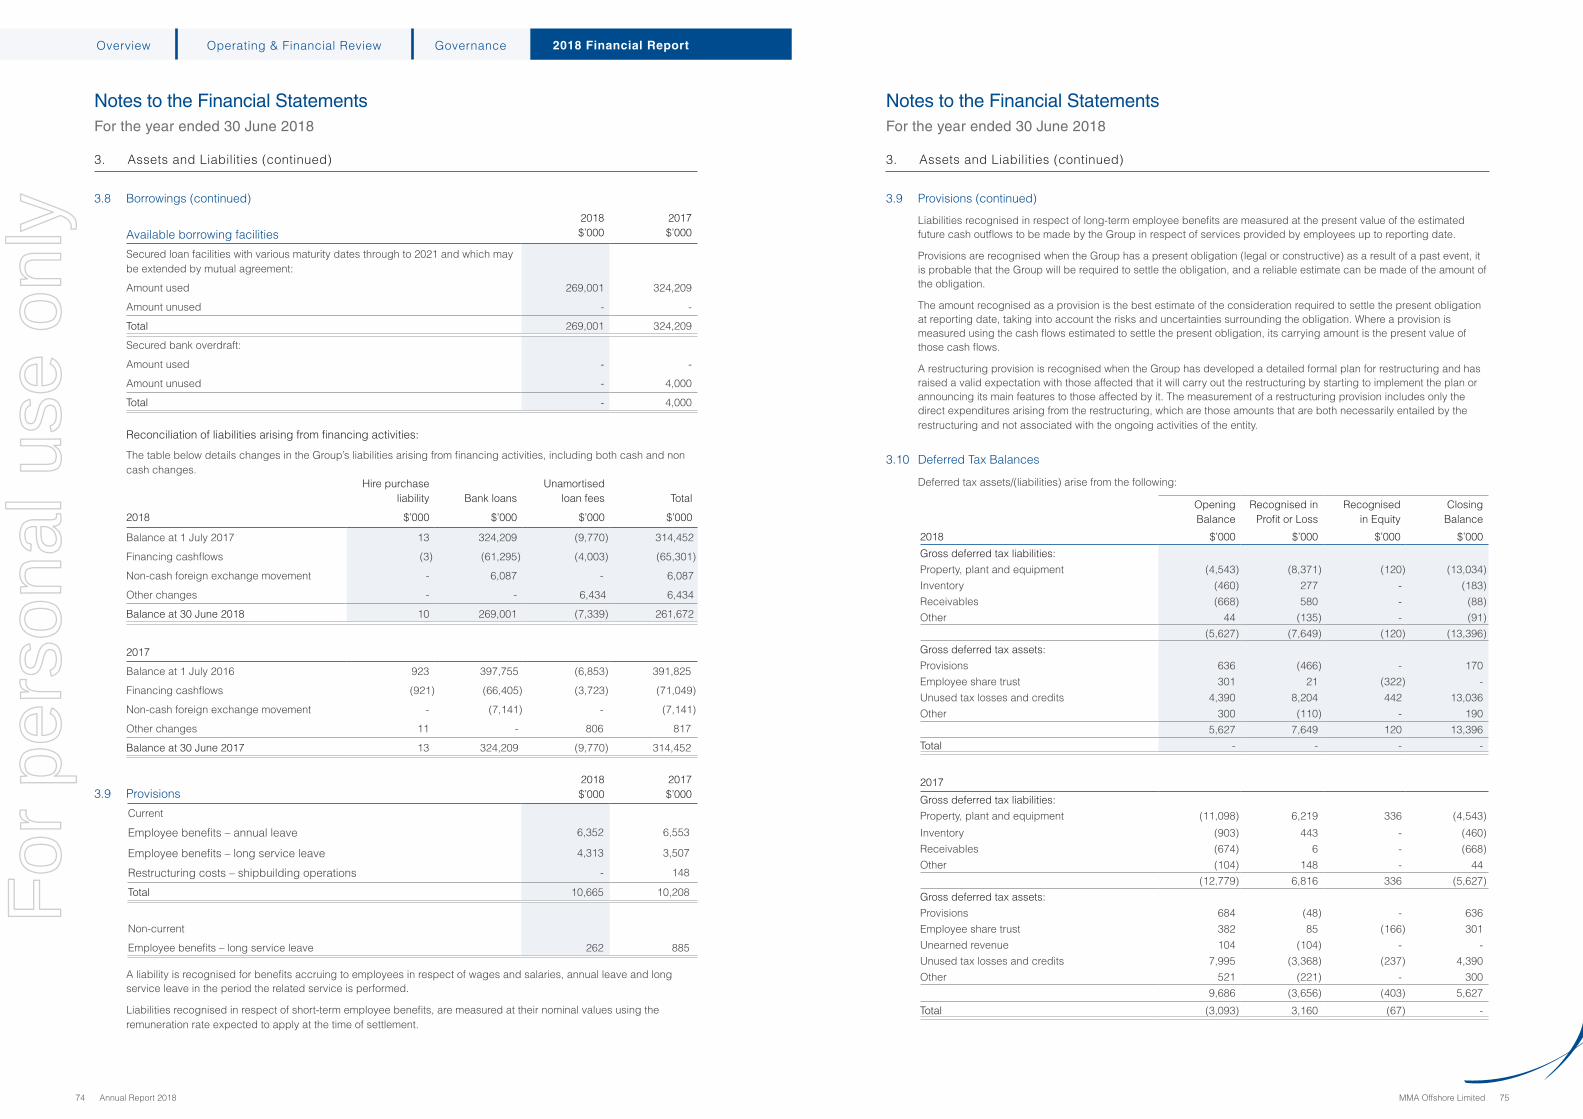
74 Annual Report 2018 MMA Offshore Limited 75
Notes to the Financial Statements For the year ended 30 June 2018
Notes to the Financial Statements For the year ended 30 June 2018
Overview Operating & Financial Review Governance 2018 Financial Report
3. Assets and Liabilities (continued)
3.8 Borrowings (continued)
Available borrowing facilities
2018 $’000
2017 $’000
Secured loan facilities with various maturity dates through to 2021 and which may be extended by mutual agreement:
Amount used 269,001 324,209
Amount unused - -
Total 269,001 324,209
Secured bank overdraft:
Amount used - -
Amount unused - 4,000
Total - 4,000
Reconciliation of liabilities arising from financing activities:
The table below details changes in the Group’s liabilities arising from financing activities, including both cash and non cash changes.
Hire purchase liability Bank loans
Unamortised loan fees Total
2018 $’000 $’000 $’000 $’000
Balance at 1 July 2017 13 324,209 (9,770) 314,452
Financing cashflows (3) (61,295) (4,003) (65,301)
Non-cash foreign exchange movement - 6,087 - 6,087
Other changes - - 6,434 6,434
Balance at 30 June 2018 10 269,001 (7,339) 261,672
2017
Balance at 1 July 2016 923 397,755 (6,853) 391,825
Financing cashflows (921) (66,405) (3,723) (71,049)
Non-cash foreign exchange movement - (7,141) - (7,141)
Other changes 11 - 806 817
Balance at 30 June 2017 13 324,209 (9,770) 314,452
3.9 Provisions2018 $’000
2017 $’000
Current
Employee benefits – annual leave 6,352 6,553
Employee benefits – long service leave 4,313 3,507
Restructuring costs – shipbuilding operations - 148
Total 10,665 10,208
Non-current
Employee benefits – long service leave 262 885
A liability is recognised for benefits accruing to employees in respect of wages and salaries, annual leave and long service leave in the period the related service is performed.
Liabilities recognised in respect of short-term employee benefits, are measured at their nominal values using the remuneration rate expected to apply at the time of settlement.
3. Assets and Liabilities (continued)
3.9 Provisions (continued)
Liabilities recognised in respect of long-term employee benefits are measured at the present value of the estimated future cash outflows to be made by the Group in respect of services provided by employees up to reporting date.
Provisions are recognised when the Group has a present obligation (legal or constructive) as a result of a past event, it is probable that the Group will be required to settle the obligation, and a reliable estimate can be made of the amount of the obligation.
The amount recognised as a provision is the best estimate of the consideration required to settle the present obligation at reporting date, taking into account the risks and uncertainties surrounding the obligation. Where a provision is measured using the cash flows estimated to settle the present obligation, its carrying amount is the present value of those cash flows.
A restructuring provision is recognised when the Group has developed a detailed formal plan for restructuring and has raised a valid expectation with those affected that it will carry out the restructuring by starting to implement the plan or announcing its main features to those affected by it. The measurement of a restructuring provision includes only the direct expenditures arising from the restructuring, which are those amounts that are both necessarily entailed by the restructuring and not associated with the ongoing activities of the entity.
3.10 Deferred Tax Balances
Deferred tax assets/(liabilities) arise from the following:
Opening Balance
Recognised in Profit or Loss
Recognised in Equity
Closing Balance
2018 $’000 $’000 $’000 $’000
Gross deferred tax liabilities:Property, plant and equipment (4,543) (8,371) (120) (13,034)Inventory (460) 277 - (183)Receivables (668) 580 - (88)Other 44 (135) - (91)
(5,627) (7,649) (120) (13,396)Gross deferred tax assets:Provisions 636 (466) - 170Employee share trust 301 21 (322) -Unused tax losses and credits 4,390 8,204 442 13,036Other 300 (110) - 190
5,627 7,649 120 13,396Total - - - -
2017
Gross deferred tax liabilities:Property, plant and equipment (11,098) 6,219 336 (4,543)
Inventory (903) 443 - (460)Receivables (674) 6 - (668)Other (104) 148 - 44
(12,779) 6,816 336 (5,627)Gross deferred tax assets:Provisions 684 (48) - 636Employee share trust 382 85 (166) 301Unearned revenue 104 (104) - -Unused tax losses and credits 7,995 (3,368) (237) 4,390Other 521 (221) - 300
9,686 (3,656) (403) 5,627
Total (3,093) 3,160 (67) -
For
per
sona
l use
onl
y

76 Annual Report 2018 MMA Offshore Limited 77
Notes to the Financial Statements For the year ended 30 June 2018
Notes to the Financial Statements For the year ended 30 June 2018
Overview Operating & Financial Review Governance 2018 Financial Report
3. Assets and Liabilities (continued)
3.10 Deferred Tax Balances (continued)
Deferred tax is recognised on temporary differences between the carrying amounts of assets and liabilities in the financial statements and the corresponding tax bases used in the computation of taxable profit. Deferred tax assets are generally recognised for all deductible temporary differences to the extent that it is probable that taxable profits will be available against which deductible temporary differences can be utilised.
Deferred tax assets and liabilities are measured at the tax rates that are expected to apply in the period(s) in which the liability is settled or the asset is realised, based on tax rates (and tax laws) that have been enacted or substantively enacted by reporting date. The measurement of deferred tax liabilities and assets reflects the tax consequences that would follow from the manner in which the Group expects, at the reporting date, to recover or settle the carrying amount of its assets and liabilities.
Deferred tax assets and liabilities are offset when there is a legally enforceable right to set off current tax assets against current tax liabilities and when they relate to income taxes levied by the same taxation authority and the Group intends to settle its current tax assets and liabilities on a net basis.
Current and deferred tax are recognised in profit or loss, except when they relate to items that are recognised in other comprehensive income or directly in equity, in which case the current and deferred tax are also recognised in other comprehensive income or directly in equity respectively.
Unrecognised deferred tax assets2018 $’000
2017 $’000
Deductible temporary differences, unused tax losses and unused tax credits for which no deferred tax assets have been recognised are attributable to the following:
Tax losses (revenue in nature) 64,603 39,371
Tax losses (capital in nature) 19,320 19,313
Deductible temporary differences 5,668 10,116
The carrying amount of deferred tax assets is reviewed at the end of each reporting period and reduced to the extent that it is no longer probable that sufficient taxable profits will be available to allow all or part of the asset to be recovered.
Nature of tax funding arrangements and tax sharing agreements
Entities within the tax-consolidated group have entered into a tax funding arrangement and a tax sharing agreement with the head entity. Under the terms of the tax funding arrangement, MMA Offshore Ltd and each of the entities in the tax-consolidated group has agreed to pay a tax equivalent payment to or from the head entity, based on the current tax liability or current tax asset of the entity. Such amounts are reflected in amounts receivable from or payable to other entities in the tax-consolidated group.
The tax sharing agreement entered into between members of the tax-consolidated group provides for the determination of the allocation of income tax liabilities between the entities should the head entity default on its tax payment obligations or if any entity should leave the tax consolidated group. The effect of the tax sharing agreement is that each member’s liability for tax payable by the tax consolidated group is limited to the amount payable to the head entity under the tax funding arrangement.
4. Capital Structure
4.1 Issued Capital
Fully Paid Ordinary Shares 2018
No.’0002018 $’000
2017 No.’000
2017 $’000
Balance at beginning of financial year 373,077 561,275 373,077 556,566
Issue of shares under institutional placement 111,923 22,385 - -
Issue of shares under institutional entitlement offer 78,027 15,605 - -
Issue of shares under retail entitlement offer 295,050 59,010 - -
Share issue costs - (4,558) - -
Transfer employee equity settled benefits reserve - 1,018 - 4,709
Balance at end of financial year 858,077 654,735 373,077 561,275
Fully paid ordinary shares carry one vote per share and carry the right to dividends.
Share Rights
As at 30 June 2018, executives and employees held rights over 9,555,660 ordinary shares (2017: 10,923,881) in aggregate (see note 5.2). All remaining share rights lapsed in July 2018.
Share rights granted under the employee share rights plans carry no right to dividends and no voting rights.
An equity instrument is any contract that evidences a residual interest in the assets of an entity after deducting all of its liabilities. Equity instruments issued by the Group are recorded at the proceeds received, net of direct issue costs.
4.2 Reserves2018 $’000
2017 $’000
Employee equity settled benefits 154 1,114
Hedging (57,290) (51,203)
Foreign currency translation 178,590 165,288
Balance at end of financial year 121,454 115,199
The employee equity settled benefits reserve arises on the grant of share rights to executives and employees under the Company’s share rights plans. Amounts are transferred out of the reserve and into issued capital when the rights vest or expire.
The hedging reserve is used to record gains and losses on hedges designated as cash flow hedges including hedges of net investments in a foreign operation. Gains and losses accumulated in the hedge reserve are taken to the profit or loss when the hedged transaction impacts the profit or loss, or is included as an adjustment to the initial carrying amount of the hedged item. For a net investment in a foreign operation any gains and losses are taken to profit and loss on disposal of the foreign operation.
The foreign currency translation reserve represents exchange differences relating to the translation from the functional currencies of the Group’s foreign controlled entities into Australian Dollars.
The assets and liabilities of the Group’s foreign operations are translated into Australian Dollars using exchange rates prevailing at the end of the reporting period. Income and expense items are translated at the average exchange rates for the period. Exchange differences arising, if any, are recognised through other comprehensive income and recognised in equity.
On the disposal of the foreign operation (i.e. a disposal of the Group’s entire interest in a foreign operation), all of the accumulated exchange differences in respect of that operation attributable to the Group are reclassified to profit or loss.
For
per
sona
l use
onl
y

78 Annual Report 2018
Notes to the Financial Statements For the year ended 30 June 2018
Notes to the Financial Statements For the year ended 30 June 2018
Overview Operating & Financial Review Governance 2018 Financial Report
MMA Offshore Limited 79
4. Capital Structure (continued)
4.3 Capital Risk Management
The Group manages its capital to ensure that entities in the Group will be able to continue as going concerns, while maximising the return to stakeholders through the optimisation of the debt and equity balance. The Group’s overall strategy remains unchanged from 2017.
The capital structure of the Group consists of net debt (borrowings as detailed in note 3.8 offset by cash at bank balances) and equity of the Group (comprising issued capital and reserves as detailed in notes 4.1 and 4.2 and accumulated losses).
The Group is not subject to any externally imposed capital requirements other than normal banking requirements.
Based on recommendations of management and the Board, the Group will balance its overall capital structure through new share issues as well as the establishment of new borrowing facilities or repayment of existing facilities. The Group uses its gearing ratio (measured as net debt to equity) to manage its capital. The ratio is monitored on a monthly basis by the Board and management.
Gearing Ratio
The gearing ratio at the end of the reporting period was as follows:
2018 $’000
2017 $’000
Debt(i) 261,672 314,452
Cash and cash equivalents (69,648) (28,757)
Net debt 192,024 285,695
Equity(ii) 328,295 256,489
Gearing ratio 58% 111%
(i) Debt is defined as long and short-term borrowings, as detailed in note 3.8.(ii) Equity includes all capital and reserves of the Group that are managed as capital.
5. Other Notes
5.1 Commitments for Expenditure
Capital expenditure commitments2018 $’000
2017 $’000
Plant and Equipment - 339
Vessels 749 1,149
Total 749 1,488
Minimum Lease PaymentsPresent Value of Minimum
Lease Payments
Finance lease liabilities2018 $’000
2017 $’000
2018 $’000
2017 $’000
Not later than 1 year 7 6 6 5
Later than 1 year and not later than 5 years 5 10 4 8
Minimum future payments 12 16 10 13
Less future finance charges (2) (3) - -
Present value of minimum lease payments 10 13 10 13
Included in the Financial Statements as:
Borrowings – current (note 3.8) 6 5
Borrowings – non-current (note 3.8) 4 8
Total 10 13
Finance leases relate to various equipment with lease terms of up to 5 years. The Group has options to purchase the equipment for a nominated amount at the conclusion of the lease agreements.
Leases are classified as finance leases when the terms of the lease transfer substantially all the risks and rewards of ownership to the lessee. All other leases are classified as operating leases.
Assets held under finance leases are initially recognised as assets of the Group at their fair value at the inception of the lease or, if lower, at the present value of the minimum lease payments. The corresponding liability to the lessor is included in the Statement of Financial Position as a finance lease obligation.
Lease payments are apportioned between finance costs and reduction of the lease obligations so as to achieve a constant rate of interest on the remaining balance of the liability. Finance costs are recognised immediately in profit or loss.
For
per
sona
l use
onl
y

80 Annual Report 2018 MMA Offshore Limited 81
Notes to the Financial Statements For the year ended 30 June 2018
Notes to the Financial Statements For the year ended 30 June 2018
Overview Operating & Financial Review Governance 2018 Financial Report
5. Other Notes (continued)
5.1 Commitments for Expenditure (continued)
Operating leases2018 $’000
2017 $’000
Payments recognised as an expense:
Minimum lease payment 6,230 14,848
Non-cancellable operating lease commitments:
Not later than 1 year 3,828 3,345
Later than 1 year and not later than 5 years 3,350 5,483
Total non-cancellable operating lease commitments 7,178 8,828
Aggregate operating lease commitments comprise:
Office rental commitments(i) 3,661 4,363
Onshore facility rental commitments(ii) 1,476 3,969
Vessel charter fee commitments(iii) 1,066 -
Other(iv) 975 496
Total 7,178 8,828
(i) Office rental commitments: The Group has a lease on the head office premises at Fremantle, Australia which expires on 4 August 2020, with an option to extend for a further 5-year term. The Group also has a 2-year lease agreement in place for the Singapore office expiring on 31 January 2020.
(ii) Onshore facility rental commitments: The Group has a rental commitment for the lease of the Singapore Onshore Facility for a term expiring on 15 April 2021.
(iii) Vessel charter commitments: As of 30 June 2018, the Company had three vessels (2017: Nil) under bare boat charter agreement. Vessel charter commitments represent charter fee payments to be made to the owners of these vessels.
(iv) Other lease commitments: The Group has leases over a number of residential properties and various items of machinery and equipment. These leases are all on commercial terms for periods up to 5 years.
Operating lease payments are recognised as an expense on a straight-line basis over the lease term, except where another systematic basis is more representative of the time pattern in which economic benefits from the leased asset are consumed.
5. Other Notes (continued)
5.2 Share Based Payments
Share rights incentive plans
The Group has established ownership based compensation plans whereby executives and employees of the Group have been issued rights over ordinary shares of MMA Offshore Limited.
Upon exercise, each share right, converts into one ordinary share of MMA Offshore Limited. No amounts are paid or are payable by the recipient on receipt of the rights. The rights carry no entitlement to dividends and no voting rights. Holders of rights do not have the entitlement, by virtue of the right, to participate in any share issue of the Company. The rights may be exercised at any time from their vesting date to the date of their expiry. The rights are not quoted on the ASX.
The following share based payment arrangements were in existence during the current reporting period:
Series Number issued Grant Date Expiry Date
Exercise price
$
Fair Value at Grant date
$
(1) Issued 22 October 2014 1,052,625 22 Oct 2014 1 Jul 2017 0.00 1.09
(2) Issued 1 December 2014 11,382 1 Dec 2014 1 Jul 2017 0.00 1.09
(3) Issued 1 December 2014 430,075 18 Nov 2014 1 Jul 2017 0.00 0.75
(4) Issued 10 February 2016 2,001,432 18 Nov 2015 1 Jul 2020 0.00 0.02
(5) Issued 10 February 2016 8,037,836 7 Dec 2015 1 Jul 2020 0.00 0.02
(6) Issued 7 June 2016 220,284 18 Apr 2015 1 Jul 2020 0.00 0.02
None of the Performance Criteria for rights issued during the 2015 financial year as part of Series 1, 2 and 3 were met. As such, all the rights have lapsed in accordance with the terms of the Plan rules.
Performance Rights issued during the 2016 financial year as part of Series 4, 5 and 6 to executives and employees are subject to achievement of a number of vesting targets. 50% of the rights are subject to achieving a share price target and the remaining 50% are subject to the Company’s Total Shareholder Return percentile ranking relative to a selected Peer Group over the 3-year vesting period. At 30 June 2018 none of the performance criteria for these rights had been met and they will lapse in accordance with the terms of the Plan rules.
Please refer to the Remuneration Report on pages 35 to 44 for further details of Performance Rights issued to executives and employees.
Fair value of share rights granted during the year
There were no share rights granted during the year.
Equity settled share based payments to employees are measured at fair value of the equity instrument at grant date.
The fair value determined at the grant date of the equity settled share based payments is expensed on a straight-line basis over the vesting period, based on the Group’s estimate of equity instruments that will eventually vest, with a corresponding increase in equity. At the end of each reporting period, the Group revises its estimate of the number of equity instruments expected to vest. The impact of the revision of the original estimates, if any, is recognised in profit or loss such that the cumulative expense reflects the revised estimate, with corresponding adjustment to the employee equity settled benefits reserve.F
or p
erso
nal u
se o
nly
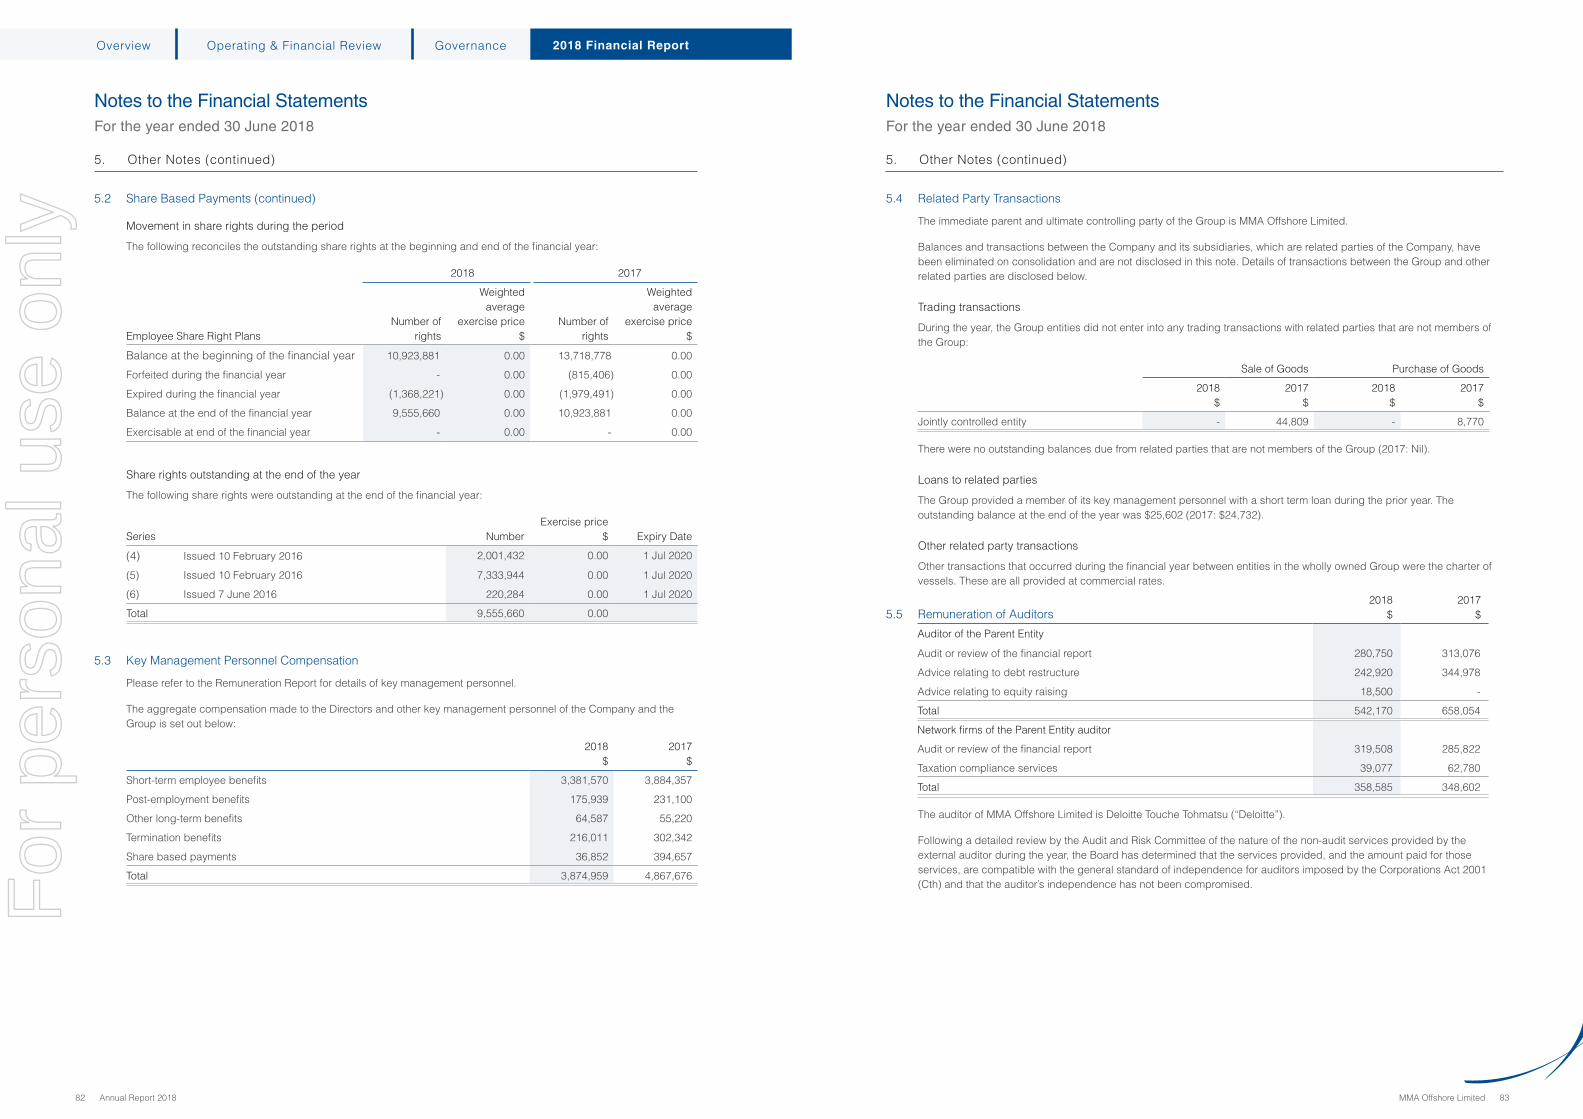
82 Annual Report 2018 MMA Offshore Limited 83
Notes to the Financial Statements For the year ended 30 June 2018
Notes to the Financial Statements For the year ended 30 June 2018
Overview Operating & Financial Review Governance 2018 Financial Report
5. Other Notes (continued)
5.2 Share Based Payments (continued)
Movement in share rights during the period
The following reconciles the outstanding share rights at the beginning and end of the financial year:
2018 2017
Employee Share Right PlansNumber of
rights
Weighted average
exercise price $
Number of rights
Weighted average
exercise price $
Balance at the beginning of the financial year 10,923,881 0.00 13,718,778 0.00
Forfeited during the financial year - 0.00 (815,406) 0.00
Expired during the financial year (1,368,221) 0.00 (1,979,491) 0.00
Balance at the end of the financial year 9,555,660 0.00 10,923,881 0.00
Exercisable at end of the financial year - 0.00 - 0.00
Share rights outstanding at the end of the year
The following share rights were outstanding at the end of the financial year:
Series NumberExercise price
$ Expiry Date
(4) Issued 10 February 2016 2,001,432 0.00 1 Jul 2020
(5) Issued 10 February 2016 7,333,944 0.00 1 Jul 2020
(6) Issued 7 June 2016 220,284 0.00 1 Jul 2020
Total 9,555,660 0.00
5.3 Key Management Personnel Compensation
Please refer to the Remuneration Report for details of key management personnel.
The aggregate compensation made to the Directors and other key management personnel of the Company and the Group is set out below:
2018 $
2017 $
Short-term employee benefits 3,381,570 3,884,357
Post-employment benefits 175,939 231,100
Other long-term benefits 64,587 55,220
Termination benefits 216,011 302,342
Share based payments 36,852 394,657
Total 3,874,959 4,867,676
5. Other Notes (continued)
5.4 Related Party Transactions
The immediate parent and ultimate controlling party of the Group is MMA Offshore Limited.
Balances and transactions between the Company and its subsidiaries, which are related parties of the Company, have been eliminated on consolidation and are not disclosed in this note. Details of transactions between the Group and other related parties are disclosed below.
Trading transactions
During the year, the Group entities did not enter into any trading transactions with related parties that are not members of the Group:
Sale of Goods Purchase of Goods
2018 $
2017 $
2018 $
2017 $
Jointly controlled entity - 44,809 - 8,770
There were no outstanding balances due from related parties that are not members of the Group (2017: Nil).
Loans to related parties
The Group provided a member of its key management personnel with a short term loan during the prior year. The outstanding balance at the end of the year was $25,602 (2017: $24,732).
Other related party transactions
Other transactions that occurred during the financial year between entities in the wholly owned Group were the charter of vessels. These are all provided at commercial rates.
5.5 Remuneration of Auditors2018
$2017
$
Auditor of the Parent Entity
Audit or review of the financial report 280,750 313,076
Advice relating to debt restructure 242,920 344,978
Advice relating to equity raising 18,500 -
Total 542,170 658,054
Network firms of the Parent Entity auditor
Audit or review of the financial report 319,508 285,822
Taxation compliance services 39,077 62,780
Total 358,585 348,602
The auditor of MMA Offshore Limited is Deloitte Touche Tohmatsu (“Deloitte”).
Following a detailed review by the Audit and Risk Committee of the nature of the non-audit services provided by the external auditor during the year, the Board has determined that the services provided, and the amount paid for those services, are compatible with the general standard of independence for auditors imposed by the Corporations Act 2001 (Cth) and that the auditor’s independence has not been compromised.F
or p
erso
nal u
se o
nly
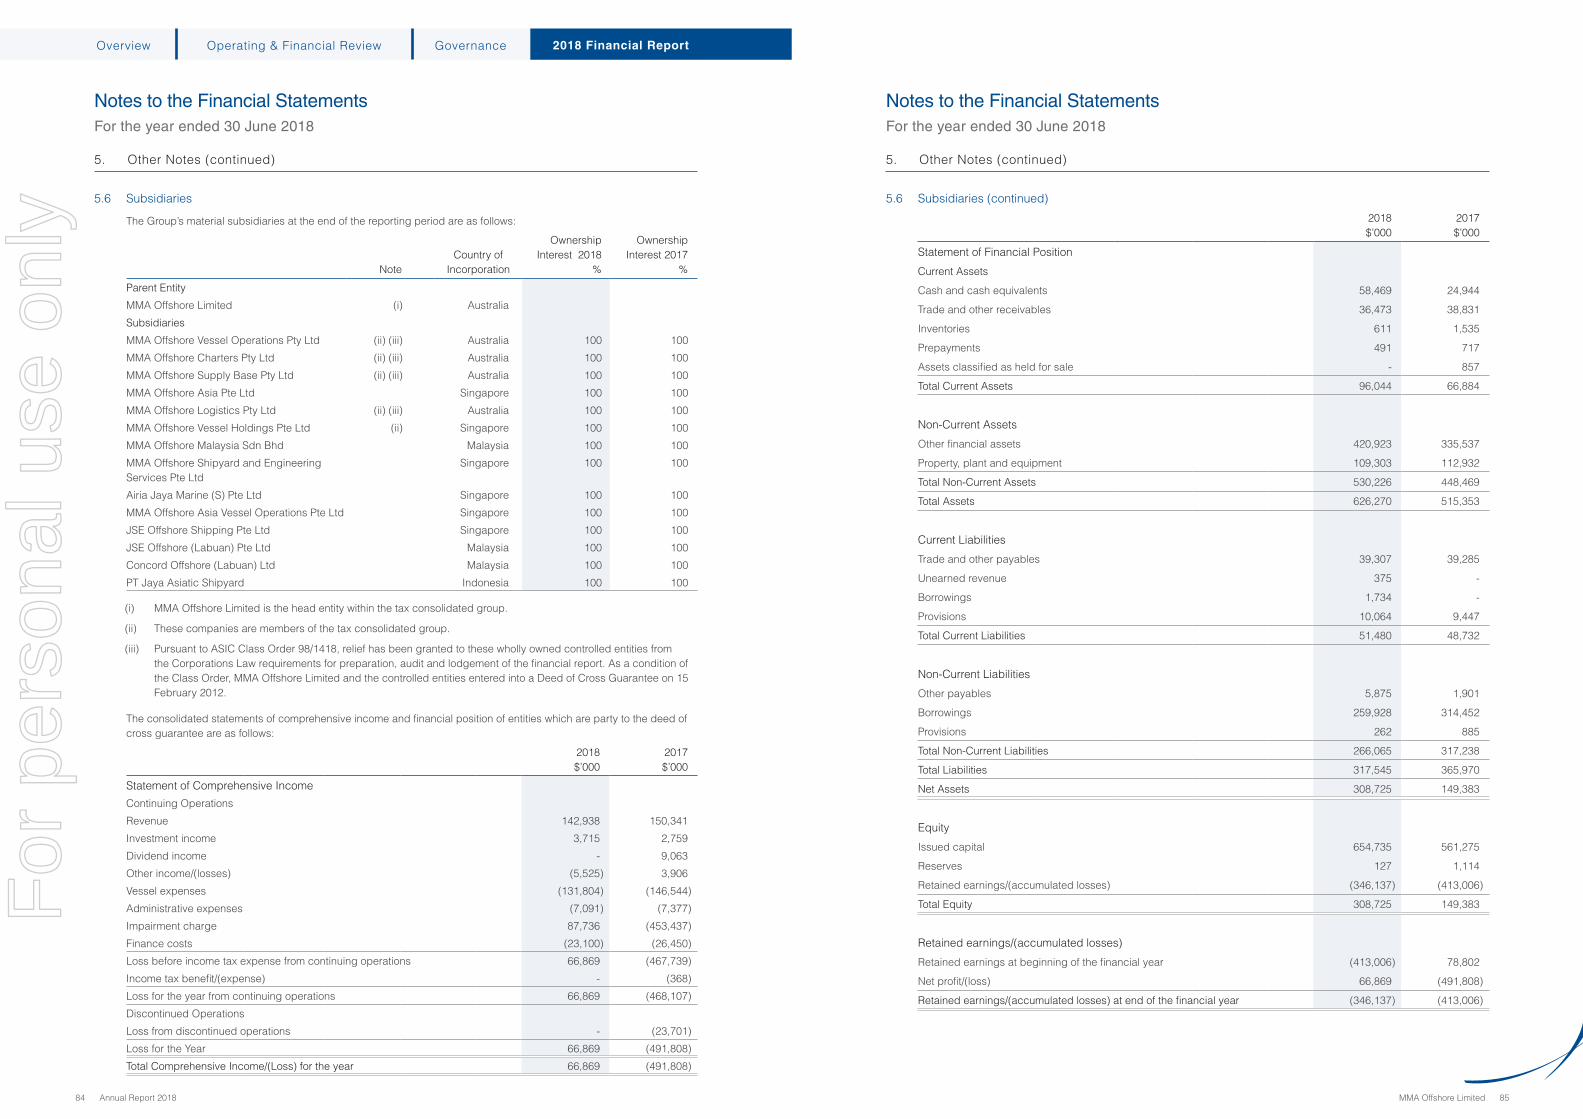
84 Annual Report 2018 MMA Offshore Limited 85
Notes to the Financial Statements For the year ended 30 June 2018
Notes to the Financial Statements For the year ended 30 June 2018
Overview Operating & Financial Review Governance 2018 Financial Report
5. Other Notes (continued)
5.6 Subsidiaries
The Group’s material subsidiaries at the end of the reporting period are as follows:
NoteCountry of
Incorporation
Ownership Interest 2018
%
Ownership Interest 2017
%
Parent Entity
MMA Offshore Limited (i) Australia
Subsidiaries
MMA Offshore Vessel Operations Pty Ltd (ii) (iii) Australia 100 100
MMA Offshore Charters Pty Ltd (ii) (iii) Australia 100 100
MMA Offshore Supply Base Pty Ltd (ii) (iii) Australia 100 100
MMA Offshore Asia Pte Ltd Singapore 100 100
MMA Offshore Logistics Pty Ltd (ii) (iii) Australia 100 100
MMA Offshore Vessel Holdings Pte Ltd (ii) Singapore 100 100
MMA Offshore Malaysia Sdn Bhd Malaysia 100 100
MMA Offshore Shipyard and Engineering Services Pte Ltd
Singapore 100 100
Airia Jaya Marine (S) Pte Ltd Singapore 100 100
MMA Offshore Asia Vessel Operations Pte Ltd Singapore 100 100
JSE Offshore Shipping Pte Ltd Singapore 100 100
JSE Offshore (Labuan) Pte Ltd Malaysia 100 100
Concord Offshore (Labuan) Ltd Malaysia 100 100
PT Jaya Asiatic Shipyard Indonesia 100 100
(i) MMA Offshore Limited is the head entity within the tax consolidated group.
(ii) These companies are members of the tax consolidated group.
(iii) Pursuant to ASIC Class Order 98/1418, relief has been granted to these wholly owned controlled entities from the Corporations Law requirements for preparation, audit and lodgement of the financial report. As a condition of the Class Order, MMA Offshore Limited and the controlled entities entered into a Deed of Cross Guarantee on 15 February 2012.
The consolidated statements of comprehensive income and financial position of entities which are party to the deed of cross guarantee are as follows:
2018 $’000
2017 $’000
Statement of Comprehensive Income
Continuing Operations
Revenue 142,938 150,341
Investment income 3,715 2,759
Dividend income - 9,063
Other income/(losses) (5,525) 3,906
Vessel expenses (131,804) (146,544)
Administrative expenses (7,091) (7,377)
Impairment charge 87,736 (453,437)
Finance costs (23,100) (26,450)
Loss before income tax expense from continuing operations 66,869 (467,739)
Income tax benefit/(expense) - (368)
Loss for the year from continuing operations 66,869 (468,107)
Discontinued Operations
Loss from discontinued operations - (23,701)
Loss for the Year 66,869 (491,808)
Total Comprehensive Income/(Loss) for the year 66,869 (491,808)
5. Other Notes (continued)
5.6 Subsidiaries (continued)
2018 $’000
2017 $’000
Statement of Financial Position
Current Assets
Cash and cash equivalents 58,469 24,944
Trade and other receivables 36,473 38,831
Inventories 611 1,535
Prepayments 491 717
Assets classified as held for sale - 857
Total Current Assets 96,044 66,884
Non-Current Assets
Other financial assets 420,923 335,537
Property, plant and equipment 109,303 112,932
Total Non-Current Assets 530,226 448,469
Total Assets 626,270 515,353
Current Liabilities
Trade and other payables 39,307 39,285
Unearned revenue 375 -
Borrowings 1,734 -
Provisions 10,064 9,447
Total Current Liabilities 51,480 48,732
Non-Current Liabilities
Other payables 5,875 1,901
Borrowings 259,928 314,452
Provisions 262 885
Total Non-Current Liabilities 266,065 317,238
Total Liabilities 317,545 365,970
Net Assets 308,725 149,383
Equity
Issued capital 654,735 561,275
Reserves 127 1,114
Retained earnings/(accumulated losses) (346,137) (413,006)
Total Equity 308,725 149,383
Retained earnings/(accumulated losses)
Retained earnings at beginning of the financial year (413,006) 78,802
Net profit/(loss) 66,869 (491,808)
Retained earnings/(accumulated losses) at end of the financial year (346,137) (413,006)
For
per
sona
l use
onl
y

86 Annual Report 2018 MMA Offshore Limited 87
Notes to the Financial Statements For the year ended 30 June 2018
Notes to the Financial Statements For the year ended 30 June 2018
Overview Operating & Financial Review Governance 2018 Financial Report
5. Other Notes (continued)
5.7 Parent Company Information
The accounting policies of the parent entity, which have been applied in determining the financial information shown below, are the same as those applied in the Consolidated Financial Statements.
Financial Position2018 $’000
2017 $’000
Assets
Current assets 57,706 17,352
Non-current assets 542,311 563,601
Total assets 600,017 580,953
Liabilities
Current liabilities 5,018 4,982
Non-current liabilities 266,705 319,482
Total liabilities 271,723 324,464
Net Assets 328,294 256,489
Equity
Issued capital 654,748 561,289
Retained earnings/(accumulated losses) (440,716) (420,079)
Profit reserve - 2016(i) 114,122 114,122
Employee equity settled benefits reserve 140 1,157
Total Equity 328,294 256,489
Financial Performance
Loss for the year (20,637) (420,079)
Other comprehensive gain - -
Total comprehensive gain/(loss) (20,637) (420,079)
Guarantees provided under the deed of cross guarantee 45,822 41,506
(i) A profit reserve was created in the prior year and represents an appropriation of amounts from retained earnings for the payment of future dividends.
5.8 Financial Instruments
Categories of financial instruments2018 $’000
2017 $’000
Financial assets
Cash and cash equivalents 69,648 28,757
Loans and receivables 61,641 65,317
Financial liabilities
Payables and borrowings at amortised cost 299,001 360,435
Financial risk management objectives
The Group’s treasury function includes the management of the Group’s financial assets and commitments including ensuring adequate procedures and controls are in place to manage financial risks. These risks include market risk (including currency and interest rate risk) credit risk and liquidity risk.
A Treasury Policy has been approved by the Board and provides guidelines for conducting treasury activities. Compliance with this Policy is monitored through internal audit procedures and subsequent reporting to the Audit and Risk Committee.
The Group seeks to minimise the effects of these risks, by using, where considered appropriate, derivative financial instruments to hedge these risk exposures. The allowable financial derivatives and conditions for their use are documented in the Treasury Policy. The Group does not enter into or trade financial instruments including derivative financial instruments for speculative purposes.
5. Other Notes (continued)
5.8 Financial Instruments (continued)
Market risk
The Group’s activities expose it primarily to the financial risks of changes in foreign currency exchange rates and interest rates. Where required, the Group can enter into a range of derivative financial instruments to manage its exposure to these risks.
At a Group level, these market risks are managed through sensitivity analysis. There is no change in the manner in which these risks are managed and measured in the current year.
Foreign currency risk management
The Group undertakes transactions denominated in foreign currencies. Consequently, exposures to exchange rate fluctuations arise. Exchange rate exposures are managed within approved policy parameters utilising forward foreign exchange contracts, when it is considered appropriate.
The carrying amounts of the Group’s foreign currency denominated monetary assets and monetary liabilities at the end of the financial year are as follows:
Liabilities Assets
2018 $’000
2017 $’000
2018 $’000
2017$’000
US Dollars 25,724 17,061 48,652 41,844
Singapore Dollars 3,076 3,518 2,682 2,335
Euro 445 643 12 877
Other 561 975 2,192 1,224
Foreign currency sensitivity analysis
The Group is mainly exposed to US Dollars (USD), Singapore Dollars (SGD) and Euro (EUR).
The following table details the Group’s sensitivity to a 10% increase and decrease in the Australian Dollar against the relevant foreign currencies. The 10% sensitivity represents management’s assessment of the reasonably possible change in foreign exchange rates. The sensitivity analysis includes only outstanding foreign currency denominated monetary items and adjusts their translation at the period end for a 10% change in foreign currency rates. A positive number below indicates an increase in profit or equity where the Australian dollar strengthens 10% against the relevant currency. For a 10% weakening of the Australian Dollar against the relevant currency, there would be an equal and opposite impact on the profit or equity.
Profit or Loss Equity(i)
2018 $’000
2017 $’000
2018$’000
2017 $’000
US Dollar Impact (394) (788) (1,691) (1,465)
Singapore Dollar Impact 12 1 24 107
Euro Impact 2 (17) 37 (5)
(i) The current and comparative year USD impact relates to the translation from the functional currencies of the Group’s foreign entities into Australian Dollars.
The Group’s profit and loss sensitivity to foreign currency has decreased at the end of the current period due to lower net USD denominated assets.
For
per
sona
l use
onl
y

88 Annual Report 2018 MMA Offshore Limited 89
Notes to the Financial Statements For the year ended 30 June 2018
Notes to the Financial Statements For the year ended 30 June 2018
Overview Operating & Financial Review Governance 2018 Financial Report
5. Other Notes (continued)
5.8 Financial Instruments (continued)
Interest rate risk management
The Group is exposed to interest rate risk because it borrows funds primarily at floating interest rates. The risk is managed by the Group by the use of interest rate swap contracts when considered appropriate. Hedging activities are evaluated regularly to align with interest rate views ensuring the most cost-effective hedging strategies are applied, if required.
The Group’s exposures to interest rates on financial assets and financial liabilities are detailed in the liquidity risk management section of this note.
Interest rate sensitivity analysis
The sensitivity analysis below has been determined based on the exposure to interest rates at the end of the reporting period. For floating rate liabilities, the analysis is prepared assuming the amount of the liability outstanding at the end of the reporting period was outstanding for the whole year. A 100 basis point increase or decrease is used when reporting interest rate risk internally to key management personnel and represents management’s assessment of the reasonably possible change in interest rates.
At reporting date, if interest rates had been 100 basis points higher / lower and all other variables were held constant, the impact on the net profit of the Group would be as follows:
• Net profit would decrease / increase by $2,690,012 (2017: decrease / increase by $3,242,085). This is attributable to the Group’s exposure to interest rates on its variable borrowings.
The Group’s sensitivity to interest rates has decreased during the current year due to the decrease in the carrying value of the variable rate debt instruments as a result of the principal repayments made during the year.
Credit risk management
Credit risk refers to the risk that a counterparty will default on its contractual obligations resulting in financial loss to the Group. The Group has a policy of only dealing with credit worthy counterparties. The Group’s exposures to its counterparties are continuously monitored by management. Where appropriate, the Group obtains guarantees from customers. Cash terms, advance payments or letters of credit are required from customers of lower credit standing.
Trade receivables consist of a large number of customers spread across the offshore oil and gas exploration, development and production industries and across diverse geographical areas. Ongoing credit evaluation is performed on the financial condition of trade receivables.
Apart from the largest, second and third largest trade receivables (refer note 3.2), the Group does not have any significant credit risk exposure to any single counterparty or any group of counterparties having similar characteristics. The Group defines counterparties as having similar characteristics if they are related entities. The credit risk on the three largest receivables is managed through regular meetings with the customers, on-going contractual arrangements and regular receipts for the balances outstanding.
The credit risk on liquid funds and derivative financial instruments is limited because the counterparties are banks with high credit ratings assigned by international credit rating agencies.
The carrying amount of financial assets recognised in the financial statements, which is net of impairment losses, represents the Group’s maximum exposure to credit risk.
Liquidity risk management
The Group manages liquidity risk by maintaining adequate cash reserves and borrowing facilities, continuously monitoring forecast and actual cash flows and managing credit terms with customers and suppliers.
5. Other Notes (continued)
5.8 Financial Instruments (continued)
Liquidity and interest risk tables
The following tables detail the Group’s remaining contractual maturity for its non-derivative financial liabilities with agreed repayment periods. The tables have been drawn up based on the undiscounted cash flows of financial liabilities based on the earliest date on which the Group can be required to pay. The table includes both interest and principal cash flows. To the extent that interest flows are at floating rate, the undiscounted amount is derived from current interest rates at the end of the reporting period.
Weighted average effective
interest rate %
Less than 1 month
$’000
1-3 months
$’000
3 months to 1 year
$’0001-5 years
$’000Total
$’000
30 June 2018
Non-interest bearing - 19,886 1,891 859 14,693 37,329
Hire purchase liability 2.90 1 1 5 5 12
Variable interest rate instruments 6.08 1,390 2,735 12,239 310,039 326,403
Total 21,277 4,627 13,103 324,737 363,744
30 June 2017
Non-interest bearing - 37,386 - - 8,597 45,983
Hire purchase liability 2.90 1 1 4 10 16
Variable interest rate instruments 7.60 2,899 4,124 18,457 355,106 380,586
Total 40,286 4,125 18,461 363,713 426,585
The following table details the Group’s expected maturity for its non-derivative financial assets. The table has been drawn up based on the undiscounted contractual maturities of the financial assets including interest that will be earned on those assets.
Weighted average effective
interest rate %
Less than 1 month
$’000
1-3 months
$’000
3 months to 1 year
$’0001-5 years
$’000Total
$’000
30 June 2018
Non-interest bearing - 24,960 6,658 29,423 600 61,641
Variable interest rate instruments 2.20 69,775 - - - 69,775
Total 94,735 6,658 29,423 600 131,416
30 June 2017
Non-interest bearing - 23,354 8,430 27,084 6,449 65,317
Variable interest rate instruments 1.06 28,782 - - - 28,782
Total 52,136 8,430 27,084 6,449 94,099
For
per
sona
l use
onl
y

90 Annual Report 2018 MMA Offshore Limited 91
Notes to the Financial Statements For the year ended 30 June 2018
Overview Operating & Financial Review Governance 2018 Financial Report
Additional Securities Exchange Information For the year ended 30 June 2018
5. Other Notes (continued)
5.8 Financial Instruments (continued)
Fair value of financial instruments
The Directors consider that the carrying amounts of financial assets and financial liabilities recognised in the consolidated financial statements approximate their fair values.
The fair values of financial assets and financial liabilities are determined as follows:
• The fair values of financial assets and financial liabilities with standard terms and conditions and traded on active liquid markets are determined with reference to quoted market prices.
• The fair values of other financial assets and financial liabilities (excluding derivative instruments) are determined in accordance with generally accepted pricing models based on discounted cash flow analysis.
5.9 Events After the Reporting Period
There has not been any matter or circumstance that occurred subsequent to the end of the financial year that has significantly affected, or may significantly affect, the operations of the consolidated entity, the results of those operations, or the state of affairs of the consolidated entity in future financial years.
Ordinary Share Capital (as at 14 September 2018)
858,077,084 fully paid ordinary shares are held by 7,112 individual shareholders. All issued ordinary shares carry one vote per share.
Substantial shareholdersNumber of
Shares% of Issued
Capital
Black Crane Asia Opportunities Fund 77,418,996 9.02
Halom Investments Pte Ltd 67,481,946 7.86
Paradice Investment Management Pty Ltd 62,537,998 7.29
Tribeca Investment Partners Pty Ltd 51,523,200 6.00
Eley Griffiths Group Pty Ltd 48,370,356 5.64
TIGA Trading Pty Ltd 46,806,956 5.45
Thorney Opportunities Ltd 46,806,956 5.45
First Samuel Limited 45,466,875 5.30
Distribution of Holders of Ordinary Shares (as at 31 August 2018)Size of Holding Number of ordinary shareholders
1 to 1,000 1,556
1,001 to 5,000 1,932
5,001 to 10,000 1,108
10,001 to 100,000 2,148
100,001 and over 361
Total 7,105
Twenty Largest Shareholders (as at 14 September 2018)Number of
Shares% of Issued
Capital
1 J P Morgan Nominees Australia Limited 156,803,021 18.27
2 HSBC Custody Nominees (Australia) Limited 141,780,152 16.52
3 Citicorp Nominees Pty Limited 126,228,272 14.71
4 National Nominees Limited 89,372,678 10.42
5 UBS Nominees Pty Ltd 34,969,417 4.08
6 BNP Paribas Nominees Pty Ltd <IB AU NOMS RETAILCLIENT DRP> 31,064,273 3.62
7 Warbont Nominees Pty Ltd <UNPAID ENTREPOT A/C> 12,255,550 1.43
8 Evelin Investments Pty Limited 9,160,000 1.07
9 Mr Hong Keong Chiu + Ms Yok Kee Khoo 8,830,149 1.03
10 Argo Investments Limited 6,000,000 0.70
11 Zakher Marine Intl Inc 5,847,378 0.68
12 Bond Street Custodians Limited <FORAGER WHOLESALE VALUE FD> 5,549,663 0.65
13 BNP Paribas Noms Pty Ltd <DRP> 5,378,627 0.63
14 Hishenk Pty Ltd 5,100,000 0.59
15 Zero Nominees Pty Ltd 5,000,000 0.58
16 Ms Jennifer Ann Weber + Mr Jeffrey Andrew Weber <JAWS Family A/C> 3,815,916 0.44
17 Neweconomy Com Au Nominees Pty Limited <900 ACCOUNT> 3,411,543 0.40
18 Mr Ross Alexander Macpherson 2,999,000 0.35
19 Mrs Elizabeth Aprieska <Tap Money Family A/C> 2,889,106 0.34
20 Mr Mark Francis Bradley 2,823,819 0.33
Total 659,278,564 76.83
For
per
sona
l use
onl
y

92 Annual Report 2018
Overview Operating & Financial Review Governance 2018 Financial Report
Unmarketable Parcels (as at 31 August 2018)
The number of holders holding less than a marketable parcel of the Company’s shares is as follows:
Minimum Parcel Size Number of ordinary shareholders Number of shares
2,174 2,302 1,759,339
Voting Rights
All ordinary shares carry one vote per share without restriction.
Unquoted Options
As at the date of this report, there are no unissued shares under rights.
Shareholder Enquiries
Shareholders can obtain information about their shareholding by contacting the Company’s share registry:
Computershare Investor Services Pty Ltd
GPO Box 2975MelbourneVictoria 3000 AustraliaEnquiries:(within Australia) 1300 850 505(outside Australia) 61 3 9415 4000Facsimile: 61 3 9473 [email protected]
Change of Address
Shareholders should notify the share registry immediately if there is a change to their registered address.
Securities Exchange Listing
Shares in MMA Offshore Limited are listed on the Australian Securities Exchange.
Publications
The Annual Report is the main source of information for shareholders.
Additional Securities Exchange Information For the year ended 30 June 2018 (continued)
Overview Operating & Financial Review Governance 2018 Financial Report
Directors
Andrew EdwardsChairman
Jeffrey WeberManaging Director
Peter KennanNon-Executive Director
Eve HowellNon-Executive Director
Chiang Gnee Heng Non-Executive Director
Company Secretary
Dylan Darbyshire-Roberts
Registered Office
Endeavour Shed, 1 Mews RoadFREMANTLE WA 6160Tel: +61 8 9431 7431Fax: +61 8 9431 7432www.mmaoffshore.com
Auditors
Deloitte Touche TohmatsuChartered AccountantsBrookfield Place, Tower 2 123 St Georges TerracePERTH WA 6000
Tel: +61 8 9365 7000Fax: +61 8 9365 7001
Solicitors
AshurstBrookfield Place, Tower 2 123 St Georges TerracePERTH WA 6000
Tel: +61 8 9366 8000Fax: +61 8 9366 8111
C o r p o r a t e D i r e c t o r y
For
per
sona
l use
onl
y
Ins
igh
t Co
mm
un
ica
tion
& D
es
ign
mmaoffshore.com
For
per
sona
l use
onl
y