Embed Size (px)
Citation preview
Magellan Financial Group Limited
Investor Briefing
Hamish DouglassChief Executive Officer
29th AUGUST 2013For
per
sona
l use
onl
y

Magellan Financial Group Limited Overview
� Sydney based investment boutique established in 2006, specialising in the management of global equity and infrastructure strategies.
� As at 30 June 2013:
• $14.7 billion in funds under management.
• 22 investment professionals and 58 total staff.
• Strong balance sheet with net assets of $153.0 million.
• Net profit after tax of $66.6 million.• Net profit after tax of $66.6 million.
� Underlying profit after tax $48.5 million1.
� Underlying EPS of 29.2 cents per share1,2.
� Dividend policy 75%-80% of underlying profit of funds management segment, subject to franking credits
� Theoretical capacity of our global equities and infrastructure strategies – US$50 billion
2
1 Excludes gain on the in-specie distribution2 Fully diluted.
For
per
sona
l use
onl
y

Key Statistics
Results Summary
30 June2013
30 June2012
% Change
Revenue $120.9m $35.8m 238%
Expenses $25.9m $16.7m 55%
Profit after tax $66.6m $13.7m 386%
Underlying Profit After Tax4 $48.5m $13.7m 254%
30 June2013
30 June2012
% Change
Earnings per share (EPS)1 40.0c 8.5c 371%
Underlying EPS4 29.2c 8.5c 244%
Dividend per share2 21.5c 4.5c 378%
NTA per share3 $1.02 $0.91 12%
1 Fully diluted.2 During the 2013 year an in-specie distribution representing 9.16 cents per share was made.3 Diluted assuming conversion of the Class B shares (& 2016 MFG options.)4 Excludes gain on the in-specie distribution
3
For
per
sona
l use
onl
y

MFG Capital Structure
30 June 2013 million
Ordinary Shares 152.783
2016 Options1 7.771
Class B Shares2,3 10.228
Total potential issued capital 170.782
1 MFG 2016 options have an exercise price of $2.6411 and expire on 30 June 2016.2 Class B shares are held by H.M. Douglass and will convert to ordinary shares on the first business day after 21 November 2016 . The number of ordinary shares is equal to 0.0637 times the number of ordinary shares on issue on 21 November 2016, subject to a cap of 10.83 million ordinary shares.3 Based on the ordinary shares on issue and assuming all options are fully exercised as at 30 June 2013
4
For
per
sona
l use
onl
y

Funds Management Business
$ million 30 June 2013 30 June 2012 % change
Revenue
Management fees 56.0 22.0 155%
Performance fees 28.5 9.1 213%
Consulting fees1 1.2 1.2 0%
Interest/other income 0.3 0.4 (25)%
86.0 32.7 163%
Expenses
Employee expense 17.4 11.4 53%
US Marketing/consulting fees2 1.6 - -
Other expense 6.2 5.0 24%Other expense 6.2 5.0 24%
25.2 16.4 54%
Profit before tax 60.8 16.3 273%
Key Statistics
30 June 2013 30 June 2012 % change
Avg. Number of Employees 51 38 34%
Employee expense/total expense 69.1% 69.5%
Cost/Income 29.3% 50.1%
Cost/Income (excl performance fees) 43.8% 69.3%
5
1 The arrangement under which consulting fees are received expired on 30 June 2013.2 Pursuant to the agreement, Frontier Partners is entitled to receive 25% of net management fees from Frontegra MFG Funds and 20% of net management fees from institutional mandates with clients in North America.
For
per
sona
l use
onl
y

Funds Management Business at 30 June 2013
North America
9%
UK6%
Geographical Management & Performance Fee Revenue
Breakdown
Expense Breakdown
Other Expense
25%
6
Australia85%
Employee expense
69%
US marketing/ consulting
fee expense6%
For
per
sona
l use
onl
y
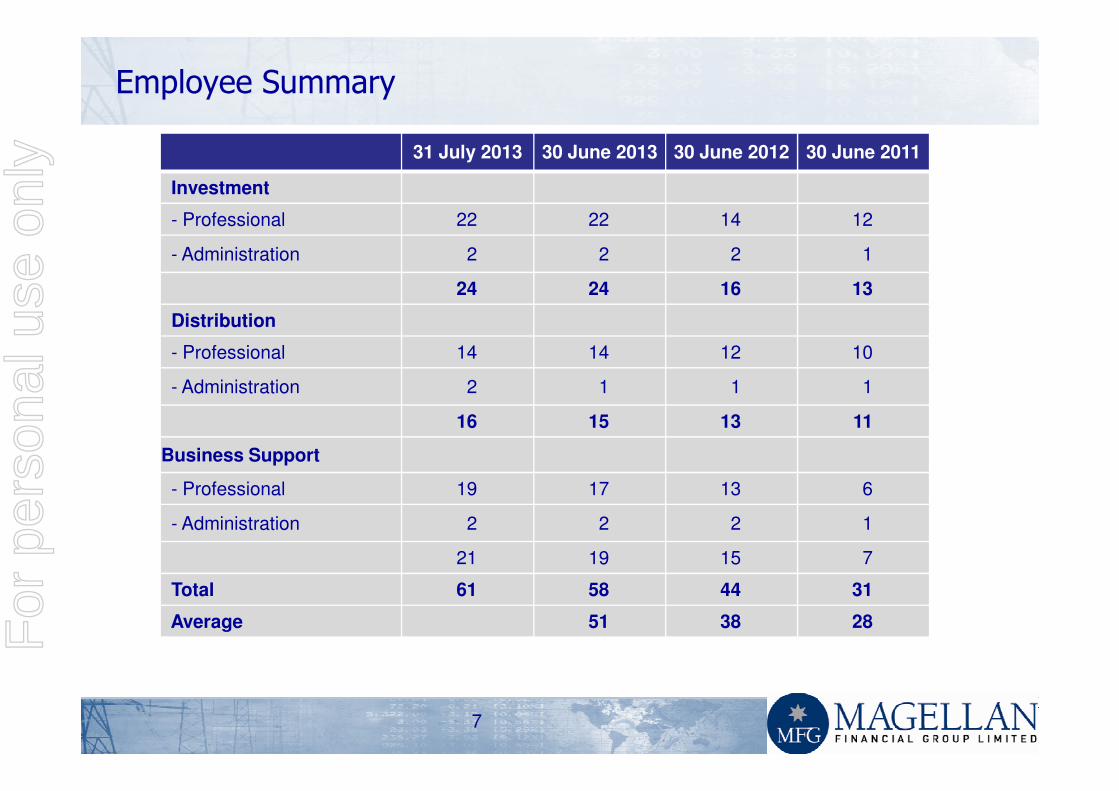
Employee Summary
31 July 2013 30 June 2013 30 June 2012 30 June 2011
Investment
- Professional 22 22 14 12
- Administration 2 2 2 1
24 24 16 13
Distribution
- Professional 14 14 12 10
- Administration 2 1 1 1- Administration 2 1 1 1
16 15 13 11
Business Support
- Professional 19 17 13 6
- Administration 2 2 2 1
21 19 15 7
Total 61 58 44 31
Average 51 38 28
7
For
per
sona
l use
onl
y

Employee and Expense Outlook
� We expect that the number of employees will increase modestly (currently 61) in 2013/14
� We expect total employee expenses will increase by approximately 40% in 2013/14
� US marketing costs to increase with North American funds under management and net management fees
8
For
per
sona
l use
onl
y

31 July 2013 30 June 2013 30 June 2012 30 June 2011
$ million
Retail 4,962 4,542 1,750 1,082
Institutional
- Australia/NZ 2,589 2,424 1,924 1,674- North America 3,085 2,891 306 -- Rest of World 5,346 4,838 26 -
11,020 10,153 2,256 1,674Total FUM 15,982 14,695 4,006 2,756%
Retail 31% 31% 44% 39%
Funds Under Management Summary
Retail 31% 31% 44% 39%
Institutional
- Australia/NZ 16% 16% 48% 61%- North America 20% 20% 7% -- Rest of World 33% 33% 1% -
69% 69% 56% 61%
Total FUM 100% 100% 100% 100%
Breakdown of Funds Under Management ($ million)
-Global Equities 13,094 12,088 2,357 1,046
-Infrastructure Equities 2,888 2,607 1,649 1,710
9
For
per
sona
l use
onl
y
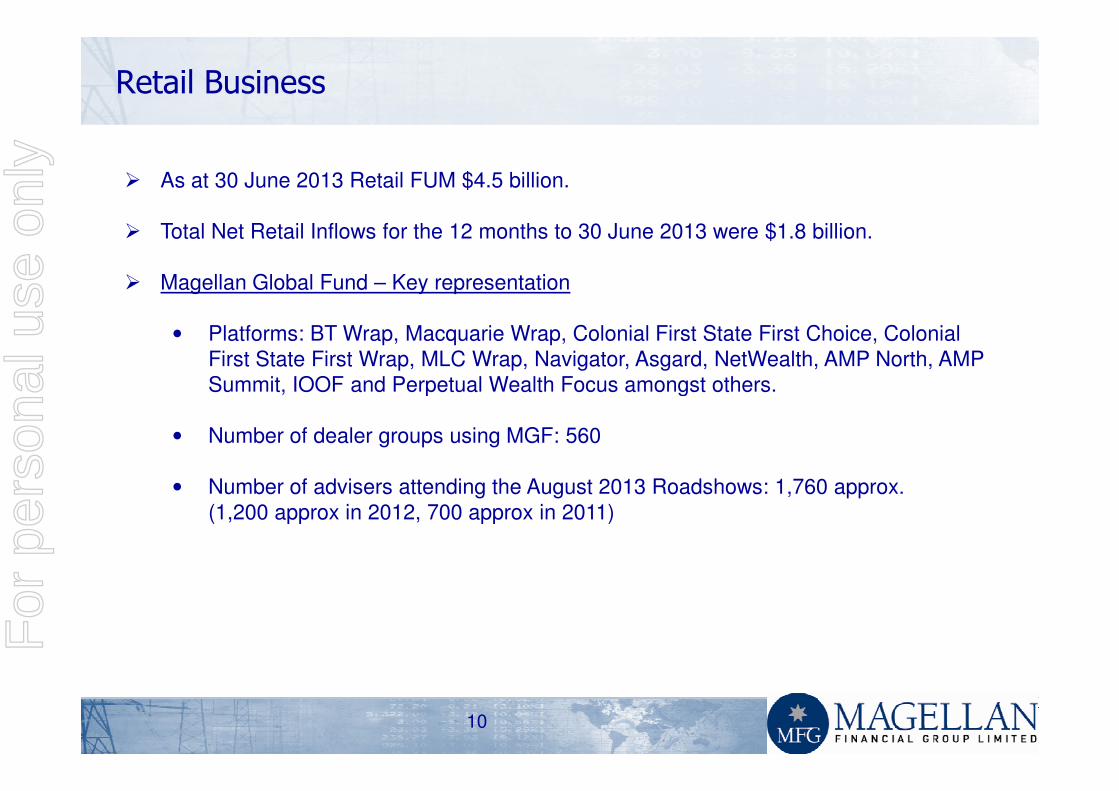
Retail Business
� As at 30 June 2013 Retail FUM $4.5 billion.
� Total Net Retail Inflows for the 12 months to 30 June 2013 were $1.8 billion.
� Magellan Global Fund – Key representation
• Platforms: BT Wrap, Macquarie Wrap, Colonial First State First Choice, Colonial First State First Wrap, MLC Wrap, Navigator, Asgard, NetWealth, AMP North, AMP Summit, IOOF and Perpetual Wealth Focus amongst others.Summit, IOOF and Perpetual Wealth Focus amongst others.
• Number of dealer groups using MGF: 560
• Number of advisers attending the August 2013 Roadshows: 1,760 approx.(1,200 approx in 2012, 700 approx in 2011)
10
For
per
sona
l use
onl
y

1 Year3 Years
p.a.5 Years
p.a.5 Years cumul.
Magellan Global Fund 39.7% 19.2% 15.6% 106.5%
MSCI World NTR Index ($A) 32.8% 10.7% 3.7% 19.8%
Excess 6.9% 8.5% 11.9% 86.7%
Retail Investment Performance at 30 June 2013
Magellan Infrastructure Fund 17.7% 19.2% 9.3% 56.0%
UBS Dev Infra & Utilities NTR Index Hedged ($A) 14.4% 12.0% 2.5% 13.1%
Excess 3.3% 7.2% 6.8% 42.9%
*Calculations are based on exit price with distributions reinvested, after ongoing fees and expenses but excluding individual tax, member fees and entry fees (ifapplicable). Annualised 5 Year performance is denoted with “p.a.”, cumulative 5 year performance is denoted with “cumul.”
Source: MSCI, Magellan Asset Management
11
For
per
sona
l use
onl
y

1 Year 3 Years (% p.a.) 5 Years (% p.a.)
Magellan Global 39.7% 19.2% 15.6%
Platinum International Brands 33.1% 11.8% 15.4%
IFP Global Franchise Fund 30.6% 16.4% 12.7%
Platinum International 37.3% 6.0% 9.5%
MFS Global Equity Trust 39.6% 13.6% 7.6%
Walter Scott Global Equity 28.2% 9.6% 6.2%
Global Equity Peer Comparison at 30 June 2013
Walter Scott Global Equity 28.2% 9.6% 6.2%
Fidelity Global Equities 31.5% 11.2% 4.2%
MSCI WORLD NET TR ($A) 32.8% 10.7% 3.7%
Zurich Investments Global Thematic 27.2% 7.5% 3.2%
Ironbark GTP Global Equity Thematic 29.6% 6.0% 1.3%
T. Rowe Price Global Equity 29.6% 7.6% -0.3%
AMP Capital Wholesale Global Equity Growth 25.3% 6.5% -3.2%
12
Source: MSCI, Morningstar
For
per
sona
l use
onl
y

Magellan Global Fund – Monthly Net Inflows and FUM
Retail Net Inflows – Global Equity
1,500
2,000
2,500
3,000
3,500
4,000
4,500
100
150
200
250 $M$M
•FUM & Flows includes Colonial First State Magellan Global Option from April 2011
13
-
500
1,000
1,500
-
50
Magellan Global Fund & CFS Flows - LHS Magellan Global Fund & CFS FUM - RHS
For
per
sona
l use
onl
y

Magellan High Conviction Fund
� Unconstrained, highly concentrated, high quality global equity strategy
� Leverages Magellan’s deep global equities/macroeconomic research and risk
management
� Focused on ‘best investment’ ideas (8 to 12 stocks)
� Portfolio managed by Hamish Douglass
� Fees
• Base Management fee 1.5% pa
14
• Base Management fee 1.5% pa
• Performance fee 10% of returns above 10% pa
� Capacity US$3 billion
� Offered to higher net worth clients in Australia and New Zealand
� Currently working on platform representation
For
per
sona
l use
onl
y

Institutional Business
� As at 30 June 2013 total institutional FUM $10.2 billion• Number of institutional clients 38• Global equities $7.8 billion• Infrastructure $2.4 billion
� Net inflows of $6.2 billion for the last 12 months.
� Australia/New Zealand: • 25 Institutional clients • FUM $2.4 billion at 30 June 2013.• FUM $2.4 billion at 30 June 2013.
� North America: • Nine new global equity mandates and one infrastructure mandate.
• We are sub-advisor to two institutional mutual funds in the United States for US based investors that do not qualify for the separate account minimum.
• FUM $2.9 billion at 30 June 2013.
15
For
per
sona
l use
onl
y

Institutional Business (continued)
� UK:
• February 2013 – St. James’s Place initial funding of approximately $3 billion ($3.7 billion at 30 June 2013).
• May 2012 - a UK insurance company (in partnership with FTSE and Magellan) launched our Core Infrastructure strategy. FUM as at 30 June 2013 is $986 million.
• August 2013 - UCITS. The Central Bank of Ireland authorised MFG Investment Fund plc for Magellan to act as promoter and investment manager.Fund plc for Magellan to act as promoter and investment manager.
MFG Global Fund will be launched shortly and we anticipate solid client interest.
16
For
per
sona
l use
onl
y

Fee Summary
Base Fee pa Performance Fee
Magellan Global Fund 1.35% Yes
Magellan Global Fund (Hedged) 1.35% Yes
Magellan Infrastructure Fund 1.06% Yes
Magellan Infrastructure Fund (Unhedged) 1.06% Yes
Magellan Core Infrastructure Fund 0.60% No
Magellan High Conviction Fund 1.50% Yes
Frontegra MFG Global Equity Fund1 0.80% No
Frontegra MFG Infrastructure Fund1 0.70% NoFrontegra MFG Infrastructure Fund1 0.70% No
MFG Global Fund (UCITS) 0.80% No
Global Equities institutional fee scale1
First $US 100m 0.70%
Next $US 100m 0.50%
Next $US 200m 0.40%
17
1 Pursuant to the agreement, Frontier Partners is entitled to receive 25% of net management fees from Frontegra MFG Funds and 20% of net management fees from institutional mandates with clients in North America.F
or p
erso
nal u
se o
nly

Principal Investments at 30 June 2013
Investment $ million
Cash1 24.3
Fixed Term Deposits 9.7
Magellan Unlisted Funds 73.1
Listed shares 21.6
Listed subordinated bank notes 4.3Listed subordinated bank notes 4.3
Other 2.8
Total 135.8
Deferred tax liability (7.9)
Net principal investments 127.9
Net principal investments per share (cents) 78.7
18
1 Settlements payable at 30 June 2013 of $8.8 million has been deducted from cash.For
per
sona
l use
onl
y

Offshore Banking Unit
� On 31 July 2013, Magellan Asset Management Limited was declared an Offshore
Banking Unit (OBU).
� Under the current legislation, assessable offshore banking (OB) income, net of
costs, will be subject to a concessional tax rate of 10%.
� Revenues earned from non-resident clients invested in the Magellan’s global
19
� Revenues earned from non-resident clients invested in the Magellan’s global
equities strategy meet the current definition of assessable OB income.
� As at 31 July 2013, offshore institutional global equity AUM is 45% of total AUM.
For
per
sona
l use
onl
y

CEO Remuneration (from 1 July 2013)
Hamish Douglass CEO and Managing Director
Fixed Compensation$1,250,000
Investment Restriction Payment (15 July 2017)
$500,000
Short Term IncentiveShort Term Incentive
- Incentive Up to 1 times fixed compensation
- Key Criteria (Global Equity Strategy) Ranking in Peer Group (33.3%)
Absolute Investment Performance (33.3%)
Relative Investment Performance (33.3%)
20
For
per
sona
l use
onl
y

Board update
� Chris Mackay to step down as Executive Chairman effective 30 September 2013
� Chris Mackay to become Special Adviser to MFG
� Chris to become Managing Director of Magellan Flagship Fund Limited (MFF)
� Dr Brett Cairns to become Non-Executive Chairman effective 30 September 2013
� Arrangements with MFF post 30 September
� Magellan Asset Management Limited (MAM) ceases to be investment manager but will continue to provide research and administration services.
� MAM’s management fees to be reduced by an amount equivalent to Chris Mackay’s executive remuneration.
21
For
per
sona
l use
onl
y
Important Information
This presentation has been prepared by Magellan Financial Group Limited (‘MFG’).
While the information in this presentation has been prepared in good faith and with reasonable care, norepresentation or warranty, express or implied, is made as to the accuracy, adequacy or reliability of anystatements, estimates, opinions or other information contained in the presentation.
This presentation may contain forward looking statements. These forward-looking statements have been madebased upon MFG’s expectations and beliefs concerning future developments and theirpotential effect upon MFG (and its controlled entities) and are subject to risks and uncertainty which are, in manyinstances, beyond MFG’s control. No assurance is given that future developments will be in accordance withMFG’s expectations. Actual results could differ materially from those expected by MFG.
This presentation does not constitute an offer to sell or a solicitation of an offer to purchase any security or financialThis presentation does not constitute an offer to sell or a solicitation of an offer to purchase any security or financialproduct or service. Any such offer or solicitation shall be made only pursuant to a Product Disclosure Statement,Information Memorandum, Prospectus or other offer document relating to a financial product or service.
Past performance is not necessarily indicative of future results and no person guarantees the performance of anyfinancial product or service or the amount or timing of any return from it. There can be no assurance that thefinancial product or service will achieve any targeted returns, that asset allocations will be met or that the financialproduct or service will be able to implement its investment strategy and investment approach or achieve itsinvestment objective.
The information contained in this presentation is not intended to be relied upon as advice to investors or potentialinvestors, who should consider seeking independent professional advice depending upon their specific investmentobjectives, financial situation or particular needs.
22
For
per
sona
l use
onl
y