Embed Size (px)
Citation preview

PROBIOTEA.B.N. 91 0
PR
EC LIMITED AND075 170 151
ROBIOTE
D ITS CONTROLL
EC LIMI
Fo
LED ENTITIES
ITED AN
Prelimi
or the Perio
ND ITS
inary Final
od ended 3
CONTR
Report
30 June 20
ROLLED
13
D ENTIT
IES
For
per
sona
l use
onl
y

PROBIOTEA.B.N. 91 0
AppendAs requ ProbiotPrelimiFor the
Results Current Previous Gross
Sales R Earningamortis
Earning Net proattributNet promembe
Earning
Result
Sales R
Earningamortis
Earning
Net proattribut
Net pro
Earning
Net Ta
Net Ta Dividen No dividdeclared
EC LIMITED AND075 170 151
dix 4E ired by ASX
tec Limitedinary final re year ende
for announc
Reporting Ps Correspond
Results
Revenue from
gs before intsation (EBIT
gs before int
ofit / (loss) ftable to memofit / (loss) foers
gs per share
ts from con
Revenue
gs before intsation (EBIT
gs before int
ofit from ordtable to mem
ofit for the p
gs per share
ngible assets
ngible assets
nds
dend has bed in the prior
D ITS CONTROLL
Listing Rule
d report
ed 30 June 2
cement to ma
eriod: Year eding Period:
m ordinary ac
terest, tax, dDA)
terest and ta
from ordinarymbers for the period
ntinuing ope
terest, tax, dDA)
terest and ta
inary activitimbers
eriod attribu
s per share a
s per share a
een declaredr correspond
LED ENTITIES
4.3A
2013
arket
ended 30 JunYear ended 3
ctivities
epreciation &
x (EBIT)
y activities be
d attributable
erations
epreciation &
x (EBIT)
es before tax
table to mem
as at 30 June
as at 30 June
d or paid in ing period.
ne 2013 30 June 201
&
efore tax
e to
&
x
mbers
e 2013
e 2012
regards to
2
Up
Down
Down
Down
Down
Down
Up
Down
Down
Down
Down
Down
Up
the 2013 fin
Movement
5%
18%
31%
47%
52%
52%
2%
17%
26%
31%
34%
34%
1%
nancial year.
t
% to
% to
% to
% to
% to
% to
% to
% to
% to
% to
% to
% to
% to
. No dividen
Page 1
($'000)
69,582
5,828
2,267
669
597
1.1¢
67,343
6,704
3,143
1,544
1,472
2.8¢
65.3¢
64.5¢
nds were
For
per
sona
l use
onl
y

PROBIOTEA.B.N. 91 0
Review Overview For the $67,342to mempreviousattributaprofit of
The Grolargely i
Firstretaaffemar
Secoaligimpthes
Whilst ta modelreturns past twoprofitab The Grobrandedpillars a Overview During tannounc fully
bus
restthe
These inJune 20are expeflow fro Numerobusinessdetails o
EC LIMITED AND075 170 151
w of Results
ew of results
year ended 2,884, an incbers for the s financial yeable to memf $1,249,380
oup’s statutoimpacted by
t, the Group ail climate anected. Lowergin contract
ondly, a rangnment of the
plemented to se initiatives
he result for l that the dirto shareholdo years will f
bility in the fu
oup is continud products anre set out be
ew of operatio
the year, theced in June 2
y divested itsiness assets;
tructured sev2014 financi
nitiatives res013, includingected to provm its ongoin
ous additionas units are yon these initi
D ITS CONTROLL
s
30 June 201crease of 2.0%financial yea
ear of $2,229bers for the
0.
ry net profit two issues:
has been exnd, while saleer margins haion in the Gr
ge of adjustme Group. Thimprove theand their im
the year is drectors believders. To this form the founuture.
uing to focusnd intellectuaelow.
ions
e Group cont2011. Most n
s Animal Nut; and
veral operatinial year.
ulted in a rag a loss fromvide improve
ng operations
al initiatives tet to be comiatives will be
LED ENTITIES
3, the Group% on the prear from conti9,250. At a stfinancial yea
attributable
xperiencing pes revenue have resulted roup’s consum
ments have bese adjustme
e strategic fompact for the
disappointingve will be botend, the direndation for t
s on the threal property d
inued to comnotably, the G
rition busine
ng units with
nge of adjusm discontinueements in thes in the 2014
to further strmpleted but ae provided w
p generated sevious financnuing operattatutory repoar was $596,
to members
pressure on ias been maifrom changemer health p
been made aents have re
ocus and busyear is set o
g, the Groupth more secuectors believthe Group to
ee pillars of itdevelopment
mplete initiatGroup has:
ess, including
hin the busin
stments to thed operationse Group’s ab4 financial ye
reamline the are continuinwhen the Gro
sales revenucial year. Thtions was $1orted level, t869, compar
s for the finan
its operating ntained, mares in the Groproducts.
as a result ofesulted from iness operatiout below.
continues toure and betteve that the in
achieve imp
ts business: . Details on d
ives identifie
g the sale of a
ess, with a r
he financial sts of $875,617ility to gener
ear.
business andg to be revie
oup is in a po
e from contihe Group’s ne,472,486, co
the Group’s nred to the pr
ncial year of
margins in trgins have beoup’s sales m
f the ongoingnumerous inions of the G
o transition iter able to deitiatives unde
proved levels
Contract madevelopment
d in the stra
all brands an
educed cost
tatements fo7. Importanrate attractiv
d eliminate uewed and proosition to do
nuing operatet profit attriompared to tnet profit revious finan
$596,869 w
the current seen negative
mix together w
g strategic renitiatives beinGroup. More
ts business teliver improviertaken overof growth a
nufacturing, ts of each of
ategic review
nd associated
base effectiv
or the year ently, these inive earnings a
underperformogressed. Fuso.
Page 2
tions of ibutable the
cial year
as
subdued ely with
e-ng detail on
towards ing r the nd
these
d
ve for
nded 30 itiatives and cash
ming urther
For
per
sona
l use
onl
y

PROBIOTEA.B.N. 91 0
Segmen
Pharma Sales in pharmasport nuslight de The conthe salesports nof the G Contrac The Grogreater manufacEncourahas a grongoingpharma The inteimplemeinvestedare expe The tran(followinincrease Intellect The Grdevelop During trelease togethethat thishareho
1 For the the prior ysubsequen
EC LIMITED AND075 170 151
nt Results
aceuticals and
the Group’sceutical rangutrition produecline on the
ntinuing subdes of the Gronutrition prodGroup’s Bioso
ct Manufactur
oup’s contraclevel of focucturing was agingly, the Growing orderg growth. Thceutical com
egration of nentation costd in additionaected to deliv
nsfer of the Bng the signine in the reve
ctual Property
roup continupment portfol
the year the in future yer with 16 phis pipeline oolders.
2013 financial yyear, total salesntly been re-allo
D ITS CONTROLL
d consumer h
pharmaceutges (includingucts performe previous ye
dued economup’s productducts all grewource brand t
uring
ct manufactuus and resour$23,729,543Group is contr book for thehe majority o
mpanies.
ew contract ts. In order tal plant, warver material
Biosource brng of a long tnue associat
y Developme
ues to proglio and its AD
Group contiars. As at 30harmaceuticaof products
year, total saless of $1,525,336 ocated to the co
LED ENTITIES
health
tical and cong Gold Crossed consisten
ear’s sales of
mic conditionss. Pleasinglyw over the prto the contra
ring segmenrces allocated
3, an increasetinuing to exe 2014 finanof contract m
manufacturito support a ehousing andlong term be
and from theterm manufaed with this
ent
gress its intDP Protein Pl
nued to rese0 June 2013al products iwill help to
for Biosource ohad been recor
ontract manufac
nsumer healts, David Craigntly during th
$35,706,162
s in the domy, sales of therior period, wact manufact
nt experienced to this sege of 35.5% oxperience stroncial year andmanufacturing
ng customermaterial incrd distributionenefits and e
e pharmaceuacturing and brand1.
tellectual prolant (see belo
earch and de3, the Group in various sto secure ad
of $2,634,156 wrded in the pharcturing segment
h segment, cg, Lomotil anhe year. Sale2.
estic retail ee Group’s phwith this growturing segme
ed a materialgment. Salesover the prioong demandd expects thig activity was
rs during therease in the n infrastructuearnings to t
utical and concollaboration
operty portfow).
evelop a rangcurrently ha
tages of devdditional lon
were recorded inrmaceutical andt for comparativ
comprising ond Vermox), s revenue wa
nvironment carmaceuticawth being ofent during the
increase in s revenue fror correspond in contract s segment tos on behalf o
year requirelevel of businure. Howevehe Group.
nsumer healtn agreement
folio, most
ge of pharmaas three clinivelopment. Tng term ear
n the contract m consumer heal
ve purposes).
our traditionaweight loss a
was $35,445,1
continued tols, weight loffset by the te year (see b
demand, witom contract ding period. manufacturino experienceof major
ed significantness, the Groer, these init
th segment t), has result
notably its
aceutical prodical trials in The directorsrnings and v
manufacturing selth segment (wh
Page 3
al and 162, a
o impact ss and transfer below).
th a
ng and e
t oup ial costs
ted in an
product
ducts for progress s believe value to
egment. In hich have
For
per
sona
l use
onl
y

PROBIOTEA.B.N. 91 0
Additive Sales in $3,275,brands a Export a The Grobusinessto $7,13improveof loss mand Grehas nowinitial or ADP Pro Last yeaprotein whey de(ADP). with com The ADPbased hImmunocontinuistrengthprotein Cash flo For theoperatinliabilitiesdate in additionbelow foGroup tachievaexpecte
Audit S This repdispute,
EC LIMITED AND075 170 151
es and Nutrit
the nutrition289. This deand associat
activities
oup’s export ses in the Un31,966, but red level of prmaking operaeat Britain pow begun to drders receive
oject update
ar the Group fractionationerived pharmThis relocati
mmercial pro
P Plant will phigh purity Imoglobulins inting to researhening of demfraction.
ow and geari
e year endedng activities, s net of casthe previou
nal debt facilor further deto more consble as major
ed to improve
the businesflows; and
ADP comme
Status
port is based, emphasis o
D ITS CONTROLL
tion
nal products ecline was prted business
activities connited Kingdorecorded a profitability waations and acound has conevelop a con
ed and sales
entered inton plant (ADP maceutical grion is now cooduction to b
produce the dmmunoglobuto the infantrch and devemand for Lac
ing
d 30 June an increase
sh, as at 30 us year. Thelities utilised etails). It is aservative levr planned cape due to:
ss improvem
encing comm
d on accounof matter or q
LED ENTITIES
segment decrimarily a resassets, as ou
ntinue to focm and Irelanrofit of $202as largely thectivities. The
ntinued to imntract manufenquiries gro
o an agreemePlant) to Jerade dairy proomplete withbegin immedi
dairy proteinlins. The Grnutrition, hu
elop a range ctoferrin has
2013, the Gof 53.6% ovJune 2013 w
e increased in the upgr
a priority of vels during thpital expendi
ment initiative
mercial operat
nts which haqualification.
clined 27.0%sult of the diutlined earlie
us primarily nd. Export sa2,711 as oppoe result of the strength of
mpact upon thfacturing servowing steadi
ent with Unitrvois in Southoteins throug
h final commiiately upon c
fraction Lacroup proposeuman nutritioof exciting p
s seen a sign
Group generver the priorwas $26,094level of deb
rade and re-the directorshe 2014 finaiture program
es referred
tions and co
ave been au
% on the priovestment of er.
on its manufales revenue osed to $5,5
he rationalisathe Australia
he profitabilitvice from its ly, albeit off
ted Dairy Powh Australia, agh its Austraissioning triacommissionin
ctoferrin alones to sell bothon and pharm
pharmaceuticificant rise in
rated $5,441r correspondi4,605, an incbt level in testablishmens to materialancial year. Tms are now l
to in this re
ntributing to
udited. The a
or correspondthe Group’s
facturing andfell 18.6% fr91 in the priotion and/or can dollar agaty of this segIreland proda low base.
wer Pty Ltd (and recommelian Dairy Prols currently n
ng.
ng with the wh Lactoferrinmaceuticals mcal applicationn the market
1,947 in casing period. Tcrease of 10the Group isnt of the ADly reduce theThe directorsargely comp
eport increa
cash flow.
accounts are
ding period tanimal nutri
d distributionfrom the prioor year. Thiclosure of a ainst both thegment. The Gduction facto
(UDP) to reloence producrotein subsidnearing com
world’s only dn and markets, as wns. The conprice for thi
sh flow provTotal interest0.4% from ts largely a DP Protein Ple level of ders believe thaplete and cas
asing operati
e not subjec
Page 4
to tion
n or year is number e Euro Group ory, with
ocate its tion of iary pletion
dairy
well as tinued s
vided by t bearing he same result of lant (see bt in the at this is sh flow is
ing cash
ct to any
For
per
sona
l use
onl
y

PROBIOTEA.B.N. 91 0
About P Probioteand oveThe comdomestiand on Further
EC LIMITED AND075 170 151
Probiotec
ec Limited is er-the-countempany ownically and intbehalf of oth
details abou
D ITS CONTROLL
a brand owner (OTC) phs four manternationally.hers, includin
ut Probiotec a
LED ENTITIES
ner, manufacharmaceuticaufacturing f. Products ang major inte
are available
cturer, markeals, complemfacilities in Aare manufacternational ph
at www.pro
eter and distmentary medAustralia antured by Pro
harmaceutica
obiotec.com.a
tributor of a icines and sd distributes
obiotec for bol companies.
au.
range of prespecialty inges its producoth its own .
Page 5
escription redients. cts both products
For
per
sona
l use
onl
y

PROBIOTEC LIMITED AND ITS CONTROLLED ENTITIES
A.C.N. 075 170 151
FINANCIAL REPORT
FOR THE YEAR ENDED 30 JUNE 2013
For
per
sona
l use
onl
y

INDEX TO FINANCIAL REPORT FOR THE YEAR ENDED 30 JUNE 2013
Section Page DIRECTORS' REPORT……………………………………………………………………………………………… 1 AUDITOR'S INDEPENDENCE DECLARATION……………………………………………………………… 17 STATEMENT OF COMPREHENSIVE INCOME……………….……………………………………………… 18 STATEMENT OF FINANCIAL POSITION ..………………………………………………………………….. 19 STATEMENT ON CHANGES IN EQUITY……………………………………………………………………… 20 STATEMENT OF CASH FLOWS………………………………………………………………………………… 21 NOTES TO THE FINANCIAL STATEMENTS………………………………………………………………… 22 DIRECTORS’ DECLARATION……………………………………………………………………………………. 53 AUDITOR’S REPORT TO THE MEMBERS…………………………………………………………………… 54
For
per
sona
l use
onl
y
Page 1
DIRECTORS’ REPORT The directors submit the financial report of Probiotec Limited and its controlled entities (“the Group”) for the financial year ended 30 June 2013. Directors The names of the directors in office at any time during or since the end of the year are: Maurice Van Ryn Non-Executive Chairman Charles Wayne Stringer Wesley Stringer
Executive Director Executive Director
Graham Harry Buckeridge Non-Executive Director Richard David Kuo Robert Maxwell Johnston Robin Tedder
Non-Executive Director Non-Executive Director Non-Executive Director (Appointed 1 October 2012)
Directors have been in office to the date of this report unless otherwise stated. Company Secretary The name of the company secretary in office at any time during or since the end of the year was: Jared Stringer
The company secretary has been in office to the date of this report unless otherwise stated. Principal Activities The Group’s principal activities in the course of the financial year were the development, manufacture and sale of pharmaceuticals, foods and nutraceutical products in Australian and international markets. Operating Results The consolidated profit of the Group attributable to the shareholders for the financial year was $596,869 (2012: $1,249,380). Dividends No dividend has been declared or paid in regards to the financial year ended 30 June 2013 (2012: $nil). Operating and financial review Overview of results For the year ended 30 June 2013, the Group generated sales revenue from continuing operations of $67,342,884, an increase of 2.0% on the previous financial year. The Group’s net profit attributable to members for the financial year from continuing operations was $1,472,486, compared to the previous financial year of $2,229,250. At a statutory reported level, the Group’s net profit attributable to members for the financial year was $596,869, compared to the previous financial year profit of $1,249,380.
The Group’s statutory net profit attributable to members for the financial year of $596,869 was largely impacted by two issues:
For
per
sona
l use
onl
y

Page 2
First, the Group has been experiencing pressure on its operating margins in the current subdued retail climate and, while sales revenue has been maintained, margins have been negatively affected. Lower margins have resulted from changes in the Group’s sales mix together with margin contraction in the Group’s consumer health products.
Secondly, a range of adjustments have been made as a result of the ongoing strategic re-alignment of the Group. These adjustments have resulted from numerous initiatives being implemented to improve the strategic focus and business operations of the Group. More detail on these initiatives and their impact for the year is set out below.
Whilst the result for the year is disappointing, the Group continues to transition its business towards a model that the directors believe will be both more secure and better able to deliver improving returns to shareholders. To this end, the directors believe that the initiatives undertaken over the past two years will form the foundation for the Group to achieve improved levels of growth and profitability in the future. The Group is continuing to focus on the three pillars of its business: Contract manufacturing, branded products and intellectual property development. Details on developments of each of these pillars are set out below. Overview of operations During the year, the Group continued to complete initiatives identified in the strategic review announced in June 2011. Most notably, the Group has: fully divested its Animal Nutrition business, including the sale of all brands and associated business assets;
and
restructured several operating units within the business, with a reduced cost base effective for the 2014 financial year.
These initiatives resulted in a range of adjustments to the financial statements for the year ended 30 June 2013, including a loss from discontinued operations of $875,617. Importantly, these initiatives are expected to provide improvements in the Group’s ability to generate attractive earnings and cash flow from its ongoing operations in the 2014 financial year. Numerous additional initiatives to further streamline the business and eliminate underperforming business units are yet to be completed but are continuing to be reviewed and progressed. Further details on these initiatives will be provided when the Group is in a position to do so. Segment Results
Pharmaceuticals and consumer health Sales in the Group’s pharmaceutical and consumer health segment, comprising our traditional pharmaceutical ranges (including Gold Cross, David Craig, Lomotil and Vermox), weight loss and sport nutrition products performed consistently during the year. Sales revenue was $35,445,162, a slight decline on the previous year’s sales of $35,706,162. The continuing subdued economic conditions in the domestic retail environment continued to impact the sales of the Group’s products. Pleasingly, sales of the Group’s pharmaceuticals, weight loss and sports nutrition products all grew over the prior period, with this growth being offset by the transfer of the Group’s Biosource brand to the contract manufacturing segment during the year (see below).
For
per
sona
l use
onl
y

Page 3
Contract Manufacturing The Group’s contract manufacturing segment experienced a material increase in demand, with a greater level of focus and resources allocated to this segment. Sales revenue from contract manufacturing was $23,729,543, an increase of 35.5% over the prior corresponding period. Encouragingly, the Group is continuing to experience strong demand in contract manufacturing and has a growing order book for the 2014 financial year and expects this segment to experience ongoing growth. The majority of contract manufacturing activity was on behalf of major pharmaceutical companies. The integration of new contract manufacturing customers during the year required significant implementation costs. In order to support a material increase in the level of business, the Group invested in additional plant, warehousing and distribution infrastructure. However, these initial costs are expected to deliver material long term benefits and earnings to the Group. The transfer of the Biosource brand from the pharmaceutical and consumer health segment (following the signing of a long term manufacturing and collaboration agreement), has resulted in an increase in the revenue associated with this brand1. Intellectual Property Development The Group continues to progress its intellectual property portfolio, most notably its product development portfolio and its ADP Protein Plant (see below). During the year the Group continued to research and develop a range of pharmaceutical products for release in future years. As at 30 June 2013, the Group currently has three clinical trials in progress together with 16 pharmaceutical products in various stages of development. The directors believe that this pipeline of products will help to secure additional long term earnings and value to shareholders. Additives and Nutrition Sales in the nutritional products segment declined 27.0% on the prior corresponding period to $3,275,289. This decline was primarily a result of the divestment of the Group’s animal nutrition brands and associated business assets, as outlined earlier. Export activities The Group’s export activities continue to focus primarily on its manufacturing and distribution businesses in the United Kingdom and Ireland. Export sales revenue fell 18.6% from the prior year to $7,131,966, but recorded a profit of $202,711 as opposed to $5,591 in the prior year. This improved level of profitability was largely the result of the rationalisation and/or closure of a number of loss making operations and activities. The strength of the Australian dollar against both the Euro and Great Britain pound has continued to impact upon the profitability of this segment. The Group has now begun to develop a contract manufacturing service from its Ireland production factory, with initial orders received and sales enquiries growing steadily, albeit off a low base. 1 For the 2013 financial year, total sales for Biosource of $2,634,156 were recorded in the contract manufacturing segment. In the prior year, total sales of $1,525,336 had been recorded in the pharmaceutical and consumer health segment (which have subsequently been re-allocated to the contract manufacturing segment for comparative purposes).
For
per
sona
l use
onl
y

Page 4
ADP Project update Last year the Group entered into an agreement with United Dairy Power Pty Ltd (UDP) to relocate its protein fractionation plant (ADP Plant) to Jervois in South Australia, and recommence production of whey derived pharmaceutical grade dairy proteins through its Australian Dairy Protein subsidiary (ADP). This relocation is now complete with final commissioning trials currently nearing completion with commercial production to begin immediately upon commissioning. The ADP Plant will produce the dairy protein fraction Lactoferrin along with the world’s only dairy based high purity Immunoglobulins. The Group proposes to sell both Lactoferrin and Immunoglobulins into the infant nutrition, human nutrition and pharmaceuticals markets, as well as continuing to research and develop a range of exciting pharmaceutical applications. The continued strengthening of demand for Lactoferrin has seen a significant rise in the market price for this protein fraction. Cash flow and gearing For the year ended 30 June 2013, the Group generated $5,441,947 in cash flow provided by operating activities, an increase of 53.6% over the prior corresponding period. Total interest bearing liabilities net of cash, as at 30 June 2013 was $26,094,605, an increase of 10.4% from the same date in the previous year. The increased level of debt level in the Group is largely a result of additional debt facilities utilised in the upgrade and re-establishment of the ADP Protein Plant (see below for further details). It is a priority of the directors to materially reduce the level of debt in the Group to more conservative levels during the 2014 financial year. The directors believe that this is achievable as major planned capital expenditure programs are now largely complete and cash flow is expected to improve due to:
the business improvement initiatives referred to in this report increasing operating cash flows; and
ADP commencing commercial operations and contributing to cash flow.
Significant Changes in State of Affairs Significant changes in the state of affairs of the Group comprised the continued implementation of the Group’s strategic review and associated activities as outlined in the review of operations and expanded upon in note 6 of the financial report for the year ended 30 June 2013. There was no other significant change in the state of affairs of the Group other than that referred to in the financial statements or notes thereto and elsewhere in the financial report of the company and its controlled entities for the year ended 30 June 2013. Significant After Reporting Date Events There has not been any matter or circumstance, other than that referred to in the financial statements or notes thereto, that has arisen since the end of the financial year, that has significantly affected, or may significantly affect, the operations of the Group, the results of those operations, or the state of affairs of the Group in future financial years. Future Developments The Group will continue to operate its business consistent with its stated business strategy of growing both its pharmaceutical and nutritional/nutraceutical business segments. The Board will continue to monitor the progress of the business improvement initiatives and the intended improvement in the Group’s operating and financial performance. Should further decisions and actions become necessary, then these will be made and within the framework of growing both profitability and cash flow of the Group. Environmental Issues The Group monitors its environmental legal obligations and has its own self imposed policies. We believe that the Group complies with all aspects of the environmental laws.
For
per
sona
l use
onl
y

Page 5
Occupational Health and Safety The Group’s Occupational Health and Safety Committee meet monthly and monitors the business by conducting regular audits of the premises. Any safety matters raised either by staff, the audits or from an investigation of any workers’ compensation claims are reviewed and, where appropriate, changes made to operating procedures. Staff are encouraged to make safety suggestions to their departmental representatives. All committee members are given the necessary training for the position. Directors’ Benefits No director has received or become entitled to receive a benefit other than directors’ remuneration. Full details of the level of remuneration received by Directors can be found in the Remuneration Report on page 7 of the Directors Report. Meetings of Directors Probiotec Limited became a public company on 17th February 2006 and listed on the Australian Stock Exchange on the 14th November 2006. Directors hold meetings every month. The board also comprises the Audit and Risk Management and Remuneration and Nominations Sub-Committees. The number of meetings of the company's board of directors held during the year ended 30 June 2013, and the numbers of meetings attended by each director were:
Board of Directors
Meetings
Audit & Risk Management
Committee meetings
Remuneration & Nominations
Committee meetings
Director No. Held*
No. Attended
No. Held**
No. Attended
No. Held**
No. Attended
Maurice Van Ryn 12 11 2 2 - - Charles Wayne Stringer 12 12 - - 2 2
Graham Harry Buckeridge 12 11 2 2 2 1
Richard David Kuo 12 12 2 2 - - Robin Tedder 9 8 - - - -
Wesley Stringer 12 12 - - - -Robert Maxwell Johnston 12 12 - - 2 2* Number of board meetings held while director eligible to attend. ** Number of meetings for members of respective board or committee only. Information on Directors and Officers Maurice Van Ryn Role - Chairman (Non-executive)Qualifications - Bachelor of Business (RMIT) Experience - Appointed Chairman in July 2006. Previously held the position of CEO of
Bega Cheese and is currently Bega Cheese's Manager Consumer Products - International. Maurice has 33 years experience in direct management of food companies in the Australian manufacturing sector.
Special Responsibilities - Member of Audit and Risk Committee. Other Directorships -
Non-executive Director of Medical Development International Limited (since October 2003).
Graham Harry Buckeridge Role - Non-Executive DirectorQualifications - Dip Bus, CPA, FFIN Experience - Co-founder and executive director of BG Capital Corp Ltd (BGC) a
relationship based firm providing corporate advisory and investment
For
per
sona
l use
onl
y

Page 6
banking services. Previously joint founder and Managing Director of Burdett Buckeridge and Young, a member corporation of ASX. Graham has extensive experience in all aspects of international and domestic financial markets.
Special Responsibilities - Member of Remuneration and Nominations Committee. Other Directorships - Executive Director of BG Capital Corp Limited
Executive Chairman of Abacus Film Fund Richard David Kuo Role - Non-Executive DirectorQualifications - B.Com, LLB, FAICD Experience - Holds Commerce and Law degrees with post graduate qualifications in
applied finance and investment. Brings with him 27 years experience in law, investment banking and corporate strategy. Currently manages Pier Capital, a privately owned investment banking firm which provides corporate and financial advice to corporations, investors and government and has extensive experience in mergers and acquisitions, capital markets and strategic planning.
Special Responsibilities - Responsibilities include Chairman of the Audit and Risk Management Committee.
Other Directorships - Non-Executive Director of Australian Arts Events Foundation
Robert Maxwell Johnston Role - Non-Executive Director Qualifications - FCDA, MAICD Experience - A former senior executive with Johnson & Johnson, the world’s largest
Medical, Pharmaceutical and Consumer Healthcare company. Mr. Johnston was president and CEO of Johnson & Johnson Pacific, while also concurrently leading several Asia Pacific Franchise and Functional working group. Brings extensive overseas experience during his career in leading businesses in both Western and Central-Eastern Europe and Africa. Prior to joining Johnston & Johnson, Max’s career also included senior roles with Diageo and Unilever.
Special Responsibilities - Chairman of Remuneration and Nominations Committee. Other Directorships - Non-Executive Director of Medical Development International Limited Charles Wayne Stringer Role - Chief Executive Officer (Executive Director)Qualifications - Dip. Bus, ACA Experience - CEO of Probiotec since it was founded in 1997. Overseen the development
of a series of joint ventures and commercial opportunities and acquisition of Pharmaction in the 2004 financial year and the Biotech Milton Pharmaceutical company in 2005. Wayne also spent several years as a CEO and director of companies involved in manufacturing, retailing, finance, mining and waste management.
Special Responsibilities - Responsibilities include strategic management, remuneration and operational oversight.
Other Directorships - Nil Robin Tedder Role - Non-Executive Director Qualifications - FFIN, MW Experience - Robin has over 35 years experience in business investment and finance. He
is the Chairman of Vintage Capital a private investment company and a director of several public and private companies active in property, retail and investment. Robin was a member of the ASX for over a decade and
For
per
sona
l use
onl
y

Page 7
served as an executive director of two investment banks active in Australia and overseas. He is the Australian Ambassador for Singularity University (founders include Genentech and Google) of Mountain View California, which runs advanced technology healthcare education programs. Robin is a Fellow of the Financial Services Institute of Australia.
Special Responsibilities - Nil Other Directorships - Blackwall Property Funds Ltd
Pelorus Private Equity Kirela Pty Ltd Italtile Australia Pty Ltd
Jared Stringer Role - Company Secretary Qualifications - B.Comm (Accounting, Finance), BIT, CPAExperience - Began employment with Probiotec in 2002 and accepted role of Financial
Accountant in May 2005 before being appointed as Chief Financial Officer in 2011.
Special Responsibilities - None Other Directorships - Nil Wesley Stringer Role - Chief Operation OfficerQualifications - B.Comm (Accounting, Finance), LLB (hons), CPA Experience - Prior to joining Probiotec, Wesley was employed by KPMG in Taxation and
Finance. He has also worked internationally for Deutsche Bank and BNP Paribas Investment Bank in London.
Special Responsibilities - None Other Directorships - Nil Insurance of Officers During the financial year the company insured its directors and officers against liabilities for all costs and expenses incurred by them in defending any legal proceedings arising out of their conduct while acting in the capacity as directors and officers of the company, other than conduct involving a willful breach of duty in relation to the company. The total premium paid was $46,306. REMUNERATION REPORT (Audited) This report is prepared in accordance with section 300A of the Corporations Act 2001 for the Group for the financial year ended 30 June 2013. This report is audited. 1. REMUNERATION 1.1 Remuneration & Nominations Committee The primary function of the Board Remuneration and Nominations Committee (“Committee”) is to assist the Board of Directors (“Board”) in fulfilling its oversight responsibility to shareholders by ensuring that:
the Board comprises individuals best able to discharge the responsibilities of directors having regard to the law and the highest standards of governance; and
the Group has coherent remuneration policies and practices that fairly and responsibly reward executives having regard to performance, the law and the highest standards of governance.
The Committee’s purpose in relation to remuneration is to:
review and approve executive remuneration policy;
For
per
sona
l use
onl
y

Page 8
make recommendations to the Board in relation to the remuneration of the Chief Executive Officer and Non-executive Directors;
review and make recommendations to the Board on corporate goals and objectives relevant to the remuneration of the Chief Executive Officer, and the performance of the Chief Executive Officer in light of these objectives;
approve remuneration packages for Probiotec’s executives; review and approve all equity based plans; approve all merit recognition expenditure; and oversee general remuneration practices.
The Committee will primarily fulfill these responsibilities by carrying out the activities outlined in its Charter. The Committee membership and the Chairman of the Committee will be as determined from time to time by the Board. Each of the members will be independent directors and free from any business or other relationship that, in the opinion of the Board, would materially interfere with the exercise of their independent judgement as a member of the Committee. New Committee members will receive induction training from the Chairman of the Committee, the Chief Financial Officer’s and GM – Quality’s teams and the Company Secretary. Committee members receive continuous training. Members of Remuneration and Nominations Committee Position Appointed
Robert Maxwell Johnston Chairman 29 July 2010 Graham Buckeridge Member 28 July 2006 1.2 Remuneration Policy – Non-Executive Directors The level of remuneration for the company’s non-executive directors is set to reflect the scope of the director’s responsibilities, the size of the company’s operations and the workload demanded. Probiotec believes that the current remuneration packages for non-executive directors are appropriate having considered the factors above. The current annualised total remuneration for the company’s non-executive directors is $274,000. The Nomination & Remuneration Committee reviews non-executive remuneration annually and makes recommendations to the Board. The Committee considers current market rates of remuneration for similar sized companies and obtains advice from independent professional firms if required. Shareholders will be periodically asked to approve increases in the fee level of non-executive directors if the size, scope, complexity or demands made on the directors increases. Non-executive directors do not receive any performance related remuneration and are not entitled to receive performance shares, rights or options. Remuneration levels for non-executive directors for the 2013 financial year are set out on page 11 of this report. 1.3 Remuneration Policy – Executive Directors and Key Management Personnel The Remuneration and Nominations Committee has structured the Group’s executive remuneration policies to ensure: the policy motivates executives to pursue the long term growth and success of Probiotec within an
appropriate control framework; the policy demonstrates a clear relationship between individual performance and remuneration; and the policy involves an appropriate balance between fixed and variable remuneration, reflecting the short
and long term performance objectives appropriate to Probiotec’s circumstances and goals.
For
per
sona
l use
onl
y

Page 9
The Group’s remuneration framework for executive directors and key management personnel comprises fixed annual remuneration, short-term incentives and long-term incentives. The Group structures remuneration packages to balance between base incomes and “at risk” incomes to ensure that key personnel are retained, whilst still providing strong incentives to maximise the potential long-term growth of the Group. The Group has no formal policy in place for limiting the risk to key management personnel in relation to their remuneration. Short-term Incentives Executive directors and key management are eligible to receive short-term incentive payments, in the form of cash bonuses, based on the achievement of set Key Performance Indicators (KPIs). KPIs are based on financial measures targeted at maximising Group performance and returns to shareholders. No specific performance conditions were set for the 2013 financial year and no short-term incentives were paid or payable to key management personnel. Long-term Incentives The Group provides long-term incentives to key management personnel to reward sustained performance by the organisation as a whole. Long-term incentives are in the form of options over Probiotec Limited shares issued under the company’s Exempt Share and Option Plan, which was adopted by a resolution of members on 23 November 2011, or by the issue of shares under the company’s Employee Share Plan, which was also adopted by members on 23 November 2011. The issue of shares and/or options is based on a review of the contributions and value of management personnel undertaken by the Nomination and Remuneration Committee. At the date of this report, Wayne Stringer and Wesley Stringer are the only executive directors of Probiotec Limited. Both are paid a fixed annual remuneration. Along with his fixed annual remuneration, Mr. Wayne Stringer is also eligible to receive equity-based compensation, in the form of share options, based on the achievement of set milestones stipulated in his contract of employment (see page 13 for details). Mr. Wesley Stringer had previously received shares under the Probiotec Limited Employee Share Plan prior to being appointed as a director of the company and was also granted options during the 2013 financial year (see page 13 for details). Termination Arrangements All key management personnel are employed subject to employment contracts with indefinite durations. These employment contracts specify notice period of between one and three months (unless a greater period is required by law). The Group may choose to make a payment in lieu of the notice period. 1.4 Remuneration Policy - Employees All salaried positions are evaluated based on the size of the role, the level of accountability and experience required, amongst other factors. Economic and market factors are also taken into consideration when evaluating the remuneration level for a specified role. 2. LINKING REMUNERATION TO PROBIOTEC’S PERFORMANCE Probiotec has structured its remuneration policies to increase goal congruence between shareholders, directors and executives. The company believes that this will have a positive effect on shareholder wealth. The company is committed to innovation and growth, whilst continuing to focus on maximising profitability and long-term shareholder value. There is no formal policy linking remuneration policy and company performance.
For
per
sona
l use
onl
y
Page 10
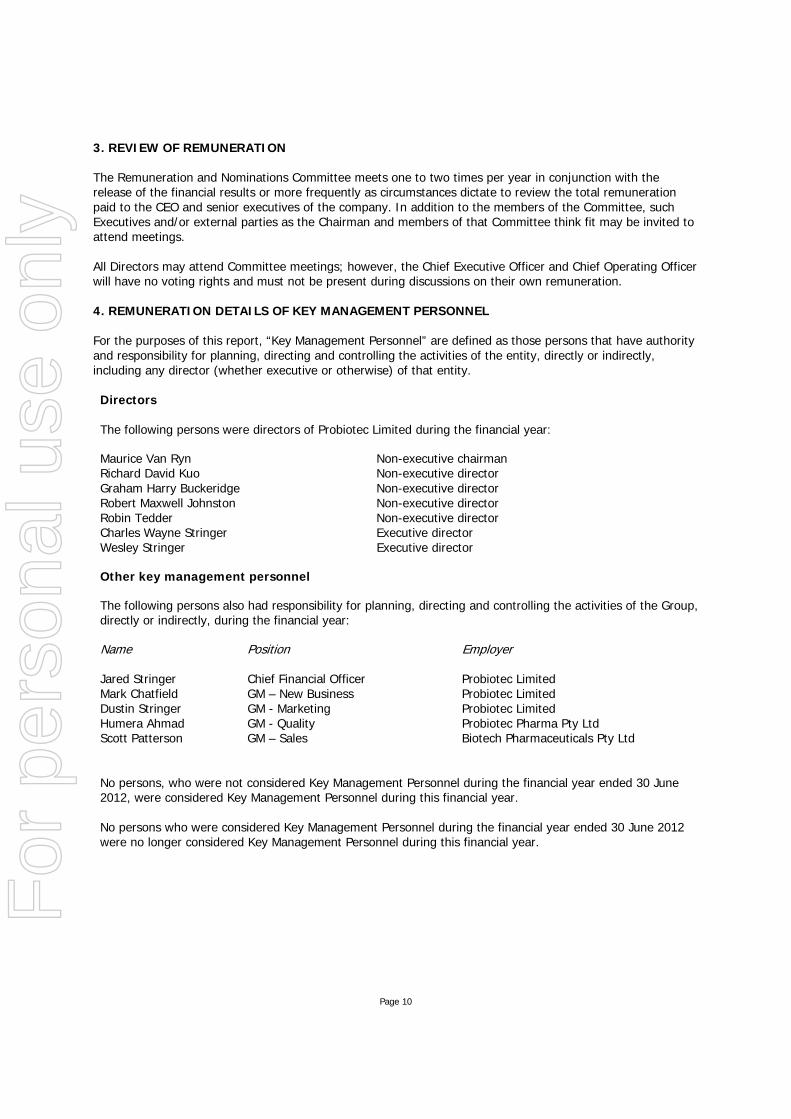
3. REVIEW OF REMUNERATION The Remuneration and Nominations Committee meets one to two times per year in conjunction with the release of the financial results or more frequently as circumstances dictate to review the total remuneration paid to the CEO and senior executives of the company. In addition to the members of the Committee, such Executives and/or external parties as the Chairman and members of that Committee think fit may be invited to attend meetings. All Directors may attend Committee meetings; however, the Chief Executive Officer and Chief Operating Officer will have no voting rights and must not be present during discussions on their own remuneration. 4. REMUNERATION DETAILS OF KEY MANAGEMENT PERSONNEL For the purposes of this report, “Key Management Personnel” are defined as those persons that have authority and responsibility for planning, directing and controlling the activities of the entity, directly or indirectly, including any director (whether executive or otherwise) of that entity. Directors The following persons were directors of Probiotec Limited during the financial year: Maurice Van Ryn Non-executive chairman Richard David Kuo Non-executive director Graham Harry Buckeridge Non-executive director Robert Maxwell Johnston Non-executive director Robin Tedder Non-executive director Charles Wayne Stringer Executive director Wesley Stringer Executive director
Other key management personnel The following persons also had responsibility for planning, directing and controlling the activities of the Group, directly or indirectly, during the financial year:
Name Position Employer Jared Stringer Chief Financial Officer Probiotec Limited Mark Chatfield GM – New Business Probiotec Limited Dustin Stringer GM - Marketing Probiotec Limited Humera Ahmad GM - Quality Probiotec Pharma Pty Ltd Scott Patterson GM – Sales Biotech Pharmaceuticals Pty Ltd No persons, who were not considered Key Management Personnel during the financial year ended 30 June 2012, were considered Key Management Personnel during this financial year. No persons who were considered Key Management Personnel during the financial year ended 30 June 2012 were no longer considered Key Management Personnel during this financial year.
For
per
sona
l use
onl
y

Page 11
The Directors and identified Key Management Personnel received the following amount of compensation for their services as Directors and executives of the company and the group during the year: 2013
Post Employment Equity-Based
Short-Term Benefits Benefits Benefits
Salary,
Proportion of
Fees & Short Term Non-Cash Long Service Superannuation Remuneration that
is
Commissions Incentives Benefits Leave2 Contribution Options Total performance based
(options)
Position $ $ $ $ $ $ $
%
Directors & Secretaries
Maurice Van Ryn Chairman 68,807 - - - 6,193 - 75,000 -
Charles Wayne Stringer CEO / Managing Director 558,104 - - 3,982 50,229 29,006 641,321 4.5
Wesley Stringer COO / Executive Director 285,891 - 14,334 5,944 15,775 8,050 329,994 2.4
Richard David Kuo Non-Executive Director 55,000 - - - - - 55,000 -
Graham Harry Buckeridge Non-Executive Director 24,000 - - - 24,000 - 48,000 -
Robert Maxwell Johnston Non-Executive Director 44,037 - - - 3,983 - 48,000 -
Robin Tedder3 Non-Executive Director 36,000 - - - - - 36,000 -
Jared Stringer CFO / Company Secretary 209,480 - - 4,666 18,853 9,200 242,199 3.8
1,281,319 - 14,334 14,592 119,013 46,256 1,475,514 3.1
Other Key Management Personnel
Dustin Stringer GM - Marketing 190,738 - 14,015 3,639 17,124 9,200 225,516 4.1
Humera Ahmad GM - Quality 171,950 - - 15,913 23,275 5,750 211,138 2.7
Mark Chatfield GM – New Business 181,058 - - 3,330 25,784 5,750 210,172 2.7
Scott Patterson GM - Sales 187,952 - - 290 16,514 5,750 204,756 2.8
731,698 - 14,015 23,172 82,697 26,450 878,032 3.0
2 All Long Service Leave amounts relate to accrued balances. No Long Service Leave was taken or paid out during the year 3 Robin Tedder was appointed on 1 October 2012
For
per
sona
l use
onl
y

Page 12
2012 Post Employment Equity-Based
Short-Term Benefits Benefits Benefits
Salary,
Proportion of
Fees & Short Term Non-Cash Long Service Superannuation Remuneration that
is
Commissions Incentives Benefits Leave4 Contribution Options Total performance based
(options)
Position $ $ $ $ $ $ $
%
Directors & Secretaries
Maurice Van Ryn Chairman 68,807 - - - 6,193 - 75,000 -
Charles Wayne Stringer CEO / Managing Director 665,137 - - 21,895 59,863 - 746,895 -
Wesley Stringer COO / Executive Director 275,987 - 14,334 3,104 15,679 - 309,104 -
Richard David Kuo Non-Executive Director 55,000 - - - - - 55,000 -
Graham Harry Buckeridge Non-Executive Director - - - - 48,000 - 48,000 -
Robert Maxwell Johnston Non-Executive Director 44,036 - - - 3,964 - 48,000 -
Jared Stringer CFO / Company Secretary 186,544 - - 2,543 16,789 - 205,876 -
1,295,511 - 14,334 27,542 150,487 - 1,487,875 -
Other Key Management Personnel
Dustin Stringer GM - Marketing 169,654 - - 1,799 15,252 - 184,705 -
Humera Ahmad GM - Quality 153,550 - - 4,930 22,638 - 181,118 -
Mark Chatfield GM – New Business 151,671 - - 1,910 26,660 - 180,241 -
Scott Patterson5 GM - Sales 16,798 - - - 10,014 - 26,812 -
491,673 - - 8,639 74,564 - 574,876 -
No long-term employee benefits, other than equity-based benefits and accrued long service leave have been provided to Directors, Secretaries or Key Management personnel during the year.
4 All Long Service Leave amounts relate to accrued balances. No Long Service Leave was taken or paid out during the year 5 Scott Patterson commenced employment on 14 May 2012
For
per
sona
l use
onl
y

Page 13
Options issued to Chief Executive Officer (CEO)
On 23 November 2012, the issue of 1,500,000 options to the CEO was approved at a general meeting on the terms set forth below -
(a) Each option has an exercise price of $0.70 per fully paid ordinary share
(b) The options will lapse 48 months after their date of grant
(c) The options do not vest until 24 months after their date of grant
(d) Each option entitles the holder to 1 fully paid ordinary share
(e) Shares issued upon exercise of option will rank equally with all existing ordinary shares of the company
Options issued to Key Management Personnel
On 1 July 2012, the issue of 1,700,000 options to Key Management Personnel was made on the terms set forth below -
(f) Each option has an exercise price of $0.70 per fully paid ordinary share
(g) The options will lapse 36 months after their date of grant
(h) The options do not vest until 24 months after their date of grant
(i) Each option entitles the holder to 1 fully paid ordinary share
Options issued to Chief Operating Officer (COO)
On 23 November 2012, the issue of 600,000 options to the COO was approved at a general meeting on the terms set forth below -
(j) Each option has an exercise price of $0.70 per fully paid ordinary share
(k) The options will lapse 36 months after their date of grant
(l) The options do not vest until 24 months after their date of grant
(m) Each option entitles the holder to 1 fully paid ordinary share
(n) Shares issued upon exercise of option will rank equally with all existing ordinary shares of the company
Full Details of these options can be found on page 14. No options were exercised during the year ended 30 June 2013.
For
per
sona
l use
onl
y

Page 14
5. INTEREST IN SHARES & OPTIONS
The number of options held by key management personnel is as follows:
Name Grant Date
VestingDate
ExpiryDate
ExercisePrice
Balance at start
of the yearnumber
Option Granted
during the year number
Options lapsed /
forfeited during the
year number
Option Vested during
the year number
Balance vested
at end of the year number
Balance unvestedat end ofthe yearnumber
Fair Value per
options1 at grated
date Charles Wayne Stringer 05.08.2008 30.06.2010 30.06.2013 $1.50 500,000 - )500,000( - - - $0.21
05.08.2008 30.06.2011 30.06.2013 $1.75 500,000 - )500,000( - - - $0.17 05.08.2008 30.06.2012 30.06.2013 $2.00 500,000 - )500,000( - - - $0.16 23.11.2012 23.11.2014 23.11.2015 $0.70 - 1,500,000 - - - 1,500,000 $0.04
Wesley Stringer 24.11.2012 23.11.2014 23.11.2015 $0.70 - 600,000 - - - 600,000 $0.02 01.7.2008 30.6.2011 30.6.2013 $1.50 50,000 - )50,000( - - - $0.17 30.6.2009 30.6.2012 30.6.2014 $2.35 60,000 - - - 60,000 - $0.41
Dustin Stringer 01.07.2012 30.06.2014 30.06.2015 $0.70 - 400,000 - - - 400,000 $0.02 01.7.2008 30.6.2011 30.6.2013 $1.50 40,000 - - - 40,000 - $0.17 30.6.2009 30.6.2012 30.6.2014 $2.35 60,000 - - - 60,000 - $0.41
Mark Chatfield 01.07.2012 30.06.2014 30.06.2015 $0.70 - 250,000 - - 250,000 $0.02 01.7.2008 30.6.2011 30.6.2013 $1.50 25,000 - - - 25,000 - $0.17 30.6.2009 30.6.2012 30.6.2014 $2.35 25,000 - - - 25,000 - $0.41
Humera Ahmad 01.07.2012 30.06.2014 30.06.2015 $0.70 - 250,000 - - - 250,000 $0.02 01.7.2008 30.6.2011 30.6.2013 $1.50 20,000 - - - 20,000 - $0.17 30.6.2009 30.6.2012 30.6.2014 $2.35 15,000 - - - 15,000 - $0.41
Scott Patterson 01.07.2012 30.06.2014 30.06.2015 $0.70 - 250,000 - - - 250,000 $0.02 Jared Stringer 01.07.2012 30.06.2014 30.06.2015 $0.70 - 400,000 - - - 400,000 $0.02
01.7.2008 30.6.2011 30.6.2013 $1.50 30,000 - - - 30,000 - $0.17 30.6.2009 30.6.2012 30.6.2014 $2.35 45,000 - - - 45,000 - $0.41
1,870,000 3,650,000 (1,550,000) - 320,000 3,650,000 *The executives have no access to the shares until expiry of 36 months of their employment with the company or an Associated Body Corporate from the date of grant of the shares. All shares are forfeited if the grantee resigns from the company prior to the expiry of 36 months from the date of grant of the shares. **All options1 have been valued using the Black-Scholes option model. The values of the options1 calculated under this method are allocated evenly over the vesting period.
The number of shares held by key management personnel is as follows:
Name No. of fully paidordinary shares
Maurice Van Ryn 991,122 Richard David Kuo 74,726 Graham Henry Buckeridge 1,448,684 Robin Tedder 5,262,334 Robert Maxwell Johnston 307,215 Charles Wayne Stringer 8,675,786 Wesley Stringer 337,689 Dustin Stringer 77,000 Mark Chatfield - Humera Ahmad - Scott Patterson - Jared Stringer 138,717
For
per
sona
l use
onl
y

Page 15
6. SHARE OPTIONS EXERCISED OR LAPSED DURING THE YEAR No share options issued to directors or Key Management Personnel were exercised, lapsed or forfeited during the year ended 30 June 2013, other than:
Forfeited Lapsed Value ofduring during Shares at
Grant Vesting Exercise the year the year Forfeited /lapsedName date date Price ($) Number Number Date ($)Humera Ahmad 01.07.2008 30.06.2011 1.50 - 20,000 Mark Chatfield 01.07.2008 30.06.2011 1.50 - 25,000 Dustin Stringer 01.07.2008 30.06.2011 1.50 - 40,000 Charles Wayne Stringer 05.08.2008 30.06.2010
1.50 500,000-
Charles Wayne Stringer 05.08.2008 30.06.2011
1.75 500,000 -
Charles Wayne Stringer 05.08.2008 30.06.2012
2.00 500,000-
Jared Stringer 01.07.2008 30.06.2011 1.50 - 30,000 Wesley Stringer 01.07.2008 30.06.2011 1.50 - 50,000
The fair value of the options at the date they lapsed or forfeited was $0.01 per option. The board has no formal policy in place for limiting the risk to the directors or other key management personnel in relation to the options issued. 7. CONTRACTS OF EMPLOYMENT All executive staff employed by the Group are subject to employment contracts, which set out the terms and conditions of their employment. These contracts define their level of remuneration, length of contract (if for fixed period) and termination events amongst other areas. The standard notice period for employees of the Group is one month; however, this may be varied to be up to one year in limited instances. End of remuneration report. Proceedings on Behalf of the Company No person has applied for leave of court to bring proceedings on behalf of the company or intervene in any proceedings to which the company is a party for the purpose of taking responsibility on behalf of the company for all or any part of those proceedings. Non-audit Services The board of directors is satisfied that the provision of non-audit services during the year is compatible with the general standard of independence for auditors imposed by the Corporations Act 2001. The directors are satisfied that the services disclosed below did not compromise the external auditor's independence for the following reasons:
all non-audited services are reviewed and approved by the board prior to commencement to ensure that they do not adversely affect the integrity and objectivity of the auditor; and
the nature of the services provided do not compromise the general principles relating to auditors independence as set out in Code of Conduct APES 110 Code of Ethics for professional accountants issued by the Accounting professional & ethical standards board, including reviewing or auditing the auditor’s own work, acting in a management or decision making capacity for the company, acting as advocate for the company or jointly sharing economic risks and rewards.
For
per
sona
l use
onl
y
Page 16
No fees for non-audit services were paid/payable to the external auditors during the year ended 30 June 2013. Auditor's Independence Declaration A copy of the auditor's independence declaration as required under section 307C of the Corporations Act 2001 is set out on page 17 of this report. Signed in accordance with a resolution of Board of Directors.
…………………………………………………………………….. Director Charles Wayne Stringer Signed at Laverton this 22nd day of August 2013
For
per
sona
l use
onl
y

Moore Stephens ABN 39 533 589 331. Liability limited by a scheme approved under Professional Standards Legislation. An independent member of Moore Stephens International Limited – members in principal cities throughout the world. The Melbourne Moore Stephens firm is not a partner or agent of any other Moore Stephens firm. And is a separate partnership in Victoria.
Level 10, 530 Collins Street
Melbourne VIC 3000
T +61 (0)3 8635 1800 F +61 (0)3 8102 3400
www.moorestephens.com.au
Auditor’s Independence Declaration under Section 307C of the Corporations Act
2001 to the directors of Probiotec Limited
I declare that, to the best of my knowledge and belief, during the year ended 30 June 2013 there have been:
(i) No contraventions of the auditor independence requirements as set out in the Corporations Act 2001 in relation to the audit, and
(ii) No contraventions of any applicable code of professional conduct in relation to the audit.
(iii) MOORE STEPHENS Chartered Accountants Nick Michael Partner Melbourne, 22 August 2013
For
per
sona
l use
onl
y

2013 2012$ $
Sales revenue from continuing operations 2 67,342,884 66,046,188
Cost of goods sold (38,167,752) (36,791,522)
Gross profit 29,175,132 29,254,666
Other revenue 2 10,241 119,164
Other income 2 891,043 3,585,907
Warehousing & distribution expenses (5,917,382) (4,778,448)
Sales and marketing expenses (10,777,436) (14,138,251)
Impairment expenses - (1,245)
Finance costs (1,598,713) (2,011,984)
Legal costs (283,403) (418,818)
Administration and other expenses 4 (9,955,194) (9,373,374)
Profit / (loss) from continuing activities before income tax expense 1,544,289 2,237,617
Income tax expense relating to continuing activities 5 (71,803) (8,367)
Profit / (loss) from continuing activities for the period attributable to members of the parent entity 1,472,486 2,229,250
Loss from discontinued operations 6 (875,617) (979,870)
Profit for the period attributable to members of the parent entity 3 596,869 1,249,380
Other comprehensive income
Other Comprehensive income / (loss) to be classified to profit and loss when specific conditions are met 448,070 (90,584)
Income tax on items of other comprehensive income - -
Other comprehensive income for the year, net of tax 448,070 (90,584)
Total comprehensive income for the year 1,044,939 1,158,795
Total comprehensive income for the year attributable to members of the parent entity 1,044,939 1,158,795
Earnings per share for profit attributable to members of the parent entity
Basic earnings per share (cents) 31 1.1 2.4 Diluted earnings per share (cents) 31 1.1 2.4
Earnings per share from discontinued operations
Basic earnings per share (cents) 31 (1.7) (1.9) Diluted earnings per share (cents) 31 (1.7) (1.9)
The Consolidated Statement of Comprehensive Income is to be read in conjunction with the attached notes
CONSOLIDATED STATEMENT OF PROFIT OR LOSS AND COMPREHENSIVE INCOME FOR THE YEAR ENDED 30 JUNE 2013
Consolidated GroupNote
Page 18
For
per
sona
l use
onl
y
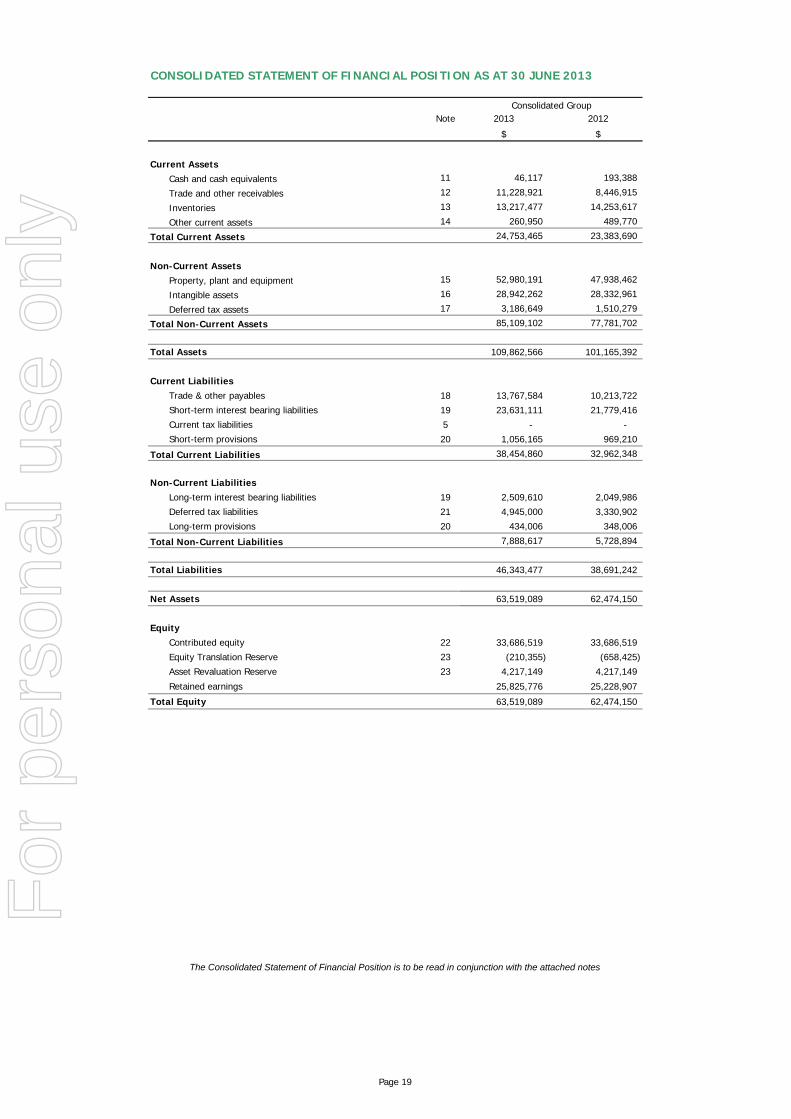
Note 2013 2012
$ $
Current AssetsCash and cash equivalents 11 46,117 193,388
Trade and other receivables 12 11,228,921 8,446,915
Inventories 13 13,217,477 14,253,617
Other current assets 14 260,950 489,770
Total Current Assets 24,753,465 23,383,690
Non-Current AssetsProperty, plant and equipment 15 52,980,191 47,938,462
Intangible assets 16 28,942,262 28,332,961
Deferred tax assets 17 3,186,649 1,510,279
Total Non-Current Assets 85,109,102 77,781,702
Total Assets 109,862,566 101,165,392
Current LiabilitiesTrade & other payables 18 13,767,584 10,213,722
Short-term interest bearing liabilities 19 23,631,111 21,779,416
Current tax liabilities 5 - -
Short-term provisions 20 1,056,165 969,210
Total Current Liabilities 38,454,860 32,962,348
Non-Current LiabilitiesLong-term interest bearing liabilities 19 2,509,610 2,049,986
Deferred tax liabilities 21 4,945,000 3,330,902
Long-term provisions 20 434,006 348,006
Total Non-Current Liabilities 7,888,617 5,728,894
Total Liabilities 46,343,477 38,691,242
Net Assets 63,519,089 62,474,150
EquityContributed equity 22 33,686,519 33,686,519
Equity Translation Reserve 23 (210,355) (658,425)
Asset Revaluation Reserve 23 4,217,149 4,217,149
Retained earnings 25,825,776 25,228,907
Total Equity 63,519,089 62,474,150
CONSOLIDATED STATEMENT OF FINANCIAL POSITION AS AT 30 JUNE 2013
Consolidated Group
The Consolidated Statement of Financial Position is to be read in conjunction with the attached notes
Page 19
For
per
sona
l use
onl
y

CONSOLIDATED STATEMENT OF CHANGES IN EQUITY FOR THE YEAR ENDED 30 JUNE 2013
Ordinary Share Capital
Asset Revaluation
ReserveRetained Earnings Total
$ $ $ $ $
Balance as at 1 July 2011 33,686,519 (681,306) 4,523,385 23,786,755 61,315,353
Total comprehensive income for the year
Profit for the year - - - 1,249,380 1,249,380
Asset revaluations - - (113,465) - (113,465)
Other comprehensive income - 22,881 - - 22,881
Sale of property, plant and equipment previously revalued - - (192,771) 192,771 -
- 22,881 (306,236) 1,442,151 1,158,796
Transactions with owners in their capacity as owners
Shares (cancelled) / issued during the year - - - - -
Dividends paid or provided for - - - - -
Balance as at 30 June 2012 33,686,519 (658,425) 4,217,149 25,228,907 62,474,150
Total comprehensive income for the year
Profit for the year - - - 596,869 596,869
Asset revaluations - - - - -
Other comprehensive income - 448,070 - - 448,070
Total comprehensive income for the year - 448,070 - 596,869 1,044,939
Transactions with owners in their capacity as owners
Shares (cancelled) issued during the year - - - - -
Dividends paid or provided for - - - - -
Balance as at 30 June 2013 33,686,519 (210,355) 4,217,149 25,825,776 63,519,089
The Consolidated Statement of Changes in Equity is to be read in conjunction with the attached notes
Total comprehensive income for the year
Equity Translation Reserve
Page 20
For
per
sona
l use
onl
y

Note 2013 2012
$ $
Cash Flows From Operating ActivitiesReceipts from customers 64,560,878 67,849,578 Payments to suppliers and employees (57,530,458) (62,410,161)Interest received 10,241 119,164 Interest and other costs of finance paid (1,598,713) (2,011,984)
Income tax paid - (3,071)
Net cash provided by operating activities 27 (b) 5,441,948 3,543,526
Cash Flows From Investing ActivitiesPayment for property, plant and equipment (8,034,247) (3,532,926)
Proceeds from sale of property, plant and equipment 32,094 1,048,125
Proceeds from sale of intangible assets 900,000 6,000,000
Cash payments for investments - (322,046)
Receipts relating to loans receivable 511,496 590,001
Purchase of intangible assets (1,309,880) (2,596,575)
Net cash used in investing activities (7,900,537) 1,186,579
Cash Flows From Financing Activities
Proceeds from issues of shares - -
Dividends Paid - -
Proceeds from borrowings 6,187,666 1,527,448
Repayment of borrowings (5,303,931) (7,002,272)
Net cash provided by / (used in) financing activities 883,735 (5,474,824)
Net Increase in cash held (1,574,856) (744,719)
Cash at beginning of financial year 193,388 938,107 Cash at end of financial year 11 (1,381,468) 193,388
RECONCILIATION OF CASH AND CASH EQUIVALENTFor the purposes of the statement of cash flows, cash includes cash on hand and in banks and investments inmoney market instruments, net of outstanding bank overdrafts. Cash at the end of the financial year as shown inthe statement of cash flows is reconciled to the related items in the statement of financial position as follows:
Cash 46,117 193,388 Bank Overdraft (1,427,584) -
(1,381,468) 1,673,396
CONSOLIDATED STATEMENT OF CASH FLOWS FOR THE YEAR ENDED 30 JUNE 2013
Consolidated Group
The Consolidated Statement of Cash Flows is to be read in conjunction with the attached notes
Page 21
For
per
sona
l use
onl
y

Page 22
NOTES TO THE FINANCIAL STATEMENTS FOR THE YEAR ENDED 30 JUNE 2013 1. STATEMENT OF SIGNIFICANT ACCOUNTING POLICIES
The financial report covers Probiotec Limited (“company”) and controlled entities (“group”). Probiotec Limited is a for-profit listed public company, incorporated and domiciled in Australia. The financial report is for the financial year ended 30 June 2013 and is presented in Australian dollars.
Basis of Preparation The financial report is a general purpose financial report which has been prepared in accordance with Australian Accounting Standards, Australian Accounting interpretations, other authoritative pronouncements of the Australian Accounting Standards Board (AASB) and the Corporations Act 2001. The accounting policies set out below have been consistently applied to all years presented. Reporting Basis and Convention The financial report has been prepared on an accrual basis and is applied on historical costs modified by the revaluation of selected non-current assets, financial liabilities and derivative financial instruments for which the fair value basis of accounting has been applied. Compliance with IFRS Australian Accounting Standards include International Financial Reporting Standards as adopted in Australia. Compliance with Australian Accounting Standards ensures that the financial statements and notes of Probiotec Limited comply with International Financial Reporting Standards (IFRS). Material accounting policies adopted in the preparation of these financial statements have been consistently applied unless stated otherwise. Authorisation for issue This financial report was authorized for issue by the board of directors of Probiotec Limited on 22 August 2013. Accounting Policies (a) Principles of Consolidation The consolidated financial statements are prepared by combining the financial statements of all the entities that comprise the consolidated entity, being Probiotec Limited (the parent entity) and its controlled entities as defined in accounting standard AASB 127 "Consolidated and Separate Financial Statements". Where a subsidiary either began or ceased to be controlled during the year, the results of its operations are included only from the date control commenced or ceased. All inter-company balances and transactions between entities in the group, including any unrealised profits or losses, have been eliminated on consolidation. Minority interests in the results and equity of subsidiaries are shown separately in the consolidated statement of comprehensive income and statement of financial position respectively. Subsidiaries are accounted for by the parent entity at cost, less any impairment charges.
For
per
sona
l use
onl
y

Page 23
(b) Income Tax (i) General Current tax assets and liabilities for the current and prior periods are measured as the amount expected to be recovered from or paid to the taxation authorities. The income tax expense for the period is the tax payable on the current period’s taxable income based on the notional income tax rate of each jurisdiction adjusted by changes in deferred tax assets and liabilities attributable to temporary differences between the tax base of assets and liabilities and their carrying amounts in the financial statements, and to unused tax losses. Deferred tax balances are determined using the balance sheet liability method which calculates temporary differences based on the carrying amounts of an entity's asset and liabilities carried in the financial statements and their associated tax bases. No deferred income tax will be recognised from the initial recognition of an asset or liability, excluding a business combination, where there is no effect on accounting or taxable profit or loss. The amount of deferred tax provided will be based on the expected manner of realisation of the asset or settlement of the liability, using tax rates enacted on reporting date. Deferred tax is credited in profit or loss except where it relates to items that may be credited directly to equity, in which case the deferred tax is adjusted directly against equity. Deferred tax assets will be recognised only to the extent that it is probable that future income tax profits will be available against which the assets can be utilised. The amount of benefits brought to account or which may be realised in the future is based on the assumption that no adverse change will occur in income taxation legislation and the anticipation that the group will derive sufficient future assessable income to enable the benefit to be realised and to comply with the conditions of the deductibility imposed by law. The carrying amount of deferred income tax assets is reviewed at each balance date and reduced to the extent that it is no longer probable that sufficient taxable profit will be available to allow all or part of the deferred income tax to be utilised. Unrecognised deferred income tax assets are reassessed at each balance date and are recognised to the extent that it has become probable that future taxable profit will allow the deferred tax asset to be recovered. (ii) Goods and Services Tax Revenues, expenses and assets are recognised net of the amount of GST, except where the amount of GST incurred is not recoverable from the Australian Taxation Office. In these circumstances the GST is recognised as part the cost of acquisition of the asset or as part of an item of the expense. Receivables and payables in the statement of financial position are shown inclusive of GST. Cash flows are included in the statement of cash flows on a gross basis and the GST component of cash flows arising from investing and financing activities, which is recoverable from, or payable to, the taxation authority are classified as operating cash flows. Commitments and contingencies are disclosed net of the amount of GST recoverable from, or payable to, the taxation authority. (c) Foreign Currency Translation (i) Functional and presentation currency The functional currency of each of the group's entities is measured using the currency of the primary economic environment in which that entity operates. The consolidated financial statements are presented in Australian dollars which is the parent entity's functional and presentation currency.
For
per
sona
l use
onl
y

Page 24
(ii) Foreign Currency Transactions Foreign currency transactions are translated into the functional currency using the exchange rate prevailing at the date of the transaction. Foreign currency monetary items are translated at the year end exchange rate. Non-monetary items measured at historical cost continue to be carried at the exchange rate at the date of the transaction. Non-monetary items measured at fair value in a foreign currency are translated at the date when the fair value was determined. (iii) Translation of group companies functional currency to presentation currency The results of the New Zealand, British, Chinese, German and Irish subsidiaries are translated into Australian dollars as at the date of the transactions. Assets and liabilities are translated at exchange rates prevailing at balance date. Exchange variations resulting from the translation are recognised in the foreign currency translation reserve in other comprehensive income. (d) Impairment of assets The recoverable amount of the Group assets excluding deferred tax assets and goodwill are reviewed at each reporting date to determine whether there is any indication of impairment. If any such indication exists, the asset is tested for impairment by comparing the recoverable amount (being the higher of the asset’s fair value less cost to sell and value in use) to its carrying amount. Goodwill and intangible assets that have an indefinite useful life and assets not ready for use are tested for impairment at least annually. The recoverable amount is estimated for the individual asset or, if it is not possible to estimate the recoverable amount for the individual asset, the recoverable amount of the cash generating unit (CGU) to which the asset belongs is determined. CGUs have been determined as the smallest identifiable group of assets that generate cash inflows largely independent of the cash flow of other assets. An impairment loss is recognised as an expense when the carrying amount of an asset or the CGU exceeds its recoverable amount. Impairment losses recognised in respect of CGUs are allocated first to reduce the carrying amount of any goodwill allocated to the CGU and then, to reduce the carrying amount of the other assets in the unit on a pro rata basis. An impairment loss recognised in prior periods for an asset (other than goodwill) is reversed if, and only where there is an indicator that the impairment loss may no longer exist, and there has been a change in the estimates used to determine the asset's recoverable amount since the last impairment loss was recognised. The increased carrying amount of an asset due to a reversal of an impairment loss does not exceed the carrying amount that would have been determined (net of amortisation) had no impairment loss been recognised for the asset in prior years. In calculating the value in use, the cash flow includes projections of cash inflows and outflows from continuing use of the asset and cash flows associated with disposal of the asset. The cash flows are estimated for the assets in their current condition and do not include cash flows and out flows expected to arise from future restructuring which are not yet committed, or from improving or enhancing the asset's performance. In assessing value in use, the estimated cash flows are discounted to their present value effectively using a pre-tax discount rate that reflects the current market assessments of the risk specific to the asset or CGU. (e) Inventories Inventories, which include raw materials, work in progress and finished goods, are valued at the lower of cost and net realisable value. Costs comprise all cost of purchase and conversion, including material, labour and appropriate portion of fixed and variable overhead expenses. Costs have been assigned to inventory on hand at reporting date using either the first-in-first-out (F.I.F.O.) basis or the weighted average cost basis, depending on the nature of product being manufactured. Fixed overheads are allocated on the basis of normal
For
per
sona
l use
onl
y

Page 25
operating capacity. Net realisable value is the estimated selling price in the ordinary course of business, less the estimated cost of completion and selling expenses. (f) Property, Plant and Equipment Each class of property, plant and equipment is carried at historical cost or fair value less accumulated depreciation and impairment. Cost includes expenditure that is directly attributable to the acquisition of the item. (i) Property Freehold land and buildings are stated at fair value (being the amount for which an asset could be exchanged between knowledgeable willing parties in an arm's length transaction), based on periodic, valuations by external valuers, less subsequent depreciation for the building. Any accumulated depreciation at the date of valuation is eliminated against the gross carrying amount of the asset and the net amount is reinstated to the revalued amount of the asset. Independent valuations are carried out every three to five years, with internal reviews performed regularly to ensure that the carrying amounts of land and buildings do not differ materially from the fair value at the reporting date. Increases in the carrying amount arising on revaluation of land and buildings are credited to a revaluation reserve in equity. Decreases that offset previous increases of the same asset are charged against fair value reserves directly in equity; all other decreases are charged to profit or loss. Each year the difference between depreciation based on the revalued carrying amount of the asset charged to profit or loss and depreciation based on the asset's original cost is transferred from the revaluation reserve to retained earnings. When revalued assets are sold, amounts included in the revaluation reserve relating to the asset are transferred to retained earnings. (ii) Plant and Equipment Plant and equipment are stated at historical cost, including costs directly attributable to bringing the asset to the location and condition necessary for it to be capable of operating in the manner intended by management, less depreciation and any impairments. The carrying amount of plant and equipment is reviewed annually by directors to ensure it is not in excess of the recoverable amount from these assets. The recoverable amount is assessed as the higher of fair value less costs to sell or value in use. In the event the carrying amount of plant and equipment is greater than the estimated recoverable amount, the carrying amount is written down immediately to the estimated recoverable amount and impairment losses are recognized either in profit and loss or as a revaluation decrease if the impairment loss relates to a revalued asset. The cost of fixed assets constructed within the group includes the cost of materials, direct labour, borrowing costs and an appropriate proportion of fixed and variable overheads. Subsequent costs are included in the asset's carrying amount or recognised as a separate asset, as appropriate, only when it is probable that future economic benefits associated with the item will flow to the group and the cost of the item can be measured reliably. All other repairs and maintenance are charged to the profit or loss during the financial year in which they were incurred. Depreciation The depreciable amount of property, plant and equipment, including capitalised lease assets, but excluding freehold land, is depreciated on a straight line basis over their useful lives to the group commencing from the time the asset is held ready for use. Leasehold improvements are depreciated over the shorter of either the unexpired period of the lease or the estimated useful lives of the improvements. The depreciation rates used for each class of depreciable assets are:
For
per
sona
l use
onl
y

Page 26
Buildings 4% Leased Plant, Equipment and Other 5% to 12.5% Plant, Equipment and Other 5% to 50% The assets' residual value and useful life are reviewed, and adjusted if appropriate, at each balance date. Gains and losses on disposals are determined by comparing proceeds with the carrying amount. These gains and losses are included in profit or loss. (g) Leases Leases where substantially all the risks and benefits incidental to the ownership of the asset, but not the legal ownership, are transferred to the entities within the group are classified as finance leases. Finance lease are capitalised at the lower of the fair value of the leased property or the present value of the minimum lease payments. The corresponding rental obligations, net of finance charges, are included in the current and non-current interest bearing liabilities. Each lease payment is allocated between the liability and the finance charges. The interest element of the lease payment is charged to profit or loss over the lease period so as to produce a constant periodic rate of interest on the remaining balance of the liability for each period. The property, plant and equipment acquired under finance leases is depreciated over the shorter of the asset's useful life or the lease term, unless it is reasonably certain that ownership will be obtained by the end of the lease term where it is depreciated over the period of the expected use which is the useful life of the asset. Lease payments for operating leases, where substantially all the risks and benefits remain with the lessor, are charged as expenses on a straight line basis over the period of the lease. (h) Investments in Associates Associates comprise entities over which the parent entity or the Group have significant influence and hold an ownership interest. Investments in associated companies are recognised in the financial statements by applying the equity method of accounting. Under the equity method of accounting the carrying amounts of investments in associates are increased or decreased to recognise the Group’s share of the post-acquisition profits or losses and other changes in net assets of the associates. The Group’s share of the post-acquisition profits or losses of associates is included in the consolidated profit and loss. The financial statements of the associate are used to apply the equity method. The reporting dates of the associate and the parent are identical and both use consistent accounting policies. Associates are accounted for in the parent entity financial statements at cost. (i) Interests in Joint Venture Entities Under AASB 131 "Interests in Joint Ventures" interests in jointly controlled entities can be recognised using either the proportionate consolidation approach or the equity method. Prior to 1 July 2008, the group had accounted for its interests in joint ventures using the equity method. From 1 July 2008, the group has changed its policy to account for interests in joint ventures such that the proportionate consolidation method is adopted. (j) Intangibles i) Goodwill Goodwill on consolidation is initially recorded at the amount by which the purchase price for a business or for an ownership interest in a controlled entity plus the amount of any non-controlling interests in the acquire exceeds the fair value attributed to the acquiree’s identifiable assets, liabilities and contingent liabilities at the date of acquisition. Goodwill on acquisitions of subsidiaries is included in intangible assets. Goodwill on
For
per
sona
l use
onl
y

Page 27
acquisition of associates is included in investments in associates. Goodwill is tested annually for impairment. For the purpose of impairment testing, goodwill acquired in a business combination is allocated to each of the group’s cash-generating units, or groups of cash-generating units that are expected to benefit from the synergies of the combination, irrespective of whether other assets or liabilities of the group are assigned to these units or groups of units. Impairment is determined by assessing the recoverable amount of the cash-generating unit, or group of cash-generating units, to which the goodwill relates. Impairment losses recognised for goodwill are not subsequently reversed. Goodwill is carried at cost less accumulated impairment losses. Gains and losses on the disposal of an entity include the carrying amount of goodwill relating to the entity sold. ii) Trademarks, Licenses, product development costs and Product Dossiers Trademarks, licenses, product development costs and product dossiers (“Developed Products”) are initially recognised at cost. Developed Products have an indefinite life and are tested at each reporting date for impairment and carried at cost less accumulated impairment losses. Those with a finite life are carried at cost less any accumulated amortisation and accumulated impairment losses. Those developed products with finite lives are amortised on a straight line basis over a useful life of between 10 and 40 years. Amortisation is included within administration and other expenses in the statement of comprehensive income. iii) Research and Development – Internally generated Research costs are expensed as incurred. Development expenditure incurred on an individual project is capitalised if the product or service is technically feasible, adequate resources are available to complete the project, it is probable that future economic benefits will be generated and expenditure attributable to the project can be measured reliably. Expenditure capitalised comprises costs of materials, services, direct labour and directly attributable overheads. Other development costs are expensed when they are incurred. Capitalised development expenditure is stated at cost less accumulated amortisation and any impairment losses and amortised over the period of expected future sales from the related projects. The carrying value of development costs is reviewed annually when the asset is not yet available for use, or when events or circumstances indicate that the carrying value may be impaired. (k) Employee Benefits i) Wages, Salaries & Annual Leave Liabilities for employee benefits such as wages, salaries, annual leave, sick leave and other current employee entitlements represent present obligations resulting from employees' services provided to reporting date, and are measured at the amount expected to be paid when the liabilities are settled. ii) Long Service Leave Liabilities relating to Long Service Leave are measured as the present value of the estimated future cash outflows to be made in respect to services provided by employees, up to the reporting date. Consideration is given to expected future wage levels, experience of employee departures and period of service. Expected future payments are discounted using market yields at the reporting date on national government bonds with terms to maturity that match, as closely as possible, the estimated future cash outflows. iii) Superannuation Contributions are made by the entity to employee superannuation funds and are charged as expenses when incurred. The consolidated entity does not maintain any retirement benefit funds. iv) Employee share based payments Shares issued pursuant to an employee share plan, which are facilitated by means of a loan with recourse only to the shares, are treated as an option grant. The loan is shown as a reduction in equity until the shares are either cancelled or settled in accordance with the terms of the plan. The fair value of options granted is
For
per
sona
l use
onl
y

Page 28
recognised as an employee benefit expense with a corresponding increase in the share-based payments reserve in equity. The fair value is measured at grant date taking into account market performance conditions only, and spread over the vesting period during which the employees become unconditionally entitled to the options. The fair value of options granted is measured using the Black Scholes model. The amount recognised as an expense is adjusted to reflect the actual number of options that vest, except where forfeiture is due to market related conditions. At each subsequent reporting date until vesting, the cumulative change to profit or loss is the product of: The grant date fair value. The current best estimate of the number of securities that will vest, taking into account factors such as the
likelihood of employee turnover during the vesting period and the likelihood of non-market performance conditions not being met.
The expired portion of the vesting period.
(l) Financial Instruments Recognition Financial instruments are initially measured at fair value plus directly attributable transaction costs except for financial instruments that are measured at fair value through profit and loss, which are initially measured at fair value and any directly attributable transaction costs are recognized in profit or loss immediately. Subsequent to initial recognition these instruments are measured as set out below. Loans and Receivables Loan and Receivables are non-derivative financial assets with fixed or determinable payments that are not quoted in an active market and are stated at amortised cost using the effective interest method. Loans and receivables are initially measured at fair value and are subsequently measured at amortised cost less any allowance for impairment. Trading terms are between 7 days to 60 days. An allowance for impairment is recognised when it becomes probable that the all or part of the loan or receivable will not be recoverable. Gains or losses are recognised in profit or loss when the loans and receivables are derecognised or impaired. Trade and other payables Trade and other payables represent liabilities for goods and services provided to the group prior to the year end and which are unpaid. These amounts are unsecured and have 30 – 90 day payment terms. Trade and other payables are carried at amortised cost, yet due to their short term nature, they are not discounted. Gains or losses are recognized in profit or loss through the amortization process when the financial liability is derecognized. Interest bearing liabilities Borrowings are subsequently measured at amortised cost using the effective interest method. Fair Value Fair value is determined based on current bid prices of all quoted investments. Valuation techniques are applied to determine the fair value for all unlisted securities, including recent arm's length transactions, reference to similar instruments and option pricing models. Impairment At each reporting date, the group assesses whether there is objective evidence that a financial instrument has been impaired (see note 1(d) for further details).
For
per
sona
l use
onl
y
Page 29
Derivative financial instruments The group uses derivative financial instruments such as forward foreign currency contracts and interest rate swaps to hedge its risk associated with interest rate and foreign currency fluctuations. Such derivatives are stated at fair value on the date which the derivative contract is entered into and is subsequently remeasured at fair value. The fair value of forward exchange contracts is calculated by reference to current forward exchange rates for contracts with similar maturity profiles. The fair value of interest rate swap contracts is determined by reference to market values for similar instruments. For derivatives that do not qualify for hedge accounting, any gains or losses arising from changes in fair value are taken directly to net profit or loss for the year where they are material. (m) Government Grants Grants from government are recognised at the fair value when there is a reasonable assurance that the grant will be received and the consolidated entity has complied with the required conditions. Grants relating to expense items are recognised as income over the periods necessary to match the grant to the costs they are compensating. Grants relating to assets are credited to deferred income and are amortised on a straight line basis over the expected lives of the assets. (n) Revenue Recognition Revenue is measured at the fair value of the consideration received or receivable to the extent it is probable that the economic benefits will flow to the group and the revenue can be measured reliably. Amounts disclosed as revenue are net of returns, allowances and discounts. Sales revenue comprises revenue earned from the provision of products and services to entities outside the consolidated entity. Sales revenue is recognised when the risks and rewards of ownership have transferred to the customer and can be measured reliably. Risks and rewards are considered passed to the buyer when goods have been delivered to the customer. Interest income is recognised as it accrues using the effective interest method. This method uses the effective interest rate which is the rate that exactly discounts the estimated future cash receipts over the expected life of the financial asset to the net carrying amount of the financial asset. Interest income is included as financial income in profit or loss. Dividends are recognised when the group’s right to receive payment is established. All revenue is stated net of the amount of goods and services tax (GST). (o) Financing costs Financing costs include interest income and expense, amortisation of discounts or premiums relating to borrowings, amortisation of ancillary costs incurred in connection with the arrangement of borrowings and lease finance charges. Borrowing costs are expensed as incurred except when directly attributable to the acquisition, construction or production of a qualifying asset, in which case they form part of the cost of the asset. (p) Provisions A provision is recognised when there is a legal or constructive obligation as a result of a past event and it is probable that a future sacrifice of economic benefits will be required to settle the obligation, and the amount can be reliably estimated. Provisions are measured at the present value of management’s best estimate of the expenditure required to settle the present obligation at the reporting date using a discounted cash flow methodology.
For
per
sona
l use
onl
y

Page 30
(q) Cash For purposes of the statement of cash flows, cash includes deposits at call with financial institutions which are readily convertible to cash on hand and are subject to an insignificant risk of changes in value, net of outstanding bank overdrafts. (r) Comparative Figures Comparative figures have been adjusted to conform to changes in presentation for the current year. (s) Earnings per share Basic earnings per share is determined by dividing the net profit attributable to members of the Company, excluding any costs of servicing equity other than ordinary shares, by the weighted average number of ordinary shares, adjusted for any bonus elements. Diluted earnings per share is determined by dividing the net profit attributable to members of the Company, by the weighted average number of ordinary shares and dilutive potential ordinary shares adjusted for any bonus elements. (t) Contributed equity Issued and paid up capital is recognised at the fair value of the consideration received by the Company. Incremental costs directly attributable to the issue of new shares or options are shown in equity as a deduction, net of tax, from the proceeds. (u) Business combinations Business combinations occur where an acquirer obtains control over one or more businesses. A business combination is accounted for by applying the acquisition method, unless it is a combination involving entities or businesses under common control. The business combination will be accounted for from the date that control is attained, whereby the fair value of the identifiable assets acquired and liabilities (including contingent liabilities) assumed is recognised (subject to certain limited exemptions). When measuring the consideration transferred in the business combination, any asset or liability resulting from a contingent consideration arrangement is also included. Subsequent to initial recognition, contingent consideration classified as equity is not remeasured and its subsequent settlement is accounted for within equity. Contingent consideration classified as an asset or liability is remeasured in each reporting period to fair value, recognising any change to fair value in profit or loss, unless the change in value can be identified as existing at acquisition date. All transaction costs incurred in relation to business combinations are recognised as expenses in profit or loss when incurred. The acquisition of a business may result in the recognition of goodwill or a gain from a bargain purchase. (v) New Accounting Standards
The AASB has issued a number of new and amended Accounting Standards and Interpretations that have mandatory application dates for future reporting periods, some of which are relevant to the Group. The Group has decided not to early adopt any of these new and amended pronouncements. The Group’s assessment of the new and amended pronouncements that are relevant to the Group but applicable in future reporting periods is set out below.
For
per
sona
l use
onl
y

Page 31
— AASB 9: Financial Instruments (December 2010) and AASB 2010–7: Amendments to Australian Accounting Standards arising from AASB 9 (December 2010) (applicable for annual reporting periods commencing on or after 1 January 2015).
These Standards are applicable retrospectively and include revised requirements for the classification and measurement of financial instruments, as well as recognition and de-recognition requirements for financial instruments. The key changes made to accounting requirements include: simplifying the classifications of financial assets into those carried at amortised cost and those
carried at fair value;
simplifying the requirements for embedded derivatives;
removing the tainting rules associated with held-to-maturity assets;
removing the requirements to separate and fair value embedded derivatives for financial assets carried at amortised cost;
allowing an irrevocable election on initial recognition to present gains and losses on investments in equity instruments that are not held for trading in other comprehensive income. Dividends in respect of these investments that are a return on investment can be recognised in profit or loss and there is no impairment or recycling on disposal of the instrument;
requiring financial assets to be reclassified where there is a change in an entity’s business model as they are initially classified based on: (a) the objective of the entity’s business model for managing the financial assets; and (b) the characteristics of the contractual cash flows; and
requiring an entity that chooses to measure a financial liability at fair value to present the portion of the change in its fair value due to changes in the entity’s own credit risk in other comprehensive income, except when that would create an accounting mismatch. If such a mismatch would be created or enlarged, the entity is required to present all changes in fair value (including the effects of changes in the credit risk of the liability) in profit or loss.
These standards were mandatorily applicable for annual reporting periods commencing on or after 1 January 2013. However, AASB 2012-6: Amendments to Australian Accounting Standards – Mandatory Effective Date of AASB 9 and Transition Disclosures (issued in September 2012) defers the mandatory application date of AASB 9 from 1 January 2013 to 1 January 2015. In light of this change to the mandatory effective date, the Group is expected to adopt AASB 9 and AASB 2010-7 for the annual reporting period ending 30 June 2015. Although, the directors anticipate that the adoption of AASB 9 and AASB 2010-7 may have a significant impact on the Group’s financial instruments, it is impracticable at this stage to provide a reasonable estimate of such impact.
— AASB 10: Consolidated Financial Statements, AASB 11: Joint Arrangements, AASB 12: Disclosure of Interests in Other Entities, AASB 127: Separate Financial Statements [August 2011], AASB 128: Investments in Associates and Joint Ventures [August 2011] (as amended by AASB 2012-10: Amendments to Australian Accounting Standards – Transition Guidance and Other Amendments) and AASB 2011-7: Amendments to Australian Accounting Standards arising from the Consolidation and Joint Arrangements Standards (applicable for annual reporting periods commencing on or after 1 January 2013).
AASB 10 replaces parts of AASB 127 [March 2008, as amended] and Interpretation 112: Consolidation –Special Purpose Entities. AASB 10 provides a revised definition of control and additional application guidance so that a single control model will apply to all investees.
For
per
sona
l use
onl
y

Page 32
AASB 11 replaces AASB 131: Interests in Joint Ventures (July 2004, as amended). AASB 11 requires joint arrangements to be classified as either ‘joint operations’ (where the parties that have joint control of the arrangement have rights to the assets and obligations for the liabilities) or ‘joint ventures’ (where the parties that have joint control of the arrangement have rights to the net assets of the arrangement). Joint ventures are required to adopt the equity method of accounting (proportionate consolidation is no longer allowed). AASB 12 contains the disclosure requirements applicable to entities that hold an interest in a subsidiary, joint venture, joint operation or associate. AASB 12 also introduces the concept of a ‘structured entity’, replacing the ‘special purpose entity’ concept currently used in Interpretation 112, and requires specific disclosures in respect of any investments in unconsolidated structured entities. To facilitate the application of AASBs 10, 11 and 12, revised versions of AASB 127 and AASB 128 have also been issued. These Standards are not expected to significantly impact the Group’s financial statements.
— AASB 13: Fair Value Measurement and AASB 2011-8: Amendments to Australian Accounting Standards arising from AASB 13 (applicable for annual reporting periods commencing on or after 1 January 2013).
AASB 13 defines fair value, sets out in a single Standard a framework for measuring fair value, and requires disclosures about fair value measurement. AASB 13 requires: inputs to all fair value measurements to be categorised in accordance with a fair value hierarchy;
and
enhanced disclosures regarding all assets and liabilities (including, but not limited to, financial assets and financial liabilities) measured at fair value.
These Standards are expected to result in more detailed fair value disclosures, but are not expected to significantly impact the amounts recognised in the Group’s financial statements.
AASB 2011-4: Amendments to Australian Accounting Standards to Remove Individual Key Management Personnel Disclosure Requirements (applicable for annual reporting periods beginning on or after 1 July 2013)
This Standard makes amendments to AASB 124: Related Party Disclosures to remove the individual key management personnel disclosure requirements (including paragraphs Aus29.1 to Aus29.9.3). These amendments serve a number of purposes, including furthering trans-Tasman convergence, removing differences from IFRSs, and avoiding any potential confusion with the equivalent Corporations Act 2001 disclosure requirements.
This Standard is not expected to significantly impact the Group’s financial report because the Corporations Legislation Amendment Regulation 2013 (No. A) proposes to include the requirements in AASB 124 that will be deleted by AASB 2011-4 in the Corporations Regulations.
— AASB 119: Employee Benefits [September 2011] and AASB 2011-10: Amendments to Australian Accounting Standards arising from AASB 119 (applicable for annual reporting periods commencing on or after 1 January 2013)
These Standards introduce a number of changes to accounting and presentation of defined benefit plans. The Group does not have any defined benefit plans and so is not impacted by the amendment.
For
per
sona
l use
onl
y

Page 33
AASB 119 [September 2011] also includes changes to: (a) require only those benefits that are expected to be settled wholly before twelve months after the end of the annual reporting period in which the employees render the related service to be classified as short-term employee benefits. All other employee benefits are to be classified as either other long-term employee benefits, post-employment benefits or termination benefits , as appropriate; and (b) the accounting for termination benefits that require an entity to recognise an obligation for such benefits at the earlier of: (i) for an offer that may be withdrawn – when the employee accepts;
(ii) for an offer that cannot be withdrawn – when the offer is communicated to affected employees; and
(iii) where the termination is associated with a restructuring of activities under AASB 137 and if earlier than the first two conditions – when the related restructuring costs are recognised.
For
per
sona
l use
onl
y

8: KEY MANAGEMENT PERSONNEL AND THEIR RELATED PARTIES DISCLOSURES
Full details of Key Management Personnel and their related party disclosures are set out in the Remuneration Report section of the Directors Report.
2013 2012(a) Key management personnel compensation: $ $
Short-term employee benefits 2,017,366 1,801,518Post-employment benefits 225,710 225,051 Other long term benefits 37,764 36,181 Termination benefits - - Share-based payments 72,706 - Total compensation 2,353,546 2,062,750
(b) The number of options1 held by directors and key management personnel for the year ended 30 June 2013 is as follows:
Maurice Van Ryn - - - - - - - - - Richard David Kuo - - - - - - - - - Graham Henry Buckeridge - - - - - - - - - Robert Maxwell Johnston - - - - - - - - - Charles Wayne Stringer 1,500,000 1,500,000 - (1,500,000) 1,500,000 - - - 1,500,000 Wesley Stringer 110,000 600,000 - (50,000) 660,000 - - - 660,000 Dustin Stringer 100,000 400,000 - (20,000) 480,000 - - - 480,000 Mark Chatfield 50,000 250,000 - (25,000) 275,000 - - - 275,000 Humera Ahmad 35,000 250,000 - (20,000) 265,000 - - - 265,000 Scott Patterson - 250,000 - - 250,000 - - - 250,000 Jared Stringer 75,000 400,000 - (30,000) 445,000 - - - 445,000
- (1,645,000) 3,875,000 - - - 3,875,000
Option1 Holdings of Key Management Personnel for the year ended 30 June 2012:
Maurice Van Ryn - - - - - - - - - Richard David Kuo - - - - - - - - - Graham Henry Buckeridge - - - - - - - - - Robert Maxwell Johnston - - - - - - - - - Charles Wayne Stringer 2,200,000 - - (700,000) 1,500,000 - - - 1,500,000 Wesley Stringer 135,000 - - (25,000) 110,000 - - - 110,000 Dustin Stringer 120,000 - - (20,000) 100,000 - - - 100,000 Mark Chatfield 75,000 - - (25,000) 50,000 - - - 50,000 Humera Ahmad 60,000 - - (25,000) 35,000 - - - 35,000 Scott Patterson - - - - - - - - - Jared Stringer 95,000 - - (20,000) 75,000 - - - 75,000
- (815,000) 1,870,000 - - - 1,870,000
Ordinary share holdings of Key Management Personnel
Directors Balance at 1/07/2011
Share acquisitions
through exercise of
share optionsCEO Options
Exercised
Other purchases during the
year*Sold during
the yearBalance at 30/06/12
Share acquisitions through exercise of share options
CEO Options Exercised
Other purchases during the
year*Sold during the
yearBalance at 30/06/13
Maurice Van Ryn 281,101 - - 525,000 - 806,101 - - 185,021 - 991,122 Charles Wayne Stringer 7,828,643 - - 529,209 - 8,357,852 - - 317,934 - 8,675,786 Wes Stringer 272,811 - - 287,934 - 560,745 - - 64,878 (287,934) 337,689 Graham Harry Buckeridge 1,348,684 - - - - 1,348,684 - - 100,000 - 1,448,684 Robert Maxwell Johnston 203,000 - - 31,000 - 234,000 - - 73,215 - 307,215 Robin Tedder 5,262,334 - - - - 5,262,334 - - - - 5,262,334 Richard David Kuo 74,726 - - - - 74,726 - - - - 74,726 Total for Directors 15,271,299 - - 1,373,143 - 16,644,442 - - 741,048 (287,934) 17,097,556
Key Executive PersonnelScott Patterson - - - - - - - - - - - Jared Stringer 91,610 - - 47,107 - 138,717 - - - - 138,717 Mark Chatfield - - - - - - - - - - - Dustin Stringer 98,000 - - - (21,000) 77,000 - - - - 77,000 Humera Ahmad - - - - - - - - - - - Total for Key Executive Personnel 189,610 - - 47,107 (21,000) 215,717 - - - - 215,717
* Includes on market purchases and dividend reinvestment plan allotments.
No equity instruments other than options were granted to key management personnel during the 2012 or 2013 financial years as compensation.
Balance vested and exercisable
at end of the year number
Balance unvested and unexercisable at end of the year
number
Exercised during the year
number
Forfeited/Lapsed during the year number
1 The term Option includes unvested fully paid ordinary shares issues and the associated loans with recourse to the shares which are issued under the Probiotec Limited Employee Share Plan (ESP). These shares and loans together have substantially similar financial and economic dynamics to options. Other than the options issued to Wayne Stringer, all other “options” referred to in this table are shares and associated loans issued under the ESP.
Balance at end of the year number
Balance vested and exercisable
at end of the year number
Balance at start of the
year number
Balance unvested and/or
unexerceseable at end of the year
number
*The executives have no access to the shares until expiry of 36 months of their employment with the company or an Associated Body Corporate from the date of grant of the shares. All shares are forfeited if the grantee resigns from the company prior to the expiry of 36 months from the date of grant of the shares.
Balance at end of the year number
Granted as compensati
on during the year number
Exercised during the year
number
Forfeited / Lapsed during
the year number
Balance vested and
unexercisable at end of the year number
Granted as compensati
on during the year number
Balance vested and
unexercisable at end of the year number
Balance unvested and exercisable at
end of the year number
Balance unvested and exercisable at
end of the year number
Balance at start of the
year number
Page 37
For
per
sona
l use
onl
y

9: REMUNERATION OF AUDITORS 2013 2012$ $
Audit servicesAuditing or reviewing the financial report 90,000 90,000
90,000 90,000
21,160 20,587 - - - 20,587
10: DIVIDENDS
Cents per Total Cents per Total Recognised Amounts Share $ Share $Fully Paid Ordinary Shares
Interim dividend for half year ended 31 Decemberfully franked at 30% corporate tax rate - - - -
Unrecognised AmountsFully paid ordinary shares
Final dividend for year ended 30 June, fully franked at 30% corporate tax rate - - - -
2013 2012Dividend franking account $ $
Amount of franking credits available for subsequent years 1,157,405 1,157,405
11: CASH AND CASH EQUIVALENTS
Cash on hand and at bank 46,117 193,388
Interest rate risk exposure
The Group’s and the parent entity’s exposure to interest rate risk is discussed in note 34.
12: TRADE AND OTHER RECEIVABLES
CURRENTTrade accounts receivable - third parties 11,121,432 7,956,963
(132,647) (221,538) 10,988,785 7,735,425
GST receivable 240,136 - Other receivables - 711,490
11,228,921 8,446,916
(a) An analysis of trade receivables that are past due but not impaired at the reporting date:
2013 2013 2012 2012Gross Allowance Gross Allowance
$ $ $ $Not past due 10,206,362 - 6,954,482 - Past due 1 - 30 days 738,588 - 511,179 - Past due 31 - 60 days 43,412 - 200,518 - Past 61 days 133,070 (132,647) 290,784 (221,538)
11,121,432 (132,647) 7,956,963 (221,538) (b) Impaired trade receivables
Other receivables are expected to be recoverable in full and are due from reputable companies.
2013 2012
Trade debtors are generally extended on credit terms of between 14 days to 60 days. As at 30 June 2013, current trade receivables of the Group with a nominal value of $133,070 (2012 - 290,784) were impaired. The amount of the allowance was $132,647 (2012 - $221,538). The individually impaired receivables mainly relate to customers, which are in unexpectedly difficult economic situations.
Less: allowance for impairment of receivables
Total current trade and other receivables
Trade receivables that are neither past due or impaired relate to long standing customers with a good payment history.
Amounts paid/payable to Moore Stephens Melbourne for:
Total current trade receivables
Amounts paid/payable to related practices of Moore Stephens Melbourne for:
Audit and taxation services from Moore Stephens NathanGeneral advice and services from Moore Stephens Nathan
No dividend has been declared or paid in relation to the financial years ended 30 June 2012 or 30 June 2013
Page 38
For
per
sona
l use
onl
y

Movements in the provision for impairment of receivables are as follows:
2013 2012$ $
At 1 July 221,538 218,401 Provision for impairment recognised / (reversed) during the year (46,642) 47,056 Receivables written off during the year as uncollectible (42,249) (43,919) At 30 June 132,647 221,538
(c) Fair value and credit risk
Due to the short term nature of these receivables, their carrying value is assumed to approximate their fair value.
(d) Foreign exchange and interest rate risk
13: INVENTORIES 2013 2012$ $
CURRENT6,910,808 6,814,753
Work in progress - at cost 1,186,786 978,095 5,119,883 6,460,769
13,217,477 14,253,617
14: OTHER CURRENT ASSETS
Prepayments 260,950 489,770
15: PROPERTY, PLANT AND EQUIPMENT
Freehold land - at valuation 3,910,000 3,910,000
Building - at independent valuation 12,390,000 12,390,000 Less: Accumulated depreciation (467,600) -
11,922,400 12,390,000
43,131,084 38,654,058 (12,656,288) (11,996,957) 30,474,796 26,657,101
8,958,151 6,648,812 Less: Accumulated depreciation (2,285,155) (1,667,450)
6,672,995 4,981,362 52,980,191 47,938,462
Finished goods - at cost
TOTAL PROPERTY, PLANT AND EQUIPMENT
Plant & equipment - at cost (i)
Payment terms on receivables past due but not considered impaired have not been renegotiated. The Group has been in direct contact with the relevant customers and are reasonably satisfied that payment will be received in full.
Raw material - at cost
Information about the Group's and the parent entity's exposure to foreign currency risk and interest rate risk in relation to trade and other receivables is provided in note 30.
Leased plant & equipment
Less: Accumulated depreciation
All of the Group's freehold land and buildings were revalued by an independent valuer in June 2012 and resulted in a net revaluation decrease of $109,213. Valuations were made on the basis of weighted depreciated values and open market values. The revaluation deficit net of applicable deferred income taxes was credited to an asset revaluation reserve in shareholders’ equity. As at 30 June 2013, if the cost model had been applied, the carrying value of the Group’s freehold land and buildings would have been $3,106,480 and $8,508,771 respectively.
Page 39
For
per
sona
l use
onl
y

Movements during the year Freehold land BuildingsPlant, Equipment
& OtherLeased Plant,
Equipment & OtherTotal
Consolidated Group $ $ $ $ $Carrying amount at 1 July 2011 4,337,775 13,765,396 25,704,680 4,775,742 48,583,594 Additions - 37,229 3,383,724 711,123 4,132,076 Impairment - - - - - Revaluation 165,600 (274,813) - - (109,213) Reclassification - (75,591) - - (75,591) Disposals (593,375) (421,575) (336,480) (111,783) (1,463,213) Depreciation and amortisation - (640,646) (2,094,824) (393,720) (3,129,190) Carrying amount at 30 June 2012 3,910,000 12,390,000 26,657,100 4,981,362 47,938,462
Carrying amount at 1 July 2012 3,910,000 12,390,000 26,657,100 4,981,362 47,938,462 Additions - - 5,811,311 2,309,338 8,120,649 Impairment - - - - - Revaluation - - - - - Reclassification - - - - - Disposals - - (118,496) - (118,496) Depreciation and amortisation - (467,600) (1,875,119) (617,705) (2,960,424) Carrying amount at 30 June 2013 3,910,000 11,922,400 30,474,796 6,672,995 52,980,191
16: INTANGIBLE ASSETS2013 2012
(a) Intangible summary and reconciliation $ $
Acquired intangible assets - indefinite life: Goodwill - at cost 2,079,000 2,079,000
5,120,641 3,785,739 7,199,641 5,864,739
Acquired intangible assets - finite life:14,519,212 12,229,190
Accumulated amortisation (632,109) (552,005) 13,887,103 11,677,185
Capitalised development costs - indefinite life:- 2,789,600
Products under development - at cost 2,849,652 1,089,412 2,849,652 3,879,012
Capitalised development costs - finite life:6,178,810 7,564,624
Accumulated amortisation (1,172,944) (652,598) 5,005,866 6,912,026
Total intangible assets 28,942,262 28,332,961
Reconciliation of Intangible Assets:
Goodwill Developed ProductsProducts under Development Total
2,079,000 26,119,298 1,360,555 29,558,853 - 499,649 - 499,649
Additions - 806,074 1,290,852 2,096,926 Transfer of commercialised product - 1,561,995 (1,561,995) - Disposals - (3,126,895) - (3,126,895) Impairment - (1,245) - (1,245) Amortisation - (694,327) - (694,327) Closing balance as at 30 June 2012 2,079,000 25,164,549 1,089,412 28,332,961
2,079,000 25,164,549 1,089,412 28,332,961 - - - -
Additions - 628,142 681,739 1,309,881 Transfer of commercialised product - - - - Disposals * - (100,130) - (100,130) Impairment - - - - Amortisation - (600,450) - (600,450) Closing balance as at 30 June 2013 2,079,000 25,092,111 1,771,151 28,942,262
Developed products - at cost
Probiotec Ltd has both acquired and capitalised trademarks, licenses, product development costs and product dossiers ("Developed Products"). Product dossiers incorporate formulations, registrations, Therapeutic Goods Administration (TGA) listings, stability and validation data, and manufacturing and testing procedures.
Developed products - at cost
Developed products - at cost
Developed products - at cost
* On 10 May 2013, the Company completed the sale of its animal nutrition brands, including all intellectual property and business assets associated with these brands. The sale price of $900,000 resulted in an item of other income (see Note 6 for details) and a reduction in intangible assets of $100,130 (being the intangible asset balance applicable to these brands).
Acquisitions
(i) Pre-commercialised plant and equipment
Plant and equipment amounting to $17,264,695 carried at cost relates to plant that is pre-commercialisation and therefore not depreciated. The plant is expected to be commissioned on or about September 2013. An impairment review has been carried out which the values the plant at a value higher than cost.
Opening balance as at 1 July 2011
Opening balance as at 1 July 2012Acquisitions
Page 40
For
per
sona
l use
onl
y

Estimated useful life of intangible assets
Goodwill 2013 2012$ $
Australian Dairy Proteins Pty Ltd 2,079,000 2,079,000 2,079,000 2,079,000
Impairment of Intangibles
Developed products
Impairment Disclosures
Year ended 30 June 2013
Pharmaceuticals and consumer
healtthContract
manufacturing Nutritional products Export salesResearch and development Total
2,079,000 - - - - 2,079,000 7,970,293 - - - - 7,970,293
Year ended 30 June 2012
Pharmaceuticals and consumer
healtthContract
manufacturing Nutritional products Export salesResearch and development Total
2,079,000 - - - - 2,079,000 6,420,949 - 100,130 1,143,672 - 7,664,751
2013 2012Probiotec BLC Pty Ltd 12.4% 12.4%Australian Dairy Proteins Pty Ltd 12.4% 12.4%Intangibles with indefinite useful lives 12.4% 12.4%
17: DEFERRED TAX ASSETS2013 2012
$ $Deferred tax assets is comprised as follows:
Temporary differences - provisions 447,051 461,050 Temporary differences - Property, plant & equipment 474,564 166,145 Temporary differences - leases 1,140,633 829,030 Temporary differences - other 815,842 168,765 Offset against deferred tax liabilities (2,139,538) (2,950,521) Tax losses 2,448,097 2,835,810
3,186,649 1,510,279
18: TRADE AND OTHER PAYABLES
Trade accounts payable 9,390,223 7,511,362 Sundry creditors & accruals 3,297,147 2,164,986 GST payable 1,080,214 537,374
13,767,584 10,213,722
(a) Fair value
2013 2012Current $ $
Euro 59,480 200,388 Great British Pounds 61,257 161,465 US Dollars 387,263 764 NZD - 1,121
508,000 363,738
As at 30 June 2013, no impairment charges were incurred in relation to developed products which no longer generate future cash flows sufficient to justify their carrying value.
Intangibles with indefinite useful lives
(b) Foreign exchange risk
Amounts payable in foreign currencies
Due to the short term nature of these payables, their carrying value is assumed to approximate their fair value.
The discount rates used to determine the value-in-use are:
Intangibles with indefinite useful livesGoodwill
Detailed information about the Group's and the parent entity's exposure to foreign currency risk in relation to trade and other payables is provided innote 30.
Intangible assets, comprising Developed Products and goodwill, have indefinite useful lives apart from Developed Products which are subject to a license with a specified term. Developed Products with a finite life have a term of 10 to 40 years. Developed Products with indefinite lives comprise trademarks and product dossiers. Developed Products with finite useful lives are amortised on a straight line basis over their effective life. The current amortisation charges for intangible assets are included under depreciation and amortisation expense in the income statement. The directors consider intangibles to have an indefinite life when, based on an analysis of all relevant factors, there is no foreseeable limit to the period over which the asset is expected to generate net cashflows for the group.
The amount of goodwill and intangible assets with indefinite useful lives allocated to each cash-generating unit for the purposes of annual impairment testing are:
Goodwill
Goodwill is tested annually for impairment, based on value-in-use calculations conducted using the assumptions outlined in note 7.
Breakdown of goodwill at year end:
Page 41
For
per
sona
l use
onl
y

19: INTEREST-BEARING LIABILITIES2013 2012
CURRENT $ $Secured borrowingsBank loans 22,288,610 20,915,968 Lease liabilities 1,342,501 863,448
23,631,111 21,779,416 NON-CURRENTSecured borrowingsBank loans 50,000 150,000 Lease liabilities 2,459,610 1,899,986
2,509,610 2,049,986 (a) Total current and non-current secured liabilities: Bank loans 22,338,610 21,065,968 Lease liabilities 3,802,111 2,763,434
26,140,721 23,829,402
Freehold land and building (Note 15) 15,832,400 16,300,000
Weighed average interest rate of 7.87% Secured by leased plant / assets
20: PROVISIONS
CURRENT
Leave entitlements (a) 1,056,165 969,210
NON-CURRENT
Leave entitlements (a) 434,007 348,006
Total provisions 1,490,172 1,317,216
21: DEFERRED TAXES
Deferred taxes is comprised as follows:
Deferred tax assets (note 17) 5,326,187 1,510,279Deferred tax liabilities - temporary differences (a) (7,084,358) (3,330,902)Net deferred tax liabilities (1,758,171) (1,820,623)
Deferred tax expense debit / (credit) to income tax expense 71,803 8,367
Deferred tax expense charged to equity - 73,761
(a) Deferred tax liabilities comprises:
Temporary differences - property, plant & equipment (2,001,899) (1,494,409)Temporary differences - capitalised development costs (3,219,745) (2,891,322)Temporary differences - other (1,862,715) 1,054,829
(7,084,358) (3,330,902)
(b) The carrying amount of the assets secured by a first registered mortgage:
(a) Provision for leave entitlements represents accrued annual leave along with an allowance for long service leave either earned by employees and not yet taken or partly earned. For partly earned long service leave, historical retention rates are used to determine likelihood of achieving fully vested long service leave.
The bank covenants require tangible net worth to exceed $35 million, an equity ratio of greater than 50%, debt service to EBITDA to exceed 1.25 and the ratio of financial indebtedness to EBITDA of less than 4 as at 30 June 2013, where EBITDA excludes extraordinary and/or non-cash events. The Group is in compliance with the bank convenants.
Finance leases are entered into with the Commonwealth Bank of Australia and Rabo Australia Limited. The lease terms are from 3 to 5 years. Finance leases may be extended at the expiry of their term by negotiation with the lease finance provider.
The Group’s and the parent entity’s exposure to interest rate risk is discussed in note 30.
The bank loans provided by Commonwealth Bank and Rabo Australia Limited are secured by cross guarantees between Probiotec Limited and its controlled entities.
(d) Finance lease liabilities:
(e) Interest rate risk exposure
(c) The bank loans are provided by Rabo Australia Limited and are secured by a registered first mortgage over all freehold property of the parent entity and the subsidiaries which in total have a carrying amount of $15,832,400 at 30 June 2013.
Page 42
For
per
sona
l use
onl
y

Reconciliation of net deferred tax liabilities: $
Opening as at 1 July 2011 (1,886,017)
Less : deferred tax expense (8,367) Less : deferred tax expense charged to equity 73,761 Closing as at 30 June 2012 (1,820,623)
Less : deferred tax expense 71,803 Less : deferred tax expense charged to equity (9,351)
Closing as at 30 June 2013 (1,758,171)
22: CONTRIBUTED EQUITY 2013 2012$ $
33,686,519 33,686,519
33,563,021 35,072,269Issue of shares - -
- (1,509,248)Equity raising expenses - -
33,563,021 33,563,021
2013 2012No. No.
Balance at the beginning of reporting period 52,929,356 52,929,356 Shares issued during the year - - Balance at end of the report date 52,929,356 52,929,356
(a) Capital management
2013 2012$ $
Total borrowings 26,140,721 23,829,402 Less cash and cash equivalents (46,117) (193,388)Net debt 26,094,604 23,636,014
33,686,519 33,686,518 Total capital employed 59,781,123 57,322,532
Gearing ratio 43.7% 41.2%
23: RESERVES 2013 2012$ $
Asset revaluation reserve 4,217,150 4,217,149
Equity translation reserve (210,355) (658,425)
Reconciliation of asset revaluation reserve
4,217,149 4,523,385 - (306,236)
4,217,149 4,217,149
Reconciliation of foreign currency translation reserve
(658,425) (681,306) 448,070 (362,886)
- 385,767 (210,355) (658,425)
Cancellation of shares held under Equity Compensation Plan
Asset revaluation reserves arise on the revaluation of non-current assets.
translation of net investment in foreign entities
Revaluation of assetsBalance at end of financial year
Balance at beginning of financial year
There were no changes to the Group's approach to capital management from 2012.
Reconciliation of fully paid ordinary shares
Balance at beginning of the financial year
Balance at end of financial year
Reconciliation of ordinary shares
The Group's objective is to maintain a strong capital base to ensure the Group continues as a going concern as well as to maintain optimal returns to shareholders and benefits for other stakeholders. Management also aims to maintain an optimal capital structure to reduce the cost of capital.
Ordinary shares participate in dividends and the proceeds on winding up of the parent entity in proportion to the numbers of shares.
The Group's debt and capital includes ordinary share capital and financial liabilities, supported by financial assets. The Group is not subject to externally imposed capital requirements other than those set out in Note 19.
The Group effectively manages the Group's capital by monitoring its gearing ratio. This ratio is calculated as net debt divided by total capital. Net debt is calculated as total borrowings less cash and cash equivalents. Total capital is calculated as ‘equity’ as shown in the balance sheet plus net debt.
The level of gearing in the Group is periodically reviewed by the Board to ensure that a responsible level of gearing is maintained. The directors consider that the Group is currently operating at a responsible gearing level. The gearing ratios at 30 June 2013 and 30 June 2012 were as follows:
Total contributed equity
Balance at beginning of financial year
Impairment of net investment in foreign entities
At the shareholders meeting each ordinary share is entitled to one vote when a poll is called, otherwise each shareholders has one vote on a show of hands.
Balance at end of financial year
52,929,356 (2012: 52,929,356) fully paid ordinary shares
Page 43
For
per
sona
l use
onl
y

24: COMMITMENTS
Lease commitmentsOperating leases
Non-cancellable operating Payable - minimum lease
Within one year 340,933 406,991 392,797 659,969
733,730 1,066,960
Finance leases commitmentsPayable - minimum lease
Within one year 1,469,812 1,026,150 2,584,332 2,020,602
Minimum lease payments 4,054,144 3,046,752 Less: Future finance charges (252,033) (283,318)
3,802,111 2,763,434
Current 1,342,501 863,448 Non-current 2,459,610 1,899,986
3,802,111 2,763,434
25: SHARE BASED PAYMENTS
(a) Incentive Option Scheme
CEO Employment Options for the year ended 30 June 2013
Grant Date Vesting dateExpiry
dateExercise price ($)
Balance at start of year
numberOptions granted
numberOptions forfeited/ exercised number
Balance at end of year number
Vested and exercisable at
end of year23.11.2012 23.11.2014 23.11.2015 0.70 - 1,500,000 - 1,500,000 - 05.08.2008 30.06.2010 30.06.2013 1.50 500,000 - (500,000) - - 05.08.2008 30.06.2011 30.06.2013 1.75 500,000 - (500,000) - - 05.08.2008 30.06.2012 30.06.2013 2.00 500,000 - (500,000) - -
1,500,000 1,500,000 (1,500,000) 1,500,000 - $ 1.75 $ 0.70 $ 1.75 $ 0.70 $ -
Commitments not recognised in the statement of financial position
Weighted average exercise price
The weighted average contractual life remaining on CEO options outstanding is 583 days as at balance date.
Later than one year but not later than 5 years
Later than one year but not later than 5 years
Representing lease liabilities (Note 19):
Leases are entered into with terms between 3 to 5 years. Operating leases are entered into for rental of sites, plant, equipment and vehicles. Finance leases are entered into for the purchase of various items of property, plant and equipment. Leased property is held at all of the group's Australian based manufacturing sites. Leases may be renewed by negotiation. No contingent rents are payable under any lease contract entered into. The group also entered into an operating lease for the rental of its manufacturing site in Dundalk, Ireland. This is a 20 year lease with a right for the group to terminate at any time after the expiry of the third year of the lease without penalty.
The weighted average interest rate implicit in the leases is 7.87%. The carrying value of assets purchased via leases is $6,672,995 (2012: $4,981,362).
Where a revalued asset is sold that portion of the reserve which relates to that asset, and is effectively realised, is transferred to retained earnings.
Foreign currency translation reserves arise upon the translation of net investments in foreign entities at balance date.
The Group has in place an option incentive scheme to encourage employees to share in the ownership of the company in order to promote the long-term success of the company as a goal shared by the employees. This scheme is designed to attract, motivate and retain eligible employees. These options are governed by the Probiotec Limited Employee Share Plan ("the plan"). Under the plan, participants may be granted options which vest if the participant remains in the employment of the group for a period of three years from the grant date. Participation in the plan is at the Board's discretion and no individual has a contractual right to participate in the plan or to receive any guaranteed amount of options. For details of options issued to key management personnel refer to the remuneration report.
Page 44
For
per
sona
l use
onl
y
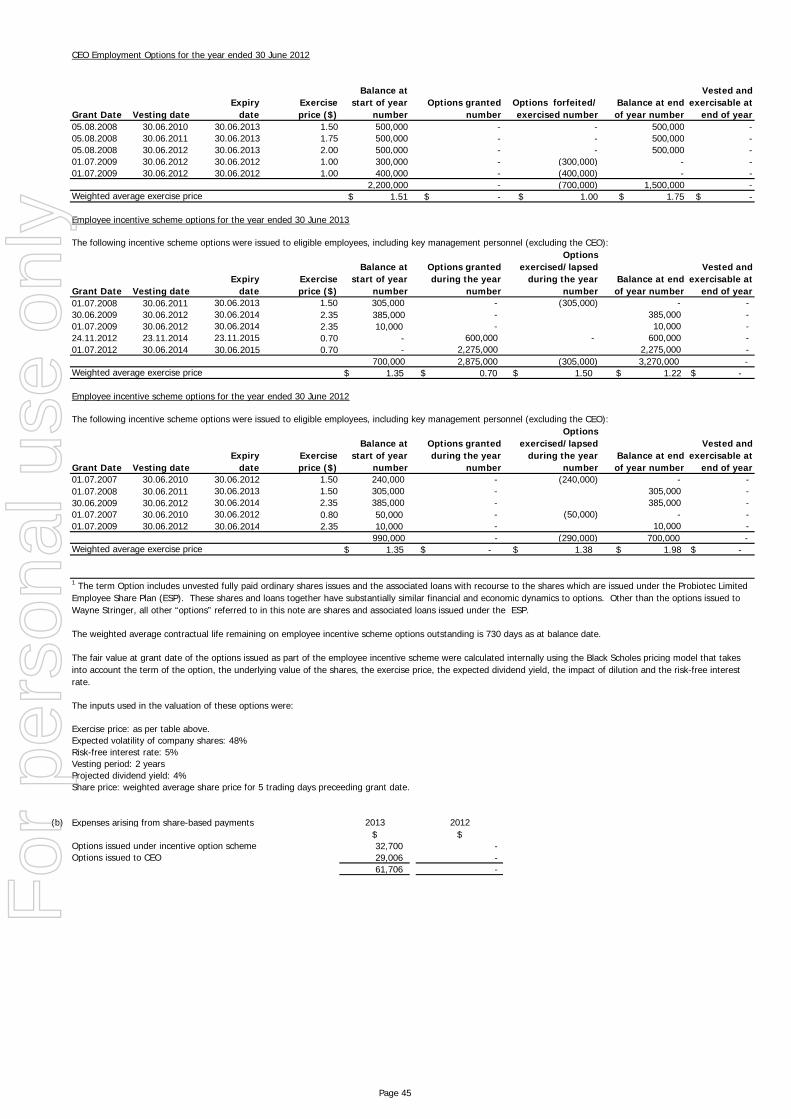
CEO Employment Options for the year ended 30 June 2012
Grant Date Vesting dateExpiry
dateExercise price ($)
Balance at start of year
numberOptions granted
numberOptions forfeited/ exercised number
Balance at end of year number
Vested and exercisable at
end of year05.08.2008 30.06.2010 30.06.2013 1.50 500,000 - - 500,000 - 05.08.2008 30.06.2011 30.06.2013 1.75 500,000 - - 500,000 - 05.08.2008 30.06.2012 30.06.2013 2.00 500,000 - - 500,000 - 01.07.2009 30.06.2012 30.06.2012 1.00 300,000 - (300,000) - - 01.07.2009 30.06.2012 30.06.2012 1.00 400,000 - (400,000) - -
2,200,000 - (700,000) 1,500,000 - $ 1.51 $ - $ 1.00 $ 1.75 $ -
Employee incentive scheme options for the year ended 30 June 2013
Grant Date Vesting dateExpiry
dateExercise price ($)
Balance at start of year
number
Options granted during the year
number
Options exercised/lapsed
during the year number
Balance at end of year number
Vested and exercisable at
end of year01.07.2008 30.06.2011 30.06.2013 1.50 305,000 - (305,000) - - 30.06.2009 30.06.2012 30.06.2014 2.35 385,000 - 385,000 - 01.07.2009 30.06.2012 30.06.2014 2.35 10,000 - 10,000 - 24.11.2012 23.11.2014 23.11.2015 0.70 - 600,000 - 600,000 - 01.07.2012 30.06.2014 30.06.2015 0.70 - 2,275,000 2,275,000 -
700,000 2,875,000 (305,000) 3,270,000 - $ 1.35 $ 0.70 $ 1.50 $ 1.22 $ -
Employee incentive scheme options for the year ended 30 June 2012
Grant Date Vesting dateExpiry
dateExercise price ($)
Balance at start of year
number
Options granted during the year
number
Options exercised/lapsed
during the year number
Balance at end of year number
Vested and exercisable at
end of year01.07.2007 30.06.2010 30.06.2012 1.50 240,000 - (240,000) - - 01.07.2008 30.06.2011 30.06.2013 1.50 305,000 - 305,000 - 30.06.2009 30.06.2012 30.06.2014 2.35 385,000 - 385,000 - 01.07.2007 30.06.2010 30.06.2012 0.80 50,000 - (50,000) - - 01.07.2009 30.06.2012 30.06.2014 2.35 10,000 - 10,000 -
990,000 - (290,000) 700,000 - $ 1.35 $ - $ 1.38 $ 1.98 $ -
(b) Expenses arising from share-based payments 2013 2012$ $
Options issued under incentive option scheme 32,700 - Options issued to CEO 29,006 -
61,706 -
Vesting period: 2 years
Exercise price: as per table above.
Share price: weighted average share price for 5 trading days preceeding grant date.Projected dividend yield: 4%
The inputs used in the valuation of these options were:
Expected volatility of company shares: 48%Risk-free interest rate: 5%
The following incentive scheme options were issued to eligible employees, including key management personnel (excluding the CEO):
Weighted average exercise price
The following incentive scheme options were issued to eligible employees, including key management personnel (excluding the CEO):
Weighted average exercise price
The fair value at grant date of the options issued as part of the employee incentive scheme were calculated internally using the Black Scholes pricing model that takes into account the term of the option, the underlying value of the shares, the exercise price, the expected dividend yield, the impact of dilution and the risk-free interest rate.
1 The term Option includes unvested fully paid ordinary shares issues and the associated loans with recourse to the shares which are issued under the Probiotec Limited Employee Share Plan (ESP). These shares and loans together have substantially similar financial and economic dynamics to options. Other than the options issued to Wayne Stringer, all other “options” referred to in this note are shares and associated loans issued under the ESP.
Weighted average exercise price
The weighted average contractual life remaining on employee incentive scheme options outstanding is 730 days as at balance date.
Page 45
For
per
sona
l use
onl
y

26: RELATED PARTY TRANSACTIONS AND BALANCES
Associated companies 2013 2012$ $
- 35,000
Key Management personnel
Identification of Related Parties - Ultimate Parent Entity
The ultimate parent company is Probiotec Limited which is incorporated in Australia.
27: NOTES TO THE STATEMENT OF CASH FLOWS
(a) Financing facilities with banks
Facility balance 1,500,000 1,500,000 Amount used (1,427,584) - Amount unused 72,416 500,000
Facility balance 23,340,000 26,147,500 Amount used (22,338,610) - Amount unused 1,001,390 26,147,500
Facility balance 12,000,000 12,000,000Amount used (3,802,111) (2,763,434) Amount unused 8,197,889 9,236,566
Facility balance 250,000 250,000Amount used (250,000) (250,000) Amount unused - -
(b)
596,869 1,249,380
Depreciation and amortisation 3,560,874 3,824,259 Loss / (profit) on sale of plant and equipment (155,375) (486,447)Loss / (profit) on sale of intangible assets (690,607) (2,856,205)Impairment and reclassification costs 617,639 1,378,193 Equity translation (634,951) (669,122)(Decrease)/increase in net deferred taxes (62,272) (65,394)(Increase)/decrease in inventories 1,036,140 559,644 (Increase)/decrease in trade and other receivables (2,782,006) 1,803,391
228,820 (74,465)Increase/(decrease) in trade and other payables 3,553,862 (1,258,069)Increase/(decrease) in tax liabilities - (3,071)
172,955 141,432
Net cash from operating activities 5,441,948 3,543,526
Non-cash financing and investing activities:
During the year the economic entity acquired plant and equipment with an aggregate value of $1,827,446 (2012: $273,081) by means of finance leases. These acquisitions are not reflected in the statement of cash flows.
Secured term loan and working capital facilities with banks:
There were no transactions between Key Management Personell and Probiotec Limited or any of its subsidiaries during the year ended 30 June 2012 other than as disclosed in note 8.
Profit after related income tax
Secured bank overdraft facility:
(Increase)/decrease in other current assets
Transactions between related parties are on normal commercial terms and conditions no favourable than those available to other parties unless otherwise stated. No balances have been written off and no provision for doubtful debts has been made against any balances with related parties.
Increase/(decrease) in provisions
Lease finance facilities:
Bank bill acceptance facility, reviewed annually:
Reconciliation of Profit from Ordinary Activities After Related Income Tax to Net Cash Flows From Operating Activities:
Payments were made to Pier Capital Pty Ltd, an entity associated with Mr Richard Kuo (director). These payments were for the provision of financial modelling services performed
Page 46
For
per
sona
l use
onl
y

28: EARNINGS PER SHARE2013 2012
$ $
Profit 596,869 1,249,379 Earnings used in the calculation of basic EPS 596,869 1,249,379
596,869 1,249,379
52,929,356 52,929,356
- -
52,929,356 52,929,356
Earnings per share:
1.1 2.4 1.1 2.4
(1.7) (1.9)(1.7) (1.9)
29:
83 Cherry Lane, Laverton VIC36 Bolong Road, Bomaderry NSW35 Norfolk Avenue, South Nowra NSWFinnabair Industrial Park, Dundalk, IRE
The principal places of businesses are:
COMPANY DETAILS
Probiotec Limited, 83 Cherry Lane, Laverton North VIC 3026
Earnings per share from discontinued operations:
Basic earnings per share (cents)
Earnings used in the calculation of dilutive EPS
Weighted average number of ordinary shares outstanding during the year used in calculation of basic EPS
Weighted average number of options outstanding
The registered office of the company is:
Weighted average number of ordinary shares outstanding during the year used in calculation of dilutive EPS
Diluted earnings per share (cents)
Basic earnings per share (cents)Diluted earnings per share (cents)
Page 47
For
per
sona
l use
onl
y

30: FINANCIAL INSTRUMENTS
FINANCIAL RISK MANAGEMENT
(a) Market risk
(i) Foreign exchange risk
The Group’s exposure to foreign currency risk at the reporting date was as follows:
2013 GBP NZD USD EUR$ $ $ $
Financial Assets
Trade and other receivables 855,014 93,065 23,118 51,574
Financial Liabilities
Trade and other payables 61,257 - 387,263 59,480
Net exposure 793,757 93,065 (364,145) (7,906)
2012 GBP NZD USD EUR$ $ $ $
Financial Assets
Trade and other receivables 684,939 274,436 83,227 154,444
Financial Liabilities
Trade and other payables 161,465 1,121 764 200,388
Net exposure 523,474 273,315 82,463 (45,944)
Sensitivity analysis
Profit Equity$ $
2013GBP (72,160) - NZD (12,139) - US dollars 33,104 - EUR 719 -
2012GBP (47,589) - NZD (35,650) - US dollars (7,497) - EUR 4,177 -
The Group is exposed to foreign exchange risk arising from various currency exposures when it undertakes sale and purchase of goods and services in currencies other than the Group’s measurement currency, primarily with respect to the British Pound, US dollar and the Euro. The Group seeks to mitigate the effect of its foreign currency exposure by maintaining foreign currency bank accounts that match the cash flows generated from and used by the underlying foreign currency transactions.
Based on the financial instruments held as at 30 June 2013, a 10% strengthening of Australian dollar against GBP, 15% strengthening of Australian dollar against the New Zealanddollar (NZD), 10% strengthening of Australian dollar against US dollar and a 10% strengthening of Australian Dollar against EUR at 30 June would have increased / (decreased) profitor loss and equity by the amounts shown below. This analysis assumes that all other variables remain constant. The analysis is performed on the same basis for 2012.
A 10% weakening of Australian dollar against GBP, 15% weakening of Australian dollar against NZD, 10% weakening of Australian dollar against US dollar and a 10% weakening ofAustralian dollar against EUR at 30 June would have the equal but opposite effect on GBP, US dollar and NZD to the amount shown above on the basis that other variables remainconstant.
The Group's financial instruments consist mainly of receivables, payables, bank loans and overdrafts, finance leases, loans from related parties, cash and short-term deposits.
Risk management policies are established to identify, assess and control the risks which affects its business and are reviewed regularly to reflect changes in market conditions and the Group's activities.
The Audit and Risk Committee overseas how management monitors compliance with the Group's risk management policies and procedures including the review of the adequacy of the risk management framework with respect to the risks faced by the Group.
There has been no change to the Group's exposure to foreign currency risk or the manner in which the Group manages and measures the risk from previous period.
The main risks the Group is exposed to through its financial instruments are foreign currency risk, interest rate risk, liquidity risk and credit risk.
Consolidated Group
The Board of Directors has overall responsiblity for establishment and oversight of the risk management framework. The Board has established the Audit and Risk Management Committee, which is responsible for approving and reviewing the Group's financial risk management strategy and policy. The Group manages its exposure to key financial risks in accordance with the Group's risk management policy approved by the Board of Directors to enable the risks to be balanced against appropriate rewards for the taking and managing of the risks.
Financial Risks
Page 48
For
per
sona
l use
onl
y

(ii) Interest rate risk
2013Weighted average
interest rate %1 year or less
Over 1 to 5 years
More than 5 years
Total
$ $ $ $Financial assets:
Cash 2.90 46,117 - - 46,117 Total financial assets 46,117 - - 46,117
Financial Liabilities:Loans and overdraft 5.80 22,288,610 50,000 - 22,338,610
Total financial liabilities 22,288,610 50,000 - 22,338,610
Net exposure (22,242,493) (50,000) - (22,292,493)
2012Weighted average
interest rate %1 year or less
Over 1 to 5 years
More than 5 years
Total
$ $ $ $Financial assets:
Cash 2.90 193,388 - - 193,388 Total financial assets 193,388 - - 193,388
Financial Liabilities:Loans and overdraft 7.49 20,915,968 150,000 - 21,065,968
Total financial liabilities 20,915,968 150,000 - 21,065,968
Net exposure (20,722,580) (150,000) - (20,872,580)
Sensitivity analysis
Profit$
20131% (222,925) 2% (445,850)
20121% (208,726) 2% (417,452)
(b) Liquidity risk
The Group's exposure to market interest rates relates primarily to the Group's long-term debt obligations. The level of debt is disclosed in note 19. Borrowings issued at variable ratesexpose the Group to cash flow interest rate risk. Borrowings issued at fixed rates expose the Group to fair value interest rate risk.
As at the reporting date, the Group had the following financial assets and liabilities exposed to variable interest rate risk:
The Group manages liquidity risk by continuously monitoring forecast and actual cash flows and to have sufficient liquidity to meet its liabilities when due.
In addition, the Group had access to approximately $9.2 million undrawn credit facilities available for use at the reporting date which would further reduce the liquidity risk. For further details see note 27(a).
The Group constantly analyses its interest rate exposure. The Group's current approach is to maintain approximately 10% - 50% of its borrowings at fixed rate using floating-to-fixedinterest rate swaps and/or fixed rate leasing to achieve this. Generally, the Group raises long-term borrowings at floating rates and swaps them into fixed rates that are lower thanthose available if the Group borrowed at fixed rates directly. Under the interest rate swaps, the Group agrees with other parties to exchange, at specified intervals (mainly quarterly),the difference between fixed contract rates and floating-rate interest amounts calculated by reference to the agreed notional principal amounts. These swaps are designated to hedgethe underlying debt obligations. During 2012 and 2013, the Group’s borrowings at variable rates were denominated in Australian Dollars.
Floating interest rate maturing
Liquidity risk is the risk that the Group may encounter difficulties rasing funds to meet commitments associated with financial instruments such as borrowing repayments.
Floating interest rate maturing
Based on the financial assets and liabilities held as at 30 June 2013, an increase in interest rates would have the following financial impact on the Group. This analysis assumes thatall other variables remain constant. The analysis is performed on the same basis for 2012.
A reduction in interest rates at 30 June would have the equal but opposite effect to the amount shown above on the basis that other variables remain constant.
The Group's objective is to maintain a balance between continuity of funding and flexibility through the use of available funding through an adequate amount of committed credit facilities such as bank overdrafts, bank loans and finance leases.
Page 49
For
per
sona
l use
onl
y

Maturities of financial liabilities
Consolidated Group
2013Carrying amount
Total contractual cash flows
Less than 6 months
6 - 12months
1 - 5years
$ $ $ $ $
13,767,584 13,767,584 13,446,584 321,000 - 3,802,111 4,054,144 734,906 734,906 2,584,332 22,338,610 22,338,610 675,000 675,000 20,988,610 39,908,305 40,160,338 14,856,490 1,730,906 23,572,942
2012
10,213,722 10,213,722 9,892,722 321,000 - 2,763,434 3,046,752 513,075 513,075 2,020,602 21,065,968 22,619,870 1,650,343 4,931,543 16,037,984 34,043,124 35,880,344 12,056,140 5,765,618 18,058,586
(c) Credit risk
(d) Price risk
(e) Fair values
Carrying Net Fair Carrying Net FairAmount Value Amount Value
$ $ $ $Financial Assets
Trade & other current receivables 11,228,921 11,228,921 8,446,915 8,446,915 Cash 46,117 46,117 193,388 193,388
11,275,038 11,275,037 8,640,303 8,640,303
Carrying Net Fair Carrying Net FairAmount Value Amount Value
Financial Liabilities $ $ $ $
Trade & others payables 13,767,584 13,767,584 10,213,722 10,213,722 Short term borrowings 22,288,610 22,288,610 20,915,968 20,915,968 Long term borrowings 50,000 50,000 150,000 150,000 Lease liability 3,802,111 3,802,111 2,763,434 2,763,434
39,908,305 39,908,305 34,043,124 34,043,124
Fair values are materially in line with carrying values for all financial assets and liabilities.
31: PARENT ENTITY INFORMATION
The following details information related to the parent entity, Probiotec Limited, at 30 June 2013.
The information presented here has been prepared using consistent financial statements.2013 2012
$ $Current assets 55,705,484 43,300,914 Non-current assets 22,143,159 26,197,619 Total Assets 77,848,643 69,498,533
Current Liabilities 34,000,313 26,168,552 Non-current liabilities 6,598,178 4,139,900 Total Liabilities 40,598,491 30,308,452
Contributed equity 35,072,269 35,072,269 Retained earnings (365,993) 1,573,936 Equity Compensation Plan (1,385,750) (1,385,750) Other reserve 3,929,626 3,929,626 Total equity 37,250,152 39,190,081
Profit / (loss) for the year (1,939,929) (6,336,147) Other Comprehensive income for the year - 192,771 Total comprehensive income for the year (1,939,929) (6,143,376)
The parent company has not guaranteed any loans held by its subsidiaries other than as part of the cross guarantees set out in Note 19 (c).
32: SUBSEQUENT EVENTS
Trade and other payables
Trade and other payables
There has not been any matter or circumstance that has arisen since the end of the financial year that has significantly affected or may significantly affect, the consolidated entity's operations, the results of those operations, or the consolidated entity's state of affairs in financial years after the financial year.
The parent entity is subject to contractual obligations in regards to the group's interest bearing liabilities as detailed in note 19. All finance leases held by the group (see note 24) are held by the parent entity.
2013
The fair values of loans and amounts due are determined by discounting the cash flows, at market interest rates of similar borrowings, to their present value. For forward exchange contracts the fair value is the recognised unrealised gain or loss at reporting date determined from the current forward exchange rates for contracts with similar maturities.
Non-derivatives financial liabilities
Non-derivatives financial liabilities
The Group's policy is to trade with recognised and credit-worthy third parties and as such no collateral is required. The Group manages its credit risk by assessing the credit quality and financial position of its customers including past experience and other factors. In addition, receivable balances are monitored on an ongoing basis minimising the exposure to bad debts. The Group has also taken out a credit insurance policy that applies to all approved debtors. This policy provides insurance for 90% of the invoiced value outstanding based on pre-defining maximum credit limits agreed between the group and the insurer.
For other assets and other liabilities the fair value approximates their carrying value. No financial assets and financial liabilities are readily traded on organised markets in standardised form other than listed investments, forward exchange contracts and interest rates swaps. Financial assets where the carrying amount exceeds fair values have not been written down as the economic entity intends to hold these assets to maturity.
Fixed borrowings (including finance leases)
Fixed borrowings (including finance leases)
There has been no change to the Group's method of calculating fair values of financial assets and financial liabilities since last year.
2012
2013
Credit risk arises from the financial assets of the Group, which comprise cash and cash equivalents as well as credit exposures to customers, including outstanding receivables from subsidiaries and financial guarantees given to entities within the Group. The Group's exposure to credit risk arises from potential default of the counter party, with a maximum exposure equal to the carrying amount of these instruments. Exposure at reporting date is addressed in Note 12 .
Variable borrowings
The Group is not exposed to any commodity and equity securities price risk. Most of the raw materials are sourced through importing agents and major suppliers in the local milk powder industry and the Group does not actively trade in equity investments.
2012
Variable borrowings
Page 50
For
per
sona
l use
onl
y

33: SEGMENT INFORMATION
(a)
Business Segments Segment nameSegment 1 Pharmaceuticals and consumer healthSegment 2 Contract manufacturingSegment 3 Nutritional productsSegment 4 Export salesSegment 5 Research & Development
Year ended 30 June 2013 Segment 1 Segment 2 Segment 3 Segment 4 Segment 5 Consolidated$ $ $ $ $ $
- - 2,239,077 - - 2,239,077 35,445,162 23,729,543 1,036,212 7,131,966 - 67,342,884
Total segmental revenue 35,445,162 23,729,543 3,275,289 7,131,966 - 69,581,961
- - (875,617) - (875,617) 6,067,092 2,977,244 419,861 202,711 (2,127,247) 7,539,661
Total segmental profit 6,067,092 2,977,244 (455,756) 202,711 (2,127,247) 6,664,044
Interest (1,598,713) Unallocated other income -
(4,396,661)
(5,995,374)
1,544,289
(875,617)
668,672
Year ended 30 June 2012 Segment 1 Segment 2 Segment 3 Segment 4 Segment 5 Consolidated$ $ $ $ $ $
- - - 418,814 - 418,814 35,706,162 17,514,134 4,484,168 8,341,725 - 66,046,188
Total segmental revenue 35,706,162 17,514,134 4,484,168 8,760,539 - 66,465,002
- - (979,870) - (979,870) - - - (1,245) - (1,245) 6,791,353 2,024,184 710,068 987,065 (2,183,790) 8,328,880
Total segmental profit 6,791,353 2,024,184 710,068 5,951 (2,183,790) 7,347,765
Interest (2,011,984) Unallocated other income 92,010
(4,170,046)
(6,090,020)
2,237,617
(979,870)
1,257,747
(b) Reconciliation of segmental revenue to total revenue 2013 2012
$ $
Segmental revenue 69,581,960 66,465,002
Interest received 10,241 119,657
Total revenue 69,592,201 66,584,659
(c) Segment revenue
Loss from continuing activities before income tax
Loss from discontinued operations before income tax
Sales between segments (if they occur) are carried out at arm's length and are eliminated on consolidation. The revenue from external parties reported to the board is measured in a manner consistent with that in the statement of comprehensive income.
Revenues from external customers are derived from the sale of products on both a wholesale and business-to-business basis from each of the business segments outlined earlier in this note. A breakdown of revenue is provided in the tables above.
Description of segments
Management has determined the operating segments based on reports reviewed by the executive management committee for making strategic decision. The executive management committee comprises the chief executive officer, chief financial officer and divisional managers. The committee monitors the business based on product and geographic factors and have identified 5 reportable segments.
Pharmaceuticals and consumer health
The pharmaceuticals and consumer health segment involves the sale of branded pharmaceutical products (both owned and licensed brands) along with the sale of a range of weight management products throughout Australia.
Nutritional products
Contract manufacture
The Research and Development segment is involved in the research and development of a range of innovative products and drugs for both domestic and international markets. This segment also involves the development of intellectual property to support the commercialisation of product in development by undertaking research, clinical trials, regitartions and other activities.
The Contract manufacturing segment involves the contract manufacturing of pharmaceutical, food and animal nutrition products on behalf of domestic and international pharmaceutical and food companies.
The nutritional products segment is involved in the sale of human and animal nutrition products along with the sale of ingredients and additives for use in the pharmaceutical and food industries.
Revenue from external customers
Unallocated corporate expenses
Total unallocated income / (expense)
Segmental profit from continuing operations
Revenue from discontinued operations
Profit from continuing activities before income tax
Loss from discontinued operations
Revenue from discontinued operations
Export sales
The export sales segment is involved in the sale of products to markets outside of Australia. Product sales included in this segment are excluded from other segment figures.
Research and Development
Revenue from external customers
Unallocated corporate expenses
Loss from discontinued operations before income tax
Loss from discontinued operations
Total unallocated income / (expense)
Segmental profit from continuing operations
Impairment costs - continuing operations
Page 51
For
per
sona
l use
onl
y

(d) Segment profit
(e) Entity wide information
The gross revenue in each region where significant export revenue is achieved for the year was:
New European United StatesAustralia Zealand Union of America Other
$ $ $ $ $
Gross Revenue for year ended 30 June 2013 61,634,728 1,396,592 5,696,227 68,454 785,960
Gross Revenue for year ended 30 June 2012 57,185,897 1,257,331 6,893,480 574,804 553,490
(f) Segment assets
No disclosure of segment assets has been made as this information is not provided to the chief decision maker on a regular basis.
Revenues of approximately $9,305,372 and $5,512,136 (2012: $10,371,556 and $8,672,626) are derived from two major external customers included in the pharmaceutical and consumer health and contract manufacturing segments respectively.
The board assesses the performance of the operating segments based on a measure of adjusted EBIT. This measurement basis excludes the effects of non-recurring expenditure from the operating segments such as restructuring costs, legal expenses and goodwill impairments when the impairment is the result of an isolated, non-recurring event. This measurement basis also exlcudes the effects of any non-recurring items of revenue or income. Interest income and expenditure are not allocated to segments, as this type of activity is driven by the central treasury function, which manages the cash position of the group.
Page 52
For
per
sona
l use
onl
y

Page 53
PROBIOTEC LIMITED AND ITS CONTROLLED ENTITIES ACN 075 170 151 DECLARATION BY DIRECTORS The directors of the company declare that: 1. The financial statements, comprising the statement of comprehensive income, statement
of financial position, statement of cash flows, statement of changes in equity, accompanying notes, are in accordance with the Corporations Act 2001 and: (a) comply with Accounting Standards and the Corporations Regulations 2001; and (b) give a true and fair view of the financial position as at 30 June 2013 and of the
performance for the year ended on that date of the consolidated entity. 2. The company has included in the notes to the financial statements an explicit and
unreserved statement of compliance with International Financial Reporting Standards. 3. In the directors’ opinion, there are reasonable grounds to believe that the company will
be able to pay its debts as and when they become due and payable.
4. The remuneration disclosures included in pages 7 to 15 of the directors’ report (as part of audited Remuneration Report), for the year ended 30 June 2013, comply with section 300A of the Corporations Act 2001.
5. The directors have been given the declarations by the chief executive officer and chief
financial officer required by section 295A. This declaration is made in accordance with a resolution of the Board of Directors and is signed for and on behalf of the directors by:
…………………………………………………………………………… Charles Wayne Stringer Director Dated at Laverton this 22nd day of August 2013
For
per
sona
l use
onl
y

Moore Stephens ABN 39 533 589 331. Liability limited by a scheme approved under Professional Standards Legislation. An independent member of Moore Stephens International Limited – members in principal cities throughout the world. The Melbourne Moore Stephens firm is not a partner or agent of any other Moore Stephens firm. And is a separate partnership in Victoria.
INDEPENDENT AUDITOR’S REPORT
TO THE MEMBERS OF PROBIOTEC LIMITED Report on the Financial Report We have audited the accompanying financial report of Probiotec Limited, which comprises the statement of financial position as at 30 June 2013, the statement of comprehensive income, the statement of changes in equity and the statement of cash flows for the year then ended, notes comprising a summary of significant accounting policies and other explanatory information, and the directors’ declaration of the consolidated entity comprising the company and the entities it controlled at the year’s end or from time to time during the financial year. Directors’ Responsibility for the Financial Report
The directors of the company are responsible for the preparation of the financial report that gives a true and fair view in accordance with Australian Accounting Standards and the Corporations Act 2001 and for such internal control as the directors determine is necessary to enable the preparation of the financial report that is free from material misstatement, whether due to fraud or error. In Note 1, the directors also state, in accordance with Accounting Standard AASB 101 Presentation of Financial Statements, that the financial statements comply with International Financial Reporting Standards. Auditor’s Responsibility
Our responsibility is to express an opinion on the financial report based on our audit. We conducted our audit in accordance with Australian Auditing Standards. Those standards require that we comply with relevant ethical requirements relating to audit engagements and plan and perform the audit to obtain reasonable assurance about whether the financial report is free from material misstatement. An audit involves performing procedures to obtain audit evidence about the amounts and disclosures in the financial report. The procedures selected depend on the auditor’s judgement, including the assessment of the risks of material misstatement of the financial report, whether due to fraud or error. In making those risk assessments, the auditor considers internal control relevant to the entity’s preparation and fair presentation of the financial report in order to design audit procedures that are appropriate in the circumstances, but not for the purpose of expressing an opinion on the effectiveness of the entity’s internal control. An audit also includes evaluating the appropriateness of accounting policies used and the reasonableness of accounting estimates made by the directors, as well as evaluating the overall presentation of the financial report. We believe that the audit evidence we have obtained is sufficient and appropriate to provide a basis for our audit opinion. Independence
In conducting our audit, we have complied with the independence requirements of the Corporations Act 2001. We confirm that the independence declaration required by the Corporations Act 2001, which has been given to the directors of Probiotec Limited would be the same terms if given to the directors as at the time of this auditor’s report.
Level 10, 530 Collins Street
Melbourne VIC 3000
T +61 (0)3 8635 1800 F +61 (0)3 8102 3400
www.moorestephens.com.au
For
per
sona
l use
onl
y
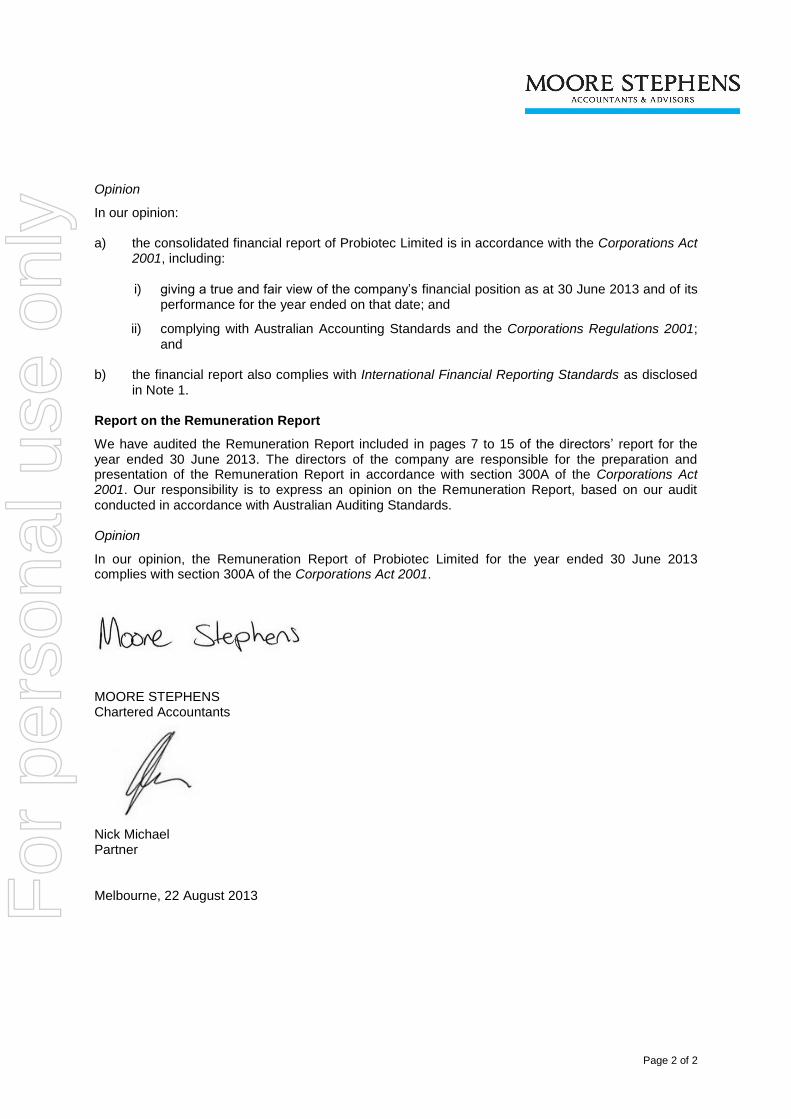
Page 2 of 2
Opinion
In our opinion: a) the consolidated financial report of Probiotec Limited is in accordance with the Corporations Act
2001, including: i) giving a true and fair view of the company’s financial position as at 30 June 2013 and of its
performance for the year ended on that date; and
ii) complying with Australian Accounting Standards and the Corporations Regulations 2001; and
b) the financial report also complies with International Financial Reporting Standards as disclosed
in Note 1. Report on the Remuneration Report
We have audited the Remuneration Report included in pages 7 to 15 of the directors’ report for the year ended 30 June 2013. The directors of the company are responsible for the preparation and presentation of the Remuneration Report in accordance with section 300A of the Corporations Act 2001. Our responsibility is to express an opinion on the Remuneration Report, based on our audit conducted in accordance with Australian Auditing Standards. Opinion
In our opinion, the Remuneration Report of Probiotec Limited for the year ended 30 June 2013 complies with section 300A of the Corporations Act 2001. MOORE STEPHENS Chartered Accountants Nick Michael Partner Melbourne, 22 August 2013 F
or p
erso
nal u
se o
nly


