Embed Size (px)
Citation preview

TROY IRVIN - CORPORATE DEVELOPMENT OFFICER DAN HOWE - CHIEF GEOLOGIST Corporate Presentation September 2016
A growing mid-tier gold miner
For
per
sona
l use
onl
y

Qualification This presentation has been prepared by Saracen Mineral Holdings Limited (Saracen or the Company) based on information from its own and third party sources and is not a disclosure document. No party other than the Company has authorised or caused the issue, lodgement, submission, despatch or provision of this presentation, or takes any responsibility for, or makes or purports to make any statements, representations or undertakings in this presentation. You should be aware that as an Australian company with securities listed on the ASX, the Company is required to report reserves and resources in Australia in accordance with the Australasian Code for Reporting of Exploration Results, Mineral Resources and Ore Reserves (The JORC Code 2012 Edition ) ("JORC Code"). You should note that while the Company's reserve and resource estimates comply with the JORC Code, they may not comply with the relevant guidelines in other countries. This is a presentation about geology, geoscientific interpretation, geoscientific speculation, gold deposits, gold potential, engineering, infrastructure, potential values, costs, risks, and related matters pertinent to Saracen’s present and future activities as a publicly listed mineral exploration and production company. It includes forecasts, predictions, targets and estimates of future expenditures which may vary over time. It is uncertain if further exploration will result in the determination of a Resource or Reserve. Where exploration, evaluation, operational and feasibility study expenditure estimates and budgets amounts are presented herein, ongoing prioritisation and scaling of expenditures will be subject to results and, where applicable, scheduling changes. Targeted production and other outcomes are subject to change, and may not eventuate, depending on the results of ongoing performance and assessment of data. All Reserves and Resources as referred to herein are in accordance with the JORC Code. Refer to last slide of this presentation for the relevant Competent Person statements. Resources are inclusive of Reserves. Certain statements contained in the Presentation Materials, including information as to the future financial or operating performance of the Company and its projects, are forward looking statements. Such forward looking statements: a) are necessarily based upon a number of estimates and assumptions that, while considered reasonable by the Company, are inherently subject to significant technical, business, economic, competitive, political and
social uncertainties and contingencies; b) involve known and unknown risks and uncertainties that could cause actual events or results to differ materially from estimated or anticipated events or results reflected in such forward looking statements; and c) may include, among other things, statements regarding estimates and assumptions in respect of prices, costs, results and capital expenditure, and are or may be based on assumptions and estimates related to future
technical, economic, market, political, social and other conditions. The Company disclaims any intent or obligation to publicly update any forward looking statements, whether as a result of new information, future events or results or otherwise. The words “believe”, “expect”, “anticipate”, “indicate”, “contemplate”, “target”, “plan”, “intends”, “continue”, “budget”, “estimate”, “may”, “will”, “schedule” and similar expressions identify forward looking statements. All forward looking statements contained in the Presentation Materials are qualified by the foregoing cautionary statements. Recipients are cautioned that forward looking statements are not guarantees of future performance and accordingly recipients are cautioned not to put undue reliance on forward looking statements due to the inherent uncertainty therein. The Presentation Materials do not purport to be all inclusive or to contain all information about the Company. This presentation is not a prospectus, disclosure document or other offering document under Australian law or under any other law. It is provided for information purposes and is not an invitation nor offer of shares for subscription, purchase or sale in any jurisdiction. Take care to question and carefully evaluate any judgments you might make, on the basis of the Presentation Materials, as to the value of Saracen and its securities. This presentation is not intended to provide the sole or principal basis of any investment or credit decision or any other risk evaluation and may not be considered as a recommendation by Saracen or its officers. Any investor reading the Presentation Materials should determine its interest in acquiring securities in Saracen on the basis of independent investigations that it considers necessary, prudent or desirable. Saracen and its officers do not accept any liability for any loss or damage suffered or incurred by any investor or any other person or entity however caused (including negligence) relating in any way to this presentation including, without limitation, the information contained in it, any errors or omissions however caused by any other person or entity placing any reliance on the Presentation Materials, its accuracy or reliability.
2
For
per
sona
l use
onl
y

Corporate overview Corporate structure (ASX:SAR)
Shares 806.2m
Share price A$1.375 At 5
September 2016
Market cap A$1.1b (US$831m)
Liquidity 30-day ADV 7.7m shares
Major indices ASX200, GDXJ, MSCI Small cap
Cash and bullion A$40m (US$30m) At 30 Jun
2016
Debt Nil
Hedging 283koz @ A$1,548/oz or ~19% of Reserve
Mineral Resources 7.6 Moz As at 30 Jun 2015 Ore Reserves 1.5 Moz
Board Non-Executive Chairman Geoff Clifford Managing Director Raleigh Finlayson Non-Executive Director Mark Connelly Non-Executive Director Martin Reed Non-Executive Director Samantha Tough
Owne
rship
geog
raph
ic
Subs
tantia
l sha
reho
lders
45%
22%
4% 3% 3%
0.3% 22% Institutional - Australia
Institutional - North AmericaInstitutional - UKInstitutional - Europe (ex-UK)Institutional - AsiaInstitutional - OtherRetail
* Australian dollars converted at an exchange rate of A$0.75 per $1US
Executive Chief Financial Officer Gerry Kaczmarek Chief Operating Officer Craig Bradshaw Chief Geologist Daniel Howe Corporate Development Officer Troy Irvin
3
15.3%
7.0% 6.0%
71.7%
Van Eck GlobalWroxbyKarara CapitalOthersF
or p
erso
nal u
se o
nly

Australia’s newest mid-tier gold miner • Production to hit ~300kozpa by the June Q 2017, AISC
declining to A$950/oz in FY20, driving substantial increases in cash-flow
• Two operational centres in Western Australia: Carosue Dam (NE of Kalgoorlie) – Outstanding operational
track record, multiple high-margin underground mines, ~160-170koz pa
Thunderbox (SE of Leinster) – Acquired from Norilsk, large-scale simple open pit, ~130-140koz pa, multiple growth opportunities including bulk underground mining potential and high grade “sweeteners”
• Large endowment – 7.6Moz Resources, 1.5Moz Reserves • A$42m exploration budget: Aimed at growing production
and mine life, supported by outstanding new drill results
Thunderbox
Carosue Dam
PERTH
Kalgoorlie
Growing volume, margin and endowment 4
For
per
sona
l use
onl
y

Plan the mine, mine the plan
157 155 170 170 160
31 125 130 130 140
$1,095
$1,250 $1,150
$1,050 $950
$0
$500
$1,000
$1,500
0
100
200
300
FY16 (A) FY17 (F) FY18 (F) FY19 (F) FY20 (F)
AISC
(A$/
oz)
Prod
uctio
n (k
oz)
CDO (koz) TBO (koz) Group AISC ($/oz)
Five-year production outlook (83% classified as Reserves)
Note - Refer to the ASX announcement dated 27th July 2016 – “Tripling of exploration budget to grow production and life”
Met or exceeded guidance four years straight 5
For
per
sona
l use
onl
y

Growth in an ex-growth world
Sector leading fully funded growth
Expanding volumes, declining costs, rising margins 6
CAGR (compound annual growth rate) based on broker consensus 2 year forward production forecasts for 51 precious metals stocks (primary listings CN 27, AU 11, US 5, LN 4, SJ 4) SAR AU data – FY16A 188.6koz, FY17F 290koz, FY18F 314koz Average CAGR by primary listing - CN 8.0%, AU 11.0%, US -0.2%, LN 5.9%, SJ -2.1%)
-20%
-10%
0%
10%
20%
30%
40%
50%
2 yea
r CAG
R
BIGS (>1Moz pa) Average 2.2%
SMALLS (<300koz pa) Average 6.6%
MIDS (300koz - 1Moz pa) Average 9.6%
Sara
cen
(SAR
AU)
29%
For
per
sona
l use
onl
y

More than meets the eye…
Five-year outlook
Growth Deposits discovered within last 30 years (v ~100 years Goldfields)
Average depth of SAR underground mines ~350m (v peers ~680m)
FY17 exploration budget A$42m (v A$25m over the past 2 years)
All deposits open at depth and along strike
Backed in by an A$42M drilling investment in FY17
Red October
Karari
Thunderbox
Deep South
King of the Hills
7
For
per
sona
l use
onl
y

Tripling of exploration budget Judicious allocation of capital
• Recent discovery costs have been sub-A$10/oz e.g. Karari underground
The most aggressive drilling campaign in SAR’s 10 year history 8
Project TOTAL $m
ThunderboxThunderbox Zone A UG $9.3
King of the Hills $3.3
Carosue DamRed October $2.5
Deep South $6.8
Karari $9.1
Whirling Dervish $8.2
GreenfieldsRegional $2.8
TOTAL $m $42.0$8.6 $9.4 $15.4 $8.6
8.2
9.3
3.3
2.8
Sep-16 Qtr Dec-16 Qtr Mar-17 Qtr Jun-17 Qtr
2.5
9.1
6.8
Denotes drilling underway For
per
sona
l use
onl
y

Carosue Dam - Overview
• 2.4Mtpa CIL plant, operated since 2010 • FY17 outlook 155koz • Ore sources include:
Karari – Shallow, multiple lodes, growing discovery next to the plant, open in all directions
Deep South – Shallow, stoping underway, open in all directions
Red October – Small volume / high grade “sweetener”, shallow Lionfish discovery open down plunge, reinvigorated exploration effort underway targeting extensions and repeats
Ore stockpile – ~32koz contained, mining cost sunk
• Outstanding exploration – Extensive land holding in world-class ~23Moz Laverton District, 180km strike of two key regional structures
Carosue Dam
PERTH
Kalgoorlie
Consistent performer with growth opportunities straddling the mill 9
For
per
sona
l use
onl
y

Carosue Dam – We have baseload! Underwritten by growth deposits: • Highly productive Karari
UG mine ~500m from the mill • Whirling Dervish UG
option (technically advanced, permitted)
<1km from the mill
• Plus 32koz stockpile At the mill • Augmented by higher
grade Deep South ~80km from the mill
10
For
per
sona
l use
onl
y

Carosue Dam – Drill momentum
Aggressive drilling Dedicated drill platforms installed with “shelf life” Recent drill results (over last month) include: 24.0m @ 5.4g/t 12.4m @ 5.6g/t 12.8m @ 4.4g/t 34.2m @ 3.2g/t 36.0m @ 3.0g/t 42.8m @ 2.7g/t Twin declines being developed Open at depth and along strike
Karari
Deep South Aggressive drilling Dedicated drill platforms planned with “shelf life” Deepest hole i.e. 18m @ 7.4g/t (outside Reserve) Recent drill results (over last month) include: 4.7m @ 14.4g/t 8.5m @ 10.6g/t 5.2m @ 8.8g/t 3.1m @ 7.2g/t 6.9m @ 5.3g/t 11.0m @ 4.3g/t Open at depth and along strike Think big… aiming to extend both by +300m 11
For
per
sona
l use
onl
y

Thunderbox – We’ve only just begun
• Developed ahead of schedule and under budget • 2.5Mtpa plant, A$63m capex funded from cashflows • Stage 1 open pit – 596koz contained, ~A$1000/oz AISC
(US$750/oz), 4-5 year mine life • Fixed price contracts cover ~50% diesel usage over next
two years (A$0.62/litre v Feasibility Study A$0.90) • Multiple growth opportunities beyond the initial open pit:
• Bulk UG potential - Open down-plunge, deepest hole 55m @ 3.0g/t Au, Feasibility Study underway (AMC Consultants)
• KOTH high grade - Drilling and mining commenced
• Kailis high grade – 3.0g/t open pit, AISC A$880/oz
• Thunderbox D Zone – Near surface northern cut-back
Robust, long-life open pit operation with outstanding underground potential 12
For
per
sona
l use
onl
y

Thunderbox – Gets better every day Simple, robust open pit: • A Zone
• High productivity, low cost
• Top down method (no pit
staging)
• As the mine progresses:
Strip ratio falls (waste:ore) Grade rises AISC falls Cash flow increases dramatically • Ditto C Zone
i.e. AISC falls and cash flow increases dramatically as the mine progresses
13
For
per
sona
l use
onl
y

Thunderbox – Drilling the next chapter Potential >10 year mine life: • +30,000m drilling program has
commenced
• Targeting down-plunge A Zone
• Follow-up rich hole 55m @ 3.0g/t (TBDR019)
• Drilling will aim to define a multi-year bulk underground mine
• AMC underground feasibility study ongoing
14
For
per
sona
l use
onl
y

Thunderbox – Grade is king… of the Hills Sleeping giant... awakens: • Mining and drilling underway
• Very large mineralised system
• High grade results proximal to
existing infrastructure will be assessed for mining
• Exploration drilling continues to the south of the mine
15
For
per
sona
l use
onl
y

Thunderbox – Grade is king… of the Hills Sleeping giant... awakens: • Plethora of high grade drill results
over last month: Near mine:
14.3m @ 21.2g/t (ETW 6.5m) 9.0m @ 12.4g/t (ETW 5.0m) 1.5m @ 37.2g/t (ETW 1.0m) 4.0m @ 35.3g/t (ETW 2.5m)
Southern exploration:
0.3m @ 126.0g/t (ETW 0.3m) 0.3m @ 110.0g/t (ETW 0.3m) 0.9m @ 80.4g/t (ETW 0.9m) 0.6m @ 51.4g/t (ETW 0.6m) 1.3m @ 19.1g/t (ETW 1.3m) 0.4m @ 34.1g/t (ETW 0.4m) 1.0m @ 65.2g/t (ETW 1.0m) 2.7m @ 10.4g/t (ETW 2.7m) 4.4m @ 7.6g/t (ETW 4.4m)
16
For
per
sona
l use
onl
y

Carosue Dam - Exploration upside Land of opportunity: • Two high quality structural zones • Limited exploration budget in recent years due to
focus on Thunderbox development…
• …enabled the technical knowledge to prepare and de-risk an aggressive campaign
• Multiple high quality targets systematically ranked
Plethora of high quality targets 17
For
per
sona
l use
onl
y

Carosue Dam – Exploration upside North Lake Carey… in the purple circle:
• Neighbours (AngloGold, Goldfields,
Dacian) are extremely active
• With good reason!
Wallaby +8Moz Sunrise Dam +10Moz Granny Smith +2Moz Mt Morgans +3Moz, growing • Looking for the next big one
• SAR drilling in June half 2017
The hottest exploration destination in Australia 18
For
per
sona
l use
onl
y

Saracen is a progressive business
Aiming for gold sector leadership
* Based on 7 brokers with FY17F consensus production of 290koz and gold price of A$1869/oz
19
From… …to…
Delivery Met or exceeded guidance 4 years straight Meeting or exceeding guidance
Operating cash flow FY16A A$110m Consensus FY17F A$180m*
Production ~150koz pa from 1 operation >300koz pa from 2 operations
Balance sheet Retired debt, internally funded Thunderbox Putting cash on balance sheet
Growth Thunderbox OP, two new UG mines Thunderbox UG, KOTH etc
Returns Much improved Consistent TSR outperformance
Share register Australian-centric Global
Exploration Minimal Aggressive - Trebled!For
per
sona
l use
onl
y

APPENDIX A – Ore Reserves – June 2015 tonnes g/t oz tonnes g/t oz tonnes g/t oz
Karari 1 UG 2,213,000 3.0 212,000 2,213,000 3.0 212,000Whirling Dervish UG 950,000 3.0 90,000 950,000 3.0 90,000Carosue Dam Sub-Total 0 0.0 0 3,163,000 3.0 302,000 3,163,000 3.0 302,000Million Dollar OP 1,390,000 1.2 53,000 1,390,000 1.2 53,000Wallbrook OP 1,765,000 1.3 71,000 1,765,000 1.3 71,000Enterprise OP 357,000 2.2 26,000 357,000 2.3 26,000Porphyry Sub-Total 0 0.0 0 3,512,000 1.3 150,000 3,512,000 1.3 150,000Deep South UG 979,000 4.0 125,000 979,000 4.0 125,000
Safari Bore Sub-Total 0 0.0 0 979,000 4.0 125,000 979,000 4.0 125,000Red October UG 225,000 6.0 43,000 225,000 6.0 43,000
0 0.0 0Red October Sub-Total 0 0.0 0 225,000 6.0 43,000 225,000 6.0 43,000Stockpiles S 2,296,000 1.1 81,000 2,296,000 1.1 81,000Carosue Dam Ore Reserves 2,296,000 1.1 81,000 7,879,000 2.4 620,000 10,175,000 2.1 701,000Thunderbox OP 10,908,000 1.7 596,000 10,908,000 1.7 596,000
Thunderbox Sub-Total 0 0.0 0 10,908,000 1.7 596,000 10,908,000 1.7 596,000Bannockburn OP 4,352,000 1.5 206,000 4,352,000 1.5 206,000
Bannockburn Sub-Total 0 0.0 0 4,352,000 1.5 206,000 4,352,000 1.5 206,000Kailis * OP 998,000 3.0 95,000 998,000 3.0 95,000
King of the Hills Sub-Total 0 0.0 0 998,000 3.0 95,000 998,000 3.0 95,000All Thunderbox Ore Reserves 0 0.0 0 16,258,000 1.7 897,000 16,258,000 1.7 897,000
Total Ore Reserves 2,296,000 1.1 81,000 24,137,000 2.0 1,517,000 26,433,000 1.9 1,598,000
Thun
derb
ox Thun
derb
oxBa
nnoc
kbur
nKi
ng o
f the
Hi
lls
Total
Caro
sue
Dam
Caro
sue
Dam
Porp
hyry
Safa
ri Bo
reRe
d O
ctob
er
All
Location District Deposit Mine Type
Proved Reserves Probable Reserves Total Ore Reserves
1 Karari UG Ore Reserves reflect the update from April 2016 – For more information refer to ASX announcement made on 13 April 2016 titled, “Resource and Reserve upgrade, Carosue Dam set for long life”. The report is available to view on the ASX Website at www.asx.com.au and on the Company’s website at www.saracen.com.au.
20
For
per
sona
l use
onl
y

APPENDIX A – Mineral Resources – June 2015 tonnes g/t oz tonnes g/t oz tonnes g/t oz tonnes g/t oz
Whirling Dervish O/P 5,619,000 1.5 277,000 305,000 1.1 11,000 5,924,000 1.5 288,000Whirling Dervish U/G 4,400,000 2.4 355,000 1,624,000 2.7 147,000 6,024,000 2.6 502,000Karari O/P 136,000 1.2 5,000 191,000 1.5 9,000 327,000 1.3 14,000Karari U/G 1 7,404,000 2.6 625,000 2,105,000 3.5 234,000 9,509,000 2.8 859,000Monty's/Elliots 123,000 2.2 9,000 1,422,000 1.8 83,000 374,000 1.6 19,000 1,919,000 1.8 111,000Twin Peaks 40,000 2.3 3,000 564,000 3.4 61,000 80,000 2.8 7,000 684,000 3.2 71,000North West 332,000 0.8 9,000 691,000 0.8 18,000 1,023,000 0.8 27,000Pinnacles 387,000 2.1 27,000 26,000 1.4 1,000 413,000 2.1 28,000Blue Manna 1,074,000 1.5 51,000 1,074,000 1.5 51,000Carosue Dam Sub-Total 163,000 2.3 12,000 20,264,000 2.2 1,442,000 6,470,000 2.4 497,000 26,897,000 2.3 1,951,000Porphyry O/P 702,000 1.1 25,000 7,262,000 1.0 239,000 1,551,000 1.0 48,000 9,515,000 1.0 312,000Porphyry U/G 488,000 5.0 78,000 243,000 2.9 23,000 731,000 4.3 101,000Million Dollar 9,270,000 1.0 298,000 1,639,000 0.9 47,000 10,909,000 1.0 345,000Wallbrook 1,286,000 1.1 44,000 6,775,000 1.0 216,000 4,037,000 1.1 141,000 12,098,000 1.0 401,000Margarets 48,000 1.4 2,000 634,000 1.1 22,000 682,000 1.1 24,000Enterprise 218,000 2.1 15,000 310,000 2.2 22,000 142,000 2.2 10,000 670,000 2.2 47,000Porphyry Sub-Total 2,206,000 1.2 84,000 24,153,000 1.1 855,000 8,246,000 1.1 291,000 34,605,000 1.1 1,230,000Safari Bore 780,000 2.0 50,000 1,358,000 2.3 100,000 672,000 2.3 50,000 2,810,000 2.2 200,000Deep South O/P 355,000 2.5 29,000 0 355,000 2.5 29,000Deep South U/G 1,256,000 4.0 163,000 430,000 4.0 55,000 1,686,000 4.0 218,000Deep Well 68,000 2.2 5,000 15,000 2.0 1,000 83,000 2.2 6,000Safari Bore Sub-Total 780,000 2.0 50,000 3,037,000 3.0 297,000 1,117,000 3.0 106,000 4,934,000 2.9 453,000Red October O/P 251,000 1.7 14,000 251,000 1.7 14,000Red October U/G 9,000 8.6 2,000 152,000 16.8 82,000 33,000 13.9 15,000 194,000 15.9 99,000Thin Lizzie 325,000 1.3 14,000 325,000 1.3 14,000Tin Dog 1,284,000 1.3 54,000 1,284,000 1.3 54,000Bulldog 1,529,000 0.9 44,000 1,529,000 0.9 44,000Crimson Belle 916,000 1.4 41,000 577,000 1.3 24,000 1,493,000 1.4 65,000Butcher Well 2,692,000 1.7 144,000 2,280,000 1.7 126,000 4,972,000 1.7 270,000Red October Sub-Total 9,000 6.9 2,000 4,011,000 2.2 281,000 6,028,000 1.4 277,000 10,048,000 1.7 560,000Ore Stockpiles 2,296,000 1.1 81,000 2,296,000 1.1 81,000Sub-grade stockpiles 3,460,000 0.6 69,000 3,460,000 0.6 69,000Carosue Dam Mineral Resources 8,914,000 1.0 298,000 51,465,000 1.7 2,875,000 21,861,000 1.7 1,171,000 82,240,000 1.6 4,344,000
Total
Caro
sue
Dam
Caro
sue
Dam
Porp
hyry
Safa
ri Bo
reRe
d O
ctob
erAl
l
Location District Deposit Measured Indicated Inferred
1 Karari UG Mineral Resources reflect the update from April 2016 – For more information refer to ASX announcement made on 13 April 2016 titled, “Resource and Reserve upgrade, Carosue Dam set for long life”. The report is available to view on the ASX Website at www.asx.com.au and on the Company’s website at www.saracen.com.au.
21
For
per
sona
l use
onl
y
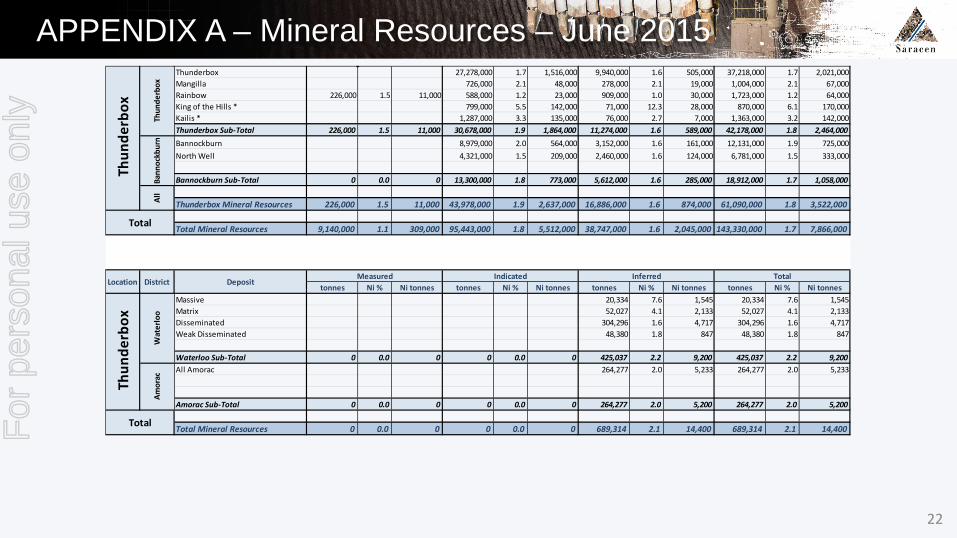
APPENDIX A – Mineral Resources – June 2015 Thunderbox 27,278,000 1.7 1,516,000 9,940,000 1.6 505,000 37,218,000 1.7 2,021,000Mangilla 726,000 2.1 48,000 278,000 2.1 19,000 1,004,000 2.1 67,000Rainbow 226,000 1.5 11,000 588,000 1.2 23,000 909,000 1.0 30,000 1,723,000 1.2 64,000King of the Hills * 799,000 5.5 142,000 71,000 12.3 28,000 870,000 6.1 170,000Kailis * 1,287,000 3.3 135,000 76,000 2.7 7,000 1,363,000 3.2 142,000Thunderbox Sub-Total 226,000 1.5 11,000 30,678,000 1.9 1,864,000 11,274,000 1.6 589,000 42,178,000 1.8 2,464,000Bannockburn 8,979,000 2.0 564,000 3,152,000 1.6 161,000 12,131,000 1.9 725,000North Well 4,321,000 1.5 209,000 2,460,000 1.6 124,000 6,781,000 1.5 333,000
Bannockburn Sub-Total 0 0.0 0 13,300,000 1.8 773,000 5,612,000 1.6 285,000 18,912,000 1.7 1,058,000
Thunderbox Mineral Resources 226,000 1.5 11,000 43,978,000 1.9 2,637,000 16,886,000 1.6 874,000 61,090,000 1.8 3,522,000
Total Mineral Resources 9,140,000 1.1 309,000 95,443,000 1.8 5,512,000 38,747,000 1.6 2,045,000 143,330,000 1.7 7,866,000
tonnes Ni % Ni tonnes tonnes Ni % Ni tonnes tonnes Ni % Ni tonnes tonnes Ni % Ni tonnesMassive 20,334 7.6 1,545 20,334 7.6 1,545Matrix 52,027 4.1 2,133 52,027 4.1 2,133Disseminated 304,296 1.6 4,717 304,296 1.6 4,717Weak Disseminated 48,380 1.8 847 48,380 1.8 847
Waterloo Sub-Total 0 0.0 0 0 0.0 0 425,037 2.2 9,200 425,037 2.2 9,200All Amorac 264,277 2.0 5,233 264,277 2.0 5,233
Amorac Sub-Total 0 0.0 0 0 0.0 0 264,277 2.0 5,200 264,277 2.0 5,200
Total Mineral Resources 0 0.0 0 0 0.0 0 689,314 2.1 14,400 689,314 2.1 14,400Total
Deposit Measured Indicated Inferred Total
Thun
derb
ox
Wat
erlo
oAm
orac
Thun
derb
ox
Thun
derb
oxBa
nnoc
kbur
nAl
l
Total
Location District
22
For
per
sona
l use
onl
y

APPENDIX A – Competent persons Competent Persons Statements The information on Mineral Resources and Ore Reserves has been extracted from the ASX announcements titled “2015 Mineral Resources and Ore Reserves” dated 15 October 2015, and “Resource and Reserve upgrade, Carosue Dam set for long life” dated 13 April 2016 . These reports are available to view on the ASX Website at www.asx.com.au and on the Company’s website at www.saracen.com.au.The Company confirms that it is not aware of any new information or data that materially affects the information included in the original market announcements and, in the case of estimates of Mineral Resources and Ore Reserves, that all market assumptions and technical assumptions underpinning the estimates in the relevant market announcements continue to apply and have not materially changed. The Company confirms that the form and context in which the Competent Person’s findings are presented have not been materially modified from the original market announcements. The information in the report to which this statement is attached that relates to Exploration Results and Mineral Resources related to Gold is based upon information compiled by Mr Daniel Howe, a Competent Person who is a member of The Australasian Institute of Mining and Metallurgy and the Australian Institute of Geoscientists. Daniel Howe is a full-time employee of the company. Daniel Howe has sufficient experience that is relevant to the style of mineralisation and type of deposit under consideration and to the activity being undertaken to qualify as a Competent Person as defined in the 2012 Edition of the ‘Australasian Code for Reporting of Exploration Results, Mineral Resources and Ore Reserves’. Daniel Howe consents to the inclusion in the report of matters based on his information in the form and context in which it appears. The information in the report to which this statement is attached that relates to Exploration Results and Mineral Resources related to Nickel is based upon information compiled by Mr Lynn Widenbar, a Competent Person who is a member of The Australasian Institute of Mining and Metallurgy. Lynn Widenbar is a consultant to Saracen Mineral Holdings. Lynn Widenbar has sufficient experience that is relevant to the style of mineralisation and type of deposit under consideration and to the activity being undertaken to qualify as a Competent Person as defined in the 2012 Edition of the ‘Australasian Code for Reporting of Exploration Results, Mineral Resources and Ore Reserves’. Lynn Widenbar consents to the inclusion in the report of matters based on his information in the form and context in which it appears. The information in the report to which this statement is attached that relates to underground Ore Reserves at Red October, Deep South, Karari and Whirling Dervish is based upon information compiled by Stephen King, a Competent Person who is a member of The Australasian Institute of Mining and Metallurgy. Stephen King is a full-time employee of the company. Stephen King has sufficient experience that is relevant to the style of mineralisation and type of deposit under consideration and to the activity being undertaken to qualify as a Competent Person as defined in the 2012 Edition of the ‘Australasian Code for Reporting of Exploration Results, Mineral Resources and Ore Reserves’. Stephen King consents to the inclusion in the report of matters based on his information in the form and context in which it appears. The information in the report to which this statement is attached that relates to all open pit Ore Reserves relating to Gold based upon information compiled by Christopher Burton, a Competent Person who is a member of The Australasian Institute of Mining and Metallurgy. Christopher Burton is a full-time employee of the company. Christopher Burton has sufficient experience that is relevant to the style of mineralisation and type of deposit under consideration and to the activity being undertaken to qualify as a Competent Person as defined in the 2012 Edition of the ‘Australasian Code for Reporting of Exploration Results, Mineral Resources and Ore Reserves’. Christopher Burton consents to the inclusion in the report of matters based on his information in the form and context in which it appears.
23
For
per
sona
l use
onl
y

Contact Details Troy Irvin
Corporate Development Officer Phone: +61 8 6229 9100
Email: [email protected] Website: www.saracen.com.au
For
per
sona
l use
onl
y