Embed Size (px)
Citation preview

Global Responsible Investors1
Global Responsible Investors
November 2019
For
per
sona
l use
onl
y

Global Responsible Investors2
For
per
sona
l use
onl
y

Global Responsible Investors3
Company Results
Year ended 30 September 2018
Year ended 30 September 2019
Pre-Tax Operating Profit $ 5.29m $ 1.96m
Post-Tax Operating Profit $ 3.81m $ 1.41m
Pre-Tax NTA per share $1.1746 $1.1491
Post Tax NTA per share $1.1543 $1.1299
Amount
Total Dividend 2019 2 c per share
Interim Dividend(Payment date: 19 July 2019)
1 c per share
Final Dividend(Payment date: 17 December 2019) 1 c per share
Profits reserve* $ 5.07m
Company Performance Dividends
Past performance is not indicative of future performance.
*As at 30 September 2019.
NTA per share at 21 November 2019 was $1.1652 pre-tax and $1.1414 post-tax
For
per
sona
l use
onl
y

Global Responsible Investors4
• Consideration of Financial Statements and Reports
• Resolution 1: Remuneration Report
• Resolution 2: Re-election of JoAnna Fisher as a Director
• Resolution 3: Re-election of Jack Lowenstein as a Director
AGM AgendaF
or p
erso
nal u
se o
nly

Global Responsible Investors5
To receive the Financial Report, Directors’ Report and Auditor’s Report for the
Company for the financial year ended 30 September 2019.
There is no requirement for shareholders to approve these reports.
Financial StatementsF
or p
erso
nal u
se o
nly

Global Responsible Investors6
“That the Remuneration Report of the Company
(which forms part of the Directors' Report) for the
financial year ended 30 September 2019 be
adopted.”
RESOLUTION 1 – Remuneration reportF
or p
erso
nal u
se o
nly

Global Responsible Investors7
RESOLUTION 2 – Re-election of JoAnna Fisher
“That Ms JoAnna Fisher, who retires by rotation in
accordance with rule 6.7 of the Company’s
Constitution and, being eligible, offers herself for
re-election, be re-elected as a director of the
Company.”
For
per
sona
l use
onl
y

Global Responsible Investors8
RESOLUTION 3 – Re-election of Jack Lowenstein
“That Mr Jack Lowenstein, who retires by rotation
in accordance with rule 6.7 of the Company’s
Constitution and, being eligible, offers himself for
re-election, be re-elected as a director of the
Company.”
For
per
sona
l use
onl
y

Global Responsible Investors9
For
per
sona
l use
onl
y

Global Responsible Investors10
Morphic Asset / Ellerston Capital
WELL-ESTABLISHED
BUSINESS
Founded in 2004
Over A$5 billion in FUM*
DIVERSE CLIENT
BASE
Across Sovereign wealth, institutional, private
banking, family office and retail
ALIGNED WITH
OUR INVESTORSMajority owned by principals and staff
ROBUST
INSTITUTIONAL
INFRASTRUCTURE
Best of breed systems and technologies
supporting portfolio management, client service
and compliance
*Source: Ellerston Capital as at August 2019.
HIGHLY SUCCESSFUL, AUSTRALIAN BOUTIQUE INVESTMENT MANAGER
• Ellerston Capital (ECL) acquired Morphic Asset
Management (MAM) in May 2019
• MAM team moved to ECL offices in June 2019
• MAM investment team to continue running
Morphic Funds
For
per
sona
l use
onl
y

Global Responsible Investors11
Source: Global Sustainable Investment Review, GSIA, 2018
Growth of RI Assets by Region 2014-2018
Europe 9,885€ 11,045€ 12,306€ 12% 11%
United States 6,572$ 8,723$ 11,995$ 33% 38%
Canada (in CAD) 1,011$ 1,505$ 2,132$ 49% 42%
Australia/New Zealand (in AUD) 203$ 707$ 1,033$ 248% 46% 50%
Growth
2014-2016
Growth
2016-201820182014 2016
Compound
Annual
Growth Rate
2014-2018
Growth Per Period
6%
16%
21%
For
per
sona
l use
onl
y

Global Responsible Investors12
1 Global Sustainable Investment Review, GSIA, 2018; 2 Morgan Stanley3 T. Verheyden (Arabesque Asset Management & Vrije Universiteit Brussel); Z. Nagy (MSCI Inc.), M. Statman (Santa Clara University); 4 RIAA; 5 Governance & Accountability Institute, Inc.,2018; 6 Australian Council of Superannuation Investors (ACSI), 2018; 7 UBS; 8 Bonds and Climate Change www.climatebonds.net September 2018
of Millennials interested in responsible investing2
86%
The explosion of interest for Responsible Investing
50%p.a. FUM growth in Australia /NZ1
$866 bnFUM in Australia1
$30.7 tnResponsible Investing Assets Globally1
ZER0Cost to returns3
34%Global FUM Growth 2016-20181
90%of Australians expect responsible super4
85%of S&P500
Companies Publish Sustainability
Reports5
90%of ASX200
Companies report on ESG risks and
opportunities6$1.8 bn
Growth Opportunity7
5x"ESG" Google Trends Search Interest since 20047
1,900PRI Signatories globally7
$1.4 tnclimate-aligned bond universe8
For
per
sona
l use
onl
y

Global Responsible Investors13
Source: Bridge Ventures, 2012
TraditionalEthical Investing
Impact InvestingThematic “Sustainable”
Investing
Environment Social Governance (ESG)
InvestingPhilanthropy
“Defined by what we don’t do”.• Values-driven• Sector exclusions
Focussed on ESG risksand opportunities• ESG & Fundamental
analysis• “Active ownership”
Funding for direct and measurable environmental / social goals that require some financial trade-off
Focussed on areas where social and environmental needs create financial opportunities
Impact-only:social and environmental needs require 100% financial trade-off
E.g.: “Church exclusion of “Sin stocks”, Zero carbon Fund
E.g.: ‘Best-in-class’ SRI Fund
E.g.: Clean Energy FundE.g.: Private Equity funding Micro-finance
E.g.: Philanthropic foundations
Financial returns? X
Responsible Investing stylesF
or p
erso
nal u
se o
nly

Global Responsible Investors14
“Negative Screen” excludes buying shares in:
Can short screened out stocks and sectors
Ethical compliance check first, before investment research
ArmamentsTobacco & alcohol
GamblingCoal & Uranium Mining
Oil & gasIntensive animal farming & aquaculture
Rain forest & old growth logging
14
We seek out “positive” investments that support:
Water quality Air quality Conservation Renewable energy
Our approach to Responsible InvestingF
or p
erso
nal u
se o
nly

Global Responsible Investors15
Source: PRI 2019 Assessment Report for Morphic
Morphic received top rating in Australasia for Responsible Investing
For
per
sona
l use
onl
y

Global Responsible Investors1616
TO YOUTH MENTAL HEALTH TO AUSTRALIAN BIODIVERSITY
FIRST DONATION FROM MANAGING THE TRIUM MORPHIC ESG L/S FUND
Rainforest Alliance
For
per
sona
l use
onl
y

Global Responsible Investors17
For
per
sona
l use
onl
y
Global Responsible Investors18
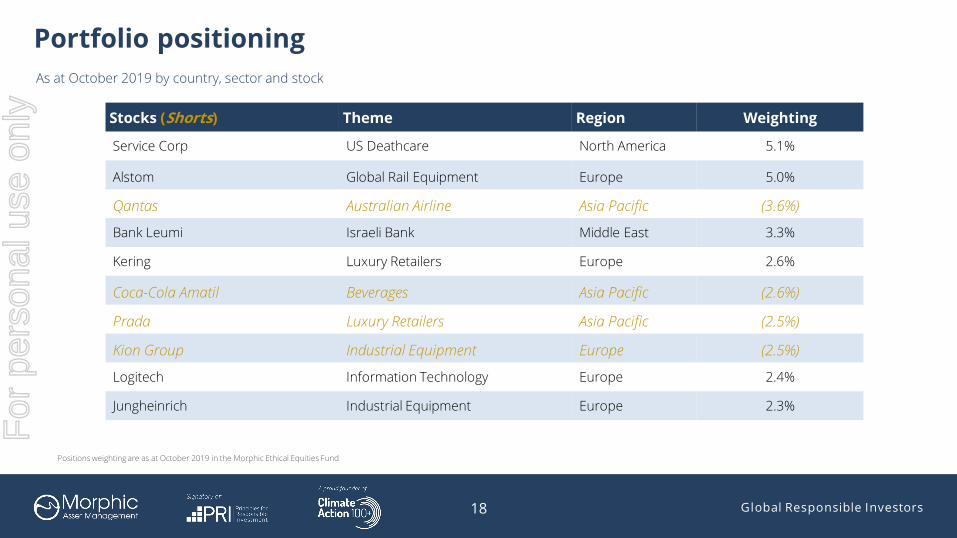
Stocks (Shorts) Theme Region Weighting
Service Corp US Deathcare North America 5.1%
Alstom Global Rail Equipment Europe 5.0%
Qantas Australian Airline Asia Pacific (3.6%)
Bank Leumi Israeli Bank Middle East 3.3%
Kering Luxury Retailers Europe 2.6%
Coca-Cola Amatil Beverages Asia Pacific (2.6%)
Prada Luxury Retailers Asia Pacific (2.5%)
Kion Group Industrial Equipment Europe (2.5%)
Logitech Information Technology Europe 2.4%
Jungheinrich Industrial Equipment Europe 2.3%
As at October 2019 by country, sector and stock
Portfolio positioning
Positions weighting are as at October 2019 in the Morphic Ethical Equities Fund
For
per
sona
l use
onl
y

Global Responsible Investors19
The Big Train that will: Alstom (France)
Source: Bloomberg, Team Analysis
Alstom share price performanceEUR, January 2015 – October 2019
Alstom (ALO)
World leader in train technology.
Cheaply priced for its growth prospects.
Pioneer of hydrogen fuel-powered, zero-emission regional train.
Member of Dow Jones Sustainability Indices.
10
20
30
40
50
Jan
-15
Au
g-1
5
Ma
r-1
6
Oct
-16
Ma
y-1
7
De
c-1
7
Jul-
18
Feb
-19
Se
p-1
9
Alstom share price Morphic ownership
For
per
sona
l use
onl
y

Global Responsible Investors20
When Investor Engagement Bears Fruit: Panalpina (Switzerland)
Source: Bloomberg, Team Analysis
Panalpina share price performanceCHF, March 2018 - September 2019
Panalpina (PWTN SW)
Global logistics provider with low margins but improving performance.
Non-independent Chairman steps aside to improve corporate governance. This resolved a “flag” and suggested improvement.
Engagement with Management, BoD & other shareholders via letters.
100
120
140
160
180
200
220
240
Ma
r 1
8
Ma
y 1
8
Jul 1
8
Se
p 1
8
No
v 1
8
Jan
19
Ma
r 1
9
Ma
y 1
9
Jul 1
9
Se
p 1
9
Panalpina share price Morphic ownership
For
per
sona
l use
onl
y

Global Responsible Investors21
Prada’s Devilish Governance Is Out Of Fashion
Source: Bloomberg, Team Analysis
Kering and Prada share price performanceUSD, November 2017 - October 2019
Kering (KER FP)
Strong, well managed Gucci brand
Reasonably priced on 21x 2019 EPS
Low gearing, good governance
Prada (1913 HK)
Struggling brand
Expensive at over 30x 2019 EPS
High gearing, poor governance1.0
2.0
3.0
4.0
5.0
6.0
7.0
200
250
300
350
400
450
500
550
600
650
No
v-1
7
Jan
-18
Mar-
18
May-
18
Jul-
18
Se
p-1
8
No
v-1
8
Jan
-19
Mar-
19
May-
19
Jul-
19
Se
p-1
9
Kering Share Price (LHS) Prada Share Price (RHS)
Morphic Ownership Morphic Short Ownership
For
per
sona
l use
onl
y

Global Responsible Investors22
9.1% 9.7%
14.8%
18.5%20.1% 20.1%
25.3%
0.0%
5.0%
10.0%
15.0%
20.0%
25.0%
30.0%
MSCI Emerging
Markets
MSCI Asia Ex
Japan
MSCI Japan MSCI Australia MSCI AC World MSCI Europe MSCI USA
2019 Thus far – Markets rebound but Asia lags
Asian Equities fail to bounce back
Markets returns by region USD, January 2019 – 25 November 2019
Sources: Bloomberg, Morphic Asset Management
For
per
sona
l use
onl
y

Global Responsible Investors23
Outlook – Updates on July Anti-predictions
Anti-PredictionsAs at 1 July 2019
How are we going?As at 25 November 2019
Status
The Federal Reserve will NOT cut interest
rates three times (or 75bps) in 2019
The Federal Reserve cut interest rates in October
for the third time this year.
Indian long-term bond rates will NOT end
above 7%
Currently at 6.5%. Low inflation is the good news
reason for getting this right, sluggish growth is the
bad news
✔
Reported Chinese Growth will NOT fall
below 6%
Latest YoY growth at 6.2%. Central government
has retained enough levers to offset impacts of
trade antagonism with the US
✔
Brexit will NOT matterWith no proposal for Brexit likely to be put before
the UK parliament in 2019, this one looks safe.✔
The Australian dollar will NOT finish below
the current low of 2019 (67.4c)Currently at 68c. ✔F
or p
erso
nal u
se o
nly

Global Responsible Investors24
For
per
sona
l use
onl
y

Global Responsible Investors25
• Objectives
o Outperform the Index in Australian dollars over rolling three year
o Preserve capital in falling markets through hedging
• Strategy
o Long/Short global equities with a Small & Mid Cap bias
o Ethically screened equities
o Can hold cash (up to 50%) to protect capital
• Style
o Value and Momentum factors
Platform availability
MGOF Performance* As at October 2019
1 Month 3 Months CYTD 3 Years p.a. 5 Years p.a. ITD p.a.
-0.18% 1.29% 15.04% 10.67% 9.61% 14.27%
Morphic Global Opportunities Fund 2018 Finalist“Best Global Equity Fund of the Year”
* Past performance is not indicative of future performance.** Calculations are based on exit price with distributions reinvested, after ongoing fees and expensesbut excluding individual tax, member fees and entry fees (if applicable). Fund Inception 2 August 2012.
Morphic Global Opportunities Fund Performance of $10,000** AUD, Aug 2012 – Oct 2019
10,000
13,000
16,000
19,000
22,000
25,000
28,000
Au
g-1
2
Jan
-13
Jun
-13
No
v-1
3
Ap
r-1
4
Se
p-1
4
Feb
-15
Jul-
15
De
c-1
5
Ma
y-1
6
Oct
-16
Ma
r-1
7
Au
g-1
7
Jan
-18
Jun
-18
No
v-1
8
Ap
r-1
9
Se
p-1
9
For
per
sona
l use
onl
y

Global Responsible Investors26
Key Facts As at October 2019
Platform availability
MEC Performance2 As at October 2019
1 Month 3 Months 6 Months CYTD ITD (p.a.)
-0.50% 0.78% 1.55% 12.46% 6.25%
Pre-tax NTA $ 1.1436
Share price $ 0.875
Dividend paid3 $0.02
1 Net Tangible Asset Value before tax. Past performance is not indicative of future performance.2 Performance is net of investment management fees, before company admin costs and taxes.3 Annual dividend per share.
MEC Share Price vs NTA1 AUD, weekly, April 2017 – 21 November 2019
Morphic Ethical Equities Fund (ASX: MEC) Update 2018 Finalist“New Fund of
the Year”
0.80
0.85
0.90
0.95
1.00
1.05
1.10
1.15
1.20
Pre-tax per share Share Price
$1.1652
$0.97
For
per
sona
l use
onl
y

Global Responsible Investors27
For
per
sona
l use
onl
y

Global Responsible Investors28
For
per
sona
l use
onl
y

Global Responsible Investors29
As at October 2019 by country, sector and stock
Portfolio positioning
By Region By Sector
-0.80%
2.68%
3.81%
4.38%
5.02%
8.72%
11.37%
11.68%
15.98%
18.37%
18.79%
-1.00% 4.00% 9.00% 14.00% 19.00%
Energy
Utilities
Real Estate
Consumer Staples
Materials
Communication Services
Health Care
Industrials
Consumer Discretionary
Financials
Information Technology
Morphic Ethical
Equities Fund
Benchmark
0.80%
1.30%
1.41%
4.80%
15.83%
20.38%
55.48%
0.00% 20.00% 40.00% 60.00% 80.00%
Eastern Europe
South & Central America
Central Asia
Africa / Middle East
Asia Pacific
Western Europe
North America
For
per
sona
l use
onl
y

Global Responsible Investors30
For
per
sona
l use
onl
y

Global Responsible Investors3131
Irene Kardasis
Marketing and IR Manager
Phone:+612 9021 7726
Email: [email protected]
Level 11, 179 Elizabeth St
Sydney 2000
New South Wales
Australia
Disclaimer: Unless specifically indicated, this presentation is for information purposes only and is not intended as an offer or solicitation with respect to the purchase or sale of any security by the sender or
Morphic Asset Management Pty Ltd (“Morphic”) (ACN 155 937 901) (AFSL 419916). This presentation does not take into account the investment objectives, financial situation or particular needs of any particular
person. Investors should obtain individual financial advice based on their own particular circumstances before making an investment decision. Any person considering investment in the Morphic Global
Opportunities Fund (“MGOF”) should first review the Product Disclosure Statement (PDS) for the Fund issued by Perpetual Trust Services Ltd dated 04/12/2017. Initial Applications for units in the MGOF can only be
made pursuant to the application form in the PDS. Morphic does not guarantee repayment of capital or any particular rate of return from the MGOF. Past performance is no guarantee of future performance.
Investment returns have been calculated in accordance with normal industry practice utilising movements in unit price and assuming reinvestment of all distribution of income and realised profits. Statements of
fact in this presentation have been obtained from and are based upon sources that Morphic believes to be reliable, but Morphic does not guarantee their accuracy, and any such information may be incomplete or
condensed. All opinions and estimates included in this presentation constitute Morphic's judgement as of the date of this communication and are subject to change without notice.
The Certification Symbol signifies that a product or service offers an investment style that takes into account environmental, social, governance or ethical considerations. The Symbol also signifies that Morphic
Ethical Equities Fund adheres to the strict disclosure practices required under the Responsible Investment Certification Program for the category of Product Provider. The Certification Symbol is a Registered Trade
Mark of the Responsible Investment Association Australasia (RIAA). Detailed information about RIAA, the Symbol and Morphic Ethical Equities Fund’s methodology, performance and stock holdings can be found at
www.responsibleinvestment.org, together with details about other responsible investment products certified by RIAA.1
1 The Responsible Investment Certification Program does not constitute financial product advice. Neither the Certification Symbol nor RIAA recommends to any person that any financial product is a suitable
investment or that returns are guaranteed. Appropriate professional advice should be sought prior to making an investment decision. RIAA does not hold an Australian Financial Services Licence.
For further enquiries:
Morphic Asset ManagementF
or p
erso
nal u
se o
nly