Embed Size (px)
Citation preview

2019 Annual ReportBluechiip Limited ACN 104 795 922
For
per
sona
l use
onl
y

PRODUCTIVITY.SAMPLE QUALITY. INTEGRITY.
For
per
sona
l use
onl
y
2018/19 Highlights 4
Chairman’s Letter 8
Managing Director’s Report 10
Directors Report 14
Remuneration Report 19
Corporate Governance 30
Auditor Independence Declaration 31
Consolidated Statement of Financial Position 32
Consolidated Statement of Profit or Loss and Other Comprehensive Income 33
Consolidated Statement of Changes in Equity 34
Consolidated Statement of Cash Flows 35
Notes to the Consolidated Financial Statements 36
Directors’ Declaration 57
Independent Auditors Report 58
Additional ASX Information 62
Corporate Information 64
Contents
For
per
sona
l use
onl
y

2018/19 Highlights
Cumulative Reader & Chip Sales
Product & Licence Reader
1st Half FY16
1st Half FY17
1st Half FY18
1st Half FY19
2nd Half FY16
2nd Half FY17
2nd Half FY18
2nd Half FY19
1st Half FY16
1st Half FY17
1st Half FY18
1st Half FY19
2nd Half FY16
2nd Half FY17
2nd Half FY18
2nd Half FY19
900
800
700
600
500
400
300
200
100
0
Hal
f Ye
arlly
Rev
enue
(‘0
00
s)
Labcon Licence Agreement
April ‘17Planet Innovation
Licence Agreement Sept’ 16
Genea Licence Agreement
Dec ‘15
Labcon Deal for $15.9M
Sept ‘18
Labcon Order for
$1M Dec ‘17
• Dramatically increasing partner pipeline with 32 developer kits sold to date
• Signed and have begun execution of a three-year supply agreement with Labcon, worth over US$11.6 million
• Continued to rapidly scale production to meet customer demand
• Delivered over 400k chips to date
• Now seeing recurring revenues with FY19 sales of $1.02M, an 82% growth Y.O.Y
• Continued intensive research and development activities to meet the requirements of new and existing customers
450,000
400,000
350,000
300,000
250,000
200,000
150,000
100,000
50,000
0
120
100
80
60
40
20
0
Chi
p Sa
les
(Cum
ulat
ive)
Read
er S
ales
(Cum
ulat
ive)
4F
or p
erso
nal u
se o
nly

-1960C
1 10 0 0 0 01 1 1 1 1
Bluechiip OverviewBluechiip’s technology wirelessly tracks the identification and temperature of valuable samples such as tissue, blood, serum and plasma which are stored in vials and bags in harsh environments like liquid nitrogen. This technology is highly differentiated, a world first with protected IP and a rapidly growing >$200m market with very large adjacent markets.
Bluechiip’s technology improves productivity, reduces human error and ensures sample integrity in industries such as the US$2B bio- preservation market. Bluechiip’s miniature chips – smaller than the size of a matchhead – are attached to storage bags and vials, and
information from these chips is read by a mechanical reader. Current sample-tracking technology – largely barcodes, radio-frequency identification (RFID) technology and written labels – is simply not keeping up with the increasing value of biosamples. Bluechiip’s chips are currently being built into a range of vials by a US company, Labcon North America, one of the world’s biggest consumables manufacturers. Bluechiip is in discussion with several other manufacturers to incorporate its technology into their products. Bluechiip’s strong IP portfolio across nine patent families, includes 25 granted patents.
Bluechiip TechnologyThe chip, a Micro Electro Mechanical System (MEMS), measuring 1mm x 1mm x 1mm, is a purely mechanical device with no powered electronics. Unlike other labelling technology – such as labels, barcodes and radio-frequency identification (RFID) technology – Bluechiip’s chips perform in extreme environments like liquid nitrogen, operating reliably at -196°C. They are also resistant to gamma sterilisation, they are extremely difficult to clone or corrupt, and provide the temperature of samples when read.
Billions of ID CombinationsBillions of unique ID combinations can be captured in this miniaturised chip
Resonating Micro Beams Shifting with TemperatureEach chip is a unique micro electro mechanical system (MEMS) containing multiple beams
Miniature Chip The beams resonate at different frequencies which are translated to an ID. The frequency of the beams is directly related to the temperature
BLU
ECH
IIP LIM
ITED
AN
NU
AL REPO
RT 20195
For
per
sona
l use
onl
y
Stream Sample Data Management Software
HAND-HELD READER
LABCON COLDPOINT™ BLUECHIIP ENABLEDVIALS
CRYOVIAL BOX
CRYOTAG
MATCHBOX READER MULTIVIAL READER
RETROFIT BUTTON FOR CRYOVIALS
BLUECUBE
Consumables
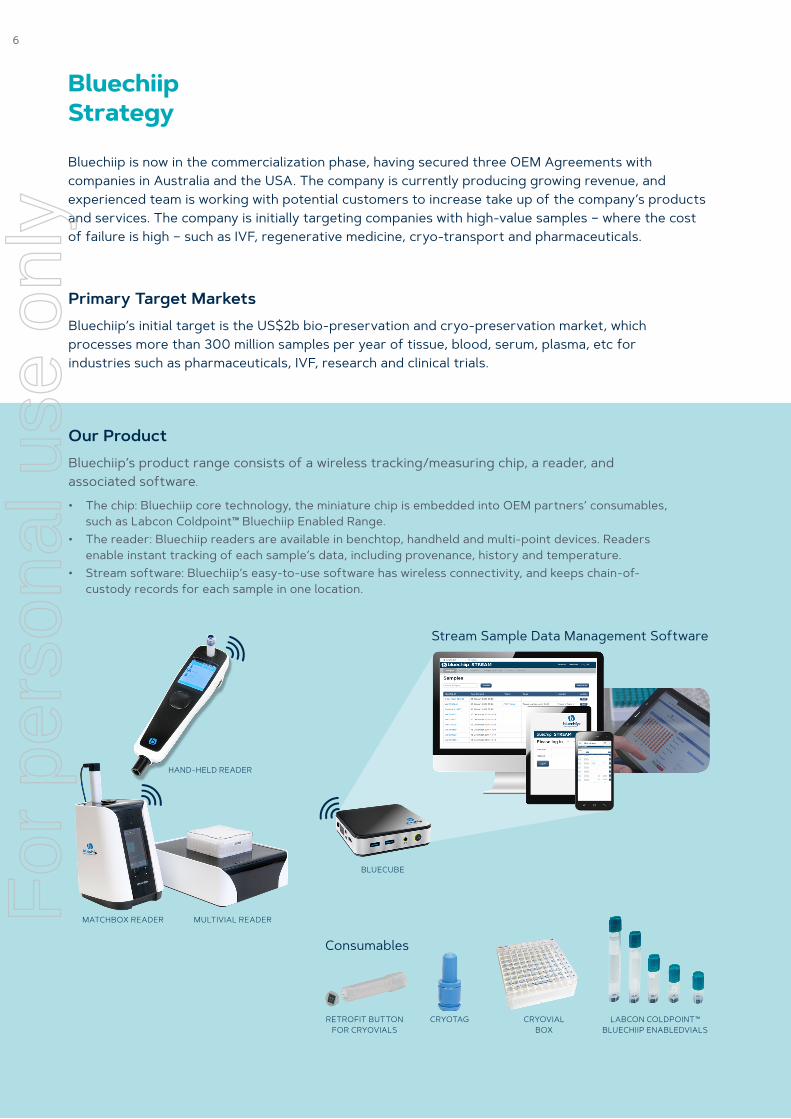
Bluechiip is now in the commercialization phase, having secured three OEM Agreements with companies in Australia and the USA. The company is currently producing growing revenue, and experienced team is working with potential customers to increase take up of the company’s products and services. The company is initially targeting companies with high-value samples – where the cost of failure is high – such as IVF, regenerative medicine, cryo-transport and pharmaceuticals.
Primary Target MarketsBluechiip’s initial target is the US$2b bio-preservation and cryo-preservation market, which processes more than 300 million samples per year of tissue, blood, serum, plasma, etc for industries such as pharmaceuticals, IVF, research and clinical trials.
Our ProductBluechiip’s product range consists of a wireless tracking/measuring chip, a reader, and associated software.
• The chip: Bluechiip core technology, the miniature chip is embedded into OEM partners’ consumables, such as Labcon Coldpoint™ Bluechiip Enabled Range.
• The reader: Bluechiip readers are available in benchtop, handheld and multi-point devices. Readers enable instant tracking of each sample’s data, including provenance, history and temperature.
• Stream software: Bluechiip’s easy-to-use software has wireless connectivity, and keeps chain-of- custody records for each sample in one location.
Bluechiip Strategy
6F
or p
erso
nal u
se o
nly
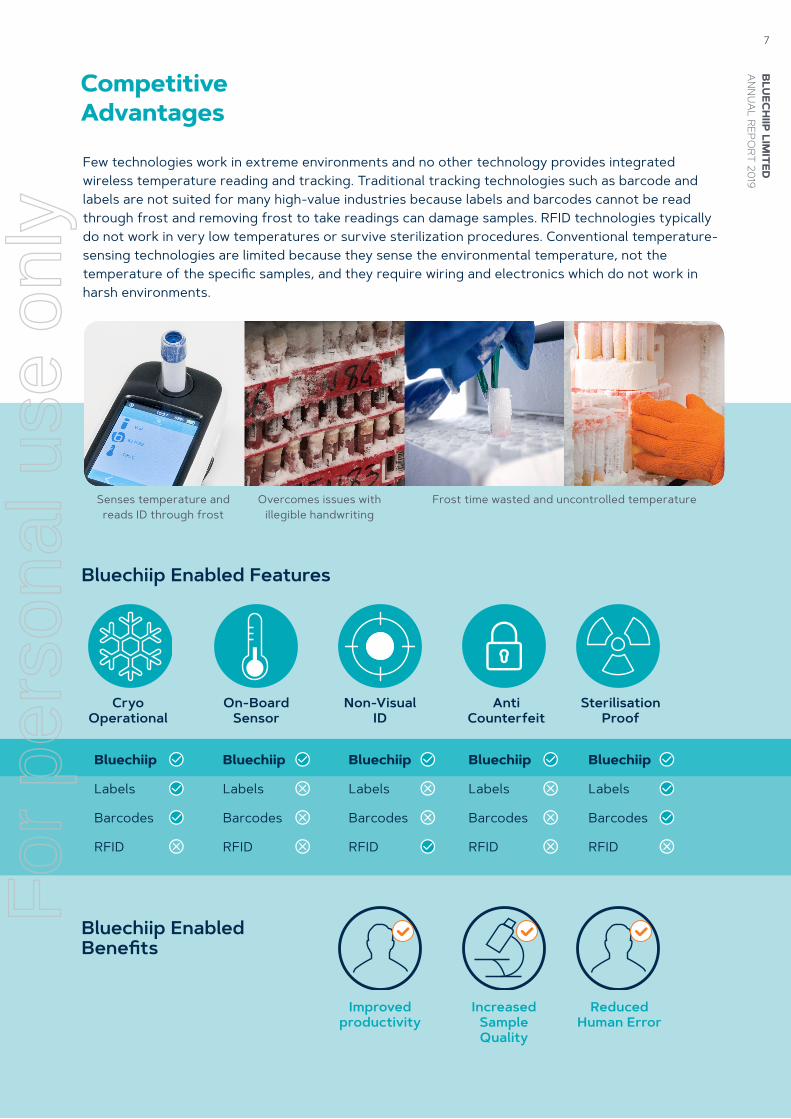
Bluechiip Enabled Features
Senses temperature and reads ID through frost
Few technologies work in extreme environments and no other technology provides integrated wireless temperature reading and tracking. Traditional tracking technologies such as barcode and labels are not suited for many high-value industries because labels and barcodes cannot be read through frost and removing frost to take readings can damage samples. RFID technologies typically do not work in very low temperatures or survive sterilization procedures. Conventional temperature-sensing technologies are limited because they sense the environmental temperature, not the temperature of the specific samples, and they require wiring and electronics which do not work in harsh environments.
Overcomes issues with illegible handwriting
Frost time wasted and uncontrolled temperature
Bluechiip Bluechiip Bluechiip Bluechiip Bluechiip
Labels Labels Labels Labels Labels
Barcodes Barcodes Barcodes Barcodes Barcodes
RFID RFID RFID RFID RFID
On-Board Sensor
Non-Visual ID
Anti Counterfeit
Sterilisation Proof
Cryo Operational
Increased Sample Quality
Reduced Human Error
Improved productivity
Bluechiip Enabled Benefits
Competitive Advantages
BLU
ECH
IIP LIM
ITED
AN
NU
AL REPO
RT 20197
For
per
sona
l use
onl
y

CHAIRMAN’S LETTER
8F
or p
erso
nal u
se o
nly

Dear Shareholder,
On behalf of the Board, I am pleased to report that Bluechiip has significantly strengthened its position over the past year and is well positioned to pursue growth as it rapidly scales production. Some five years ago, following major board changes including a new CEO & MD, we laid the foundations for future success with a fresh commercialisation strategy and execution. Bluechiip’s core technology, the chip itself, remains ‘unique’ and is a real value proposition.
Our target market is resonating strongly and we are seeing the rewards of those changes. Annual sales revenue has now passed $1 million and nearly half a million chips and over 100 readers have been delivered to the market. North America accounts for over three-quarters of these readers, underpinned by the deal with Labcon. As important, there are 32 developer kits in the market which we regard as a key barometer to track market interest in Bluechiip’s technology.
Momentum is building and we see a big difference in how some of our target partners deal with us. They are now stepping through the “does this work?” stage straight to the development and customisation “how to implement” stage, which is very encouraging.
No other technology provides integrated wireless temperature reading and tracking. Bluechiip’s technology is highly differentiated, a world first and protected by a solid family of patents. These are fundamental strengths of our business, which we expect to grow strongly and establish a prominent market position.
The OEM beachhead established in North America was vital and your Directors expect to see chip and reader deliveries grow dramatically and steadily in the coming year.
We have an experienced team led by Andrew. They will continue to drive the business forward to grow sales and financial performance.
As always we thank our shareholders for their continuing support and we look forward to sharing the Company’s success with them.
Iain Kirkwood Chairman
Building scale as sales orders increase
BLU
ECH
IIP LIM
ITED
AN
NU
AL REPO
RT 20199
For
per
sona
l use
onl
y
MANAGING DIRECTOR’S REPORT
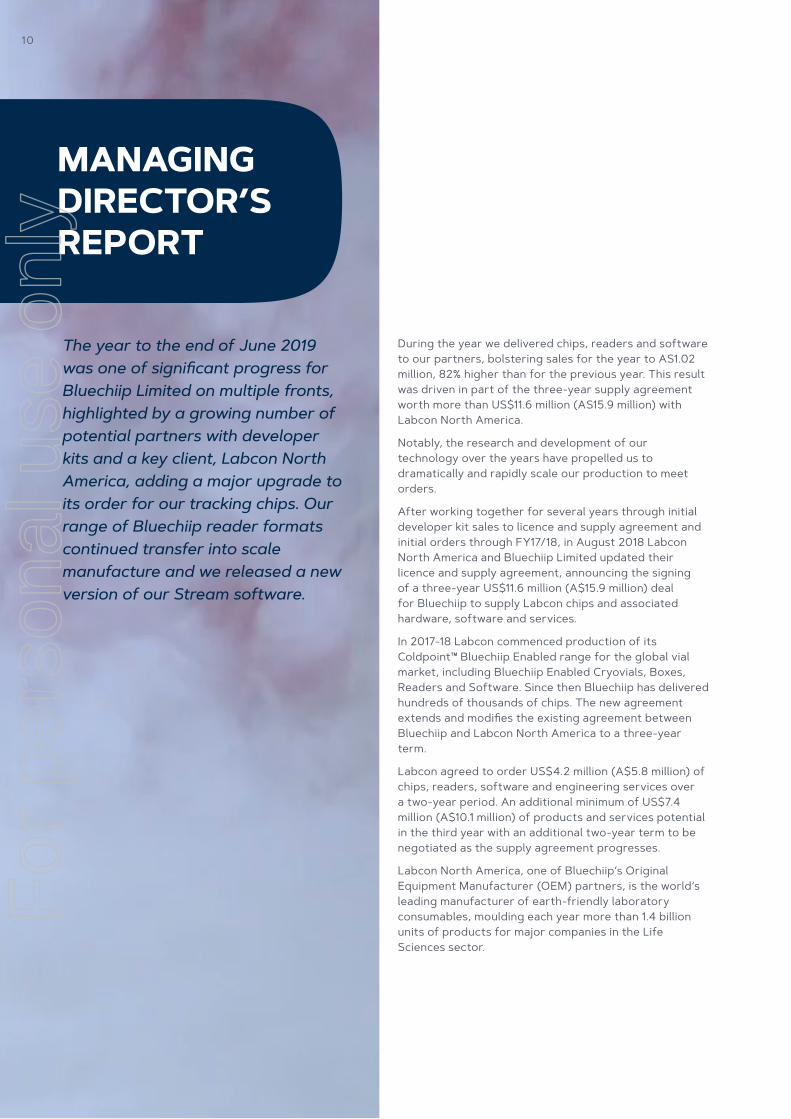
During the year we delivered chips, readers and software to our partners, bolstering sales for the year to AS1.02 million, 82% higher than for the previous year. This result was driven in part of the three-year supply agreement worth more than US$11.6 million (AS15.9 million) with Labcon North America.
Notably, the research and development of our technology over the years have propelled us to dramatically and rapidly scale our production to meet orders.
After working together for several years through initial developer kit sales to licence and supply agreement and initial orders through FY17/18, in August 2018 Labcon North America and Bluechiip Limited updated their licence and supply agreement, announcing the signing of a three-year US$11.6 million (A$15.9 million) deal for Bluechiip to supply Labcon chips and associated hardware, software and services.
In 2017-18 Labcon commenced production of its Coldpoint™ Bluechiip Enabled range for the global vial market, including Bluechiip Enabled Cryovials, Boxes, Readers and Software. Since then Bluechiip has delivered hundreds of thousands of chips. The new agreement extends and modifies the existing agreement between Bluechiip and Labcon North America to a three-year term.
Labcon agreed to order US$4.2 million (A$5.8 million) of chips, readers, software and engineering services over a two-year period. An additional minimum of US$7.4 million (A$10.1 million) of products and services potential in the third year with an additional two-year term to be negotiated as the supply agreement progresses.
Labcon North America, one of Bluechiip’s Original Equipment Manufacturer (OEM) partners, is the world’s leading manufacturer of earth-friendly laboratory consumables, moulding each year more than 1.4 billion units of products for major companies in the Life Sciences sector.
The year to the end of June 2019 was one of significant progress for Bluechiip Limited on multiple fronts, highlighted by a growing number of potential partners with developer kits and a key client, Labcon North America, adding a major upgrade to its order for our tracking chips. Our range of Bluechiip reader formats continued transfer into scale manufacture and we released a new version of our Stream software.
10F
or p
erso
nal u
se o
nly
Bluechiip is working closely with Labcon’s sales team with sales training, support training, accompanying sales representatives on customer visits and assisting with the roll out of Labcon’s Coldpoint Bluechiip Enabled range.
As a result of this commitment we progressed development of our Multi-Vial reader and Hand-Held reader, both of which are progressing towards scale manufacture. These are important elements of the Bluechiip system as the Multi-Vial reader allows a user to scan up to 100 samples at once and the Hand-Held reader allows a user to take mobile readings throughout a facility.
Through FY19, via further research and development of the software, a substantial upgrade to our Stream software was undertaken and released onto our Bluecube servers. The Bluecube provides a central node and database to which each of our readers communicates and sample information is stored.
Significant improvements included the robustness of the software and enhancement of the user interface. All of our Bluechiip readers and Stream-installed Bluecubes are being distributed with Labcon’s Coldpoint™ Bluechiip Enabled consumables. It is exciting to have a range of consumables, multiple reader formats and software available on the market for the first time.
Over the year we have also made progress with Planet Innovation, another of our OEM partners. They continue to support our R&D activities and progress our reader platforms towards volume manufacture, while also introducing us to their wide range of customers.
Notably, to date we have sold 32 Bluechiip Developer Kits, which we hope will lead to the signing up of more customers. We now have several active proposals in the market for additional OEMs to incorporate Bluechiip technology.
As the year progressed, we saw a greater interest in the company from shareholders, stockbrokers, asset managers and potential investors. They are interested in our world-first, highly differentiated technology, with its widely-protected and expanding IP foundation.
The markets we continue to chase are significant. Our key target bio-preservation market is greater than US$200 million, with large adjacent markets.
I would like to thank all shareholders for their support during the year. Many of them participated in the capital raise in September 2018, in which Bluechiip successfully completed a placement of A$5.5 million, and a subsequent shareholder purchase plan to its existing shareholders that raised A$1.95 million. We are using these funds to further our R&D activities, scale our production capacity, increase execution of business development and as working capital for the continuing operation of the business.
I look forward to the coming year with enthusiasm as we will further scale production to meet demand. We expect to see increased sales volumes and growth in coming years. Our pipeline with new and existing OEMs remains robust, with Bluechiip Enabled products expected to be deployed in many active markets worldwide, including IVF, Cell Therapy, Cold Chain Logistics and biorepositories. We remain focused on continuing to expand our IP base and product pipeline.
Lastly, I would like to thank the team at Bluechiip for their commitment throughout a year of continued growth.
Andrew McLellan Managing Director
BLU
ECH
IIP LIM
ITED
AN
NU
AL REPO
RT 201911
For
per
sona
l use
onl
y
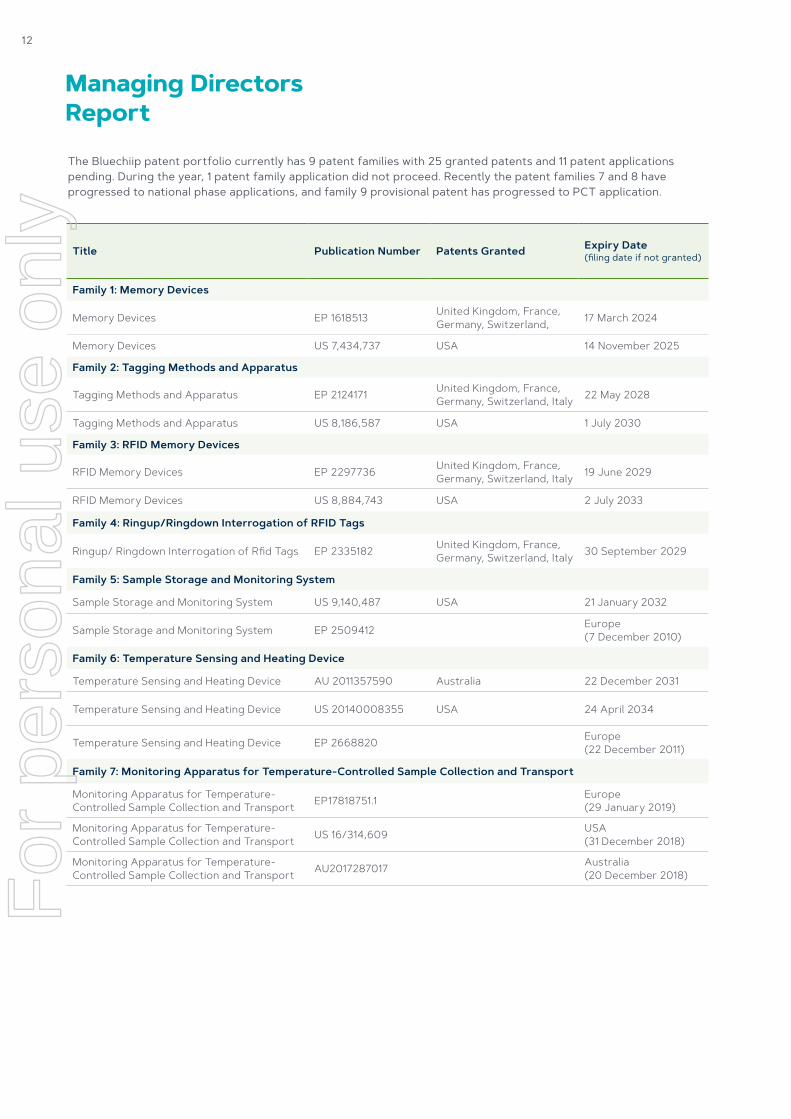
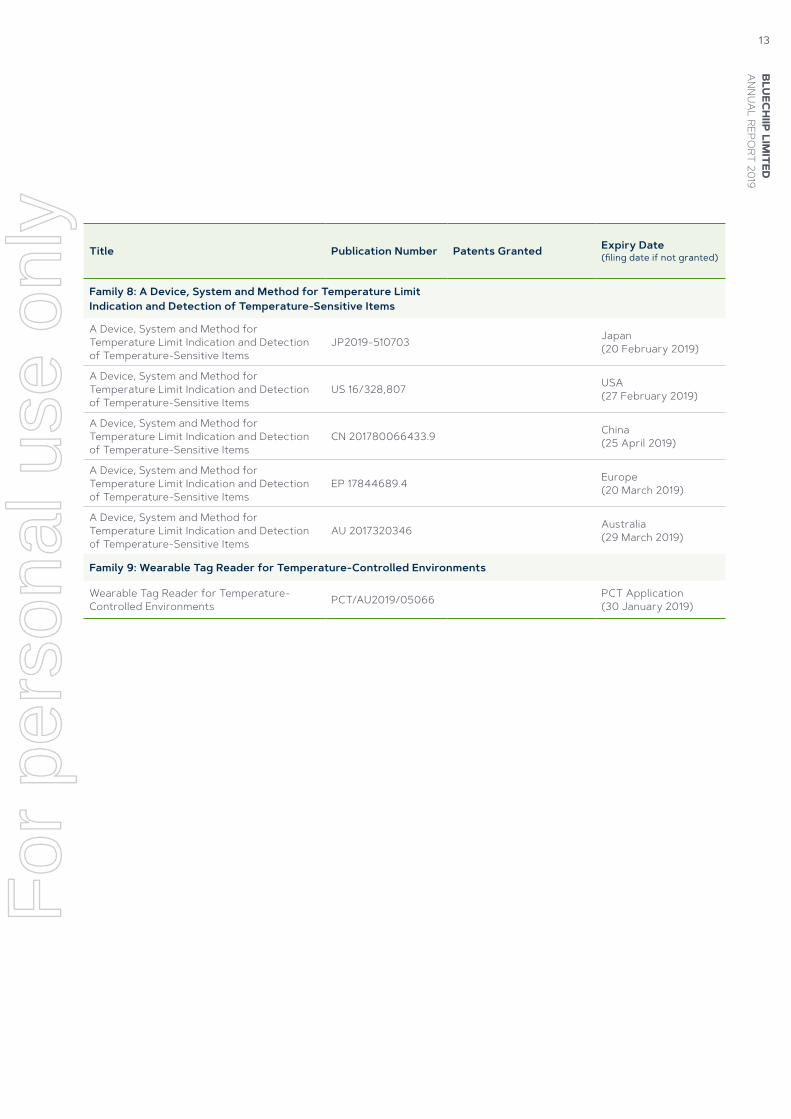
The Bluechiip patent portfolio currently has 9 patent families with 25 granted patents and 11 patent applications pending. During the year, 1 patent family application did not proceed. Recently the patent families 7 and 8 have progressed to national phase applications, and family 9 provisional patent has progressed to PCT application.
Title Publication Number Patents Granted Expiry Date (filing date if not granted)
Family 1: Memory Devices
Memory Devices EP 1618513 United Kingdom, France, Germany, Switzerland, 17 March 2024
Memory Devices US 7,434,737 USA 14 November 2025
Family 2: Tagging Methods and Apparatus
Tagging Methods and Apparatus EP 2124171 United Kingdom, France, Germany, Switzerland, Italy 22 May 2028
Tagging Methods and Apparatus US 8,186,587 USA 1 July 2030
Family 3: RFID Memory Devices
RFID Memory Devices EP 2297736 United Kingdom, France, Germany, Switzerland, Italy 19 June 2029
RFID Memory Devices US 8,884,743 USA 2 July 2033
Family 4: Ringup/Ringdown Interrogation of RFID Tags
Ringup/ Ringdown Interrogation of Rfid Tags EP 2335182 United Kingdom, France, Germany, Switzerland, Italy 30 September 2029
Family 5: Sample Storage and Monitoring System
Sample Storage and Monitoring System US 9,140,487 USA 21 January 2032
Sample Storage and Monitoring System EP 2509412 Europe (7 December 2010)
Family 6: Temperature Sensing and Heating Device
Temperature Sensing and Heating Device AU 2011357590 Australia 22 December 2031
Temperature Sensing and Heating Device US 20140008355 USA 24 April 2034
Temperature Sensing and Heating Device EP 2668820 Europe (22 December 2011)
Family 7: Monitoring Apparatus for Temperature-Controlled Sample Collection and Transport
Monitoring Apparatus for Temperature- Controlled Sample Collection and Transport EP17818751.1 Europe
(29 January 2019)
Monitoring Apparatus for Temperature- Controlled Sample Collection and Transport US 16/314,609 USA
(31 December 2018)
Monitoring Apparatus for Temperature- Controlled Sample Collection and Transport AU2017287017 Australia
(20 December 2018)
12
Managing Directors Report
For
per
sona
l use
onl
y
Title Publication Number Patents Granted Expiry Date (filing date if not granted)
Family 8: A Device, System and Method for Temperature Limit Indication and Detection of Temperature-Sensitive Items
A Device, System and Method for Temperature Limit Indication and Detection of Temperature-Sensitive Items
JP2019-510703 Japan (20 February 2019)
A Device, System and Method for Temperature Limit Indication and Detection of Temperature-Sensitive Items
US 16/328,807 USA (27 February 2019)
A Device, System and Method for Temperature Limit Indication and Detection of Temperature-Sensitive Items
CN 201780066433.9 China (25 April 2019)
A Device, System and Method for Temperature Limit Indication and Detection of Temperature-Sensitive Items
EP 17844689.4 Europe (20 March 2019)
A Device, System and Method for Temperature Limit Indication and Detection of Temperature-Sensitive Items
AU 2017320346 Australia (29 March 2019)
Family 9: Wearable Tag Reader for Temperature-Controlled Environments
Wearable Tag Reader for Temperature- Controlled Environments PCT/AU2019/05066 PCT Application
(30 January 2019)
BLU
ECH
IIP LIM
ITED
AN
NU
AL REPO
RT 201913
For
per
sona
l use
onl
y
DirectorsThe names and details of the Company’s Directors in office during the financial year and until the date of this report are as follows. Directors were in office for this entire year unless otherwise stated.
Iain M Kirkwood – Non-Executive Chairman Qualifications: MA (Hons) Oxon, FCPA
Appointed to the Board in November 2007, Iain serves as Chairman. He is an experienced private consultant, investor and non-executive Director.
He has considerable practical and operational experience gained from a successful financial career spanning
35 years in a range of industries including auditing, resources, manufacturing and latterly healthcare in Australia, Britain and the USA. He started his career at Arthur Andersen & Co in London. During his career, he has held a range of senior financial and general management positions, including Woodside Petroleum
Limited, Santos Limited, Pilkington plc, F.H. Faulding & Co Limited and Clinuvel Pharmaceuticals Limited.
During the past three (3) years he has also served as a Director of the following other ASX listed companies:
• Simonds Group Limited (Appointed 20 September 2017)
• Novita Healthcare Limited (formerly Avexa Limited) (Appointed 9 August 2010, Resigned 30 October 2017)
Andrew McLellan – Managing Director and CEOQualifications: MBA, B Eng (Hons), GAICD
Appointed as Managing Director and CEO on 27 January 2015. Andrew has vast experience in innovation and commercialisation combined with significant technical and operational experience. Prior to joining Bluechiip, he was the CEO of Advanced Manufacturing Co-operative Research Centre (AMCRC) which he now serves as a non- executive Director. Andrew focused on bringing together industry and research to develop and commercialise ground breaking innovations. He has held a range of senior positions including Director at Leica Microsystems Pty Ltd (previously Vision BioSystems Pty Ltd, a division of the former publicly listed Vision Systems Limited), Vice President of Marketing and Business Development North America and Director of Product Management at Vision BioSystems Pty Ltd. Andrew holds a Bachelor of Engineering Degree (Hons) and an MBA (Strategy) from Monash University (Melbourne). In addition, he is also a graduate of the Australian Institute of Company Directors (GAICD).
Michael Ohanessian – Non-Executive DirectorQualifications: B Eng, MBA
Appointed to the Board on 15 December 2014. Michael is currently the CEO of Praemium Limited. Michael has considerable executive experience gained from technology-related businesses with a mixture of operational, strategic and leadership capabilities. Following a ten-year career at Mobil Oil, Michael joined the Boston Consulting Group where he consulted to clients in a wide range of industries which include banking, airlines, mining, packaging, sports, oil and gas, retailing and biotechnology.
Michael later moved on to be the CEO of Vision BioSystems, a division of the former publicly listed Vision Systems Limited, where he transformed the business over seven years from a small unprofitable contract manufacturer into a vertically integrated, profitable and growing medical diagnostics business with distribution to over 60 countries. More recently he has served as Chief Executive of Genetic Technologies Limited and has been involved in investment management and corporate advice with Lion Capital prior to joining Praemium Limited, a company listed on the ASX, as its CEO on 9 August 2011.
14
Directors Report
For
per
sona
l use
onl
y

Andrew Cox – Non-Executive DirectorQualifications: MBA, B Commerce (MELB), ICA
Appointed to the Board on 26 July 2017. Andrew is a finance professional with experience in emerging and international markets. Andrew was a co-founder and former chairman of private equity-funded media/ technology business Inlink (sold to ASX-listed oOh! Media Ltd in 2015), and is a co-founder of Rezex Timber Pty Ltd and iPro Pty Ltd.
Andrew began his career with KPMG in Melbourne before moving to China and Hong Kong, where he spent seven years with SG Warburg, the Australian Trade Commission and Ernst & Young. He is a member of the Translation and Commercialisation Committee of the Murdoch Children’s Research Institute and is fluent in Mandarin Chinese. Andrew holds a Bachelor of Commerce from the University of Melbourne and an MBA from the International Institute for Management Development (Lausanne, Switzerland). He is also a member of the Australian Institute of Chartered Accountants (ICA) and is a graduate of the Australian Institute of Company Directors.
Company Secretary
Lee MitchellQualifications: BA, LLM (Melb)
Lee is a director at Nicholson Ryan, a boutique law firm based in Melbourne, Victoria. He is a qualified solicitor practising principally in corporate and commercial law advising on corporate and securities regulation, equity capital raisings, formulation and implementation of mergers and acquisitions, corporate governance and company secretarial matters.
He joined Bluechiip Limited as Company Secretary in September 2010.
BLU
ECH
IIP LIM
ITED
AN
NU
AL REPO
RT 201915
For
per
sona
l use
onl
y
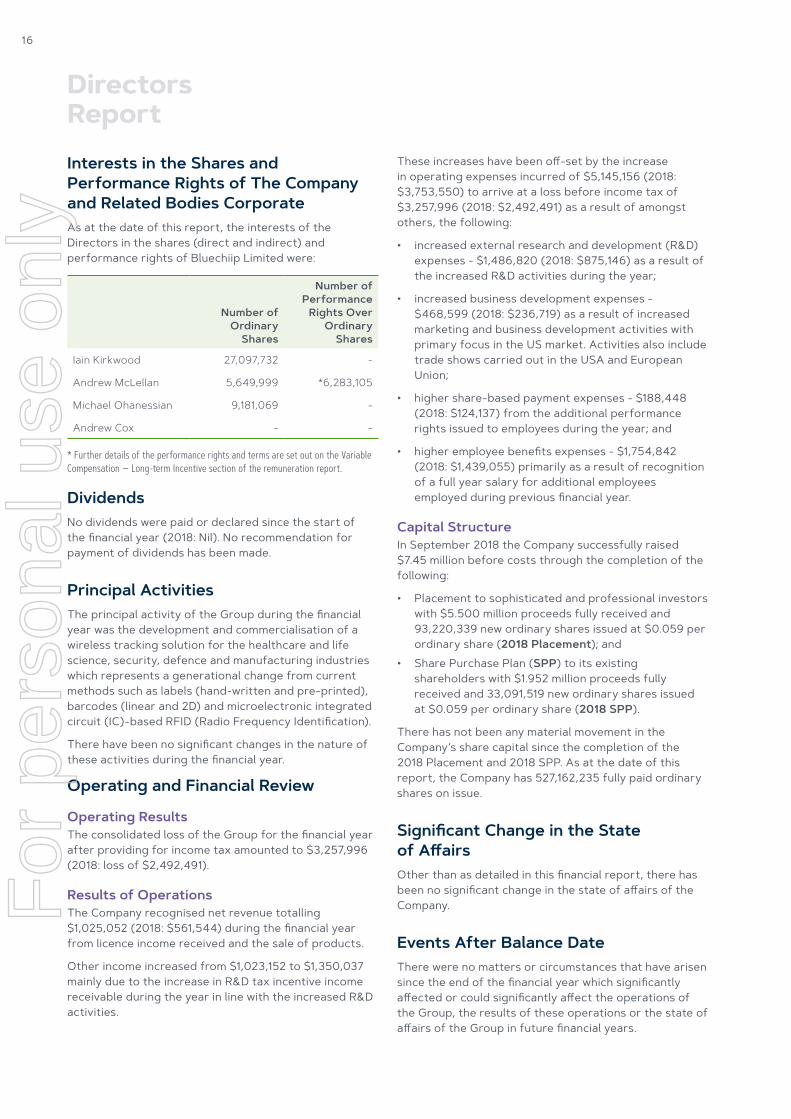
Interests in the Shares and Performance Rights of The Company and Related Bodies CorporateAs at the date of this report, the interests of the Directors in the shares (direct and indirect) and performance rights of Bluechiip Limited were:
Number of Ordinary
Shares
Number of Performance
Rights Over Ordinary
Shares
Iain Kirkwood 27,097,732 -
Andrew McLellan 5,649,999 *6,283,105
Michael Ohanessian 9,181,069 -
Andrew Cox - -
* Further details of the performance rights and terms are set out on the Variable Compensation — Long-term Incentive section of the remuneration report.
DividendsNo dividends were paid or declared since the start of the financial year (2018: Nil). No recommendation for payment of dividends has been made.
Principal ActivitiesThe principal activity of the Group during the financial year was the development and commercialisation of a wireless tracking solution for the healthcare and life science, security, defence and manufacturing industries which represents a generational change from current methods such as labels (hand-written and pre-printed), barcodes (linear and 2D) and microelectronic integrated circuit (IC)-based RFID (Radio Frequency Identification).
There have been no significant changes in the nature of these activities during the financial year.
Operating and Financial Review
Operating ResultsThe consolidated loss of the Group for the financial year after providing for income tax amounted to $3,257,996 (2018: loss of $2,492,491).
Results of OperationsThe Company recognised net revenue totalling $1,025,052 (2018: $561,544) during the financial year from licence income received and the sale of products.
Other income increased from $1,023,152 to $1,350,037 mainly due to the increase in R&D tax incentive income receivable during the year in line with the increased R&D activities.
These increases have been off-set by the increase in operating expenses incurred of $5,145,156 (2018: $3,753,550) to arrive at a loss before income tax of $3,257,996 (2018: $2,492,491) as a result of amongst others, the following:
• increased external research and development (R&D) expenses - $1,486,820 (2018: $875,146) as a result of the increased R&D activities during the year;
• increased business development expenses - $468,599 (2018: $236,719) as a result of increased marketing and business development activities with primary focus in the US market. Activities also include trade shows carried out in the USA and European Union;
• higher share-based payment expenses - $188,448 (2018: $124,137) from the additional performance rights issued to employees during the year; and
• higher employee benefits expenses - $1,754,842 (2018: $1,439,055) primarily as a result of recognition of a full year salary for additional employees employed during previous financial year.
Capital StructureIn September 2018 the Company successfully raised $7.45 million before costs through the completion of the following:
• Placement to sophisticated and professional investors with $5.500 million proceeds fully received and 93,220,339 new ordinary shares issued at $0.059 per ordinary share (2018 Placement); and
• Share Purchase Plan (SPP) to its existing shareholders with $1.952 million proceeds fully received and 33,091,519 new ordinary shares issued at $0.059 per ordinary share (2018 SPP).
There has not been any material movement in the Company’s share capital since the completion of the 2018 Placement and 2018 SPP. As at the date of this report, the Company has 527,162,235 fully paid ordinary shares on issue.
Significant Change in the State of AffairsOther than as detailed in this financial report, there has been no significant change in the state of affairs of the Company.
Events After Balance DateThere were no matters or circumstances that have arisen since the end of the financial year which significantly affected or could significantly affect the operations of the Group, the results of these operations or the state of affairs of the Group in future financial years.
16
Directors Report
For
per
sona
l use
onl
y
Basis of PreparationThe financial report has been prepared on a going concern basis which takes into account the Group’s assets and liabilities and assumes that funds will be obtained from several sources as outlined in Note 2 to the Financial Statements.
Likely Developments and Expected Results Building off prior years’ foundation, the year ahead will continue focus on supporting our existing Original Equipment Manufacturers (OEM) partners with delivery to existing and new orders for chips, readers, software and engineering support services while also pursuing existing and new pipeline opportunities to translate into sales. Bluechiip will continue with its strategy of working with OEM partners to integrate Bluechiip technology in OEM products complemented by the progression of the Bluechiip Multi- Vial Reader and Hand Held Reader into scale manufacture and product registrations across the globe to address the need for temperature tracking devices and solutions for the high volume biobanking sector. This is expected to lead to the demand for the Company’s technology and products. Bluechiip is expected to roll out the implementation of quality systems in pursuit of ISO certification.
The Company will continue to pursue sales, marketing and business development activities, including collaborative research and development activities with OEM players while also working with end users through distribution channels.
The Company will continue to work through its business development team in the USA on the expansion of its OEM pipeline in the USA, Europe and APAC markets and to convert OEM partner opportunities.
The Company expects to continue research and development of solutions to meet OEM partners’ requirements as well as continued expansion on underlying core intellectual property.
Environmental Regulation and PerformanceThe Group’s operations are not regulated by any significant environmental regulations under a law of the Commonwealth or of a state or territory.
Options
Unissued SharesAs at the date of this report, there were no unexercised options (2018: Nil) over ordinary shares or shares issued
on the exercise of options or performance rights except as detailed in the following paragraphs.
As at the date of this report, there were 15,077,475 (2018: 12,162,000) unexercised performance rights (zero exercise price options) over ordinary shares, of which 1,000,000 performance rights have been vested but remain unexercised. Further details of the performance rights and their terms are set out in the Variable Compensation - Long-term Incentive section of the remuneration report.
Indemnification of Directors and OfficersThe Company has not granted any indemnity to any current or former Directors or officers against any liability other than as provided in the Company’s constitution and in standard deeds of insurance and indemnity entered into with each of the directors under which the Company indemnifies each officer against any liability to a party other than the Company or a related body corporate, but only to the extent that the liability arises out of conduct in good faith together with legal costs to the extent permitted by the Corporations Act.
During the financial year, the Company has paid premiums in respect of a contract insuring the Directors of the Company (as named above) and all Executive Officers of the Company The liabilities insured are legal costs that may be incurred in defending civil or criminal proceedings that may be brought against the officers in their capacity as officers of entities in the group, and any other payments arising from liabilities incurred by the officers in connection with such proceedings. This does not include such liabilities that arise from conduct involving a wilful breach of duty by the officers or the improper use by the officers of their position or of information to gain advantage for themselves or someone else or to cause detriment to the company. It is not possible to apportion the premium between amounts relating to the insurance against legal costs and those relating to other liabilities.
The total amount of Directors & Officers Liability insurance contract premiums paid was $40,020 (2018: $33,750).
Indemnification of AuditorsTo the extent permitted by law, the Company has agreed to indemnify its auditors, Deloitte Touche Tohmatsu, as part of the terms of its audit engagement agreement against claims by third parties arising from the audit. No payment has been made to indemnify Deloitte Touche Tohmatsu during or since the financial year.
BLU
ECH
IIP LIM
ITED
AN
NU
AL REPO
RT 201917
For
per
sona
l use
onl
y
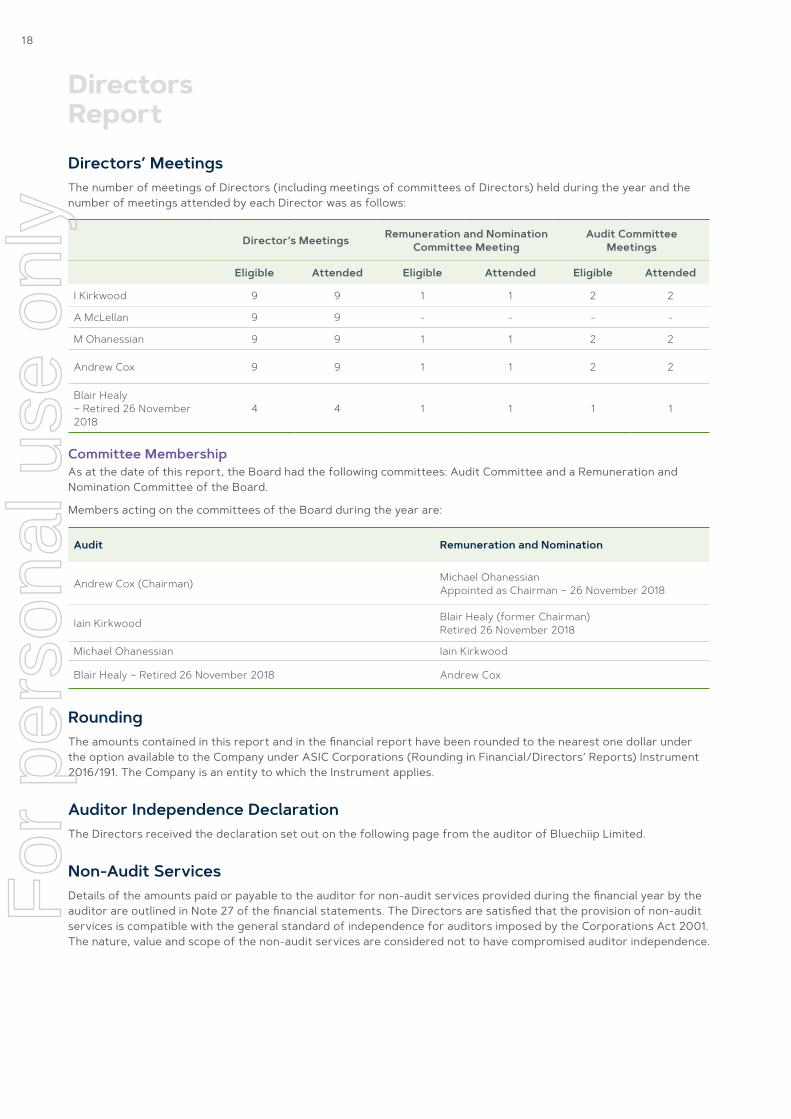
Directors’ MeetingsThe number of meetings of Directors (including meetings of committees of Directors) held during the year and the number of meetings attended by each Director was as follows:
Director’s Meetings Remuneration and Nomination Committee Meeting
Audit Committee Meetings
Eligible Attended Eligible Attended Eligible Attended
I Kirkwood 9 9 1 1 2 2
A McLellan 9 9 - - - -
M Ohanessian 9 9 1 1 2 2
Andrew Cox 9 9 1 1 2 2
Blair Healy – Retired 26 November 2018
4 4 1 1 1 1
Committee MembershipAs at the date of this report, the Board had the following committees: Audit Committee and a Remuneration and Nomination Committee of the Board.
Members acting on the committees of the Board during the year are:
Audit Remuneration and Nomination
Andrew Cox (Chairman) Michael Ohanessian Appointed as Chairman – 26 November 2018
Iain Kirkwood Blair Healy (former Chairman) Retired 26 November 2018
Michael Ohanessian Iain Kirkwood
Blair Healy – Retired 26 November 2018 Andrew Cox
RoundingThe amounts contained in this report and in the financial report have been rounded to the nearest one dollar under the option available to the Company under ASIC Corporations (Rounding in Financial/Directors’ Reports) Instrument 2016/191. The Company is an entity to which the Instrument applies.
Auditor Independence DeclarationThe Directors received the declaration set out on the following page from the auditor of Bluechiip Limited.
Non-Audit ServicesDetails of the amounts paid or payable to the auditor for non-audit services provided during the financial year by the auditor are outlined in Note 27 of the financial statements. The Directors are satisfied that the provision of non-audit services is compatible with the general standard of independence for auditors imposed by the Corporations Act 2001. The nature, value and scope of the non-audit services are considered not to have compromised auditor independence.
18
Directors Report
For
per
sona
l use
onl
y
Compensation of ExecutivesThis report outlines the compensation arrangements in place for Directors and senior executives of the Company being the Key Management Personnel (KMP) of the Company – being those persons having authority and responsibility for planning, directing and controlling the major activities of the Company, directly or indirectly, including any Director whether executive or otherwise.
All sections contained herein have been subject to audit as required by section 308(3C) of the Corporations Act. Remuneration is referred to as compensation in this report.
Individual KMP DisclosuresDetails of KMP of the Company are set out below:
Directors
Iain Kirkwood Non-Executive Chairman
Andrew McLellan CEO/Managing Director
Michael Ohanessian Non-Executive Director
Andrew Cox Non-Executive Director
Blair Healy Non-Executive Director Retired 26 November 2018
Remuneration and Nomination CommitteeThe Remuneration and Nomination Committee of the Board is responsible for making recommendations to the Board on the remuneration arrangements for Non- Executive Directors (NEDs) and executives. The Board approves the remuneration arrangements for executives having regard to the recommendations made by the Remuneration and Nomination Committee including any Short-term Incentive (STI) or Long-term Incentive (LTI) arrangements. The Board also sets the aggregate fee pool for NEDs (which is subject to shareholder approval) and NED fee levels.
The Remuneration and Nomination Committee comprises all NEDs, each of which is considered independent.
The Remuneration and Nomination Committee meets periodically as part of the Directors’ meetings during the year. Executives are not present at meetings of the Committee except by invitation.
The Remuneration and Nomination Committee has not engaged any external remuneration advisers during the financial year.
Further information on the Remuneration and Nomination Committee’s role, responsibilities and membership is located a bluechiip.com/about-us/corporate-governance/
Principles of Compensation and StrategyThe Remuneration & Nomination Committee of the Board assesses the appropriateness of the nature and amount of remuneration of NEDs and executives on a periodic basis by reference to relevant employment market conditions, with the overall objective of ensuring maximum stakeholder benefit from the retention of a high performing Director and executive team and aligning the interests of the executives with those of the shareholders.
Bluechiip’s remuneration strategy is designed to attract, motivate and retain employees and executives by identifying and rewarding high performers and recognising the contribution of each employee to the continued growth and success of the Company. To this end, key objectives of the Company’s reward framework are to ensure that remuneration practices are aligned to the Company’s business strategy, offer competitive remuneration benchmarked against the external market, provide strong linkage between individual and Group performance and rewards and align the interests of executives with shareholders. Where relevant, the remuneration framework incorporates at risk components through STI and LTI arrangements tailored to the particular executive by reference to both financial and other metrics which generate value for shareholders. In accordance with best practice corporate governance, the structure of NED and executive remuneration is separate and distinct.
The Board assumes full responsibility for compensation policies and packages applicable to Directors and senior executives of the Company. The broad compensation policy is to ensure the compensation package appropriately reflects the person’s duties and responsibilities, and that compensation levels are competitive in attracting, retaining and motivating people who possess the requisite level of skill and experience. Employees may receive at-risk incentive payments remunerated as cash or share options based on the achievement of specific goals related to the performance of the individual and the Company (as determined by the Directors). Incentives are provided to senior executives and employees for the achievement of individual and strategic objectives with the broader view of creating value for shareholders.
BLU
ECH
IIP LIM
ITED
AN
NU
AL REPO
RT 201919
Remuneration Report
For
per
sona
l use
onl
y
Components of total compensation are ‘at risk’ (variable compensation) and dependent on meeting pre-determined performance benchmarks including Key Performance Indicators (KPIs). The inclusion of appropriate challenging performance hurdles in relation to variable compensation is designed to align employee performance with the creation of shareholder value and wealth. KPIs are agreed and set each year for KMP with the specific objective of influencing both short and long- term performance and the generation of shareholder wealth.
Variable or performance-linked compensation comprises cash bonus and/or share-based payments.
Fixed CompensationFixed compensation consists of a base salary and employer superannuation contributions. Fixed compensation levels are set so as to provide a base level of compensation which is both appropriate to the position and is competitive in the market.
Fixed compensation is reviewed at least annually by the Remuneration and Nomination Committee and the process consists of a review of the Company’s performance, relevant comparative compensation in the market and, where appropriate, external advice on policies and practices. Employees receive their fixed compensation in cash. The Board’s policy is to ensure that fixed remuneration is market competitive having regard to industry peers and companies of similar financial size. Given the Company’s size the Company generally undertakes its own review of these matters, which it does on an ongoing basis.
KPIs are individually tailored by the Board, based on recommendations and input from the Remuneration & Nomination Committee in advance for each employee each year, and reflect an assessment of how that employee can fulfil his or her particular responsibilities in a way that best contributes to Company performance and shareholder wealth in that year with close alignment to the role and responsibility within the organisation and in conjunction with the strategic objectives of the Company.
Performance Linked CompensationAll employees are potentially eligible to receive at- risk incentive payments and/or securities (shares or options) based on the achievement of specific goals related to (i) performance against individual KPI’s and/ or (ii) the performance of the Company as a whole as determined by the Board based on a range of factors, both financial and non-financial. These factors include traditional financial considerations such as operating
performance, cash consumption and deals concluded and also industry-specific factors. The purpose of these payments is to reward employees for their contribution to the Company.
Employment contracts for staff other than the CEO provide for variable compensation of up to 10% of their total fixed compensation package (although higher variable compensation payments may be made at the Board’s discretion).
The Remuneration & Nomination Committee makes a recommendation annually to the Board in respect of incentive compensation for employees and executives. The Board at its sole discretion determines the total amount of variable compensation payable as a percentage of the total annualised salaries for all employees employed as at the end of the financial year (with pro rata reductions to the annualised salary made for any employee not employed for the entire financial year).
The CEO has the discretion to recommend the offer of rights or options to acquire ordinary shares or the direct issue of shares to any member of staff in recognition of exemplary performance. Such securities may be fully vested upon issue given that they are issued as a reward for past performance rather than as a long-term incentive. Any issue of rights or options proposed as incentive compensation requires approval by the Board and is subject to any limitations imposed by the Corporations Act and the ASX Listing Rules. The Board considers that the performance linked compensation structure is operating effectively.
At, or as soon as practicable after, the beginning of the financial year, individual and team performance for the previous year is assessed for every employee by their manager and new objectives set for the forthcoming year. These objectives include department and project specific objectives together with individual stretch objectives, challenging, realistic and personal development objectives tailored to the employee’s role within the organisation. Measurement, management support, target dates and training course requirements are all set. Progress against the objectives is reviewed during the year and percentage achievement concluded at the end of the year, whereupon the cycle recommences. The outputs of this process form the basis of the assessment of the individual’s personal incentive compensation.
The Board has discretion to reduce, cancel or clawback any unvested performance-based remuneration in the event of serious misconduct or a material misstatement in the Group’s financial statements.
20
Remuneration Report
For
per
sona
l use
onl
y
Variable Compensation – Short-term Incentive (STI)The Company does not operate a formal STI program other than in respect of the CEO. The CEO is eligible to receive a cash bonus subject to the attainment of defined KPIs. The STI is based on the achievement of financial and non-financial objectives. The actual STI payment awarded to the CEO will depend on the extent to which specific targets set at the beginning of the year are met but potentially could be an amount of up to 30% of the CEO’s base remuneration package. Financial performance targets include net sales target and EBITDA. Non- financial performance targets include individual objectives which are aligned to the Group’s strategy. The Company has predetermined financial performance benchmarks which must be met in order to trigger payments under the STI plan and these are varied on a yearly basis in line with annual budgeting process.
A summary of the measures and weightings are set out below.
An amount of $188,448 (2018: $124,137) has been recognised in the 2019 financial year by way of share based payment expense. This is in respect of performance rights (unvested) issued.
Service ContractsRemuneration arrangements for executives are formalised in employment agreements. The following outlines the details of contracts with executives.
Chief Executive OfficerThe CEO, Andrew McLellan, is employed under an ongoing employment contract which can be terminated with notice by either party.
The key terms of the contract are as follows:
• Annual base Salary of $300,000 including superannuation;
• Short-term cash Incentive being up to 30% of Andrew McLellan’s annual base salary, payable on the achievement of agreed annual performance targets;
• Treatment of entitlements upon termination of employment are as follows:
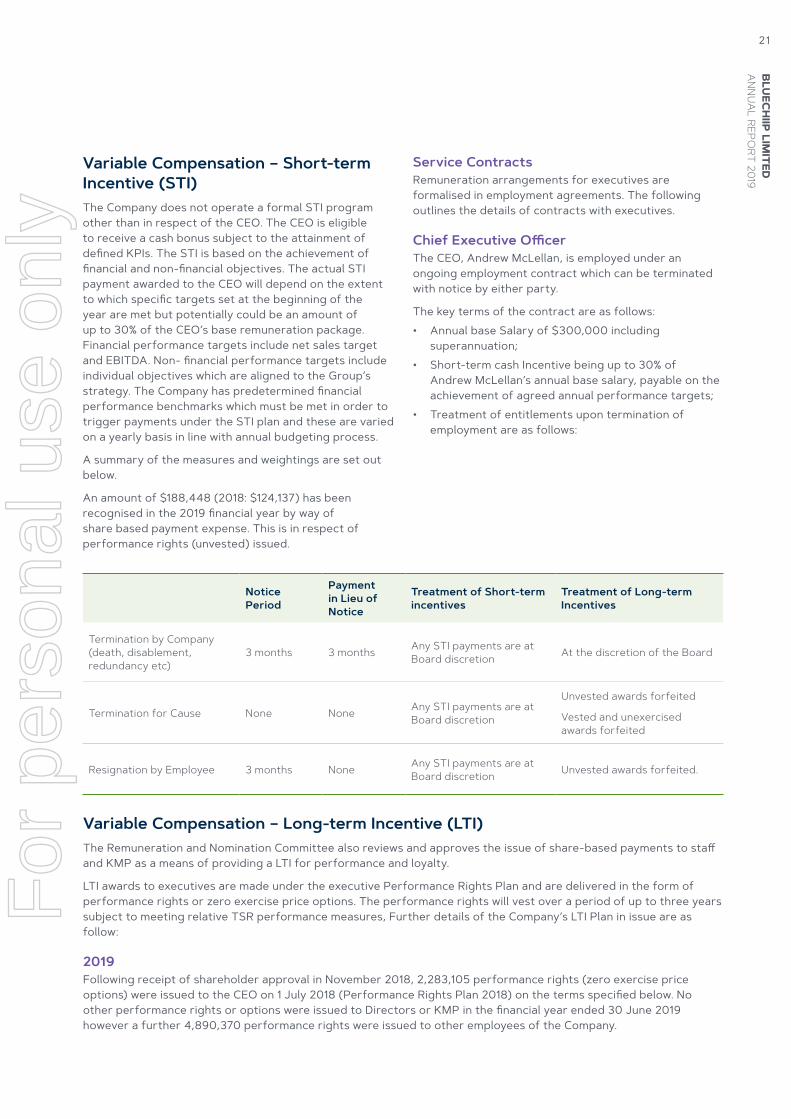
Notice Period
Payment in Lieu of Notice
Treatment of Short-term incentives
Treatment of Long-term Incentives
Termination by Company (death, disablement, redundancy etc)
3 months 3 months Any STI payments are at Board discretion At the discretion of the Board
Termination for Cause None None Any STI payments are at Board discretion
Unvested awards forfeited
Vested and unexercised awards forfeited
Resignation by Employee 3 months None Any STI payments are at Board discretion Unvested awards forfeited.
Variable Compensation – Long-term Incentive (LTI)The Remuneration and Nomination Committee also reviews and approves the issue of share-based payments to staff and KMP as a means of providing a LTI for performance and loyalty.
LTI awards to executives are made under the executive Performance Rights Plan and are delivered in the form of performance rights or zero exercise price options. The performance rights will vest over a period of up to three years subject to meeting relative TSR performance measures, Further details of the Company’s LTI Plan in issue are as follow:
2019Following receipt of shareholder approval in November 2018, 2,283,105 performance rights (zero exercise price options) were issued to the CEO on 1 July 2018 (Performance Rights Plan 2018) on the terms specified below. No other performance rights or options were issued to Directors or KMP in the financial year ended 30 June 2019 however a further 4,890,370 performance rights were issued to other employees of the Company.
BLU
ECH
IIP LIM
ITED
AN
NU
AL REPO
RT 201921
For
per
sona
l use
onl
y
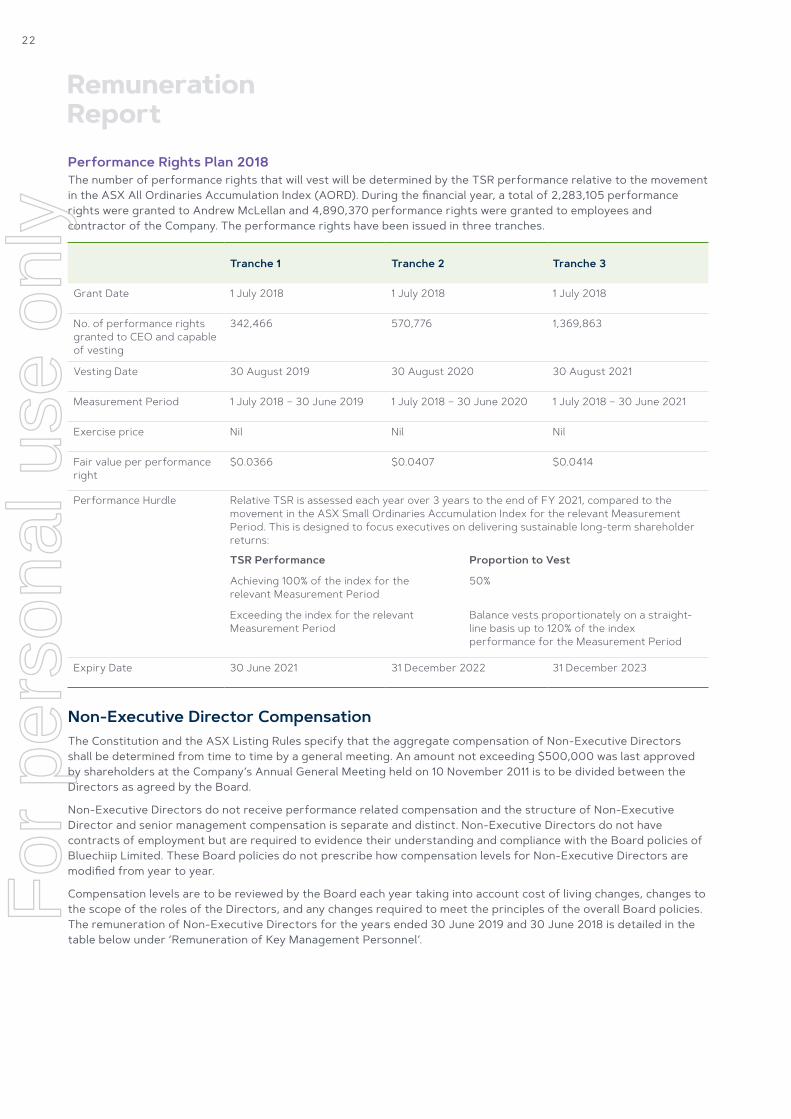
Performance Rights Plan 2018The number of performance rights that will vest will be determined by the TSR performance relative to the movement in the ASX All Ordinaries Accumulation Index (AORD). During the financial year, a total of 2,283,105 performance rights were granted to Andrew McLellan and 4,890,370 performance rights were granted to employees and contractor of the Company. The performance rights have been issued in three tranches.
Tranche 1 Tranche 2 Tranche 3
Grant Date 1 July 2018 1 July 2018 1 July 2018
No. of performance rights granted to CEO and capable of vesting
342,466 570,776 1,369,863
Vesting Date 30 August 2019 30 August 2020 30 August 2021
Measurement Period 1 July 2018 – 30 June 2019 1 July 2018 – 30 June 2020 1 July 2018 – 30 June 2021
Exercise price Nil Nil Nil
Fair value per performance right
$0.0366 $0.0407 $0.0414
Performance Hurdle Relative TSR is assessed each year over 3 years to the end of FY 2021, compared to the movement in the ASX Small Ordinaries Accumulation Index for the relevant Measurement Period. This is designed to focus executives on delivering sustainable long-term shareholder returns:
TSR Performance Proportion to Vest
Achieving 100% of the index for the 50% relevant Measurement Period
Exceeding the index for the relevant Balance vests proportionately on a straight-Measurement Period line basis up to 120% of the index performance for the Measurement Period
Expiry Date 30 June 2021 31 December 2022 31 December 2023
Non-Executive Director CompensationThe Constitution and the ASX Listing Rules specify that the aggregate compensation of Non-Executive Directors shall be determined from time to time by a general meeting. An amount not exceeding $500,000 was last approved by shareholders at the Company’s Annual General Meeting held on 10 November 2011 is to be divided between the Directors as agreed by the Board.
Non-Executive Directors do not receive performance related compensation and the structure of Non-Executive Director and senior management compensation is separate and distinct. Non-Executive Directors do not have contracts of employment but are required to evidence their understanding and compliance with the Board policies of Bluechiip Limited. These Board policies do not prescribe how compensation levels for Non-Executive Directors are modified from year to year.
Compensation levels are to be reviewed by the Board each year taking into account cost of living changes, changes to the scope of the roles of the Directors, and any changes required to meet the principles of the overall Board policies. The remuneration of Non-Executive Directors for the years ended 30 June 2019 and 30 June 2018 is detailed in the table below under ‘Remuneration of Key Management Personnel’.
22
Remuneration Report
For
per
sona
l use
onl
y
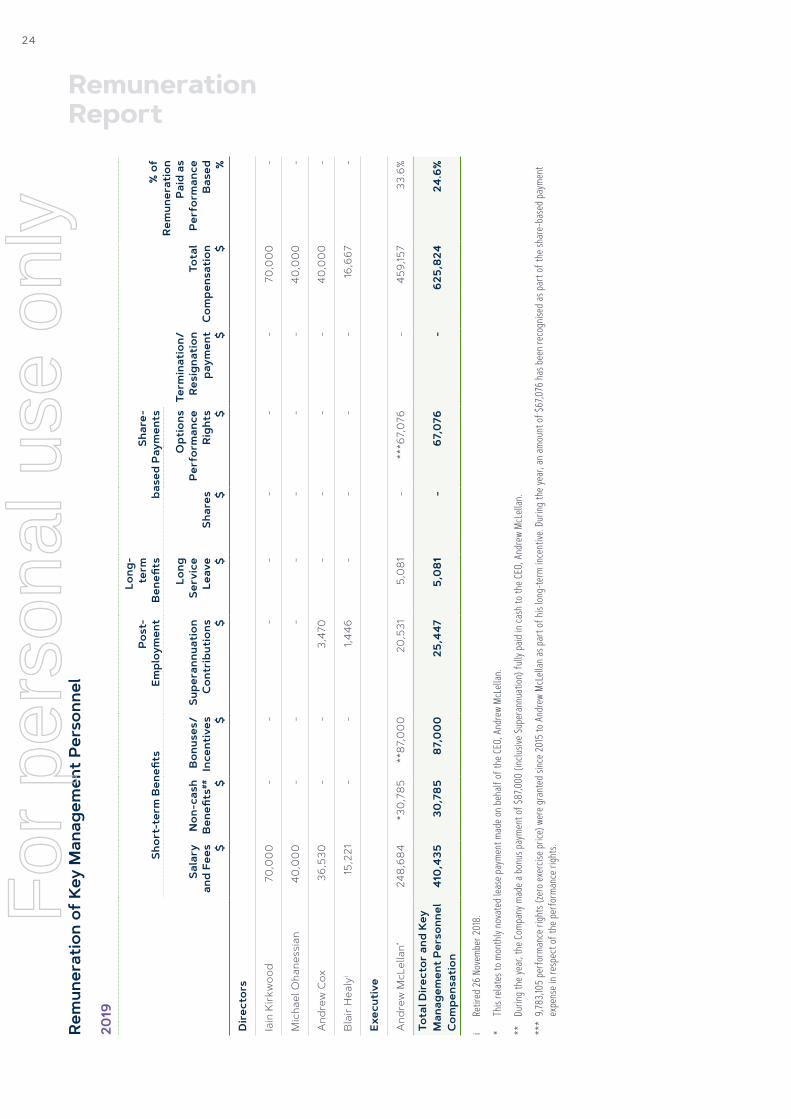
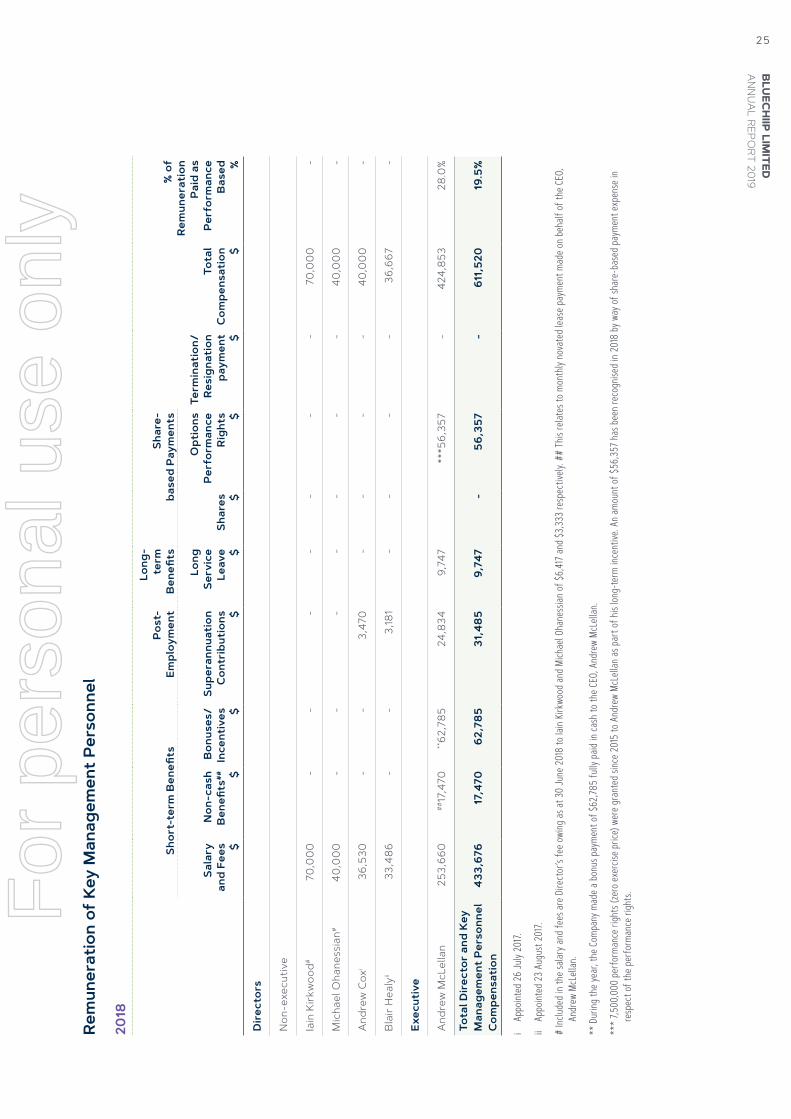
Directors’ and Executive Officers’ Compensation TablesDetails of the nature and amount of each major element of the compensation of each KMP including Directors of the Company are disclosed in accordance with Accounting Standard AASB 124 Related Party Disclosures and with the Corporations Act 2001 in the following tables.
No options or performance rights held by persons in the ‘Remuneration of Key Management Personnel’ table were exercised during the 2019 financial year other than 1,375,000 performance rights held by the CEO, Andrew McLellan which vested and were exercised during the financial year (2018: 1,375,000).
In the table, the fair value of the performance rights granted to executive officers has been calculated based on the value at the date of grant using a hybrid trinomial option pricing model which uses a combination of Monte Carlo Simulation and a trinomial lattice to model the performance of the Company’s shares and the individual shares within the selected peer group, taking into account their individual volatilities and correlations. The value as disclosed is the portion of the fair value of the performance rights allocated to this reporting year. Refer to the next sections of this report for full details of the performance rights valuations.
LoanThere were no loans to any Directors or KMPs during the financial year (2018: Nil).
Other Transactions and Balances With KMPDuring the financial year, there was no other transactions nor balances outstanding at the end of the reporting period with its directors and KMP.
BLU
ECH
IIP LIM
ITED
AN
NU
AL REPO
RT 201923
For
per
sona
l use
onl
y
Rem
uner
atio
n of
Key
Man
agem
ent
Pers
onne
l
2019
Shor
t-te
rm B
enefi
tsPo
st-
Empl
oym
ent
Long
- te
rm
Ben
efits
Shar
e-
base
d Pa
ymen
ts
Term
inat
ion/
Re
sign
atio
n pa
ymen
t $
Tota
l C
ompe
nsat
ion $
% o
f Re
mun
erat
ion
Paid
as
Perf
orm
ance
B
ased
%
Sala
ry
and
Fees
$
Non
-cas
h B
enefi
ts#
# $
Bon
uses
/ In
cent
ives
$
Supe
rann
uati
on
Con
trib
utio
ns $
Long
Se
rvic
e Le
ave $
Shar
es $
Opt
ions
Pe
rfor
man
ce
Righ
ts $
Dir
ecto
rs
Iain
Kir
kwoo
d70
,00
0-
--
--
--
70,0
00
-
Mic
hael
Oha
ness
ian
40,
00
0-
--
--
--
40,
00
0-
And
rew
Cox
36,5
30-
-3,
470
--
--
40,
00
0-
Bla
ir H
ealy
i15
,221
--
1,44
6-
--
-16
,667
-
Exec
utiv
e
And
rew
McL
ella
n*24
8,68
4*3
0,78
5**
87,0
00
20,5
315,
081
-**
*67,
076
-45
9,15
733
.6%
Tota
l Dir
ecto
r an
d Ke
y M
anag
emen
t Pe
rson
nel
Com
pens
atio
n41
0,43
530
,785
87,0
00
25,4
475,
081
-67
,076
-62
5,82
424
.6%
i Re
tired
26
Nove
mber
201
8.
* Th
is re
lates
to m
onth
ly no
vate
d lea
se p
ayme
nt m
ade o
n be
half
of th
e CEO
, And
rew
McLe
llan.
**
Durin
g the
year
, the
Com
pany
mad
e a b
onus
pay
ment
of $
87,0
00 (i
nclus
ive Su
pera
nnua
tion)
fully
paid
in ca
sh to
the C
EO, A
ndre
w Mc
Lella
n.
***
9,783
,105
perfo
rman
ce ri
ghts
(zero
exer
cise p
rice)
wer
e gra
nted
sinc
e 201
5 to
And
rew
McLe
llan
as p
art o
f his
long-
term
ince
ntive
. Dur
ing th
e yea
r, an
amou
nt of
$67
,076
has
bee
n re
cogn
ised a
s par
t of t
he sh
are-
base
d pay
ment
ex
pens
e in
resp
ect o
f the
per
form
ance
righ
ts.
24
Remuneration Report
For
per
sona
l use
onl
y
Rem
uner
atio
n of
Key
Man
agem
ent
Pers
onne
l
2018
Shor
t-te
rm B
enefi
tsPo
st-
Empl
oym
ent
Long
- te
rm
Ben
efits
Shar
e-
base
d Pa
ymen
ts
Term
inat
ion/
Re
sign
atio
n pa
ymen
t $
Tota
l C
ompe
nsat
ion $
% o
f Re
mun
erat
ion
Paid
as
Perf
orm
ance
B
ased
%
Sala
ry
and
Fees
$
Non
-cas
h B
enefi
ts#
#
$
Bon
uses
/ In
cent
ives
$
Supe
rann
uati
on
Con
trib
utio
ns $
Long
Se
rvic
e Le
ave $
Shar
es $
Opt
ions
Pe
rfor
man
ce
Righ
ts $
Dir
ecto
rs
Non
-exe
cutiv
e
Iain
Kir
kwoo
d#70
,00
0-
--
--
--
70,0
00
-
Mic
hael
Oha
ness
ian#
40,
00
0-
--
--
--
40,
00
0-
And
rew
Cox
i36
,530
--
3,47
0-
--
-4
0,0
00
-
Bla
ir H
ealy
ii33
,486
--
3,18
1-
--
-36
,667
-
Exec
utiv
e
And
rew
McL
ella
n25
3,66
0#
#17
,470
**62
,785
24,8
349,
747
***5
6,35
7-
424,
853
28.0
%
Tota
l Dir
ecto
r an
d Ke
y M
anag
emen
t Pe
rson
nel
Com
pens
atio
n43
3,67
617
,470
62,7
8531
,485
9,74
7-
56,3
57-
611,
520
19.5
%
i Ap
point
ed 2
6 Ju
ly 20
17.
ii Ap
point
ed 2
3 Au
gust
2017.
# Inc
luded
in th
e sala
ry an
d fee
s are
Dire
ctor
’s fe
e owi
ng as
at 3
0 Ju
ne 2
018
to Ia
in Kir
kwoo
d and
Mich
ael O
hane
ssian
of $
6,41
7 an
d $3,
333
resp
ectiv
ely. #
# Th
is re
lates
to m
onth
ly no
vate
d lea
se p
ayme
nt m
ade o
n be
half
of th
e CEO
, An
drew
McL
ellan
.
** D
uring
the y
ear,
the C
ompa
ny m
ade a
bon
us p
ayme
nt of
$62
,785
fully
paid
in ca
sh to
the C
EO, A
ndre
w Mc
Lella
n.
*** 7
,500
,000
per
form
ance
righ
ts (ze
ro ex
ercis
e pric
e) w
ere g
rant
ed si
nce 2
015
to A
ndre
w Mc
Lella
n as
par
t of h
is lon
g-te
rm in
cent
ive. A
n am
ount
of $5
6,35
7 ha
s bee
n re
cogn
ised i
n 20
18 b
y way
of sh
are-
base
d pay
ment
expe
nse i
n re
spec
t of t
he p
erfo
rman
ce ri
ghts
.
BLU
ECH
IIP LIM
ITED
AN
NU
AL REPO
RT 201925
For
per
sona
l use
onl
y
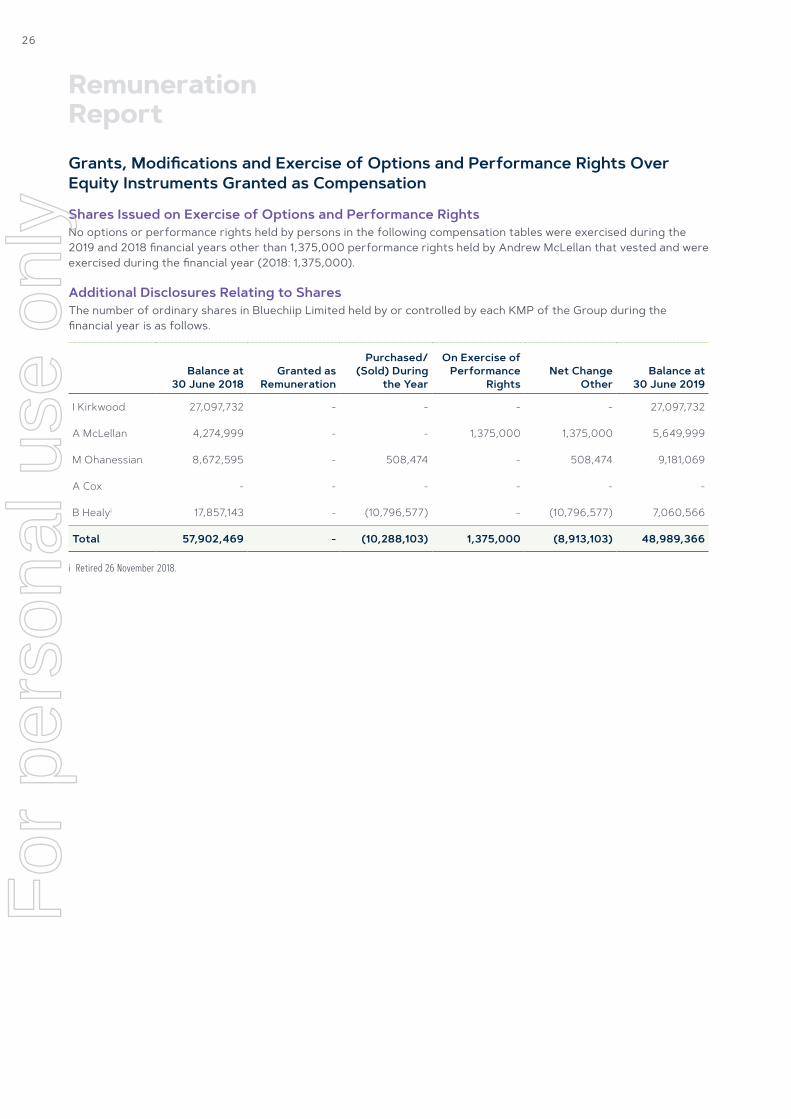
Grants, Modifications and Exercise of Options and Performance Rights Over Equity Instruments Granted as Compensation
Shares Issued on Exercise of Options and Performance RightsNo options or performance rights held by persons in the following compensation tables were exercised during the 2019 and 2018 financial years other than 1,375,000 performance rights held by Andrew McLellan that vested and were exercised during the financial year (2018: 1,375,000).
Additional Disclosures Relating to SharesThe number of ordinary shares in Bluechiip Limited held by or controlled by each KMP of the Group during the financial year is as follows.
Balance at 30 June 2018
Granted as Remuneration
Purchased/ (Sold) During
the Year
On Exercise of Performance
RightsNet Change
OtherBalance at
30 June 2019
I Kirkwood 27,097,732 - - - - 27,097,732
A McLellan 4,274,999 - - 1,375,000 1,375,000 5,649,999
M Ohanessian 8,672,595 - 508,474 - 508,474 9,181,069
A Cox - - - - - -
B Healyi 17,857,143 - (10,796,577) - (10,796,577) 7,060,566
Total 57,902,469 - (10,288,103) 1,375,000 (8,913,103) 48,989,366
i Retired 26 November 2018.
26
Remuneration Report
For
per
sona
l use
onl
y
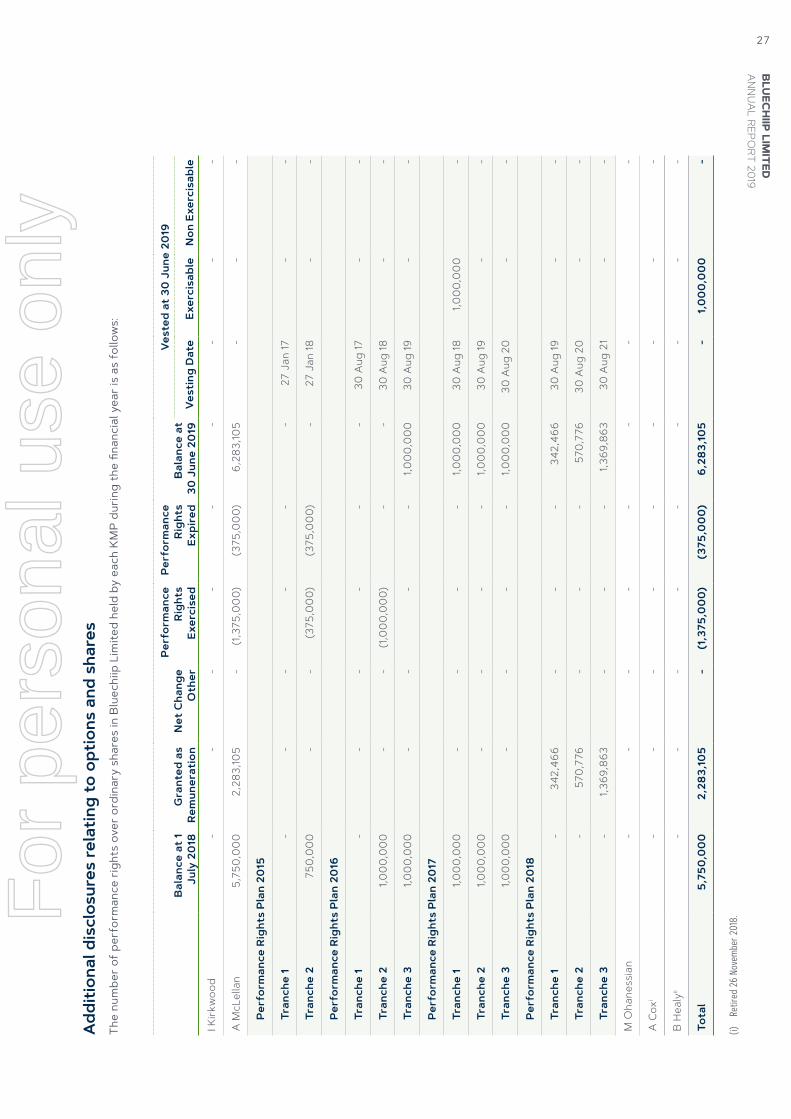
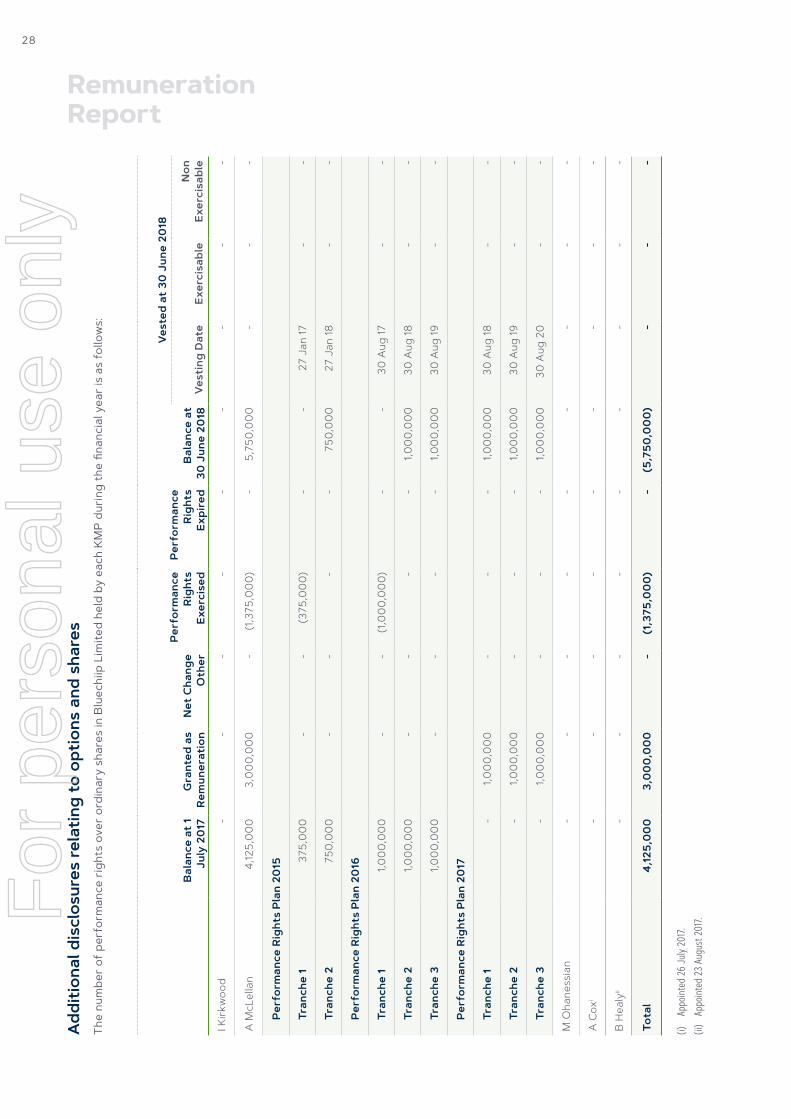
Add
ition
al d
iscl
osur
es re
latin
g to
opt
ions
and
sha
res
The
num
ber
of p
erfo
rman
ce r
ight
s ov
er o
rdin
ary
shar
es in
Blu
echi
ip L
imite
d he
ld b
y ea
ch K
MP
duri
ng t
he fi
nanc
ial y
ear
is a
s fo
llow
s:
Bal
ance
at
1 Ju
ly 2
018
Gra
nted
as
Rem
uner
atio
nN
et C
hang
e O
ther
Perf
orm
ance
Ri
ghts
Ex
erci
sed
Perf
orm
ance
Ri
ghts
Ex
pire
dB
alan
ce a
t 30
Jun
e 20
19
Vest
ed a
t 30
Jun
e 20
19
Vest
ing
Dat
eEx
erci
sabl
eN
on E
xerc
isab
le
I Kir
kwoo
d-
--
--
--
--
A M
cLel
lan
5,75
0,0
00
2,28
3,10
5-
(1,3
75,0
00)
(375
,00
0)6,
283,
105
--
-
Perf
orm
ance
Rig
hts
Pla
n 20
15
Tran
che
1-
--
--
-27
Jan
17-
-
Tran
che
275
0,0
00
--
(375
,00
0)(3
75,0
00)
-27
Jan
18-
-
Perf
orm
ance
Rig
hts
Pla
n 20
16
Tran
che
1-
--
--
-30
Aug
17-
-
Tran
che
21,0
00,
00
0-
-(1
,00
0,0
00)
--
30 A
ug 18
--
Tran
che
31,0
00,
00
0-
--
-1,0
00,
00
030
Aug
19-
-
Perf
orm
ance
Rig
hts
Pla
n 20
17
Tran
che
11,0
00,
00
0-
--
-1,0
00,
00
030
Aug
181,0
00,
00
0-
Tran
che
21,0
00,
00
0-
--
-1,0
00,
00
030
Aug
19-
-
Tran
che
31,0
00,
00
0-
--
-1,0
00,
00
030
Aug
20
--
Perf
orm
ance
Rig
hts
Pla
n 20
18
Tran
che
1-
342,
466
--
-34
2,4
6630
Aug
19-
-
Tran
che
2-
570,
776
--
-57
0,77
630
Aug
20
--
Tran
che
3-
1,369
,863
--
-1,3
69,8
6330
Aug
21
--
M O
hane
ssia
n-
--
--
--
-
A C
oxi
--
--
--
--
-
B H
ealy
ii-
--
--
--
--
Tota
l5,
750,
00
02,
283,
105
-(1
,375
,00
0)(3
75,0
00)
6,28
3,10
5-
1,0
00,
00
0-
(i)
Retir
ed 2
6 No
vemb
er 2
018.
BLU
ECH
IIP LIM
ITED
AN
NU
AL REPO
RT 201927
For
per
sona
l use
onl
y
Add
ition
al d
iscl
osur
es re
latin
g to
opt
ions
and
sha
res
The
num
ber
of p
erfo
rman
ce r
ight
s ov
er o
rdin
ary
shar
es in
Blu
echi
ip L
imite
d he
ld b
y ea
ch K
MP
duri
ng t
he fi
nanc
ial y
ear
is a
s fo
llow
s:
Bal
ance
at
1 Ju
ly 2
017
Gra
nted
as
Rem
uner
atio
nN
et C
hang
e O
ther
Perf
orm
ance
Ri
ghts
Ex
erci
sed
Perf
orm
ance
Ri
ghts
Ex
pire
dB
alan
ce a
t 30
Jun
e 20
18
Vest
ed a
t 30
Jun
e 20
18
Vest
ing
Dat
eEx
erci
sabl
eN
on
Exer
cisa
ble
I Kir
kwoo
d-
--
--
--
--
A M
cLel
lan
4,12
5,0
00
3,0
00,
00
0-
(1,3
75,0
00)
-5,
750,
00
0-
--
Perf
orm
ance
Rig
hts
Pla
n 20
15
Tran
che
137
5,0
00
--
(375
,00
0)-
-27
Jan
17-
-
Tran
che
275
0,0
00
--
--
750,
00
027
Jan
18-
-
Perf
orm
ance
Rig
hts
Pla
n 20
16
Tran
che
11,0
00,
00
0-
-(1
,00
0,0
00)
--
30 A
ug 17
--
Tran
che
21,0
00,
00
0-
--
-1,0
00,
00
030
Aug
18-
-
Tran
che
31,0
00,
00
0-
--
-1,0
00,
00
030
Aug
19-
-
Perf
orm
ance
Rig
hts
Pla
n 20
17
Tran
che
1-
1,00
0,0
00
--
-1,0
00,
00
030
Aug
18-
-
Tran
che
2-
1,00
0,0
00
--
-1,0
00,
00
030
Aug
19-
-
Tran
che
3-
1,00
0,0
00
--
-1,0
00,
00
030
Aug
20
--
M O
hane
ssia
n-
--
--
--
--
A C
oxi
--
--
--
--
-
B H
ealy
ii-
--
--
--
--
Tota
l4,
125,
00
03,
00
0,0
00
-(1
,375
,00
0)-
(5,7
50,0
00)
--
-
(i)
Appo
inted
26
July
2017.
(ii)
Appo
inted
23
Augu
st 20
17.
28
Remuneration Report
For
per
sona
l use
onl
y
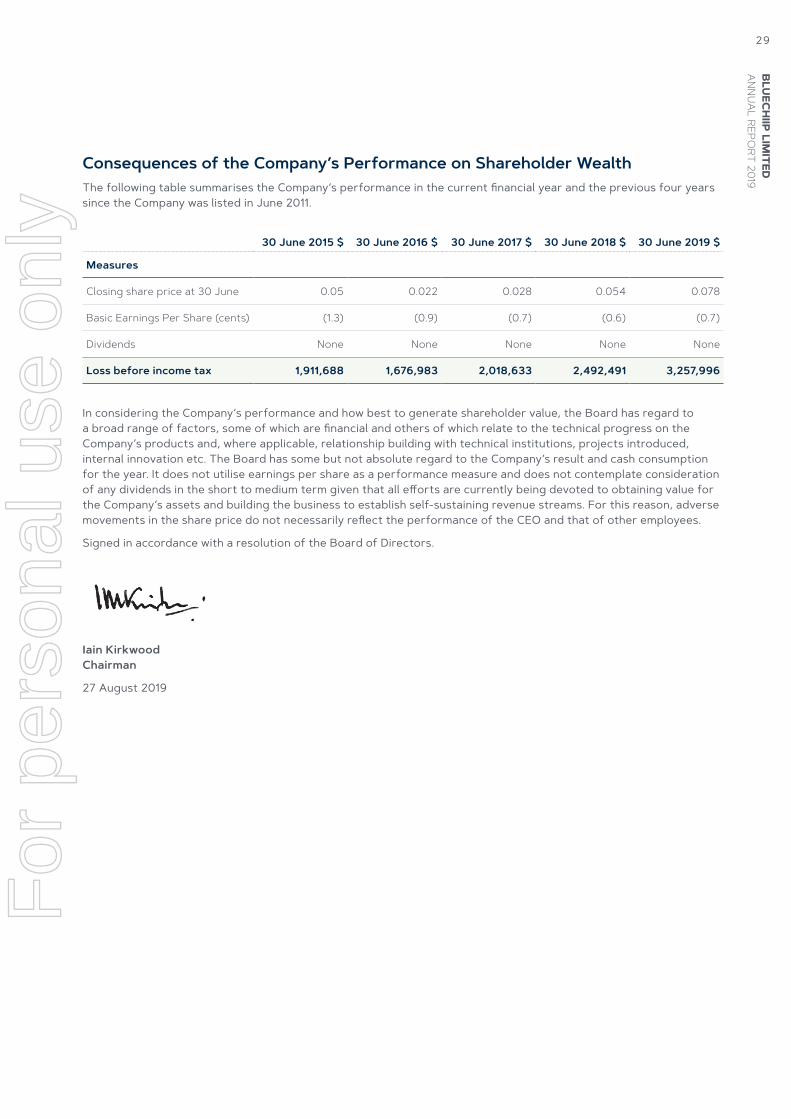
Consequences of the Company’s Performance on Shareholder WealthThe following table summarises the Company’s performance in the current financial year and the previous four years since the Company was listed in June 2011.
30 June 2015 $ 30 June 2016 $ 30 June 2017 $ 30 June 2018 $ 30 June 2019 $
Measures
Closing share price at 30 June 0.05 0.022 0.028 0.054 0.078
Basic Earnings Per Share (cents) (1.3) (0.9) (0.7) (0.6) (0.7)
Dividends None None None None None
Loss before income tax 1,911,688 1,676,983 2,018,633 2,492,491 3,257,996
In considering the Company’s performance and how best to generate shareholder value, the Board has regard to a broad range of factors, some of which are financial and others of which relate to the technical progress on the Company’s products and, where applicable, relationship building with technical institutions, projects introduced, internal innovation etc. The Board has some but not absolute regard to the Company’s result and cash consumption for the year. It does not utilise earnings per share as a performance measure and does not contemplate consideration of any dividends in the short to medium term given that all efforts are currently being devoted to obtaining value for the Company’s assets and building the business to establish self-sustaining revenue streams. For this reason, adverse movements in the share price do not necessarily reflect the performance of the CEO and that of other employees.
Signed in accordance with a resolution of the Board of Directors.
Iain Kirkwood Chairman
27 August 2019
BLU
ECH
IIP LIM
ITED
AN
NU
AL REPO
RT 201929
For
per
sona
l use
onl
y

The board of Directors of Bluechiip Limited is responsible for establishing the corporate governance framework of the Group having regard to the ASX Corporate Governance Council (CGC) published guidelines (3rd edition) as well as its corporate governance principles and recommendations. The Board guides and monitors the business and affairs of Bluechiip Limited on behalf of the shareholders by whom they are elected and to whom they are accountable.
An overview of the Company’s corporate governance structures and practices is published on the Company’s website at www.bluechiip.com/investor/corporate-governance-policies.
The 2018/2019 Corporate Governance Statement is dated as at 27 August 2019 and reflects the corporate governance practices in place throughout the reporting period. The Corporate Governance Statement was approved by the Board on 27 August 2019 and can be viewed at www.bluechiip.com/investor/corporate-governance-policies.
30
Corporate Governance
For
per
sona
l use
onl
y
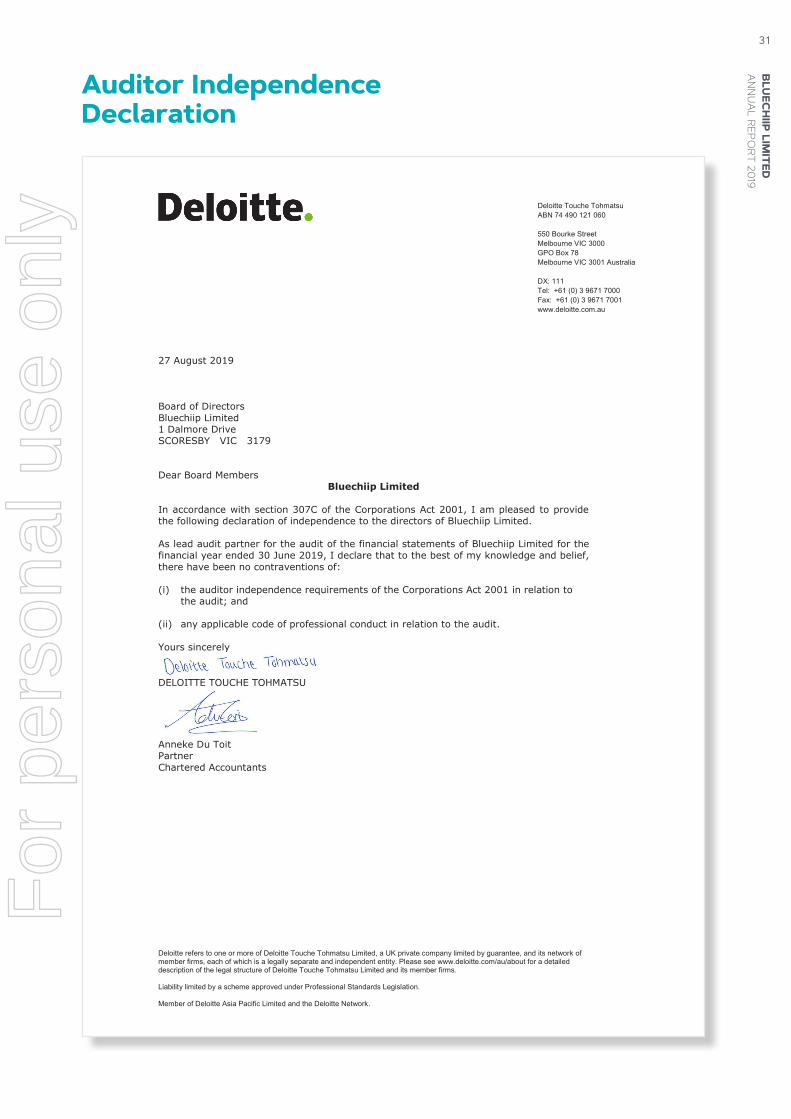
Deloitte refers to one or more of Deloitte Touche Tohmatsu Limited, a UK private company limited by guarantee, and its network of member firms, each of which is a legally separate and independent entity. Please see www.deloitte.com/au/about for a detailed description of the legal structure of Deloitte Touche Tohmatsu Limited and its member firms. Liability limited by a scheme approved under Professional Standards Legislation. Member of Deloitte Asia Pacific Limited and the Deloitte Network.
Deloitte Touche Tohmatsu ABN 74 490 121 060 550 Bourke Street Melbourne VIC 3000 GPO Box 78 Melbourne VIC 3001 Australia DX: 111 Tel: +61 (0) 3 9671 7000 Fax: +61 (0) 3 9671 7001 www.deloitte.com.au
27 August 2019 Board of Directors Bluechiip Limited 1 Dalmore Drive SCORESBY VIC 3179 Dear Board Members
Bluechiip Limited In accordance with section 307C of the Corporations Act 2001, I am pleased to provide the following declaration of independence to the directors of Bluechiip Limited. As lead audit partner for the audit of the financial statements of Bluechiip Limited for the financial year ended 30 June 2019, I declare that to the best of my knowledge and belief, there have been no contraventions of: (i) the auditor independence requirements of the Corporations Act 2001 in relation to
the audit; and
(ii) any applicable code of professional conduct in relation to the audit. Yours sincerely
DELOITTE TOUCHE TOHMATSU
Anneke Du Toit Partner Chartered Accountants
BLU
ECH
IIP LIM
ITED
AN
NU
AL REPO
RT 201931
Auditor Independence Declaration
For
per
sona
l use
onl
y
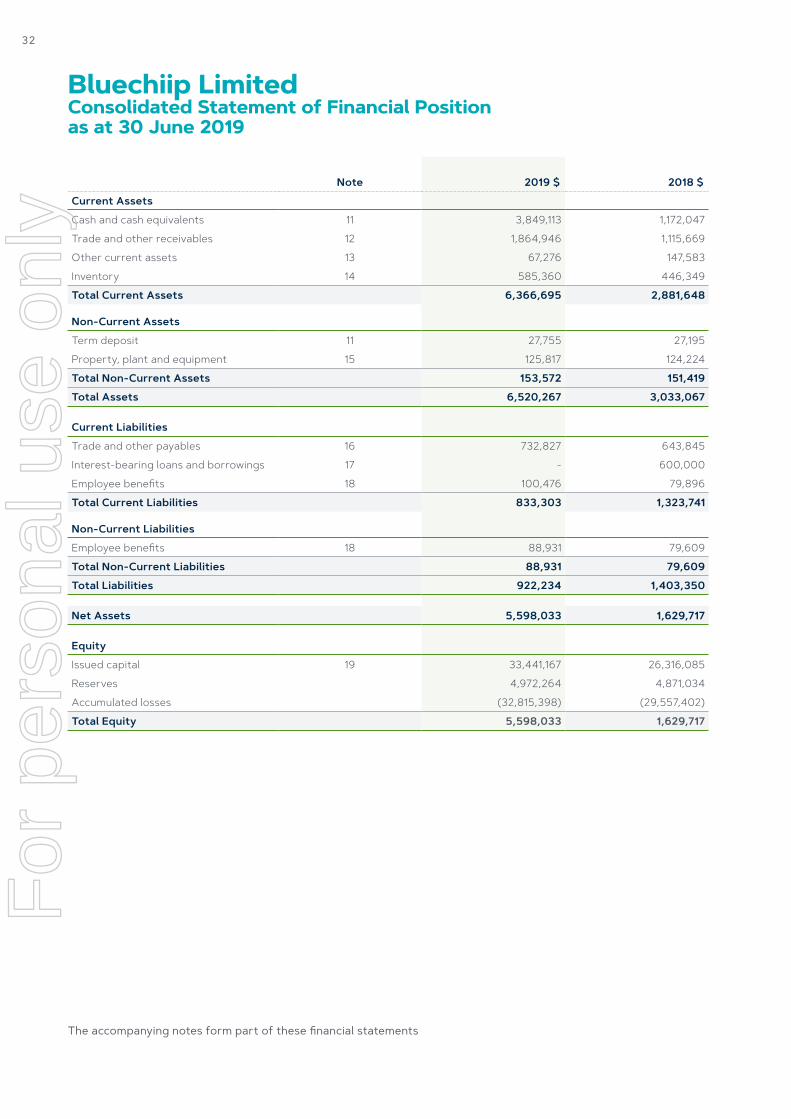
Note 2019 $ 2018 $
Current Assets
Cash and cash equivalents 11 3,849,113 1,172,047
Trade and other receivables 12 1,864,946 1,115,669
Other current assets 13 67,276 147,583
Inventory 14 585,360 446,349
Total Current Assets 6,366,695 2,881,648
Non-Current Assets
Term deposit 11 27,755 27,195
Property, plant and equipment 15 125,817 124,224
Total Non-Current Assets 153,572 151,419
Total Assets 6,520,267 3,033,067
Current Liabilities
Trade and other payables 16 732,827 643,845
Interest-bearing loans and borrowings 17 - 600,000
Employee benefits 18 100,476 79,896
Total Current Liabilities 833,303 1,323,741
Non-Current Liabilities
Employee benefits 18 88,931 79,609
Total Non-Current Liabilities 88,931 79,609
Total Liabilities 922,234 1,403,350
Net Assets 5,598,033 1,629,717
Equity
Issued capital 19 33,441,167 26,316,085
Reserves 4,972,264 4,871,034
Accumulated losses (32,815,398) (29,557,402)
Total Equity 5,598,033 1,629,717
32
Bluechiip Limited Consolidated Statement of Financial Position as at 30 June 2019
The accompanying notes form part of these financial statements
For
per
sona
l use
onl
y
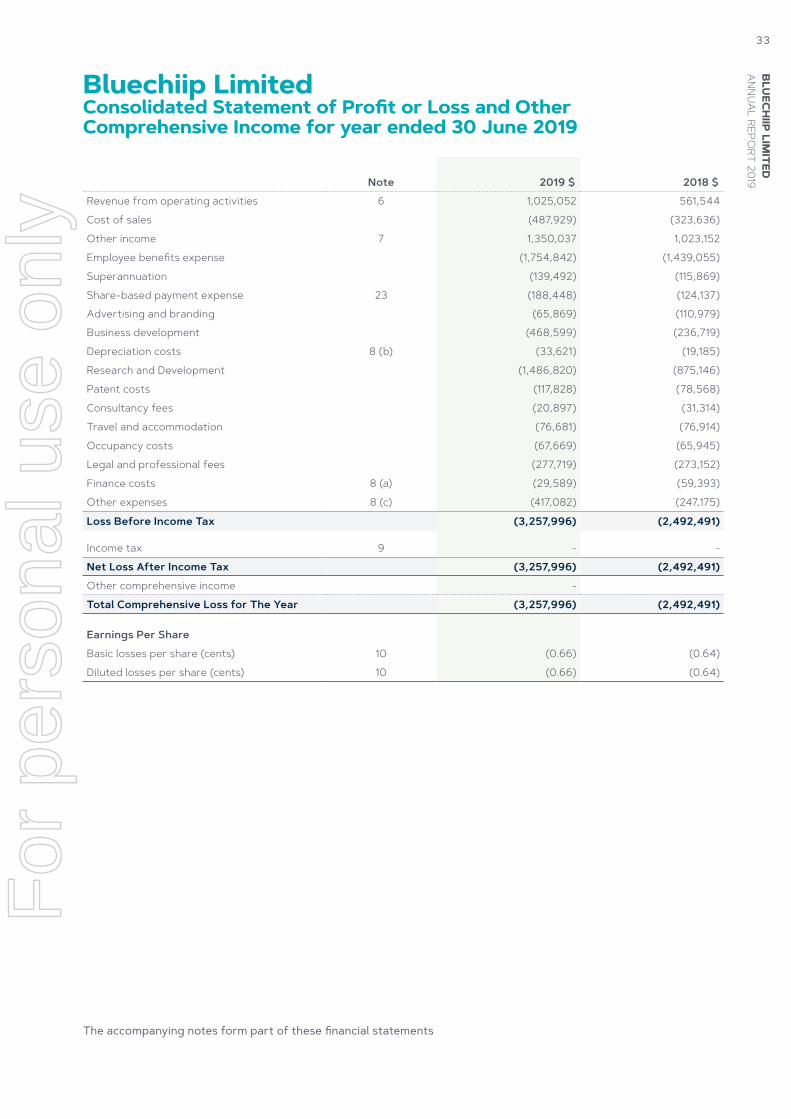
Note 2019 $ 2018 $
Revenue from operating activities 6 1,025,052 561,544
Cost of sales (487,929) (323,636)
Other income 7 1,350,037 1,023,152
Employee benefits expense (1,754,842) (1,439,055)
Superannuation (139,492) (115,869)
Share-based payment expense 23 (188,448) (124,137)
Advertising and branding (65,869) (110,979)
Business development (468,599) (236,719)
Depreciation costs 8 (b) (33,621) (19,185)
Research and Development (1,486,820) (875,146)
Patent costs (117,828) (78,568)
Consultancy fees (20,897) (31,314)
Travel and accommodation (76,681) (76,914)
Occupancy costs (67,669) (65,945)
Legal and professional fees (277,719) (273,152)
Finance costs 8 (a) (29,589) (59,393)
Other expenses 8 (c) (417,082) (247,175)
Loss Before Income Tax (3,257,996) (2,492,491)
Income tax 9 - -
Net Loss After Income Tax (3,257,996) (2,492,491)
Other comprehensive income -
Total Comprehensive Loss for The Year (3,257,996) (2,492,491)
Earnings Per Share
Basic losses per share (cents) 10 (0.66) (0.64)
Diluted losses per share (cents) 10 (0.66) (0.64)
BLU
ECH
IIP LIM
ITED
AN
NU
AL REPO
RT 201933
Bluechiip Limited Consolidated Statement of Profit or Loss and Other Comprehensive Income for year ended 30 June 2019
The accompanying notes form part of these financial statements
For
per
sona
l use
onl
y
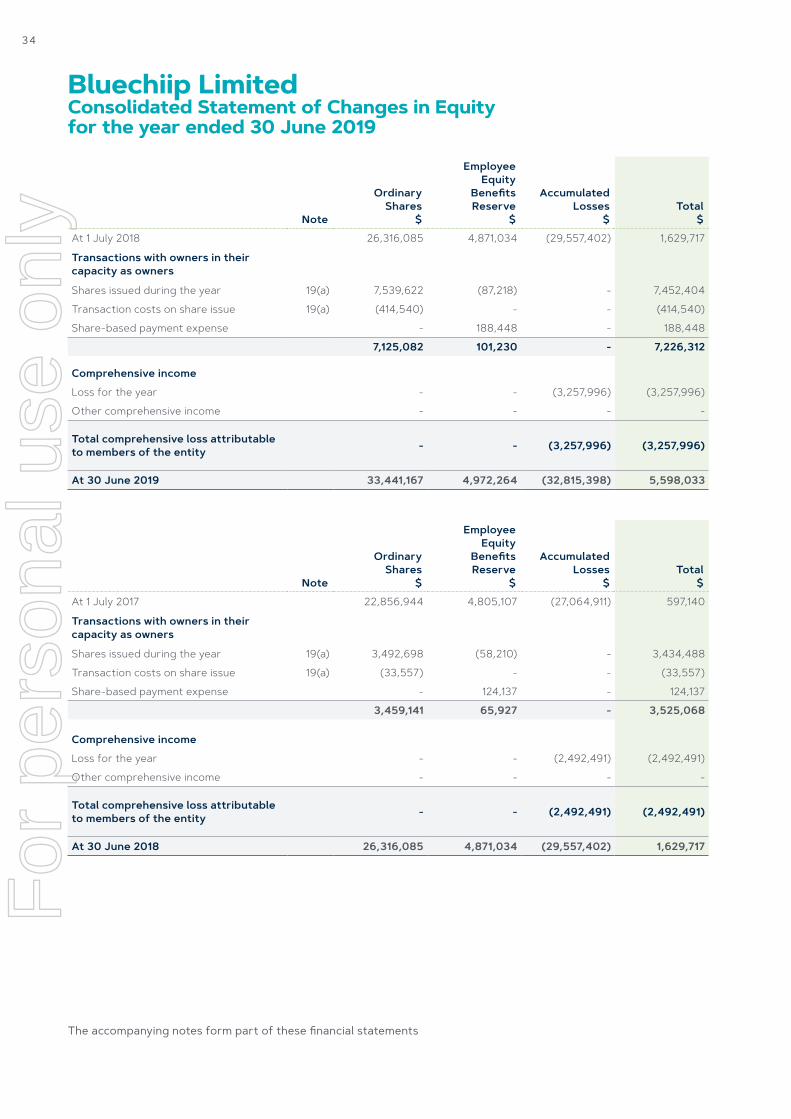
Note
Ordinary Shares
$
Employee Equity
Benefits Reserve
$
Accumulated Losses
$Total
$
At 1 July 2018 26,316,085 4,871,034 (29,557,402) 1,629,717
Transactions with owners in their capacity as owners
Shares issued during the year 19(a) 7,539,622 (87,218) - 7,452,404
Transaction costs on share issue 19(a) (414,540) - - (414,540)
Share-based payment expense - 188,448 - 188,448
7,125,082 101,230 - 7,226,312
Comprehensive income
Loss for the year - - (3,257,996) (3,257,996)
Other comprehensive income - - - -
Total comprehensive loss attributable to members of the entity - - (3,257,996) (3,257,996)
At 30 June 2019 33,441,167 4,972,264 (32,815,398) 5,598,033
Note
Ordinary Shares
$
Employee Equity
Benefits Reserve
$
Accumulated Losses
$Total
$
At 1 July 2017 22,856,944 4,805,107 (27,064,911) 597,140
Transactions with owners in their capacity as owners
Shares issued during the year 19(a) 3,492,698 (58,210) - 3,434,488
Transaction costs on share issue 19(a) (33,557) - - (33,557)
Share-based payment expense - 124,137 - 124,137
3,459,141 65,927 - 3,525,068
Comprehensive income
Loss for the year - - (2,492,491) (2,492,491)
Other comprehensive income - - - -
Total comprehensive loss attributable to members of the entity - - (2,492,491) (2,492,491)
At 30 June 2018 26,316,085 4,871,034 (29,557,402) 1,629,717
34
The accompanying notes form part of these financial statements
Bluechiip Limited Consolidated Statement of Changes in Equity for the year ended 30 June 2019
For
per
sona
l use
onl
y
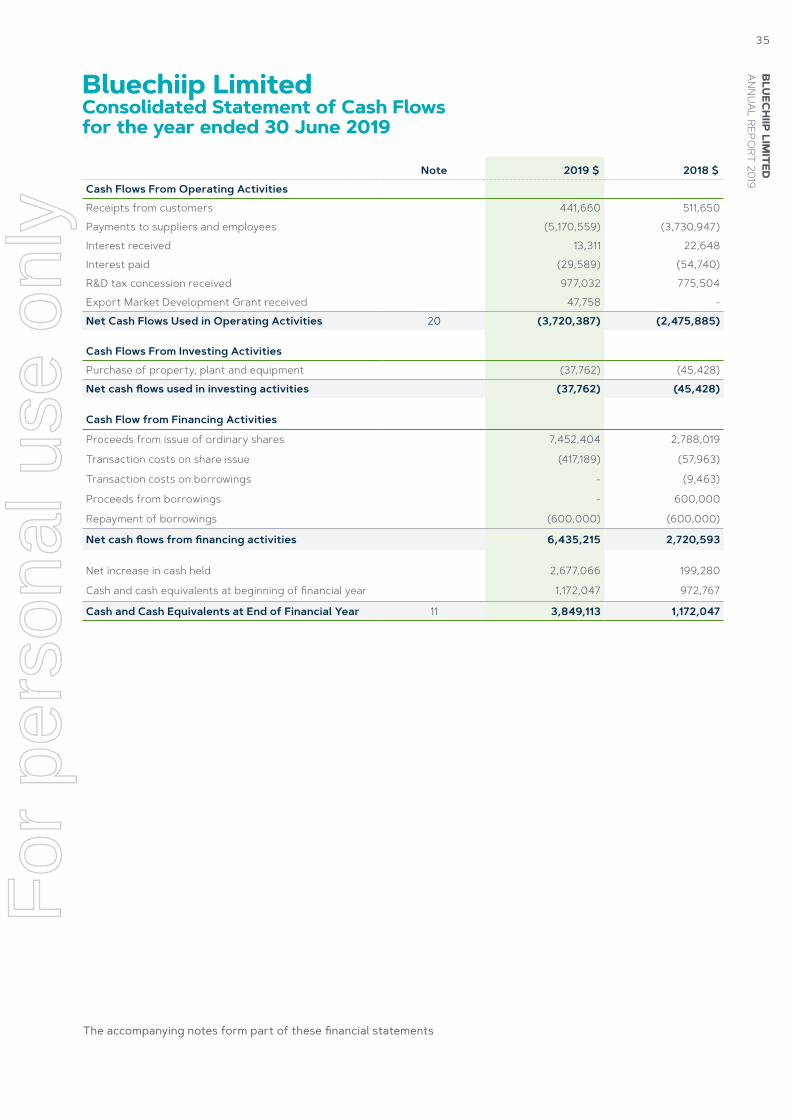
Note 2019 $ 2018 $
Cash Flows From Operating Activities
Receipts from customers 441,660 511,650
Payments to suppliers and employees (5,170,559) (3,730,947)
Interest received 13,311 22,648
Interest paid (29,589) (54,740)
R&D tax concession received 977,032 775,504
Export Market Development Grant received 47,758 -
Net Cash Flows Used in Operating Activities 20 (3,720,387) (2,475,885)
Cash Flows From Investing Activities
Purchase of property, plant and equipment (37,762) (45,428)
Net cash flows used in investing activities (37,762) (45,428)
Cash Flow from Financing Activities
Proceeds from issue of ordinary shares 7,452,404 2,788,019
Transaction costs on share issue (417,189) (57,963)
Transaction costs on borrowings - (9,463)
Proceeds from borrowings - 600,000
Repayment of borrowings (600,000) (600,000)
Net cash flows from financing activities 6,435,215 2,720,593
Net increase in cash held 2,677,066 199,280
Cash and cash equivalents at beginning of financial year 1,172,047 972,767
Cash and Cash Equivalents at End of Financial Year 11 3,849,113 1,172,047
BLU
ECH
IIP LIM
ITED
AN
NU
AL REPO
RT 201935
The accompanying notes form part of these financial statements
Bluechiip Limited Consolidated Statement of Cash Flows for the year ended 30 June 2019
For
per
sona
l use
onl
y
Note 1 Corporate InformationThe consolidated financial report of Bluechiip Limited for the year ended 30 June 2019 was authorised for issue in accordance with a resolution of the Directors on 27 August 2019.
Bluechiip Limited (the Parent) is a company limited by shares incorporated in Australia whose shares are publicly traded on the Australian Stock Exchange.
The nature of the operations and principal activities of the Group during the year was the development and commercialisation of a wireless tracking solution for the healthcare and life science, security, defence and manufacturing industries which represents a generational change from current methods such as labels (hand-written and pre-printed), barcodes (linear and 2D) and microelectronic integrated circuit (IC)-based RFID (Radio Frequency Identification).
Note 2 Summary of Significant Accounting Policies
Basis of PreparationThe consolidated financial statements have been prepared on the basis of historical cost. Historical cost is generally based on the fair values of the consideration given in exchange for goods and services. All amounts are presented in Australian dollars, unless otherwise noted.
Going Concern
The financial report has been prepared on a going concern basis which takes account of the Group’s assets and liabilities and assumes continuity of normal activities and the Directors’ assessment included:
• sales revenue anticipated to be generated over the next twelve months;
• grants received from the Australian State and Federal governments, and from overseas sources which the Group continues to actively pursue;
• receipts from the Federal Government R&D tax incentive programme on the basis that the Group continues to qualify for these receipts;
• up-front license fees, milestone payments, co- development or collaboration funding from third party joint ventures may be generated within the next twelve months; and
• ability to secure a R&D advance facility from a lender
(a) Statement of Compliance
These financial statements are general purpose financial statements which have been prepared in accordance with the Corporations Act 2001, Accounting Standards
and Interpretations, and comply with other requirements of the law. The financial statements comprise the consolidated financial statements of the Group. For the purposes of preparing the consolidated financial statements, the Company is a for-profit entity.
Accounting Standards include Australian Accounting Standards. Compliance with Australian Accounting Standards ensures that the financial statements and notes of the Company and the Group comply with International Financial Reporting Standards (‘IFRS’).
(b) Application of new and revise Australian Accounting Standards issued not yet effective
The Group has adopted all new and revised accounting standards issued by the AASB that are relevant to its operations and are effective for the current reporting period. The adoption of these standards and interpretations did not result in a material change on the reported results and position or disclosures of the Group as they did not result in any changes to the Group’s existing accounting policies. The new and revised accounting standards are as follows:
At the date of authorisation of the financial statements, the Group has not applied the following new and revised Australian Accounting Standards, Interpretations and amendments that have been issued but are not yet effective:
Standard/Amendment
Effective for Annual Reporting Periods Beginning
on or After
AASB 16 Leases 1 January 2019
AASB 2018-1 Amendments to Australian Accounting Standards – Annual Improvements 2015-2017 Cycle
30 June 2020
AASB 2018-7 Amendments to Australian Accounting Standards – Definition of Material
30 June 2021
Interpretation 23 Uncertainty over Income Tax Treatments
30 June 2020
Amendments to References to the Conceptual Framework in IFRS Standards
30 June 2021
AASB 16 Leases
AASB 16 introduces a comprehensive model for the identification of lease arrangements and accounting treatments for both lessors and lessees. AASB 16 will supersede the current lease guidance including AASB 117 Leases and the related interpretations when it becomes effective.
36
Notes to the Consolidated Financial Statements
For
per
sona
l use
onl
y
AASB 16 distinguishes leases and service contracts on the basis of whether an identified asset is controlled by a customer. Distinctions of operating leases (off balance sheet) and finance leases (on balance sheet) are removed for lessee accounting and is replaced by a model wherea right-of-use asset and a corresponding liability have to be recognised for all leases by lessees (i.e. all on balance sheet) except for short-term leases and leases of low value assets. The right-of-use asset is initially measured at cost and subsequently measured at cost (subject to certain exceptions) less accumulated depreciation and impairment losses, adjusted for any remeasurement of the lease liability. The lease liability is initially measured at the present value of the lease payments that are not paid at that date.
Subsequently, the lease liability is adjusted for interest and lease payments, as well as the impact of lease modifications, amongst others. This standard must be implemented retrospectively, either with the restatement of comparative information or with the cumulative impact of application recognised as at application date under the modified retrospective approach. AASB 16 contains several practical expedients. Under the modified retrospective approach, on a lease-by-lease basis, the right of use of an asset may be deemed to be equivalent to the liability at transition or calculated retrospectively as at inception of the lease.
AASB 16 on implementation is to provide an estimate and is dependent on amongst others the appropriate application of discount rates and the choice of transition method. Notwithstanding this, the Group does not consider the upcoming leasing standard to have a material impact on the Group given the minimal leases currently in place.
Application of new and revise Australian Accounting Standards issued, effective this financial reporting period
The Group has adopted all of the new and revised standards issued by the Australian Accounting Standards Board and amendments that are relevant to its operations and effective for the current annual reporting period. The new relevant revised standards and amendments include:
AASB 9 Financial Instruments and related amending Standards
The Group has adopted AASB 9 Financial Instruments from which replaces AASB 139 Financial Instruments: Recognition and Measurement effective 1 July 2018. AASB 9 introduces new requirements for the classification and measurement of financial assets and financial liabilities, a new model for calculating the provision for doubtful debts and new hedge accounting requirements. The impact on the Group from the
adoption of AASB 9 did not have a material impact as discussed below. The transition provisions of IFRS 9 allow an entity not to restate comparatives. The Group has elected to use this transition approach with respect to initial application.
Credit losses on trade receivablesThe Group has elected to use the simplified approach which requires the recognition of lifetime expected loss allowance for all trade receivables. Trade receivables have been grouped based on credit risks attributes and debtor’s days in estimating expected credit losses.
Given the nature of the accounts receivable recorded by the Group, which are mainly short-term trade receivables, the adoption of AASB 9 has not materially impacted the credit loss allowance calculated under AASB 9 compared to the incurred loss calculated under AASB 139.
AASB 15 Revenue from Contracts with Customers and related amending Standards
The Group has adopted AASB 15 Revenue from Contracts with Customers which replaces AASB 118 Revenue effective 1 July 2018. The Group is applying the modified approach on transition. AASB 15 establishes a single comprehensive model with five-step approach to revenue recognition. The core principle of AASB 15 premises on that an entity should recognise revenue to depict the transfer of promised goods or services to customers in an amount that reflects the consideration to which the entity expects to be entitled to revenue recognition. The five-step approach to revenue recognition under AASB 15 is as follows:• Step 1: Identify the contract(s) with a customer
• Step 2: Identify the performance obligations in the contract
• Step 3: Determine the transaction price
• Step 4: Allocate the transaction price to the performance obligations in the contract
• Step 5: Recognise revenue when (or as) the entity satisfies a performance obligation
Under IFRS 15, an entity recognises revenue when (or as) a performance obligation is satisfied, i.e. when ‘control’ of the goods or services underlying the particular performance obligation is transferred to the customer. The impact of the adoption of AASB 15 are discussed under each revenue stream below.
Revenue Recognition
The Group recognises revenue at a point in time or an over time depending when the Group expects to satisfy the performance obligation and, on the nature, and specifications of contracts entered into with its customers from the following major sources:
BLU
ECH
IIP LIM
ITED
AN
NU
AL REPO
RT 201937
For
per
sona
l use
onl
y
Licence Income
Licence income is the fee income received from customers in consideration to grant the customer the rights and access to use the Bluechiip intellectual property technology Licence income is recognised at either a point in time or over time where the Group continues to retain the responsibility for the performance obligations associated with the licence and that the customer simultaneously receives and consumes the benefits from the Group.
Amounts collected for rights and access not yet provided are recorded as deferred revenue in the balance sheet.
Sale of Goods
Sale of goods is recognised at a point in time when the performance obligations of the sale has been fulfilled and control of the goods has transferred to the customers, which continues to occur at the point of sale when goods were collected or delivered from the premise. In recognising revenue from the sale of goods, the Group considers its historical experience with sales return to determine if it is highly probable that a significant reversal of revenue will arise in the future. The adoption of AASB 15 had no material impact.
Sale of Services
Sale of services is recognised at a point in time when the performance obligations of rendering the services has been fulfilled which continues to occur at the point of sale when the customers assumes the delivery of the goods with performed services. The adoption of AASB 15 has not materially impacted the timing of revenue recognition on the sale of services.
A number of new standards and amendments to standards are effective for annual periods beginning after 1 January 2019 and earlier application is permitted; however, the Group has not early adopted the following new or amended standards in preparing these consolidated financial statements. The Group’s assessment of the impact of these standards and interpretations is set out below.
(c) Basis of Consolidation
The consolidated financial statements comprise the financial statements of Bluechiip Limited and its subsidiaries (the Group) (as outlined in Note 28) as at and for the year ended 30 June 2019. Control is achieved when the Group is exposed, or has rights, to variable returns from its involvement with the investee and has the ability to affect those returns through its power over the investee.
Specifically, the Group controls an investee if and only if the Group has:
• Power over the investee (i.e. existing rights that give it the current ability to direct the relevant activities of the investee)
• Exposure, or rights, to variable returns from its involvement with the investee, and
• The ability to use its power over the investee to affect its returns.
When the Group has less than a majority of the voting or similar rights of an investee, the Group considers all relevant facts and circumstances in assessing whether it has power over an investee.
Consolidation of a subsidiary begins when the Company obtains control over the subsidiary and ceases when the Company loses control of the subsidiary. Specifically, income and expenses of a subsidiary acquired or disposed of during the year are included in the consolidated statement of profit or loss and other comprehensive income from the date the Company gains control until the date when the Company ceases to control the subsidiary. All intragroup assets and liabilities, equity, income, expenses and cash flows relating to transactions between members of the Group are eliminated in full on consolidation.
(d) Foreign Currency Translation
i. Functional and presentation currency Both the functional and presentation currency of Bluechiip Limited and its subsidiaries are Australian dollars ($).
ii. Transactions and balances In preparing the financial statements of each individual group entity, transactions in currencies other than the entity’s functional currency (foreign currencies) are recognised at the rates of exchange prevailing at the dates of the transactions. At the end of each reporting period, monetary items denominated in foreign currencies are retranslated at the rates prevailing at that date. Non-monetary items that are measured in terms of historical cost in a foreign currency are not retranslated. Exchange differences on monetary items are recognised in profit or loss in the period in which they arise.
(e) Cash and Cash Equivalents (Ref Note 11)
Cash and cash equivalents in the statement of financial position comprise cash at bank and in hand and short- term deposits with maturity of three months or less that are readily convertible to known amounts of cash and which are subject to an insignificant risk of changes in value, or for those with longer maturities, deposits are classified as cash equivalents if they are expected to be utilised for short term commitments.
For the purposes of the statement of cash flows, cash and cash equivalents consist of cash and cash equivalents as defined above.
38
Notes to the Consolidated Financial Statements
For
per
sona
l use
onl
y
(f) Trade and Other Receivables (Ref Notes 12 and 13)
Financial Assets
Financial assets comprise ‘loans and receivables’. The classification depends on the business model for managing the financial asset and the contractual terms of the cash flows.
Loans and receivables
Loans and receivables are non-derivative financial assets with fixed or determinable payments that are not quoted in an active market. Loans and receivables (including trade and other receivables and cash and cash equivalents) are measured at amortised cost using the effective interest method (except for any short-term receivables where the effect of discounts is immaterial), less any impairment.
Impairment of financial assets
The Group considers and recognises a loss allowance for expected credit losses on financial assets annually. The amount of expected credit losses is updated at each reporting date to reflect changes in credit risk since initial recognition of the respective financial instrument.
The Group always recognises lifetime ECL for loans and receivables. The expected credit losses on these financial assets are estimated using a provision matrix based on the Group’s historical credit loss experience, adjusted for factors that are specific to the debtors, general economic conditions and an assessment of both the current as well as the forecast direction of conditions at the reporting date, including time value of money where appropriate.
Lifetime ECL represents the expected credit losses that will result from all possible default events over the expected life of a financial instrument. In contrast, 12-month ECL represents the portion of lifetime ECL that is expected to result from default events on a financial instrument that are possible within 12 months after the reporting date.
Credit Impaired Financial Assets
A financial asset is credit-impaired when one or more events that have a detrimental impact on the estimated future cash flows of that financial asset have occurred. Evidence that a financial asset is credit-impaired includes observable data about the following events:
• significant financial difficulty of the issuer or counterparty; or
• breach of contract, such as default or delinquency in interest or principal payments; or
• if becoming probable that the borrower will enter bankruptcy or financial re-organisation; or
• the disappearance of an active market for that financial asset because of financial difficulties.
Measurement and recognition of expected credit losses
The measurement of expected credit losses is a function of the probability of default, loss given default (i.e. the magnitude of the loss if there is a default) and the exposure at default. The assessment of the probability of default and loss given default is based on historical data adjusted by forward-looking information as described above.
For financial assets, the expected credit loss is estimated as the difference between all contractual cash flows that are due to the Group in accordance with the contract and all the cash flows that the Group expects to receive, discounted at the original effective interest rate.
The Group recognises an impairment gain or loss in profit or loss for all financial instruments with a corresponding adjustment to their carrying amount through a loss allowance account.
De-recognition of Financial Assets
The Group derecognises a financial asset only when the contractual rights to the cash flows from the asset expire, or when it transfers the financial asset and substantially all the risks and rewards of ownership of the asset to another entity.
On de-recognition of a financial asset measured at amortised cost, the difference between the asset’s carrying amount and the sum of the consideration received and receivable is recognised in profit or loss.
(g) Inventories (Ref Note 14)
Inventories are stated at the lower of cost and net realisable value. Costs of inventories are determined on a first-in-first-out basis. Net realisable value represents the estimated selling price for inventories less all estimated costs of completion and costs necessary to make the sale.
(h) Non-current assets (Ref Note 15)
i. Property, Plant and EquipmentPlant and equipment is stated at historical cost less accumulated depreciation and any accumulated impairment losses. Such cost includes the cost of replacing parts that are eligible for capitalisation when the cost of replacing the parts is incurred. Similarly, when each major inspection is performed, its cost is recognised in the carrying amount of the plant and equipment as a replacement only if it is eligible for capitalisation. All other repairs and maintenance are recognised in the Statement of Profit or Loss and Other Comprehensive Income as incurred.
BLU
ECH
IIP LIM
ITED
AN
NU
AL REPO
RT 201939
For
per
sona
l use
onl
y
Depreciation is calculated on a diminishing value method basis over the estimated useful life of the specific assets as follows:
Computer & Office Equipment 10% to 66.67%
Furniture, Fixtures and Fittings 10% to 20%
Technical Equipment and Tools 10% to 66.67%
The assets’ residual values, useful lives and amortisation methods are reviewed, and adjusted if appropriate, at each financial year end.
(i) Leases
Leases of fixed assets where substantially all the risks and benefits incidental to the ownership of the asset, but not the legal ownership that are transferred to entities in the Group are classified as finance leases.
Finance leases are capitalised by recording an asset and a liability at the lower of the amounts equal to the fair value of the leased property or the present value of the minimum lease payments, including any guaranteed residual values. Lease payments are allocated between the reduction of the lease liability and the lease interest expense for the year. Leased assets are depreciated on a reducing balance basis over the shorter of their estimated useful lives where it is likely that the Group will obtain ownership of the asset or over the term of the lease.
Operating lease payments are recognised as an operating expense in the Statement of Profit or Loss and Other Comprehensive Income on a straight-line basis over the lease term. Lease payments are apportioned between finance expenses and reduction of the lease obligation so as to achieve a constant rate of interest on the remaining balance of the liability. Finance costs are recognised immediately in profit or loss. Operating lease incentives are recognised as a liability when received and subsequently reduced by allocating lease payments between rental expense and reduction of the liability.
(j) Impairment of Non-financial Assets
Non-financial assets are tested for impairment whenever events or changes in circumstances indicate that the carrying amount may not be recoverable.
Bluechiip Limited conducts an annual internal review of asset values, which is used as a source of information to assess for any indicators of impairment. External factors, such as changes in expected future processes, technology and economic conditions, are also monitored to assess for indicators of impairment. If any indication of impairment exists, an estimate of the asset’s recoverable amount is calculated.
An impairment loss is recognised for the amount by which the asset’s carrying amount exceeds its recoverable amount. Recoverable amount is the higher of an asset’s fair value less costs of disposal and value in use. For the purposes of assessing impairment, assets are grouped at the lowest levels for which there are separately identifiable cash inflows that are largely independent of the cash inflows from other assets or groups of assets (cash-generating units). Non-financial assets that suffered impairment are tested for possible reversal of the impairment whenever events or changes in circumstances indicate that the impairment may have reversed.
(k) Research and Development Costs
Research and development costs are expensed as incurred. An intangible asset arising from development expenditure on an internal project is recognised only when the Group can demonstrate the technical feasibility of completing the intangible asset so that it will be available for use or sale, its intention to complete and its ability to use or sell the asset, how the asset will generate future economic benefits, the availability of resources to complete the development and the ability to measure reliably the expenditure attributable to the intangible asset during its development. Following the initial recognition of the development expenditure, the cost model is applied requiring the asset to be carried at cost less any accumulated amortisation and accumulated impairment losses. No development costs have been capitalised to date because the Group is unable to demonstrate that the products will be able to generate future economic benefits.
(l) Financial Liability (Ref Notes 16 and 17)
Financial liabilities are classified as ‘other financial liabilities’.
Other financial liabilities
Other financial liabilities representing trade and other payables and borrowings are subsequently measured at amortised cost using the effective interest method.
The effective interest method is a method of calculating the amortised cost of a financial liability and of allocating interest expense over the relevant period. The effective interest rate is the rate that exactly discounts estimated future cash payments (including all fees and points paid or received that form an integral part of the effective interest rate, transaction costs and other premiums or discounts) through the expected life of the financial liability, or (where appropriate) a shorter period, to the net carrying amount on initial recognition.
Borrowings are classified as current liabilities unless the Group has an unconditional right to defer settlement of the liability for at least 12 months after reporting date.
40
Notes to the Consolidated Financial Statements
For
per
sona
l use
onl
y
De-recognition of financial liabilities
The Group derecognises financial liabilities when, and only when, the Group’s obligations are discharged, cancelled or have expired. The difference between the carrying amount of the financial liability derecognised and the consideration paid and payable is recognised in profit or loss.
(m) Provisions
Provisions are recognised when the Group has a present obligation (legal or constructive) as a result of a past event, it is probable that an outflow of resources embodying economic benefits will be required to settle the obligation and a reliable estimate can be made of the amount of the obligation. When the Group expects some or all of a provision to be reimbursed, for example under an insurance contract, the reimbursement is recognised as a separate asset but only when the reimbursement is virtually certain. The expense relating to any provision is presented in the Statement of Profit or loss and Other Comprehensive Income net of any reimbursement.
Provisions are measured at the present value of management’s best estimate of the expenditure required to settle the present obligation at the reporting date. The discount rate used to determine the present value reflects current market assessments of the time value of money and the risks specific to the liability. The increase in the provision resulting from the passage of time is recognised in finance costs
(n) Employee Benefits (Ref Note 18)
i. Short-term Benefits Liabilities for wages and salaries, including non- monetary benefits and certain annual leave benefits expected to be settled within 12 months of the reporting date are recognised in respect of employees’ services up to the reporting date. Annual leave balances that are expected to be settled after 12 months are measured at present value. They are measured at the amounts expected to be paid when the liabilities are settled.
ii. Long-term benefitsThe liability for long service leave and certain annual leave benefits are recognised and measured as the present value of expected future payments to be made in respect of services provided by employees up to the reporting date. Consideration is given to expected future wage and salary levels, experience of employee departures, and years of service. Expected future payments are discounted at rates using market yield on high quality Corporate Bonds at the reporting date.
(o) Share-based Payment Transactions (Ref Note 23)
Equity-settled Transactions
The Group provides benefits to its employees and Directors (including key management personnel) in the form of share-based payments, whereby services are rendered in exchange for shares or rights over shares (equity-settled transactions).
There is currently a Performance Rights Plan in place as part of the LTI, for the issue of share-based payments to staff and KMP as a reward for performance and loyalty. LTI awards to executives are made under the executive Performance Rights Plan and are delivered in the form of performance rights or zero exercise price options. The performance rights will vest over a period of up to three years subject to meeting performance measures, The Company uses a combination of absolute total shareholder return (TSR) and commercial targets as the performance measure for the LTI plan.
The cost of these equity-settled transactions with employees is measured by reference to the fair value of the equity instruments at the date at which they are granted. The fair value of the performance rights granted to executive officers has been calculated based on the value at the date of grant using a hybrid trinomial option pricing model which uses a combination of Monte Carlo Simulation and a trinomial lattice to model the performance of the Company’s shares and the individual shares within the selected peer group, taking into account their individual volatilities and correlations.
In valuing equity-settled transactions, no account is taken of any vesting conditions, other than (if applicable):
• Non-vesting conditions that do not determine whether the Group or Company receives the services that entitle the employees to receive payment in equity or cash; and
• Conditions that are linked to the price of the shares of Bluechiip Limited (market conditions).
The cost of equity-settled transactions is recognised, together with a corresponding increase in equity, over the period in which the performance and/or service conditions are fulfilled (the vesting period), ending on the date on which the relevant employees become fully entitled to the award (the vesting date).
At each subsequent reporting date until vesting, the cumulative charge to the Statement of Profit or Loss and Other Comprehensive Income is the product of:
a. The grant date fair value of the award;
BLU
ECH
IIP LIM
ITED
AN
NU
AL REPO
RT 201941
For
per
sona
l use
onl
y

b. The current best estimate of the number of awards that will vest, taking into account such factors as the likelihood of employee turnover during the vesting period and the likelihood of non-market performance conditions being met; and
c. The expired portion of the vesting period.
The charge to the Statement of Profit or Loss and Other Comprehensive Income for the year is the cumulative amount as calculated above less the amounts already charged in previous years. There is a corresponding entry to equity.
If a non-vesting condition is within the control of the Group, Company or employee, the failure to satisfy the condition is treated as a cancellation. If a non-vesting condition within the control of neither the Group, Company nor employee is not satisfied during the vesting period, any expense for the award not previously recognised is recognised over the remaining vesting period, unless the award is forfeited.
If the terms of an equity-settled award are modified, as a minimum an expense is recognised as if the terms had not been modified. An additional expense is recognised for any modification that increases the total fair value of the share-based payment arrangement, or is otherwise beneficial to the employee, as measured at the date of modification.
If an equity-settled award is cancelled, it is treated as if it had vested on the date of cancellation, and any expense not yet recognised for the award is recognised immediately. However, if a new award is substituted for the cancelled award and designated as a replacement award on the date that it is granted, the cancelled and new award are treated as if they were a modification of the original award, as described in the previous paragraph.
The dilutive effect, if any, of outstanding options is reflected as additional share dilution in the computation of diluted earnings per share (see Note 10).
(p) Contributed equity (Ref Note 19)
Ordinary shares are classified as equity. Incremental costs directly attributable to the issue of new shares or options are shown in equity as a deduction, net of tax, from the proceeds.
(q) Revenue recognition (Ref Note 6)
i. Sales RevenueThe Group recognises revenue at a point in time or an over time depending when the Group expects to satisfy the performance obligation and, on the nature, and specifications of contracts entered into with its customers from the following major sources.
Licence Income
Licence income is the fee income received from customers in consideration to grant the customer the rights and access to use the Bluechiip Intellectual property technology Licence income is recognised at either a point in time or over time where the Group continues to retain the responsibility for the performance obligations associated with the licence and that the customer simultaneously receives and consumes the benefits from the Group. Amounts collected for rights and access not yet provided are recorded as deferred revenue in the balance sheet.
Sale of Goods
Sale of goods is recognised at a point in time when the performance obligations of the sale has been fulfilled and control of the goods has transferred to the customers, which continues to occur at the point of sale when goods were collected or delivered from the premise. In recognising revenue from the sale of goods, the Group considers its historical experience with sales return to determine if it is highly probable that a significant reversal of revenue will arise in the future. The adoption of AASB 15 had no material impact.
Sale of Services
Sale of services is recognised at a point in time when the performance obligations of rendering the services has been fulfilled which continues to occur at the point of sale when the customers assumes the delivery of the goods with performed services
ii. Government Grants (Ref Note 7)Government grants are recognised in the Statement of Profit or Loss and Other Comprehensive Income as other income when the grant is receivable. The R&D tax offset is brought to account only when the amount receivable has been quantified, based on eligible development spend and supported by appropriate claim documentation.
iii. Interest RevenueRevenue is recognised as interest accrues using the effective interest method. This is a method of calculating the amortised cost of a financial asset and allocating the interest income over the relevant year using the effective interest rate, which is the rate that exactly discounts estimated future cash receipts through the expected life of the financial asset to the net carrying amount of the financial asset. All revenue is stated net of the amount of goods and services tax (GST).
42
Notes to the Consolidated Financial Statements
For
per
sona
l use
onl
y
(r) Income Tax and Other Taxes (Ref Note 9)
No taxation has been provided for and no deferred tax assets have been recognised in view of losses incurred.
Deferred tax assets are only brought to account where it is probable that future tax profits will be available against which deductible temporary differences can be utilised. In view of the Group just commenced generating revenues, deferred tax assets are not recognised in respect of the assessed and estimated tax losses to be carried forward on the basis that recoupment is not probable at 30 June 2019.
Current tax assets and liabilities are measured at the amount expected to be recovered from or paid to the taxation authorities based on the current year’s taxable income. The tax rates and tax laws used to compute the amount are those that are enacted or substantively enacted at the reporting date. Unrecognised deferred income tax assets are reassessed at each reporting date and are recognised to the extent that it has become probable that future taxable profit will allow the deferred tax asset to be recovered.
Deferred income tax assets and liabilities are measured at the tax rates that are expected to apply to the year when the asset is realised or the liability is settled, based on tax rates (and tax laws) that have been enacted or substantively enacted at the reporting date. Deferred tax assets and deferred tax liabilities are offset only if a legally enforceable right exists to set off current tax assets against current tax liabilities and the deferred tax assets and liabilities relate to the same taxable entity and the same taxation authority.
Other Taxes
Revenues, expenses and assets are recognised net of the amount of GST except:
• When the GST incurred on a purchase of goods and services is not recoverable from the taxation authority, in which case the GST is recognised as part of the cost of acquisition of the asset or as part of the expense item as applicable; and
• Trade receivables and other payables, which are stated with the amount of GST included.
The net amount of GST recoverable from, or payable to, the taxation authority is included as part of receivables or payables in the statement of financial position. Cash flows are included in the statement of cash flows on a gross basis and the GST component of cash flows arising from investing and financing activities, which is
recoverable from, or payable to, the taxation authority is classified as part of operating cash flows.
Commitments and contingencies are disclosed net of the amount of GST recoverable from, or payable to, the taxation authority. (s) Earnings per share (Ref Note 10)
Basic earnings per share is calculated as net profit/ (loss) attributable to members of the parent, adjusted to exclude any costs of servicing equity, divided by the weighted average number of ordinary shares.
Diluted earnings per share is calculated as net profit/ (loss) attributable to members of the parent, adjusted for:
• Costs of servicing equity; and
• Other non-discretionary changes in revenues or expenses during the year that would result from the dilution of potential ordinary shares, divided by the weighted average number of ordinary shares and dilutive potential ordinary shares, adjusted for any bonus element.
As the Group incurred a loss during the year, the impact of options and performance rights was anti-dilutive and as such, basic and diluted EPS are the same amount.
(t) Financial Instruments
Financial assets and financial liabilities are recognised when a group entity becomes a party to the contractual provisions of the instruments.
Financial assets and financial liabilities are initially measured at fair value. Transaction costs that are directly attributable to the acquisition or issue of financial assets and financial liabilities (other than financial assets and financial liabilities at fair value through profit or loss) are added to or deducted from the fair value of the financial assets or financial liabilities, as appropriate, on initial recognition. Transaction costs directly attributable to the acquisition of financial assets or financial liabilities at fair value through profit or loss are recognised immediately in profit or loss.
(u) Comparative Figures
When required by Accounting Standards, comparative figures will be adjusted to conform to changes in presentation. No comparative adjustment has occurred in the current year.
BLU
ECH
IIP LIM
ITED
AN
NU
AL REPO
RT 201943
For
per
sona
l use
onl
y
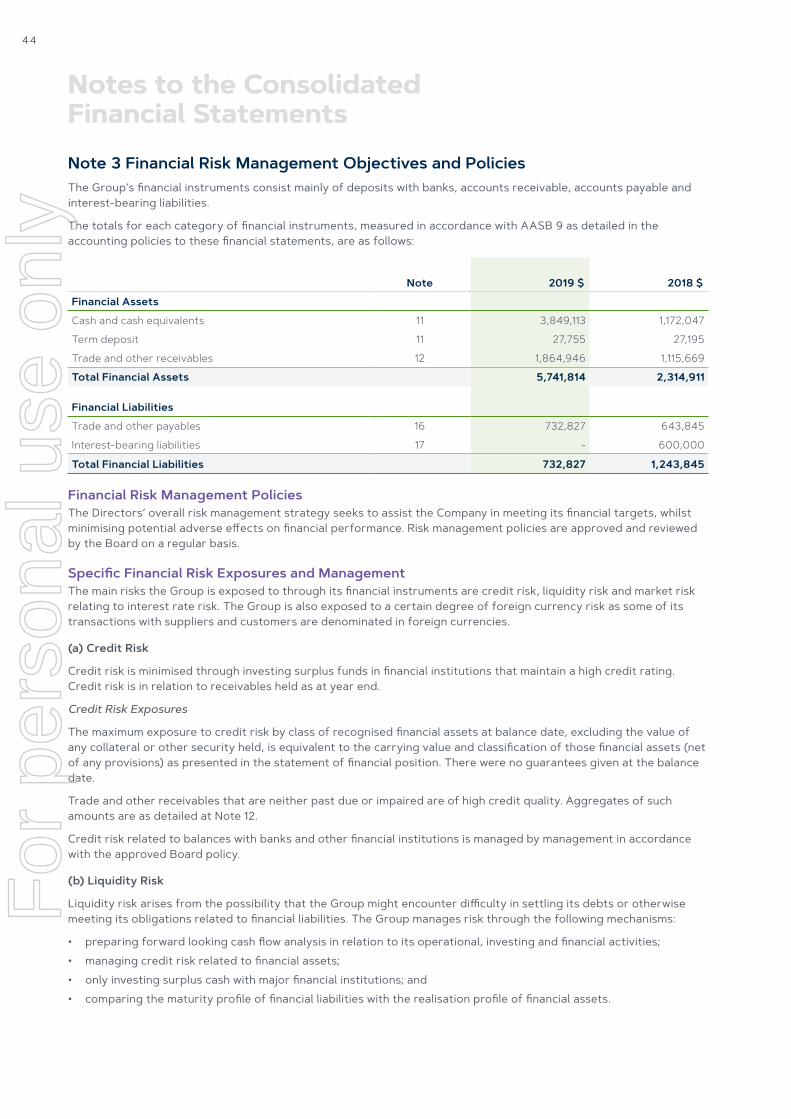
Note 3 Financial Risk Management Objectives and PoliciesThe Group’s financial instruments consist mainly of deposits with banks, accounts receivable, accounts payable and interest-bearing liabilities.
The totals for each category of financial instruments, measured in accordance with AASB 9 as detailed in the accounting policies to these financial statements, are as follows:
Note 2019 $ 2018 $
Financial Assets
Cash and cash equivalents 11 3,849,113 1,172,047
Term deposit 11 27,755 27,195
Trade and other receivables 12 1,864,946 1,115,669
Total Financial Assets 5,741,814 2,314,911
Financial Liabilities
Trade and other payables 16 732,827 643,845
Interest-bearing liabilities 17 - 600,000
Total Financial Liabilities 732,827 1,243,845
Financial Risk Management PoliciesThe Directors’ overall risk management strategy seeks to assist the Company in meeting its financial targets, whilst minimising potential adverse effects on financial performance. Risk management policies are approved and reviewed by the Board on a regular basis.
Specific Financial Risk Exposures and ManagementThe main risks the Group is exposed to through its financial instruments are credit risk, liquidity risk and market risk relating to interest rate risk. The Group is also exposed to a certain degree of foreign currency risk as some of its transactions with suppliers and customers are denominated in foreign currencies.
(a) Credit Risk
Credit risk is minimised through investing surplus funds in financial institutions that maintain a high credit rating. Credit risk is in relation to receivables held as at year end.
Credit Risk Exposures
The maximum exposure to credit risk by class of recognised financial assets at balance date, excluding the value of any collateral or other security held, is equivalent to the carrying value and classification of those financial assets (net of any provisions) as presented in the statement of financial position. There were no guarantees given at the balance date.
Trade and other receivables that are neither past due or impaired are of high credit quality. Aggregates of such amounts are as detailed at Note 12.
Credit risk related to balances with banks and other financial institutions is managed by management in accordance with the approved Board policy.
(b) Liquidity Risk
Liquidity risk arises from the possibility that the Group might encounter difficulty in settling its debts or otherwise meeting its obligations related to financial liabilities. The Group manages risk through the following mechanisms:
• preparing forward looking cash flow analysis in relation to its operational, investing and financial activities;
• managing credit risk related to financial assets;
• only investing surplus cash with major financial institutions; and
• comparing the maturity profile of financial liabilities with the realisation profile of financial assets.
44
Notes to the Consolidated Financial Statements
For
per
sona
l use
onl
y
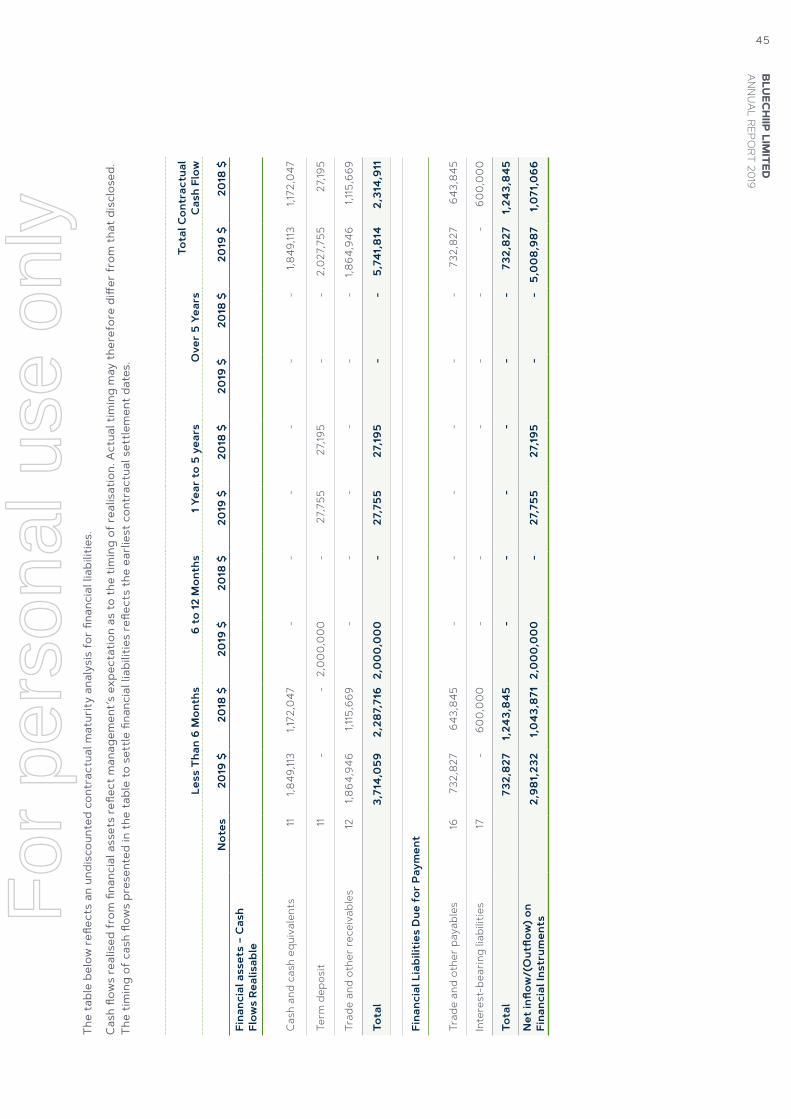
The
tab
le b
elow
refl
ects
an
undi
scou
nted
con
trac
tual
mat
urit
y an
alys
is f
or fi
nanc
ial l
iabi
litie
s.
Cas
h flo
ws
real
ised
fro
m fi
nanc
ial a
sset
s re
flect
man
agem
ent’
s ex
pect
atio
n as
to
the
tim
ing
of r
ealis
atio
n. A
ctua
l tim
ing
may
the
refo
re d
iffer
fro
m t
hat
disc
lose
d.
The
tim
ing
of c
ash
flow
s pr
esen
ted
in t
he t
able
to
sett
le fi
nanc
ial l
iabi
litie
s re
flect
s th
e ea
rlie
st c
ontr
actu
al s
ettle
men
t da
tes.
Less
Tha
n 6
Mon
ths
6 to
12 M
onth
s1 Y
ear
to 5
yea
rsO
ver
5 Ye
ars
Tota
l Con
trac
tual
C
ash
Flow
Not
es20
19 $
2018
$20
19 $
2018
$20
19 $
2018
$20
19 $
2018
$20
19 $
2018
$Fi
nanc
ial a
sset
s –
Cas
h Fl
ows
Real
isab
le
Cas
h an
d ca
sh e
quiv
alen
ts11
1,849
,113
1,172
,047
--
--
--
1,849
,113
1,172
,047
Term
dep
osit
11-
-2,
00
0,0
00
-27
,755
27,19
5-
-2,
027,
755
27,19
5
Trad
e an
d ot
her
rece
ivab
les
121,8
64,9
46
1,115
,669
--
--
--
1,864
,94
61,1
15,6
69
Tota
l3,
714,
059
2,28
7,71
62,
00
0,0
00
-27
,755
27,19
5-
- 5
,741
,814
2,31
4,91
1
Fina
ncia
l Lia
bilit
ies
Due
for
Pay
men
t
Trad
e an
d ot
her
paya
bles
16
732,
827
643,
845
--
--
--
732,
827
643,
845
Inte
rest
-bea
ring
liab
ilitie
s 17
-60
0,0
00
--
--
--
600,
00
0
Tota
l73
2,82
71,
243,
845
--
--
--
732,
827
1,24
3,84
5
Net
inflo
w/(
Out
flow
) on
Fi
nanc
ial I
nstr
umen
ts2,
981,
232
1,04
3,87
1 2,
00
0,0
00
- 2
7,75
527
,195
--
5,0
08,
987
1,07
1,0
66
BLU
ECH
IIP LIM
ITED
AN
NU
AL REPO
RT 201945
For
per
sona
l use
onl
y
(c) Market Risk
i. Interest Rate Risk Interest rate risk is the risk that the fair value or future cash flows of a financial instrument will fluctuate because of changes in market interest rates.
Borrowings (see Note 17) are negotiated at fixed rates to assist in managing the risk and that in determining the interest rates, reference is made to bank lending or borrowing rates at the time the loan is entered into.
ii. Sensitivity AnalysisThe following table illustrates sensitivities to the Group’s exposures to changes in interest rates. The table indicates the impact on how profit and equity values reported at balance date would have been affected by changes in the relevant risk variable that management considers to be reasonably possible. These sensitivities assume that the movement in a particular variable is independent of other variables.
Profit $ Equity $
Year Ended 30 June 2019
+1% in interest rates 38,769 -
-1% in interest rates (38,769) -
Year Ended 30 June 2018
+1% in interest rates 11,992 -
-1% in interest rates (11,992) -
The above sensitivities calculation assumption is based on cash and cash equivalent and financial assets reported at balance date. Interest on borrowings are fixed.
Note 4 Significant Accounting judgements, Estimates and AssumptionsThe preparation of the financial statements requires the Directors to evaluate estimates and judgments incorporated into the financial statements based on historical knowledge and best available current information. Estimates assume a reasonable expectation of future events and are based on current trends and economic data, obtained both externally and within the Group. Further details of the nature of these assumptions and conditions may be found in the relevant notes to the financial statements.
InventoryManagement has to exercise significant judgement in estimating the net realisable value of inventory which includes estimating future sales quantities and selling prices. These estimates are based on the current contracts in place by the Company and given the application of the technology is deemed reasonable. Management assess the classification of inventory based on forward sales growth and expect to realise the inventory in the next twelve months.
Note 5 Operating SegmentsThe Group has identified its operating segments based on the internal reports that are reviewed and used by the CEO and Managing Director (the chief operating decision maker or CODM) in assessing performance and in determining the allocation of resources. The CODM only reviews consolidated financial information and as such, it has been determined that there is only one segment at the present time. Furthermore, the Group’s business activities are not organised on the basis of differences in related products and services or differences in geographical areas of operations. Given the Group’s stage of development, the Directors consider this to be appropriate.
Note 6 Revenue from Operating Activities
2019 $ 2018 $
Gross Revenue From Sale of Product and Licence income
Sale of product - point in time 993,295 433,795
Licence income - over time 27,092 153,0071,020,387 586,802
Less Trade discount 4,665 (25,258)
Revenue From Operating Activities 1,025,052 561,544
Note 7 Other Income
2019 $ 2018 $
Other Revenue
Interest income 42,833 22,648
R&D tax incentive/concession 1,176,070 1,000,504
Rebate received from a supplier 83,376 -
Export Market Development Grant 47,758 -
Total Other Income 1,350,037 1,023,152
46
Notes to the Consolidated Financial Statements
For
per
sona
l use
onl
y
Note 8 Expenses
2019 $ 2018 $
(a) Finance Costs
Interest expense 29,589 50,030
Debt establishment fee (refer Note 17 for further detail) - 9,363
Total Finance Costs 29,589 59.393
(b) Depreciation
Depreciation of property, plant and equipment 33,621 19,185
33,621 19,185
(c) Other Expenses
Share registry, administration and secretarial 80,854 68,383
Insurance 53,212 44,402
Conference and seminar 612 2,754
Telecommunications 14,984 17,362
Membership and subscriptions 5,131 8,100
Others 262,289 106,174
Total Other Expenses 417,082 247,175
Note 9 Income Tax Expense No taxation has been provided in view of the losses incurred for the year (2018: Nil). Tax losses for the 2019 financial year are $1,299,855 (2018: $998,568). The amount available of carried forward tax losses for offset against future taxable income is $13,779,156 (2018: $12,361,121). The deferred tax asset of $4,068,897 (2018: $3,684,761) associated with carried forward tax losses as well as deferred tax assets arising from temporary differences of $137,044 (2018: $147,874) have not been recorded on the basis that its recovery is not probable at this time. There are no deferred tax liabilities arising from temporary differences on assets.
The prima facie tax on the loss from ordinary activities is reconciled to the income tax credit shown in the Statement of Profit or Loss and Other Comprehensive Income as follows:
2019 $ 2018 $
Prima facie tax on loss from ordinary activities before income tax at 27.5% (2018: 27.5%)
Consolidated entity (895,949) (685,435)
(895,949) (685,435)
Add/(Deduct): Tax Effect of
Non-deductible expenses 44,356 19,709
Research and development tax effect 465,692 371,890
Deferred tax assets arising not brought to account as at balance sheet date because realisation is not considered probable 385,901 293,836
Income Tax Credit Attributable to the Consolidated Entity - -
BLU
ECH
IIP LIM
ITED
AN
NU
AL REPO
RT 201947
For
per
sona
l use
onl
y
Note 10 Earnings Per Share
2019 $ 2018 $
Earnings/(loss) used to calculate basic and dilutive EPS (3,257,996) (2,492,491)
For Basic and Diluted EPS Tax Effect of
Weighted average number of ordinary shares outstanding during the year – No. used in calculating basic EPS 496,315,398 386,632,392
As the Group incurred a loss during the year, the impact of performance rights were anti-dilutive and as such, basic and diluted EPS are the same amount.
Note 11 Cash and Cash Equivalents and Term Deposit
2019 $ 2018 $
Current Assets – Cash and Cash Equivalents
Cash at bank 1,849,113 1,172,047
Term Deposita 2,000,000 -
3,849,113 1,172,047
Non-current Assets
Term Depositb 27,755 27,195
a Relates to a term deposit placed with a bank and designated as cash as expected to be utilised within 12 months, therefore designated as a cash equivalents b Relates to a term Deposit with a bank held as security for a credit card facility.
Note 12 Current Assets – Trade and Other Receivables
2019 $ 2018 $
Current Assets – Cash and Cash Equivalents
Trade receivables 664,946 115,669
R&D tax off-set receivable 1,200,000 1,000,000
1,864,946 1,115,669
The ageing analysis of trade receivables is a
0-30 days 492,133 114,882
31-60 days - -
61-90 days (past due not impaired) - -
91+ days (past due not impaired) 172,813 787
Total Trade and Other Receivables 664,946 115,669
* Debts over 90 days are also individually assessed for impairment. The expected credit loss model under AASB 9 requires the Group to account for expected credit losses and changes in those expected credit losses at each reporting period. As at the date of this report, the Group reviewed and assessed the trade receivables and deems these individually recoverable.
48
Notes to the Consolidated Financial Statements
For
per
sona
l use
onl
y
Note 13 Other Current Assets
2019 $ 2018 $
Prepayment 36,159 30,933
Other debtorsa 31,117 -
Depositb - 116,650
67,276 147,583
a Include in other debtors is interest income receivable of $28,000 (2018: Nil) from a short-term deposit placed with a bank.b The deposit in prior year represents the balance of a supplier payment for the purchase of raw materials to manufacture the Company’s Matchbox™ readers, During
the financial year, the deposit has been fully utilised as part settlement of the Matchbox readers purchased following the Termination and Release Agreement with the supplier.
Note 14 Inventory
2019 $ 2018 $
Raw materials 398,104 286,218
Finished goods 248,847 221,722
Provision of net realisable value - Finished Goods (61,591) (61,591)
Total Inventory 585,360 446,349
Note 15 Non-current Assets - Property, Plant and Equipment
2019 $ 2018 $
Technical equipment and tools at cost 321,427 290,574
Accumulated depreciation (209,359) (184,001)
Total technical equipment and tools 112,068 106,573
Furniture, fixtures and fittings at cost 18,876 18,876
Accumulated depreciation (13,875) (13,104)
Total Furniture, Fixtures and Fittings 5,001 5,772
Computer and office equipment at cost 123,424 119,064
Accumulated depreciation (114,676) (107,185)
Total Computer and Office Equipment 8,748 11,879
Total Property, Plant and Equipment 125,817 124,224
BLU
ECH
IIP LIM
ITED
AN
NU
AL REPO
RT 201949
For
per
sona
l use
onl
y
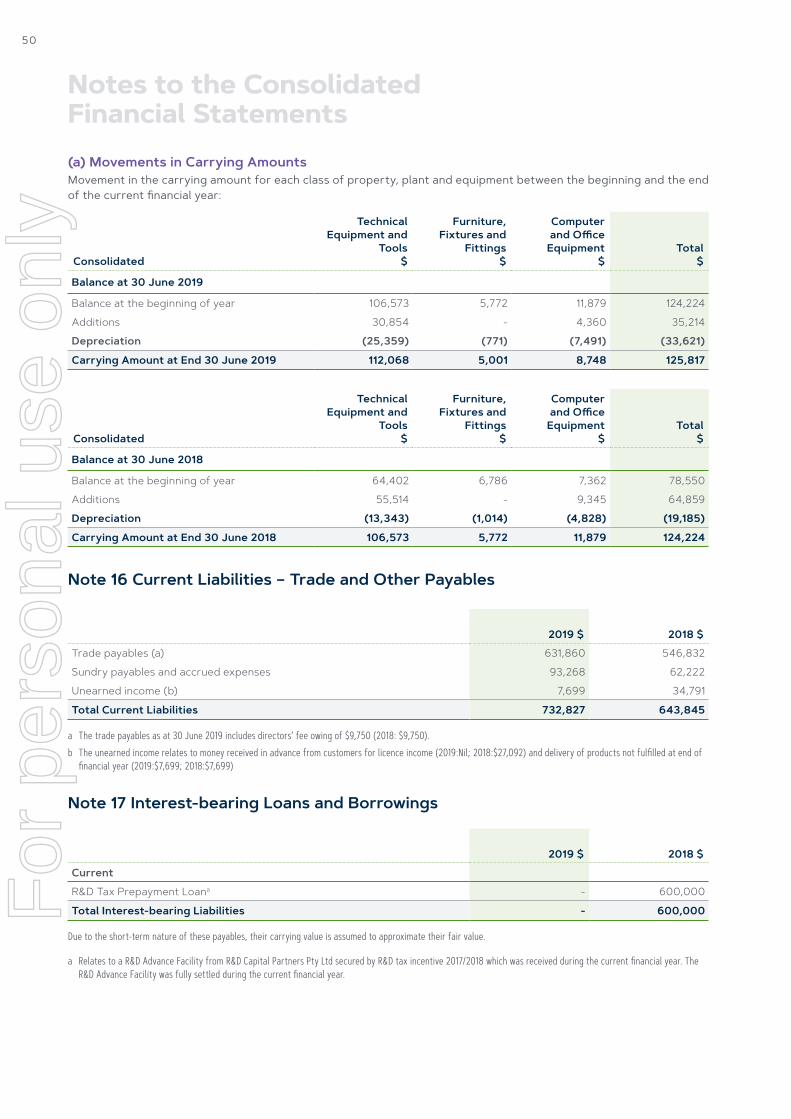
(a) Movements in Carrying AmountsMovement in the carrying amount for each class of property, plant and equipment between the beginning and the end of the current financial year:
Consolidated
Technical Equipment and
Tools $
Furniture, Fixtures and
Fittings $
Computer and Office
Equipment $
Total $
Balance at 30 June 2019
Balance at the beginning of year 106,573 5,772 11,879 124,224
Additions 30,854 - 4,360 35,214
Depreciation (25,359) (771) (7,491) (33,621)
Carrying Amount at End 30 June 2019 112,068 5,001 8,748 125,817
Consolidated
Technical Equipment and
Tools $
Furniture, Fixtures and
Fittings $
Computer and Office
Equipment $
Total $
Balance at 30 June 2018
Balance at the beginning of year 64,402 6,786 7,362 78,550
Additions 55,514 - 9,345 64,859
Depreciation (13,343) (1,014) (4,828) (19,185)
Carrying Amount at End 30 June 2018 106,573 5,772 11,879 124,224
Note 16 Current Liabilities – Trade and Other Payables
2019 $ 2018 $
Trade payables (a) 631,860 546,832
Sundry payables and accrued expenses 93,268 62,222
Unearned income (b) 7,699 34,791
Total Current Liabilities 732,827 643,845
a The trade payables as at 30 June 2019 includes directors’ fee owing of $9,750 (2018: $9,750).b The unearned income relates to money received in advance from customers for licence income (2019:Nil; 2018:$27,092) and delivery of products not fulfilled at end of
financial year (2019:$7,699; 2018:$7,699)
Note 17 Interest-bearing Loans and Borrowings
2019 $ 2018 $
Current
R&D Tax Prepayment Loana - 600,000
Total Interest-bearing Liabilities - 600,000
Due to the short-term nature of these payables, their carrying value is assumed to approximate their fair value.
a Relates to a R&D Advance Facility from R&D Capital Partners Pty Ltd secured by R&D tax incentive 2017/2018 which was received during the current financial year. The R&D Advance Facility was fully settled during the current financial year.
50
Notes to the Consolidated Financial Statements
For
per
sona
l use
onl
y
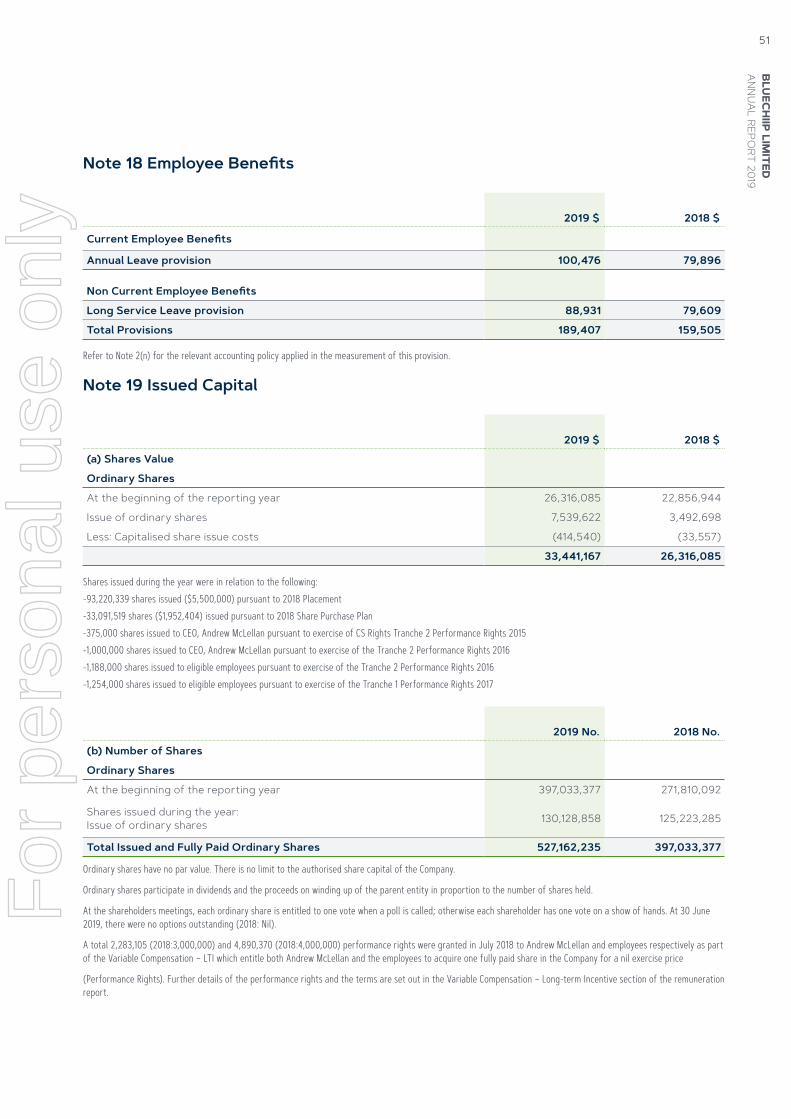
Note 18 Employee Benefits
2019 $ 2018 $
Current Employee Benefits
Annual Leave provision 100,476 79,896
Non Current Employee Benefits
Long Service Leave provision 88,931 79,609
Total Provisions 189,407 159,505
Refer to Note 2(n) for the relevant accounting policy applied in the measurement of this provision.
Note 19 Issued Capital
2019 $ 2018 $
(a) Shares Value
Ordinary Shares
At the beginning of the reporting year 26,316,085 22,856,944
Issue of ordinary shares 7,539,622 3,492,698
Less: Capitalised share issue costs (414,540) (33,557)
33,441,167 26,316,085
Shares issued during the year were in relation to the following:-93,220,339 shares issued ($5,500,000) pursuant to 2018 Placement-33,091,519 shares ($1,952,404) issued pursuant to 2018 Share Purchase Plan-375,000 shares issued to CEO, Andrew McLellan pursuant to exercise of CS Rights Tranche 2 Performance Rights 2015 -1,000,000 shares issued to CEO, Andrew McLellan pursuant to exercise of the Tranche 2 Performance Rights 2016-1,188,000 shares issued to eligible employees pursuant to exercise of the Tranche 2 Performance Rights 2016-1,254,000 shares issued to eligible employees pursuant to exercise of the Tranche 1 Performance Rights 2017
2019 No. 2018 No.
(b) Number of Shares
Ordinary Shares
At the beginning of the reporting year 397,033,377 271,810,092
Shares issued during the year: Issue of ordinary shares 130,128,858 125,223,285
Total Issued and Fully Paid Ordinary Shares 527,162,235 397,033,377
Ordinary shares have no par value. There is no limit to the authorised share capital of the Company.
Ordinary shares participate in dividends and the proceeds on winding up of the parent entity in proportion to the number of shares held.
At the shareholders meetings, each ordinary share is entitled to one vote when a poll is called; otherwise each shareholder has one vote on a show of hands. At 30 June 2019, there were no options outstanding (2018: Nil).
A total 2,283,105 (2018:3,000,000) and 4,890,370 (2018:4,000,000) performance rights were granted in July 2018 to Andrew McLellan and employees respectively as part of the Variable Compensation – LTI which entitle both Andrew McLellan and the employees to acquire one fully paid share in the Company for a nil exercise price
(Performance Rights). Further details of the performance rights and the terms are set out in the Variable Compensation – Long-term Incentive section of the remuneration report.
BLU
ECH
IIP LIM
ITED
AN
NU
AL REPO
RT 201951
For
per
sona
l use
onl
y
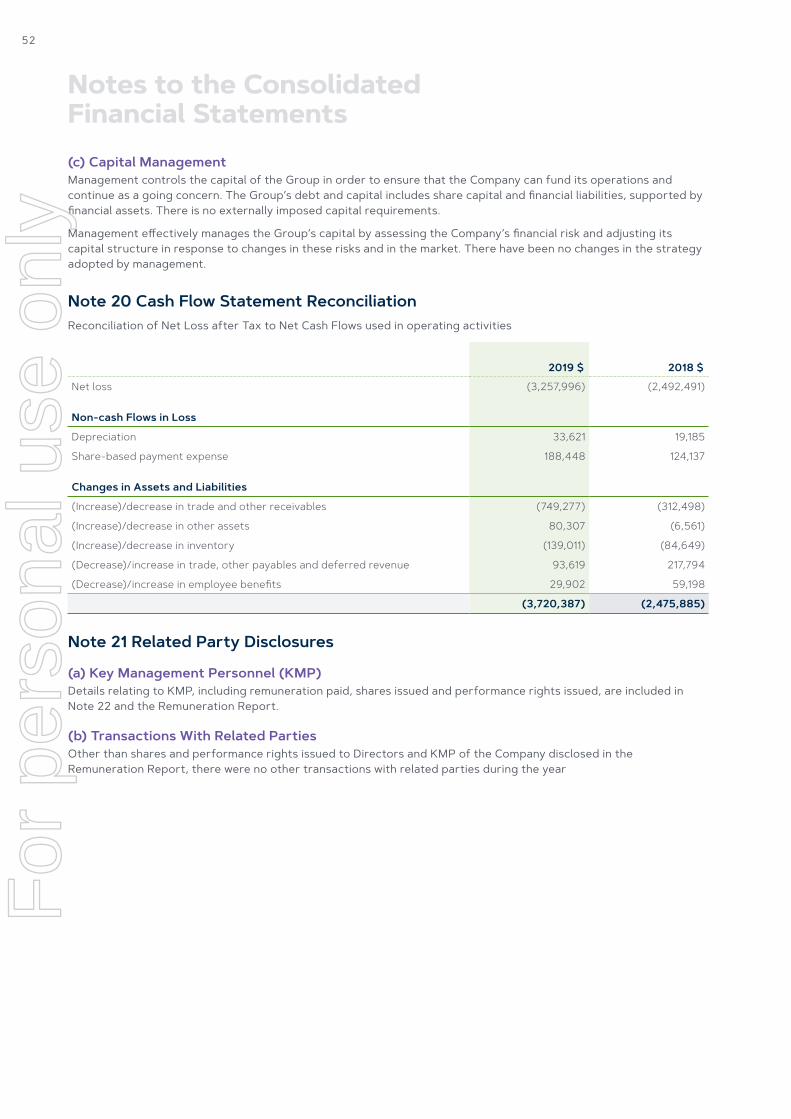
(c) Capital ManagementManagement controls the capital of the Group in order to ensure that the Company can fund its operations and continue as a going concern. The Group’s debt and capital includes share capital and financial liabilities, supported by financial assets. There is no externally imposed capital requirements.
Management effectively manages the Group’s capital by assessing the Company’s financial risk and adjusting its capital structure in response to changes in these risks and in the market. There have been no changes in the strategy adopted by management.
Note 20 Cash Flow Statement ReconciliationReconciliation of Net Loss after Tax to Net Cash Flows used in operating activities
2019 $ 2018 $
Net loss (3,257,996) (2,492,491)
Non-cash Flows in Loss
Depreciation 33,621 19,185
Share-based payment expense 188,448 124,137
Changes in Assets and Liabilities
(Increase)/decrease in trade and other receivables (749,277) (312,498)
(Increase)/decrease in other assets 80,307 (6,561)
(Increase)/decrease in inventory (139,011) (84,649)
(Decrease)/increase in trade, other payables and deferred revenue 93,619 217,794
(Decrease)/increase in employee benefits 29,902 59,198
(3,720,387) (2,475,885)
Note 21 Related Party Disclosures
(a) Key Management Personnel (KMP)Details relating to KMP, including remuneration paid, shares issued and performance rights issued, are included in Note 22 and the Remuneration Report.
(b) Transactions With Related PartiesOther than shares and performance rights issued to Directors and KMP of the Company disclosed in the Remuneration Report, there were no other transactions with related parties during the year
52
Notes to the Consolidated Financial Statements
For
per
sona
l use
onl
y
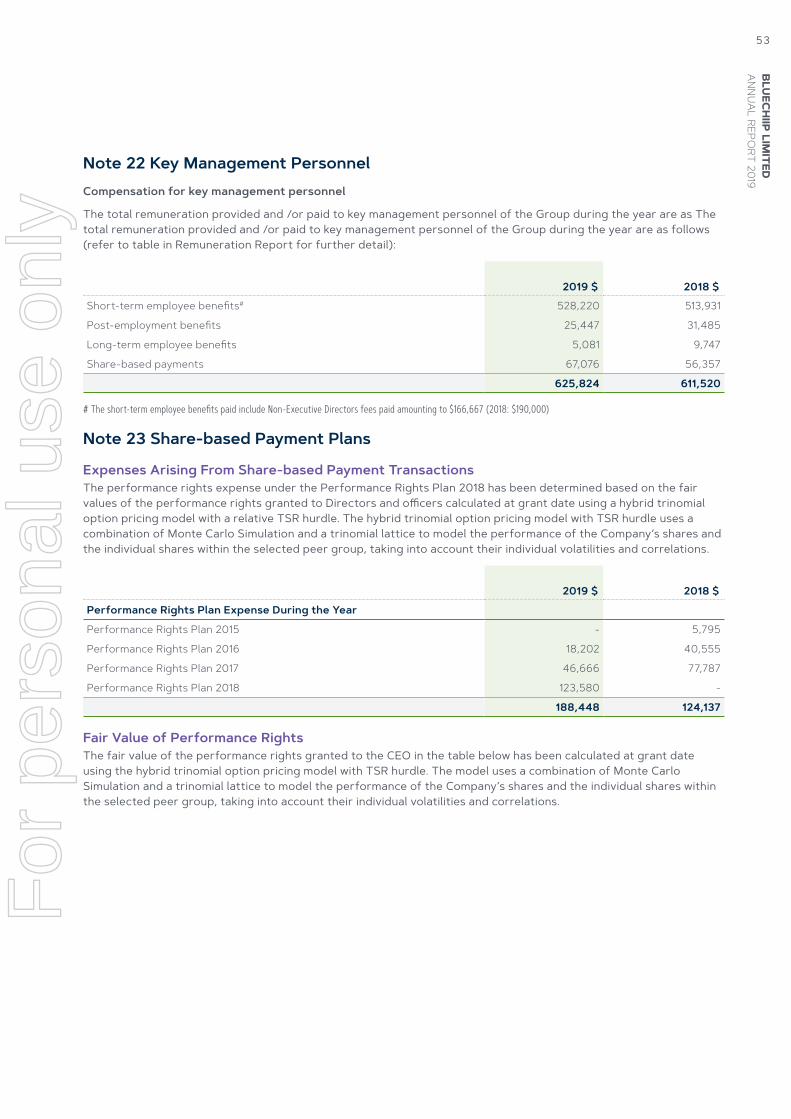
Note 22 Key Management PersonnelCompensation for key management personnel
The total remuneration provided and /or paid to key management personnel of the Group during the year are as The total remuneration provided and /or paid to key management personnel of the Group during the year are as follows (refer to table in Remuneration Report for further detail):
2019 $ 2018 $
Short-term employee benefits# 528,220 513,931
Post-employment benefits 25,447 31,485
Long-term employee benefits 5,081 9,747
Share-based payments 67,076 56,357
625,824 611,520
# The short-term employee benefits paid include Non-Executive Directors fees paid amounting to $166,667 (2018: $190,000)
Note 23 Share-based Payment Plans
Expenses Arising From Share-based Payment TransactionsThe performance rights expense under the Performance Rights Plan 2018 has been determined based on the fair values of the performance rights granted to Directors and officers calculated at grant date using a hybrid trinomial option pricing model with a relative TSR hurdle. The hybrid trinomial option pricing model with TSR hurdle uses a combination of Monte Carlo Simulation and a trinomial lattice to model the performance of the Company’s shares and the individual shares within the selected peer group, taking into account their individual volatilities and correlations.
2019 $ 2018 $
Performance Rights Plan Expense During the Year
Performance Rights Plan 2015 - 5,795
Performance Rights Plan 2016 18,202 40,555
Performance Rights Plan 2017 46,666 77,787
Performance Rights Plan 2018 123,580 -
188,448 124,137
Fair Value of Performance RightsThe fair value of the performance rights granted to the CEO in the table below has been calculated at grant date using the hybrid trinomial option pricing model with TSR hurdle. The model uses a combination of Monte Carlo Simulation and a trinomial lattice to model the performance of the Company’s shares and the individual shares within the selected peer group, taking into account their individual volatilities and correlations.
BLU
ECH
IIP LIM
ITED
AN
NU
AL REPO
RT 201953
For
per
sona
l use
onl
y
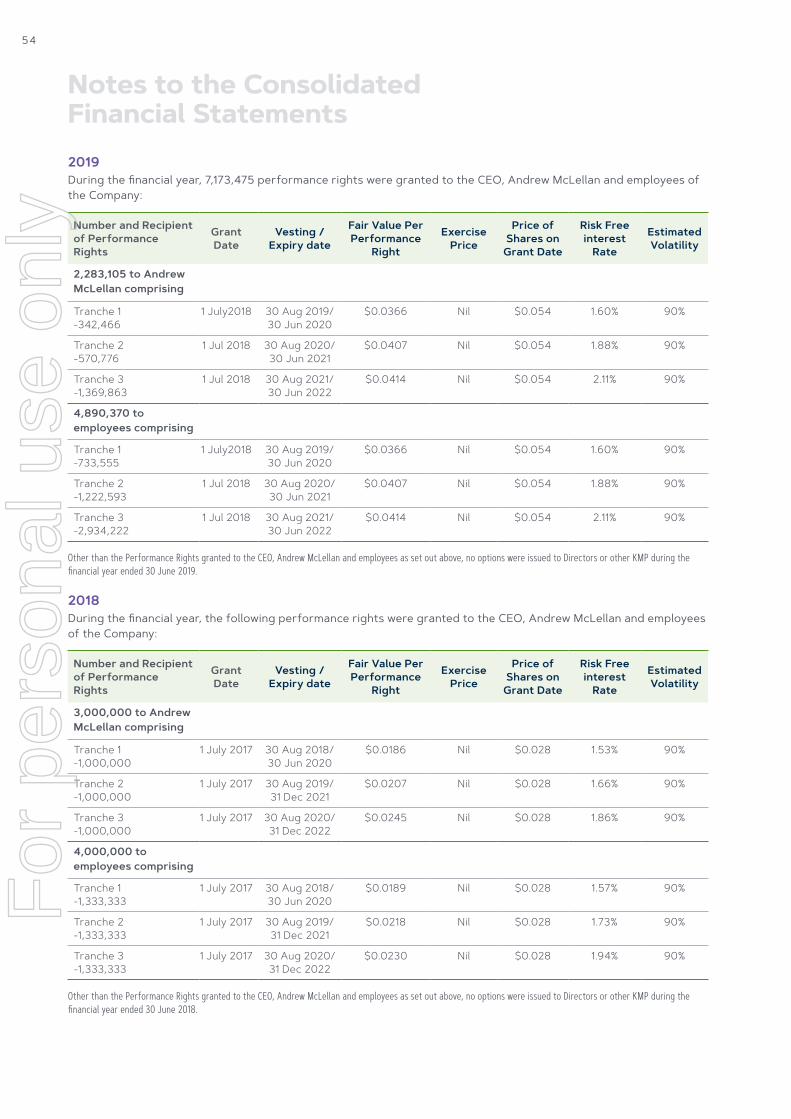
2019During the financial year, 7,173,475 performance rights were granted to the CEO, Andrew McLellan and employees of the Company:
Number and Recipient of Performance Rights
Grant Date
Vesting / Expiry date
Fair Value Per Performance
Right
Exercise Price
Price of Shares on
Grant Date
Risk Free interest
Rate
Estimated Volatility
2,283,105 to Andrew McLellan comprising
Tranche 1 -342,466
1 July2018 30 Aug 2019/ 30 Jun 2020
$0.0366 Nil $0.054 1.60% 90%
Tranche 2 -570,776
1 Jul 2018 30 Aug 2020/ 30 Jun 2021
$0.0407 Nil $0.054 1.88% 90%
Tranche 3 -1,369,863
1 Jul 2018 30 Aug 2021/ 30 Jun 2022
$0.0414 Nil $0.054 2.11% 90%
4,890,370 to employees comprising
Tranche 1 -733,555
1 July2018 30 Aug 2019/ 30 Jun 2020
$0.0366 Nil $0.054 1.60% 90%
Tranche 2 -1,222,593
1 Jul 2018 30 Aug 2020/ 30 Jun 2021
$0.0407 Nil $0.054 1.88% 90%
Tranche 3 -2,934,222
1 Jul 2018 30 Aug 2021/ 30 Jun 2022
$0.0414 Nil $0.054 2.11% 90%
Other than the Performance Rights granted to the CEO, Andrew McLellan and employees as set out above, no options were issued to Directors or other KMP during the financial year ended 30 June 2019.
2018During the financial year, the following performance rights were granted to the CEO, Andrew McLellan and employees of the Company:
Number and Recipient of Performance Rights
Grant Date
Vesting / Expiry date
Fair Value Per Performance
Right
Exercise Price
Price of Shares on
Grant Date
Risk Free interest
Rate
Estimated Volatility
3,000,000 to Andrew McLellan comprising
Tranche 1 -1,000,000
1 July 2017 30 Aug 2018/ 30 Jun 2020
$0.0186 Nil $0.028 1.53% 90%
Tranche 2 -1,000,000
1 July 2017 30 Aug 2019/ 31 Dec 2021
$0.0207 Nil $0.028 1.66% 90%
Tranche 3 -1,000,000
1 July 2017 30 Aug 2020/ 31 Dec 2022
$0.0245 Nil $0.028 1.86% 90%
4,000,000 to employees comprising
Tranche 1 -1,333,333
1 July 2017 30 Aug 2018/ 30 Jun 2020
$0.0189 Nil $0.028 1.57% 90%
Tranche 2 -1,333,333
1 July 2017 30 Aug 2019/ 31 Dec 2021
$0.0218 Nil $0.028 1.73% 90%
Tranche 3 -1,333,333
1 July 2017 30 Aug 2020/ 31 Dec 2022
$0.0230 Nil $0.028 1.94% 90%
Other than the Performance Rights granted to the CEO, Andrew McLellan and employees as set out above, no options were issued to Directors or other KMP during the financial year ended 30 June 2018.
54
Notes to the Consolidated Financial Statements
For
per
sona
l use
onl
y
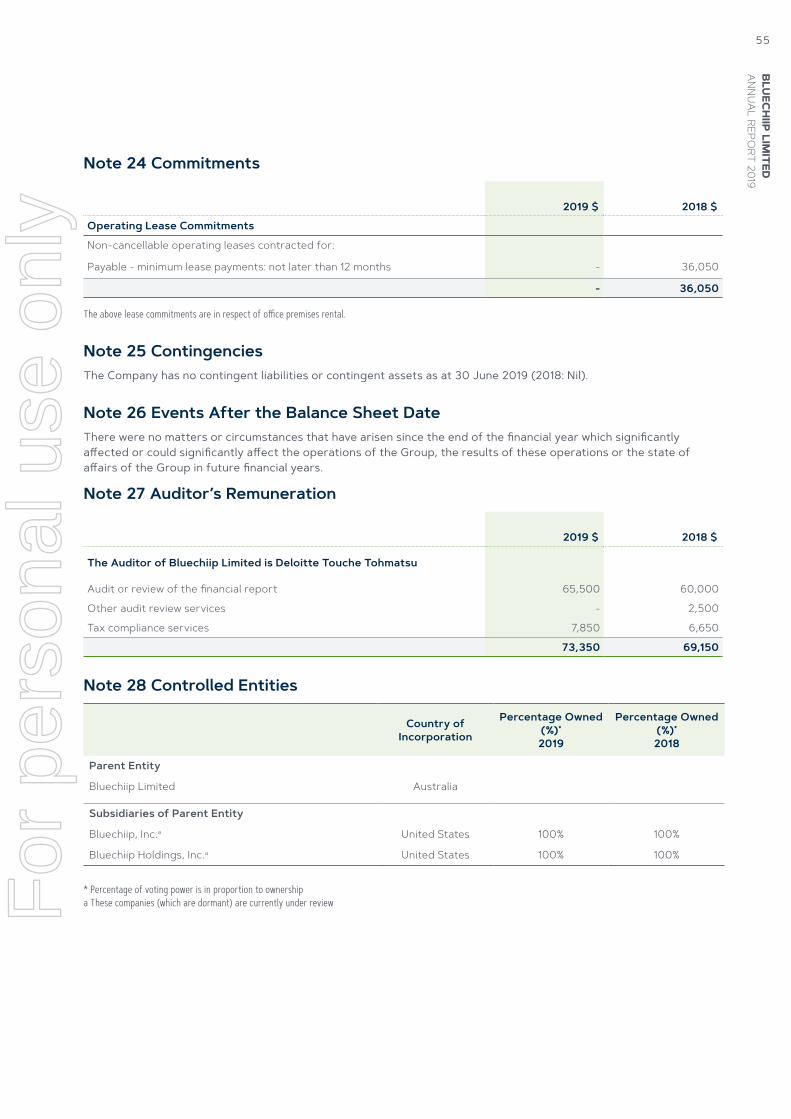
Note 24 Commitments
2019 $ 2018 $
Operating Lease Commitments
Non-cancellable operating leases contracted for:
Payable - minimum lease payments: not later than 12 months - 36,050
- 36,050
The above lease commitments are in respect of office premises rental.
Note 25 ContingenciesThe Company has no contingent liabilities or contingent assets as at 30 June 2019 (2018: Nil).
Note 26 Events After the Balance Sheet DateThere were no matters or circumstances that have arisen since the end of the financial year which significantly affected or could significantly affect the operations of the Group, the results of these operations or the state of affairs of the Group in future financial years.
Note 27 Auditor’s Remuneration
2019 $ 2018 $
The Auditor of Bluechiip Limited is Deloitte Touche Tohmatsu
Audit or review of the financial report 65,500 60,000
Other audit review services - 2,500
Tax compliance services 7,850 6,650
73,350 69,150
Note 28 Controlled Entities
Country of Incorporation
Percentage Owned (%)* 2019
Percentage Owned (%)* 2018
Parent Entity
Bluechiip Limited Australia
Subsidiaries of Parent Entity
Bluechiip, Inc.a United States 100% 100%
Bluechiip Holdings, Inc.a United States 100% 100%
* Percentage of voting power is in proportion to ownershipa These companies (which are dormant) are currently under review
BLU
ECH
IIP LIM
ITED
AN
NU
AL REPO
RT 201955
For
per
sona
l use
onl
y
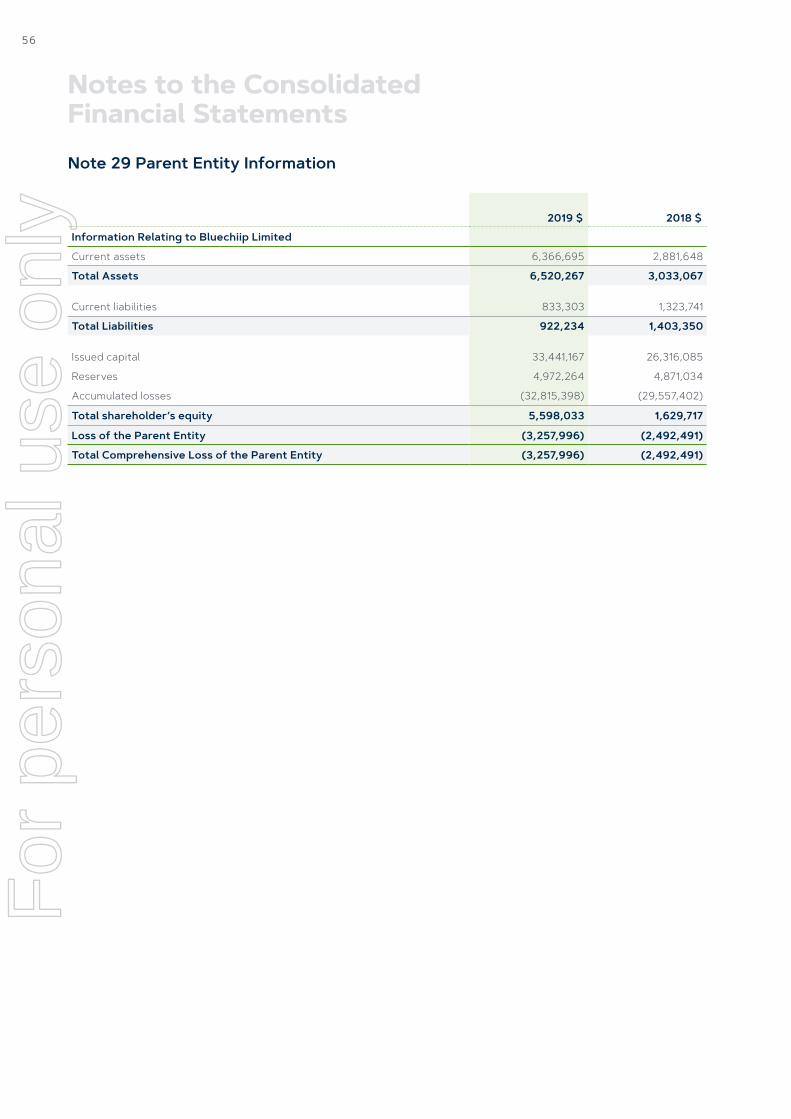
Note 29 Parent Entity Information
2019 $ 2018 $
Information Relating to Bluechiip Limited
Current assets 6,366,695 2,881,648
Total Assets 6,520,267 3,033,067
Current liabilities 833,303 1,323,741
Total Liabilities 922,234 1,403,350
Issued capital 33,441,167 26,316,085
Reserves 4,972,264 4,871,034
Accumulated losses (32,815,398) (29,557,402)
Total shareholder’s equity 5,598,033 1,629,717
Loss of the Parent Entity (3,257,996) (2,492,491)
Total Comprehensive Loss of the Parent Entity (3,257,996) (2,492,491)
56
Notes to the Consolidated Financial Statements
For
per
sona
l use
onl
y

In accordance with a resolution of the Directors of Bluechiip Limited, I state that:
1. In the opinion of the Directors:
a The financial statements and notes of Bluechiip Limited for the financial year ended 30 June 2019 are in accordance with the Corporations Act 2001, including:
i. Giving a true and fair view of its financial position as at 30 June 2019 and performance for the period ended on that date
ii. Complying with Accounting Standards (including the Australian Accounting Interpretations) and the Corporations Regulations 2001
b The financial statements and notes also comply with International Financial Reporting Standards as disclosed in Note 2(a)
c There are reasonable grounds to believe that the Group will be able to pay its debts as and when they become due and payable as disclosed in Note 2
2. This declaration has been made after receiving declarations required to be made to the Directors in accordance with Section 295A of the Corporations Act 2001 for the financial year ended 30 June 2019.
On behalf of the Board.
Iain Kirkwood Chairman
27 August 2019
BLU
ECH
IIP LIM
ITED
AN
NU
AL REPO
RT 201957
Directors’ DeclarationF
or p
erso
nal u
se o
nly
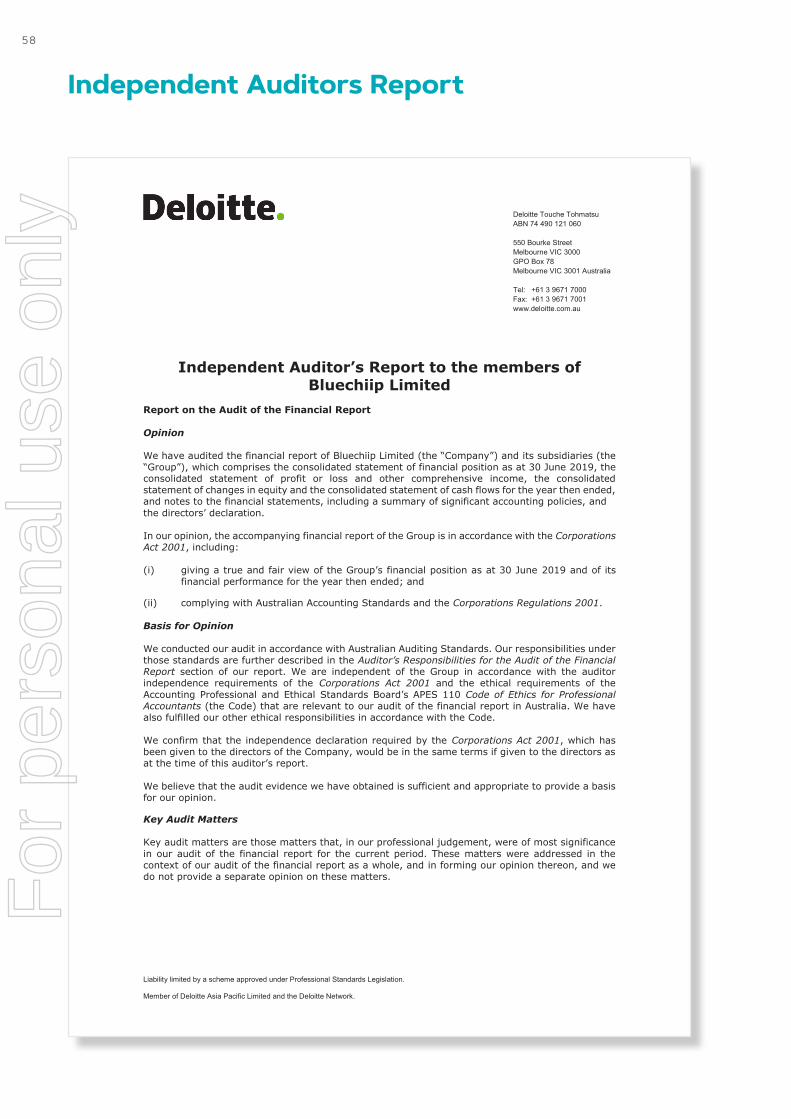
Liability limited by a scheme approved under Professional Standards Legislation. Member of Deloitte Asia Pacific Limited and the Deloitte Network.
Deloitte Touche Tohmatsu ABN 74 490 121 060 550 Bourke Street Melbourne VIC 3000 GPO Box 78 Melbourne VIC 3001 Australia Tel: +61 3 9671 7000 Fax: +61 3 9671 7001 www.deloitte.com.au
Independent Auditor’s Report to the members of Bluechiip Limited
Report on the Audit of the Financial Report Opinion We have audited the financial report of Bluechiip Limited (the “Company”) and its subsidiaries (the “Group”), which comprises the consolidated statement of financial position as at 30 June 2019, the consolidated statement of profit or loss and other comprehensive income, the consolidated statement of changes in equity and the consolidated statement of cash flows for the year then ended, and notes to the financial statements, including a summary of significant accounting policies, and the directors’ declaration. In our opinion, the accompanying financial report of the Group is in accordance with the Corporations Act 2001, including: (i) giving a true and fair view of the Group’s financial position as at 30 June 2019 and of its
financial performance for the year then ended; and
(ii) complying with Australian Accounting Standards and the Corporations Regulations 2001. Basis for Opinion We conducted our audit in accordance with Australian Auditing Standards. Our responsibilities under those standards are further described in the Auditor’s Responsibilities for the Audit of the Financial Report section of our report. We are independent of the Group in accordance with the auditor independence requirements of the Corporations Act 2001 and the ethical requirements of the Accounting Professional and Ethical Standards Board’s APES 110 Code of Ethics for Professional Accountants (the Code) that are relevant to our audit of the financial report in Australia. We have also fulfilled our other ethical responsibilities in accordance with the Code. We confirm that the independence declaration required by the Corporations Act 2001, which has been given to the directors of the Company, would be in the same terms if given to the directors as at the time of this auditor’s report. We believe that the audit evidence we have obtained is sufficient and appropriate to provide a basis for our opinion. Key Audit Matters Key audit matters are those matters that, in our professional judgement, were of most significance in our audit of the financial report for the current period. These matters were addressed in the context of our audit of the financial report as a whole, and in forming our opinion thereon, and we do not provide a separate opinion on these matters.
58
Independent Auditors ReportF
or p
erso
nal u
se o
nly
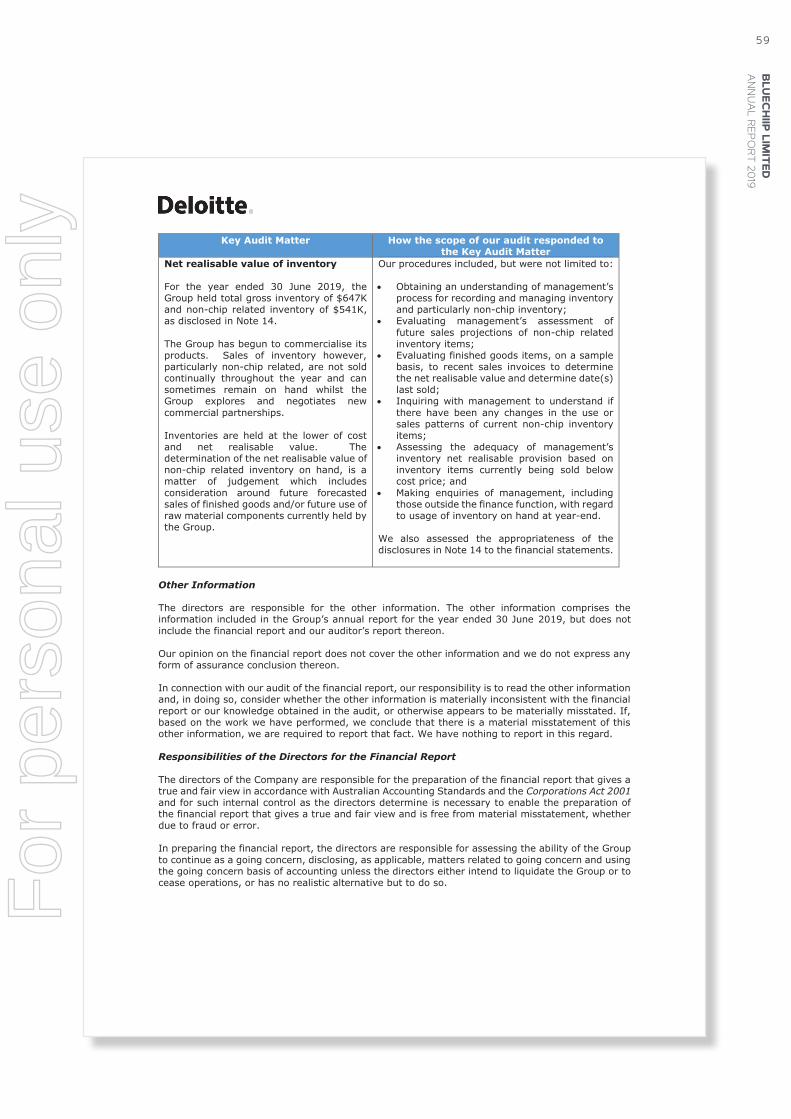
BLU
ECH
IIP LIM
ITED
AN
NU
AL REPO
RT 201959
Key Audit Matter How the scope of our audit responded to the Key Audit Matter
Net realisable value of inventory For the year ended 30 June 2019, the Group held total gross inventory of $647K and non-chip related inventory of $541K, as disclosed in Note 14. The Group has begun to commercialise its products. Sales of inventory however, particularly non-chip related, are not sold continually throughout the year and can sometimes remain on hand whilst the Group explores and negotiates new commercial partnerships. Inventories are held at the lower of cost and net realisable value. The determination of the net realisable value of non-chip related inventory on hand, is a matter of judgement which includes consideration around future forecasted sales of finished goods and/or future use of raw material components currently held by the Group.
Our procedures included, but were not limited to: Obtaining an understanding of management’s
process for recording and managing inventory and particularly non-chip inventory;
Evaluating management’s assessment of future sales projections of non-chip related inventory items;
Evaluating finished goods items, on a sample basis, to recent sales invoices to determine the net realisable value and determine date(s) last sold;
Inquiring with management to understand if there have been any changes in the use or sales patterns of current non-chip inventory items;
Assessing the adequacy of management’s inventory net realisable provision based on inventory items currently being sold below cost price; and
Making enquiries of management, including those outside the finance function, with regard to usage of inventory on hand at year-end.
We also assessed the appropriateness of the disclosures in Note 14 to the financial statements.
Other Information The directors are responsible for the other information. The other information comprises the information included in the Group’s annual report for the year ended 30 June 2019, but does not include the financial report and our auditor’s report thereon. Our opinion on the financial report does not cover the other information and we do not express any form of assurance conclusion thereon. In connection with our audit of the financial report, our responsibility is to read the other information and, in doing so, consider whether the other information is materially inconsistent with the financial report or our knowledge obtained in the audit, or otherwise appears to be materially misstated. If, based on the work we have performed, we conclude that there is a material misstatement of this other information, we are required to report that fact. We have nothing to report in this regard. Responsibilities of the Directors for the Financial Report The directors of the Company are responsible for the preparation of the financial report that gives a true and fair view in accordance with Australian Accounting Standards and the Corporations Act 2001 and for such internal control as the directors determine is necessary to enable the preparation of the financial report that gives a true and fair view and is free from material misstatement, whether due to fraud or error. In preparing the financial report, the directors are responsible for assessing the ability of the Group to continue as a going concern, disclosing, as applicable, matters related to going concern and using the going concern basis of accounting unless the directors either intend to liquidate the Group or to cease operations, or has no realistic alternative but to do so. F
or p
erso
nal u
se o
nly

Auditor’s Responsibilities for the Audit of the Financial Report Our objectives are to obtain reasonable assurance about whether the financial report as a whole is free from material misstatement, whether due to fraud or error, and to issue an auditor’s report that includes our opinion. Reasonable assurance is a high level of assurance, but is not a guarantee that an audit conducted in accordance with the Australian Auditing Standards will always detect a material misstatement when it exists. Misstatements can arise from fraud or error and are considered material if, individually or in the aggregate, they could reasonably be expected to influence the economic decisions of users taken on the basis of this financial report. As part of an audit in accordance with the Australian Auditing Standards, we exercise professional judgement and maintain professional scepticism throughout the audit. We also: Identify and assess the risks of material misstatement of the financial report, whether due to
fraud or error, design and perform audit procedures responsive to those risks, and obtain audit evidence that is sufficient and appropriate to provide a basis for our opinion. The risk of not detecting a material misstatement resulting from fraud is higher than for one resulting from error, as fraud may involve collusion, forgery, intentional omissions, misrepresentations, or the override of internal control.
Obtain an understanding of internal control relevant to the audit in order to design audit
procedures that are appropriate in the circumstances, but not for the purpose of expressing an opinion on the effectiveness of the Company’s internal control.
Evaluate the appropriateness of accounting policies used and the reasonableness of accounting
estimates and related disclosures made by the directors. Conclude on the appropriateness of the directors’ use of the going concern basis of accounting
and, based on the audit evidence obtained, whether a material uncertainty exists related to events or conditions that may cast significant doubt on the Group’s ability to continue as a going concern. If we conclude that a material uncertainty exists, we are required to draw attention in our auditor’s report to the related disclosures in the financial report or, if such disclosures are inadequate, to modify our opinion. Our conclusions are based on the audit evidence obtained up to the date of our auditor’s report. However, future events or conditions may cause the Group to cease to continue as a going concern.
Evaluate the overall presentation, structure and content of the financial report, including the
disclosures, and whether the financial report represents the underlying transactions and events in a manner that achieves fair presentation.
Obtain sufficient appropriate audit evidence regarding the financial information of the entities
or business activities within the Group to express an opinion on the financial report. We are responsible for the direction, supervision and performance of the Group’s audit. We remain solely responsible for our audit opinion.
We communicate with the directors regarding, among other matters, the planned scope and timing of the audit and significant audit findings, including any significant deficiencies in internal control that we identify during our audit. We also provide the directors with a statement that we have complied with relevant ethical requirements regarding independence, and to communicate with them all relationships and other matters that may reasonably be thought to bear on our independence, and where applicable, related safeguards. From the matters communicated with the directors, we determine those matters that were of most significance in the audit of the financial report of the current period and are therefore the key audit matters. We describe these matters in our auditor’s report unless law or regulation precludes public disclosure about the matter or when, in extremely rare circumstances, we determine that a matter should not be communicated in our report because the adverse consequences of doing so would reasonably be expected to outweigh the public interest benefits of such communication.
60
Independent Auditors Report
For
per
sona
l use
onl
y

BLU
ECH
IIP LIM
ITED
AN
NU
AL REPO
RT 201961
Report on the Remuneration Report Opinion on the Remuneration Report We have audited the Remuneration Report included in pages 19 to 28 of the Directors’ Report for the year ended 30 June 2019. In our opinion, the Remuneration Report of Bluechiip Limited, for the year ended 30 June 2019, complies with section 300A of the Corporations Act 2001. Responsibilities The directors of the Company are responsible for the preparation and presentation of the Remuneration Report in accordance with section 300A of the Corporations Act 2001. Our responsibility is to express an opinion on the Remuneration Report, based on our audit conducted in accordance with Australian Auditing Standards.
DELOITTE TOUCHE TOHMATSU
Anneke Du Toit Partner Chartered Accountants Melbourne, 27 August 2019
For
per
sona
l use
onl
y
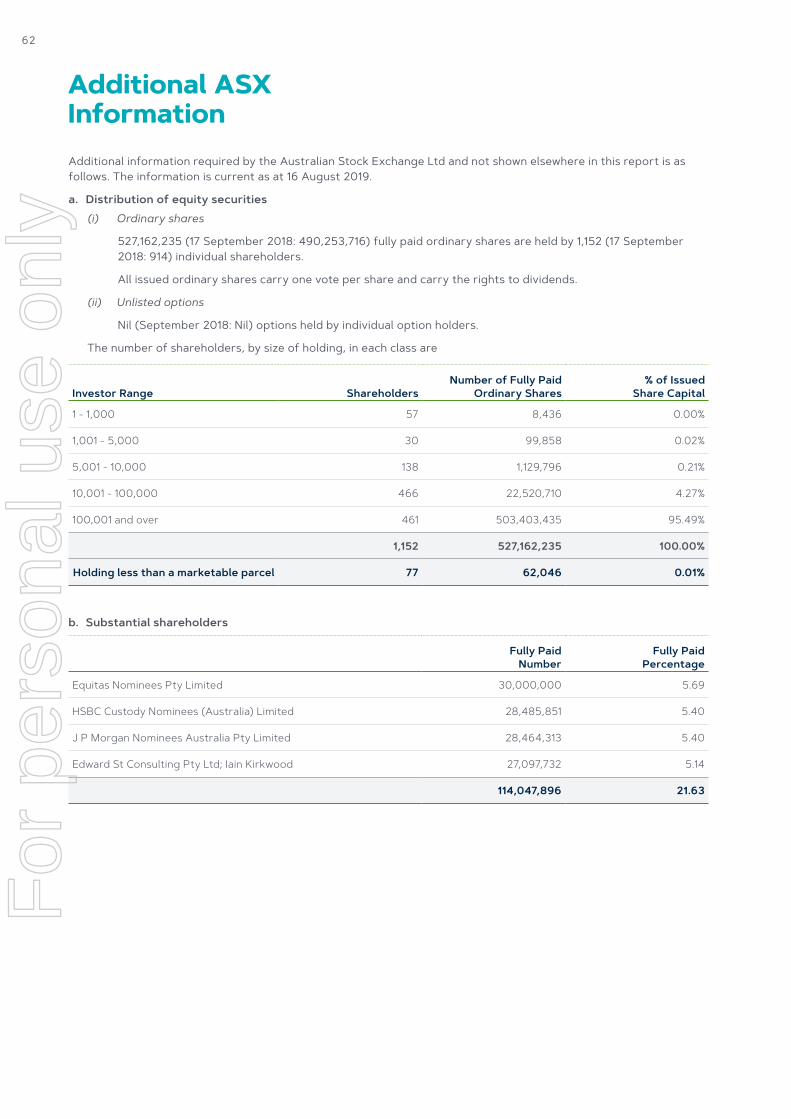
Additional information required by the Australian Stock Exchange Ltd and not shown elsewhere in this report is as follows. The information is current as at 16 August 2019.
a. Distribution of equity securities(i) Ordinary shares
527,162,235 (17 September 2018: 490,253,716) fully paid ordinary shares are held by 1,152 (17 September 2018: 914) individual shareholders.
All issued ordinary shares carry one vote per share and carry the rights to dividends.
(ii) Unlisted options
Nil (September 2018: Nil) options held by individual option holders.
The number of shareholders, by size of holding, in each class are
Investor Range ShareholdersNumber of Fully Paid
Ordinary Shares% of Issued
Share Capital
1 - 1,000 57 8,436 0.00%
1,001 - 5,000 30 99,858 0.02%
5,001 - 10,000 138 1,129,796 0.21%
10,001 - 100,000 466 22,520,710 4.27%
100,001 and over 461 503,403,435 95.49%
1,152 527,162,235 100.00%
Holding less than a marketable parcel 77 62,046 0.01%
b. Substantial shareholders
Fully Paid Number
Fully Paid Percentage
Equitas Nominees Pty Limited 30,000,000 5.69
HSBC Custody Nominees (Australia) Limited 28,485,851 5.40
J P Morgan Nominees Australia Pty Limited 28,464,313 5.40
Edward St Consulting Pty Ltd; Iain Kirkwood 27,097,732 5.14
114,047,896 21.63
62
Additional ASX Information
For
per
sona
l use
onl
y

c. Twenty largest holders of quoted equity securities
Fully Paid Number
Fully Paid Percentage
EQUITAS NOMINEES PTY LIMITED <PB-600686 A/C> 30,000,000 5.69%
HSBC CUSTODY NOMINEES (AUSTRALIA) LIMITED 28,485,851 5.40%
J P MORGAN NOMINEES AUSTRALIA PTY LIMITED 28,464,313 5.40%
MUTUAL TRUST PTY LTD 21,064,454 4.00%
DR STEPHEN FREDERICK WOODFORD 18,000,000 3.41%
MR IAIN MACGREGOR CRAWFORD KIRKWOOD 15,024,949 2.85%
BNP PARIBAS NOMS PTY LTD <DRP> 14,129,475 2.68%
PLANET INNOVATION PTY LTD 13,636,363 2.59%
ROSHI BLUE PTY LTD <ROSHI BLUE SUPER FUND A/C> 9,176,470 1.74%
EDWARD ST CONSULTING PTY LTD <KIRKWOOD FAMILY S/FUND A/C> 8,320,037 1.58%
MR BRETT WILLIAM FISHER PATON & MRS VICKI ANNE PATON <BRETT PATON FAMILY SUPER A/C> 8,224,211 1.56%
PULITANO FAMILY SUPERANNUATION PTY LTD <PULITANO FAMILY SF A/C> 6,941,675 1.32%
ALLTOGETHER PTY LTD <ALLTOGETHER SUPER FUND A/C> 6,001,322 1.14%
SANDHURST TRUSTEES LTD <JMFG CONSOL A/C> 5,920,389 1.12%
LIGHT KEEPER #2 PTY LTD <LEADING LIGHT UNIT A/C> 5,782,203 1.10%
JUST GREENERY PTY LTD <GREEN FAMILY SUPER FUND A/C> 5,601,695 1.06%
DR STEPHEN FREDERICK WOODFORD & DR PATRICIA ALISON WOODFORD <BELLADONNA SUPER FUND A/C> 5,460,601 1.04%
MR PHILLIP STANLEY HOLTEN 5,363,260 1.02%
TALENTO HOLDINGS PTY LTD 5,000,000 0.95%
GOUSSE HOLDINGS PTY LTD 5,000,000 0.95%
245,597,268 46.59%
BLU
ECH
IIP LIM
ITED
AN
NU
AL REPO
RT 201963
For
per
sona
l use
onl
y

Corporate Information
DirectorsMr Iain Kirkwood Non-Executive Chairman
Mr Andrew McLellan CEO/Managing Director
Mr Michael Ohanessian Non-Executive Director
Mr Andrew Cox Non-Executive Director
Company SecretaryMr Lee Mitchell
Registered Office1 Dalmore Drive Caribbean Business Park Scoresby VIC 3179
Phone +613 9763 9763
Principal Place of Business1 Dalmore Drive Caribbean Business Park Scoresby VIC 3179
Phone +613 9763 9763
Share RegistryAutomic Registry Services Level 3, 50 Holt Street Sydney NSW 2010
Phone 1300 288 664 (local) Phone +612 9698 5414 (international) Fax +612 9279 0664
Bluechiip Limited shares are listed on the Australian Stock Exchange (ASX: BCT).
BankersNational Australia Bank Limited Melbourne VIC 3000
AuditorsDeloitte Touche Tohmatsu 550 Bourke Street Melbourne, VIC 3001
Websitebluechiip.com
64
Corporate Information
For
per
sona
l use
onl
y

65B
LUEC
HIIP
LIMITED
A
NN
UA
L REPORT 2019
For
per
sona
l use
onl
y

Bluechiip Corporate Headquarters1 Dalmore Drive Caribbean Business Park Scoresby Victoria 3179 AustraliaPhone 61 3 9763 9763 Email [email protected] bluechiip.comBLU0016 0819F
or p
erso
nal u
se o
nly