Embed Size (px)
Citation preview

SURFSTITCH GROUP LIMITED1H FY2015 RESULTS PRESENTATION
For
per
sona
l use
onl
y

JUSTIN CAMERON - CEO
For
per
sona
l use
onl
y
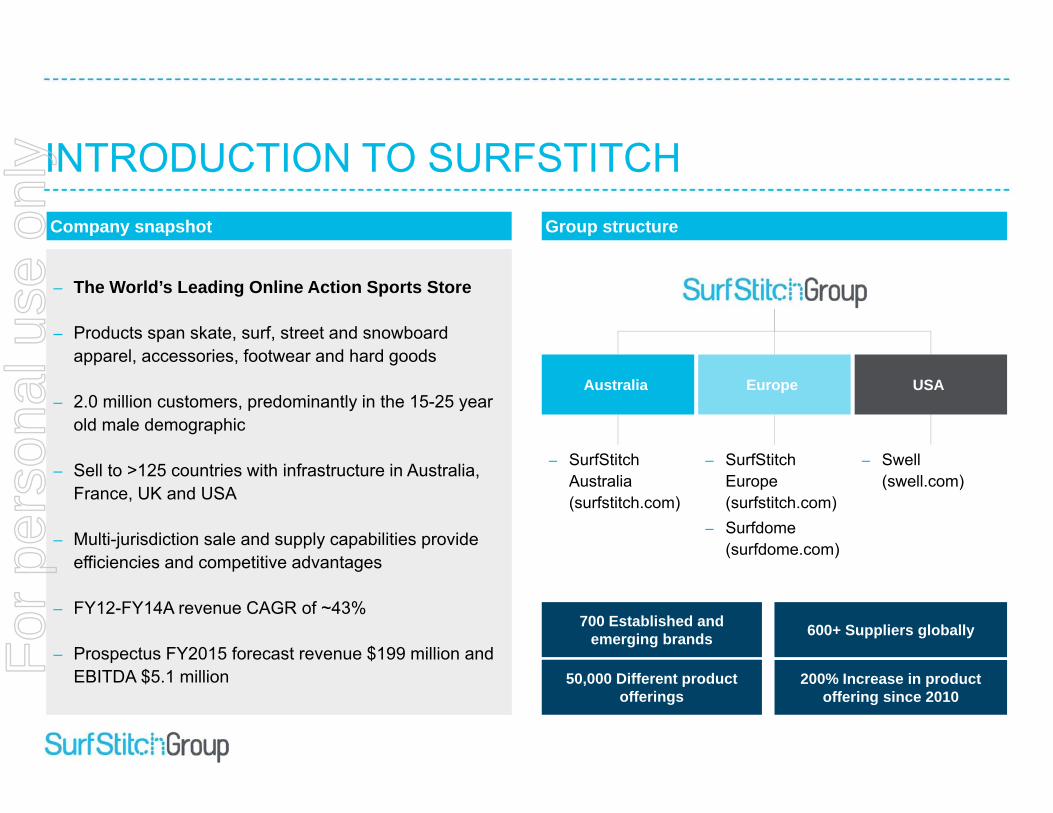
INTRODUCTION TO SURFSTITCHCompany snapshot Group structure
‒ SurfStitch Australia (surfstitch.com)
‒ SurfStitch Europe (surfstitch.com)
‒ Surfdome (surfdome.com)
‒ Swell(swell.com)
‒ The World’s Leading Online Action Sports Store
‒ Products span skate, surf, street and snowboard apparel, accessories, footwear and hard goods
‒ 2.0 million customers, predominantly in the 15-25 year old male demographic
‒ Sell to >125 countries with infrastructure in Australia, France, UK and USA
‒ Multi-jurisdiction sale and supply capabilities provide efficiencies and competitive advantages
‒ FY12-FY14A revenue CAGR of ~43%
‒ Prospectus FY2015 forecast revenue $199 million and EBITDA $5.1 million
Australia Europe USA
700 Established and emerging brands 600+ Suppliers globally
50,000 Different product offerings
200% Increase in product offering since 2010
For
per
sona
l use
onl
y
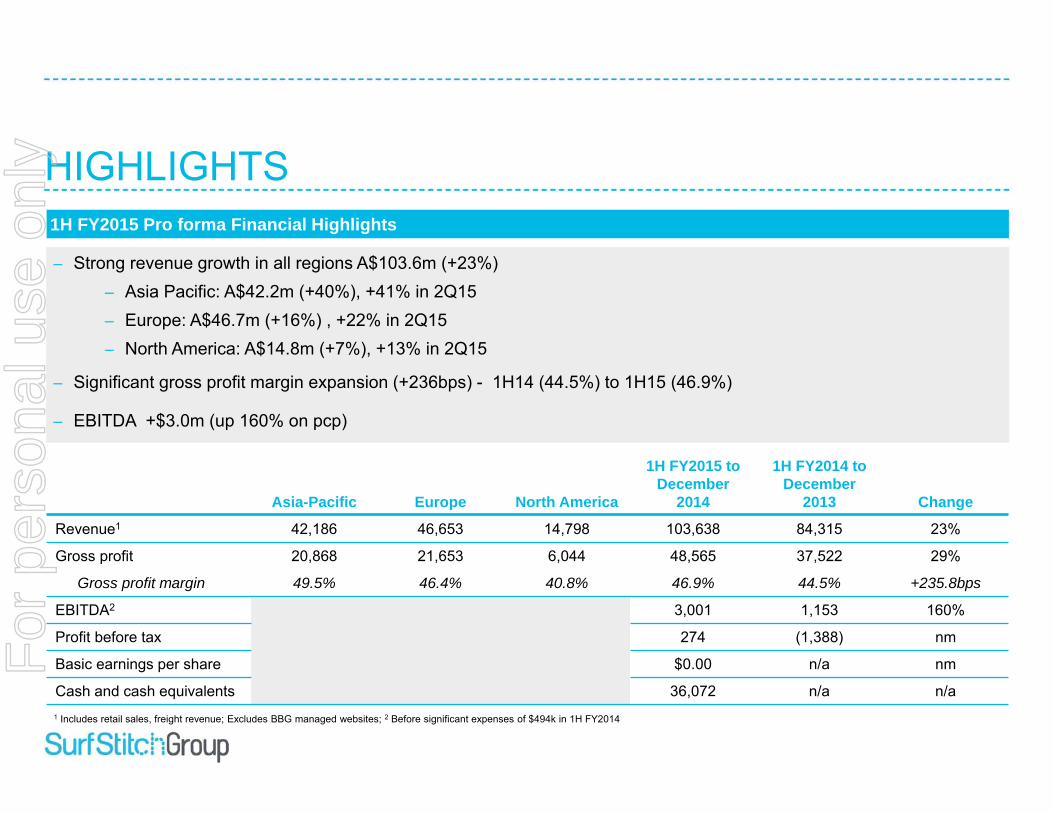
HIGHLIGHTS1H FY2015 Pro forma Financial Highlights
‒ Strong revenue growth in all regions A$103.6m (+23%)‒ Asia Pacific: A$42.2m (+40%), +41% in 2Q15 ‒ Europe: A$46.7m (+16%) , +22% in 2Q15‒ North America: A$14.8m (+7%), +13% in 2Q15
‒ Significant gross profit margin expansion (+236bps) - 1H14 (44.5%) to 1H15 (46.9%)
‒ EBITDA +$3.0m (up 160% on pcp)
Asia-Pacific Europe North America
1H FY2015 to December
2014
1H FY2014 to December
2013 Change
Revenue1 42,186 46,653 14,798 103,638 84,315 23%
Gross profit 20,868 21,653 6,044 48,565 37,522 29%
Gross profit margin 49.5% 46.4% 40.8% 46.9% 44.5% +235.8bps
EBITDA2 3,001 1,153 160%
Profit before tax 274 (1,388) nm
Basic earnings per share $0.00 n/a nm
Cash and cash equivalents 36,072 n/a n/a1 Includes retail sales, freight revenue; Excludes BBG managed websites; 2 Before significant expenses of $494k in 1H FY2014
For
per
sona
l use
onl
y

HIGHLIGHTS (CONT’D)1H FY2015 Pro forma Financial Highlights (cont’d)
‒ SurfStitch Group reported statutory results for the interim period of 13 October to 31 December 2014‒ Represents two-weeks of trading activity since the Company listed on 16 December 2014‒ $12.3 million in revenue and ($5.3) million in net losses‒ Losses incurred in the statutory period resulting from acquisition and IPO listing fees
‒ Two weeks of operations are not indicative of the overall operations of the Consolidated Group
‒ In order to provide a comprehensive view of the Consolidated business and to provide visibility into year over year comparisons, pro forma adjustments have been taken to reflect the full 1H period of 1 July to 31 December
‒ Pro forma numbers assume SurfStitch AU, SurfStitch EU, Surfdome and SWELL were acquired as at 1 July 2012‒ Historical pro forma numbers for FY13 and FY14 match prospectus numbers and include all four businesses‒ Historical pro forma numbers for 1H FY14 match figures used to build to FY14 prospectus numbers and include all four
businesses‒ Pro forma numbers excluded Billabong managed websites to match treatment in the prospectus
‒ All figures stated this presentation represent pro forma numbers, unless otherwise indicated
‒ Significant progress in Global platform rationalisation‒ Global Inventory system rollout close to completion‒ Europe Consolidation in progress‒ Separation of Billabong Group websites to complete 2H15
‒ Increasing customer engagement from +2m global database of 15-25 year olds
Statutory financials
For
per
sona
l use
onl
y

1.0 FINANCIAL OVERVIEW
For
per
sona
l use
onl
y

CONSOLIDATED PRO FORMA PROFIT OR LOSS STATEMENT
Asia-Pacific Europe North America
1H FY2015 to December
2014
1H FY2014 to December
2013 % Change
Revenue1 42,186 46,653 14,798 103,638 84,315 23%
COGS (21,318) (25,001) (8,754) (55,073) (46,793) 18%
Gross profit 20,868 21,653 6,044 48,565 37,522 29%
Gross profit margin 49.5% 46.4% 40.8% 46.9% 44.5% +235.8bps
Opex (45,564) (36,369) (25%)
EBITDA2 3,001 1,153 160%
Profit before tax 274 (1,388) nm
Income tax expense – – –
Profit after tax 274 (1,388) nm
A$000
Note: Pro forma numbers reflect the full 1H period of 1 July to 31 December; Exclude BBG managed websites; Assume SurfStitch AU, SurfStitch EU, Surfdome and SWELL acquired as at 1 July 2012 and are included in all periods shown; and include 1H FY14 figures used to build to FY14 prospectus numbers1 Includes retail sales, freight revenue2 Before significant expenses of $494k in 1H FY2014
For
per
sona
l use
onl
y

SALES1 & GROSS PROFIT PERFORMANCE BY REGIONA$000
1H FY2015 Asia-Pacific Europe North America Group total
Revenue1 42,186 46,653 14,798 103,638
% contribution 41% 45% 14% n/a
Growth 1H15 40% 16% 7% 23%
Growth 2Q15 41% 22% 13% 28%
Gross profit 20,868 21,653 6,044 48,565
Gross profit margin 49.5% 46.4% 40.8% 46.7%
% contribution 43% 45% 12% n/a
1H FY2014 1H FY2015 2Q FY2014 2Q FY2015Asia-Pacific Europe North America
$84$104
$66 43% 46
%
45%
45%
36%
48%
44%
45%
41%
46% 49
%
47%
North America Europe Asia-Pacific Consolidated1H FY2013 1H FY2014 1H FY2015
Consolidated sales1 (A$ in millions) to December Gross profit margin to December
$52
Note: Pro forma numbers reflect the full 1H period of 1 July to 31 December; Exclude BBG managed websites; Assume SurfStitch AU, SurfStitch EU, Surfdome and SWELL acquired as at 1 July 2012 and are included in all periods shown; and include 1H FY14 figures used to build to FY14 prospectus numbers; 1 Includes retail sales, freight revenue
For
per
sona
l use
onl
y
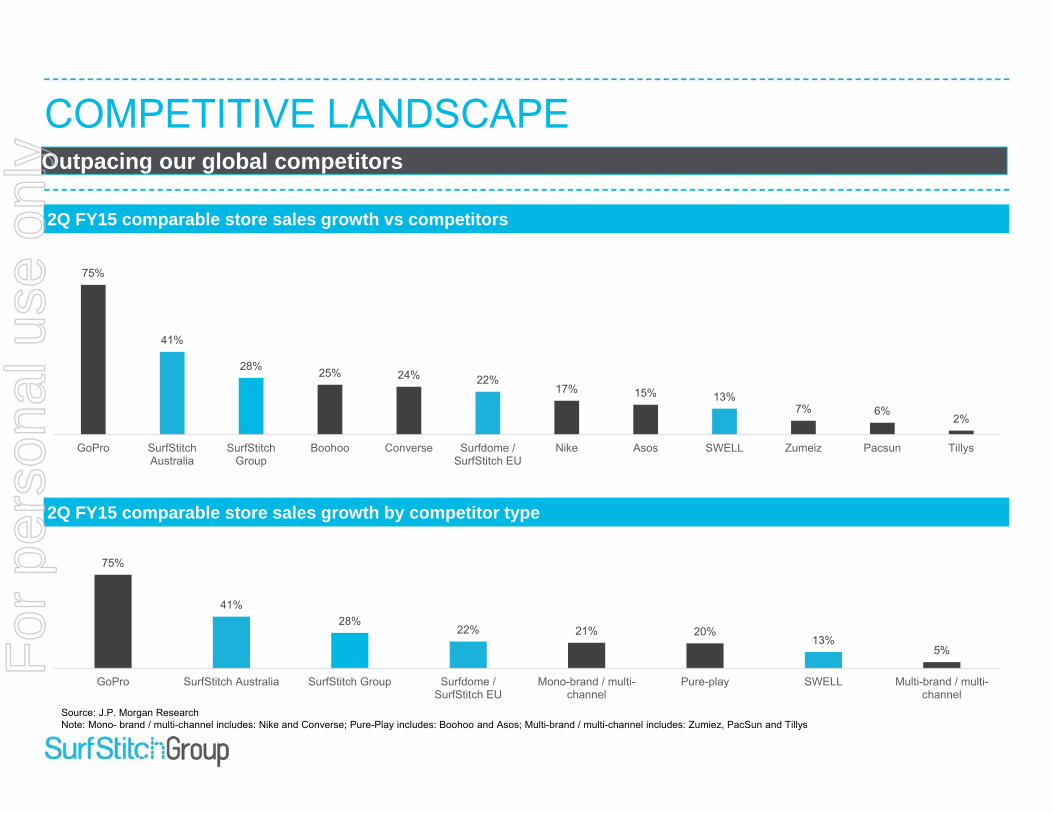
COMPETITIVE LANDSCAPE
75%
41%
28% 25% 24% 22%17% 15% 13%
7% 6%2%
GoPro SurfStitchAustralia
SurfStitchGroup
Boohoo Converse Surfdome /SurfStitch EU
Nike Asos SWELL Zumeiz Pacsun Tillys
2Q FY15 comparable store sales growth vs competitors
2Q FY15 comparable store sales growth by competitor type
75%
41%28%
22% 21% 20%13%
5%
GoPro SurfStitch Australia SurfStitch Group Surfdome /SurfStitch EU
Mono-brand / multi-channel
Pure-play SWELL Multi-brand / multi-channel
Outpacing our global competitors
Source: J.P. Morgan ResearchNote: Mono- brand / multi-channel includes: Nike and Converse; Pure-Play includes: Boohoo and Asos; Multi-brand / multi-channel includes: Zumiez, PacSun and Tillys
For
per
sona
l use
onl
y

ACQUISITION INTEGRATIONAcquisition Progress Update
‒ Gaining momentum as we fully integrate Surfdome and SWELL into the consolidated business
‒ After taking control of the North American business “SWELL”, we saw a 13% increase in sales for 2Q FY2015
‒ Witnessing early trends in gross profit improvement after acquiring Surfdome in December
‒ Delivered +160% EBITDA growth on pcp despite meaningful up-front investment relating to integrations
‒ Globalising inventory management platform
‒ Globalising technology platform
‒ Consolidating European businesses
‒ Marketing spend around brand awareness of the new product mixes
‒ We remain on track with our integration schedule for both SWELL and Surfdome
For
per
sona
l use
onl
y

2H FY2015 OUTLOOKProspectus Forecasts
‒ Strong momentum and favorable trends in 1H FY2015 reaffirm our FY2015 full-year prospectus forecast
‒ $199 million in sales
‒ $5.1 million of EBITDA
‒ January and February trading to date indicate accelerating growth in key regions
‒ No dividend currently planned. Cash will continue to be reinvested in growth given recognizable double digit growth opportunitiesF
or p
erso
nal u
se o
nly

2.0 STRATEGIC OVERVIEW
For
per
sona
l use
onl
y

OUR HISTORY
2007
2009
2012
20102011
2013
2008
2014
SurfStitch.com website launched
SurfStitch founded by Justin Cameron & Lex Pedersen
Billabong acquires 20% of SurfStitch AU1
Billabong acquires a further 31% stake in SurfStitch AU
SurfStitch EU2
established
Completed initial public offering on 16 Dec 2014
Acquisition of Billabong’s 51% stakes in SurfStitch AU and SurfStitch EU and acquisition of Swell
SurfStitch has evolved into a global online Action Sports retailer1 SurfStitch Pty Limited; 2 SurfStitch (Europe) Pty Ltd
Consolidating the Worlds leading Online Actions Sports Retailers
Acquisition of Surfdome from Quiksilver Group
Surfdome founded by Justin Stone
Quiksilver Group acquires 51% of Surfdome
For
per
sona
l use
onl
y

DIFFERENTIATED PURE PLAY ONLINE RETAILER
Premium pricing operating modelInvestment in content publishing platform
Efficient global business inventory model
Large exclusive product ranges in each region
First to market product offering Next day delivery to more than 125
countries Consignment and strong rebate / rotation
inventory model Male demographic focus, which reduces
fast fashion exposure
Recent launch of dedicated content hub “The Lens”; a content publishing platform created for customers to engage in and experience everything action sports and youth lifestyle related
Platform has delivered increased visitation (over 40% of users visit the platform over 10+ times a month)
Future investment focus
Unique infrastructure model provides an effective FX hedge
Minimises impact of FX on product cost and distribution cost while still pricing at local rates
Sustainable gross profit margins Benefits of global buying power Margin protection made possible through
exclusive brand and product assortment New market focus
For
per
sona
l use
onl
y
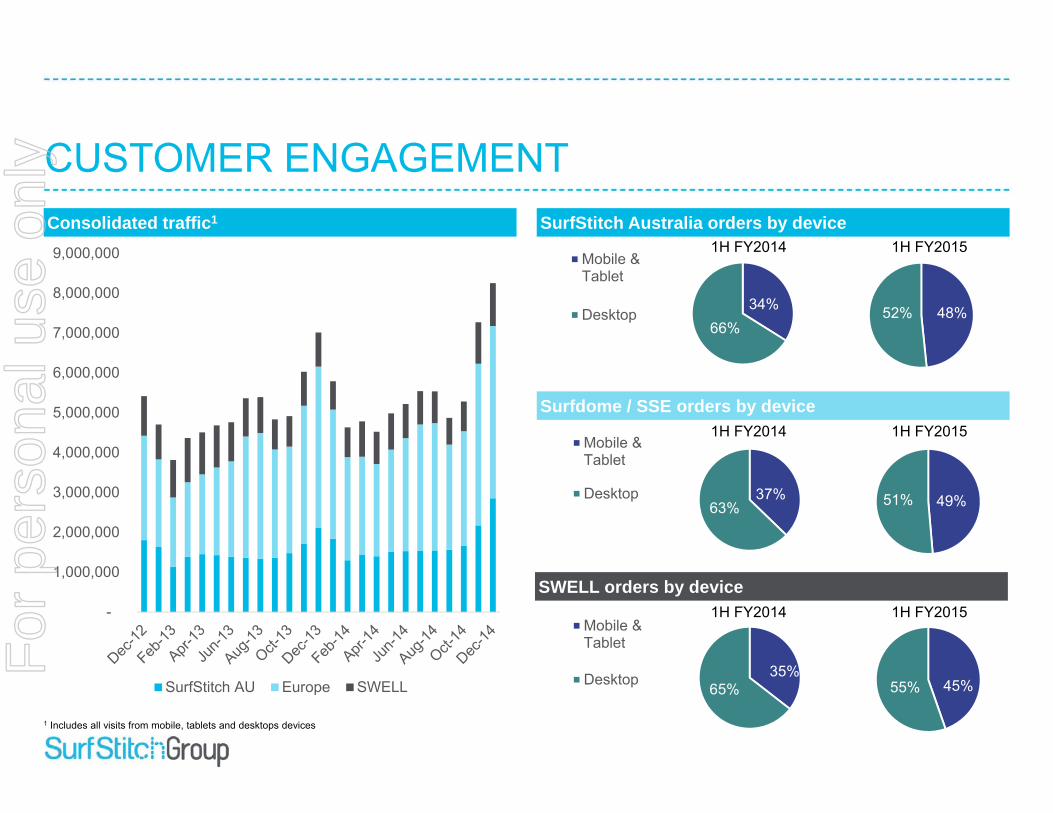
37%63%
Mobile &Tablet
Desktop
48%52%34%66%
Mobile &Tablet
Desktop
CUSTOMER ENGAGEMENTConsolidated traffic1
-
1,000,000
2,000,000
3,000,000
4,000,000
5,000,000
6,000,000
7,000,000
8,000,000
9,000,000
SurfStitch AU Europe SWELL
1 Includes all visits from mobile, tablets and desktops devices
SurfStitch Australia orders by device
Surfdome / SSE orders by device
SWELL orders by device
1H FY2014 1H FY2015
1H FY2014 1H FY2015
1H FY2014 1H FY2015
49%51%
45%55%35%
65%
Mobile &Tablet
DesktopFor
per
sona
l use
onl
y
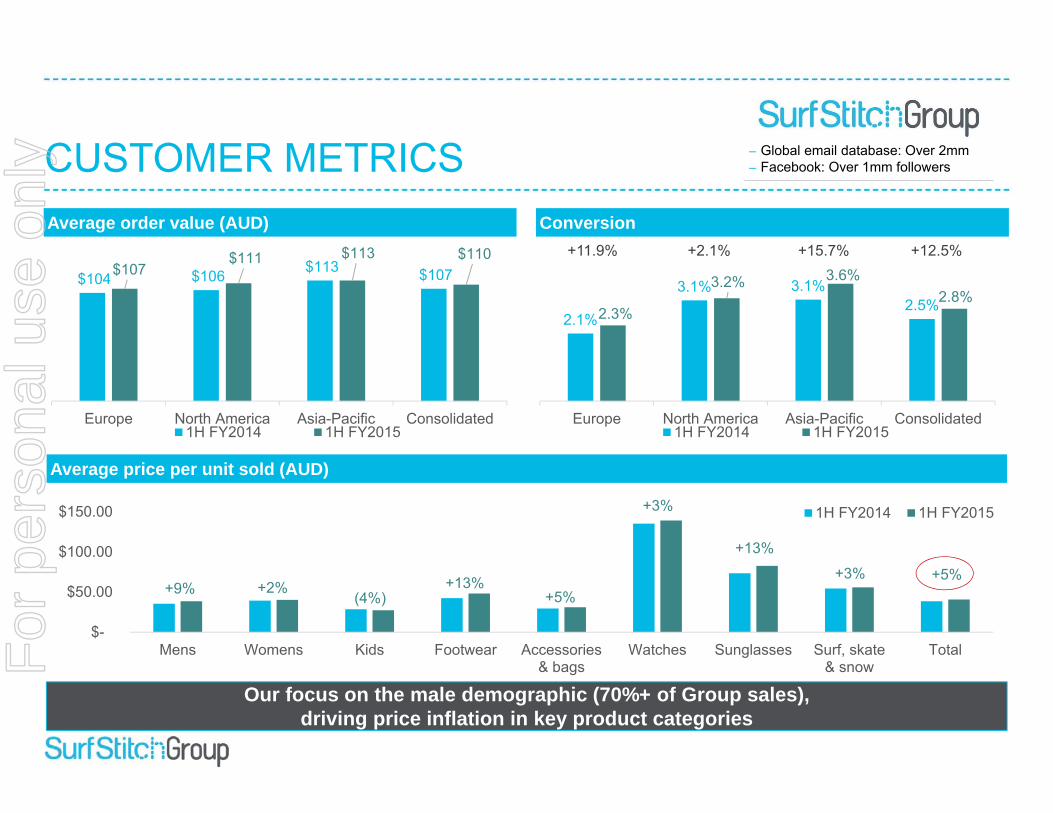
CUSTOMER METRICSConversion Average order value (AUD)
$104 $106 $113 $107 $107 $111 $113 $110
Europe North America Asia-Pacific Consolidated1H FY2014 1H FY2015
‒ Global email database: Over 2mm‒ Facebook: Over 1mm followers
Our focus on the male demographic (70%+ of Group sales), driving price inflation in key product categories
$-
$50.00
$100.00
$150.00
Mens Womens Kids Footwear Accessories& bags
Watches Sunglasses Surf, skate& snow
Total
1H FY2014 1H FY2015
Average price per unit sold (AUD)
+9% +2%(4%)
+13%+5%
+3%
+13%
+3% +5%
2.1%
3.1% 3.1%2.5%2.3%
3.2% 3.6%2.8%
Europe North America Asia-Pacific Consolidated1H FY2014 1H FY2015
+11.9% +2.1% +15.7% +12.5%
For
per
sona
l use
onl
y

CONTENT DRIVEN STRATEGY
Role of content
‒ Audience no longer responds as effectively to advertising
‒ Audience is demanding relevant authentic, entertainment that connects with their personality, interests and friends
Objectives‒ Become a destination retailer and be recognised as a greater entity than a retailer
‒ Localised content alongside investment in a global content strategy shared within the SurfStitch Group
‒ Opportunity to share globally relevant content across all businesses
‘The Lens’ our global content hub driving changes in user engagement
Frequency visits per month
53%47%
40%
16% 17% 19%
31%36%
41%
31-Dec-12 31-Dec-13 31-Dec-14
1-4x 4-10x 10+
For
per
sona
l use
onl
y
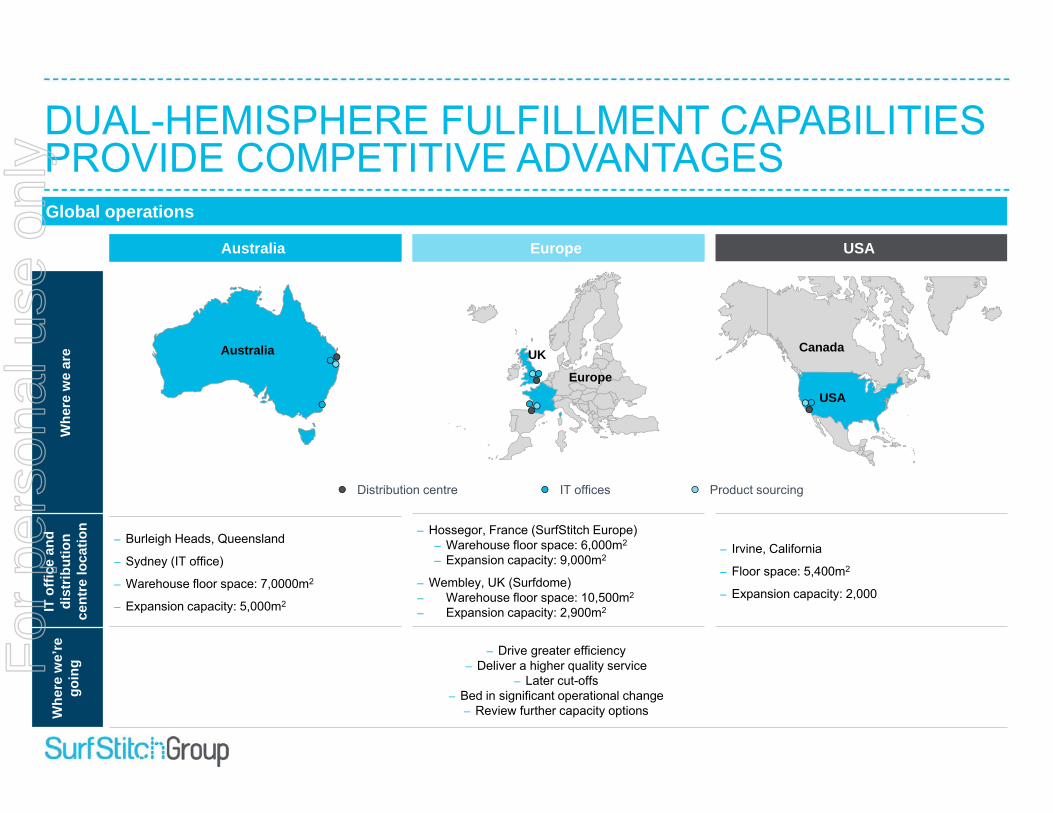
DUAL-HEMISPHERE FULFILLMENT CAPABILITIES PROVIDE COMPETITIVE ADVANTAGES
‒ Hossegor, France (SurfStitch Europe)‒ Warehouse floor space: 6,000m2
‒ Expansion capacity: 9,000m2
‒ Wembley, UK (Surfdome)‒ Warehouse floor space: 10,500m2
‒ Expansion capacity: 2,900m2
‒ Burleigh Heads, Queensland
‒ Sydney (IT office)
‒ Warehouse floor space: 7,0000m2
‒ Expansion capacity: 5,000m2
‒ Irvine, California
‒ Floor space: 5,400m2
‒ Expansion capacity: 2,000
Global operations
UK
EuropeUSA
Canada
Whe
re w
e ar
eIT
offi
ce a
nd
dist
ribut
ion
cent
re lo
catio
n
Whe
re w
e’re
go
ing
Australia Europe USAUSA
Australia
IT offices Product sourcingDistribution centre
‒ Drive greater efficiency‒ Deliver a higher quality service
‒ Later cut-offs‒ Bed in significant operational change
‒ Review further capacity options
For
per
sona
l use
onl
y

GLOBAL PRO FORMA ORDER CONTRIBUTION
A$ in millions, except per order values
1H FY2015 Asia-Pacific Europe North America Group total
COGS $21.3 $25.0 $8.8 $55.1
Distribution cost 4.0 4.8 1.5 10.4
Total direct costs $25.3 $29.8 $10.3 $65.4
Orders 409,778 470,345 163,129 1,043,252
Direct cost/order $61.81 $63.40 $63.00 $62.71
1H FY2014 Direct cost/order $65.80 $75.63 $64.82 $70.07
Variance 6% 19% 3% 12%
Note: Pro forma numbers reflect the full 1H period of 1 July to 31 December; Exclude BBG managed websites; Assume SurfStitch AU, SurfStitch EU, Surfdome and SWELL acquired as at 1 July 2012 and are included in all periods shown; and include 1H FY14 figures used to build to FY14 prospectus numbers
For
per
sona
l use
onl
y

TECHNOLOGY
Current status ‒ Global platform migrations
Planning for the future
‒ Web to cloud
‒ Customized content driven website that’s responsive and adaptive to our customers’ needs
‒ Consolidated data analytics
‒ Zonal
‒ Eurohub
‒ Improved mobile and tablet platforms
‒ Improvements for ease of processing and checkout
Key initiatives For
per
sona
l use
onl
y

REMAIN FOCUSED ON GROWTH
Strategic Overview
‒ Double digit sales growth trends are expected to continue into the second half of FY2015 ‒ Further refinement and expansion of merchandise assortment
‒ Widening exclusive product and brands offering
‒ Increased content publishing strategy
‒ New market entries
‒ We anticipate continued gross profit margin benefits into 2H FY2015‒ Benefits of global buying power
‒ Margin protection made possible through exclusive brand and product assortment
‒ New market focus
‒ Continued improvements in operating expenses‒ Benefits of scale and growth on front-loaded costs
‒ Disciplined marketing spend / reinvestment
‒ Refinement of freight costs strategyFor
per
sona
l use
onl
y

3.0 OPERATIONS OVERVIEW
For
per
sona
l use
onl
y

THE MARKET
SurfStitch dominates the significant niche of Online Action Sports
Global action sports market size
North America market: A$23bn Surf/snow/skate apparel + hard
goods: A$9bn Footwear: A$2bn Street fashion: A$12bn
Europe market: A$7bn Surf/snow/skate apparel + hard
goods: A$5bn Footwear: A$1bn Street fashion: A$1bn
Asia and Japan market: A$1bn
Australia and New Zealand: A$4bn Surf/snow/skate apparel + hard
goods: A$3bn Footwear: A$500mm Street fashion: A$500mm
Source: Equity research, global eCommerce model data, Management data; Converted at an exchange rate of A$:$USD of 1.101 Global is defined as the estimated retail spend of the following 15 countries: United States, United Kingdom, Germany, France, Spain, Italy, Russia, Japan, China, South Korea, Brazil,
Argentina, Chile, Mexico and Australia
A$302bn
Total retail market
A$259bn
Total retail market
Addressable online market
in 2012(A$15bn)
Addressable online market
in 2016(A$31bn)
10.3%
5.9%
CAGR+4.0%
CAGR+18.9%
A$12,935bn
Total retail market
A$10,552bn
Total retail market
Addressable online market
in 2012(A$683bn)
Addressable online market
in 2016(A$1,205bn)
9.3%
6.5%
CAGR+5.2%
CAGR+15.2%
Global retail market1
Australian retail market
For
per
sona
l use
onl
y

TRULY GLOBAL
‒ Only major pure play Action Sports online retailer in Australia and New Zealand
‒ Top-ten online Australian apparel / accessories retailer in Australia over last three years
‒ Approximately 1,075,000 Customers
Asia PacificAsia Pacific EuropeEurope North AmericaNorth America
SurfStitch AustraliaSurfStitch Australia SurfStitch EuropeSurfStitch Europe SwellSwellSurfdomeSurfdome
‒ A fast growing player in the European online Action Sports segment
‒ Focus on French, Spanish and Italian markets
‒ Approximately 200,000 Customers
‒ A leading UK-based pure play online retailer of Action Sports products
‒ UK, Germany and Nordic region focus complements SurfStitch Europe
‒ Approximately 500,000 Customers
‒ USA’s first pure play online Action Sports retailer with established market position
‒ Approximately 230,000 Customers
SIZEABLE GLOBAL DATABASE
‒ Sell to over 125 countries ‒ Four websites with multi-language / multi-currency capabilities‒ Local pricing with sourcing at the least expensive area‒ New market entry
For
per
sona
l use
onl
y

NATURAL FX HEDGE
Unique infrastructure model
‒ SurfStitch Group is a global business with operations in the USA, UK, Europe and Australia‒ While we report in AUD, we also earn local revenues in USD, GBP and EURO
Minimises product cost and distribution cost
‒ Minimise impact to costs by sourcing at the least expensive area‒ Domestic inventory sourcing and warehousing in regions where FX is favorable minimises distribution costs
Provides an effective natural FX hedge
‒ Adverse currency movements over the period impacted the broader ecommerce market‒ However, SurfStitch Group’s unique infrastructure model provided an effective natural hedge driving strong growth in
each region by pricing at the regional level
Materiality
‒ Although FX movements in 1H FY2015 have been most favorable to the US business, SWELL represents less than 15% of total global consolidated sales
For
per
sona
l use
onl
y

4.0 SUMMARY
For
per
sona
l use
onl
y

1H FY2015 SUMMARY
Leverage the dominant positions of each brand in respective regions
‒ Shared database and marketing driving stronger return on investment
‒ Conversion benefits from shared intellectual property and existing platform strength
Shared global inventory pool
‒ Improving stock turn and working capital position‒ Increasing closing gross profit margins leveraging
global buying capability‒ Benefits of counter seasonality
Consolidate IT platforms
‒ Back end inventory management platform shared globally
‒ Swell integration achieved in short time frame
Successful integration track record
Strong revenue growth
‒ Focus on male demographic (70% of Group sales), driving price inflation
‒ Unique assortment and range‒ Exclusive products and content
Up-front investment
‒ Globalising inventory management and technology platform
‒ Marketing spend around brand awareness of the new invigorated product mixes
Margin expansion
‒ Improved buying behaviors and strong traffic generation delivering improved conversion rates
‒ Improved stock management and partnerships with key suppliers
Growth & efficiencies realised
For
per
sona
l use
onl
y

SURFSTITCH’S GROWTH STRATEGYDrive operational synergies
‒ Share operational best practices across the group
‒ Integration of e-Commerce technology platforms to remove duplicate costs
‒ More favourable trading terms from product suppliers and technology providers with global buying power
Grow Action Sports market share
‒ Continued expansion of brand and product range
‒ Enhance user experience functionality
‒ Increase personalisation of email marketing
‒ Content driven strategy
Complete integration of acquisitions
‒ Assess and execute acquisitions to build scale or enter new geographies
‒ Complete integration of newly acquired businesses to capitalise on synergies and scale
‒ Consolidate position as a global leader in pure play online Action Sports retail
Expansion into new markets
‒ Evaluate organic expansion opportunities based on certain criteria to achieve greater scale
‒ Organic expansion into Asia
‒ Efficiently and cost effectively enter new markets
Leverage operational efficiencies
‒ Increase site traffic and conversion rates
‒ Exploit counter seasonal aspects of dual-hemisphere operating platforms
‒ 2H FY2015 to realise benefits of 1H FY2015 up-front investment and increased scale
‒ Disciplined marketing spend / reinvestment and refinement of freight costs strategy
For
per
sona
l use
onl
y

5.0 APPENDICES
For
per
sona
l use
onl
y

HISTORICAL PRO FORMA REVENUE AND GROSS PROFIT BY REGIONRevenue1 (A$ in millions)
Gross profit (A$ in millions)
$39.7 $35.7
$56.7 $52.5
$84.3 $69.3
$103.6
1H FY2012 2H FY2012 1H FY2013 2H FY2013 1H FY2014 2H FY2015 1H FY2015
SSA Europe SWELL
$18.0 $17.0 $25.6 $23.3
$37.5 $29.4
$48.6
1H FY2012 2H FY2012 1H FY2013 2H FY2013 1H FY2014 2H FY2015 1H FY2015
SSA Europe SWELLNote: Pro forma numbers reflect the full 1H period of 1 July to 31 December; Exclude BBG managed websites; Assume SurfStitch AU, SurfStitch EU, Surfdome and SWELL acquired as at 1 July 2012 and are included in all periods shown; and include 1H FY14 figures used to build to FY14 prospectus numbers1 Includes retail sales, freight revenue
For
per
sona
l use
onl
y

CONSOLIDATED PRO FORMA HISTORICAL PROFIT OR LOSS STATEMENT
Consolidated pro forma historical profit or loss statement
Pro forma historical (prospectus numbers) Pro forma 1HA$ in millions FY2013 FY2014 1H FY2014 (prospectus) 1H FY2015Revenue 109.1 153.7 84.3 103.6COGS (60.2) (86.7) (46.8) (55.1)
Gross profit 48.9 67.0 37.5 48.6
Opex (50.6) (69.1) (36.4) (45.6)
EBITDA before significant items (1.7) (2.1) 1.2 3.0Significant items (1.9) (0.9) (0.5) –
EBITDA (3.6) (3.0) 0.7 3.0Depreciation and amortisation (2.5) (4.6) (2.0) (2.9)
EBIT (6.1) (7.6) (1.4) 0.1Interest – – – 0.1
Profit before tax (6.1) (7.6) (1.4) 0.3Income tax expense (0.4) (0.5) – –
NPAT (6.5) (8.1) (1.4) 0.3
Start up losses of SurfStitch EU impacting FY 2013 and FY 2014 earnings
Note: Pro forma numbers reflect the full 1H period of 1 July to 31 December; Exclude BBG managed websites; Assume SurfStitch AU, SurfStitch EU, Surfdome and SWELL acquired as at 1 July 2012 and are included in all periods shown; and include 1H FY14 figures used to build to FY14 prospectus numbers
For
per
sona
l use
onl
y
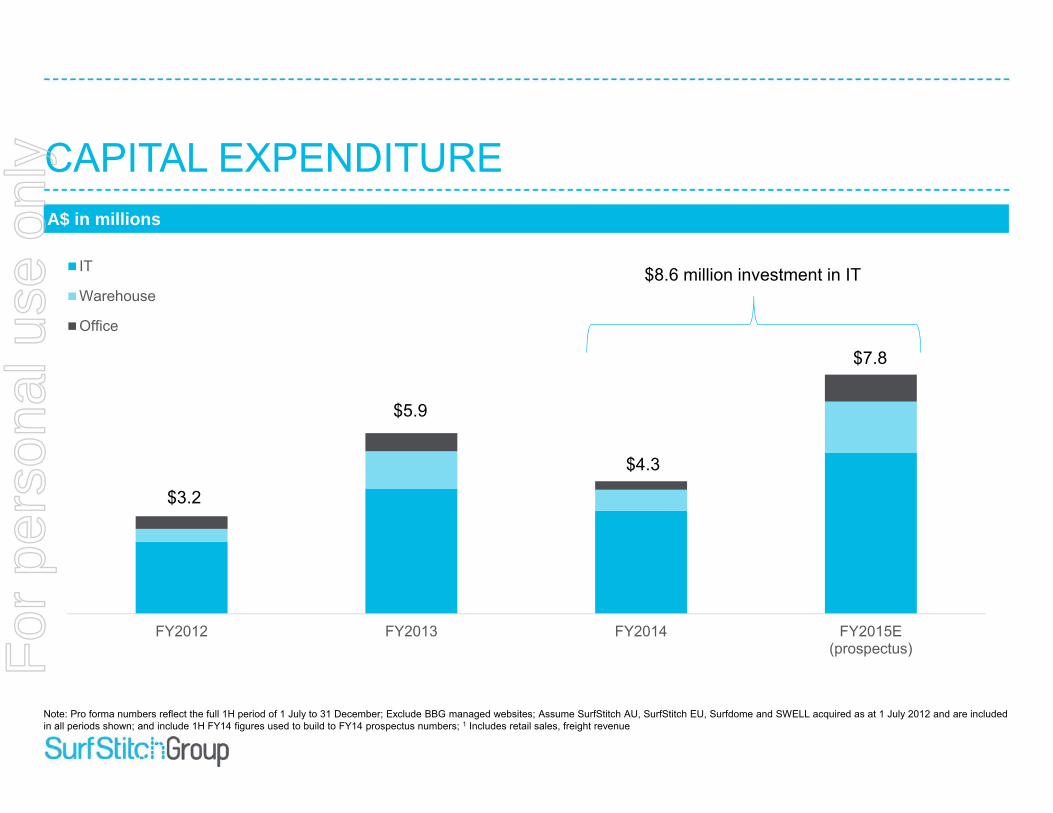
CAPITAL EXPENDITUREA$ in millions
FY2012 FY2013 FY2014 FY2015E(prospectus)
IT
Warehouse
Office
Note: Pro forma numbers reflect the full 1H period of 1 July to 31 December; Exclude BBG managed websites; Assume SurfStitch AU, SurfStitch EU, Surfdome and SWELL acquired as at 1 July 2012 and are included in all periods shown; and include 1H FY14 figures used to build to FY14 prospectus numbers; 1 Includes retail sales, freight revenue
$3.2
$5.9
$4.3
$7.8
$8.6 million investment in IT
For
per
sona
l use
onl
y

STATUTORY CONSOLIDATED STATEMENT OF PROFIT OR LOSS
Continuing operations (A$ millions)Revenue 12.3COGS (7.6)Gross Profit 4.7Other income 0.01Selling & distribution expenses (5.4)Administrative expenses (0.8)Other expenses (5.7)Results from operating activities (7.2)Finance income 0.02Finance costs –Net finance income 0.02Profit before tax (7.2)Income tax benefit 1.8Net (loss) attributable to the owners of SurfStitch Group Limited (5.3)
Statutory profit or loss for the period 13 October 2014 to 31 December 2014
For
per
sona
l use
onl
y
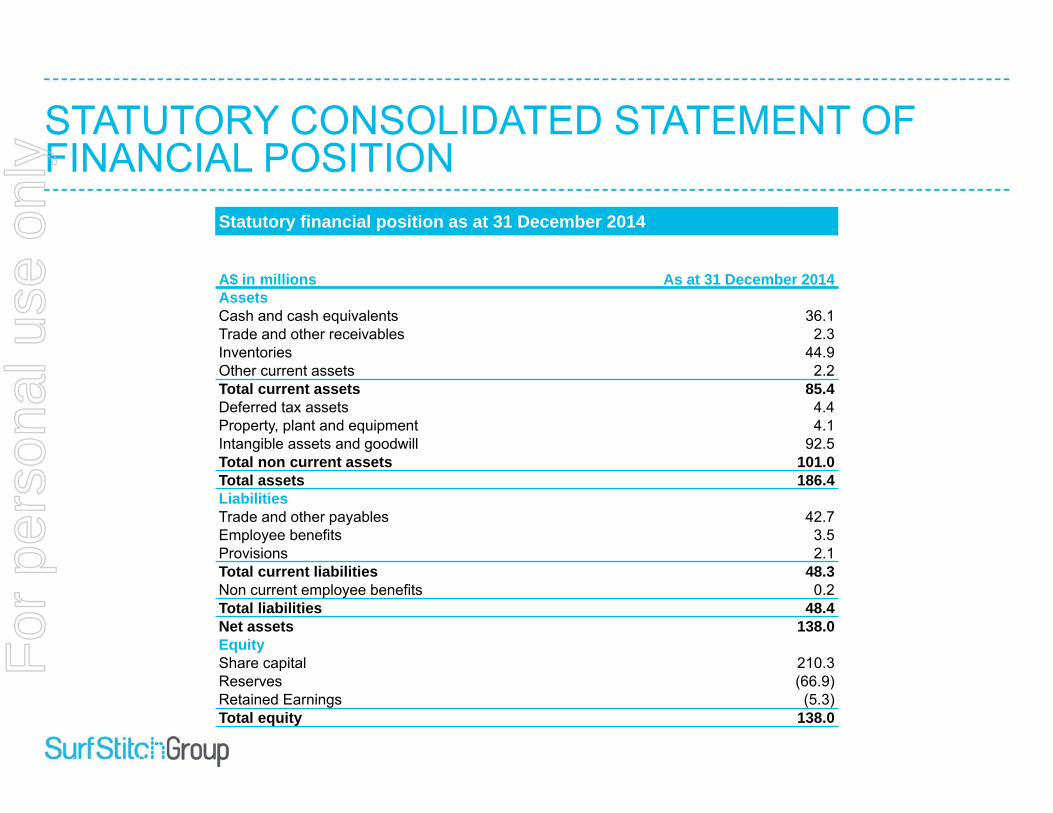
STATUTORY CONSOLIDATED STATEMENT OF FINANCIAL POSITION
A$ in millions As at 31 December 2014AssetsCash and cash equivalents 36.1Trade and other receivables 2.3Inventories 44.9Other current assets 2.2Total current assets 85.4Deferred tax assets 4.4Property, plant and equipment 4.1Intangible assets and goodwill 92.5Total non current assets 101.0Total assets 186.4LiabilitiesTrade and other payables 42.7Employee benefits 3.5Provisions 2.1Total current liabilities 48.3Non current employee benefits 0.2Total liabilities 48.4Net assets 138.0EquityShare capital 210.3Reserves (66.9)Retained Earnings (5.3)Total equity 138.0
Statutory financial position as at 31 December 2014
For
per
sona
l use
onl
y

STATUTORY CONSOLIDATED STATEMENT OF CASH FLOW
A$ in millionsCash flows from operating activitiesCash and cash equivalents 11.2Other current assets (11.8)Total current assets (0.6)Cash flows from investing activitiesInterest received 0.02Acquisition of intangible assets (0.1)Acquisition of subsidiary, net of cash acquired (42.8)Acquisition of property, plant and equipment (0.07)Total cash used in investing activities (43.0)Cash flows from financing activitiesProceeds from share capital 83.2Transaction costs related to the issue of share capital (3.5)Total cash used in financing activities 79.7Net increase/(decrease) in cash and cash equivalents 36.1Cash and cash equivalents at 13 October –Effect of exchange rate fluctuations on cash held (0.008)Cash and cash equivalents at 31 December 36.1
Statutory cash flow for the period 13 October 2014 to 31 December 2014
For
per
sona
l use
onl
y
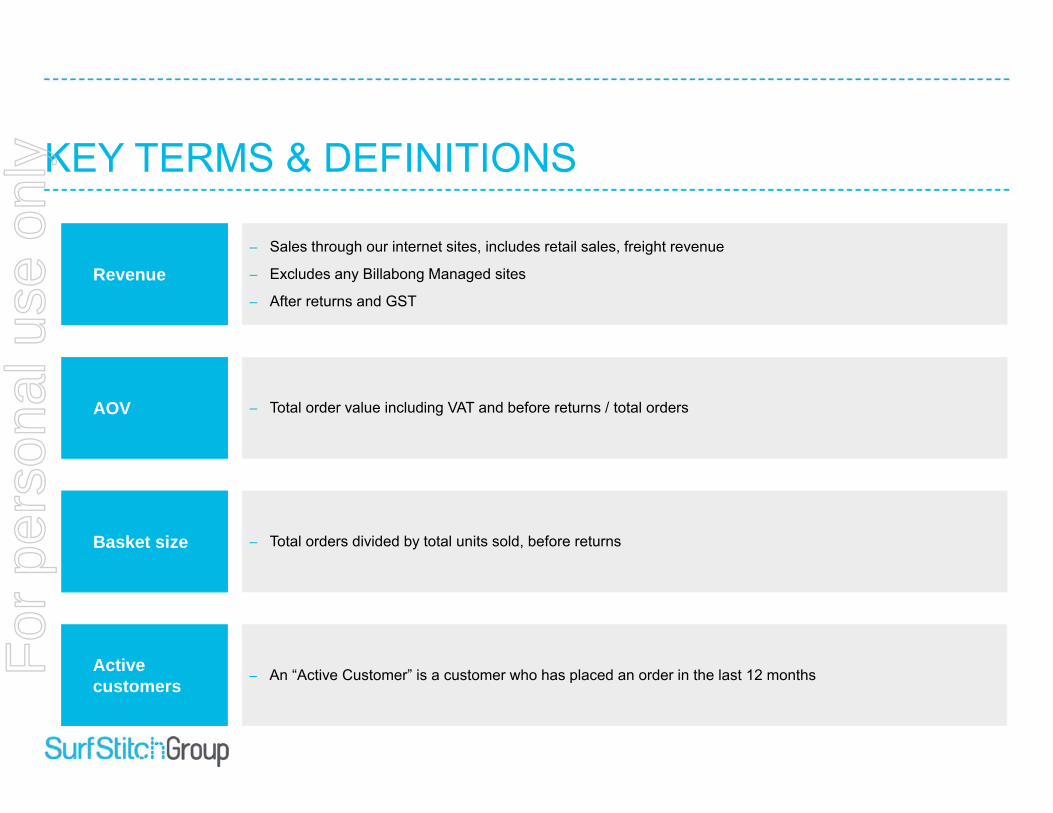
KEY TERMS & DEFINITIONS
Revenue‒ Sales through our internet sites, includes retail sales, freight revenue
‒ Excludes any Billabong Managed sites
‒ After returns and GST
AOV ‒ Total order value including VAT and before returns / total orders
Basket size ‒ Total orders divided by total units sold, before returns
Active customers ‒ An “Active Customer” is a customer who has placed an order in the last 12 monthsF
or p
erso
nal u
se o
nly

DISCLAIMER
This presentation and information communicated verbally to you may contain certain projections and other forward-lookingstatements with respect to the financial condition, results of operations, businesses and prospects of SurfStitch Group Limited(“SurfStitch Group”). These statements are based on current expectations and involve risk and uncertainty because they relateto events and depend upon circumstances that may or may not occur in the future. There are a number of factors which couldcause actual results or developments to differ materially from those expressed or implied by these forward-looking statements.Any of the assumptions underlying these forward-looking statements could prove inaccurate or incorrect and therefore anyresults contemplated in the forward-looking statements may not actually be achieved. Nothing contained in this presentation orcommunicated verbally should be construed as a profit forecast or profit estimate. Investors or other recipients are cautionednot to place undue reliance on any forward-looking statements contained herein. SurfStitch Group undertakes no obligation toupdate or revise (publicly or otherwise) any forward-looking statement, whether as a result of new information, future events orother circumstances. Neither this presentation nor any verbal communication shall constitute an invitation or inducement toany person to subscribe for or otherwise acquire securities in SurfStitch Group.
For
per
sona
l use
onl
y

For
per
sona
l use
onl
y