Embed Size (px)
Citation preview

1
Diggers Presentation9 August 2017
The Evolution of Lithium®
For
per
sona
l use
onl
y
2
+ =
2
Disclaimer
Summary information: This document has been prepared by Neometals Ltd (“Neometals” or “the Company”) to provide summary information about the Company and its associated entities and their activities current as at the date of this document. The information contained in this document is of general background and does not purport to be complete. It should be read in conjunction with Neometals’ other periodic and continuous disclosure announcements lodged with the Australian Securities Exchange, which are available at www.asx.com.au.
Forward-looking information: This document includes certain statements, opinions, projections, forecasts and other forward-looking information which, while considered reasonable by Neometals, are inherently subject to significant uncertainties and contingencies. Many known and unknown factors could cause actual events or results to differ materially from estimated or anticipated events or results included in this document. Recipients of this document are cautioned that forward-looking statements are not guarantees of future performance – they must make their own independent investigations, consideration and evaluation of the opportunity to invest in the Company. By accepting this document, recipients agree that if they proceed further with their investigations, consideration or evaluation of the opportunity to invest in the Company, they will make and rely solely upon their own investigations and enquiries and will not in any way rely upon this document.
Any statements, opinions, projections, forecasts and other forward-looking information contained in this document do not constitute any commitments, representations or warranties by Neometals and its associated entities, directors, agents and employees, including any undertaking to update any such information. Except as required by law, and only to the extent so required, directors, agents and employees of Neometals shall in no way be liable to any person or body for any loss, claim, demand, damages, costs or expenses of whatsoever nature arising in any way out of, or in connection with, the information contained in this document.
Financial data: All figures in this document are in Australian dollars (AUD) unless stated otherwise.
Not financial product advice: This document is for information purposes only and is not financial product or investment advice, nor a recommendation to acquire securities in Neometals. It has been prepared without taking into account the objectives, financial situation or needs of individuals. Before making any investment decision, prospective investors should consider the appropriateness of the information having regard to their own objectives, financial situation and needs and seek legal and taxation advice appropriate to their jurisdiction.
Investment risk: An investment in securities in Neometals is subject to investment and other known and unknown risks, some of which are beyond the control of Neometals. The Company does not guarantee any particular rate of return or the performance of Neometals. Investors should have regard to the risk factors outlined in this document.
Competent Persons Statement:The information in this document that relates to “Barrambie Mineral Resource Estimates”, “Barrambie Pre Feasibility Study Results”, “Mt Marion Mineral Resource Estimates” and “Lithium Battery Recycling– Scoping Study Results” are extracted from ASX Releases set out below. The Company confirms that it is not aware of any new information or data that materially affects the information included in theASX Releases set out below, and in the case of estimates of mineral resources, that all material assumptions and technical parameters underpinning the estimates in those ASX Releases continue to applyand have not materially changed.
The Company confirms that all the material assumptions underpinning the production target and the forecast financial information derived from the production targets in the Barrambie Pre-feasibility Studyand Lithium Battery Recycling – Scoping Study continue to apply and have not materially changed.
2
6/12/2013 Barrambie - Amended JORC 2012 Mineral Resource Estimate25/08/2015 Barrambie Pre Feasibility Study Results27/10/2016 Mt Marion Mineral Resource Upgrade22/02/2017 Lithium Battery Recycling – Scoping Study Results
For
per
sona
l use
onl
y

3
+ =
+ =
3
For
per
sona
l use
onl
y

4
Investment Thematic – ConservativeExposure to Energy Storage Revolution
8XGrowth
For
per
sona
l use
onl
y

5
Focus on Li-Ion Battery CommoditiesF
or p
erso
nal u
se o
nly

6
Long-term Strategy
2 cent unfranked div – April ‘162 cent unfranked div – Aug 5% on market buyback
For
per
sona
l use
onl
y

7
Tactical Plan - FY17
• Negotiated increased output and offtake pricing. Running sale process for stake in Mt Marion.
• Advancing local LiOH project in parallel with equipment vendor testwork, offtake and partner selection processes.
• Fast-track evaluation of proprietary recycling process to recover Lithium/Cobalt/Nickel from Lithium-ion batteries with focus on EV.
• Build royalty portfolio from commercialisation of Neomet Process with Sedgman and Andritz
• Cash and investments ~ A$62M, no debtF
or p
erso
nal u
se o
nly

8
+ =
+ =
8
For
per
sona
l use
onl
y

9
+ =
• Commercialise Mt Marion
• Evaluating local Conventional Downstream Processing
• Co-developed, Evaluated, Patented New ELi® Process
• Co-developed, Evaluated, Patent Pending ELi ® for brines
• Testing and Evaluating Lithium-Ion Battery Recycling
Evolution of our Lithium BusinessF
or p
erso
nal u
se o
nly

10
+ =
10
Our Positions in the Supply ChainF
or p
erso
nal u
se o
nly

11
+ =
11
Downstream processing adds valueF
or p
erso
nal u
se o
nly

12
+ =
Mt Marion Lithium Operation
Neometals 13.8%through Reed Industrial Minerals Pty LtdF
or p
erso
nal u
se o
nly

13
+ =
13
World’s largest lithium concentrator
For
per
sona
l use
onl
y
14
+ =
14
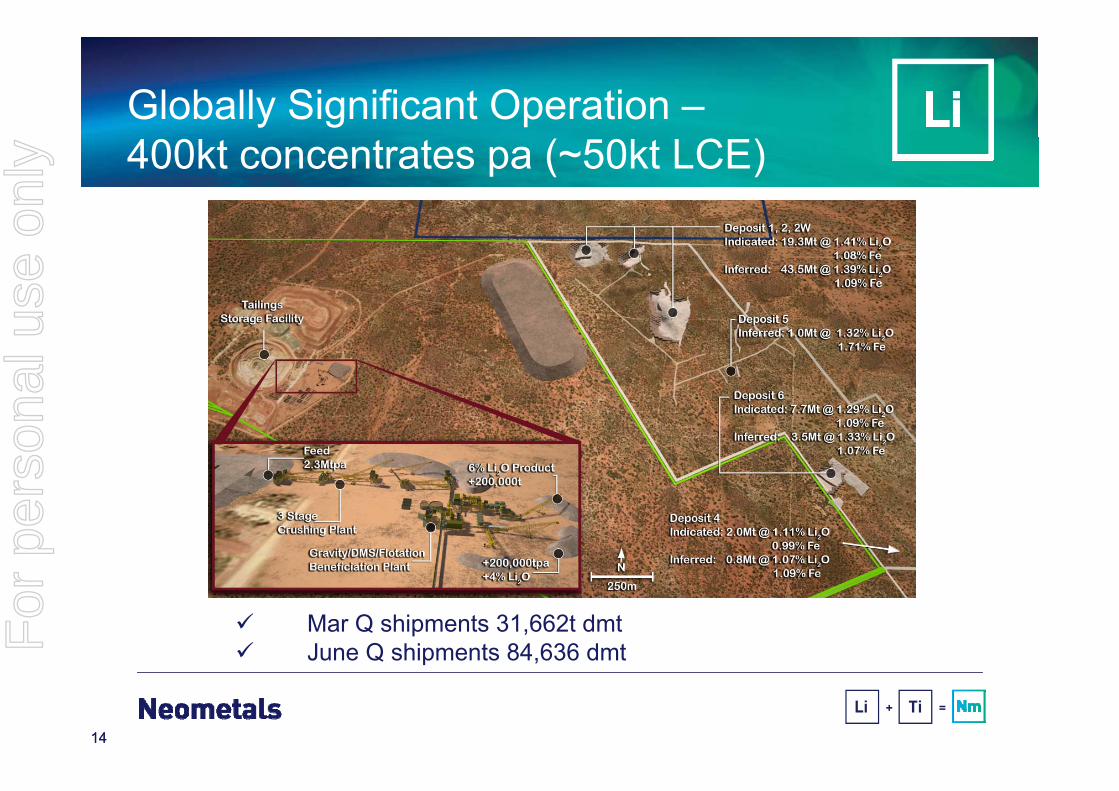
Globally Significant Operation –400kt concentrates pa (~50kt LCE)
Mar Q shipments 31,662t dmt June Q shipments 84,636 dmtF
or p
erso
nal u
se o
nly

15
+ =
15
Strong Operating Partner
Australia’s largest contract minerals processor Operate mine-to-port on BOO basis No upfront capital cost to NMT Minimum production levels (~50ktpa LCE) Fixed rate mining and processing costs
For
per
sona
l use
onl
y
16
+ =
16
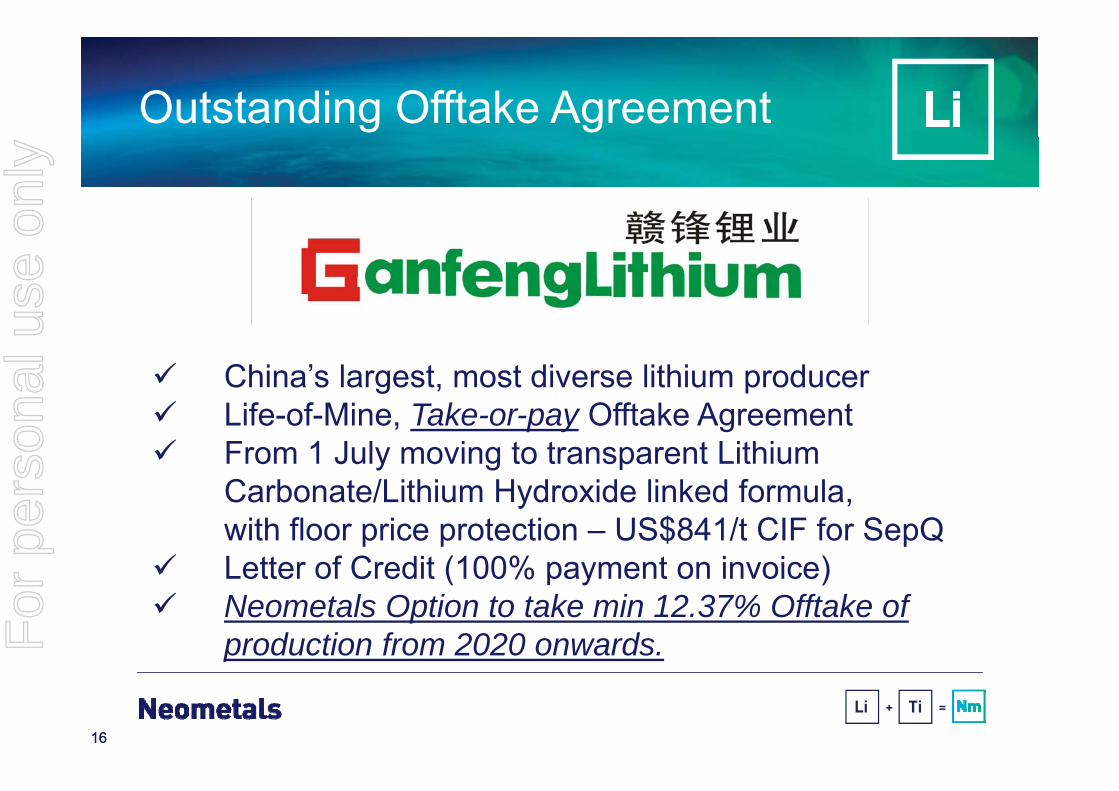
Outstanding Offtake Agreement
China’s largest, most diverse lithium producer Life-of-Mine, Take-or-pay Offtake Agreement From 1 July moving to transparent Lithium
Carbonate/Lithium Hydroxide linked formula, with floor price protection – US$841/t CIF for SepQ
Letter of Credit (100% payment on invoice) Neometals Option to take min 12.37% Offtake of
production from 2020 onwards.For
per
sona
l use
onl
y

Downstream processingWA-based LiOH Project
Neometals 100%Offtake Option for ~50kt spodumene concentratesF
or p
erso
nal u
se o
nly

Secure LiOH supply for the West
Lithium users want LiOH/Li2CO3 from spodumene converted outside China
For
per
sona
l use
onl
y

19
+ =
19
Commission**
Q1 2021
FEED Study*& Final Investment Decision**
Q3 2018
Lump-sumEquipment Price & Opex Data
Q4 2017
VendorTest work on Mt MarionConcentrates
Q3 2017
Finalise Location/Offtake/Operating Partner
Commercialisation Plan
(*) Subject to NMT Board Approval (**) Subject to FID
• Local plant in WA to minimise transport, 7t spodumene concentrate needed for 1t of Lithium Hydroxide
• Utilise local spodumene (Share of Mt Marion and Third Party), natural gas, sulfuric acid and workforce
• Use Sulfate/Caustic Flowsheet from leading Lithium equipment supplier
• Remove technology risk – speed to market
For
per
sona
l use
onl
y

20
+ =
20
Potential Site Evaluation
• Hatch benchmarking Capex/Opex for 3 locations: Kalgoorlie, Kwinana and Port Hedland
• NMT has 70% beneficial interest in PLA45/3003 which covers the Pilgangoora Tin-Tantalum Plant and Workshop, and historic tailings
• Adjacent tenure contains Pilbara Minerals and Altura Mining’s Proposed Mine/Concentrators.
For
per
sona
l use
onl
y

+ =
Research & DevelopmentLithium Titanate (LTO)
For
per
sona
l use
onl
y

22
+ =
22
Superior Anode Material for EV
• Lithium-Titanate (LTO) has surface area of +100m2/g vs 3m2/g for Carbon = superfast charging = minutes not hours
• The Lithium-titanate nanocrystals are superstrong/stable/safe with effective lives of +40 years of daily cycling
For
per
sona
l use
onl
y

23
+ =
23
• We think Lithium-Titanate (LTO) will become the anode of choice for EV and conventional stop-start engines. Apparently so to do Porsche and Johnson Controls/Toshiba.
Superior Anode Material for EV
For
per
sona
l use
onl
y

24
+ =
24
Research & Development Plan
Cycle testingin largerformat (18650)Li-ion battery*
Q4 2017
ProduceLTO usingBarrambie/Mt Marionproduct*
Q3 2017
Cycle testingin coin-cellLi-ion batteryin USA
Q2 2017
ProducedLTO atCSIRO
Q2 2017
(*) Subject to Board Approval
For
per
sona
l use
onl
y

+ =
Intellectual PropertyPortfolio
For
per
sona
l use
onl
y

26
+ =
26
• 84% of the value of Top 500 US companies is intangible assets such as patents and trademarks.
• Less than 1% of US patents are commercially viable• R&D Projects must address a real market opportunity, create a
sustainable competitive advantage and have strong business case• Conduct Engineering Cost Studies asap to not waste time/money
Our Approach
For
per
sona
l use
onl
y

+ =
Downstream processingDirect Extraction from Brine
100% Neometals
For
per
sona
l use
onl
y

28
+ =
28
Selective LiCl Extraction from Brine
For
per
sona
l use
onl
y

29
+ =
29
Direct Extraction via Adsorption
• Pat pending Titanate adsorbent
• Quick load/strip cycle – 30mins
• Complete rejection of sodium
• High recovery of Lithium 53-79%
• Returns water to salar, no evaporation
• Next Step -Proof of ScaleF
or p
erso
nal u
se o
nly

+ =
Downstream processingELi Process™
Neometals 70%Mineral Resources Ltd 30%F
or p
erso
nal u
se o
nly

31
+ =
31
Conversion of LiCl > LiOH is a potentialgamechanger for brine producers
Business model is to licence to existing brine producers in return for royalty stream:• De-risks ELi for
own use later• Quicker
cashflow• Higher P/E
multiple
For
per
sona
l use
onl
y

32
+ =
32
Competitive advantage from Patented Technology for production of LiOH
For
per
sona
l use
onl
y

33
+ =
33
ELi potentially levels playing field forwestern hard rock developers
Business model is to deploy/co-invest in partnership with and/or licence to integrated hard-rock developers in return for equity/royalty stream.
For
per
sona
l use
onl
y

+ =
Downstream processingLithium Battery Recycling
Neometals 50% of IPExclusive licence to commercialise
CoF
or p
erso
nal u
se o
nly

35
+ =
35
Lithium Battery Recycling Strategy
Exploiting cost advantage in recovery of Cobalt from Lithium Cobalt Batteries in Consumer Electronics to develop a low-risk, long-life, high-margin
operation with strong partners.
Co
Estimated< 5%
Recyled
For
per
sona
l use
onl
y

36
+ =
36
Closing the loop:Recycle and re-use CoF
or p
erso
nal u
se o
nly

37
+ =
37
Initial test work and Scoping Studyon Consumer Electric Batteries - LCO
CoF
or p
erso
nal u
se o
nly

38
+ =
38
Scoping Study Results
(± 30% accuracy)
Operating Costs US$4.45/lb Co (US$10k/t)
Spot price US$25/lb Co (US$55k/t)
Capex US$4.5M
Proceeding to pilot plant – Q3 ‘17
Can be constructed and commissioned in 42 weeks
CoF
or p
erso
nal u
se o
nly

39
+ =
39
Constructing Pilot Plant to process Typical EV Battery Cells - NMC
CoF
or p
erso
nal u
se o
nly

40
+ =
40
Project Development Phasing Co
Running Partner/Site Selection Processes in parallel with test work and engineering programs
For
per
sona
l use
onl
y

41
+ =
41
Commercial Plant Schematic
Feed preparation and
digestion
Incoming Materials
Finished Product
Residue Disposal
Reagent Storage
Purification and Crystallisation
Plant footprint approx. 30m x 50m
CoF
or p
erso
nal u
se o
nly

42
+ =
42
Commercialisation Plan Co
Running Partner/Site Selection Processes in parallel with test work and engineering programsFor
per
sona
l use
onl
y

+ =
Technology LicensingNeomet Process
Neometals - 25% of sub-licencing royalties
For
per
sona
l use
onl
y

44
+ =
44
Patented Neomet Process
Commodity agnostic – developed in Canada for Ni-laterites, used commercially for treating refractory copper-gold concentrates,
adapted for titanium concentrates.
For
per
sona
l use
onl
y

45
+ =
45
Commercialising technology with leading industry partners
For
per
sona
l use
onl
y

46
+ =
46
Project Development Phasing
Neometals Testing Facility in Montreal
Laboratory scale set up (above) Pilot scale up (below)
For
per
sona
l use
onl
y

47
+ =
Barrambie Titanium Project
100% Neometals
For
per
sona
l use
onl
y

48
+ =
48
Strong demand/supply fundamentals
The titanium pigment industry is 10x as large as the lithium compound
industry.
Growth = GDP
Globally declining grades and quality
Cost push price inflation
For
per
sona
l use
onl
y

49
+ =
49
Globally Significant Ti Resource
For
per
sona
l use
onl
y

50
+ =
50
Globally Significant Ti Resource
21
347Mt @ 22% TiO2Barrambie*
+150Mt @34% TiO2
Lac Tio18%Tellnes
Sources: Company Reports
* Mineral Resource Estimate (JORC2012) on page 29
For
per
sona
l use
onl
y

51
+ =
51
Dual Track Evaluations
Barrambie
China - TollConcentrator
Geraldton
Ti Pigment
Direct Ship Concentrate
Barrambie
China - TollConcentrator
Geraldton
China -Neomet
Ti Pigment
For
per
sona
l use
onl
y

52
+ =
52
Evaluating potential for Direct Shipping Ore and Toll-concentration in China
For
per
sona
l use
onl
y

53
+ =
53
Neomet Process: 3 Product Efficiency
Strong EPC &
OEM Alliance
For
per
sona
l use
onl
y

54
+ =
54
Neomet Process: Patented, low-costF
or p
erso
nal u
se o
nly

Why Titanium Hydroxide?F
or p
erso
nal u
se o
nly
56
+ =
56
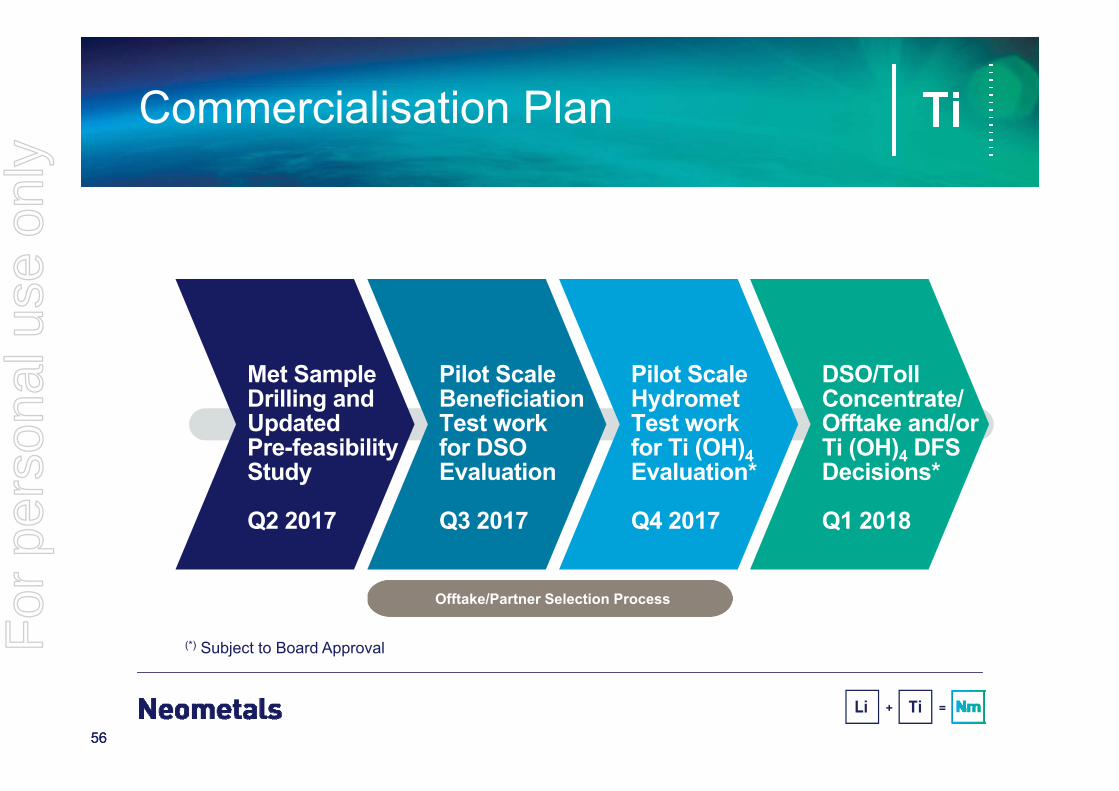
Commercialisation Plan
DSO/TollConcentrate/Offtake and/orTi (OH)4 DFSDecisions*
Q1 2018
Pilot ScaleHydrometTest work for Ti (OH)4Evaluation*
Q4 2017
Pilot ScaleBeneficiationTest work for DSO Evaluation
Q3 2017
Met SampleDrilling andUpdatedPre-feasibilityStudy
Q2 2017
Offtake/Partner Selection Process
(*) Subject to Board ApprovalFor
per
sona
l use
onl
y

57
+ =
Corporate
57F
or p
erso
nal u
se o
nly

58
+ =
58
Human & Financial Resources
DIRECTORS/MANAGEMENTSteven Cole Non‐Executive Chairman
Chris Reed Managing Director & CEO
David Reed Non‐Executive Director
Natalia Streltsova Non‐Executive Director
Doug Ritchie Non‐Executive Director
Michael Tamlin COO
Jason Carone CFO & Company Sec.
MAJOR SHAREHOLDERS
David Reed 10.9%
Kilkenny Limited 4.3%
Top 20 (7‐8‐2017) 37.1%
18 MONTH SHARE PRICEASX CODE: NMT OTC:RDRUYLast close (7‐8‐2017) A$ 0.29
Shares on issue M 544
Market capitalisation A$M 157
Net Cash (at 30‐6‐2017) A$M 46.1
Receivables/Investments A$M 16.50
10
20
30
40
50
60
Jan-16 Apr-16 Jul-16 Oct-16 Jan-17 Apr-17
For
per
sona
l use
onl
y

59
+ =
59
Operating structure
Neometals Ltd(ASX:NMT)
ReedIndustrialMineralsPty Ltd
Mount MarionLithium Project
13.8%
ReedAdvancedMaterialsPty Ltd
Lithium Hydroxide IP
(ELi Process)
Ganfeng Lithium Co.,
Ltd
MineralResources Ltd
70%
NeometProcess
IP
43.1%
43.1% Alphamet Management
Pty Ltd
100%
Urban Mining Pty Ltd
LithiumBattery
RecyclingIP
100%
25%Profitshare
Licence
Barrambie TitaniumProject
Australian TitaniumPty Ltd
LITHIUM TITANIUM
100%
100% 50%100%
For
per
sona
l use
onl
y

60
+ =
60
Internal restructure
For
per
sona
l use
onl
y

61
+ =
Investment Proposition
61F
or p
erso
nal u
se o
nly

62
+ =
62
Lithium: Cash, cashflow & growth options
0102
03
~A$56.1M Cash plus ~A$16.5M in receivables and investments
Cashflows from 13.8% Mt Marion
Downstream process to LiOH. Licence ELi to brine rock producers.Li-Ion Battery Recycling Project
+ +
For
per
sona
l use
onl
y

63
+ =
63
Titanium : A growth story for 2018
01 0203
Demonstrated Technical Feasibility
Demonstrated Economic Viability
Demonstrate DSO/concentrate & Ti(OH)4 Quality.
Obtain Strong Partnersto Commercialise
+ +
For
per
sona
l use
onl
y

64
+ =
64
Technology : developing a diversified portfolio
01 0203
Obtained Strong Partners for Neomet Process
Commenced third party testing -Neomet Process
Obtain Strong Partners to CommercialiseELi/LiB Recycling/LTO Anode Material
+ +
For
per
sona
l use
onl
y

65
+ =
Thank youwww.neometals.com.au
For
per
sona
l use
onl
y

66
+ =
66
Mineral Resource EstimateMt Marion Lithium deposit, as at October 2016, for a block cut‐off grade of 0.5% Li2O
NOTE: Figures may not sum due to rounding. Significant figures do not imply an added level of precision.
Classification Deposit Tonnes (Mt) Li2O % Fe %Indicated Area 1,2,2W 19.3 1.41 1.08
Area 4 2.0 1.11 0.99
Area 6 7.7 1.29 1.04
Indicated Total 28.9 1.35 1.06
Inferred Area 1,2,2W 43.5 1.39 1.09
Area 4 0.8 1.07 1.09
Area 5 1.0 1.32 1.71
Area 6 3.5 1.33 1.07
Inferred Total 48.9 1.38 1.10
Grand Total 77.8 1.37 1.09
For
per
sona
l use
onl
y

67
+ =
67
Feasibility Study - Financial Metrics
Life of Plant (LOP) 20 yearsPre-production Capital cost US$ 158 million**
Average Annual Pre-tax Net Cashflow US$ 82 million
Pre-tax Internal Rate of Return 51%
Pre-tax NPV (12% real discount rate) US$ 481 million
Payback of capital costs 2.6 years
Average Annual Production 14,000t LiOH5,600t Li2CO3
Average Cost per tonne of LiOH US$ 4,630/t
Average Cost per tonne of Li2CO3 US$ 5,345/t
[1
** Capital costs valid at June 2016. Estimated to accuracy of ±15%, Including EPCM and ContingencyAssumptions: 2016 Spodumene feedstock US$440/t CIF (6% Li2O); LiOH/Li2CO3 selling price US$11k/10k/t CIF respectively
FS
For
per
sona
l use
onl
y
68
+ =
68
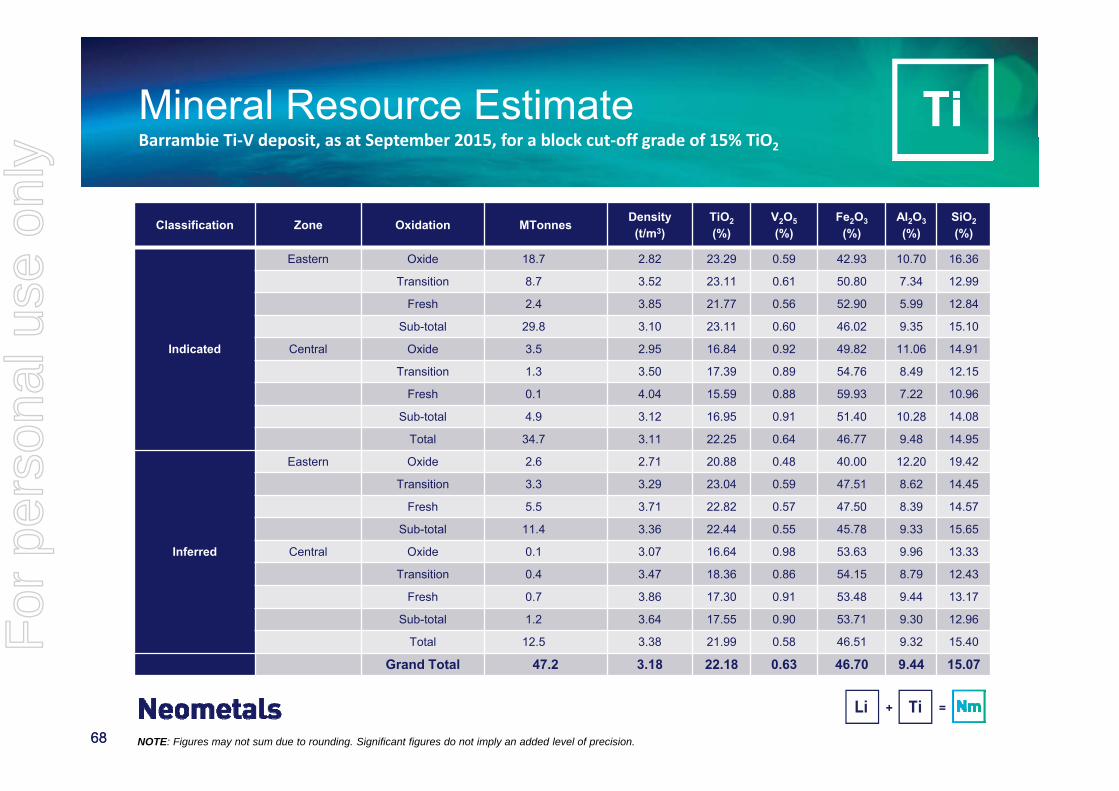
Mineral Resource EstimateBarrambie Ti‐V deposit, as at September 2015, for a block cut‐off grade of 15% TiO2
NOTE: Figures may not sum due to rounding. Significant figures do not imply an added level of precision.
Classification Zone Oxidation MTonnes Density(t/m3)
TiO2(%)
V2O5(%)
Fe2O3(%)
Al2O3(%)
SiO2(%)
Indicated
Eastern Oxide 18.7 2.82 23.29 0.59 42.93 10.70 16.36
Transition 8.7 3.52 23.11 0.61 50.80 7.34 12.99
Fresh 2.4 3.85 21.77 0.56 52.90 5.99 12.84
Sub-total 29.8 3.10 23.11 0.60 46.02 9.35 15.10
Central Oxide 3.5 2.95 16.84 0.92 49.82 11.06 14.91
Transition 1.3 3.50 17.39 0.89 54.76 8.49 12.15
Fresh 0.1 4.04 15.59 0.88 59.93 7.22 10.96
Sub-total 4.9 3.12 16.95 0.91 51.40 10.28 14.08
Total 34.7 3.11 22.25 0.64 46.77 9.48 14.95
Inferred
Eastern Oxide 2.6 2.71 20.88 0.48 40.00 12.20 19.42
Transition 3.3 3.29 23.04 0.59 47.51 8.62 14.45
Fresh 5.5 3.71 22.82 0.57 47.50 8.39 14.57
Sub-total 11.4 3.36 22.44 0.55 45.78 9.33 15.65
Central Oxide 0.1 3.07 16.64 0.98 53.63 9.96 13.33
Transition 0.4 3.47 18.36 0.86 54.15 8.79 12.43
Fresh 0.7 3.86 17.30 0.91 53.48 9.44 13.17
Sub-total 1.2 3.64 17.55 0.90 53.71 9.30 12.96
Total 12.5 3.38 21.99 0.58 46.51 9.32 15.40
Grand Total 47.2 3.18 22.18 0.63 46.70 9.44 15.07
For
per
sona
l use
onl
y

69
+ =
69
Pre-feasibility Study - Financial Metrics (*)
Life of Mine (LOM) 19.6 yearsPre-production Capital cost (excluding EPCM and Contingency)
A$ 549 million
Average Annual Pre-tax Net Cashflow A$ 123 millionPre-tax Internal Rate of Return 21% Pre-tax NPV (12% real discount rate) A$ 355 millionPayback of capital costs 3.9 years
Average Annual Production 98,000t TiO22,000t V2O5
234,000t Fe2O3
Cash Operating Cost per tonne of paid TiO2 net of co-product credit US$ 572/t
[1
(*) Estimated to accuracy of ±25% Assumptions: US$1,838/t TiO2; US$14,873/t V2O5, US$520/t Fe2O3 Pigment, A$/US$0.75, Royalties (State/Technology) 10% GrossFor
per
sona
l use
onl
y