Embed Size (px)
Citation preview

Prospa Group Limited ACN 625 648 722
Annual Report2019
For
per
sona
l use
onl
y

For
per
sona
l use
onl
y

For
per
sona
l use
onl
y

Small businesses are the backbone of the economy
2.3 m
44%
35%
small businesses in Australia1
of jobs2
of GDP2
>$20b<2% penetratedFY19 $479m
1. ABS 8165 (Counts of Australian Businesses including Entries and Exits) June 2018 (released in February 2019). 2. Parliament of Australia, Department of Parliamentary Services, Research Paper Series, 2017-18.
Australian small businesses operate across a wide range of industries and are concentrated in New South Wales, Victoria and Queensland and throughout Australia roughly in line with population.
4 Prospa Annual Report 2019
For
per
sona
l use
onl
y

Small businesses are the backbone of the economy
2.3 m 530,000
29%
28%
small businesses in New Zealand3
of jobs3
of GDP3
>$4b4
<1% penetratedFY19 $24m4
3. Small Business in New Zealand, Ministry of Business, Innovation & Employment, June 2017. 4. New Zealand Dollars.
NZ
Prospa Annual Report 2019 5
For
per
sona
l use
onl
y

Small businesses need a fast convenient way to access finance because they’re time poor.5
work 50 hours a week or more
work 7 days a week
26% 24%
They need access to finance to grow and prosper
6 Prospa Annual Report 2019
For
per
sona
l use
onl
y

Small businesses seek finance for a number of business activities6
Maintaining short-term cash flow or liquidity
Replacing, upgrading or purchasing additional equipment or machinery
Introducing new or improved goods, services or processes
Pursuing expansion opportunities
Keeping the business operating
5. YouGov survey for Prospa of small business owners who work full time in their business, November 2018. YouGov is an independent, publicly listed global consumer insight company.
6. Small businesses defined as having less than 20 employees, including non-employing businesses; ABS 8167 (Selected Characteristics of Australian Business), June 2016 - 2017 (released in August 2018).
Prospa Annual Report 2019 7
For
per
sona
l use
onl
y

The challenge of accessing finance
Small businesses in Australia can find it difficult to access business loans from traditional lenders due to a number of factors. Prospa’s solutions are addressing a significant and growing market opportunity which has been under-served by incumbents.
8 Prospa Annual Report 2019
For
per
sona
l use
onl
y

The traditional bank model
Banks
?
Retail products (cards & mortgages)
Small business
Structural challenges (regulatory capital)
Higher information requirements
Products not well suited to small business
Risk appetite and ROI
Why not?
Corporate (larger loans)
Prospa Annual Report 2019 9
For
per
sona
l use
onl
y

Prospa is a significant economic enabler. Every of Prospa lending
results in
to date
Full time jobs annually7
$4.8b$1.2b
FTE annual employment
in Australian GDP
67,000
$1m
$4m 57
7. The Economic Impact of Prospa Lending to Small Business, RFi Group and The Centre for International Economics, January 2019. Represents the estimated nominal GDP increase and the estimated total FTE impact of Prospa lending over the period 1 January 2013 to 31 March 2019, calculated using Prospa lending over the period 1 January 2013 to 31 December 2018.
We’re helping small business owners prosper and grow the economy
10 Prospa Annual Report 2019
For
per
sona
l use
onl
y

The economic impact of Prospa lending
Economic Growth
Goods and Services Market
Small Business
Households
Increased output
Increased salaries
Funds used to purchase
production uplift
Increased consumption
Increased salaries
Prospa Annual Report 2019 11
For
per
sona
l use
onl
y

With a cohesive customer-focused platform
GrowSmall Business Loan
$5,000 to $300,000
A one-off lump sum to take advantage of opportunities
Mobile app for increased customer engagement and retention
We build cash flow products and services that allow small businesses to GROW and RUN their business and help them PAY for goods and services.
12 Prospa Annual Report 2019
For
per
sona
l use
onl
y

Run PayLine of Credit ProspaPay
$2,000 to $25,000
Complementary to small business loan
Leverages existing credit infrastructure, technology and distribution
Automated customer interactions and increased data
$500 to $20,000
B2B trade payments
Provides interest free “buy now pay later” solution for vendors
Vendors can increase basket size
Low cost customer acquisition
Network effect
Prospa Annual Report 2019 13
For
per
sona
l use
onl
y

"I used the money to create cash flow, buy new stock, and generate income that way. It has actually allowed me to keep trading and basically, just to be here."
Brigid Victoria, Australia
For
per
sona
l use
onl
y

Contents
Performance Highlights 16Chairman’s Letter 18Joint Chief Executives’ Report 22Board of Directors 26Executive Leadership 30Directors’ Report 32Review of Operations 39Remuneration Report 48Corporate Governance 65Auditor’s Independence Declaration 70Financial Statements 72Directors’ Declaration 118Auditor’s Report 119Shareholders’ Information 126Corporate Information 130
Prospa Annual Report 2019 15
For
per
sona
l use
onl
y

$1.2 billion
77+ NPS
~50%
2.8x
market share
Performance Highlights
Originations since inception
World class net promoter score
Customer lifetime value
Online small business lending
16 Prospa Performance Highlights
For
per
sona
l use
onl
y
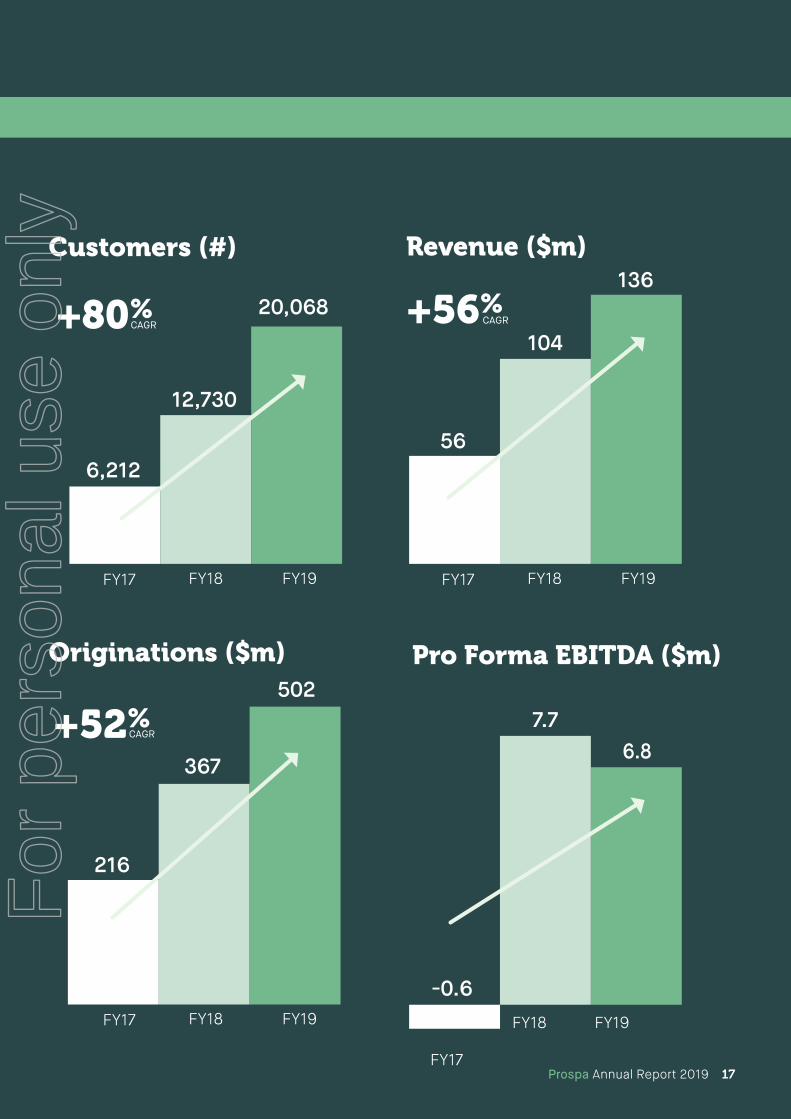
Customers (#)
FY18 FY18
FY18
FY19 FY19
FY19
FY17 FY17
FY17
6,212
12,730
+80%
+52%
+56%20,068
56
104
136
-0.6
6.87.7
Revenue ($m)
Pro Forma EBITDA ($m)
FY18 FY19FY17
216
367
502
Originations ($m)
CAGR CAGR
CAGR
Prospa Annual Report 2019 17
For
per
sona
l use
onl
y

Chairman’s Letter
“From the outset, we recognised people would power our success and we have invested in building a diverse and inclusive team and a culture focused firmly on our core values.”Gail Pemberton AO
18 Prospa Annual Report 2019
For
per
sona
l use
onl
y

Prospa Annual Report 2019 19Prospa Annual Report 2019 19
For
per
sona
l use
onl
y

Dear shareholder,
On behalf of the Directors of Prospa Group Limited (“Prospa” or the “Company”), I am pleased to present our annual report for the financial year ending 30 June 2019 (FY19). It has been a year of strong growth, with Prospa successfully launching into New Zealand, bringing two new products to market and listing on the Australian Securities Exchange (ASX) in June.
Prospa was founded in 2012 and has grown rapidly to become Australia’s #1 online small business lender, with nearly $1.2 billion in originations to date and over 20,000 customers across Australia and New Zealand.
Our vision is to help small businesses prosper and grow. To facilitate this, the Prospa team offers customers a range of fast, flexible cash flow solutions – with funding decisions often made within the same business day. To deliver these quick funding outcomes, our proprietary Credit Decision Engine assesses hundreds of data points and overlays management requirements such as credit quality distribution, compliance and profit margin. Prospa will continue to invest in driving improved decisioning and loan book performance as we scale.
Delivering financial resultsProspa listed on the Australian Securities Exchange on 11 June 2019 to raise funds to accelerate growth. On all key metrics, the Company has achieved or exceeded forecasts made in the Prospa prospectus dated 16 May 2019.
The FY19 year was characterised by continued momentum and strong demand, during which we originated loan volume of $501.7 million, up 36.6% on the prior year (FY18: $367.3 million) and 3.1% ahead of prospectus forecast. Revenue of $136.4 million was up 31.2% on the prior year (FY18: $104.0 million) and in line with prospectus forecast.
Prospa has now delivered approximately $1.2 billion in loans since inception and in FY19 total customer numbers in Australia and New Zealand grew to over 20,000, up 58% on the prior year.
Economies of scale, improvements in loan impairment expense and lower funding costs are flowing through to the bottom line and we delivered pro forma Earnings Before Interest, Tax, Depreciation and Amortisation (EBITDA) of $6.8 million, ahead of prospectus forecast by 11.5%.
Executing on strategy
These results are a testament to the hard work of the Prospa team and reflect the successful execution of our strategies: to increase our addressable market by improving the core small business loan product; pursuing growth in new geographies; and diversifying our product offering to help more small business owners grow and run their businesses and pay for the products and services they need.
During the financial year, the team successfully launched Prospa’s core small business loan product into the New Zealand market, with initial momentum exceeding expectations and over NZ$24 million in originations during the period. Also during the period, we launched a line of credit product and ProspaPay, a B2B trade payments solution. Prospa believes there is a $20 billion addressable market opportunity for small business lending in Australia and a NZ$4 billion addressable market opportunity in New Zealand. Prospa also believes the market opportunity for B2B trade payments is more than $100 billion.
Fostering culture and best practice governanceFrom the outset, we recognised people would power our success and we have invested in building a diverse and inclusive team and a culture focused firmly on our core values. The executive team has broad expertise spanning financial services, technology, sales and marketing, compliance and distribution and together they lead a passionate team of over 250 small business advocates. During the period, we were awarded AON Hewitt Employer of Choice for the second year running and our employee engagement scores are consistently high.
Prospa’s Board is comprised of six Directors including three independent non-executive Directors, one non-independent non-executive Director, and Prospa’s joint Chief Executive Officers. The Board has created a governance and compliance framework, including adopting relevant internal controls, risk management processes and corporate governance policies and practices that are designed to promote responsible management and conduct. Prospa’s Board Charter and Policies can be found on the investor section of the Prospa website (investors.prospa.com) and are unchanged since the Company listed.
Chairman's Letter
20 Prospa Chairman's Letter
For
per
sona
l use
onl
y

Continued commitment to putting customers firstProspa’s customer experience is recognised with a Net Promoter Score consistently above 77 and a rating of 9.8 out of 10 during the period on independent review site Trustpilot.
To ensure we continue to meet the expectations of our customers, regulators and shareholders, the Board has focused on regulatory risk and compliance management over the period.
On 1 January 2019, Prospa was pleased to announce that it was one of the first online lenders to be operating in compliance with the AFIA Online Small Business Lenders’ Code of Lending Practice. Prospa has been instrumental in developing the new Code and reaffirms its commitment to increased transparency so that small business owners can clearly assess whether a financial product is the best solution available to meet their needs and how much it is going to cost them.
Prospa has a demonstrated track record of industry leadership and innovation, having funded its first loan in 2012, implemented same day loan approval capability in 2013, implemented the first Australian small business loan securitisation in 2015, and the first rated warehouse facility for unsecured small business loans in Australia. We have also invested significantly in customer experience and customer success teams, who seek to offer specialised support to small businesses when it matters most.
Prospa is a significant economic enabler. Independent research commissioned by Prospa (and conducted by RFi Group and The Centre for International Economics) estimates every $1 million Prospa lends boosts Australia’s nominal Gross Domestic Product (GDP) by $4 million and creates 57 full time jobs.
The Prospa team is incredibly proud of the work they do and its direct impact on Australia’s small business economy. Since founding the business seven years ago, it is estimated our almost $1.2 billion in lending has generated a $4.8 billion positive impact on Australian GDP and created 67,000 jobs.
Motivated for the year aheadOn behalf of the Board, I congratulate each and every member of the Prospa team on delivering an impressive financial result in FY19. During my 18 months on the Board of Prospa, I have observed a highly motivated and purpose-led team firmly focused on the future.
Thank you to our customers, partners, investors and funders for your continued support, and for sharing our vision and values and enabling us to serve small businesses across Australia and New Zealand.
I would also like to thank my fellow Directors Fiona Trafford-Walker, Greg Ruddock, Avi Eyal, Greg Moshal and Beau Bertoli for their contribution and collaboration.
Most importantly, thank you to fellow Prospa shareholders who have recognised the strategic growth opportunities ahead for this company and invested to help us execute on our plans. We look forward to keeping you updated on our progress in the year ahead.
Sincerely,
Gail Pemberton AO Chairman Prospa Group Limited
Prospa Annual Report 2019 21
For
per
sona
l use
onl
y

22 Prospa Annual Report 2019
For
per
sona
l use
onl
y

Joint Chief Executives' Report
“This year has been characterised by strong customer and originations growth from all sources of our business, as we continue to see a structural shift towards online small business lending.”
Greg Moshal & Beau Bertoli
Prospa Annual Report 2019 23
For
per
sona
l use
onl
y

We started Prospa in 2012 because it was clear to us there had to be a better way. As small business owners, we’d experienced the frustration of missing opportunities because we couldn’t access finance. We found the traditional system slow, cumbersome and disheartening.
We wanted to solve this widespread problem for small business owners. By reimagining what it means to grow and run a small business – and pay for the goods and services to do it – we’ve been able to create a customer experience that is faster, friendlier and more accessible than traditional options.
FY19This year has been characterised by strong customer and originations growth from all sources of our business, as we continue to see a structural shift towards online small business lending:
– FY19 loan originations of $501.7 million, up 36.6% on the prior year (FY18: $367.3 million), 3.1% ahead of prospectus forecast;
– FY19 revenue of $136.4 million, up 31.2% on the prior year (FY18: $104.0 million), in line with prospectus forecast, driven by strong loan originations in Australia and New Zealand;
– FY19 pro forma EBITDA of $6.8 million, 11.5% ahead of prospectus forecast as the company continues to experience improvements in its loan impairment expense, lower funding costs, while at the same time investing in growth in New Zealand and new products; and
– Prospa has now delivered approximately $1.2 billion in loans since inception and total customer numbers in Australia and New Zealand grew to over 20,000 in FY19, up 58% on the prior year.
This success has been driven by our vision to help small businesses prosper and grow. We currently have three products that are designed specifically to help small businesses GROW their businesses for the long term, RUN their day-to-day and PAY for the products and services they need.
We can help small businesses GROW with a fixed-term loan that facilitates investment and business-building. Our small business loans range from $5,000 to $300,000 in value. We’ve made a number of enhancements to our core product – the small business loan – to appeal to a broader range of customers. This includes increasing the maximum loan amount from $250,000 to $300,000 and providing longer terms of up to 24 months for certain customers. As a result, our average loan amount has increased by 9% and our average term is now 14 months, delivering more revenue per loan.
We can help small business owners RUN their business with a revolving line of credit so they can manage their cash flow day-to-day. This is a convenient and flexible facility of between $2,000 to $25,000, with interest paid only on what customers use, while they use it. Our line of credit product leverages our existing credit infrastructure and we’ve found it to be very complementary to the small business loan.
And now we can also help small businesses PAY for products and services using a B2B trade payments solution. ProspaPay enables approved customers to purchase goods and services from approved ProspaPay vendors up to $20,000, with repayment terms of between three and nine months, on an interest-free basis.
Finally, we’ve made great progress expanding into new geographies by entering the New Zealand market. We estimate the potential opportunity in New Zealand to be more than NZ$4 billion. At the end of the period we had exceeded our expectations, writing over NZ$24 million of loans for more than 700 customers.
We also have a market leading funding platform. During FY19 we added a further three funding warehouses, taking our total number of funding warehouses to five. During the period we added two major banks to our funding structures to support the ongoing future growth of the portfolio, enabling us to pass on lower rates to our customers.
This represents a significant step forward for our business, and for the small business lending category in general. Following the year end, we closed our first funding warehouse in New Zealand after less than 12 months of operation. This NZ$45 million facility will fund our New Zealand portfolio and ensure we can continue our acceleration into the New Zealand market.
We’ve also passed on the benefit of lower funding costs to our customers, with our simple annual interest rates now ranging from 9.9% to 26.5% and a weighted average APR for the portfolio of 36.9% down from 40.7% in FY18.
Joint Chief Executives' Report
24 Prospa Joint Chief Executives' Report
For
per
sona
l use
onl
y

Operational achievementsOur team is highly engaged. In 2019 Prospa was awarded AON Hewitt Employer of Choice for the second year in a row. Our distribution partners recognise we are best in class, with Prospa achieving a clean sweep of the Mortgage and Finance Association of Australia State Excellence Awards for Best Fintech Lender 2019, and winning the national excellence award as Best Fintech Lender for the second year running, receiving the accolade across all states and territories in Australia.
We continued to invest in our executive leadership team, appointing Shai Haim as Chief Technology Officer, Simon Griffin as Chief Commercial Officer, Elise Ward as Executive General Manager, People and Culture and Matt Bauld as Executive General Manager, Growth Channels.
OutlookDuring the reporting period we met – or exceeded – our core operating metrics from our 2019 prospectus.
In the year ahead, we’re focused on:
– Accelerating innovation in our core product; – Increasing our addressable market through product diversification; and – Geographic expansion.
We’re proud of our achievements so far, but we believe this is just the beginning. The financial services industry is changing rapidly, and our role in supporting small business is now even more vital.
As a public company, our guiding principles won’t change. We’ll continue to strive to exceed our customers’ expectations and deliver for all stakeholders. We aim to build a company that creates value over decades, not just years.
Greg Moshal & Beau Bertoli Founders & Joint Chief Executive Officers
Prospa Annual Report 2019 25
For
per
sona
l use
onl
y

For
per
sona
l use
onl
y

Board of Directors
For
per
sona
l use
onl
y

Gail has been a Director of Prospa Advance Pty Ltd since February 2018 and a Director of the Company since May 2018. Gail has been Chairman of Prospa since February 2019. Gail has more than 35 years’ experience in banking and wealth management and is a specialist in technology and operations. Prior to taking up a Non-Executive Director career, Gail was COO, UK at BNP Paribas and CEO and Managing Director, BNP Paribas, Australia and New Zealand. She was previously Group Chief Information Officer and Financial Services Group COO at Macquarie Bank.Gail is currently a Non-Executive Director of Eclipx Group and Sydney Metro. Gail has previously served on the Boards of ARQ Group (ASX:ARQ), OneVue (ASX:OVH), SIRCA and RoZetta Technology and Onthehouse (ASX:OTH) as independent Chair, and as a Non-Executive Director on PayPal Australia, QIC, UXC (ASX:UXC), Baycorp, Alleron Funds Management, Air Services Australia, the Sydney Opera House Trust and Harvey World Travel (ASX:HWT).Gail has an MA from UTS, and a Graduate Certificate in Finance from Griffith University. She is also a Fellow of the Australian Institute of Company Directors.In January 2018 Gail was awarded an Order of Australia for distinguished service to the finance and banking industry, to business through a range of roles, as an advocate for technology and as a mentor to women.Gail is a member of the Audit and Risk Committee and a member of the Remuneration, People and Nomination Committee.
Greg has been a Director of Prospa Advance Pty Ltd since October 2015 and a Director of the Company since April 2018.Greg has more than 30 years’ experience in private equity and operations management and specialises in investment strategy, business development and mergers & acquisitions.Greg is a founder and Joint Chief Executive Officer of Ironbridge where he co-leads Investment and Portfolio Management activities. Since 2003 Greg has led many of its successful financial services investments including Prospa, Judo Capital, Eclipx Group and Stardex Insurance. Greg also led and served on the Boards of Easternwell, Super A-mart, BBQs Galore, Tandem Group, and AOS.Prior to this role, Greg spent 7 years with leading Australian industrial group Wesfarmers in mergers and acquisitions and 5 years with Gresham Partners and Gresham Private Equity where he led the development of financial services payments provider Cashcard Australia. Greg also spent 5 years with diversified listed company Avatar Limited, where he was Finance Director and Managing Director of one of its major subsidiaries. Greg is currently a Director of Ironbridge Capital Holdings Pty Ltd, Judo Capital Limited, Workclub Australia Pty Ltd and AOS Pty Ltd. Greg is a qualified accountant and holds a Bachelor of Commerce degree from the University of Western Australia and post graduate qualifications from the Financial Services Institute of Australasia and the Australian Society of Accountants. Greg is the Chairman of the Remuneration, People and Nomination Committee and a member of the Audit and Risk Committee.
Fiona has been a Director of Prospa Advance Pty Ltd since March 2018 and a Director of the Company since May 2018. Fiona has more than 25 years’ experience advising institutional asset owners and investors on investment and governance-related issues.Since September 2015, Fiona has served as an Independent Non-Executive Director of Link Administration Holdings (ASX:LNK) where she is also Chair of the Risk and Audit Committee. She is currently an Independent Non-Executive Director of the Victorian Funds Management Corporation (VFMC) and a member of the Investment Committee for the Walter and Eliza Hall Institute. Fiona is also an Investment Director at Frontier Advisors, where she is a member of the firm’s Investment Committee and Governance Advisory team. She was the inaugural Managing Director at Frontier Advisors and played a critical role in growing the firm. Fiona holds a B.Ec (Hons) from James Cook University and a Master of Finance from RMIT University. She is also a graduate of the Australian Institute of Company Directors.In 2013, Fiona was awarded inaugural Woman of the Year in the Money Management/Super Review of Women in Financial Services Awards and was ranked one of the top 10 global Asset Consultants from 2013 to 2016. In 2016, Fiona was announced as a winner in The Australian Financial Review and Westpac 100 Women of Influence Awards in the Board/Management category.Fiona is the Chairman of the Audit and Risk Committee and a member of the Remuneration, People and Nomination Committee.
Gail Pemberton, AOIndependent Non-Executive Chairman
Greg RuddockIndependent Non-Executive Director
Fiona Trafford-WalkerIndependent Non-Executive Director
Board of Directors
28 Prospa Board of Directors
For
per
sona
l use
onl
y

Avi has been a Director of Prospa Advance Pty Ltd since its incorporation in 2012 and has been instrumental to the development of Prospa. Avi has been a Director of the Company since May 2018.Avi has more than 22 years’ experience in founding, scaling and running global technology and finance companies.Avi is the co-founder and Managing Partner of Entrée Capital which led Prospa’s seed and series A funding and has participated or led in each funding round. Avi brings extensive finance and technology, governance, risk and compliance (GRC) knowledge to Prospa. In 2004 he co-founded Cura Software Solutions which sold GRC software to Global 1000 companies and served as CEO until 2009 when it was sold to a global public technology company.Avi is a current Board Director of monday.com, BreezoMeter, Gastrofix, Adhawk, thumbzup and other technology companies in the UK, EU, USA and Israel. Avi has previously served as Board Director for Riskified, HouseParty, FlyPay (JustEat), Scan Inc. (Snapchat), Cura Software Solutions, CQS Technology Holdings, Real Technology Ventures and Datatec Limited / Insight Technologies.Avi has a BSc in Electronic and Computer Engineering from the University of Natal in South Africa. In 2010 Avi received the Johnnie Walker Entrepreneur of the Year Award and in 2018 was listed by Forbes Inc as one of the Top 25 European venture Capitalists (Midas List).Avi is a member of the Audit and Risk committee and a member of the Remuneration, People and Nomination Committee.
Greg is a Co-Founder of Prospa and has been an Executive Director of Prospa Advance Pty Ltd since 2011 and a Director of the Company since April 2018. Greg been instrumental to the establishment of Prospa. Greg has seven years’ experience in financial services and eight years’ experience in creating and scaling start-ups, with two previous successful exits.Prior to founding Prospa, Greg was involved in the start and scaling of a consumer service chain and an international consumer product franchise, and successfully exited both.Greg is passionate about product, design and technology and developing cash flow products and services that help small businesses to prosper.In 2017 Greg was jointly awarded Fintech Leader of the Year by Fintech Australia and was jointly awarded the NSW Pearcey Tech Entrepreneur of the Year Special Recognition award.Greg has a BCom in Accounting from Monash University.
Beau is a Co-Founder of Prospa and has been an Executive Director of Prospa Advance Pty Ltd since 2013 and a Director of the Company since April 2018. Beau has been instrumental to the establishment of Prospa.Beau has 15 years’ experience in financial services and has founded a technology start-up and managed a consumer product retailer.Beau is passionate about building and growing high performing teams and creating cash flow products and services that keep small business moving.In 2017 Beau was jointly awarded Fintech Leader of the Year by Fintech Australia and was jointly awarded the NSW Pearcey Tech Entrepreneur of the Year Special Recognition award.Prior to co-founding Prospa, Beau held senior positions including National Sales Manager at listed financial services company FlexiGroup.Beau has a BCom in Economics and Finance from Sydney University.
Greg MoshalJoint CEO & Executive Director
Beau BertoliJoint CEO & Executive Director
Avi EyalNon-Executive Director
Prospa Annual Report 2019 29
For
per
sona
l use
onl
y

Ed BigazziChief Financial Officer
Ed joined Prospa in July 2015. He has responsibility for financial control, risk, treasury, legal and compliance. Ed has four years’ experience in financial services and 11 years in investment banking and private equity with experience in financial analysis, M&A, complex financing structures and investment management.Prior to joining Prospa, Ed spent nine years at Ironbridge Capital and has served as Non-Executive Director for two portfolio companies.Ed has a BCom/LLB (Hons) in Finance, Economics and Law from Sydney University.
Damon PezaroChief Product Officer
Damon joined Prospa in June 2017. He has responsibility for all product development and management including design, data and analytics.Damon has more than 20 years’ experience in digital focused businesses working across online and technical environments, having held key product and operational roles in several successful start-ups and large corporates.Prior to joining Prospa, Damon was Chief Product Officer at ASX200-listed Domain Group, Head of Operations at OurDeal.com.au (acquired by Groupon), and Senior Manager – Product & Technology at News Digital Media (NewsCorp).
Ben LambChief Operating Officer
Ben joined Prospa in April 2016. He has responsibility for operations, procurement and vendor management, and Prospa’s New Zealand operations.Ben has 12 years’ experience in financial services including product development, customer experience, operations, procurement and establishing offshore operations.Prior to joining Prospa, Ben was Head of Product & Customer Solutions at ASX-listed financial services company Eclipx Group; and Head of Customer Experience and Operations at ASX-listed financial services company FlexiGroup.
Beau BertoliJoint CEO
Greg MoshalJoint CEO
Executive Leadership
30 Prospa Executive Leadership
For
per
sona
l use
onl
y

Simon GriffinChief Commercial Officer
Simon joined Prospa in July 2019. He is responsible for Sales and Business Development and leads strategy and planning across Prospa.Simon has more than 15 years’ experience in customer focused, high-growth businesses including more than ten years in the fintech sector.Prior to joining Prospa, Simon was the CEO of XE.com. Prior to that he was a member of the OFX Executive team and has held senior roles at Macquarie Bank, Vodafone and Gemini Consulting.Simon has a BA in Economics from the University of Nottingham.
Elise WardExecutive General Manager, People & Culture
Elise joined Prospa in December 2018. She has responsibility for the design and delivery of our people strategy.Elise has more than ten years’ experience in delivering progressive people and culture strategies across start-ups and multinational organisations.Prior to joining Prospa, Elise led the People & Culture team for Canadian-based technology company Elastic Path Software and has held senior HR roles at Samsung and Tabcorp.Elise has a Bachelor of HR Management from Macquarie University and a Graduate Certificate in Change Management from AGSM at UNSW.
Matt BauldExecutive General Manager, Growth Channels
Matt joined Prospa in October 2013. He has responsibility for national sales, distribution and channel management.Matt has 17 years’ experience in financial services in national sales and marketing management positions and extensive channel management experience in commercial and consumer finance.Prior to joining Prospa, Matt led Sales & Marketing at The Leasing Centre, was Head of National Channel Sales at ASX-listed financial services company FlexiGroup and was Head of Sales & Marketing at Hanover Consumer Finance (acquired by FlexiGroup).
Shai HaimChief Technology Officer
Shai joined Prospa in July 2019. He has responsibility for delivery of Prospa’s technology platform and cyber security.Shai has over 20 years’ experience in the technology sector.Prior to joining Prospa, Shai has scaled technology teams in Asia, Europe, America and Australia and has been based in Silicon Valley where he was VP of Engineering at Brigade, and also Engineering Manager at Twitter. Most recently, he was Chief Technology Officer at Campaign Monitor where he delivered major initiatives around technology, operations and M&A.Shai has a BCompSc from IDC Herzliya in Israel and a PhD in Computer Science (AI) from UNSW.
Prospa Annual Report 2019 31
For
per
sona
l use
onl
y

"We’re growing and we had this opportunity to move into this warehouse and the window was one week. So we had to decide really fast, ‘what do we do from here?’ So I came to Prospa, and we’re here. One week."
Anita Auckland, New Zealand
Directors’ Report
For
per
sona
l use
onl
y

Prospa Group Limited Annual Report 2019 33
— Directors’ ReportThe Directors present their report, together with the financial statements, on the consolidated entity (referred to hereafter as the ‘Group’) consisting of Prospa Group Limited (referred to hereafter as the ‘Company’ or ‘parent entity’) and the entities it controlled at the end of, or during, the year ended 30 June 2019.
DirectorsThe following persons were Directors of Prospa Group Limited during the whole of the financial year and up to the date of this report, unless otherwise stated. Also included are their interests in shares, options and rights:
Gail PembertonChairman 152,036 ordinary shares, 120,556 options and 23,148 rights in Prospa Group Limited
Gregory Moshal24,701,240 ordinary shares and 1,286,640 options in Prospa Group Limited
Beaumont Bertoli9,701,240 ordinary shares and 1,286,640 options in Prospa Group Limited
Aviad Eyal2,419,280 ordinary shares, 92,592 options and 13,228 rights in Prospa Group Limited
Gregory RuddockChairman of the Remuneration, People and Nomination Committee1,033,611 ordinary shares and 25,000 options in Prospa Group Limited
Fiona Trafford-WalkerChairman of the Audit and Risk Committee13,228 ordinary shares, 120,556 options and 14,550 rights in Prospa Group Limited
Principal activitiesDuring the financial year, the principal activities of the Group continued to be the provision of finance to small businesses. This activity has not changed during the year.
DividendsThere were no dividends paid, recommended or declared during the current or previous financial year.
Review of operationsThe loss for the Group after providing for income tax amounted to $24.7 million (30 June 2018: profit of $2.1 million).
The Review of Operations on pages 39 to 47 form part of this Directors’ Report and set out:
– A review of operations during the year and the results of those operations;
– The strategic highlights of the Group;
– Matters subsequent to the end of the financial year; and
– Comments on the financial position.
Information on likely developments in the operations of the Group and the expected results of operations have not been included in this report because the Directors believe it would be likely to result in unreasonable prejudice to the Group.
For
per
sona
l use
onl
y

34 Prospa Directors’ Report
Significant changes in the state of affairsThere were no significant changes in the state of affairs of the Group during the financial year.
Environmental regulationThe Group is not subject to any significant environmental regulation under Australian Commonwealth or State or Territory law.
Company secretaryMs Nicole Johnschwager was appointed to the position of Company Secretary and General Counsel of the Group in April 2018.
She is admitted to the Supreme Court of New South Wales and is a member of the Association of Corporate Counsel Australia and the Australian Institute of Company Directors.
Ms Johnschwager has over 20 years’ experience as a solicitor and company secretary.
Meetings of DirectorsThe number of meetings of the Company’s Board of Directors (‘the Board’) and of each Board committee held during the period ended 30 June 2019, and the number of meetings attended by each Director were:
Full Board
Remuneration, People and
Nomination CommitteeAudit and
Risk Committee
Attended Held Attended Held Attended Held
Gail Pemberton 2 2 1 1 – –
Fiona Trafford-Walker 2 2 1 1 – –
Greg Ruddock 2 2 1 1 – –
Avi Eyal 2 2 1 1 – –
Greg Moshal 2 2 1 1 – –
Beau Bertoli 2 2 1 1 – –
For
per
sona
l use
onl
y

Prospa Group Limited Annual Report 2019 35
Prior to the Group’s Initial Public Offering (IPO), the number of meetings held by Prospa Advance Pty Ltd and attended by Directors were:
Full Board
Remuneration, People and
Nomination CommitteeAudit and
Risk Committee
Attended Held Attended Held Attended Held
Gail Pemberton 10 10 2 2 5 5
Fiona Trafford-Walker 10 10 2 2 5 5
Greg Ruddock 10 10 1 2 5 5
Avi Eyal 9 10 2 2 5 5
Greg Moshal 9 10 2 2 5 5
Beau Bertoli 9 10 2 2 5 5
Held: represents the number of meetings held during the time the Director held office or was a member of the relevant committee.
Audit and Risk Committee Remuneration, People and Nomination Committee
Fiona Trafford-Walker – Chairman Greg Ruddock – Chairman
Gail Pemberton Gail Pemberton
Greg Ruddock Avi Eyal
Avi Eyal Fiona Trafford-Walker
Shares under optionUnissued ordinary shares of Prospa Group Limited under option at the date of this report are as follows:
Grant date Expiry dateExercise
priceNumber
under option
16/02/2016 16/02/2021 $0.49 730,839
07/10/2016 07/10/2021 $0.67 175,545
27/02/2017 27/02/2021 $0.49 60,000
27/02/2017 27/02/2021 $0.67 299,241
28/04/2017 28/04/2022 $1.56 195,000
17/11/2017 17/11/2022 $1.56 1,351,253
11/01/2018 11/01/2023 $1.56 558,000
13/02/2018 13/02/2023 $1.56 150,000
30/03/2018 30/03/2023 $1.56 60,000
30/04/2018 30/04/2023 $2.00 1,131,250
30/11/2018 30/11/2023 $3.64 3,555,000
01/12/2018 01/12/2023 $3.64 92,592
25/01/2019 25/01/2024 $4.19 191,112
01/04/2019 01/04/2024 $3.64 370,500
For
per
sona
l use
onl
y

36 Prospa Directors’ Report
Grant date Expiry dateExercise
priceNumber
under option
10/04/2019 10/04/2024 $3.64 75,000
14/05/2019 14/05/2024 $3.33 1,086,246
14/05/2019 14/05/2024 $3.64 615,555
14/05/2019 14/05/2024 $3.78 1,487,034
14/06/2019 14/06/2024 $4.35 75,000
No person entitled to exercise the options had or has any right by virtue of the option to participate in any share issue of the company or of any other body corporate.
Shares under performance rights
Unissued ordinary shares of Prospa Group Limited under performance rights at the date of this report are as follows:
Grant date Expiry dateExercise
priceNumber
under rights
14/06/2019 N/a N/a 50,926
No person entitled to exercise the performance rights had or has any right by virtue of the performance right to participate in any share issue of the Company or of any other body corporate.
Shares issued on the exercise of options
The following ordinary shares of Prospa Group Limited were issued during the year ended 30 June 2019 and up to the date of this report on the exercise of options granted:
Date options grantedExercise
priceNumber of
shares issued
16/02/2016 $0.49 27,480
07/10/2016 $0.67 9,999
17/11/2017 $1.56 36,247
Shares issued on the exercise of performance rights
The following ordinary shares of Prospa Group Limited were issued during the year ended 30 June 2019 and up to the date of this report on the exercise of performance rights granted:
Date performance rights grantedExercise
priceNumber of
shares issued
11 June 2019 $3.78 330,000
Remuneration Report
The Remuneration Report set out on pages 48 to 64 forms part of this Directors' Report.
Indemnity and insurance of officers
The Company has indemnified the Directors and executives of the Company for costs incurred, in their capacity as a Director or executive, for which they may be held personally liable, except where there is a lack of good faith.
For
per
sona
l use
onl
y

Prospa Group Limited Annual Report 2019 37
During the financial year, the Company paid a premium in respect of a contract to insure the Directors and executives of the Company against a liability to the extent permitted by the Corporations Act 2001. The contract of insurance prohibits disclosure of the nature of the liability and the amount of the premium.
Indemnity and insurance of auditor
The Company has not, during or since the end of the financial year, indemnified or agreed to indemnify the auditor of the Company or any related entity against a liability incurred by the auditor.
During the financial year, the Company has not paid a premium in respect of a contract to insure the auditor of the Company or any related entity.
Proceedings on behalf of the Company
No person has applied to the Court under section 237 of the Corporations Act 2001 for leave to bring proceedings on behalf of the Company, or to intervene in any proceedings to which the Company is a party for the purpose of taking responsibility on behalf of the Company for all or part of those proceedings.
Non-audit services
Details of the amounts paid or payable to the auditor for non-audit services provided during the financial year by the auditor are outlined in note 26 to the financial statements. We note that these largely related to work carried out in relation to the IPO.
The Directors are satisfied that the provision of non-audit services during the financial year, by the auditor (or by another person or firm on the auditor’s behalf), is compatible with the general standard of independence for auditors imposed by the Corporations Act 2001.
The Directors are of the opinion that the services as disclosed in note 26 to the financial statements do not compromise the external auditor’s independence requirements of the Corporations Act 2001 for the following reasons:
– All non-audit services have been considered by the Board to ensure that they do not impact the integrity and objectivity of the auditor; and
– None of the services undermine the general principles relating to auditor independence as set out in APES 110 Code of Ethics for Professional Accountants issued by the Accounting Professional and Ethical Standards Board, including reviewing or auditing the auditor’s own work, acting in a management or decision-making capacity for the Company, acting as advocate for the Company or jointly sharing economic risks and rewards.
Officers of the Company who are former partners of DeloitteThere are no officers of the Company who are former partners of Deloitte.
Rounding of amountsThe Company is of a kind referred to in Corporations Instrument 2016/191, issued by the Australian Securities and Investments Commission, relating to ‘rounding-off’. Amounts in this report have been rounded off in accordance with that Corporations Instrument to the nearest thousand dollars, or in certain cases, the nearest dollar.
Auditor’s Independence DeclarationA copy of the Auditor’s Independence Declaration as required under section 307C of the Corporations Act 2001 is set out on page 70.
For
per
sona
l use
onl
y

38 Prospa Directors’ Report
AuditorDeloitte continues in office in accordance with section 327 of the Corporations Act 2001.
This report is made in accordance with a resolution of Directors, pursuant to section 298(2)(a) of the Corporations Act 2001.
On behalf of the Directors
Greg Moshal Gail Pemberton AODirector and Joint Chief Executive Officer Independent Director and Chairman
24 September 2019Sydney
For
per
sona
l use
onl
y

"Prospa was going to say yes or no to me in one day. You can make the next move a lot easier knowing, either way. There was no mucking around."Michael Queensland, Australia
Review of Operations
For
per
sona
l use
onl
y

40 Prospa Review of Operations
— Review of Operations
Financial highlights from the 12 months to 30 June 2019 – Originations grew to $501.7 million, an increase of 36.6% on prior corresponding period, driven by all
key sources of business, plus the addition of incremental originations volume from New Zealand, which commenced operations during the FY19 period.
– Total revenue before transaction costs grew to $136.4 million, an increase of 31.2% on prior corresponding period, driven by the originations growth across the business.
– (Loss)/profit after income tax benefit/(expense) was ($24.7) million (FY18 profit: $2.1 million). This result reflected the one-off impact of the Initial Public Offering in the form of offer costs and fair value adjustments on complex financial instruments.
– Pro forma EBITDA1 was $6.8 million, which was 11.5% ($0.7 million) ahead of prospectus forecast, driven by outperformance in funding costs and loan impairment expense.
– We are tracking well towards achieving our CY19 prospectus forecast.
Principal activities We are a financial technology company. We design, build and utilise cloud-based, data rich and API-enabled technologies to deliver seamless customer experiences for the small business economy in Australia and New Zealand. Our product offering has expanded from our first product, the online small business loan, to now include line of credit facilities and B2B trade payments. We have grown to become Australia’s #1 online lender to small business. Since 2012, we have lent approximately $1.2 billion and served more than 20,000 customers.
The credit facilities we currently offer are typically used to fund small businesses’ working capital requirements and growth initiatives. We adopt a risk-based pricing approach, where the interest rate associated with a facility is determined based on our credit risk assessment for that small business customer. This risk assessment process is largely automated and underpinned by technology calibrated with data obtained from our proprietary Credit Risk DataMart of over 73,000 loan applications. We are the #1 online lender to small business. Investment in our three strategic pillars of technology, distribution and funding provides significant leverage and scale relative to competitors. This is underpinned by robust risk management and our people.
We have combined cloud-based technology and bespoke lending principles in order to attract leads, assess credit risk and streamline the credit approval process so we are able to respond promptly to funding requests. Small businesses typically come to us directly or through a partner referral. The application process can take under 10 minutes and is available online, over the phone or through an intermediary. Once we have received the application, we usually revert to the customer with a decision within the same business day, including whether or not they have been approved, and, if they have been approved, the credit facility size, pricing and potential term.
Our core product, the small business loan, is an amortising fixed term loan, repayable in daily or weekly instalments, with an average loan size of $30,000 and an average term of 14 months. Our new line of credit product is a re-drawable facility, which can be utilised for short term cash flow needs or unplanned expenses, with an average drawn balance of $14,000. Our B2B payments solution, ProspaPay, facilitates trade transactions of between $500 and $20,000, with an average transaction value of $2,600.
Our omni-channel approach was designed to put our customers first. It leverages the best of our technology with fast credit decision capability and efficient work-flow automation, while still offering personalised service.
1. EBITDA = Earnings before interest on corporate debt, fair value movements, income tax, depreciation and amortisation. Pro forma EBITDA refers to the EBITDA result, pro forma adjusted in a manner consistent with the 2019 prospectus associated with the Company’s Initial Public Offering.
For
per
sona
l use
onl
y

Prospa Group Limited Annual Report 2019 41
Strategic highlights from the 12 months to 30 June 2019
Initial Public Offering
On 11 June 2019 we listed via an Initial Public Offering of ordinary shares in Prospa Group Limited, raising $60.0 million in primary capital. The offer was conducted to:
– Support growth strategies, including:
– Improving the core small business loan product and funding growth in the equity component of the loan book;
– Investing in technology development and talent; and
– Investing in product development and market expansion into New Zealand;
– Support working capital;
– Repay our corporate debt facility with Partners for Growth;
– Provide access to capital markets for future growth; and
– Provide liquidity for certain investors.
Expansion into the New Zealand market
Following positive feedback from our research and focus groups on the New Zealand market, we commenced our pilot phase operations in August 2018. During the pilot phase, we reached NZ$1 million in originations in our first full month of operation (vs. 14 months for our Australian business) and originated NZ$24 million of loans to New Zealand small businesses to 30 June 2019. Our early credit performance in the New Zealand portfolio appears similar to that of Australian business.
Based on our top down analysis we have estimated the potential market opportunity for small business lending in New Zealand could be in excess of NZ$4.0 billion per annum.
As at 30 June 2019, our New Zealand business has over 700 customers, with an average loan size of approximately NZ$27,000 and average loan term of 13 months. Our customer base is diversified across a range of industry sectors including hospitality, retail, professional services and building and trade. We had a Trustpilot rating in New Zealand of 9.8 out of 10 as at 30 June 2019 and rank first in the non-bank financial services category.
Enhanced core product offering
During the reporting period we made a number of enhancements to our small business loan offering in the Australian market, including:
– Increasing the maximum loan size able to use our express pathway from $100,000 to $150,000;
– Increasing the maximum loan amount from $250,000 to $300,000;
– Providing longer terms of up to 24 months for certain customers; and
– Improving our credit assessment times for loan amounts between $150,000 and $300,000.
In the final quarter of the 12 months ended 30 June 2019, we launched an updated rate card for the small business loan with simple annual interest rates from 9.9%p.a. to 26.5%p.a.. We anticipate the new rate card will allow us to continue to attract certain lower risk profile customers who are typically more price sensitive. This strategy has been a contributor to the growth in the premium segments of our portfolio, from 26% as at 30 June 2018 to 39% as at 30 June 2019.
Launched line of credit product
In the final quarter of the 12 months ended 30 June 2019, we launched our business line of credit product into market. The product is designed to help small business owners run their business day-to-day and handle any unplanned expenses.
For
per
sona
l use
onl
y
42 Prospa Review of Operations
We are leveraging our existing credit infrastructure, technology and distribution channels to more widely distribute this product. Our focus will be on maximising automation and the self-service element of the customer journey, driven by the smaller credit approval amounts and shorter payback periods. We believe automating customer interactions creates a better experience and reduces our operational and support costs.
As at 30 June 2019, we had $1.7 million in drawn facilities with an average drawn balance of $14,000 and an active line utilisation rate of 68%.
Entry into the B2B trade payments market with ProspaPay
ProspaPay is a B2B trade payments solution that allows for the purchase of items by approved small businesses from approved ProspaPay vendors on an interest-free basis. By using ProspaPay, vendors are able to provide an interest free buy now, pay later service to new and existing customers. The vendors typically receive payment for the goods and services sold on or before the next business day and may experience an increase in customers’ basket size as a result of offering the payments solution. In return for the payment, vendors pay a small vendor fee to Prospa.
Once approved, the vendor’s small business customer is able to purchase items up to $20,000 over terms of between three and nine months and make weekly fixed amount interest-free payments. They may also be able to access additional credit products through their relationship with us.
Beyond the direct benefits of providing trade credit to small business owners, and low-cost customer acquisition of new customers, Prospa could realise additional benefits from the potential network effect created on both sides of a ProspaPay transaction. Accredited vendors could encourage other vendors they do business with to become ProspaPay vendors, in order that they can themselves receive the benefit of interest-free trade credit. Small business owners who use ProspaPay to pay for items could encourage other vendors they do business with to become accredited ProspaPay vendors, so they can make interest-free purchases with them.
As at 30 June 2019, we have accredited over 70 vendors and processed an aggregate transaction volume of $1.7 million with an average transaction value of $2,600.
Growth in funding platform
During the FY19 period, Prospa added three additional warehouse funding structures to its market leading funding platform, increasing our new funding capacity by $155.0 million:
1. 2018-2 term facility ($25.0 million);
2. Pioneer bank warehouse facility ($60.0 million); and
3. Prosparity bank warehouse facility ($70.0 million).
Subsequent to balance date, in August 2019, we secured our first New Zealand warehouse funding facility for NZ$45.0 million. This facility will allow us to keep expanding rapidly into the New Zealand market and enabled the repatriation of NZ$6.0 million in equity to be reinvested in the core business and new products. Following the securing of this facility, we have $431.8 million in available funding facilities.
For
per
sona
l use
onl
y

Prospa Group Limited Annual Report 2019 43
Summary of statutory financial performance
The statutory profit and loss for the Group is summarised in the table below.
Summary Income Statement
FY19 FY18
Interest income 125.0 95.0
Other income 11.4 9.0
Total revenue 136.4 104.0
Transaction costs (8.5) (5.0)
Net revenue 127.9 99.0
Funding costs (20.1) (13.7)
Sales & marketing (27.1) (21.5)
Product development (9.4) (5.4)
General & administrative (41.5) (27.5)
Loan impairment (30.6) (23.6)
Total operating expenses (128.7) (91.7)
EBITDA (0.8) 7.4
Depreciation (1.0) (0.6)
Amortisation (2.7) (1.2)
Interest on corporate debt (2.1) (2.1)
Fair value movement (12.4) 0.2
Unwind of embedded derivative (4.4) (0.7)
Profit before tax (23.3) 3.0
Tax expense (1.4) (0.9)
NPAT2 (24.7) 2.1
During the 12 months to 30 June 2019, we delivered strong originations growth, with Group originations increasing to $501.7 million, an increase of 36.6% on prior corresponding period. Growth in originations came from all sources of business, including the addition of incremental New Zealand originations and smaller contributions from line of credit and ProspaPay.
The strong originations growth flowed through to strong organic revenue growth, with Group total revenue before transaction costs increasing to $136.4 million, an increase of 31.2% on prior corresponding period.
Operating expenses (on a statutory basis) increased to $128.7 million in the period, an increase of 40.3% on prior period. These operating expenses include a number of one-off expenses in relation to the Initial Public Offering (2019: $5.5 million). Further, operating expenses in the 12 months to 30 June 2019 reflect a significant increase in investment within the business, including in the expansion into New Zealand, the launch of our line of credit product, and the ongoing development of the ProspaPay product.
Net profit after tax was further impacted by fair value movements through the profit & loss ($12.4 million) and the unwind of embedded derivatives ($4.4 million) due to the crystallisation of a number of complex financial instruments as a result of the Initial Public Offering. These items have a one-time impact associated with the Initial Public Offering and are non-cash in nature. Overall net profit after tax reduced to ($24.7) million in the period. After adjusting for fair value movements and other IPO related adjustments, pro forma net profit after tax (NPAT) was ($1.0) million, consistent with the prospectus.
2. NPAT = Net Profit or (Loss) After Tax
For
per
sona
l use
onl
y

44 Prospa Review of Operations
Basis of preparation
The Group utilises non-IFRS financial information in its assessment and presentation of Group performance. In particular the Group references Pro Forma Revenue, Pro Forma Earnings Before Interest, Tax, Depreciation and Amortisation (EBITDA), and Pro Forma Net Profit After Tax (NPAT).
The Directors believe that the Pro Forma results better reflect the operating performance and is consistent with the 2019 prospectus associated with the Company’s Initial Public Offering.
The non-IFRS Pro Forma financial information has not been audited or reviewed. Adjustments to the IFRS information align with the principles by which the Company views and manages itself internally. See the Reconciliation of statutory revenue, EBITDA and NPAT to pro forma revenue, EBITDA and NPAT below for more information.
Reconciliation of statutory revenue, EBITDA and NPAT to pro forma revenue, EBITDA and NPAT The following table reconciles the statutory reported revenue, EBITDA and NPAT to the pro forma revenue, EBITDA and NPAT using the pro forma adjustment methodology consistent with the prospectus for the Initial Public Offering. These pro forma adjustments illustrate the impact of new accounting standards, public company cost structures, and one-off items to present the income statement on a comparable basis and in a manner consistent with internal management reporting.
Summary Pro Forma Adjustments
Statutory to Pro Forma FY19 FY18
Statutory NPAT (24.7) 2.1
Impact of AASB 9 – (2.2)
Impact of AASB 16 (0.4) (0.3)
Public company costs (0.7) (1.1)
Offer costs 5.5 3.2
Executive remuneration (0.4) (0.9)
Funding optimisation 1.4 –
Fair value (gains) and losses 16.8 (0.2)
Total pro forma adjustments 22.1 (1.6)
Pro forma effective tax rate applied to Pro forma PBT 1.5 0.7
Pro forma NPAT (1.0) 1.3
Statutory EBITDA (0.8) 7.4
Impact of AASB 9 – (2.2)
Impact of AASB 16 1.8 1.4
Public company costs (0.7) (1.1)
Offer costs 5.5 3.2
Executive remuneration (0.4) (0.9)
Funding optimisation 1.4 –
Pro Forma EBITDA 6.8 7.7
The pro forma adjustments are described below:
1. Impact of AASB 9 Financial Instruments: represents the increase in provisioning levels in prior reporting periods had the AASB 9 accounting standard been operating since 1 July 2017;
2. Impact of AASB 16 Leases: impact of AASB 16 reflects the PBT impact of the application of AASB 16 Leases as if it had been in place since 1 July 2017. We will formally adopt AASB 16 from 1 July 2019 (as required by the accounting standards);
For
per
sona
l use
onl
y
Prospa Group Limited Annual Report 2019 45
3. Public company costs: reflects our estimate of the additional annual costs associated with being a listed entity. These costs include Directors’ fees, listing fees, share registry costs, Directors’ and Officers’ insurance premiums, investor relations costs, annual general meetings costs, annual reports costs and other public company costs;
4. IPO costs: costs in relation to the Initial Public Offering, including the Joint Lead Managers’ underwriting fees, legal and accounting due diligence fees, tax and structuring advice, associated consultancy and advisory services relating to the Offer;
5. Executive remuneration: reflects the new executive remuneration arrangements that were put in place following the completion of the Initial Public Offering being applied to the historical periods. The adjustment excludes the new long-term incentive component;
6. Funding optimisation: relates to a one-off payment of $1.4 million incurred upon optimising funding facilities; and
7. Fair value (gains) and losses: reflects the profit and loss impact on a statutory basis from the conversion of the convertible notes and the exercise of the Partners for Growth warrants on Completion of the Initial Public Offering, as well as the unwind of the embedded derivative liability in respect of these instruments.
Revenue During the reporting period, total revenue before transactions costs grew to $136.4 million, an increase of 31.2% on prior corresponding period. This was largely driven by the increase in Group originations, which increased to $501.7 million, a 36.6% increase over prior corresponding period. Total revenue before transaction costs growth was slightly lower than originations growth in the period due to the introduction of a new rate card with lower rates available for lower risk customers, and an increase in conversion in that lower risk customer segment during the period (referred to hereafter as premiumisation).
Interest income increased to $125.0 million, an increase of 31.6% on prior corresponding period. This growth was in line with the overall top-line growth of the business. Other income increased to $11.4 million, an increase of 27.1% on prior corresponding period. Other income is predominantly made up of late fees charged to customers. Late fees comprise a small proportion of total revenue and are charged on the basis of recovering the cost of collections activities. In line with the premiumisation of the portfolio, we have seen the proportion of late paying customers reduce in FY19 over FY18, resulting in late fees growing at a slower pace than total revenue.
Transaction costs increased to $8.5 million, an increase of 72.4% on prior corresponding period. This growth reflects the lagged recognition of transaction costs paid in cash in prior periods (transaction costs are recognised on an effective interest rate method over the life of the loan).
Net revenue increased to $127.9 million, an increase of 29.1% on prior corresponding period, due to the factors noted above.
Operating expenses
Funding costs
Funding costs increased to $20.1 million, an increase of 46.4% on prior corresponding period. This increase included a one-off funding optimisation expense ($1.4 million). After adjusting for this one-off item, adjusted growth was 36.5% in the reporting period. The main driver of this increase in funding costs was the increase in drawn funding debt in the reporting period, offset by the reduction in average funding cost3 from 8.5% in FY18 to 7.5% in FY19.
Sales & marketing expense
Sales & marketing expense increased to $27.1 million, an increase of 26.4% on prior corresponding period. This increase was based on an uplift in broad-based marketing spend in TV and radio during the reporting period, in addition to incremental investment in building brand awareness in the New Zealand market and digital acquisition costs. Expense increases were further driven by headcount growth within the marketing and channel management functions in the business.
3. Average funding cost = funding cost divided by average monthly drawn funding debt.
For
per
sona
l use
onl
y

46 Prospa Review of Operations
Product development expense
Product development expense increased to $9.4 million, an increase of 75.0% on prior corresponding period. This has been driven by an increase in headcount in our engineering, product, design and analytics functions within the business. This additional resource has been critical to the ongoing growth of our business, enabling us to build further functionality in the core product, support our expansion into the New Zealand market and undertake new product developments such as line of credit and ProspaPay.
General & administration expense
General & administration expense increased to $41.5 million, an increase of 50.7% on prior corresponding period. General & administration expense was negatively impacted by Initial Public Offering costs ($5.5 million). Growth in general & administration expense was driven across a number of functions in the business, including customer journey, customer support, retention and credit, capital management and treasury, risk management, finance and people & culture. We further incurred a number of up-front investment costs in the form of market due diligence and legal establishment costs for the New Zealand operation, as well as the legal and establishment costs of three new warehouse facilities established in the reporting period. In FY19 there was a material uplift in investment in business infrastructure in preparation for listing and business growth.
Loan impairment expense
Loan impairment expense increased to $30.6 million, an increase of 29.4% on prior corresponding period. Loan impairment expense grew at a slower pace than total revenue before transaction costs with the benefits of premiumisation emerging in the profit & loss. We continue to monitor the performance of the portfolio closely across a number of portfolio health metrics, including early loss indicators such as the 30+ days past due at 4 months on book, which continues to be supportive of ongoing premiumisation of the portfolio.
Fair value movement and derivative unwind Through the course of 2017 and 2018, the Company received funding to support the continued growth of the business in the form of loan notes, convertible notes and warrants. In respect of the convertible notes and warrants, the conversion values of these financial instruments were referable to either the value at that prior point in time, or as a discount to future value at conversion. Upon listing on 11 June 2019 via an Initial Public Offering, a one-off fair value adjustment expense was recognised through the income statement ($12.4 million) which reflected the valuation uplift achieved by the Company relative to the fair value of these financial instruments measured at the last reporting date, in line with overall business growth.
Further, under AASB 9 Financial Instruments with convertibility may have embedded derivatives which are valued and recognised up front resulting in increased effective interest on the loan component of the convertible instrument (unwind of the embedded derivative value) over the course of the life of the instrument. This was applicable to some of the convertible notes on the Company’s balance sheet. Upon listing, the recognition of this effective interest continued up to the date of conversion, resulting in a one-off expense through the income statement ($4.4 million).
In respect of both the fair value movement and the increase in effective interest (unwind of the embedded derivative), these expenses are one-off associated with the Initial Public Offering and non-cash in nature.
Cash flow The Group continues to generate strong cash flow. Net cash from operating activities reduced to $16.9 million, a reduction of 38.5% on prior corresponding period. The FY19 result was impacted by the cash costs of the Initial Public Offering ($7.4 million), in addition to one-off financing costs ($1.4 million) and an increase in corporate income tax paid ($8.6 million).
We continue to invest in our product set, with investment in intangibles increasing to $3.6 million, an increase of 76.8% on prior corresponding period. Investment in intangibles is comprised of capitalised vendor spend and relevant internal development cost.
For
per
sona
l use
onl
y

Prospa Group Limited Annual Report 2019 47
In our funding cash flows, we raised $60.0 million of new ordinary equity through the Initial Public Offering. One of the applications of the proceeds from listing was to retire our operating company debt with Partners For Growth, reducing our gearing to nil at the operating company level.
Our growth strategy Our growth strategy has 6 main components:
1. Improving our core product through innovation;
2. Increasing the addressable market through product development;
3. Increasing the addressable market through market expansion;
4. Deepening our market penetration through improved distribution capability;
5. Continue developing operating leverage through scale and other efficiencies; and
6. Accelerating execution of product strategy and growth through acquisition.
Post balance date events On 8 August 2019, we announced the establishment of a New Zealand funding structure to fund the ongoing rapid growth of the New Zealand portfolio, anchored by a three year committed facility for NZ$45 million. The facility will fund the class B notes in the warehouse structure, laying the foundation for attracting high quality class A note investors.
No other matter or circumstance has arisen since 30 June 2019 that has significantly affected, or may significantly affect the Group’s operations, the results of those operations, or the Group’s state of affairs in future financial years.
Outlook for the calendar year ending 31 December 2019 During the FY19 reporting period we met or exceeded our core operating metrics from our 2019 prospectus. We remain on track to deliver our CY19 prospectus forecast.
For
per
sona
l use
onl
y

"We liked the process for the fact that it was really quick. Within 24 hours we had the money in our bank account, ready to go, giving us the opportunity that when something came along, we had the money there... The service was fantastic... The process was very easy..."
Jessica, Owner Victoria, Australia
Remuneration Report
For
per
sona
l use
onl
y
Prospa Group Limited Annual Report 2019 49
— Remuneration Report
Letter from the Chairman of Remuneration, People and Nomination CommitteeDear Shareholders,
We are delighted to share Prospa Group Limited’s Remuneration Report for FY19. The Remuneration Report covers remuneration arrangements and outcomes for the FY19 period and highlights of our remuneration arrangements for FY20.
Over the course of FY19, our Remuneration, People and Nomination Committee has established a remuneration framework that is fit for purpose both for the business we are now and the business we are fast becoming. This also includes a focus on broader people initiatives including succession planning, people engagement and diversity and inclusion.
In FY19 we successfully completed our Initial Public Offering , which raised $109.6 million. The funds raised will be invested in the business to encourage continued growth and were distributed to existing shareholders to allow for realisation of part of their investment in the Company. Other key successes for FY19 are our expansion into New Zealand in the first half of FY19 and our launch of a new digital line of credit product in Australia in April 2019.
Our successes in FY19 are recognised through strong results across key financial and non-financial areas. In particular our originations grew to $501.7 million, an increase of 36.6% on prior corresponding period and revenue before transactions costs grew to $136.4 million, an increase of 31.2% on prior corresponding period. Our customer experience has been recognised with a Net Promoter Score in excess of 77 for the twelve months to 30 June 2019. Additionally, we have been recognised for our employee culture and certified as a 2019 Great Place to Work, as well as having been awarded AON Hewitt Employer of Choice for the second year in a row.
We’re proud of our achievements so far, but we believe this is just the beginning. Our business strategy is to continue to invest in the customer experience and technology in order to build products and services that allow small businesses to prosper. If we achieve this, we will continue to deliver value for our shareholders.
Our Remuneration PhilosophyProspa is a young, fast growing, financial technology company and our people are the key to our success. In order to achieve our growth strategy, we will need to continue to invest heavily in our people and our award-winning culture as this represents a strong competitive advantage for us.
We compete for talent with some of the world’s fastest growing technology companies, both public and private. Since Greg and Beau started the business, they have recognised that developing an ownership culture is critical to the Company’s success in attracting and retaining the best people.
Our remuneration philosophy has always been to adopt a combination of fixed and variable remuneration, weighted heavily towards equity incentives. Immediately prior to the IPO, the Prospa team (excluding the founders) owned 10% of the company from equity incentive programs issued whilst the business was a private company.
Today as a listed company, we believe it is critical to maintain and develop this remuneration strategy.
In FY19, Executives received a mix of Fixed Remuneration (FR) and Variable Remuneration (VR) in the form of cash and equity. VR was awarded as equity to align Executives to shareholder interests and drive Prospa’s employee ownership culture. The equity awarded was subject to the achievement of financial and non-financial performance conditions, measured over a three-year period.
For FY20, Prospa will be implementing the Executive Incentive Plan (EIP), Employee Equity Plan (EEP) and the Non-Executive Director Equity Plan (NEDEP). These plans will continue to align Executives, employees and Non-Executive Directors with the achievement of the Company’s strategy and targets by allowing participants to acquire and earn equity in the Company.
For
per
sona
l use
onl
y

50 Prospa Remuneration Report
The EIP rewards Executives for achieving challenging annual targets set by the Board. As with many of our competitors in the technology industry, targets for equity incentives are set and measured over a 12-month performance period. This allows the Company to ensure the targets are aligned to meaningful annual financial and growth outcomes, which can change rapidly at this stage of our Company’s growth. To align Executives with longer-term shareholder interest, equity earned at the end of the performance period is awarded progressively over a further two-year period, resulting in a three-year vesting program.
As Prospa matures, our incentive plans may evolve to be more consistent with those adopted by larger listed companies. However, for the medium term we believe our plan is fit for purpose.
We invite you to read the full Remuneration Report and look forward to the opportunity to answer any questions from shareholders at the upcoming Annual General Meeting on 26th November 2019.
Yours sincerely,
Greg RuddockChairmanRemuneration, People and Nomination Committee
For
per
sona
l use
onl
y

Prospa Group Limited Annual Report 2019 51
Prospa Key Management PersonnelThe Committee presents the Remuneration Report of the Group for the period 1 July 2018 to 30 June 2019. This Report forms part of the Directors’ Report and has been audited in accordance with section 300A of the Corporations Act 2001.
The Remuneration Report details the remuneration arrangements for Prospa’s Key Management Personnel (KMP). KMP are those persons having authority and responsibility for planning, directing and controlling the activities of the entity, directly or indirectly, including all Directors. References in this Remuneration Report to Executives refers only to those Executives who are KMPs, as outlined in Table 1 below for FY19.
Table 1. Prospa KMP
Name Position Term as KMP
Executives
Greg Moshal Executive Director and Joint CEO Full year
Beau Bertoli Executive Director and Joint CEO Full year
Ed Bigazzi Chief Financial Officer Full year
Non-Executive Directors
Gail Pemberton Independent Non-Executive Chairman Full year1
Greg RuddockIndependent Non-Executive Director and Chairman of the Remuneration, People and Nomination Committee
Full year2
Fiona Trafford-WalkerIndependent Non-Executive Director and Chairman of the Audit and Risk Committee
Full year
Avi Eyal Non-Executive Director Full year
Executive remuneration frameworkThe Group aims to reward Executives with a level and mix of fixed and variable remuneration appropriate to their position, responsibilities and performance, in a way that aligns with the Company’s strategy, culture and values and is underpinned by remuneration principles that are fit for purpose.
The following diagram illustrates the link between the Group’s strategy, culture, values, remuneration principles and Executive remuneration arrangements. The diagram also outlines the purpose and operation of each component of the Executive remuneration framework.
1. Gail Pemberton was a Director of the Group and Chairman of the Remuneration, People and Nomination Committee prior to her appointment to position of Chairman in February 2019.
2. Prior to February 2019 Greg Ruddock was the Chairman.
For
per
sona
l use
onl
y

52 Prospa Remuneration Report
Executive remuneration framework
Our Strategy
Culture and values
Remuneration principles
Performance process
FR VR
Continue to invest in the customer experience, technology and people in order to build products and services that allow small businesses to prosper.
Our culture is demonstrated by our core values that drive the behaviour of our organisation and contribute to our ability to deliver excellent customer experiences.
Purpose: Attracts high quality personnel and rewards capability and experience.
Base salary, superannuation and non-monetary benefits.
Reviewed annually by the Committee based on individual, business unit and Group performance and comparable market remuneration for like roles in the technology and finance industry, and companies of a
similar size to Prospa.
Executives may receive their FR in the form of cash or other fringe benefits (for example motor vehicle
benefits) where it does not create any additional costs to the Group.
Purpose: Motivates high performance and retains high quality personnel through providing competitive and appropriate reward for the achievement of strategic
objectives and creation of value for shareholders.
Delivery of variable remuneration is subject to the achievement of shared performance measures that have been chosen given our focus on growing the
business in a profitable way.
Delivered as cash and equity.
Malus and clawback provisions ensure leaders demonstrate the right behaviours.
Reward financial and non financial performance that creates success for Prospa over the short and long term.
Attract, motivate and retain high calibre talent.
Drive the right behaviours and compliance.
Be fit for purpose for the business we are now and aspire to be.
Everyone in the business should share in wealth creation.
Short term incentives truly vary with business performance.
Be fair and transparent.
Remuneration outcomes are delivered with reference to performance outcomes.
Performance evaluation is based on a mix of ‘what’ people are delivering and ‘how’ they are delivering it.
Demonstration of Company values is a gate to achieving a performance rating as we expect all Prospa people to live the values.
Obsess about customers
Deliver value fast
Be bold, open and real
SimplicityDay 1 One team
For
per
sona
l use
onl
y

Prospa Group Limited Annual Report 2019 53
FY19 Executive incentive plansThe Group operated two pre-IPO long-term incentive plans (LTI Plans) in FY19 under which Executives could receive equity as part of their incentive arrangements:
1. Options plan; and
2. Loan share plan.
Executives were awarded equity subject to financial and non-financial performance conditions as part of their incentive arrangements in order to drive Prospa’s ownership culture and align Executive and shareholder interests. The amount of equity awarded was determined by Board discretion.
Equity issued under the LTI Plans was dealt with as described below to ensure that participants’ entitlements were referrable to shares in Prospa following IPO and therefore participants would continue to be motivated to achieve sustained growth for shareholders.
Options planPrior to the IPO, Executives held options under an LTI Plan which vest relative to the satisfaction of revenue, earnings before interest, taxes, depreciation and amortisation (EBITDA) and originations targets. Options were also subject to a target of no material compliance breaches.
Those options awarded to Executives prior to the IPO were swapped for options over shares in the Company immediately after completion of the IPO (replacement options). The replacement options were granted subject to the same performance conditions as those options held prior to IPO. On exercise of any vested replacement options and payment of the exercise price, Executives will receive shares (or an equivalent cash payment). The replacement options and any shares received on vesting will be subject to the Company’s Securities Dealing Policy.
Details relating to each grant held by Executives are set out in Table 2.
Table 2. Executive options grants
Participant
Number of replacement options held immediately prior to IPO completion Exercise price Vesting date
G. Moshal 1,286,640 $3.33 - $3.78 Aug-20 to Sep-22
B. Bertoli 1,286,640 $3.33 - $3.78 Aug-20 to Sep-22
E. Bigazzi 600,000 $3.64 Mar-19 to Sep-21
Unless the Board determines otherwise, if a participant ceases employment before the applicable vesting date, all unvested replacement options will lapse. If a participant ceases employment for cause after the applicable vesting date, all vested replacement options will lapse. If a participant ceases employment for any other reason after the applicable vesting date, vested replacement options must be exercised within 90 days of cessation or as otherwise determined by the Board.
Loan share planMr Bigazzi is party to a pre-IPO loan agreement with Prospa Advance Pty Ltd for the purchase of shares under an LTI plan, which vested on the satisfaction of revenue, earnings before interest, taxes, depreciation and amortisation (EBITDA) and originations targets. Shares were also subject to a target of no material compliance breaches. These shares were swapped on completion of the IPO for shares in the Company that continue to be subject to loan repayment and performance and service based vesting conditions (loan shares).
For
per
sona
l use
onl
y

54 Prospa Remuneration Report
A limited recourse loan is attached to the loan shares and must be repaid before Mr Bigazzi will be entitled to deal with the loan shares. The loan shares and any shares received on vesting and payment of the loan amount will be subject to the Company’s Securities Dealing Policy. Details of the loan shares, including the loan amounts outstanding, are set out in Table 3.
Table 3. KMP loan share grants
ParticipantNumber of loan shares held Loan amount Vesting date
E. Bigazzi 1,073,796 $524,370 Sep-18
If Mr Bigazzi ceases employment after the applicable vesting date, he will have 90 days to repay the loan, unless the Board determines another period. If the loan is repaid within the prescribed period, Mr Bigazzi will receive the relevant number of shares. If the loan is not repaid, the loan shares will be sold and the proceeds less the outstanding loan balance and costs of sale will be paid to Mr Bigazzi.
Changes to Executive remuneration in FY20The EIP to be implemented in FY20 rewards Executives for outperformance of challenging annual performance targets set by the Board. The EIP is designed to align Executives with the Company’s strategy, culture and values and ultimately shareholder interests through ongoing alignment with the Company’s share price.
The FY20 awards under the EIP as outlined in the figure below are made up partly in cash and partly in equity.
FY20 EIP
Year 2 Year 3Year 1
Performance period Performance conditions
tested for period of 1 July 2019 to 30 June 2020
50% Deferred rights
50% Deferred rights
Cash award granted at 30 June 2020
50% of rights exercisable following release of
Company’s full year audited results for FY2021
50% of rights exercisable following release of
Company’s full year audited results for FY2021
For
per
sona
l use
onl
y

Prospa Group Limited Annual Report 2019 55
FY20 remuneration mixThe diagram below sets out the maximum mix of FR and VR each Executive can receive in FY20. The mix of remuneration is weighted towards VR and equity to ensure alignment of Executives with the interests of shareholders.
Joint CEOs remuneration mix CFO remuneration mix
FR FR
Maximum EIP (Equity)
Maximum EIP (Equity)
Maximum EIP (Cash)
Maximum EIP (Cash)
46%
39%
15%
44%
38%
18%
Fixed remuneration
FR, comprising of base salary, superannuation and non-monetary benefits, is reviewed annually by the Committee based on individual, business unit and Group performance and comparable market remuneration for like roles in the technology and finance industry, and companies of a similar size to Prospa.
EIP features
Table 4 outlines the features of the EIP.
Table 4. EIP features
Eligibility The Executives will be eligible to participate in the EIP in FY20.
Award delivery
Performance conditions are set by the Company, tested over a one-year performance period (1 July 2019 to 30 June 2020) and must be satisfied for participants to receive an award. Any award made will be delivered partly in cash and partly in rights to align Executives with the Company’s share price.
The FY20 award of rights will be granted in early FY20 and will vest or lapse following testing of the performance conditions at the end of the performance period.
To the extent the performance conditions are achieved, rights will become exercisable as follows:
– 50% on the day following the release of the Company’s full year audited results for FY21; and
– 50% on the day following the release of the Company’s full year audited results for FY22;
if the participant is an employee and has not provided notice of resignation prior to that exercise date.
Issue price for rights Rights under the EIP are issued for nil consideration.
For
per
sona
l use
onl
y

56 Prospa Remuneration Report
Performance measures
The FY20 EIP awards are subject to meeting specific targets linked to the following financial and non-financial performance conditions:
– 40% of the award is subject to meeting an Earnings before Interest, Taxes, Depreciation and Amortisation (EBITDA) target;
– 40% of the award is subject to meeting a revenue target; and – 20% of the award is subject to meeting individual strategic conditions, in
relation to managing risk and growth as determined by the Company.
Rights expiry Rights will expire five years after the start of the performance period if not exercised or lapsed before this date.
Dividends and voting rights
Rights do not carry dividend or voting rights prior to exercise. Shares allocated on exercise of rights carry the same dividend and voting rights as other shares.
Cessation of employment
Unless the Company determines otherwise:
– If a participant is terminated for cause, all of their rights will lapse and the cash component of the EIP award will be forfeited;
– If a participant gives notice of their resignation: – prior to the Company testing the performance conditions following the
end of performance period, all of their rights will lapse and the cash component of the EIP award will be forfeited; or
– after the Company has tested the performance conditions, they may retain the cash component of their EIP award, but all of their un-exercisable rights will lapse;
– If a participant ceases employment for any other reason: – prior to the Company testing the performance conditions following the
end of performance period, a pro-rated EIP award (based on the portion of the performance period that has elapsed) will remain on foot; or
– after the Board has tested the performance conditions, all of the participant’s rights will remain on foot.
Unless the Board determines otherwise, any rights that do not lapse on cessation must be exercised within 90 days of the right becoming exercisable, or if the vested right is already exercisable when the participant ceases employment, within 90 days of cessation.
Change of control
Where a change of control occurs prior to the Board testing the performance conditions following the end of the performance period, unvested EIP awards will vest and be exercised on a pro-rata basis based on the portion of the performance period complete and the Board’s estimate of likely performance outcomes, subject to Board discretion.
Where a change of control occurs after the Board has tested the performance conditions, all unvested rights will vest and be exercised, subject to Board discretion.
Any rights that are exercised on a change of control will be settled in cash.
Other provisions
The Plan Rules include specific provisions dealing with rights issues, bonus issues, and corporate actions and other capital reconstructions. These provisions are intended to ensure that there is no material advantage or disadvantage to the participant in respect of their incentives as a result of such corporate actions.
Participants are not entitled to participate in new issues of securities by the Company prior to the vesting (and exercise if applicable) of their options or rights. In the event of a bonus issue, options or rights will be adjusted in the manner allowed or required by the ASX Listing Rules.
For
per
sona
l use
onl
y

Prospa Group Limited Annual Report 2019 57
Malus and clawbackThe Plan Rules provide the Company with broad malus and clawback powers if, for example, the participant has acted fraudulently or dishonestly or there is a material financial misstatement.
Dealing restrictions
Prior to vesting, the Plan Rules provide that participants must not sell, transfer, encumber, hedge or otherwise deal with their incentives. After exercise, participants will be free to deal with their any shares they received on exercise of their incentives, subject to the Securities Dealing Policy.
Prospa performance and shareholder returnOver the past three years the Group has achieved strong growth in earnings and shareholder wealth creation year on year as demonstrated in Table 5 below. This is aligned to, and reflected in, equity grants made to Executives which are designed to drive continued company growth through the achievement of financial and non-financial performance.
Of note, we delivered revenue growth of 85% from FY17 to FY18. This was driven by an originations growth of 70% over the same period. This strong revenue growth has continued in FY19, with total revenue before transactions costs growing to $136.4 million, which can be partly attributed to our successful expansion into New Zealand in the second half of 2018.
To ensure continued growth, we will continue to invest in our business by using the net proceeds from the $60.0 million primary raise and the $43.3 million raised in October 2018, through the issuance of the convertible note, to invest in funding the equity portion of the growing loan book and working capital, new products and geographies and the repayment of corporate debt.
Table 5 summarises the statutory earnings of the Group for the three years to 30 June 2019.
Table 5. Group statutory earnings
$ millionPro forma
FY19Statutory
FY19Statutory
FY18Statutory
FY17
Total revenue before transaction costs 136.4 136.4 104.0 56.3
EBITDA3 6.8 (0.8) 7.4 3.1
NPAT (1.0) (24.7) 2.1 0.7
Executive remuneration outcomesDetails of the FY19 remuneration outcomes for Executives are set out in Table 6.
Executive remuneration outcomes are determined by the Board. The Committee reviews and recommends to the Board, Executive remuneration outcomes with reference to capability, experience, market movements, the remuneration principles and individual, business unit and Group performance.
3. EBITDA means Earnings Before Corporate Interest, Tax, Depreciation and Amortisation, and Fair Value movements. Pro forma EBITDA refers to the EBITDA result, pro forma adjusted in a manner consistent with the 2019 prospectus associated with the Company’s Initial Public Offering.
For
per
sona
l use
onl
y

58 Prospa Remuneration Report
Table 6 outlines the remuneration expense recognised for the Group’s Executives for the reporting period measured in accordance with Australian Accounting Standards (AAS).
Table 6. Statutory Executive remuneration outcomes
Fixed remuneration
Post- employment
benefits
Other long-term
benefitsShare based
payments
Name Year Salary and
feesCash
bonusOther
benefitsSuperannu-
ation
Long service
leaveOptions,
rights Loan
shares
Total remunera-
tionPerformance
related
G. Moshal 2019 459,615 150,000 – 20,531 19,291 58,460 – 707,897 29%
2018 369,231 75,000 – 35,077 13,378 – – 492,686 15%
B. Bertoli 2019 459,615 150,000 – 20,531 11,090 58,460 – 699,696 30%
2018 369,231 75,000 – 35,077 6,883 – – 486,191 15%
E. Bigazzi 2019 363,462 150,000 1,200 20,531 4,340 166,482 2,261 708,276 39%
2018 297,115 58,750 1,231 34,352 2,080 – 19,262 412,790 18%
Executive contractual arrangementsRemuneration and other terms of employment for Executives are formalised in service agreements. Details of these agreements are outlined in Table 7.
Table 7. Executive contractual arrangements
Greg Moshal Joint CEO
Beau Bertoli Joint CEO
Ed Bigazzi CFO
Contract type Ongoing Ongoing Ongoing
Fixed remuneration $475,000 $475,000 $375,000
Termination notice by either party 6 months 6 months 6 months
Termination notice with cause Immediate Immediate Immediate
For
per
sona
l use
onl
y

Prospa Group Limited Annual Report 2019 59
Greg Moshal Joint CEO
Beau Bertoli Joint CEO
Ed Bigazzi CFO
Post-employment restraints
Restrictions operate for up to 12 months post-employment and include:
– Non-competition restraints, some of which purport to operate across Australia only;
– Restrictions against soliciting certain Group clients and customers and from providing certain services to those clients or customers;
– Restrictions against inducing suppliers of the Group to cease supply to Prospa; and
– Restrictions against soliciting the Group’s employees, contractors or Directors.
Restrictions operate for up to 12 months post-employment and include:
– Non-competition restraints, some of which purport to operate across Australia only;
– Restrictions against contacting Prospa customers; and
– Restrictions against influencing employees to resign from Prospa.
Sign-on or termination payments
Payment subject to termination benefits cap.
Non-Executive Director remuneration
Fees
Prospa’s Non-Executive Director fee policy is designed to attract and retain high calibre directors and recognise their contribution to the work of the Board and the associated committees on which they serve.
Table 8 outlines the annual base fees paid by the Company to Non-Executive Directors. All Non-Executive Director fees are inclusive of statutory superannuation contributions.
Table 8. Non-Executive Director fees
Board and Committee fees ($ incl super) Chairman Member
Board 175,000 100,000
Audit and Risk Committee 10,000 Nil
Remuneration, People and Nomination Committee 10,000 Nil
For
per
sona
l use
onl
y

60 Prospa Remuneration Report
Non-Executive Directors are entitled to be paid for travel and other expenses incurred in attending to Prospa’s affairs, including attending and returning from general meetings of the Company or meetings of the Board or Committees of the Board.
Any Non-Executive Director who performs extra services, makes any special exertions for the benefit of the Company or who otherwise performs services which, in the opinion of the Board, are outside the scope of the ordinary duties of a Non-Executive Director, may be remunerated for the services (as determined by the Board) out of the funds of the Company.
Prospa does not pay benefits (other than statutory entitlements) on retirement to Non-Executive Directors.
The total amount of fees paid to all Non-Executive Directors in any financial year must not exceed $900,000, as approved by Shareholders at a General Meeting of the Company.
Non-Executive Director Equity Plan
In line with Prospa’s ownership culture, the Company has designed the NEDEP which allows Non-Executive Directors to acquire rights that convert to restricted shares, in lieu of some or all of their cash Non-Executive Director fees. The NEDEP will be implemented in FY20.
The initial FY20 offer to Non-Executive Directors was made at the end of FY19 with pre-tax fee contributions to start in FY20. For this offer, each Non-Executive Director was allocated a number of rights, based on the portion of fees each Director nominated to sacrifice under the NEDEP. Table 9 details the number of rights granted to each Non-Executive Director under the initial FY20 offer.
Table 9. FY20 Non-Executive Director rights grant
Name Number of rights granted
G. Pemberton 23,148
G. Ruddock nil
F. Trafford-Walker 14,550
A. Eyal 13,228
The rights will vest on the day following the release of the FY20 half-year financial results. The shares allocated to the Non-Executive Directors on vesting of the rights will be held subject to dealing restrictions until the earlier of two years or the date on which the Non-Executive Director ceases to hold office as a Director.
The rights are not subject to any performance or service conditions which could result in potential forfeiture.
Prior to vesting, Non-Executive Directors do not have dividend or voting rights with respect to the rights. Shares allocated on vesting carry the same dividend and voting rights as other shares, and Non-Executive Directors will be free to deal with their shares, subject to the Securities Dealing Policy.
Any rights which have not vested will automatically lapse if a Non-Executive Director leaves the Board (in which case any Non-Executive Director fee contributed under the NEDEP will be paid to the Non-Executive Director, subject to superannuation and withholding of tax).
Options granted to Non-Executive Directors
Prospa issued Gail Pemberton, Fiona Trafford-Walker and Greg Ruddock 25,000 options each to reward their contribution to the proposed Company IPO in 2018 and successful Company IPO on 11 June 2019. This was a one-off grant and options were granted for nil consideration. Table 10 provides further details regarding the grant of options.
For
per
sona
l use
onl
y

Prospa Group Limited Annual Report 2019 61
Table 10. One-off options granted in connection with the Company’s IPO
Number of options 75,000
Exercise Price 115% of offer price
Vesting date Fully vested on date of grant (11 June 2019). Exercisable from the day following release of FY20 audited results
Exercise period Five years (until 11 June 2024)
Other
The options are not subject to any performance or service conditions and will remain on foot until exercised even where a Director ceases to hold office. Until options are exercised, they do not have dividend or voting rights and the Directors must not transfer, encumber, hedge or otherwise deal with their options.
Non-Executive Director statutory remuneration
Table 11 outlines statutory remuneration paid to Non-Executive Directors in FY19 in accordance with AAS.
Table 11. Non-Executive Director statutory remuneration
Name YearFees
$
Superannua-tion benefits
$Equity
$Total
$
G. Pemberton 2019 130,124 12,362 15,191 157,677
2018 35,601 3,382 – 38,983
G. Ruddock 2019 83,070 7,702 – 90,772
2018 – – – –
F. Trafford-Walker* 2019 110,000 – 15,191 125,191
2018 31,048 – – 31,048
A. Eyal** 2019 32,375 – 15,663 48,038
2018 – – – –
* Fees relating to Fiona Trafford-Walker will be paid to Abeille Advisory Pty Ltd, a personal services company of which Fiona Trafford-Walker is the sole Director, in return for it arranging for the provision of her services to the Company.
** Avi Eyal is based overseas and all fees are paid in Australian Dollars.
For
per
sona
l use
onl
y

62 Prospa Remuneration Report
Remuneration governance
The following diagram represents the Group’s remuneration oversight and decision-making framework.
The Board
The Remuneration, People and Nomination Committee
Reviews and recommends to the Board remuneration arrangements for its Non-executive Director and Executives.
Determining Non-executive Director and Executive remuneration outcomes;
Determining participation in and performance targets for incentive plans, including employee equity plans;
Approving major changes to company remuneration policies and arrangements; and
Recommending whether offeres are to be made under any or all of the Company’s employee equity incentive plans.
Members
The Committee comprises of four Non-Executive Directors, three of which are independent Directors:
• Greg Ruddock (Chairman)
• Gail Pemberton
• Fiona Trafford-Walker
• Avi Eyal
The Audit and Risk Committee
Advises the Committee of material risk matters which may impact remuneration outcomes, and matters relevant to financial outcomes that warrant consideration when determining variable remuneration award outcomes for Executives.
External consultants
During the 2019 financial year, the Board engaged Ernst & Young to review remuneration policies and to assist with the design and establishment of the EIP. No remuneration recommendations, as defined in the Corporations Act 2001, were provided by Ernst & Young or any other advisor during the year.
Reviews, challenges and, as appropriate, approves the Committee’s remuneration recommendations regarding Non-Executive Directors and Executives.
The Board has overall discretion to reduce, cancel or clawback any remuneration
Additional statutory disclosures
The information in the following section has been prepared in accordance with statutory requirements and Australian Accounting Standards.
KMP equity holdings and movements
A reconciliation of the movement in equity awards for KMPs during the period is outlined in Table 12.
For
per
sona
l use
onl
y

Prospa Group Limited Annual Report 2019 63
Tabl
e 12
. KM
P m
ovem
ents
in o
ptio
ns, l
oan
shar
es a
nd ri
ghts
KMP
*Bal
ance
of
righ
ts,
opti
ons,
loan
sh
ares
as
at
1/7/
2018
Rig
hts,
op
tion
s,
loan
sha
res
gran
ted
in
FY20
19
Gra
nt d
ate
for t
hose
is
sued
in
FY19
Fair
Val
ue a
t gr
ant
date
fo
r tho
se
issu
ed in
FY
19Ex
erci
se
Pric
eEx
piry
dat
e
Rig
hts,
op
tion
s,
loan
sha
res
vest
ed in
FY
2019
Rig
hts,
op
tion
s,
loan
sha
res
forf
eite
d in
FY
2019
Bal
ance
at
30/6
/201
9(u
nves
ted)
G. M
osha
l–
543,
123
14/0
5/20
19$
1.14
$3.
3314
/05/
2024
– –
543,
123
–
743,
517
14/0
5/20
19$
0.95
$3.
7814
/05/
2024
– –
743,
517
B. B
erto
li–
543,
123
14/0
5/20
19$
1.14
$3.
3314
/05/
2024
– –
543,
123
–
743,
517
14/0
5/20
19$
0.95
$3.
7814
/05/
2024
– –
743,
517
E. B
igaz
zi–
600
,000
30/1
1/20
18$
0.75
$3.
64
30/1
1/20
2320
0,00
0–
400,
000
1,
073,
796
– N
/aN
/a$
0.49
17/0
2/20
2121
4,75
9–
–
–
30,0
0012
/06
/201
9$
3.78
N/a
N
/a
**3
0,00
0 –
–
G. P
embe
rton
– 95
,556
25/0
1/20
19$
0.70
$4.
1925
/01/
2024
47,7
78–
47,7
78
–
25,0
0011
/06
/201
9$
0.76
$4.
3514
/06
/202
4 *
*25,
000
– –
–
23,1
4814
/06
/201
9$
3.78
N/a
N
/a
– –
23,1
48
G. R
uddo
ck–
25,0
0011
/06
/201
9$
0.76
$4.
3514
/06
/202
4 *
*25,
000
– –
F. T
raff
ord-
Wal
ker
– 95
,556
25/0
1/20
19$
0.70
$4.
1925
/01/
2024
47,7
78–
47,7
78
–
25,0
0011
/06
/201
9$
0.76
$4.
3514
/06
/202
4 *
*25,
000
– –
–
14,5
5014
/06
/201
9$
3.78
N/a
N
/a
– –
14,5
50
A. E
yal
– 92
,592
1/12
/201
8$
0.25
$3.
64
1/12
/202
377
,16
0–
15,4
32
–
13,2
2814
/06
/201
9$
3.78
N/a
N/a
–
– 13
,228
* N
ote
that
ope
ning
bal
ance
was
hel
d in
Pro
spa
Adva
nce
Pty
Ltd
and
has
been
adj
uste
d fo
r a th
ree-
for-
one
split
that
occ
urre
d du
ring
the
year
.
** V
este
d ho
wev
er u
nder
esc
row
that
they
can
not b
e ex
erci
sed
unti
l the
day
follo
win
g th
e re
leas
e of
the
FY20
resu
lts.
For
per
sona
l use
onl
y

64 Prospa Remuneration Report
The number of shares in the Company held during the financial year by each KMP, including their personally related parties, is outlined in Table 13.
Table 13. KMP equity holdings
KMPBalance at
1/7/2018
Received on exercise of CN* and
warrants
Received on exercise
of rights, options,
loan shares Purchased /
Acquired DisposedBalance at 30/6/2019
G. Moshal 27,318,795 27,948 – – 2,645,503 24,701,240
B. Bertoli 12,318,795 27,948 – – 2,645,503 9,701,240
E. Bigazzi 511,875 – 30,000 – 511,875 30,000
G. Pemberton – 99,126 – 52,910 – 152,036
G. Ruddock 1,765,794 209,613 – – 941,796 1,033,611
F. Trafford-Walker – – 13,228 – 13,228
A. Eyal 2,972,730 240,201 – – 793,651 2,419,280
* Convertible Note.
Loans and other transactions
No loans, other than those outlined in Table 3 as part of the loan share plan, have been granted to any KMP.
There were no transactions during the reporting period involving an equity instrument to KMP or related parties, other than those disclosed in the Remuneration Report.
Securities Dealing Policy
The Company has adopted a Securities Dealing Policy, which provides that Directors, Executives and employees must not deal in the Company’s securities when they are aware of “inside” information.
Directors, Executives and certain restricted employees must not deal in the Company’s securities during any of the following blackout periods:
– The period from the close of trading on the ASX on 30 June each year until the day following the announcement to ASX of the full-year results;
– The period from the close of trading on the ASX on 31 December each year until the day following the announcement to ASX of the half-year results; and
– Any other period that the Board specifies from time to time.
Directors and restricted employees must receive prior approval for any proposed dealing in the Company’s securities outside of the above blackout periods (including any proposed dealing by one of their connected persons).
In accordance with obligations under the Corporations Act 2001, Prospa’s Securities Dealing Policy prohibits key management personnel and Directors from entering into hedging arrangements in relation to Prospa securities including unvested awards in the EIP. In addition, the EIP Plan Rules restrict Executives from entering into hedging arrangement in relation to unvested awards under the EIP. Any attempt to hedge awards in contravention of the Securities Dealing Policy or EIP Plan Rules will result in forfeiture and the Board may consider disciplinary action.
For
per
sona
l use
onl
y

"You feel vulnerable with the bank because the process isn’t friendly; it’s long and drawn out...Prospa’s timing is perfect whenever you need them. They help you out when you need those funds to buy additional stock when you’re presented with good deals."
Maxine Queensland, Australia
Corporate Governance
For
per
sona
l use
onl
y

66 Prospa Corporate Governance
— Corporate GovernanceProspa has reviewed its current corporate governance policies and practices against the Australian Securities Exchange (ASX) Corporate Governance Council’s (ASX CGC) Corporate Governance Principles and Recommendations 3rd Edition (Recommendations) in respect of the year ended 30 June 2019. As recommended by the ASX CGC, further information in relation to corporate governance practices is set out in the Corporate Governance Statement, which is publicly available on our website prospa.com.
This corporate governance statement is current as at 24 September 2019 and has been approved by the board of the Company (Board).
Our Code of ConductIn conducting its business activities Prospa is committed to maintaining the highest ethical standards. Prospa’s success is dependent on the knowledge, experience and talent of our employees, the strength of our management team, the quality of our business strategy and our compliance with high standards of corporate conduct, ethics and governance. We are constantly working to reinforce and communicate our values to our employees, shareholders, customers, suppliers and the broader community. The Board believes it is important to provide a clear set of values that emphasise a culture encompassing strong corporate governance, sound business practices and good ethical conduct.
Our Code of Conduct has been prepared for the guidance and benefit of all people employed, contracted by, associated with, or acting on behalf of the Prospa and its related bodies corporate (the Group). The Code of Conduct also extends to all Directors. The Code of Conduct expresses the core values that drive our behaviour and aspirations as follows:
– our actions must be governed by high standards of integrity and fairness;
– our decisions must be made in accordance with the spirit and letter of applicable law; and
– our business must be conducted honestly and ethically, with our best skills and judgement, and for the benefit of customers, employees, shareholders and the Group alike.
Our Code of Conduct applies to all Directors, officers, employees, contractors, consultants and associates. It outlines how we expect our representatives to behave and conduct business in the workplace. By doing so we can be proud of our individual and collective achievements and ensure that the Group maintains a reputation for high standards of business conduct, professionalism and integrity, values and ethical standards are reflected in our day-to-day operations.
Prospa takes its obligations regarding ethical behaviour very seriously. In addition to our Code of Conduct, we have policies in place for the disclosure of personal relationships where a potential conflict may arise, for pre-employment and background checks, particularly for senior leaders and those employees accessing credit information and making financial decisions.
Our core valuesEmployees strive to solve our customers’ problems by making complex financing solutions simple for the everyday small business owner. Our culture is demonstrated by our core values that drive the behaviour of our organisation and contribute to our ability to deliver excellent customer experiences:
For
per
sona
l use
onl
y

Prospa Group Limited Annual Report 2019 67
Prospa’s core values
Obsess about customers
Deliver value fast
Be bold, open and real
Simplicity
Day 1
One team
Don’t just listen, hear what’s important
Celebrate outcomes, not processes
Take smart risks, be transparent and true
Make the complex simple
Keep our start-up mentality
We work as one
Diversity and inclusionWe are committed to building and maintaining a diverse and inclusive team, enhancing our capability and reputation and allowing us to attract, engage and retain talented people. Our 250 employees come from over 30 different countries.
We are committed to the principles of equal employment opportunity. We embrace strength-based leadership, and seek to recruit, promote and remunerate based on performance, capabilities and behaviours. We ensure our partner agencies are aware of our diversity agenda when recruiting on our behalf. We seek to achieve greater gender diversity by setting measurable objectives and broadening the field of potential candidates and Board appointments.
Our gender targets for FY19 for all employees were 40% women and 60% men; and for the Board and Executives 33% women and 67% men.
As at the end of FY19, we achieved our gender targets in relation to all employees. In relation to our gender diversity for the Board and Executives, we achieved 27% women and 73% men.
For the reporting period 1 April 2018 to 31 March 2019, Prospa was compliant with the Workplace Gender Equality Act 2012.
Prospa has a number of initiatives to promote workplace diversity, including flexible working options, paid parental leave, a wheelchair accessible working environment, programs to nurture leaders and study leave options.
For
per
sona
l use
onl
y

68 Prospa Corporate Governance
Prospa surveys its employees monthly with a ‘Pulse Check’ to monitor team engagement. Prospa also participates in an annual engagement survey and has been awarded the AON Hewitt Employer of Choice for the second year in a row. Furthermore, Prospa received Great Place to Work Certification in 2019. Assessment is based on an independent benchmark of our policies, practices, and programs; together with feedback from our people obtained through a Trust Index© employee survey.
Community initiatives
The Group is a responsible corporate citizen and actively supports the communities in which we live and work. Each employee is expected to uphold the Group’s commitment to pursue good corporate citizenship while engaging in its corporate activity.
Prospa has an ongoing volunteering program and during the reporting period a number of teams took the opportunity to volunteer their time to worthwhile causes.
Prospa supports Kiva, which provides micro-loans to entrepreneurs in developing countries.
Economic
This year Prospa invested in testing our purpose and commissioned independent research by RFi Group and the Centre for International Economics into the economic impact of our small business lending. The research found that every $1 million Prospa lends to small business, results in $4 million to Australian GDP and support 57 FTE jobs.
Environmental
The Group is committed to doing business in an environmentally responsible manner and identifying environmental risks that may arise out of its operations.
Prospa has a small environmental impact, but endeavours to incorporate sustainable measures into our workplace culture, such as recycling initiatives, automated software to encourage non-colour double sided printing and air-conditioning controls.
Governance and Risk ManagementManagement of risks is underpinned by a robust governance structure. The Audit and Risk Committee meets once a quarter and has the responsibility to review and address risks, compliance, controls and financial reporting impacting the Group. The Committee also provides guidance to the various management committees.
Enterprise Risk Management
The Enterprise Risk Management Framework is approved by the Board and establishes strategies and processes to identify and manage risk commensurate with the Group’s risk profile. Efficient and effective identification and management of risks has always been one of the core capabilities at Prospa. It plays an important role in helping the business achieve its strategic objectives, enhancing the portfolio’s health and protecting our reputation and shareholders’ interests. The Board and management are focused on ensuring a strong risk culture exists within the Group.
The Group’s CEOs and CFO are responsible for the Enterprise Risk Management Framework and appoint a team of senior management personnel and subject matter experts to develop and implement policies, controls, processes and procedures that identify and manage risk in all of the Group’s activities.
The Group’s activities expose it to a variety of financial and non-financial risks. These are discussed individually below.
Credit Risk
Credit risk is the risk of financial loss to the Group if a customer or counterparty to a financial instrument fails to meet its contractual obligations. Credit risk for the Group is concentrated in loan receivables.
For
per
sona
l use
onl
y

Prospa Group Limited Annual Report 2019 69
The Group has exposure to credit risk on all its term loans and revolving facilities. To manage and mitigate credit risk, the Group has developed a comprehensive credit risk framework. The credit risk framework includes the credit policy, credit procedures, statistical models that predict the likelihood of default, mathematical models that construct a financial cash flow and determine the loan affordability and specific rules to mitigate fraud.
All components of the framework are embedded in our proprietary Credit Decision Engine (CDE) which enable us to scale whilst delivering consistent and accurate credit decisions. The credit risk assessments derived from the CDE are supported by an independent review from the experienced and trained credit staff. All credit risk assessments are screened through the KYC and AML rules in accordance with our AML/CTF Program.
The quality of data facilitated by our in-house built Credit Risk DataMart enables a dedicated team to perform timely and pro-active portfolio management. Key trends in the credit portfolio along with concentration risk relative to the risk appetite are monitored frequently and reported to management on a monthly basis.
Liquidity and Market RiskLiquidity risk is the risk of the Group not meeting its financial liabilities in a timely manner. Maintaining continuous access to funds is the responsibility of the Group Capital Management (GCM) function within Prospa. GCM utilises a number of strategies to enable liquidity including operating a funding platform with a diversified source of funding that incorporates securitisation warehouse facilities, group equity and balance sheet cash. In addition, securitisation facilities are funded through multiple domestic and global funders.
Market risks, specifically interest rate and foreign exchange risk, can lead to an adverse impact on the Group’s earnings particularly as the Group offers fixed rate loans to its customers and borrows to fund these customers using a mix of fixed and floating rates from funders. The Group hedges these interest rate risks in accordance to the Board approved Financial Risk Management policy and using cost-effective hedging strategies such as interest rate caps contracts.
With the expansion into the New Zealand market, the Group is now exposed to foreign exchange translation and transaction risk. To minimise this risk, the Group has undertaken funding of its New Zealand operations in local currency restricting the exchange rate translation and transaction risk to the Group’s equity invested in the New Zealand operations.
Operational Risk & ComplianceOperational risk is defined as the risk of loss resulting from inadequate or failed internal processes, people and systems or from external events – either intentional or accidental. The extent and rigour with which operational risk is managed has an impact on the Group’s customers, employees, financial performance and reputation.
Compliance risk is the risk of regulatory action or policy change which may negatively affect the Group’s financial position or reputation resulting from a failure to abide by compliance obligations.
The Group’s Operational Risk and Compliance Frameworks allow for effective identification, assessment, management, monitoring and reporting of operational risks and compliance obligations. These frameworks set out the methodology to build and update the Group’s risk profile and help establish and define policies, techniques and controls used to manage and mitigate operational risks and obligations.
The Group’s Operational Risk and Compliance Frameworks are positioned around the five pillars of risk internally (Strategic, Legal and Regulatory, Operations, Cyber Security and Credit); allowing management to prioritise effort across all aspects of operational risk and compliance. The Operational Risk and Compliance Frameworks are revised and enhanced through feedback from management and the Audit and Risk Committee.
The Group continues to invest in operational risk capabilities to ensure we meet the evolving needs in a changing operating environment which now includes multiple products and geographies.
For
per
sona
l use
onl
y

"I got on the phone and had an answer almost straight away... We didn’t have to go into a bank. We didn’t have to fill out forms. We didn’t have to do any of that... It’s saved us so much time and effort."
Craig New South Wales, Australia
Auditor's Independence Declaration
For
per
sona
l use
onl
y

Prospa Group Limited Annual Report 2019 71
— Auditor’s Independence Declaration
Liability limited by a scheme approved under Professional Standards Legislation. Member of Deloitte Asia Pacific Limited and the Deloitte Network.
The Board of Directors Prospa Group Limited Level 1, 4 – 12 Yurong Street Sydney NSW 2000 24 September 2019 Dear Board Members
Prospa Group Limited
In accordance with section 307C of the Corporations Act 2001, I am pleased to provide the following declaration of independence to the directors of Prospa Group Limited. As lead audit partner for the audit of the financial statements of Prospa Group Limited for the financial year ended 30 June 2019, I declare that to the best of my knowledge and belief, there have been no contraventions of:
i) the auditor independence requirements of the Corporations Act 2001 in relation to the audit; and
ii) any applicable code of professional conduct in relation to the audit. Yours sincerely
DELOITTE TOUCHE TOHMATSU
Mark Lumsden Partner Chartered Accountants
Deloitte Touche Tohmatsu A.C.N. 74 490 121 060 Grosvenor Place 225 George Street Sydney NSW 2000 PO Box N250 Grosvenor Place Sydney NSW 1217 Australia Tel: +61 (0) 2 9322 7000 Fax: +61 (0) 2 9322 7001
For
per
sona
l use
onl
y

72 Prospa Financial Statements
FY19FinancialStatements
For
per
sona
l use
onl
y

Prospa Annual Report 2019 73
FY19F
or p
erso
nal u
se o
nly

74 Prospa Financial Statements
— Financial Statements
General informationThe financial statements cover Prospa Group Limited as a group consisting of Prospa Group Limited and the entities it controlled at the end of, or during, the financial year. The financial statements are presented in Australian dollars, which is Prospa Group Limited’s functional and presentation currency.
Prospa Group Limited is a listed public company limited by shares, incorporated and domiciled in Australia. Its registered office and principal place of business is:
Level 1 4-16 Yurong StreetSydney NSW 2000
A description of the nature of the Group’s operations and its principal activities are included in the Directors’ Report, which is not part of the financial statements.
The financial statements were authorised for issue, in accordance with a resolution of Directors, on 24 September 2019. The Directors have the power to amend and reissue the financial statements.
For
per
sona
l use
onl
y

Prospa Group Limited Annual Report 2019 75
— Consolidated statement of profit or loss and other comprehensive incomeFor the year ended 30 June 2019
Consolidated
Note30 June 2019
$’00030 June 2018
$’000
Interest income 124,987 94,986
Other income 4 11,436 9,005
Total revenue before transaction costs 136,423 103,991
Transaction costs (8,536) (4,950)
Net revenue 127,887 99,041
Operating expenses
Funding costs 5 (20,070) (13,708)
Sales and marketing expense (27,127) (21,465)
Product development expense (9,408) (5,375)
General and administration expense (41,498) (27,531)
Loan impairment expense (30,550) (23,600)
Total operating expense 6 (128,653) (91,679)
Earnings before interest on corporate debt, fair value movements, income tax, depreciation and amortisation (766) 7,362
Depreciation (955) (563)
Amortisation (2,684) (1,162)
Interest on corporate debt 5 (2,103) (2,143)
Financial instruments: Fair value (loss)/gain 7 (12,439) 194
Financial instruments: Unwind of embedded derivative 5,7 (4,357) (718)
(Loss)/profit before income tax expense (23,304) 2,970
Income tax expense 8 (1,417) (876)
(Loss)/profit after income tax expense for the year attributable to the owners of Prospa Group Limited 21 (24,721) 2,094
Other comprehensive income/(loss)
Gain/(loss) on the revaluation of financial assets at fair value through other comprehensive income, net of tax 104 (104)
Foreign currency translation 14 –
Other comprehensive income/(loss) for the year, net of tax 118 (104)
Total comprehensive (loss)/income for the year attributable to the owners of Prospa Group Limited (24,603) 1,990
Cents Cents
Basic (loss)/earnings per share 35 (21.55) 5.61
Diluted (loss)/earnings per share 35 (21.55) 5.17
The above consolidated statement of profit or loss and other comprehensive income should be read in conjunction with the accompanying notes
For
per
sona
l use
onl
y

76 Prospa Financial Statements
— Consolidated statement of financial positionAs at 30 June 2019
Consolidated
Note30 June 2019
$’00030 June 2018
$’000
Assets
Current assets
Cash and cash equivalents 9 69,839 34,397
Loan receivables 10 235,120 173,279
Bank deposits 1,098 796
Other financial assets 130 38
Income tax 447 –
Prepayments and other assets 3,171 2,654
Total current assets 309,805 211,164
Non-current assets
Loan receivables 11 144,733 85,855
Property, plant and equipment 12 2,354 1,535
Intangible assets 13 6,577 5,683
Deferred tax assets 14 8,814 5,264
Total non-current assets 162,478 98,337
Total assets 472,283 309,501
Liabilities
Current liabilities
Trade and other payables 6,687 7,139
Borrowings 15 14,974 16,496
Other financial liabilities 16 – 2,345
Income tax – 4,691
Employee benefits 3,792 2,042
GST provision 17 – 1,043
Total current liabilities 25,453 33,756
Non-current liabilities
Borrowings 18 296,548 238,934
Employee benefits 262 126
Total non-current liabilities 296,810 239,060
Total liabilities 322,263 272,816
Net assets 150,020 36,685
EquityIssued capital 19 609,975 36,149
Reserves 20 (431,412) 1,096
Accumulated losses 21 (28,543) (560)
Total equity 150,020 36,685
The above consolidated statement of financial position should be read in conjunction with the accompanying notes
For
per
sona
l use
onl
y

Prospa Group Limited Annual Report 2019 77
— Consolidated statement of changes in equityFor the year ended 30 June 2019
Consolidated
Issued capital
(Note 19)$’000
Reserves (Note 20)
$’000
Accumulated losses
(Note 21)$’000
Total
equity$’000
Balance at 1 July 2017 36,149 596 (2,654) 34,091
Profit after income tax expense for the year – – 2,094 2,094
Other comprehensive income for the year, net of tax – (104) – (104)
Total comprehensive income for the year – (104) 2,094 1,990
Transactions with owners in their capacity as owners:
Share-based payments (note 36) – 604 – 604
Balance at 30 June 2018 36,149 1,096 (560) 36,685
Consolidated
Issued capital
(Note 19)$’000
Reserves (Note 20)
$’000
Accumulated losses
(Note 21)$’000
Total
equity$’000
Balance at 1 July 2018 36,149 1,096 (560) 36,685
Adjustment on adoption of AASB 9 (note 1) – – (3,262) (3,262)
Balance at 1 July 2018 - restated 36,149 1,096 (3,822) 33,423
Loss after income tax expense for the year – – (24,721) (24,721)
Other comprehensive income for the year, net of tax – 118 – 118
Total comprehensive income for the year – 118 (24,721) (24,603)
Transactions with owners in their capacity as owners:
Share-based payments (note 36) – 1,626 – 1,626
Conversion of options (note 19) 77 – – 77
Capital buy-back (note 36) – (1,284) – (1,284)
IPO - Conversion of convertible notes 76,773 – – 76,773
IPO - Conversion of warrant 4,226 – – 4,226
IPO - Management performance shares 523 – – 523
IPO - Issue of ordinary shares, net of transaction costs 57,586 – – 57,586
IPO - Re-organisation reserve 432,968 (432,968) – –
IPO - IPO grants to management 1,247 – – 1,247
IPO - Proceeds from loan shares 426 – – 426
Balance at 30 June 2019 609,975 (431,412) (28,543) 150,020
The above consolidated statement of changes in equity should be read in conjunction with the accompanying notes
For
per
sona
l use
onl
y

78 Prospa Financial Statements
— Consolidated statement of cash flowsFor the year ended 30 June 2019
Consolidated
Note30 June 2019
$’00030 June 2018
$’000
Cash flows from operating activities
Finance income received 124,921 89,765
Other income received 7,405 9,014
Interest and other finance costs paid (23,306) (15,697)
Payments to suppliers and employees (83,545) (55,387)
Income taxes paid (8,613) (290)
Net cash from operating activities 34 16,862 27,405
Cash flows from investing activities
Net increase in loans advanced to customers (151,800) (126,881)
Payments for property, plant and equipment (1,775) (1,442)
Payments for intangibles (3,578) (2,024)
Other investing cash flows (302) (796)
Net cash used in investing activities (157,455) (131,143)
Cash flows from financing activities
Proceeds from borrowings 179,141 207,720
Repayment of borrowings (61,051) (78,992)
Payments for capital buy-backs (1,718) –
Proceeds from conversion of warrant 2,000 –
Proceeds from issue of shares net of transaction costs 19 57,586 –
Conversion of options 19 77 –
Net cash from financing activities 176,035 128,728
Net increase in cash and cash equivalents 35,442 24,990
Cash and cash equivalents at the beginning of the financial year 34,397 9,407
Cash and cash equivalents at the end of the financial year 9 69,839 34,397
The above consolidated statement of cash flows should be read in conjunction with the accompanying notes
For
per
sona
l use
onl
y

Prospa Group Limited Annual Report 2019 79
— Notes to the consolidated financial statementsFor the year ended 30 June 2019
1. Significant accounting policies
The principal accounting policies adopted in the preparation of the financial statements are set out below. These policies have been consistently applied to all the years presented, unless otherwise stated.
Basis of preparationThese general purpose financial statements have been prepared in accordance with Australian Accounting Standards and Interpretations issued by the Australian Accounting Standards Board (AASB) and the Corporations Act 2001, as appropriate for for-profit oriented entities. These financial statements also comply with International Financial Reporting Standards as issued by the International Accounting Standards Board (IASB).
Historical cost convention
The financial statements have been prepared under the historical cost convention, except for, where applicable, the revaluation of financial assets and liabilities at fair value through profit or loss, financial assets at fair value through other comprehensive income and loans and other receivables which are measured at amortised cost.
Critical accounting estimates
The preparation of the financial statements requires the use of certain critical accounting estimates. It also requires management to exercise its judgement in the process of applying the Group’s accounting policies. The areas involving a higher degree of judgement or complexity, or areas where assumptions and estimates are significant to the financial statements, are disclosed in note 2.
Going concern
The financial statements of the Group have been prepared on a going concern basis. The Board of Directors have made an assessment of the Group’s ability to continue as a going concern and have reviewed cash flow forecasts. They are satisfied that the Group has the resources to continue for the foreseeable future and pay debts as they fall due.
Parent entity informationIn accordance with the Corporations Act 2001, these financial statements present the results of the Group only. Supplementary information about the parent entity is disclosed in note 30.
Principles of consolidationThe consolidated financial statements incorporate the assets and liabilities of all subsidiaries of Prospa Group Limited (‘company’ or ‘parent entity’) as at 30 June 2019 and the results of all subsidiaries and trusts for the year then ended. Prospa Group Limited and its subsidiaries and trusts together are referred to in these financial statements as the ‘Group’.
Subsidiaries and trusts are all those entities over which the Group has control. The Group controls an entity when the Group is exposed to, or has rights to, variable returns from its involvement with the entity and has the ability to affect those returns through its power to direct the activities of the entity. Subsidiaries and trusts are fully consolidated from the date on which control is transferred to the Group. They are de-consolidated from the date that control ceases.
Intercompany transactions, balances and unrealised gains on transactions between entities in the Group are eliminated. Unrealised losses are also eliminated unless the transaction provides evidence of the impairment of the asset transferred. Accounting policies of subsidiaries and trusts have been changed where necessary to ensure consistency with the policies adopted by the Group.
For
per
sona
l use
onl
y

80 Prospa Financial Statements
During the period the Group undertook an Initial Public Offering and group reorganisation. This included establishing a listed entity, Prospa Group Limited, which applied the reverse acquisition accounting principles of AASB 3 to the transaction, with the effect that Propsa Group Limited has assumed the position of the parent entity of the Group. Comparative financial information of Prospa Advance Pty Limited has been reported in accordance with AASB 3. The material transactions and accounting policies in respect of the reorganisation and change in financial instruments have been disclosed within the notes to this annual report.
Foreign currency translationThe financial statements are presented in Australian dollars, which is Prospa Group Limited’s functional and presentation currency.
Foreign currency transactions
Foreign currency transactions are translated into Australian dollars using the exchange rates prevailing at the dates of the transactions. Foreign exchange gains and losses resulting from the settlement of such transactions and from the translation at financial year-end exchange rates of monetary assets and liabilities denominated in foreign currencies are recognised in profit or loss.
Foreign operations
The assets and liabilities of foreign operations are translated into Australian dollars using the exchange rates at the reporting date. The revenues and expenses of foreign operations are translated into Australian dollars using the average exchange rates, which approximate the rates at the dates of the transactions, for the period. All resulting foreign exchange differences are recognised in other comprehensive income through the foreign currency reserve in equity.
The foreign currency reserve is recognised in profit or loss when the foreign operation or net investment is disposed of.
New or amended Accounting Standards and Interpretations adoptedThe Group has adopted all of the new or amended Accounting Standards and Interpretations issued by the Australian Accounting Standards Board (AASB) that are mandatory for the current reporting period.
Any new or amended Accounting Standards or Interpretations that are not yet mandatory have not been early adopted.
The details of the new significant accounting policies and the nature of the changes to previous accounting policies in relation to the Group are set out below.
Initial adoption of AASB 9 Financial Instruments
The Group has adopted AASB 9 from 1 July 2018. AASB 9 sets out the requirements to recognise and measure financial assets and financial liabilities. This standard replaces AASB 139 Financial Instruments: Recognition and Measurement. The details of this new significant accounting policy and the impact of transition to AASB 9 on the opening balance of accumulated losses are set out below. Under the transitional rules, comparative figures have not been restated.
AASB 9 introduced new requirements for:
1. The classification and measurement of financial assets and liabilities;
2. Impairment of financial assets; and
3. Hedge accounting.For
per
sona
l use
onl
y

Prospa Group Limited Annual Report 2019 81
1. Classification and measurement
Financial assets
Under AASB 9, on initial recognition, a financial asset is classified at fair value, and classified and subsequently measured at fair value through profit or loss (FVTPL), fair value through other comprehensive income (FVOCI) or amortised cost. The classification under AASB 9 is based on the Group’s business model for managing the financial assets and the contractual cash flow characteristics of the financial assets.
On initial recognition, the Group may irrevocably designate a financial asset that otherwise meets the requirements to be measured at amortised cost as at FVTPL if doing so eliminates or significantly reduces an accounting mismatch that would otherwise arise.
The following accounting policies apply to the subsequent measurement of financial assets.
Financial assets at FVTPL These assets are subsequently measured at fair value. Changes in fair value are recognised in profit or loss.
Financial assets at FVOCI These assets are subsequently measured at fair value. Changes in fair value are recognised in other comprehensive income. At 30 June 2019 the Group no longer holds any instruments in this category.
Financial assets at amortised cost
These assets are subsequently measured at amortised cost using the effective interest method. The amortised cost is reduced by impairment losses (see impairment of financial assets).
The following table explains the original measurement categories under AASB 139 and the new measurement categories under AASB 9 for each class of the Group’s financial assets as at 1 July 2018.
Financial assetsOriginal classification
New classification Change in carrying amount
Cash and cash equivalents
Loans and receivables
Amortised cost No impact on transition to AASB 9
Loan receivables Loans and receivables
Amortised cost Impact on impairment as detailed below
Bank deposits Loans and receivables
Amortised cost No impact on transition to AASB 9
Other financial assets
Available-for-sale FVTPL FVOCI
No impact on transition to AASB 9
Financial liabilities
AASB 9 largely retains the existing requirements of AASB 139 for the classification and measurement of financial liabilities.
For
per
sona
l use
onl
y

82 Prospa Financial Statements
2. Impairment of financial assets
The AASB 9 impairment model is based on an expected credit loss methodology instead of the incurred loss methodology of AASB 139. This expected credit loss model segments the portfolio into stage 1, stage 2 and stage 3, which are described in further detail in the table below:
Stage 1 Financial assets that have not had a significant increase in credit risk since initial recognition. For these assets, 12 months expected credit losses are recognised. There is a rebuttable presumption that Stage 1 assets comprise loans less than or equal to 30 days past due.
Stage 2 Financial assets that have experienced a significant increase in credit risk since initial recognition but do not have objective evidence of impairment. For these assets, lifetime expected credit losses are recognised.
Stage 3 Financial assets that have objective evidence of impairment. For these assets, lifetime expected credit losses are recognised.
The Stage 1 and Stage 2 models are built using ‘days past due’ roll rates to derive a probability of default for each stage. This model then derives an exposure at default, to which we apply our loss given default percentage. For Stage 1, there is a mandatory emergence period of 12 months. For Stage 2, we use our portfolio emergence period, based on the behavioural life of the portfolio.
The Stage 3 provision looks at the collection status of loans past default and takes into account our loss given default percentage.
To the Stage 1-3 provision we add an economic overlay. This overlay takes into account the economic cycle and the outlook for the economic indicators which may impact the credit performance of our portfolio.
The adoption of this standard has resulted in an increase in the allowance for expected credit losses, an increase in deferred tax and an adjustment to the operating accumulated losses as follows:
$’000
Allowance for expected credit losses 4,660
Deferred tax asset (1,398)
AASB 9 adjustment to opening accumulated losses at 1 July 2018 3,262
The impact of the new Accounting Standards compared with the previous Accounting Standards is as follows:
Carrying amount under AASB 139 at 30 June 2018
Adjustment under ECL model
Carrying amount under AASB 9 at 1 July 2018
$’000 $’000 $’000
Gross loan receivables 272,990 – 272,990
Provision for loan loss impairment (13,856) (4,660) (18,516)
Net loan receivables 259,134 (4,660) 254,474
Impact on deferred tax assets 4,157 1,398 5,555
Accumulated losses 560 3,262 3,822For
per
sona
l use
onl
y

Prospa Group Limited Annual Report 2019 83
3. Hedging
The new general hedge accounting requirements retain the three types of hedge accounting mechanisms currently available in AASB 139. Under AASB 9, greater flexibility has been introduced to the types of transactions eligible for hedge accounting, specifically broadening the types of instruments that qualify for hedging instruments and the types of risk components of non-financial items that are eligible for hedge accounting. In addition, the effectiveness test has been overhauled and replaced with the principle of an “economic relationship”. Retrospective assessment of hedge effectiveness is also no longer required. Enhanced disclosure requirements about an entity’s risk management activities have also been introduced.
The adoption of AASB 9 does not have significant impact to the cash flow hedges of the Group.
Initial adoption of AASB 15 Revenue from contracts with customers
The Group has adopted AASB 15 from 1 July 2018. The standard provides a single comprehensive model for revenue recognition. The core principle of the standard is that an entity shall recognise revenue to depict the transfer of promised goods or services to customers at an amount that reflects the consideration to which the entity expects to be entitled in exchange for those goods or services. The standard introduced a new contract-based revenue recognition model with a measurement approach that is based on an allocation of the transaction price. Credit risk is presented separately as an expense rather than adjusted against revenue. Contracts with customers are presented in the statement of financial position as a contract liability, a contract asset, or a receivable, depending on the relationship between the entity’s performance and the customer’s payment. Customer acquisition costs and costs to fulfil a contract can, subject to certain criteria, be capitalised as an asset and amortised over the contract period.
The Group has several revenue streams derived from the provision of loans to small businesses predominantly in Australia. Interest income, representing revenue in the form of loan interest and origination fees is captured under AASB 9 and not under AASB 15. Fee income which comprises of servicing fees and late fees is recognised in accordance with AASB 15.
Servicing fees arise on loans with a syndication investment. We charge that syndication partner a servicing fee for originating the loan and creating the initial syndication investment, administering the loan, including initiating the direct debit instalments and passing on cleared payments to the syndication partner, in addition to any renewal or collections activity required over the life of the loan.
Late fees are charged when a customer misses any scheduled payments to us and are calculated as a percentage of the outstanding balance for every day that the loan is late.
Under AASB 15, revenue is recognised when the performance obligation has been satisfied. Determining the timing of revenue recognition, at a point in time or over time, requires judgement.
The Group has determined that for servicing fees, revenue is recognised over time as the customer simultaneously receives and consumes the benefit. Late fees are recognised at a point In time, when the performance obligation has been satisfied.
There was no impact on the financial performance and position of the Group from the adoption of AASB 15.
Revenue recognitionRevenue is recognised at an amount that reflects the consideration to which the entity expects to be entitled in exchange for those goods or services.
Interest income
Interest income includes interest and loan origination fees. Interest income is recognised using the effective interest method in terms of AASB 9 Financial Instruments.
For
per
sona
l use
onl
y

84 Prospa Financial Statements
Other income
Other income includes fees not directly attributable to the origination of loans, including late fees and servicing fees. Late fees are recognised at a point in time, when the performance obligation has been satisfied, at the transaction price determined in the loan contract. Servicing fees are recognised over time as the Group fulfils its obligations under syndication agreements with syndication partners.
Bank interest consists of interest earned on bank deposits.
Transaction costs
Transaction costs and broker commissions directly attributable to the origination of loans are recognised using the effective interest method.
Effective interest method
The effective interest method is used for the recognition of interest on loans and loan origination fees reported together within interest income, and transaction costs and broker commissions directly attributable to the origination of a loan reported within transaction costs. Interest income and transaction costs together comprise the complete effective interest yield of the loan book. This is a method of calculating the amortised cost of a financial asset and allocating the interest income over the relevant period using the effective interest rate, which is the rate that exactly discounts estimated future cash receipts through the expected life of the financial asset to the net carrying amount of the financial asset.
Interest expenseDuring the year the Group’s business operations were funded by a combination of securitisation trust warehouse facilities, term facilities, corporate debt, convertible notes and cash on the balance sheet. Interest expense is recognised as it accrues using the effective interest rate method.
On listing with the Australian Securities Exchange on 11 June 2019, the convertible notes were settled and converted to issued capital. In addition, the proceeds from the listing were used to fully repay the corporate debt facility (redeemed through a cash payment of $17 million and conversion of a further $3 million of notes into issued capital).
Interest on the Group’s trust warehouse facilities and the term facilities is disclosed as funding cost.
Interest on the corporate debt facility and convertible note are at a fixed rate and are disclosed as interest on corporate debt. The unwinding of the discount on the embedded derivative over the course of its life is recorded in financial instruments: unwind of embedded derivative.
Income taxThe income tax expense or benefit for the period is the tax payable on that period’s taxable income based on the applicable income tax rate for each jurisdiction, adjusted by the changes in deferred tax assets and liabilities attributable to temporary differences, unused tax losses and the adjustment recognised for prior periods, where applicable.
Deferred tax assets are recognised for deductible temporary differences and unused tax losses only if it is probable that future taxable amounts will be available to utilise those temporary differences and losses.
The carrying amount of recognised and unrecognised deferred tax assets are reviewed at each reporting date. Deferred tax assets recognised are reduced to the extent that it is no longer probable that future taxable profits will be available for the carrying amount to be recovered. Previously unrecognised deferred tax assets are recognised to the extent that it is probable that there are future taxable profits available to recover the asset.
Deferred tax assets and liabilities are offset only where there is a legally enforceable right to offset current tax assets against current tax liabilities and deferred tax assets against deferred tax liabilities; and they relate to the same taxable authority on either the same taxable entity or different taxable entities which intend to settle simultaneously.
For
per
sona
l use
onl
y

Prospa Group Limited Annual Report 2019 85
Current and non-current classificationAssets and liabilities are presented in the statement of financial position based on current and non-current classification.
An asset is classified as current when: it is either expected to be realised or intended to be sold or consumed in the Group’s normal operating cycle; it is held primarily for the purpose of trading; it is expected to be realised within 12 months after the reporting period; or the asset is cash or cash equivalent unless restricted from being exchanged or used to settle a liability for at least 12 months after the reporting period. All other assets are classified as non-current.
A liability is classified as current when: it is either expected to be settled in the Group’s normal operating cycle; it is held primarily for the purpose of trading; it is due to be settled within 12 months after the reporting period; or there is no unconditional right to defer the settlement of the liability for at least 12 months after the reporting period. All other liabilities are classified as non-current.
Deferred tax assets and liabilities are always classified as non-current.
Cash and cash equivalentsCash and cash equivalents includes cash on hand, deposits held at call with financial institutions, other short-term, highly liquid investments with original maturities of three months or less that are readily convertible to known amounts of cash and which are subject to an insignificant risk of changes in value.
Loans and other receivablesLoan receivables are initially recognised at fair value and subsequently measured at amortised cost using the effective interest method, less any allowance for expected credit losses. The initial fair value of loan receivables includes capitalised origination fees net of capitalised transaction costs.
Collectability of loan receivables is reviewed on an ongoing basis. Debts which are known to be uncollectable are written off by reducing the carrying amount directly. The Group also carries an allowance for expected credit loss (2018: provision for impairment) of loan receivables equal to 6.05% (30 June 2018: 5.08%) of the total loan receivables. This percentage requires a degree of estimation and judgement. The percentage is determined by use of an expected credit loss model. The model considers the aging of receivables, historical collection rates, specific knowledge of the individual borrower’s financial liability and expected performance of the loan book.
Other receivables are recognised at amortised cost, less any allowance for expected credit losses.
Derivative financial instrumentsDerivatives are initially recognised at fair value on the date a derivative contract is entered into and are subsequently remeasured to their fair value at each reporting date. The accounting for subsequent changes in fair value depends on whether the derivative is designated as a hedging instrument, and if so, the nature of the item being hedged.
Derivatives are classified as current or non-current depending on the expected period of realisation.
Cash flow hedges
Cash flow hedges are used to cover the Group’s exposure to variability in cash flows that is attributable to particular risks associated with a recognised asset or liability or a firm commitment which could affect profit or loss. The effective portion of the gain or loss on the hedging instrument is recognised in other comprehensive income through the cash flow hedges reserve in equity, whilst the ineffective portion is recognised in profit or loss. Amounts taken to equity are transferred out of equity and included in the measurement of the hedged transaction when the forecast transaction occurs.
Cash flow hedges are tested for effectiveness on a regular basis prospectively to ensure that each hedge is highly effective and continues to be designated as a cash flow hedge. If the forecast transaction is no longer expected to occur, the amounts recognised in equity are transferred to profit or loss.
For
per
sona
l use
onl
y

86 Prospa Financial Statements
If the hedging instrument is sold, terminated, expires, is exercised without replacement or rollover, or if the hedge becomes ineffective and is no longer a designated hedge, the amounts previously recognised in equity remain in equity until the forecast transaction occurs.
Fair value hedges
Changes in the fair value of derivatives that are designated and qualify as fair value hedges are recognised in profit or loss immediately, together with any changes in the fair value of the hedged asset or liability that are attributable to the hedged risk. The change in the fair value of the hedging instrument and the change in the hedged item attributable to the hedged risk are recognised in profit or loss in the line item relating to the hedged item.
Hedge accounting is discontinued when the hedging instrument expires or is sold, terminated, or exercised, or when the hedging relationship no longer meets the qualifying criteria. The fair value adjustment to the carrying amount of the hedged item arising from the hedged risk is amortised to profit or loss from that date.
The Group holds derivative financial instruments as part of its risk management activities, the main purpose being to hedge its interest rate risk exposures. Further details of derivative financial instruments are disclosed in Note 16.
Property, plant and equipmentPlant and equipment is stated at historical cost less accumulated depreciation and impairment. Historical cost includes expenditure that is directly attributable to the acquisition of the items.
Depreciation is calculated on a straight-line basis to write off the net cost of each item of property, plant and equipment (excluding land) over their expected useful lives as follows:
Plant and equipment 3-5 years
The residual values, useful lives and depreciation methods are reviewed, and adjusted if appropriate, at each reporting date.
An item of property, plant and equipment is derecognised upon disposal or when there is no future economic benefit to the Group. Gains and losses between the carrying amount and the disposal proceeds are taken to profit or loss. Any revaluation surplus reserve relating to the item disposed of is transferred directly to retained profits.
Intangible assetsIntangible assets acquired are initially recognised at cost. Finite life intangible assets are subsequently measured at cost less amortisation and any impairment. The gains or losses recognised in profit or loss arising from the derecognition of intangible assets are measured as the difference between net disposal proceeds and the carrying amount of the intangible asset. The method and useful lives of finite life intangible assets are reviewed annually. Changes in the expected pattern of consumption or useful life are accounted for prospectively by changing the amortisation method or period.
Software & Website
Expenditure on acquiring and developing software and eligible website development costs have been capitalised and amortised on a straight-line basis over the period of their expected benefit. The intangible assets are amortised over their useful lives as follows:
Website 3 yearsSoftware (acquired) 5 yearsSoftware development (in-house) 5 years
LeasesThe determination of whether an arrangement is or contains a lease is based on the substance of the arrangement and requires an assessment of whether the fulfilment of the arrangement is dependent on the use of a specific asset or assets and the arrangement conveys a right to use the asset.
For
per
sona
l use
onl
y

Prospa Group Limited Annual Report 2019 87
A distinction is made between finance leases, which effectively transfer from the lessor to the lessee substantially all the risks and benefits incidental to ownership of leased assets, and operating leases, under which the lessor effectively retains substantially all such risks and benefits.
Finance leases are capitalised. A lease asset and liability are established at the fair value of the leased assets, or if lower, the present value of minimum lease payments. Lease payments are allocated between the principal component of the lease liability and the finance costs, so as to achieve a constant rate of interest on the remaining balance of the liability.
Leased assets acquired under a finance lease are depreciated over the asset’s useful life or over the shorter of the asset’s useful life and the lease term if there is no reasonable certainty that the Group will obtain ownership at the end of the lease term.
Operating lease payments, net of any incentives received from the lessor, are charged to profit or loss on a straight-line basis over the term of the lease.
Impairment of non-financial assetsOther non-financial assets are reviewed for impairment whenever events or changes in circumstances indicate that the carrying amount may not be recoverable. An impairment loss is recognised for the amount by which the asset’s carrying amount exceeds its recoverable amount.
Recoverable amount is the higher of an asset’s fair value less costs of disposal and value-in-use. The value-in-use is the present value of the estimated future cash flows relating to the asset using a pre-tax discount rate specific to the asset or cash-generating unit to which the asset belongs.
Trade and other payablesThese amounts represent liabilities for goods and services provided to the Group prior to the end of the financial year and which are unpaid. Due to their short-term nature they are measured at amortised cost and are not discounted. The amounts are unsecured and are usually paid within 30 days of recognition.
BorrowingsLoans and borrowings are initially recognised at the fair value of the consideration received, net of transaction costs. They are subsequently measured at amortised cost using the effective interest method.
Where there is an unconditional right to defer settlement of the liability for at least 12 months after the reporting date, the loans or borrowings are classified as non-current.
Other financial instrumentsFinancial assets and financial liabilities are recognised when the Group becomes a party to the contractual provisions of the instrument. Financial assets and financial liabilities are initially measured at fair value. Transaction costs that are directly attributable to the acquisition or issue of financial assets and financial liabilities (other than financial assets and financial liabilities at fair value through profit or loss) are added to or deducted from the fair value of the financial assets or financial liabilities, as appropriate, on initial recognition.
Finance costsFinance costs attributable to qualifying assets are capitalised as part of the asset. All other finance costs are expensed in the period in which they are incurred.
Employee benefits
Short-term employee benefits
Liabilities for wages and salaries, including non-monetary benefits, annual leave and long service leave expected to be settled wholly within 12 months of the reporting date are measured at the amounts expected to be paid when the liabilities are settled.
For
per
sona
l use
onl
y

88 Prospa Financial Statements
Other long-term employee benefits
The liability for annual leave and long service leave not expected to be settled within 12 months of the reporting date are measured at the present value of expected future payments to be made in respect of services provided by employees up to the reporting date using the projected unit credit method. Consideration is given to expected future wage and salary levels, experience of employee departures and periods of service. Expected future payments are discounted using market yields at the reporting date on high quality corporate bonds with terms to maturity that match the estimated future cash outflows.
Share-based payments
Equity-settled share-based compensation benefits are provided to employees.
Equity-settled transactions are awards of shares, or options over shares, that are provided to employees in exchange for the rendering of services.
The cost of equity-settled transactions are measured at fair value on grant date. Fair value is independently determined using either the Binomial or Black-Scholes option pricing model that takes into account the exercise price, the term of the option, the impact of dilution, the share price at grant date and expected price volatility of the underlying share, the expected dividend yield and the risk free interest rate for the term of the option. Judgements are also applied in relation to estimations of the number of options which are expected to vest, by reference to historic leaver rates and expected outcomes under relevant performance conditions.
The cost of equity-settled transactions are recognised as an expense with a corresponding increase in equity over the vesting period. The cumulative charge to profit or loss is calculated based on the grant date fair value of the award, the best estimate of the number of awards that are likely to vest and the expired portion of the vesting period. The amount recognised in profit or loss for the period is the cumulative amount calculated at each reporting date less amounts already recognised in previous periods.
Market conditions are taken into consideration in determining fair value. Therefore any awards subject to market conditions are considered to vest irrespective of whether or not that market condition has been met, provided all other conditions are satisfied.
Convertible notesOn listing with the Australian Securities Exchange on 11 June 2019, the convertible notes were settled and converted to equity. This non-cash financing activity resulted in an increase in equity of $76.8 million, as disclosed in Note 19. For the year ended 30 June 2018, the option to convert these notes was deemed to be an embedded derivative. The associated embedded derivative is recognised as a financial liability at fair value through profit or loss. The convertible notes are recognised in borrowings at amortised cost.
On initial recognition, the fair value of the embedded derivative is taken from the proceeds received to arrive at the value of the convertible notes. Subsequently, the fair value of the embedded derivative is measured at each reporting period until settlement. Fair value movements are recognised in the statement of profit or loss. The embedded derivative is unwound over the life of the convertible note.
Fair value measurementWhen an asset or liability, financial or non-financial, is measured at fair value for recognition or disclosure purposes, the fair value is based on the price that would be received to sell an asset or paid to transfer a liability in an orderly transaction between market participants at the measurement date; and assumes that the transaction will take place either: in the principal market; or in the absence of a principal market, in the most advantageous market.
Fair value is measured using the assumptions that market participants would use when pricing the asset or liability, assuming they act in their economic best interests. For non-financial assets, the fair value measurement is based on its highest and best use. Valuation techniques that are appropriate in the circumstances and for which sufficient data are available to measure fair value, are used, maximising the use of relevant observable inputs and minimising the use of unobservable inputs.
For
per
sona
l use
onl
y

Prospa Group Limited Annual Report 2019 89
Assets and liabilities measured at fair value are classified into three levels, using a fair value hierarchy that reflects the significance of the inputs used in making the measurements. Classifications are reviewed at each reporting date and transfers between levels are determined based on a reassessment of the lowest level of input that is significant to the fair value measurement.
For recurring and non-recurring fair value measurements, external valuers may be used when internal expertise is either not available or when the valuation is deemed to be significant. External valuers are selected based on market knowledge and reputation. Where there is a significant change in fair value of an asset or liability from one period to another, an analysis is undertaken, which includes a verification of the major inputs applied in the latest valuation and a comparison, where applicable, with external sources of data.
Warrants On listing with the Australian Securities Exchange on 11 June 2019, the warrant was settled and converted to equity. For the year ended 30 June 2018, warrants were recognised as financial liabilities at fair value. At each reporting date the fair value was measured with changes being recognised in the statement of profit or loss.
Issued capitalOrdinary shares are classified as equity.
Incremental costs directly attributable to the issue of new shares or options are shown in equity as a deduction, net of tax, from the proceeds.
Treasury sharesOwn equity instruments that are reacquired (treasury shares) are recognised at cost and deducted from equity. No gain or loss is recognised in profit or loss on the purchase, sale, issue or cancellation of the Group’s own equity instruments.
Earnings per share
Basic earnings per share
Basic earnings per share is calculated by dividing the profit attributable to the owners of Prospa, excluding any costs of servicing equity other than ordinary shares, by the weighted average number of ordinary shares outstanding during the financial year, adjusted for bonus elements in ordinary shares issued during the financial year.
Diluted earnings per share
Diluted earnings per share adjusts the figures used in the determination of basic earnings per share to take into account the after income tax effect of interest and other financing costs associated with dilutive potential ordinary shares and the weighted average number of shares assumed to have been issued for no consideration in relation to dilutive potential ordinary shares.
Goods and Services Tax (GST) and other similar taxesRevenues, expenses and assets are recognised net of the amount of associated GST, unless the GST incurred is not recoverable from the tax authority. In this case it is recognised as part of the cost of the acquisition of the asset or as part of the expense.
Receivables and payables are stated inclusive of the amount of GST receivable or payable. The net amount of GST recoverable from, or payable to, the tax authority is included in other receivables or other payables in the statement of financial position.
Cash flows are presented on a gross basis. The GST components of cash flows arising from investing or financing activities which are recoverable from, or payable to the tax authority, are presented as operating cash flows.
Commitments and contingencies are disclosed net of the amount of GST recoverable from, or payable to, the tax authority.
For
per
sona
l use
onl
y

90 Prospa Financial Statements
ReclassificationComparatives have been realigned to the current year presentation. There is no net effect on profit and net assets for the comparative period.
Rounding of amountsThe company is of a kind referred to in Corporations Instrument 2016/191, issued by the Australian Securities and Investments Commission, relating to ‘rounding-off’. Amounts in this report have been rounded off in accordance with that Corporations Instrument to the nearest thousand dollars, or in certain cases, the nearest dollar.
Change in estimatesThe Group changed the estimated useful life of the software development (in-house) from 7 years to 5 years in December 2018, resulting in an increased amortisation expense of $957,000 at that point.
New Accounting Standards and Interpretations not yet mandatory or early adoptedAustralian Accounting Standards and Interpretations that have recently been issued or amended but are not yet mandatory, have not been early adopted by the Group for the annual reporting period ended 30 June 2019. The Group’s assessment of the impact of these new or amended Accounting Standards and Interpretations, most relevant to the Group, are set out below.
AASB 16 Leases
This standard is applicable to annual reporting periods beginning on or after 1 January 2019. The standard replaces AASB 117 Leases and for lessees will eliminate the classifications of operating leases and finance leases.
Subject to exceptions, a ‘right-of-use’ asset will be capitalised in the statement of financial position, measured at the present value of the unavoidable future lease payments to be made over the lease term. The exceptions relate to short-term leases of 12 months or less and leases of low-value assets (such as personal computers and small office furniture) where an accounting policy choice exists whereby either a ‘right-of-use’ asset is recognised or lease payments are expensed to profit or loss as incurred.
A liability corresponding to the right-of-use asset will also be recognised, adjusted for lease prepayments, lease incentives received, initial direct costs incurred and an estimate of any future restoration, removal or dismantling costs.
Straight-line operating lease expense recognition will be replaced with a depreciation charge for the leased asset (included in operating costs) and an interest expense on the recognised lease liability (included in finance costs). In the earlier periods of the lease, the expenses associated with the lease under AASB 16 will be higher when compared to lease expenses under AASB 117. However EBITDA (Earnings Before Interest, Tax, Depreciation and Amortisation) results will be improved as the operating expense is replaced by interest expense and depreciation in profit or loss under AASB 16.
The Group will adopt this standard from 1 July 2019 and have provisionally assessed that net assets on transition will decrease by $1.4 million while profit before tax for the financial year ending 30 June 2020 will decrease by $0.3 million with an increase in EBITDA of $2.2 million.
AASB Interpretation 23 Uncertainty over Income Tax Treatment
Interpretation 23 clarifies the application of the recognition and measurement criteria in AASB 112 Income Taxes where there is uncertainty over income tax treatments, and requires an assessment of each uncertain tax position as to whether it is probable that a taxation authority will accept the position. Where it is not probable, the effect of the uncertainty will be reflected in determining the relevant taxable profit or loss, tax bases, unused tax losses and unused tax credits or tax rates. The amount will be determined as either the single most likely amount or the sum of the probability weighted amounts in a range of possible outcomes, whichever better predicts the resolution of the uncertainty. Judgements will be reassessed as and when new facts and circumstances are presented.
For
per
sona
l use
onl
y

Prospa Group Limited Annual Report 2019 91
Interpretation 23 will apply to the Group from 1 July 2019. The Group's existing recognition and accounting policies are aligned with the requirements of Interpretation 23 and hence no transition adjustment to retained earnings is expected.
2. Critical accounting judgements, estimates and assumptions
The preparation of the financial statements requires management to make judgements, estimates and assumptions that affect the reported amounts in the financial statements. Management continually evaluates its judgements and estimates in relation to assets, liabilities, contingent liabilities, revenue and expenses. Management bases its judgements, estimates and assumptions on historical experience and on other various factors, including expectations of future events, management believes to be reasonable under the circumstances. The resulting accounting judgements and estimates will seldom equal the related actual results. The judgements, estimates and assumptions that have a significant risk of causing a material adjustment to the carrying amounts of assets and liabilities (refer to the respective notes) within the next financial year are discussed below.
Share-based payment transactionsThe group measures the cost of equity-settled transactions with employees by reference to the fair value of the equity instruments at the date at which they are granted. The fair value is determined by using either the Black-Scholes model taking into account the terms and conditions upon which the instruments were granted. The accounting estimates and assumptions relating to equity-settled share-based payments would have no impact on the carrying amounts of assets and liabilities within the next annual reporting period but may impact profit or loss and equity.
Share-based payments are disclosed in note 36.
Allowance for expected credit lossesThe allowance for expected credit loss assessment requires a degree of estimation and judgement. It is based on the expected credit loss, within 12 months or over the lifetime, grouped based on days overdue, and makes assumptions to allocate an overall expected credit loss rate for each stage. These assumptions include recent loss experience, historical collection rates and estimates of economic overlay.
Allowance for expected credit losses are disclosed in note 11.
Fair value measurement hierarchyThe Group is required to classify all assets and liabilities, measured at fair value, using a three level hierarchy, based on the lowest level of input that is significant to the entire fair value measurement, being: Level 1: Quoted prices (unadjusted) in active markets for identical assets or liabilities that the entity can access at the measurement date; Level 2: Inputs other than quoted prices included within Level 1 that are observable for the asset or liability, either directly or indirectly; and Level 3: Unobservable inputs for the asset or liability. Considerable judgement is required to determine what is significant to fair value and therefore which category the asset or liability is placed in can be subjective.
The fair value of assets and liabilities classified as Level 3 is determined through the use of valuation models. These include discounted cash flow analysis or the use of observable inputs that require significant adjustments based on unobservable inputs.
The fair value measurement hierarchy is disclosed in note 24.
Estimation of useful lives of assetsThe Group determines the estimated useful lives and related depreciation and amortisation charges for its property, plant and equipment and finite life intangible assets. The useful lives could change significantly as a result of technical innovations or some other event. The depreciation and amortisation charge will increase where the useful lives are less than previously estimated lives, or technically obsolete or non-strategic assets that have been abandoned or sold will be written off or written down.
Depreciation and amortisation charges are disclosed in notes 12 and 13.
For
per
sona
l use
onl
y

92 Prospa Financial Statements
Income taxThe Group is subject to income taxes in the jurisdictions in which it operates. Significant judgement is required in determining the provision for income tax. There are many transactions and calculations undertaken during the ordinary course of business for which the ultimate tax determination is uncertain. The Group recognises liabilities for anticipated tax audit issues based on the Group’s current understanding of the tax law. Where the final tax outcome of these matters is different from the carrying amounts, such differences will impact the current and deferred tax provisions in the period in which such determination is made.
Income tax is disclosed in note 8.
Recovery of deferred tax assetsDeferred tax assets are recognised for deductible temporary differences only if the Group considers it is probable that future taxable amounts will be available to utilise those temporary differences and losses.
Deferred tax is disclosed in note 14.
Re-organisation reserve and Initial Public OfferingDuring the period the Group undertook an Initial Public Offering and group reorganisation. This included establishing a listed entity, Prospa Group Limited, which in management's judgement applied the reverse acquisition accounting principles of AASB 3 to the transaction, with the effect that Prospa Group Limited has assumed the position of the parent entity of the Group. Comparative financial information of Prospa Advance Pty Limited has been reported in accordance with AASB 3. A re-organisation reserve was created to align total equity with the net asset position of the Group.
Further information on the re-organisation reserve is disclosed in note 20.
3. Operating segments
The Group’s operations consist primarily of the provision of loans to small businesses in Australia and New Zealand. The Group has considered the requirements of AASB 8 Operating Segments and assessed that the Group has one operating segment, representing the consolidated results, as this is the only segment which meets the requirements of AASB 8.
4. Other income
Consolidated
30 June 2019$’000
30 June 2018$’000
Fee income 10,672 8,718
Bank interest 764 287
11,436 9,005
For
per
sona
l use
onl
y

Prospa Group Limited Annual Report 2019 93
5. Interest expense
The total interest expense, as calculated using the effective interest rate method, is set out below:
Consolidated
30 June 2019$’000
30 June 2018$’000
Funding costs 20,070 13,708
Interest on corporate debt 2,103 2,143
Financial instruments: Unwind of embedded derivative 4,357 718
26,530 16,569
6. Operating expenses
Operating expenses for the year were $128.7 million (June 2018: $91.7 million), of that employee expenses were $40.0 million (June 2018: $29.1 million). In the statement of profit or loss and other comprehensive income these employee expenses are included within the sales & marketing expense, the product development expense and the general and administration expense on a pro-rata basis. Initial Public Offering expenses were $8.6 million of which $6.2 million have been allocated and expensed in profit or loss by category based on function in the period and $2.4 million have been capitalised to equity as disclosed in Note 19.
7. Financial instruments
Through the course of 2017 and 2018, the Company received funding to support the continued growth of the business in the form of loan notes, convertible notes and warrants. In respect of the convertible notes and warrants, the conversion values of these financial instruments were referable to either the value at that prior point in time, or as a discount to future value at conversion. Upon listing on 11 June 2019 via an Initial Public Offering, a one-off fair value adjustment expense was recognised through the income statement ($12.4 million) which reflected the valuation uplift achieved by the Company relative to the fair value of these financial instruments measured at the last reporting date, in line with overall business growth.
Further, under AASB 9 Financial Instruments, financial instruments with convertibility may have embedded derivatives which are valued and recognised up front resulting in increased effective interest on the loan component of the convertible instrument (unwind of the embedded derivative value) over the course of the life of the instrument. This was applicable to some of the convertible notes on the Company’s balance sheet. Upon listing, the recognition of this effective interest continued up to the date of conversion, resulting in a one-off expense through the income statement ($4.4 million).
In respect of both the fair value movement and the increase in effective interest (unwind of the embedded derivative), these expenses are one-off associated with the Initial Public Offering and non-cash in nature.
For
per
sona
l use
onl
y

94 Prospa Financial Statements
8. Income tax
Consolidated
30 June 2019$’000
30 June 2018$’000
Income tax expense
Current tax 3,563 3,505
Deferred tax-origination and reversal of temporary differences (2,152) (2,639)
Adjustment recognised for prior periods 6 10
Aggregate income tax expense 1,417 876
Numerical reconciliation of income tax (benefit)/expense and tax at the statutory rate (loss)/profit before income tax expense (23,304) 2,970
Tax at the statutory tax rate of 30% (6,991) 891
Tax effect amounts which are not deductible/(taxable) in calculating taxable income:
Entertainment expenses 42 27
Share-based payments 991 181
Movement on financial instruments 5,039 –
Sundry items 58 285
Deferred tax adjustment – (518)
Foreign tax rate differential 36 –
Initial public offering costs 1,531 –
Research and development accounting 705 –
1,411 866
Adjustment recognised for prior periods 6 10
Income tax expense 1,417 876
Consolidated
30 June 2019$’000
30 June 2018$’000
Amounts credited directly to equity
Deferred tax assets (1,398) (45)
For
per
sona
l use
onl
y

Prospa Group Limited Annual Report 2019 95
9. Current assets – cash and cash equivalents
Consolidated
30 June 2019$’000
30 June 2018$’000
Cash at bank 69,839 34,397
Included in the cash at bank is a restricted cash balance of $40.8 million (June 2018: $20.3 million).
10. Current assets – loan receivables
Consolidated
30 June 2019$’000
30 June 2018$’000
Loan receivables 250,260 182,544
Less: Allowance for expected credit losses (30 June 2018: Provision for impairment)* (15,140) (9,265)
235,120 173,279
* The current period balance reflects the adoption of AASB 9. The expected credit loss relating to loan receivables under AASB 9 are recorded under the allowance for expected credit losses. As prior periods have not been restated in accordance with AASB 9, individually assessed provisions and collective provision for impairment in June 2018 remain in accordance with AASB 139 and are therefore recognised on a different basis.
11. Non-current assets – loan receivables
Consolidated
30 June 2019$’000
30 June 2018$’000
Loan receivables 154,053 90,446
Less: Allowance for expected credit losses (30 June 2018: Provision for impairment)* (9,320) (4,591)
144,733 85,855
* The current period balance reflects the adoption of AASB 9. Refer to note 10 for further details.
Allowance for expected credit lossesLoan receivables which are greater than 180 days past due and 30 days of consecutive non-payment (30 June 2018: 120 consecutive days of non-payment) were written off. This policy was updated from the beginning of the reporting period in conjunction with the implementation of AASB 9 and in order to better align with the operations of the business. The allowance for expected credit losses for loan receivables as a percentage of receivables has fallen from 6.78% of the gross receivables balance as at 1 July 2018 to 6.05% (30 June 2018 provision for impairment: 5.08%). The allowance for expected credit losses is based on expected performance of the loan book, which takes into account historical data and forward-looking indicators.
The remaining tables in this note apply to the full loan receivables balance (current and non-current).For
per
sona
l use
onl
y

96 Prospa Financial Statements
The following table summarises movements in the allowance for expected credit losses during the period:
30 June 2019$’000
30 June 2018$’000
Opening balance* 18,516 8,099
Provisions recognised during the year in the profit or loss 30,550 23,600
Receivables written-off during the year as bad debts (26,666) (18,560)
Recoveries 2,060 717
24,460 13,856
* The opening balance for the period ending 30 June 2019 is the carrying amount under AASB 9 at 1 July 2018.
The expected credit loss model takes into account three main parameters, which are probability of default, loss given default and the emergence period. Internally developed statistical models are applied to derive these parameters, based on historical portfolio information. The model generates provision levels required for each of Stage 1, Stage 2 and Stage 3, based on the expected loss for each of these segments of the portfolio. Macro-economic data and forward-looking indicators are incorporated through an economic overlay assumption which forms part of the overall loan impairment provision levels. Macro-economic factors taken into consideration include unemployment rate, interest rate, inflation, gross domestic product, commercial and residential property prices.
The following table summarises loan receivables by stages:
Stage 1$’000
Stages 2 and 3 $’000
Total$’000
30 June 2019
Loan receivables 373,290 31,023 404,313
Allowance for expected credit losses (7,878) (16,582) (24,460)
Net loan receivables 365,412 14,441 379,853
1 July 2018
Loan receivables 243,140 29,850 272,990
Allowance for expected credit losses* (4,271) (14,245) (18,516)
Net loan receivables 238,869 15,605 254,474
* Comparative balance for 2018 is the carrying amount under AASB 9 at 1 July 2018.
12. Non-current assets – property, plant and equipment
Consolidated
30 June 2019$’000
30 June 2018$’000
Plant and equipment – at cost 4,136 2,426
Less: Accumulated depreciation (1,782) (891)
2,354 1,535 For
per
sona
l use
onl
y

Prospa Group Limited Annual Report 2019 97
13. Non-current assets – intangible assets
Consolidated
30 June 2019$’000
30 June 2018$’000
Website – at cost 820 747
Less: Accumulated amortisation (615) (358)
205 389
Software acquired – at cost 394 394
Less: Accumulated amortisation (252) (176)
142 218
Software development (in-house) – at cost 10,207 6,702
Less: Accumulated amortisation (3,977) (1,626)
6,230 5,076
6,577 5,683
14. Non-current assets – deferred tax assets
Deferred tax asset comprises temporary differences attributable to:
Opening balance
(30 June 2018)
Adjustment on adoption of AASB 9 to
equity (1 July 2018)
Recognised in profit or loss
Closing balance
$’000(note 8)
$’000(note 8)
$’000 $’000
Employee benefits 921 – 237 1,158
Provision for impairment of loan receivables 4,157 1,398 1,763 7,318
Derivatives 22 – (22) –
Property, plant and equipment and intangibles 164 – 174 338
5,264 1,398 2,152 8,814
Deferred tax assets relating to temporary differences are recognised only to the extent that it is probable that future taxable profit will be available against which the benefits of the deferred tax asset can be utilised. The Group has generated taxable profits for the current and prior financial years, and after taking into account forecasts for future periods, this tax payable position is expected to be maintained. Management have therefore assessed that the deferred tax asset will continue to be utilised in future periods.
For
per
sona
l use
onl
y

98 Prospa Financial Statements
15. Current liabilities – borrowings
Consolidated
30 June 2019$’000
30 June 2018$’000
Convertible notes interest payable – 110
Corporate debt interest payable – 181
Securitisation trust notes 14,852 15,505
Interest payable on trusts 746 746
Unamortised costs on trusts (624) (46)
14,974 16,496
Corporate debtInterest on the corporate debt facility was at a fixed rate that was to mature in March 2022. This debt was settled and repaid on 14 June 2019.
Refer to note 23 for further information on financial risk management.
Refer to note 18 for further information on borrowings.
16. Current liabilities – other financial liabilities
Consolidated
30 June 2019$’000
30 June 2018$’000
Interest rate swap contracts – cash flow hedges – 161
Warrant – 1,744
Embedded derivative – 440
– 2,345
Refer to note 23 for further information on financial risk management.
Refer to note 24 for further information on fair value measurement.
The borrowings related to trusts, details of which can been seen in note 15 and note 18, are linked to a floating interest rate. To reduce the risk of changing interest rates associated with the borrowings, the Group entered into an interest rate swap contract (with a notional principal of $83.3 million, expired in May 2019) with an independent financial institution with a credit rating of A3 or higher at the time of preparing this financial statement. The Group also holds interest rate cap contracts with other independent financial institutions with credit rating of A3 or higher. The notional value of the interest rate caps are as follows:
Notional Value Maturity Date
$67.3 million February 2020
$12.2 million April 2021
$50.0 million May 2021
$75.0 million January 2021 For June 2018 the Group had a $2.0 million warrant which was related to the $20.0 million corporate debt facility. On Initial Public Offering this corporate debt facility was settled and repaid and the related warrant was converted to equity on receipt of the $2.0 million exchange price. It had a term of 7 years and was to mature on 6 March 2024. The put options provided downside protection to the warrant holder to provide a floor return of $2.0 million. It was exercisable at any point up until maturity.
For
per
sona
l use
onl
y

Prospa Group Limited Annual Report 2019 99
17. Current liabilities – GST provision
Consolidated
30 June 2019$’000
30 June 2018$’000
GST provision – 1,043
During the 2018 financial year management noted it had over-claimed GST. Management engaged with the tax authorities to rectify this position and the $1.0 million provision was the estimated cost of remediation. During the 2019 financial year this was fully paid and resolved.
18. Non-current liabilities – borrowings
The Group’s business operations are funded by a combination of securitisation trust notes (warehouse facilities and term facilities), cash and contributed equity.
Consolidated
30 June 2019$’000
30 June 2018$’000
Convertible notes payable – 14,750
Corporate debt – 18,767
Securitisation trust notes 297,923 206,430
Less: unamortised costs (1,375) (1,013)
296,548 238,934
Securitisation trust notesThe Group has five securitisation warehouses in place, as a part of its asset backed securitisation program, having commenced three during the period. The Group regularly sells its loan receivables to these securitisation trusts warehouses. The trusts are consolidated as the Group is:
(a) exposed to, or has rights to, variable equity returns in its capacity as the residual unit holder (or beneficiary as the case may be) of these trusts;
(b) in its capacity as the originator of loan receivables and the servicer of these loans on behalf of the trusts, has the ability to impact the variable equity returns; and
(c) the sole subscriber to the Seller Notes issued by the trusts. These Seller Notes go towards maintaining the minimum equity contribution/subordination buffer and funding non-conforming receivables. In addition to the Seller Notes, the Group’s asset backed securitisation program includes multiple classes of Notes including Class A, Class B and Class C Notes which carry a floating interest rate. The facilities under the program have different expiry dates ranging from April 2020 to December 2021.
Convertible notes payableIn January 2018, the Group issued 1,525 convertible notes with an aggregate principal amount of $15.3 million and in October 2018, the Group issued further 4,300 convertible notes with an aggregate principal amount of $43.3 million. Coupon interest accrued daily on the face value of the note at a fixed rate per annum.
Within the convertible notes was an embedded derivative that related to the conversion option that was available to the holders of the notes.
On listing with the Australian Securities Exchange on 11 June 2019, the convertible notes were settled and converted to equity.
Refer to note 19 for further details.
For
per
sona
l use
onl
y

100 Prospa Financial Statements
Assets pledged as securityThe carrying amounts of assets pledged as security for current and non-current borrowings as a result of the securitisation warehouses:
Consolidated
30 June 2019$’000
30 June 2018$’000
Loan receivables* 356,908 247,838
* The amount recognised above represents the carrying value of the customer receivables held by the Prospa Trusts and is net of provisions for bad debts and unearned future income. This excludes customer receivables totalling $23.1 million held by Prospa Advance Pty Ltd at 30 June 2019 and $11.3 million at 30 June 2018.
Financing arrangementsUnrestricted access was available at the reporting date to the following lines of credit:
Consolidated
30 June 2019$’000
30 June 2018$’000
Total facilities
Securitisation trusts 389,470 274,500
Corporate debt – 20,000
389,470 294,500
Used at the reporting date
Securitisation trusts 312,775 222,000
Corporate debt – 20,000
312,775 242,000
Unused at the reporting date
Securitisation trusts 76,695 52,500
Corporate debt – –
76,695 52,500
19. Equity – issued capital
Consolidated
30 June 2019Shares
30 June 2018Shares
30 June 2019$’000
30 June 2018$’000
Ordinary shares – fully paid 160,514,164 21,712,630 609,975 –
Preference shares – fully paid – 15,645,067 – 36,149
Treasury shares – fully paid 836,273 2,099,707 – –
161,350,437 39,457,404 609,975 36,149
For
per
sona
l use
onl
y

Prospa Group Limited Annual Report 2019 101
Movements in ordinary share capital
Details Date Shares Issue price $’000
Balance 1 July 2017 21,712,630 –
Balance 30 June 2018 21,712,630 –
Conversion of options** December 2018 3,333 $2.00 7
Conversion of options June 2019 36,247 $1.56 57
Conversion of options June 2019 27,480 $0.49 13
Conversion of convertible notes** June 2019 6,505,580 $11.34 73,773
Conversion PFG convertible notes** June 2019 558,968 $5.36 3,000
Conversion of warrant** June 2019 372,648 $11.34 4,226
Conversion of preference shares** June 2019 15,645,067 $2.31 36,149
Conversion of management performance shares** June 2019 1,500,000 $0.35 523
Treasury shares converted to ordinary shares** June 2019 1,769,464 $0.00 –
Share split* June 2019 96,135,380 $0.00 –
Shares issued - initial public offering June 2019 15,476,191 $3.78 58,500
Shares issued to employees June 2019 441,176 $3.40 1,500
Transaction costs arising on IPO eligible for offset against share capital June 2019 – $0.00 (2,414)
Share capital restructure on IPO June 2019 – $0.00 432,968
IPO grants to management June 2019 330,000 $3.78 1,247
Proceeds from loan shares June 2019 – $0.00 426
Balance 30 June 2019 160,514,164 609,975
* On 11 June 2019, the shareholders of Prospa Group Limited approved a three-for-one share split.** These balances are prior to the three-for-one split.
Movements in preference share capital
Details Date Shares Issue price $’000
Balance 1 July 2017 15,645,067 36,149
Balance 30 June 2018 15,645,067 36,149
Conversion into ordinary shares (15,645,067) $2.31 (36,149)
Balance 30 June 2019 – –
For
per
sona
l use
onl
y

102 Prospa Financial Statements
Movements in treasury share capital
Details Date Shares
Balance 1 July 2017 2,099,707
Balance 30 June 2018 2,099,707
Management buy-back* December 2018 (130,243)
Conversion of options* December 2018 3,333
Treasury shares converted to ordinary shares* June 2019 (1,772,797)
Issuance of treasury shares* June 2019 100,000
Share split (3-for-1) June 2019 600,000
Conversion of options June 2019 (36,247)
Conversion of options June 2019 (27,480)
Balance 30 June 2019 836,273
* These balances are prior to the three-for-one split.
Ordinary sharesOrdinary shares entitle the holder to participate in dividends and the proceeds on the winding up of the company in proportion to the number of and amounts paid on the shares held. The fully paid ordinary shares have no par value and the company does not have a limited amount of authorised capital.
Every member present at a meeting in person or by proxy shall have one vote and upon a poll each share shall have one vote.
Preference sharesPreference shares rank in almost all respects equally with the ordinary shares in the share capital of the company and entitle the holder to participate in dividends and carry substantially the same voting rights as applied to the ordinary shares in the company. Upon Initial Public Offering, preference shares were converted into ordinary shares on the basis of one ordinary share for every preference share. This non-cash financing activity resulted in an increase in ordinary share capital of $36.1 million, as disclosed above.
Treasury sharesThe treasury shares mentioned above reflect shares that were issued in relation to the employee long-term incentive plan.
Share buy-backThere is no current on-market share buy-back.
20. Equity – reserves
Consolidated
30 June 2019$’000
30 June 2018$’000
Foreign currency reserve 14 –
Cash flow hedge reserve – (104)
Share option reserve 1,542 1,200
Re-organisation reserve (432,968) –
(431,412) 1,096
For
per
sona
l use
onl
y

Prospa Group Limited Annual Report 2019 103
Cash flow hedge reserve The reserve is used to recognise the effective portion of the gain or loss of cash flow hedge instruments that is determined to be an effective hedge. In May 2019 the interest rate swap expired and therefore there is no longer an effective portion to be recognised in the cash flow hedge reserve.
Share option reserveThe reserve is used to recognise the value of equity benefits provided to employees and Directors as part of their remuneration, and other parties as part of their compensation for services. In the current year there was a capital buy-back, being the repurchase of loan shares and options held by certain employees of the Group to the value of $1.3 million.
Re-organisation reserveAs part of the Initial Public Offering, the listing entity, Prospa Group Limited was established which resulted in accounting for the group reorganisation in accordance with AASB 3 reverse acquisition accounting principles. On IPO there was a restructure of the Group which was accounted for at book value. On this basis the assets and liabilities reflected their carrying value in Prospa Advance Pty Ltd. The retained earnings and other equity balances also remained at their existing balances. The amount recognised as issued capital in the Group reflected the impact of the restructure and the capital reorganisation, and thereby the market capitalisation of the Group at the date of offer (less costs that are offset against issued capital). An offsetting capital re-organisation reserve was created to align total equity with the net asset position of the Group.
Movements in reservesMovements in each class of reserve during the current and previous financial year are set out below:
Consolidated Foreign currency
translation reserve
$’000
Re-organisation
reserve$’000
Cash flow hedge
reserve$’000
Share option
reserve$’000
Total$’000
Balance at 1 July 2017 – – – 596 596
Deferred tax – – 45 – 45
Fair value changes in cash flow hedges – – (149) – (149)
Share based payments expense – – – 604 604
Balance at 30 June 2018 – – (104) 1,200 1,096
Foreign currency translation 14 – – – 14
Share-based payments – – – 1,626 1,626
Capital buy-back – – – (1,284) (1,284)
Expiry of interest rate cap – – 104 – 104
Group re-organisation – (432,968) – – (432,968)
Balance at 30 June 2019 14 (432,968) – 1,542 (431,412)
(Loss)/gain arising on interest rate swap
Total hedging (loss)
recognised in OCI
$’000
Ineffective-ness
recognised in profit or loss
$’000
Consolidated
30 June 2018
Interest rate swaps (149) 38
For
per
sona
l use
onl
y

104 Prospa Financial Statements
21. Equity – accumulated losses
Consolidated
30 June 2019$’000
30 June 2018$’000
Accumulated losses at the beginning of the financial year (560) (2,654)
Adjustment on adoption of AASB 9 (3,262) –
Accumulated losses at the beginning of the financial year - restated (3,822) (2,654)
(Loss)/profit after income tax expense for the year (24,721) 2,094
Accumulated losses at the end of the financial year (28,543) (560)
22. Equity – dividends
There were no dividends paid, recommended or declared during the current or previous financial year.
23. Financial risk management
Financial risk management objectivesThe Group’s activities expose it to a variety of financial risks, primarily market risk (including price risk, foreign currency risk and interest rate risk), credit risk and liquidity risk. The Group’s risk management program focuses on understanding drivers of financial risk and seeks to minimise potential adverse effects on financial performance of the Group. The Group does not enter into or trade financial instruments, including derivative financial instruments, for speculative purposes.
The Board have overall responsibility for the establishment and oversight of the risk management framework. The Board is responsible for developing and monitoring risk management policies. Risk management procedures are established by the Board and carried out by management to identify and analyse the risks faced by the Group and to set controls and monitor risks.
These are discussed individually below.
Market riskMarket risk is the risk that changes in market prices such as interest rates that will affect the Group’s income or the value of holdings in its financial instruments. The objective of market risk management is to manage and control market risk exposures within acceptable parameters, while optimising the return.
Interest rate risk
The Group is exposed to interest rate risk because the Group borrows funds at both fixed and floating interest rates. Details of the Groups borrowing facilities are set out in Note 15 and 18. The interest payable under the Trusts is linked to the benchmark rate, being the Bank Bill Swap Rate (BBSW) or the Bank Bill Swap Bid Rate (BBSY), both variable floating interest rate benchmarks. The risk is managed by the Group by the use of an interest rate swap contract (interest rate swap expired in May 2019) and an interest rate cap contract. Hedging activities are evaluated regularly to align with interest rate views and defined risk appetite, ensuring the most cost-effective hedging strategies are applied. Details of these are set out in Note 16.
Interest rate sensitivity analysis
The sensitivity analyses below have been determined based on the exposure to interest rates for both derivatives and non-derivative instruments at the end of the reporting period. For floating rate liabilities, the analysis is prepared assuming the amount of the liability outstanding at the end of the reporting period was outstanding for the whole year. A 25 basis point increase or decrease is used when reporting interest rate risk internally to key management personnel and represents management’s assessment of the reasonably possible change in interest rates.
For
per
sona
l use
onl
y

Prospa Group Limited Annual Report 2019 105
If interest rates had been 25 basis points higher/lower and all other variables were held constant, the Group’s profit for the year ended 30 June 2019 would decrease/increase by $781,938 (2018: decrease/increase by $554,836). This is mainly attributable to the Group’s exposure to interest rates on its variable rate borrowings.
Foreign currency risk
The Group pays certain overseas suppliers in foreign currency and is exposed to foreign currency risk through foreign exchange rate fluctuations. However, payments made in foreign currency are not of a significant value to have a material impact on the Group’s result.
Capital management
For the purpose of the Group’s capital management, capital includes issued capital and all other equity reserves attributable to the equity holder of the parent entity. The Group’s objective is to maintain a strong capital base so as to foster the support of its investors, funders and other business partners, and enable the future growth initiatives of the Group. The Board reviews these objectives periodically. There were no changes to the Group’s approach to capital management in the period.
Credit riskCredit risk is the risk of financial loss to the Group if a customer or counterparty to a financial instrument fails to meet its contractual obligations. Credit risk for the Group is concentrated in loan receivables.
The Group provides short term loans to the small business market and applies a strict credit policy. Loan receivable balances are closely monitored on an ongoing basis. The Group establishes an allowance for loan impairment that represents its estimate of expected future losses in respect of loan receivables.
The Group uses a general approach expected credit loss model to calculate expected credit losses for loan receivables. The provision rates are based on days past due. It is the Group’s policy to measure expected credit loss on loan receivables on a 12-month basis (i.e. Expected Credit Loss model Stage 1). The Group incorporates forward-looking information, including forecast economic conditions that are expected to deteriorate the credit quality of loans over the next year, through an economic overlay assumption which increases the overall provision.
Where there has been a significant increase in the credit risk of a loan receivable since origination, the allowance will be based on the lifetime expected credit loss. The Group uses a rebuttable presumption that a significant deterioration in credit risk exists when contractual payments are more than 30 days past due (i.e. Expected Credit Loss model Stage 2).
Where there has been objective evidence of impairment for a loan receivable, the allowance will be based on lifetime expected credit loss. In certain cases, a loan receivable will be considered in default when internal or external information indicate that the Group is unlikely to receive the outstanding contractual amount in full (i.e. Expected Credit Loss model Stage 3). A loan receivable is written off when there is no reasonable expectation of recovering the contractual cash flows.
The portfolio of receivables to which the Group is exposed is well diversified across industries, geographies and customers and therefore, the Group does not have any material credit risk exposure to any single debtor or Group of debtors under the financial instrument contracts entered into by the Group.
With respect to credit risk arising from the financial assets of the Group, comprised of cash and cash equivalents and loan receivables, the Group’s maximum exposure to credit risk, excluding the value of any collateral or other security at balance sheet date is the carrying amount as disclosed in the statement of financial position and notes to the financial statements. The Group’s credit risk on liquid funds is limited as the counter parties are major Australian banks with favourable credit ratings assigned by international credit rating agencies.
For
per
sona
l use
onl
y

106 Prospa Financial Statements
A metric used by management when assessing the performance of loan receivables and overall portfolio health is their ageing, split by what is over or under 90 days past due. The following table summarises this ageing of the loan receivables:
Consolidated
30 June 2019$’000
30 June 2018$’000
Loan receivables aged 90 days and under 379,915 255,437
Loan receivables aged over 90 days 24,398 17,553
404,313 272,990
Liquidity riskLiquidity risk is the risk that the Group will not be able to meet its financial obligations as they fall due. The Group has a diversified funding model and currently comprises of a mix of securitisation warehouse facilities, equity and balance sheet cash.
The Group manages operational liquidity risk by maintaining cash reserves and available borrowing facilities and by continuously monitoring actual and forecast cash flows. The Group seeks to have sufficient liquidity to meet its liabilities when due, under both normal and stressed conditions.
Remaining contractual maturities
The following tables detail the Group’s remaining contractual maturity for its financial instrument liabilities. The tables have been drawn up based on the undiscounted cash flows of financial liabilities based on the earliest date on which the financial liabilities are required to be paid. The tables include both interest and principal cash flows disclosed as remaining contractual maturities and therefore these totals may differ from their carrying amount in the statement of financial position.
Consolidated – 30 June 2019
1 year or less$’000
Between 1 and 3 years
$’000
Remaining contractual
maturities$’000
Non-derivatives
Non-interest bearing
Trade and other payables 6,687 – 6,687
Interest-bearing
Borrowings 14,974 296,548 311,522
Total non-derivatives 21,661 296,548 318,209
For
per
sona
l use
onl
y

Prospa Group Limited Annual Report 2019 107
Consolidated – 30 June 2018
1 year or less$’000
Between 1 and 3 years
$’000
Remaining contractual
maturities$’000
Non-derivatives
Non-interest bearing
Trade and other payables 7,139 – 7,139
Interest-bearing
Borrowings 16,496 238,934 255,430
Total non-derivatives 23,635 238,934 262,569
Derivatives
Interest rate swaps outflow 161 – 161
Embedded derivative 440 – 440
Warrant 1,744 – 1,744
Total derivatives 2,345 – 2,345
The cash flows in the maturity analysis above are not expected to occur significantly earlier than contractually disclosed above.
Fair value of financial instrumentsThe fair values of financial assets and liabilities, together with their carrying amounts in the statement of financial position, for the Group are as follows:
30 June 2019 30 June 2018
Consolidated
Carrying amount
$’000Fair value
$’000
Carrying amount
$’000Fair value
$’000
Assets
Cash at bank 69,839 69,839 34,397 34,397
Loan receivables 379,853 379,853 259,134 259,134
449,692 449,692 293,531 293,531
Liabilities
Trade and other payables 6,687 6,687 7,139 7,139
Borrowings 311,522 311,522 255,430 255,430
318,209 318,209 262,569 262,569
CovenantsThe Group has various financial and non-financial covenants under its financing facilities that can affect matters such as funding availability, repayments and the liabilities of the Group. Receivables funded within the senior facilities are tested at each drawdown for compliance with these covenants. If the Group’s operating results deteriorate, including incurring significant losses, the Group may be unable to meet the covenants governing its indebtedness, which may require the Group to seek amendments, waivers of covenant compliance or alternative borrowing arrangements, or to reduce debt or raise additional equity.
For
per
sona
l use
onl
y

108 Prospa Financial Statements
24. Fair value measurement
Fair value hierarchyThe following tables detail the Group’s assets and liabilities, measured or disclosed at fair value, using a three-level hierarchy, based on the lowest level of input that is significant to the entire fair value measurement, being:
– Level 1: Quoted prices (unadjusted) in active markets for identical assets or liabilities that the entity can access at the measurement date
– Level 2: Inputs other than quoted prices included within Level 1 that are observable for the asset or liability, either directly or indirectly
– Level 3: Unobservable inputs for the asset or liability
Consolidated – 30 June 2019
Level 1$’000
Level 2$’000
Level 3$’000
Total$’000
Assets
Loan receivables – 379,853 – 379,853
Interest rate cap – 130 – 130
Total assets – 379,983 – 379,983
Liabilities
Borrowings – 311,522 – 311,522
Total liabilities – 311,522 – 311,522
Consolidated – 30 June 2018
Level 1$’000
Level 2$’000
Level 3$’000
Total$’000
Assets
Loan receivables – 259,134 – 259,134
Interest rate cap – 11 – 11
Interest rate swap – 27 – 27
Total assets – 259,172 – 259,172
Liabilities
Borrowings – 255,430 – 255,430
Interest rate swap – 161 – 161
Embedded derivative – – 440 440
Warrant – – 1,744 1,744
Total liabilities – 255,591 2,184 257,775
There were no transfers between levels during the financial year.
The Group has considered all financial assets and liabilities not carried at fair value to determine whether the carrying value is an accurate reflection of fair value. The Directors consider that due to the short-term nature and/or the variable rate arrangement of the borrowings, the carrying amounts of financial assets and financial liabilities, which include cash, client receivables, payables and borrowings, are assumed to approximate their fair values.
For
per
sona
l use
onl
y

Prospa Group Limited Annual Report 2019 109
Valuation techniques for fair value measurements categorised within Level 2 and Level 3
Interest rate swap and cap derivative
A discounted cash flow model is used to determine fair value of derivative instruments. Future cash flows are estimated based on forward interest rates (from observable yield curves at the end of the reporting period) and contract interest rates, discounted at a rate that reflects the credit risk of various counterparties.
Warrants
To value the warrant a probability weighted scenario analysis has been employed, based on expected timing of trigger events and whether the warrant is expected to be in or out of the money.
Embedded derivatives
The valuation of the option value of the convertible note is established using the Black-Scholes methodology.
Level 3 assets and liabilities
Movements in Level 3 assets and liabilities during the current and previous financial year are set out below:
Consolidated
Warrants$’000
Embedded derivative
$’000Total$’000
Balance at 1 July 2017 1,631 – 1,631
Additions - on issuance of convertible notes – 710 710
Warrant gain on fair value adjustment 113 – 113
Embedded derivative (loss) on fair value adjustment – (270) (270)
Balance at 30 June 2018 1,744 440 2,184
Additions - on issuance of convertible notes – 7,773 7,773
Disposals - convertible notes were settled with the issue of 6,505,580 shares in Prospa Advance Pty Limited* – (8,213) (8,213)
Disposals - warrant was settled with the issue of 372,648 preference shares in Prospa Advance Pty Limited* (1,744) – (1,744)
Balance at 30 June 2019 – – –
Total gains/(losses) for the previous year included in profit or loss that relate to level 3 assets held at the end of the previous year 113 (270) (157)
Total losses for the current year included in profit or loss that relate to level 3 assets held at the end of the current year (987) (4,308) (5,295)
* On Initial Public Offering these shares were transferred to Prospa Group Limited in exchange for ordinary shares.
For
per
sona
l use
onl
y

110 Prospa Financial Statements
25. Key management personnel
Key management personnel are those persons having authority and responsibility for planning, directing and controlling the activities of the entity, directly or indirectly, including any Director (whether executive or otherwise) of that entity.
The remuneration of Directors and other members of key management during the year were as follows:
Consolidated
30 June 2019$’000
30 June 2018$’000
Salaries and other short-term employee benefits 2,089 1,312
Post-employment benefits 82 108
Other long-term benefits 35 41
Share-based payment 332 17
2,538 1,478
26. Remuneration of auditors
During the financial year the following fees were paid or payable for services provided by Deloitte, the auditor of the Company:
Consolidated
30 June 2019$’000
30 June 2018$’000
Audit services – Deloitte
Audit or review of the financial statements 408,573 306,098
Other services – Deloitte
Tax services 75,290 57,789
IPO due diligence and tax structuring 759,880 1,041,775
835,170 1,099,564
1,243,743 1,405,662
27. Contingent liabilities
The Group had no contingent liabilities as at 30 June 2019 and 30 June 2018.
For
per
sona
l use
onl
y

Prospa Group Limited Annual Report 2019 111
28. Commitments
The following table summarises the operating lease commitments of the Group:
Consolidated
30 June 2019$’000
30 June 2018$’000
Operating lease commitments – land and buildings
Committed at the reporting date but not recognised as liabilities, payable:
Within one year 2,248 1,449
One to five years 3,301 1,017
Total minimum lease payments – land & buildings 5,549 2,466
Operating lease commitments – computer equipment
Committed at the reporting date and recognised as liabilities, payable:
Within one year 338 248
One to five years 305 268
Total minimum lease payments – computer equipment 643 516
– –
643 516
29. Related party transactions
Parent entity
Prospa Group Limited is the parent entity.
Subsidiaries
Interests in subsidiaries are set out in note 31.
Key management personnel
One of the Key Management Personnel is party to a pre-IPO loan agreement with Prospa Advance Pty Ltd for the purchase of loan shares under a Long Term Incentive plan holding 1,073,796 loan shares with a total loan value of $524,370. These loan shares vested in September 2018 and are disclosed in the Remuneration Report.
Further disclosures relating to key management personnel are set out in note 25 and the Remuneration Report included in the Directors’ Report.
For
per
sona
l use
onl
y

112 Prospa Financial Statements
Transactions with related parties
Some of the Directors had participated in the $20 million corporate debt facility that was held by Prospa Advance Pty Ltd. These were repaid with the proceeds from the Initial Public Offering of the entity. The total exposure of this participation was $2.2 million of the $20 million that had been provided to the Company. The terms of the participation were on an arm’s length basis and consistent with other investors in the facility.
In addition, attached to this corporate debt facility was a $2 million warrant that some of the Directors had participated in. This was also repaid with the proceeds from the Initial Public Offering of the entity. The total exposure of the participation was $215,000. The terms of this participation were on an arm’s length basis and consistent with other investors in the facility.
Pre-Initial Public Offering there was a $15.3 million convertible note that some of the Directors of the Group had participated in that was held by Prospa Advance Pty Ltd. The total exposure of this participation was $650,000 of the $15.3 million provided to the Company.
In addition, there was a second convertible note issued in October 2018 for $43.3 million that one of the Directors of the Group had participated in also held by Prospa Advance Pty Ltd. The total exposure of this participation was $150,000 of the $43.3 million provided to the Company.
The terms of these participations were on an arm’s length basis and consistent with other investors in the facility. This has been repaid with the proceeds from the Initial Public Offering of the entity.
30. Parent entity information
Set out below is the supplementary information about the parent entity.
Statement of profit or loss and other comprehensive income
Parent
30 June 2019$’000
30 June 2018$’000
Loss after income tax (4,169) (552)
Total comprehensive loss (4,169) (656)
For
per
sona
l use
onl
y

Prospa Group Limited Annual Report 2019 113
Statement of financial position
Parent
30 June 2019$’000
30 June 2018$’000
Total current assets 170,964 49,844
Total assets 173,562 78,982
Total current liabilities 724 26,882
Total liabilities 724 46,757
Equity
Issued capital 609,975 36,149
Cash flow hedge reserve – (104)
Share option reserve – 1,200
Re-organisation reserve (432,968) –
Accumulated losses (4,169) (5,020)
Total equity 172,838 32,225
On 11 June 2019, Prospa Group Limited became the parent entity as part of the restructure of the Group due to the Initial Public Offering. Prior to this Prospa Advance Pty Ltd was the parent. Therefore, the comparative figures as stated above are for Prospa Advance Pty Ltd.
Contingent liabilities
The parent entity had no contingent liabilities as at 30 June 2019 and 30 June 2018.
Capital commitments – Property, plant and equipment
The parent entity had no capital commitments for property, plant and equipment as at 30 June 2019 and 30 June 2018.
Significant accounting policies
The accounting policies of the parent entity are consistent with those of the Group, as disclosed in note 1.
For
per
sona
l use
onl
y

114 Prospa Financial Statements
31. Interests in subsidiaries and trusts
The consolidated financial statements incorporate the assets, liabilities and results of the following subsidiaries and trusts in accordance with the accounting policy described in note 1:
Ownership interest
NamePrincipal place of business / Country of incorporation
30 June 2019%
30 June 2018%
Prospa Advance Pty Ltd Australia 100% 100%
Prospa Trust Series 2015-1 Security Trust** Australia 100% 100%
Prospa Trust Series 2018-1 Security Trust** Australia 100% 100%
Prospa Trust Series 2018-2 Security Trust** Australia 100% –
Prospa Trust Series Pioneer Security Trust** Australia 100% –
Prospa Trust Series Prosparity Security Trust**
Australia 100% –
Prospa Finance Pty Ltd Australia 100% 100%
Prospa Innovations Pty Ltd* Australia 100% 100%
Prospatarian Pty Ltd* Australia 100% 100%
Prospa NZ Limited* New Zealand 100% 100%
* Ownership is through Prospa Advance Pty Ltd.** Ownership is through Prospa Advance Pty Ltd, which is both the Participation Unitholder and Residual Unitholder of the trusts.
32. Deed of cross guarantee
During the year the parent entity, Prospa Group Limited and the following entities entered into a deed of cross guarantee under which each company guarantees the debts of the others:
Prospa Advance Pty Ltd
Prospa Innovations Pty Ltd
Prospa Finance Pty Ltd
Prospatarian Pty Ltd
By entering into the deed, the wholly-owned entities have been relieved from the requirement to prepare financial statements and Directors’ Report under Corporations Instrument 2016/785 issued by the Australian Securities and Investments Commission.
The effect of the Deed is that the Company guarantees to each creditor payment in full of any debt in the event of winding up of any of the subsidiaries under certain provisions of the Corporations Act 2001.
As all entities are a party to the deed or are fully controlled by an entity that is a party to the deed the income statement and balance sheet information of the combined class-ordered group is equivalent to the consolidated information presented in this financial report.
For
per
sona
l use
onl
y

Prospa Group Limited Annual Report 2019 115
33. Events after the reporting period
On 8 August 2019, the Company announced the establishment of a New Zealand funding structure to fund the ongoing rapid growth of the New Zealand portfolio, anchored by a three year committed facility for NZ$45 million. The facility will fund the class B notes in the warehouse structure, laying the foundation for attracting high quality class A note investors.
No other matter or circumstance has arisen since 30 June 2019 that has significantly affected, or may significantly affect the Group’s operations, the results of those operations, or the Group’s state of affairs in future financial years.
34. Reconciliation of (loss)/profit after income tax to net cash from operating activities
Consolidated
30 June 2019$’000
30 June 2018$’000
(Loss)/profit after income tax expense for the year (24,721) 2,094
Adjustments for:
Depreciation and amortisation 3,639 1,725
Share-based payments 2,869 604
Foreign exchange differences 26 –
Tax on amounts through equity – 45
Origination fees 2,644 2,348
Purchase of options 434 –
Loan impairment expense 30,550 24,317
Promotion interest adjustment (2,756) (3,874)
Interest accrued as part of borrowings 3,225 716
Outstanding late fees (4,075) (3,698)
Financial instruments: Fair value loss 12,439 –
Change in operating assets and liabilities:
(Increase) in prepayments and other receivables (517) (2,405)
(Increase) in other financial assets – (38)
(Increase) in deferred tax assets (2,152) (2,684)
Increase in trade and other payables and employee benefits 394 5,029
(Decrease)/increase in current tax liability (5,137) 3,226
Net cash from operating activities 16,862 27,405
For
per
sona
l use
onl
y

116 Prospa Financial Statements
35. Earnings per share
Consolidated
30 June 2019$’000
30 June 2018$’000
(Loss)/profit after income tax attributable to the owners of Prospa Group Limited (24,721) 2,094
Number Number
Weighted average number of ordinary shares used in calculating basic earnings per share 114,727,396 37,357,697
Adjustments for calculation of diluted earnings per share:
Options and warrants – 903,850
Convertible notes – 2,250,639
Weighted average number of ordinary shares used in calculating diluted earnings per share 114,727,396 40,512,186
Cents Cents
Basic (loss)/earnings per share (21.55) 5.61
Diluted (loss)/earnings per share (21.55) 5.17
For June 2018, preference shares were included in the weighted average number of shares used for the basic earnings per share calculation as preference shares ranked in almost all respects equally with the ordinary shares in the share capital of the Group. Preference shares entitle the holder to participate in dividends and carry substantially the same voting rights as applied to the ordinary shares in the Group.
As of June 2019 these preference shares have been converted to ordinary shares as part of the Initial Public Offering.
36. Share-based payments
The employee long-term incentive plan (LTIP) enables the Group to offer eligible employees options to subscribe for shares or loan shares in the Company. Loan shares involve the purchase of shares in the Company by certain employees, funded by loans from the Company. The LTIP is designed to incentivise performance. No shares have been forfeited in the financial year. During the year 67,060 options were exercised and converted to shares to the value of $76,677.
In addition, there was a repurchase of loan shares and options held by certain employees by the Group to the value of $1,284,000.
The LTIP requires the holder to remain in full-time employment of the Group until the exercise date. There are a number of key performance indicators covering both financial and non-financial measures.
Total expense arising from share-based payment transactions recognised during the financial year was $1,626,438 (30 June 2018: $603,567).
For
per
sona
l use
onl
y

Prospa Group Limited Annual Report 2019 117
The table below shows the number and weighted average exercise price (WAEP) of, and movement in, share options during the year:
2019Number
2019WAEP (cent)
2018Number*
2018WAEP (cent)*
Outstanding at 1 July 5,659,906 138 700,635 201
Granted during the year 7,584,039 364 1,306,000 508
Forfeited during the year (911,052) 134 (120,000) 322
Exercised during the year (73,726) 104 – –
Outstanding at 30 June 12,259,167 277 1,886,635 413
Exercisable at 30 June 2,363,750 – 385,378 –
* Comparative balances are prior to the three-for-one split that occurred in the period.
The weighted average remaining contractual life for the share options outstanding was 4 years as at 30 June 2019 (30 June 2018:4 years).
The exercise price of the share options is equal to the market price of the underlying shares on the date of grant. The range of exercise prices for options outstanding at the end of the year, post three-for-one share split, was $0.67 to $4.35 (2018: $0.49 to $2.00).
The contractual term of the share options is 5 years.
2019 2018
Weighted average fair value at the measurement date
Exercise price $2.66 $1.04
Dividend yield range 0% 0%
Risk-free interest rate 1.8% 1.8%
Expected volatility range 45.9% 33.5%
Expected life of options (years) 3 3
Weighted average share price $2.58 $1.07
The expected life of the share options is based on historical data and current expectations and is not necessarily indicative of exercise patterns that may occur. The expected volatility reflects the assumption that the historical volatility over a period similar to the life of the options is indicative of future trends, which may not necessarily be the actual outcome.
The fair value of the options is calculated at the date of grant using the Black-Scholes option-pricing model and allocated to each reporting period evenly over the period from grant date to vesting date. The value disclosed is the portion of the fair value of the options recognised as an expense in each reporting period.
For
per
sona
l use
onl
y

118 Prospa Directors' Declaration
— Directors’ DeclarationIn the Directors’ opinion:
– The attached financial statements and notes comply with the Corporations Act 2001, the Accounting Standards, the Corporations Regulations 2001 and other mandatory professional reporting requirements;
– The attached financial statements and notes comply with International Financial Reporting Standards as issued by the International Accounting Standards Board as described in note 1 to the financial statements;
– The attached financial statements and notes give a true and fair view of the Group’s financial position as at 30 June 2019 and of its performance for the financial year ended on that date;
– There are reasonable grounds to believe that the Company will be able to pay its debts as and when they become due and payable; and
– At the date of this declaration, there are reasonable grounds to believe that the Company and the controlled entities identified in note 32 will be able to meet any obligations or liabilities to which they are, or may become, subject by virtue of the deed of cross guarantee.
The Directors have been given the declarations required by section 295A of the Corporations Act 2001.
Signed in accordance with a resolution of Directors made pursuant to section 295(5)(a) of the Corporations Act 2001.
On behalf of the Directors
Greg Moshal Gail Pemberton AODirector and Joint Chief Executive Officer Independent Director and Chairman
24 September 2019Sydney
For
per
sona
l use
onl
y

"The feature I like the most was the ease with which the whole transaction went through. It was just smooth; it was just easy."
Kurt Auckland, New Zealand
Auditor's Report
For
per
sona
l use
onl
y

120 Prospa Auditor's Report
— Auditor’s Report
Liability limited by a scheme approved under Professional Standards Legislation. Member of Deloitte Asia Pacific Limited and the Deloitte Network.
Deloitte Touché Tohmatsu A.B.N. 74 490 121 060 Grosvenor Place 225 George Street Sydney NSW 2000 PO Box N250 Grosvenor Place Sydney NSW 1220 Australia Tel: +61 (0) 2 9322 7000 Fax: +61 (0) 2 9322 7001 www.deloitte.com.au
Independent Auditor's Report to the Directors of Prospa Group Limited
Report on the Audit of the Financial Report Opinion We have audited the financial report of Prospa Group Limited (the “Company”) and its subsidiaries (the “Group”), which comprises the consolidated statement of financial position as at 30 June 2019, the consolidated statement of profit or loss and other comprehensive income, the consolidated statement of changes in equity and the consolidated statement of cash flows for the year then ended, and notes to the financial statements, including a summary of significant accounting policies, and the directors’ declaration.
In our opinion, the accompanying financial report of the Group is in accordance with the Corporations Act 2001, including:
(i) giving a true and fair view of the Group’s financial position as at 30 June 2019 and of its financial performance for the year then ended; and
(ii) complying with Australian Standards and the Corporations Regulation 2001. Basis for Opinion We conducted our audit in accordance with Australian Auditing Standards. Our responsibilities under those standards are further described in the Auditor's Responsibilities for the Audit of the Financial Report section of our report. We are independent of the Group in accordance with the Corporations Act 2001 and the ethical requirements of the Accounting Professional and Ethical Standards Board's APES 110 Code of Ethics for Professional Accountants (the Code) that are relevant to our audit of the financial report in Australia. We have also fulfilled our other ethical responsibilities in accordance with the Code. We confirm that the independence declaration required by the Corporations Act 2001, which has been given to the directors of the Company, would be in the same terms if given to the directors as at the time of this auditor's report. We believe that the audit evidence we have obtained is sufficient and appropriate to provide a basis for our opinion.
For
per
sona
l use
onl
y

Prospa Group Limited Annual Report 2019 121
Key Audit Matters
Key audit matters are those matters that, in our professional judgement, were of most significance in our audit of the financial report for the current period. These matters were addressed in the context of our audit of the financial report as a whole, and in forming our opinion thereon, and we do not provide a separate opinion on these matters.
Key Audit Matters How the scope of our audit responded to the Key Audit Matters
Accounting for the Group reorganisation and Initial Public Offering
The Group’s Initial Public Offering (‘IPO’) on 11 June 2019 raised $60 million. A group re-organisation was also undertaken as part of the IPO which created a Group reserve of $433m in accordance with the reverse acquisition accounting principles of AASB 3 as disclosed in Note 20 of the financial report.
As a result of the IPO, warrants, preference shares and convertible notes were converted into share capital and corporate debt was paid down. As disclosed in Note 19 of the financial report.
Significant management judgement was applied in accounting for the extinguishment and conversion of these financial instruments, which included recording fair value adjustments and gains and losses through the income statement, as well as determining the acquisition accounting relating to the Group reorganisation.
Our audit procedures included, but were not limited to:
• Obtaining management’s accounting paper
in relation to recognition and measurement on the IPO transaction and assessing the appropriateness of the financial liability and equity movements under AASB 9 and AASB 132;
• Agreeing management’s accounting paper to financial instrument signed agreements and evidence of IPO proceeds, debt conversion and debt extinguishment;
• Evaluating the fair value adjustments recognised for financial instruments measured at FVTPL under AASB 9;
• Assessing the appropriateness of equity raising transaction costs capitalised under AASB 132;
• Evaluating the accounting for the group reorganisation applying the reverse acquisition accounting principles in AASB 3 with the creation of a capital reorganisation reserve;
• Evaluating the appropriateness of journal entries posted by management related to the IPO transaction; and
• Assessing the adequacy of the related disclosures in the financial report in respect of equity and financial liabilities under AASB 9 and AASB 132.
Effective interest rate
For the year ended 30 June 2019, the Group’s has reported interest income of $125 million and net loan receivables of $380 million. The Group’s disclosure over the effective interest rate is disclosed in Note 1 of the financial report.
Interest income received from loan receivables is determined using the effective interest rate (‘EIR’) method in accordance with AASB 9. The loan receivables balance is measured and presented at amortised cost using the EIR method.
Our audit procedures included, but were not limited to:
• Understanding the control environment, focusing on
• controls relating to the assessment and calculation of the effective interest rate;
• the reconciliation of the loan sub ledger to the financial statements in presenting loan receivables at amortised cost using the effective interest method;
F
or p
erso
nal u
se o
nly

122 Prospa Auditor's Report
Key Audit Matters How the scope of our audit responded to the Key Audit Matters
Significant management judgement is involved in calculating the effective interest rate, such as estimating the expected cash flows based on contractual terms of the loan including fees paid or received between parties to the contract that are an integral part of the effective interest rate, transaction costs, and all other premiums or discounts.
• Assessing management’s • determination of the effective
interest rate incorporating origination and contractual interest charges as well as transaction costs which form part of the effective interest rate; and
• Estimation of future repayment cash flows including the expected behavioural life of the lending product.
• Agreeing a sample of inputs of the effective interest calculation to underlying signed agreements and bank statements;
• Recalculating interest income under the effective interest rate method; and Assessing the adequacy of the related disclosures in the financial report in respect of the presentation of interest income and loan receivables under AASB 9 and AASB 7.
Expected credit loss provisioning AASB 9 Financial Instruments was a new and complex accounting standard which required considerable judgement and interpretation in its implementation. The standard required a new basis of providing for loan loss on an expected credit loss (‘ECL’) basis. The development of the new models built and implemented to measure the ‘expected credit losses’ involves significant judgements and assumptions made by management. Expected credit losses require assessment on a forward-looking basis that includes an overlay to reflect management’s view of potential future economic events and model risk. As at 30 June 2019, the Group’s expected credit loss of $24 million was reported as disclosed in Note 10 and Note 11 in the financial report. The Group’s disclosure over impairment of financial assets is disclosed in Note 1 of the financial report.
Our audit procedures included, but were not limited to:
• Obtaining a detailed understanding of
expert credit judgments made by management in the core expected credit loss models;
• Testing the key controls relating to customer loan approval processes and identification of overdue amounts;
• Testing the data inputs in calculating the probability of default roll rates to assess reasonableness;
• Assessing the reasonability of management’s key assumptions and recent historical loan recovery data used in determining loss given default and the period in which lifetime expected losses occur;
• Agreeing a sample of loan information to source documents;
• Evaluating the appropriateness of the modelling policy and methodology used for the customer receivable portfolio with reference to the relevant accounting standards and market practices;
• Testing model calculations through re-performance;
• Obtaining evidence to support management’s judgements in respect of calculation methodologies, economic factors
For
per
sona
l use
onl
y

Prospa Group Limited Annual Report 2019 123
Key Audit Matters How the scope of our audit responded to the Key Audit Matters
and judgmental overlays, the period of historical loss rates used, loss emergence periods, cure rates for impaired loans, and the historical experience of recoveries on distressed loans; and
• Reviewing the adequacy of the related disclosures in the financial report in respect of the accounting policy for impairment under AASB 9 and AASB 7.
Other Information The directors are responsible for the other information. The other information comprises the information included in the Group’s annual report for the year ended 30 June 2019, but does not include the financial report and our auditor’s report thereon. Our opinion on the financial report does not cover the other information and we do not express any form of assurance conclusion thereon. In connection with our audit of the financial report, our responsibility is to read the other information and, in doing so, consider whether the other information is materially inconsistent with the financial report or our knowledge obtained in the audit, or otherwise appears to be materially misstated. If, based on the work we have performed, we conclude that there is a material misstatement of this other information, we are required to report that fact. We have nothing to report in this regard. Responsibilities of the Directors for the Financial Report The directors of the Company are responsible for the preparation of the financial report that gives a true and fair view in accordance with Australian Accounting Standards and the Corporations Act 2001 and for such internal control as the directors determine is necessary to enable the preparation of the financial report that gives a true and fair view and is free from material misstatement, whether due to fraud or error. In preparing the financial report, the directors are responsible for assessing the ability of the Group to continue as a going concern, disclosing, as applicable, matters related to going concern and using the going concern basis of accounting unless the directors either intend to liquidate the Group or to cease operations, or has no realistic alternative but to do so. Auditor’s Responsibilities for the Audit of the Financial Report Our objectives are to obtain reasonable assurance about whether the financial report as a whole is free from material misstatement, whether due to fraud or error, and to issue an auditor’s report that includes our opinion. Reasonable assurance is a high level of assurance, but is not a guarantee that an audit conducted in accordance with the Australian Auditing Standards will always detect a material misstatement when it exists. Misstatements can arise from fraud or error and are considered material if, individually or in the aggregate, they could reasonably be expected to influence the economic decisions of users taken on the basis of this financial report. As part of an audit in accordance with the Australian Auditing Standards, we exercise professional judgement and maintain professional scepticism throughout the audit. We also:
Identify and assess the risks of material misstatement of the financial report, whether due to fraud or error, design and perform audit procedures responsive to those risks, and obtain audit evidence that is sufficient and appropriate to provide a basis for our opinion. The risk of not detecting a material misstatement resulting from fraud is higher than for one resulting from error, as fraud may involve collusion, forgery, intentional omissions, misrepresentations, or the override of internal control.
For
per
sona
l use
onl
y

124 Prospa Auditor's Report
Obtain an understanding of internal control relevant to the audit in order to design audit
procedures that are appropriate in the circumstances, but not for the purpose of expressing an opinion on the effectiveness of the Group’s internal control.
Evaluate the appropriateness of accounting policies used and the reasonableness of accounting estimates and related disclosures made by the directors.
Conclude on the appropriateness of the directors’ use of the going concern basis of accounting and, based on the audit evidence obtained, whether a material uncertainty exists related to events or conditions that may cast significant doubt on the Group’s ability to continue as a going concern. If we conclude that a material uncertainty exists, we are required to draw attention in our auditor’s report to the related disclosures in the financial report or, if such disclosures are inadequate, to modify our opinion. Our conclusions are based on the audit evidence obtained up to the date of our auditor’s report. However, future events or conditions may cause the Group to cease to continue as a going concern.
Evaluate the overall presentation, structure and content of the financial report, including the disclosures, and whether the financial report represents the underlying transactions and events in a manner that achieves fair presentation.
Obtain sufficient appropriate audit evidence regarding the financial information of the entities or business activities within the Group to express an opinion on the financial report. We are responsible for the direction, supervision and performance of the Group’s audit. We remain solely responsible for our audit opinion.
We communicate with the directors regarding, among other matters, the planned scope and timing of the audit and significant audit findings, including any significant deficiencies in internal control that we identify during our audit. We also provide the directors with a statement that we have complied with relevant ethical requirements regarding independence, and to communicate with them all relationships and other matters that may reasonably be thought to bear on our independence, and where applicable, related safeguards. From the matters communicated with the directors, we determine those matters that were of most significance in the audit of the financial report of the current period and are therefore the key audit matters. We describe these matters in our auditor’s report unless law or regulation precludes public disclosure about the matter or when, in extremely rare circumstances, we determine that a matter should not be communicated in our report because the adverse consequences of doing so would reasonably be expected to outweigh the public interest benefits of such communication.
For
per
sona
l use
onl
y

Prospa Group Limited Annual Report 2019 125
Report on the Remuneration Report Opinion on the Remuneration Report We have audited the Remuneration Report included in pages 49 to 64 of the Directors’ Report for the year ended 30 June 2019. In our opinion, the Remuneration Report of Prospa Group Limited, for the year ended 30 June 2019, complies with section 300A of the Corporations Act 2001. Responsibilities The directors of the Company are responsible for the preparation and presentation of the Remuneration Report in accordance with section 300A of the Corporations Act 2001. Our responsibility is to express an opinion on the Remuneration Report, based on our audit conducted in accordance with Australian Auditing Standards. Yours sincerely
DELOITTE TOUCHE TOHMATSU
Mark Lumsden Partner Chartered Accountants Sydney, 24 September 2019
For
per
sona
l use
onl
y

126 Prospa Shareholder Information
— Shareholders’ InformationIn accordance with ASX Listing Rule 4.10, the Company provides the following information to shareholders not elsewhere disclosed in this Annual Report. The information provided is current as at 30 August 2019 (Reporting Date).
Corporate Governance StatementThe Company’s Corporate Governance Statement, together with the ASX Appendix 4G, have been lodged with the ASX and are available at https://investor.prospa.com/investor-centre/.
The Company is committed to conducting business to the highest standard of corporate governance. The Board regularly reviews its corporate governance policies and processes to ensure they are appropriate and meet requisite standards. The Company’s corporate governance policies and charters are all available at https://investor.prospa.com/investor-centre/.
Substantial holdersAs at the Reporting Date, the names of the substantial holders of the Company and the number of equity securities in which those substantial holders and their associates have a relevant interest, as disclosed in substantial holding notice given to the Company, are as follows:
Holder Class of Equity SecuritiesNumber of Equity
Securities Held
% of Total Issued Securities Capital in
Relevant Class
CURFORE PTY LTD ORDINARY SHARES 52,092,763 32.29
GREG MOSHAL PTY LTD ORDINARY SHARES 24,701,240 15.31
INTERNATIONAL GROUP OF COMPANIES PTY LTD ORDINARY SHARES 9,701,240 6.01
AIRTREE VENTURES OPPOR-TUNITY FUND TRUSCO PTY LTD ORDINARY SHARES 9,487,236 5.88
J P MORGAN NOMINEES AUSTRALIA PTY LIMITED ORDINARY SHARES 9,251,410 5.73
HSBC CUSTODY NOMINEES (AUSTRALIA) LIMITED ORDINARY SHARES 9,241,717 5.73
Number of holdersAs at the Reporting Date, the number of holders in each class of equity securities as follows:
Class of Equity Securities Number of Holders
FULLY PAID ORDINARY SHARES 826
OPTIONS TO ACQUIRE ORDINARY SHARES 130
RIGHTS TO ACQUIRE ORDINARY SHARES 78
For
per
sona
l use
onl
y

Prospa Group Limited Annual Report 2019 127
Less than marketable parcels of ordinary shares (UMP Shares)The number of holders of less than a marketable parcel of ordinary shares based on the closing market price at the Reporting Date is as follows:
Total Shares UMP Shares UMP Holders% of Issued Shares held
by UMP Holders
0 0 0 0
Voting rights of Equity SecuritiesThe only class of equity securities on issue in the Company that carries voting rights is fully paid ordinary shares.
As at the Reporting Date, there were 826 holders of a total of 161,350,437 ordinary shares of the Company.
At a general meeting of the Company, every holder of ordinary shares present in person or by proxy, attorney or representative has one vote on a show of hands and on a poll, one vote for each ordinary share held. On a poll, every member (or his or her proxy, attorney or representative) is entitled to vote for each fully paid share held.
Distribution of holders of equity securitiesThe distribution of holders of equity securities on issue in the Company as at the Reporting Date is as follows:
Table: Distribution of ordinary shareholders
Holdings Range Holders Total Units %
100,001 and Over 31 157,146,369 3.76
10,001 to 100,000 105 2,839,540 12.71
5,001 to 10,000 76 569,110 9.20
1,001 to 5,000 247 618,449 29.90
1 to 1,000 367 176,969 44.43
Total 826 161,350,437 100.00
Distribution of option holders
Holdings Range Holders Total Units %
1,000,001 and Over 2 2,573,280 22.24
500,001 to 1,000,000 5 2,823,555 24.41
100,001 to 500,000 21 3,906,894 33.77
10,001 to 100,000 57 1,867,179 16.14
1 to 10,000 45 397,500 3.44
Total 130 11,568,408 100.00For
per
sona
l use
onl
y

128 Prospa Shareholder Information
Distribution of holders of rights
Holdings Range Holders Total Units %
1,000,001 and Over 0 0 0
500,001 to 1,000,000 0 0 0
100,001 to 500,000 0 0 0
10,001 to 100,000 12 125,820 43.81
1 to 10,000 66 161,393 56.19
Total 78 287,213 100.00
Twenty largest shareholdersThe Company only has one class of quoted securities, being ordinary shares. The names of the 20 largest shareholders of ordinary shares, and the number of ordinary shares and percentage of capital held by each holder, is as follows:
Rank Holder NameBalance as at
Reporting Date %
1 CURFORE PTY LTD 52,092,763 32.29
2 GREG MOSHAL PTY LTD 24,701,240 15.31
3 INTERNATIONAL GROUP OF COMPANIES PTY LTD 9,701,240 6.01
4 AIRTREE VENTURES OPPORTUNITY FUND TRUSCO PTY LTD 9,487,236 5.88
5 J P MORGAN NOMINEES AUSTRALIA PTY LIMITED 9,251,410 5.73
6 HSBC CUSTODY NOMINEES (AUSTRALIA) LIMITED 9,241,717 5.73
7 SQUARE PEG GLOBAL FUND 2015 PTY LTD 5,809,758 3.60
8 PACIFIC CUSTODIANS PTY LIMITED 5,158,823 3.20
9 AIRTREE VENTURES GP PTY LTD 5,117,949 3.17
10 NATIONAL NOMINEES LIMITED 3,810,705 2.36
11 CITICORP NOMINEES PTY LIMITED 3,597,039 2.23
12 DANITA LOWES 2,826,246 1.75
13 KUPUNA PTY LTD 2,641,563 1.64
14 EUCLID CAPITAL PARTNERS LLC 2,566,437 1.59
15 AVIAD EYAL 2,419,280 1.50
16 MORGAN STANLEY AUSTRALIA SECURITIES (NOMINEE) PTY LIMITED 1,318,198 0.82
17 PARTNERS FOR GROWTH IV LP 1,249,476 0.77
18 CS THIRD NOMINEES PTY LIMITED 1,058,202 0.66
19 TUBBIN INVESTMENTS PTY LTD 1,033,611 0.64
20 AMUR INVESTMENTS LIMITED 777,717 0.48
Total number of Shares of Top 20 Holders 153,860,610 95.36
Total Remaining Holders’ Balance 7,489,827 4.64
For
per
sona
l use
onl
y

Prospa Group Limited Annual Report 2019 129
Escrow
Class of Restricted Securities Type of Restriction Number of Securities
End date of Escrow Period
ORDINARY SHARES VOLUNTARY ESCROW 21,757,374 31 December 2019
ORDINARY SHARES VOLUNTARY ESCROW 87,591,771 30 June 2020
Unquoted equity securitiesAs at the Reporting Date, the number of each class of unquoted securities on issue, and the number of holders in each class are as follows:
Class of Equity Securities Number of Securities Number of Holders
OPTIONS TO ACQUIRE ORDINARY SHARES 11,568,408 130
RIGHTS TO ACQUIRE ORDINARY SHARES 287,213 78
No person holds 20% or more of any class of unquoted equity securities on issue.
Other InformationThe Company is not currently conducting an on-market buy-back.
There are no issues of securities approved for the purposes of item 7 of section 611 of the Corporations Act that have not yet been completed.
No securities were purchased on-market during the reporting period under or for the purposes of an employee incentive scheme or to satisfy the entitlements of the holders of options or other rights to acquire securities granted under an employee incentive scheme.
For
per
sona
l use
onl
y

130 Prospa Corporate Information
Corporate Information
Company Secretary
Ms Nicole Johnschwager
Registered Office
Level 1 4-16 Yurong Street SYDNEY NSW 2000Telephone: 1300 882 867
Share Registry
Link Market Services Limited Level 12 680 George Street SYDNEY NSW 2000Telephone: 1300 554 474
Stock Exchange Listing
The Company’s ordinary shares are quoted on the Australian Securities Exchange (ASX). The Company was admitted to the official list of the ASX on 11 June 2019 (ASX: PGL).
Auditor
Deloitte Touche Tohmatsu Grosvenor Place 225 George Street Sydney NSW 2000
Solicitors
Herbert Smith Freehills 161 Castlereagh Street Sydney NSW 2000
Website
www.prospa.com
For
per
sona
l use
onl
y

For
per
sona
l use
onl
y

For
per
sona
l use
onl
y