Embed Size (px)
Citation preview
LOCALITY PLANNING ENERGY HOLDINGS LIMITED
ASX:LPE
INVESTOR PRESENTATION
JULY 2016
For
per
sona
l use
onl
y

This presentation contains summary information about Locality Planning Energy Holdings Limited (LPE) and is current as at 13 July
2016. The information in this presentation is of general background and does not purport to be complete.
This presentation is not investment or financial product advice (nor tax, accounting or legal advice) and is not intended to be used
for the basis of making an investment decision. The information contained in this presentation has been prepared without taking
into account the objectives, financial situation or needs of individuals. Investors should obtain their own advice before making any
investment decision.
LPE has prepared this document based on information available to it at the time of preparation. No representation or warranty,
express or implied, is made as to the fairness, accuracy or completeness of the information, opinions and conclusions contained in
this presentation.
This presentation contains certain “forward-looking statements”. Forward looking statements can generally be identified by the use
of forward looking words such as, “expect”, “should”, “could”, “may”, “predict”, “plan”, “will”, “believe”, “forecast”, “estimate”,
“target” and other similar expressions. Indications of, and guidance on, future earnings and financial position and performance are
also forward-looking statements. Forward-looking statements, opinions and estimates provided in this presentation are based on
assumptions and contingencies which are subject to change without notice, as are statements about market and industry trends,
which are based on interpretations of current market conditions.
Forward-looking statements including projections, guidance on future earnings and estimates are provided as a general guide only
and should not be relied upon as an indication or guarantee of future performance. This presentation contains statements that are
subject to risk factors associated with LPE. It is believed that the expectations reflected in these statements are reasonable, but
they may be affected by a range of variables which could cause actual results or trends to differ materially.
LPE disclaim any intent or obligation to publicly update any forward looking statements, whether as a result of new information,
future events or results or otherwise.
To the maximum extent permitted by law, LPE, their related bodies corporate (as that term is defined in the Corporations Act 2001
(Cth)) and the officers, directors, employees, advisers and agents of those entities do not accept any responsibility or liability
including, without limitation, any liability arising from fault or negligence on the part of any person, for any loss arising from the use
of the presentation or its contents or otherwise arising in connection with it.
2
DISCLAIMERF
or p
erso
nal u
se o
nly

Locality Planning Energy is a Queensland
based energy retailer authorised to sell
electricity and utility services to residential,
commercial and industrial customers
throughout the National Electricity Market.
• Core offering selling electricity to strata
communities, providing significant savings for
customers
• Positioned to expand beyond current Queensland
residential and commercial strata community
market and well positioned for expansion
Australia-wide
• Ready to deploy first Electric Vehicle charging
station utilising LPE’s embedded network
infrastructure
• Led by an experienced board and management
team with deep expertise in the electricity retailing
industry
3
COMPANY OVERVIEW
Capital Structure (close of trade 13 July 2016)
ASX Code LPE
Existing shares on issue 1,357.1M
Share price $0.037
Market Capitalisation 50.21M
Options (in-the-money)* 105M
Performance shares 854M
Total (fully Diluted) 2,334.7M
Market Capitalisation – Fully Diluted 88.72M
Options (Out-Of-The-Money)** 1.1M
Top 20 Shareholders 62.4%
47%
37%
16%
Shareholder Structure
Founders / Management
High Net Worth / Institutional
Free Float
*exercisable at 2.5c on or before 30 June 2017
**600,000 exercisable at 25c on or before 23/01/17 & 500,000 exercisable at 25c on or before 15/04/18
For
per
sona
l use
onl
y

4
HISTORY TIMELINE
LPE founded by
Damien Glanville
& Ben Chester
20
12
Authorised by
Australian Energy
Regulator (Nov)
Signed first
customer (Dec)
20
14
Moved into
Maroochydore
office (Jan)
Signed 50th
contract (Jun)
HoA for ASX
Listing (Jul)
44.1GW under
contract (31 Dec)
20
15
Listed on ASX
(Jan)
63GW under
contract (31 Mar)
Institute Partner
with UDIA (Qld)
71GW under
contract (31 May)
Milestone 1:
50GWh projected
20
16
Milestone 2:
75GWh projected
Milestone 3:
100GWh projected
20
17
For
per
sona
l use
onl
y

Image
5
BOARD & MANAGEMENT TEAM
• Financial reporting,
regulatory and governance
expertise
• Fellow of the Chartered
Accountants Australia and
New Zealand. In private
practice since 1972
• 13 years’ experience in
senior management,
logistics and executive
director roles
• Renewable energy, on-site
generation and solar PV
industry specialist
• Developed the retail
architecture and sold the
business case for the
Sunshine Coast Regional
Council Valdora Solar Farm
Ben Chester
COO/Director
Andrew Pierce
Chairman
Damien Glanville
CEO/Director
• 7 years’ experience in large
scale development and
network integration of utility
assets and energy to market
strategy
• 4 years’ experience with
ASX listed company as
principal engineer for
generation assets
integration and utility
deployments
• Renewable and energy
projects specialist
Charles Furness
CFO &
Company Secretary
• More than 25 years’
experience in senior
management positions
within ASX, AIM and Nasdaq
listed companies
• Previously CFO at Kolar
Gold and Progen
Pharmaceuticals, Company
Secretary at Leaf Resources
and Moreton Resources
For
per
sona
l use
onl
y
6
INVESTMENT HIGHLIGHTS
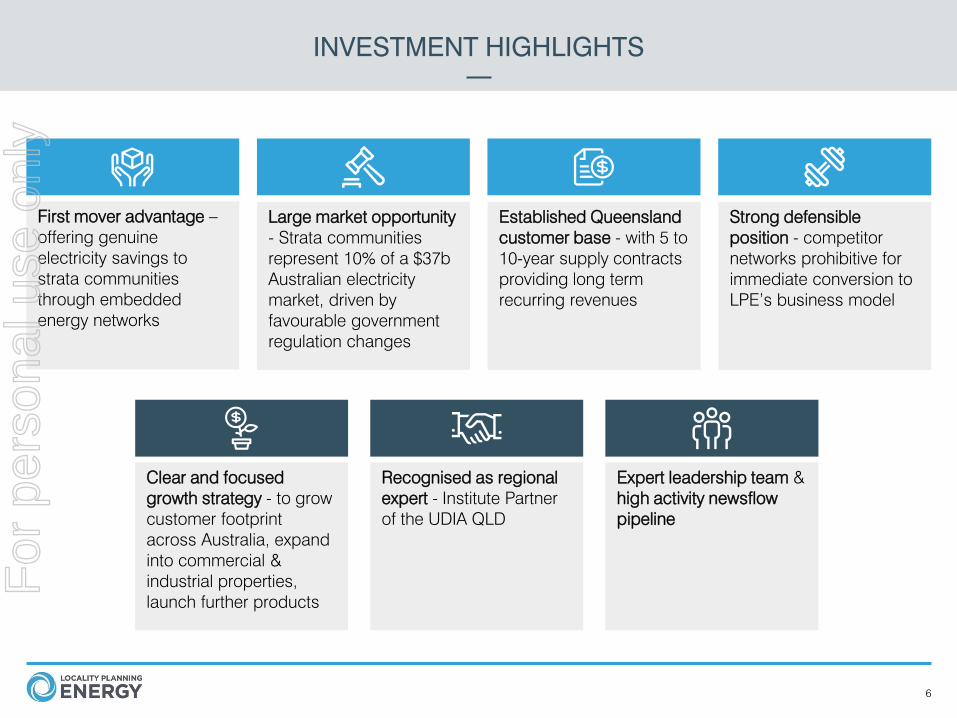
Clear and focused
growth strategy - to grow
customer footprint
across Australia, expand
into commercial &
industrial properties,
launch further products
Recognised as regional
expert - Institute Partner
of the UDIA QLD
Expert leadership team &
high activity newsflow
pipeline
First mover advantage –
offering genuine
electricity savings to
strata communities
through embedded
energy networks
Large market opportunity
- Strata communities
represent 10% of a $37b
Australian electricity
market, driven by
favourable government
regulation changes
Established Queensland
customer base - with 5 to
10-year supply contracts
providing long term
recurring revenues
Strong defensible
position - competitor
networks prohibitive for
immediate conversion to
LPE’s business model
For
per
sona
l use
onl
y

MARKETS & OPPORTUNITY
For
per
sona
l use
onl
y

• Australian National Energy Market - more than
200,000 GW traded annually
• $37 billion worth of electricity traded through
retailers
• Strata counts for 20,000 GW annually
• Federal legislative changes driving growth
8
LARGEST INTERCONNECTED ELECTRICITY GRID IN THE WORLD
Source: AEMO
17.7
10.0
31.9
40.4
Energy Breakdown by Sector
Residential
Strata
Commercial / SME
Industrial
Sources:
1. Office of Economic and Statistical Research, Queensland Treasury and Trade 2013 Derived Census
2. Australian Social Trends, Housing and Lifestyle: High Rise Living ABS 2014 Derived Census
QLD
15,500 strata
communities
~7,750GW1
NSW & ACT
17,167 strata
communities
~8,583GW2
The National Electricity Market Regional Network
For
per
sona
l use
onl
y

• LPE installs a parent meter replacing
individual strata unit lot connections
with one LPE connection
• The embedded energy infrastructure
reduces energy network access fee
(charged by the distributor) which is
based on the number of connections to
the grid
• Provides genuine savings to
customers, without impacting LPE’s
margins
9
HOW EMBEDDED ENERGY NETWORKS WORKF
or p
erso
nal u
se o
nly

10
COMPELLING CUSTOMER OFFERING
Legal
Compliance for
Body Corporates
Genuine
savings to
customers
From supply
to billingPrice fixed
Compliant with
Government
regulation and
discharges legal
obligations
$500 saving
annually per lot on
average
Energy
aggregation and
billing managed for
all lots within strata
building
No annual price
hikes
For
per
sona
l use
onl
y

• The Body Corporate of Shine on Brightwater engaged LPE to implement an embedded network prior to
complete settlement of all lots from the developer
• Shine on Brightwater has a mixed demographic range, with a long lease hotel operating on 17 of the 74
lots
• The implementation of an embedded network was done so to offer a positive point of difference in the
competitive rental market that is Brightwater
• The savings model proposed has been met after 12 months of operation1
• Each lot has seen savings of 27.3% annually following LPE’s embedded network implementation
• Total savings of ~$31k annually for the community
11
DELIVERING TRUE SAVINGS FOR CUSTOMERS
1. LPE has maintained all electricity records for Shine since 18 June 2015. These findings are based on 12 months from the initiation date. Limited assumptions have
been made due to the data being actual consumption data maintained by LPE.
For
per
sona
l use
onl
y

• The Body Corporate of Bluewater Point engaged LPE to implement an embedded network as a retrofit,
having been established for 13 years prior to the works
• The implementation resulted in significantly lower electricity supply operating costs
• The savings model proposed has been met after 12 months of operation1
• Each lot has seen savings of $500+ annually following LPE’s embedded network implementation
• Total savings of ~$38k annually for the community
12
A RECENT STRATA CONVERSION
1. LPE have maintained all electricity records for Bluewater from 19 December 2014 through to current. Findings based on 12 months from 18 June 2015 to 18 June
2016. Limited assumptions have been made due to the data being actual consumption data maintained by LPE.
For
per
sona
l use
onl
y

• Body Corporates not equipped to
comply with government
legislation
• Traditional retailers are unable to
adapt infrastructure to match
LPE’s offering
• Competitor discounting negatively
impacts retail margin
• LPE provides genuine savings to
customers without impacting its
retail margin by reducing the tariff
paid to Government to access the
Australian Energy Network
13
COMPETITIVE LANDSCAPE
Source: Standard Market Offering (July 2016) Tariff comparisons
0%
10%
20%
30%
40%
50%
60%
70%
80%
90%
100%
Standard Retail
Offering
Discounted Retail
Offering
LPE Standard
Offering
Environmental Polices Wholesale Regulated Networks Retail
% o
f stan
da
rd
ele
ctric
ity o
fferin
g
2.6%
Saving
Up to 31%
Saving
Savings
from
Network
For
per
sona
l use
onl
y
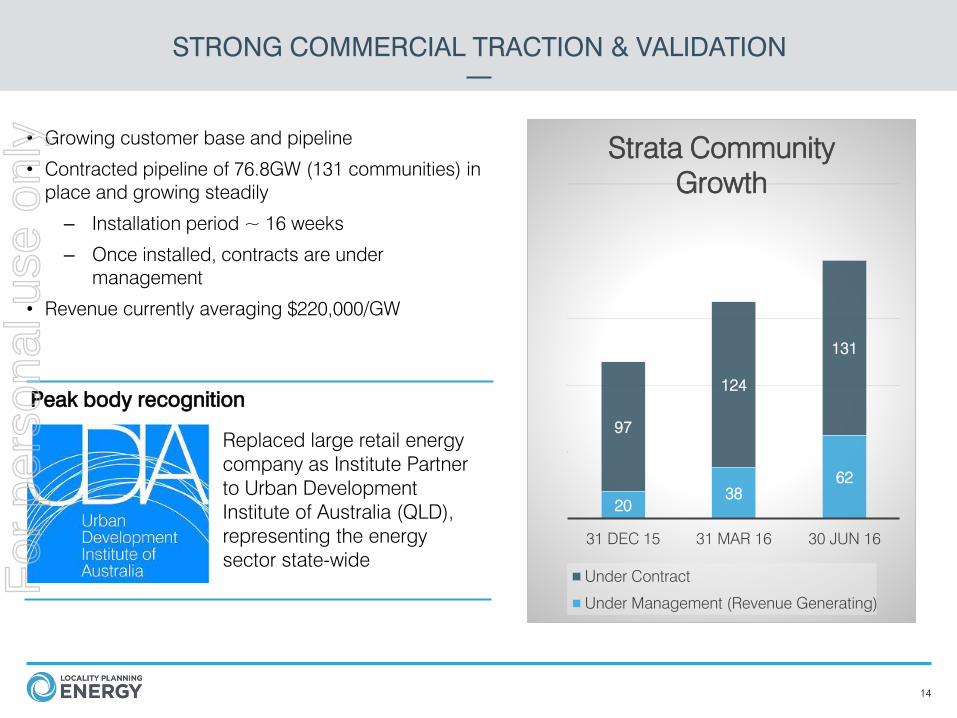
20
38
62
97
124
131
31 DEC 15 31 MAR 16 30 JUN 16
Strata Community
Growth
Under Contract
Under Management (Revenue Generating)
• Growing customer base and pipeline
• Contracted pipeline of 76.8GW (131 communities) in
place and growing steadily
– Installation period ~ 16 weeks
– Once installed, contracts are under
management
• Revenue currently averaging $220,000/GW
14
STRONG COMMERCIAL TRACTION & VALIDATION
Replaced large retail energy
company as Institute Partner
to Urban Development
Institute of Australia (QLD),
representing the energy
sector state-wide
Peak body recognition
For
per
sona
l use
onl
y

15
GO TO MARKET STRATEGY
Direct Sales
• Targeting Body Corporates, not the end
consumer
• Developers and Investment groups
Strategic Partnerships
• Authoritative Organisations
• Innovative and relevant companies
• Brand recognition
campaigns
• Trade and industry
conferences
• Active membership of target
sector industry associations
Marketing & Brand Recognition
• Advisor on legal landscape
to Body Corporates &
Developers
• Thought Leader in
Energy Sector
Industry Expert
• Partnership with Urban
Development Institute of
Australia (QLD)
• Associate member of Strata
Community Australia (SCA)
Consumer Advocate
For
per
sona
l use
onl
y
16
LOW RISK BUSINESS MODEL
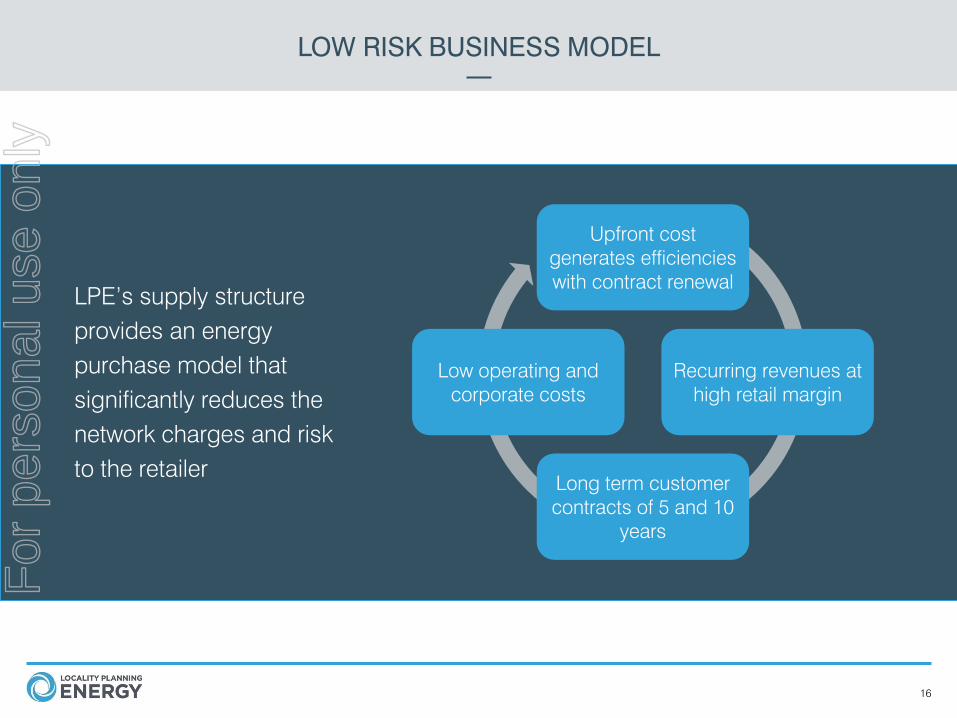
LPE’s supply structure
provides an energy
purchase model that
significantly reduces the
network charges and risk
to the retailer
Upfront cost
generates efficiencies
with contract renewal
Recurring revenues at
high retail margin
Long term customer
contracts of 5 and 10
years
Low operating and
corporate costs
For
per
sona
l use
onl
y

VALUE DRIVERS
For
per
sona
l use
onl
y
0
20
40
60
80
100
120
140
1/1
2/2
014
1/0
1/2
015
1/0
2/2
015
1/0
3/2
015
1/0
4/2
015
1/0
5/2
015
1/0
6/2
015
1/0
7/2
015
1/0
8/2
015
1/0
9/2
015
1/1
0/2
015
1/1
1/2
015
1/12/2015
1/0
1/2
016
1/0
2/2
016
1/0
3/2
016
1/0
4/2
016
1/0
5/2
016
1/0
6/2
016
1/0
7/2
016
1/0
8/2
016
1/0
9/2
016
1/1
0/2
016
1/1
1/2
016
1/1
2/2
016
1/0
1/2
017
1/0
2/2
017
1/0
3/2
017
1/04/2017
1/0
5/2
017
1/0
6/2
017
1/0
7/2
017
GW
GW contracted pipeline
GWh under management
18
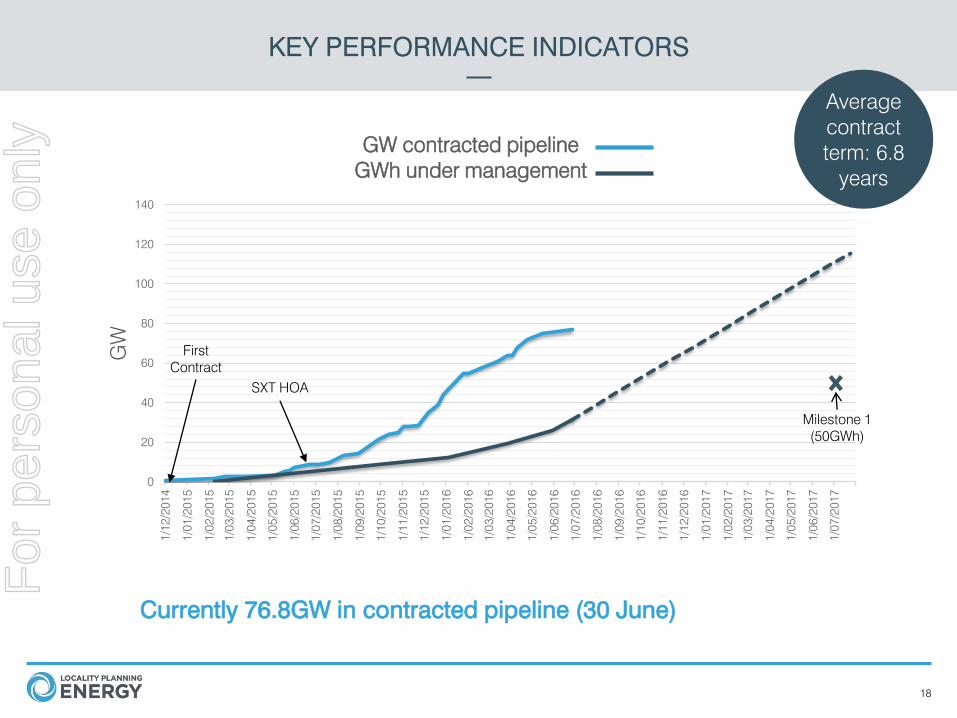
KEY PERFORMANCE INDICATORS
Average
contract
term: 6.8
years
First
Contract
SXT HOA
Currently 76.8GW in contracted pipeline (30 June)
Milestone 1
(50GWh)
For
per
sona
l use
onl
y
19
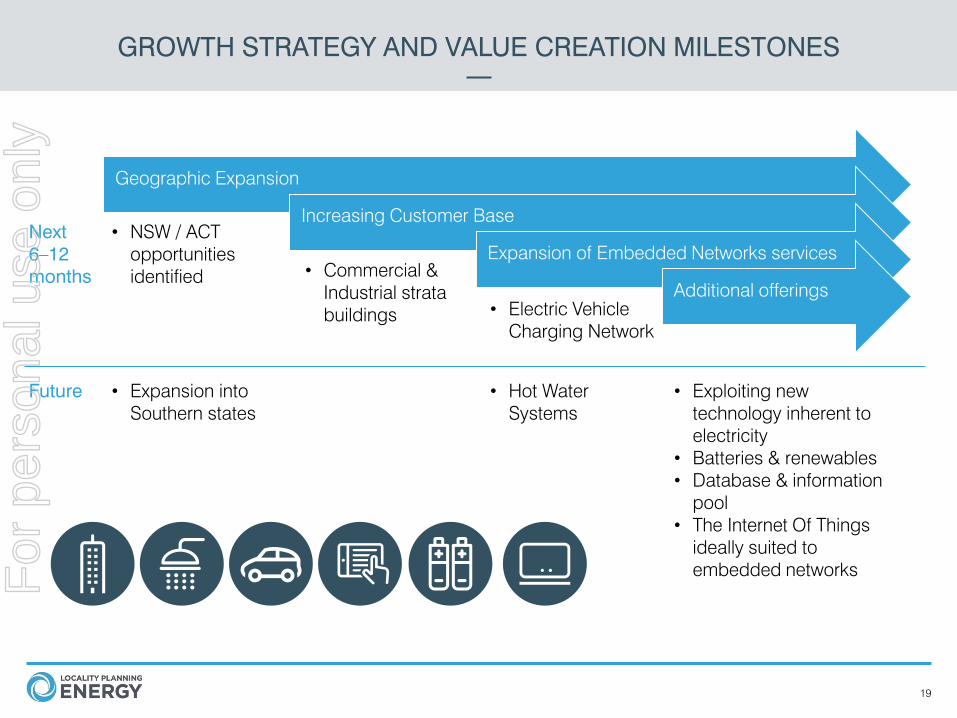
GROWTH STRATEGY AND VALUE CREATION MILESTONES
Next
6–12
months
Future
• NSW / ACT
opportunities
identified
• Expansion into
Southern states
• Commercial &
Industrial strata
buildings• Electric Vehicle
Charging Network
• Hot Water
Systems
• Exploiting new
technology inherent to
electricity
• Batteries & renewables
• Database & information
pool
• The Internet Of Things
ideally suited to
embedded networks
Geographic Expansion
Increasing Customer Base
Expansion of Embedded Networks services
Additional offerings
For
per
sona
l use
onl
y

• LPE has commenced installation of its first Electric Vehicle (EV)
Charging station in Noosa, QLD due for launch in August 2016
• Will provide electricity at a rate cheaper km-to-km than for a
combustion engine vehicle
• Second station set for deployment in November 2016 with
further stations planned for deployment along the Queensland
coast
• Utilises LPE’s embedded networks infrastructure to offer
cheaper network access and fast charge capacity
• Tritium will provide the charging stations that will be placed
inside LPE’s operational embedded network
20
ELECTRIC VEHICLE CHARGING NETWORKF
or p
erso
nal u
se o
nly

OUTLOOK & SUMMARY
For
per
sona
l use
onl
y

22
HIGH ACTIVITY NEWS FLOW
Exponential Growth
Further partnerships with leading industry bodies and lobby groups
Entry into NSW, ACT and SA
Launch of first EV Charging Station
Entry into Commercial and Industrial strata markets
Expansion of offering to other embedded energy network products (e.g. hot water)
1
2
3
4
5
6For
per
sona
l use
onl
y

23
INVESTMENT SUMMARY
Large market
opportunity in $37b
Australian electricity
market
First mover
advantage
Established
Queensland
customer base
Strong competitive
position
Recognised
regional expertise
Clear and focused
growth strategy
Expert leadership
team
Highly active
newsflow pipeline
NEWS
For
per
sona
l use
onl
y