Embed Size (px)
Citation preview
Half Year Results Presentation
29 December 2013
For
per
sona
l use
onl
y
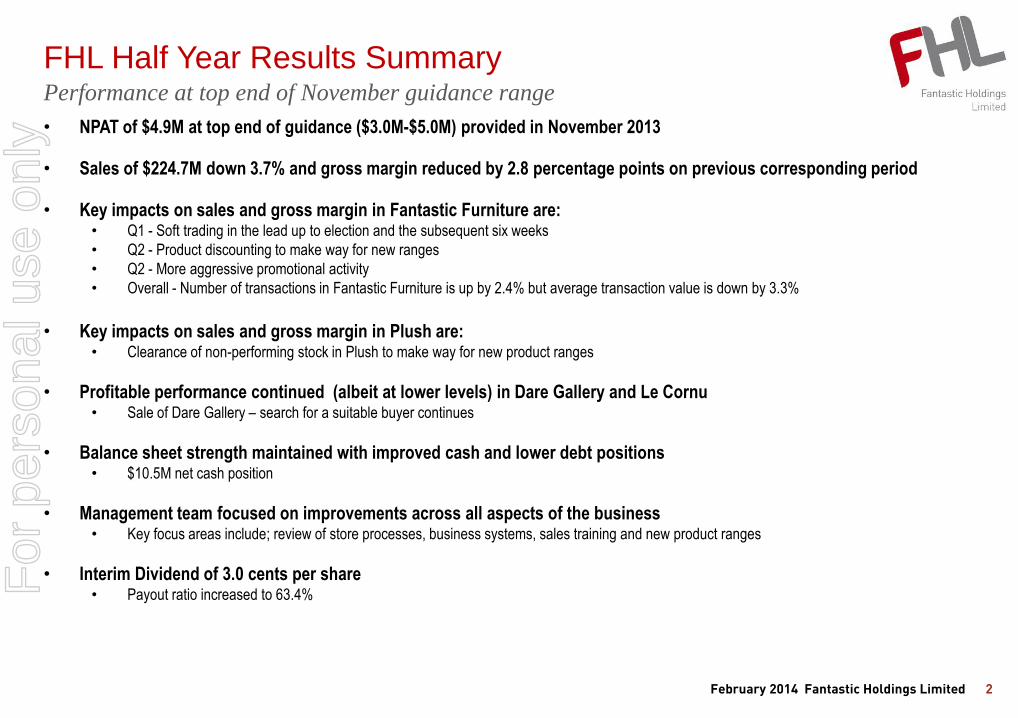
FHL Half Year Results Summary
2 February 2014 Fantastic Holdings Limited
Performance at top end of November guidance range
• NPAT of $4.9M at top end of guidance ($3.0M-$5.0M) provided in November 2013
• Sales of $224.7M down 3.7% and gross margin reduced by 2.8 percentage points on previous corresponding period
• Key impacts on sales and gross margin in Fantastic Furniture are:
• Q1 - Soft trading in the lead up to election and the subsequent six weeks
• Q2 - Product discounting to make way for new ranges
• Q2 - More aggressive promotional activity
• Overall - Number of transactions in Fantastic Furniture is up by 2.4% but average transaction value is down by 3.3%
• Key impacts on sales and gross margin in Plush are: • Clearance of non-performing stock in Plush to make way for new product ranges
• Profitable performance continued (albeit at lower levels) in Dare Gallery and Le Cornu • Sale of Dare Gallery – search for a suitable buyer continues
• Balance sheet strength maintained with improved cash and lower debt positions • $10.5M net cash position
• Management team focused on improvements across all aspects of the business • Key focus areas include; review of store processes, business systems, sales training and new product ranges
• Interim Dividend of 3.0 cents per share • Payout ratio increased to 63.4% F
or p
erso
nal u
se o
nly

Trading Performance – (Delivered Sales) New Stores
Total sales: *$229.3M -3.9%, L4L –6.2%
Fantastic Furniture: Total Sales -0.9%, L4L Sales -3.6%
Plush: Total Sales -18.8%, L4L Sales -21.0%
OMF: Total Sales +8.0%, L4L Sales +8.1%
Dare Gallery: Total Sales -8.5%, L4L Sales -9.4%
Le Cornu: Total Sales -6.8%, L4L Sales -6.8%
Both Fantastic Furniture and Plush had positive L4L written sales in December and January
*Includes only retail sales at company stores and franchisees and is exclusive of GST
Net 2 stores opened since June 2013,
FF: 2 new stores, total stores: 77 (2 franchise)
Plush: nil, total stores: 33
OMF: nil, total stores: 15
Dare Gallery: nil, total stores: 11 (1 franchise)
Le Cornu: nil, total stores: 2
138 stores now in operation (inc 3 franchise stores)
Management Initiatives Financial Management
• The leadership team is progressing on a number of initiatives to strengthen business
foundations and improve stability. Key areas include:
• Company structure - aligning staff to most appropriate roles, store based
operational training, establishment of China manufacturing joint venture,
review of business processes, systems (system rollout), FF business unit
integration
• Reducing the CODB across the business - including project initiatives around
supply chain, back office efficiency and procurement with savings expected to
flow in FY15
• Reviewing product profitability for optimal product returns
• Reviewing product range to provide customers with a more compelling offer
Improved cash balance and lower debt position
• Strong balance sheet with cash position of $28.2 million compared to a debt position of
$17.7 million.
• Return on Equity decline from 11.6% to 4.4% with lower trading profits for the half year
Strategic Review Progress
• Leadership team undertaking a business review across the Group
• Dare Gallery is currently on the market. Search for a suitable buyer continues
Operational Highlights
3 February 2014 Fantastic Holdings Limited
Management initiatives being introduced to improve performance across the business
For
per
sona
l use
onl
y

(1) Includes only retail sales at company owned and franchise stores and is inclusive of GST
(2) Gross margin recorded excludes other income such as franchise fees, property rental and profit on sale of property
All calculations have been computed based on actual numbers.
Financial Summary
4
Delivered performance within guidance range
KEY MESSAGES
• Sales decline largely due to lower average transaction value
in Fantastic Furniture and Plush and reduced number of
transactions in Plush due to incomplete product ranging
• Gross Margin decline due to stock clearance activity and
discounting in Fantastic Furniture and Plush
• CODB increased due to additional property costs associated
with new stores, higher advertising cost, further investments
in international manufacturing as well as increased
depreciation associated with completion of the Dandenong
property development
• Operating cash flows declined reflecting lower sales
• Interim dividend of 3.0 cents per share with payout ratio
increased to 63.4%
Profit After Tax
(2010-2014) Half Year Ended Dec 12 Dec 13 Change
Company and Franchise Sales (1) $ $261.1M $253.8M (2.8%)
LFL Sales % 1.8% (6.2%) (8.0pts)
Statutory Sales $ $233.4M $224.7M (3.7%)
Gross Margin $ $113.0M $102.4M ($10.6M)
Gross Margin % 48.4% 45.6% (2.8pts)
CODB $ $96.6M $99.2M $2.6M
CODB % of sales 41.4% 44.2% 2.8pts
EBITDA $ $21.3M $11.4M ($9.9M)
EBIT $ $17.8M $7.2M (59.5%)
EBIT % of Sales 7.6% 3.2% (4.4pts)
Net Profit After Tax $ $13.5M $4.9M (63.8%)
Net Profit After Tax % of Sales 5.8% 2.2% (3.6pts)
Operating Cash Flow $ $17.2M $8.1M (52.6%)
Store Numbers 134 138 4
EPS (cents) 13.08c 4.73c (63.8%)
Half Year Dividend per Share (cents) 7.50c 3.00c (60.0%)
Return on Equity % 11.6% 4.4% (7.2pts)
$M
February 2014 Fantastic Holdings Limited
12.8
9.8
13.2 13.5
4.9
0.0
3.5
7.0
10.5
14.0
17.5
HY 2010 HY 2011 HY 2012 HY 2013 HY 2014
For
per
sona
l use
onl
y

Business Performance – Sales & Gross Margin
5
Half Year to
Dec 12
Dec 13
Change
Gross Sales*
(inc franchisees) $261.1M $253.8M (2.8%)
Statutory Sales $233.4M $224.7M (3.7%)
LFL Sales % 1.8% (6.2%) (8.0pts)
Margins impacted by discounting to clear non-performing stock
Re
ve
nu
e
($M
)
• Clearance of non performing stock at reduced prices occurred in the six months to Dec13 in both Plush and Fantastic Furniture
• Whilst the number of transactions has increased in Fantastic Furniture, lower average transaction values over the half year resulted in gross margin reduction
KEY MESSAGES
Half Year to
Dec 12
Dec 13
Change
Gross Margin %
48.4%
45.6%
(2.8pts)
Gro
ss M
arg
in
(%)
•Includes only retail sales at company owned and franchise stores and is inclusive of GST
All calculations have been computed based on actual numbers
February 2014 Fantastic Holdings Limited
225 215
221 228
233
150
175
200
225
250
HY 2010 HY 2011 HY 2012 HY 2013 HY 2014
48.3%
46.3% 46.2%
48.4%
45.6%
43.0%
45.0%
47.0%
49.0%
HY 2010 HY 2011 HY 2012 HY 2013 HY 2014
For
per
sona
l use
onl
y

6
Business Performance – Sales Analysis
KEY MESSAGES
• Notwithstanding like for like being down compared to the prior comparative period, Fantastic Furniture and Plush had positive like for like sales in December 2013 and
January 2014
• Fantastic Furniture was impacted by a lower average transaction value and clearance of inventory to make way for new ranges
• Plush sales reflected the incomplete product ranges and the significant clearance and discounting to clear non performing stock
• Le Cornu has been impacted by a slowdown due to difficult market conditions in Adelaide
TOTAL HEADLINE SALES BY PERIOD
$M FY13 FY14 %Variance
1st Half 1st Half HY14 v.s .HY13
FF 165.4 164.0 (0.9%)
Plush 30.8 25.0 (18.8%)
OMF 6.6 7.1 8.0%
Dare 14.4 13.1 (8.5%)
Le Cornu 21.5 20.1 (6.8%)
Total 238.7 229.3 (3.9%)
1st Half FY13 & 1st Half FY14 (L4L Sales Analysis)
% 1H13 1H14 Variance
FF 1.2% (3.6%) (4.8pts)
Plush (6.1%) (21.0%) (14.9pts)
OMF (0.2%) 8.1% 8.3pts
Dare 3.5% (9.4%) (12.9pts)
Le Cornu 11.2% (6.8%) (18.0pts)
Total 1.8% (6.2%) (8.0pts)
Sales for major retail brands have improved in the later part of the half year
•Includes only retail sales at company owned and franchise stores and is exclusive of
GST. This excludes other minor sales not flowing through stores
All calculations have been computed based on actual numbers
February 2014 Fantastic Holdings Limited
For
per
sona
l use
onl
y

Business Performance – Cost of Doing Business
7
HY 2010 HY 2011 HY 2012 HY 2013 HY 2014
Statutory Sales
($M) 214.7 220.6 227.6 233.4 224.7
CODB ($M) 83.8 90.2 93.7 96.6 99.2
CODB / Sales (%) 39.0 40.9 41.2 41.4 44.2
Sales growth has not kept pace with increased costs – a key focus area for management
KEY MESSAGES
• CODB increased due to increased property costs associated with new stores, higher advertising cost, further investments in international manufacturing as well as
increased depreciation associated with completion of the Dandenong property development
• Recurring cost increases include property cost increases CPI, depreciation expenses as a result of IT amortisation costs and Dandenong depreciation
• Costs associated with investment include e-commerce, investment in new stores (Chullora NSW, Burleigh Heads QLD) and set up costs associated with
international manufacturing which are expected to be future revenue generating
• One off costs include stock writedowns of $1.7m and write off of fixed assets of $500k
February 2014 Fantastic Holdings Limited
37%
38%
39%
40%
41%
42%
43%
44%
45%
50.0
60.0
70.0
80.0
90.0
100.0
HY 2010 HY 2011 HY 2012 HY 2013 HY 2014
CO
DB
/ S
ale
s
CO
DB
$M
CODB CODB/Sales
For
per
sona
l use
onl
y

• EBITDA result of $11.4M for the 6 months to Dec 13 down $9.9M on prior comparative period with a multi-pronged approach to recovery in place across:
Sales – New product ranges due to land from Jan 2014 in Fantastic Furniture, which are designed to deliver improved average transaction value outcomes.
Additional sales training is been rolled out across the business
Margin – Integrated margin analysis completed for Fantastic Furniture. Product total returns now being analysed with product ranging strategies. Sales
commission model modified to be based on gross profit margins
CODB – Extensive tender program underway covering procurement contracts / services over $100k pa. Comprehensive supply chain modeling currently being
undertaken. Integration / simplification of the Fantastic Furniture business to deliver an efficient business model is nearing completion
Financial Performance – EBITDA
8
EBITDA impacted by sales decline and margin reductions
KEY MESSAGES
EB
ITD
A (
$M
)
HY 2010 HY 2011 HY 2012 HY 2013 HY 2014
Statutory Sales
($M) 214.7 220.6 227.6 233.4 224.7
EBITDA($M) 20.2 16.3 20.6 21.3 11.4
EBITDA / Sales
(%) 9.4 7.4 9.1 9.1 5.1
* CODB excludes depreciation and amortisation
February 2014 Fantastic Holdings Limited
21.3
11.4
4.3
6.3
2.7 2.0
0.0
5.0
10.0
15.0
20.0
25.0
Dec-12 Margin - Volume
Margin - Mix Increase in Other Income
Increase in CODB
Dec-13
EBITDA
For
per
sona
l use
onl
y

Balance Sheet
9
Balance sheet strengthened with net cash position recorded
KEY MESSAGES
As at Jun 13 Dec 13 Mvt (M) Mvt (%)
Cash ($M) 19.0 28.2 9.2 48.4%
Inventory ($M) 74.5 76.1 1.6 2.1%
Investment Properties ($M) 30.1 24.9 (5.2) (17.2%)
Intangibles ($M) 9.4 8.8 (0.6) (6.3%)
Interest Bearing Loans ($M) 25.3 17.7 (7.6) (30.0%)
Net Assets ($M) (2) 108.1 113.1 5.0 4.6%
Net Debt ($M) (1) (6.3) 10.5 16.8 n/a
Net Debt / Equity (%) 5.9% n/a (1) n/a
Return on Equity (%) 12.5% 4.4% (3) n/a
• Significant progress achieved to reduce the build up of aged and slow moving inventory across major retail brands to provide an efficient working capital base and
increase the stock turns on inventory
• Increase in cash due to settlement of the Campbelltown property for $12M
• Repayment of the Campbelltown property loan of $6.9M and reduction of the Le Cornu debt facility of $0.7M occurred in the period
• FHL owns three properties as at December 2013: Dandenong (VIC), Newcastle (NSW) and Rockhampton (QLD) with a total book value of $28.0M
All calculations have been computed based on actual numbers
February 2014 Fantastic Holdings Limited
(1) Cash at Dec 13 has been positive against the debt position
(2) Includes non-controlling interest
(3) Reflects only six months performance
For
per
sona
l use
onl
y

• Store number movement in the period:
- Fantastic Furniture opened 2 stores; Chullora (NSW) and Burleigh
Heads (QLD)
- Focus of new stores to be on new geographic corridors – without
cannibalisation of existing store networks
Business Performance – Store Network Growth
NSW VIC QLD WA OTHER TOTAL
FF 35 19 10 6 7 77(1)
Plush 13 12 4 - 4 33
OMF 14 - - - 1 15
Dare 2 7 2 - - 11
Le Cornu - - - - 2 2
Total 64 38 16 6 14 138
Network of Stores
(as at 29 December 2013)
Dominating presence in the key markets of NSW and VIC for FF & Plush
10
Number of Stores – split between Company owned and franchise
stores
(as at 29 December 2013)
KEY MESSAGES
• FY14 is a period of consolidation and no new store growth planned for
OMF, Le Cornu and Plush
3 Franchise stores in operation. 2 in Fantastic Furniture and 1 in Dare Gallery
(1) One store in NSW was subsequently closed in Jan 14
February 2014 Fantastic Holdings Limited
69 69 71 71 75
25 29 31 33 33
13 14 15
15 15 8 8 9
10 10
2 2
2 2 2
5 5 4
3 3
0
20
40
60
80
100
120
140
HY 2010 HY 2011 HY 2012 HY 2013 HY 2014
Franchisee
Le Cornu
Dare
OMF
Plush
FF
For
per
sona
l use
onl
y

FHL Group 2HY14 Outlook
11
Cautious outlook on retail sales – focus on efficiency improvements and return to growth
• Sales in January have trended ahead of same period last year for major retail brands (Fantastic Furniture and Plush)
• Performance across individual brands from a L4L sales perspective is a key priority in delivering the turnaround for the
business
• Operational opportunities to improve margin in isolation of sales growth with a key focus on supply chain logistics, cost of
quality and strengthening supplier arrangements
• Re-building the WA brand with investment in advertising
• Offshore manufacturing to begin in the calendar year
• Tough conditions expected to continue during second half:
• competition increasing in key markets
• lower exchange rate to place pressure on pricing, partly offset with local manufacturing capability
• FY14 is a year of rebuilding across the Group with continued focus and effort to reduce the Cost of Doing Business
February 2014 Fantastic Holdings Limited
For
per
sona
l use
onl
y

12
Questions & Answers
February 2014 Fantastic Holdings Limited
For
per
sona
l use
onl
y

Disclaimer
13
• Information in these presentations relating to the price at which relevant investments have been bought or sold in the past or the
yield on such investments cannot be relied upon as a guide to the future performance of such investments
• These presentations do not constitute an offering or recommendation to purchase securities or otherwise constitute an invitation or
inducement to any person to underwrite, subscribe for or otherwise acquire securities in any company within the Fantastic Holdings
Limited group (the “Group”)
• The information is these presentations does not take into account the potential and current individual investment objectives or the
financial situation of investors. Before making or varying any investment in securities in the Group, all investors should consider the
appropriateness of that investment in light of their individual investment objectives and financial situation and should seek their own
independent professional advice
• The presentations contain forward-looking statements which are subject to risks and uncertainties because they relate to future
events, many of which are outside the control of, and are unknown to, Fantastic Holdings Limited. These risks and uncertainties
may cause actual results to differ from any expected future events or events referred to in the forward looking statements. Fantastic
Holdings Limited disclaims any obligation or undertaking to disseminate any updates or revisions to any forward looking statements
in these materials to reflect any change in expectations in relation to any forward looking statements or any change in events,
conditions or circumstances on which any such statement is based
• No representation, warranty or assurance (express or implied) is given or made in relation to any forward looking statement by any
person (including Fantastic Holdings Limited). In particular, no representation, warranty or assurance (express or implied) is given
in relation to any underlying assumption or that any forward looking statement will be achieved
February 2014 Fantastic Holdings Limited
For
per
sona
l use
onl
y