Embed Size (px)
Citation preview

McPherson’s Limited First Half Results Financial Year 2015
Paul Maguire – Managing Director Paul Witheridge – Chief Financial Officer 24 February 2015
For
per
sona
l use
onl
y

MCP 1H FY2015 Financial Overview
» 1H FY2015 Sales Revenue of $186.6m, 3.3% above prior year
– Excluding ‘McPherson’s Housewares’, which has been equity accounted from 1 Nov 2014 following the divestment of 51% to the Fackelmann Group, revenue increased by 18.1% to $168.7m
– Comparable sales revenue in line with prior year; i.e. excluding acquisitions, new agencies and divestments
» Underlying 1H FY2015 EBIT, PAT & EPS in line with updated guidance
– Underlying EBIT of $16.3m, 10.2% below prior year*
– Underlying PAT of $9.3m, 12.7% below prior year*
– Underlying EPS of 9.7 cents, 17.1% below prior *
2 * Figures reflect the early adoption of AASB 9 Financial Instruments
For
per
sona
l use
onl
y

» ‘Cash flow from operations before interest and tax payments’ of $19.8m, significantly above prior year ($8.5m)
» EBIT Interest Cover1 of 5.0 times and Leverage Ratio2 of 2.2 for the 12 months to 31 December 2014
» Interim dividend of 6.0 cents per share fully franked
– 63% payout ratio of underlying EPS
– Payment date 9 April 2015
– Dividend Reinvestment Plan (DRP) retained
» Consistent approach to FX hedging
– Proportionally lower purchases denominated in USD in FY2015 due to Health & Beauty expansion
3
1. Normalised LTM EBIT / Net borrowing cost 2. Net Debt / Normalised LTM EBITDA Note that normalisations include the full year effect of acquisitions and divestments and non-recurring items
MCP 1H FY2015 Financial Overview
For
per
sona
l use
onl
y

STRATEGY UPDATE Paul Maguire Managing Director
For
per
sona
l use
onl
y

Revenue Summary by Division (Aus & NZ)
5
% OF TOTAL REVENUE 1H FY2015
REVENUE GROWTH
1H FY15 vs 1H FY14 REASONS OUTLOOK
HEALTH & BEAUTY 39% 33%* New agencies
& acquisitions
Growth in revenue and
profit
HOME APPLIANCES 18% 31%** New products & acquisitions
Growth in revenue and
profit
HOUSEWARES 14% (20%) Product range rationalisation
Lower sales but improved
profitability
HOUSEHOLD CONSUMABLES 25% 5% Market leadership
maintained
Ongoing market leadership but tough trading
conditions
OTHER (e.g. Impulse Merchandising)
4% (11%) Distribution changes
Profitable growth through
new ranging
* Health & Beauty sales excluding acquisitions & agencies in line with prior year **Home Appliance growth rate excluding acquisitions = 8.6%
For
per
sona
l use
onl
y

McPherson’s stated strategy is:
“to substantially transform through acquisition/divestment, the establishment of new
agency partnerships and channel expansion
........diversifying away from margin constrained channels and increasing participation in channels
with greater profit potential”
6
Transformation Strategy
For
per
sona
l use
onl
y

Over the past two years we have…
... successfully integrated 8 Earnings Per Share (EPS) accretive acquisitions; accessing synergy benefits and providing growth in profitable channels
... established agency partnerships with two prestige Beauty businesses
... divested ‘Crown Glassware’, exiting the low margin foodservice channel
... established a Housewares partnership with Fackelmann (Germany)
... launched comprehensive new innovative product ranges; and
... upgraded IT systems, boosted distribution centre efficiency & capacity, rationalised product ranges and implemented price increases
7
Transformation Achievements
For
per
sona
l use
onl
y

Mar 2014
‘Crown Glassware’ divestment
HAPL acquisition
Mar 2013
Cosmex acquisition
Eylure & Montagne Jeunesse Agencies
Footcare International acquisition
Aug 2012
Fine Fragrances Agency:
Gucci Dolce&Gabbana
Hugo Boss
Aug 2014
A’Kin & Al’chemy
acquisition
Jul 2014
Lemair acquisition
Apr 2014
Trilogy Agency
Jun 2014
McPherson’s Printing Group
(MPG) demerged
Feb 2012
Dr LeWinn’s & Revitanail acquisition
Think Appliances acquisition
Maseur acquisition
Oct 2013
Jul 2013
8
Transformation Timeline
Significant diversification achieved since the demerger of McPherson’s Printing in 2012
Appliance Agency
Dec 2014
Nov 2014
HOUSEWARES Partnership
with Fackelmann (Germany)
For
per
sona
l use
onl
y

Transformation Benefits
» Transforming through diversification reduces risk:
– Lessened exposure to foreign exchange
• USD purchases will reduce to 68% of total purchases in FY2015, down from 85% in FY2014
– A more profitable channel and customer mix
• In FY2015, the mix of business across the channels will continue to improve
9
FY2014 FY2015
Grocery 48%
Pharmacy 16%
Disc. Dept. Stores 10%
Dept. Stores 4%
Commercial
5%
Independents 14%
Hardware 1%
Retail Outlets 2%
Grocery 44%
Pharmacy 22%
Disc. Dept. Stores
7%
Dept. Stores 4%
Commercial
5%
Independents 14%
Hardware 2%
Retail Outlets
1%
Export 1%
For
per
sona
l use
onl
y
Beauty Acquisitions Delivering Growth
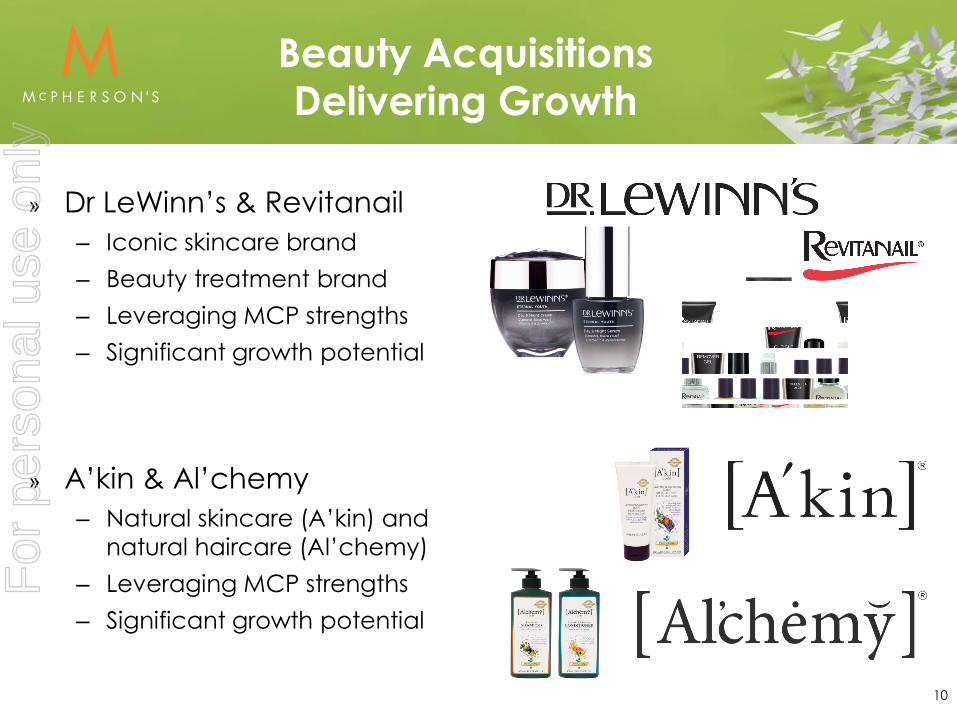
» Dr LeWinn’s & Revitanail – Iconic skincare brand – Beauty treatment brand – Leveraging MCP strengths – Significant growth potential
» A’kin & Al’chemy – Natural skincare (A’kin) and
natural haircare (Al’chemy) – Leveraging MCP strengths – Significant growth potential
10
For
per
sona
l use
onl
y

Beauty Agency Delivering Growth
11
For
per
sona
l use
onl
y

Prestige Agency Delivering Growth
12
For
per
sona
l use
onl
y

Home Appliance Acquisition Growth
» Think Appliances – Baumatic, Venini & D’Amani
– Further diversification; increasing business in electrical retail, hardware & commercial home building
» Lemair – Niche whitegoods brand
13
For
per
sona
l use
onl
y

Home Appliance Agency Growth
14
Premium Italian cookers New agency December 2014
For
per
sona
l use
onl
y
Housewares Partnership
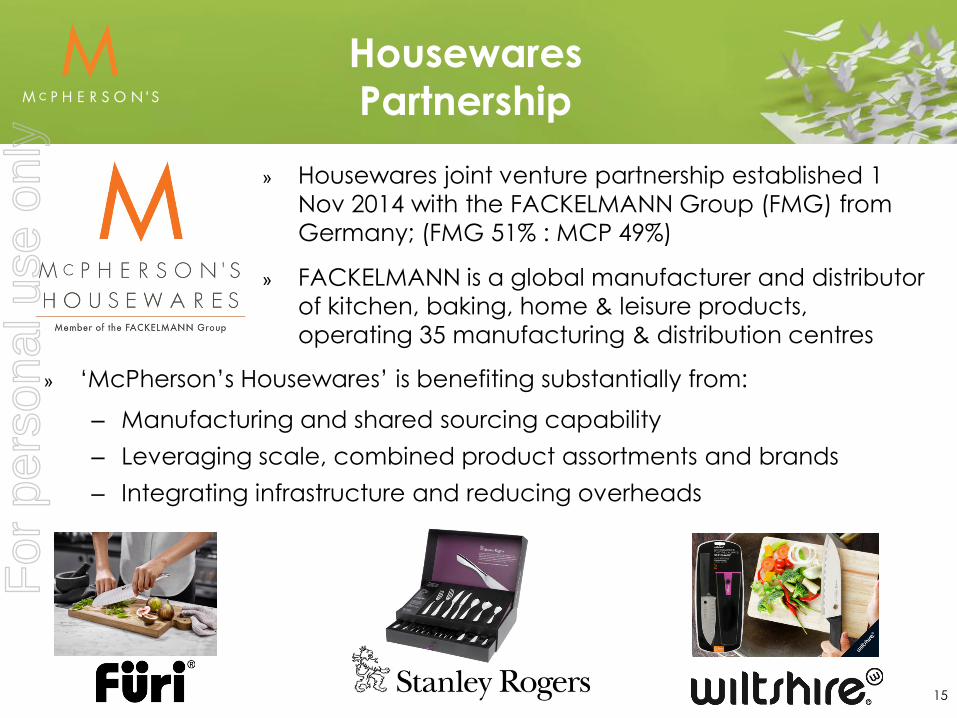
» Housewares joint venture partnership established 1 Nov 2014 with the FACKELMANN Group (FMG) from Germany; (FMG 51% : MCP 49%)
» FACKELMANN is a global manufacturer and distributor of kitchen, baking, home & leisure products, operating 35 manufacturing & distribution centres
15
» ‘McPherson’s Housewares’ is benefiting substantially from: – Manufacturing and shared sourcing capability – Leveraging scale, combined product assortments and brands – Integrating infrastructure and reducing overheads
For
per
sona
l use
onl
y

Health and Beauty
Current Status
» YTD Sales growth 33% (excl’ acquisitions & new agencies sales in line with prior year)
» Successful new product launches under trusted brands
» Acquisitions and new agencies boosting presence in Pharmacy and Department Stores and reaffirming McPherson’s beauty industry credentials:
– Dr LeWinn’s and Revitanail Nov 2013
– Trilogy, A’kin and Al’chemy July 2014
– Gucci, D&G and Hugo Boss Aug 2014
Outlook
» Synergies from recent brand acquisitions
» Continued growth through:
– new product development
– recent acquisitions and agencies
– potential new acquisitions and agencies, with capacity for >1500 new product lines in the ‘pick to light’ DC
16
For
per
sona
l use
onl
y

Home Appliances
Current Status » Home Appliances is providing customer
and channel diversification; in electrical retail, hardware & commercial
» 1H FY2015 adversely affected by product rationalisation & inventory clearance post the Think acquisition
» Sales in Masters and the Kitchen Channel slower than expected
» New products launched in 1H FY2015
Outlook » Benefits from operational initiatives and
new products launched in 1H FY2015 » Building approvals at a 5 year high » Price increases in 2H FY2015 » Continued growth through:
– new product launches in 2H FY2015 – expansion within existing & new
categories and channels – the potential for further acquisitions
17
For
per
sona
l use
onl
y

Household Consumables
Current Status
» YTD Sales 5% ahead of prior year
» Profit impacted by:
– protracted negotiations prior to the acceptance of price increases
– product cost increases ex-Asia – AUD decline & high raw material costs – increased ‘customer support’ required
Outlook
» Market leadership maintained
» Sales strengthened by new products
» Sourcing initiatives to underpin profitability
» Significant price increases required to mitigate AUD decline
18
For
per
sona
l use
onl
y

Outlook
» Consistent trading conditions anticipated
» Underlying pre-tax profit for the full year 5%-10% above FY2014
» AUD currency devaluation will require mitigation through price increases
» Health & Beauty and Home Appliances to benefit from the full year effect of acquisitions, new agencies and new products
» Household Consumables to maintain brand leadership in tough conditions
» Housewares to benefit from McPherson’s/Fackelmann partnership
» Pipeline of innovative new products supporting market leading brands
» Key operational initiatives boosting productivity and improving profitability
» Further diversification via acquisitions and new agencies
19
For
per
sona
l use
onl
y

Mission
To be a world class consumer products company
through
1st choice brands for consumers
and by being a
1st choice partner for customers and suppliers
1st choice employer for employees
1st choice investment for shareholders
McPherson’s Limited Results for the Half Year Ended 31 December 2014
Paul Maguire – Managing Director Paul Witheridge – Chief Financial Officer
For
per
sona
l use
onl
y

APPENDIX McPherson’s Limited Financial Performance Results for the Half Year Ended 31 December 2014
Paul Witheridge Chief Financial Officer
For
per
sona
l use
onl
y

Group Financial Summary for H1 FY2015 Excluding non-recurring items
December 2013*
($A million)
December 2014*
($A million)
Sales 180.6 186.6
EBITDA 19.6 17.7
Depreciation & amortisation (1.4) (1.4)
EBIT 18.2 16.3
Interest (3.3) (3.3)
NPBT 14.8 13.0
Tax (4.2) (3.7)
NPAT 10.6 9.3
Operating cash flow (before interest and tax) 8.5 19.8
EPS excluding non-recurring items (cents) 11.7 9.7
EPS (cents) (77.4) 10.4
Total dividend (cents – fully franked) 6.0 6.0
3.3% Sales increase
(10.2)% EBIT decrease
Interest cover 5.0 times
12.7% NPAT decrease
12.1% PBT decrease
22 * Figures reflect the early adoption of AASB 9 Financial Instruments
For
per
sona
l use
onl
y

Group Financial Summary for 1H FY2015 Statutory (i.e. including non-recurring items)
December 2013* ($A million)
December 2014* ($A million)
NPBT excluding non-recurring items 14.8 13.0
Non-recurring items:
- Impairment of intangibles (80.0) -
- Restructuring costs (1.1) (1.4)
- Contingent consideration adjustment - 1.7
- Other non-recurring items (0.6) (0.1)
Statutory NPBT (66.9) 13.2
Income tax expense (3.2) (3.3)
Statutory NPAT (70.1) 9.9
Statutory EPS (cents per share) (77.4) 10.4
23 * Figures reflect the early adoption of AASB 9 Financial Instruments
For
per
sona
l use
onl
y

Non-Recurring Items
December 2013
($A million)
December 2014
($A million)
Impairment of intangibles (80.0) -
Contingent consideration adjustment - 1.7
Restructuring costs – housewares disposal, redundancies and inventory clearance (1.1) (1.4)
Acquisition costs (0.6) (0.1)
Total non-recurring items before tax (81.7) 0.2
Total non-recurring items after tax (80.7) 0.7
The following non-recurring items are included in statutory profit before tax:
24
For
per
sona
l use
onl
y

Overview of Group Balance Sheet
December 2013
($A million) December 2014*
($A million) Inventories 72.8 60.2 Receivables 74.7 63.4 Assets held for sale (inventories) - 17.0 Payables (46.9) (70.3) Net working capital 100.6 70.3 Property, plant & equipment 7.3 5.9
Investment in joint venture - 7.9
Intangibles 113.4 89.9
Assets held for sale 2.1 19.3
Provisions & other net liabilities (23.1) (11.4)
Total funds employed 200.3 181.9 Net financial debt (91.7) (68.8)
Net tax balances (10.5) (4.8)
Shareholders’ funds 98.1 108.3
Gearing [Net debt / (Net debt + Shareholders’ funds)] 48.3 38.8 ROFE (underlying EBIT / Total funds employed^) 7.8% 8.2%
ROSF (underlying PAT / Shareholders’ funds^) 5.9% 5.6%
^ Total funds employed and shareholders’ funds exclude the $50.0m non-cash impairment of intangibles expensed at 30 June 2013 and the $80.0m non-cash impairment of intangibles expensed at 31 December 2013. 25
For
per
sona
l use
onl
y

Group Operating Cash Flows
December 2013* ($A million)
December 2014
($A million)
cash flows from operations
Receipts from customers (inclusive of GST) 182.1 203.2
Payments to suppliers and employees (inclusive of GST) (173.6) (183.4)
Net cash inflows from operations before interest and tax 8.5 19.8
Net interest and borrowing costs paid (3.3) (4.0)
Income tax paid (2.7) (2.9)
Net cash inflows from operations 2.5 12.9
26
For
per
sona
l use
onl
y
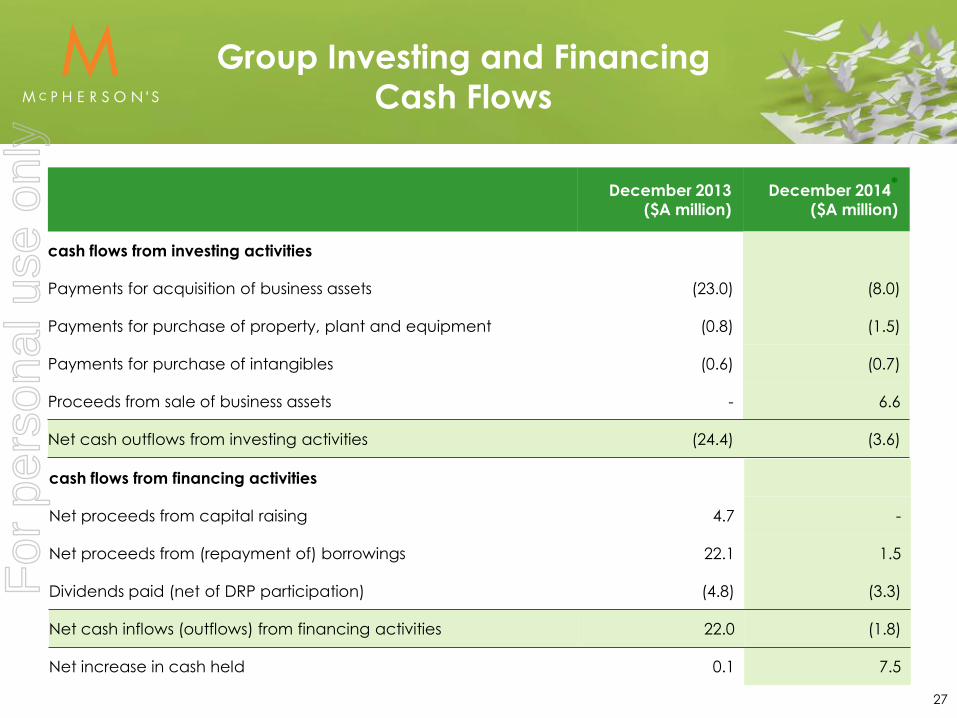
Group Investing and Financing Cash Flows
December 2013
($A million) December 2014*
($A million)
cash flows from investing activities
Payments for acquisition of business assets (23.0) (8.0)
Payments for purchase of property, plant and equipment (0.8) (1.5)
Payments for purchase of intangibles (0.6) (0.7)
Proceeds from sale of business assets - 6.6
Net cash outflows from investing activities (24.4) (3.6)
cash flows from financing activities
Net proceeds from capital raising 4.7 -
Net proceeds from (repayment of) borrowings 22.1 1.5
Dividends paid (net of DRP participation) (4.8) (3.3)
Net cash inflows (outflows) from financing activities 22.0 (1.8)
Net increase in cash held 0.1 7.5
27
For
per
sona
l use
onl
y

FX Hedging (Australia)
» Comprehensive FX hedging program in place using Options, Forward Exchange Contracts (FECs) and Collars:
Options Protect downside with premium cost but allow upside benefit FEC’s Fixed rate with lost forward points Collar Improved downside protection in exchange for limiting upside Current Policy
*Hedge 8 months forward on a rolling basis for 100% of USD requirements *Options to comprise at least 50% of 8 month requirement. Options, FEC’s
and tunnel collars to be used for remaining 50% * FEC’s placed covering:
• Next 30 days where strike is 8 cents above the protected rate; and • Next 31 to 90 days where strike is 10 cents above the protected rate
28
For
per
sona
l use
onl
y

McPherson’s Limited First Half Results
Financial Year 2015
Non-IFRS measures The non-IFRS measures used by the Company are relevant because they are consistent with measures used internally by management to assess the operating performance of the business. The non-IFRS measures have not been subject to audit or review. Disclaimer Statements contained in this presentation, particularly those regarding possible or assumed future performance, estimated company earnings, potential growth of the company, industry growth or other trend projections are or may be forward looking statements. Such statements relate to future events and expectations and therefore involve risks and uncertainties. Actual results may differ materially from those expressed or implied by these forward looking statements.
For
per
sona
l use
onl
y