Embed Size (px)
Citation preview


Copyright © 2010 Philip G. Pardey, Stanley Wood, and Reed Hertford
For personal use and non-commercial purposes: permission is granted to download and copy and to redistribute the book and any part thereof, provided that this is not for profi t, no text is changed, and the designated copyright notice and source details remain with this material.
Suggested citation: P.G. Pardey, S. Wood, and R. Herford, eds. Supplementary Tables and Figures for Research Futures: Projecting Agricultural R&D Potentials for Latin America and the Caribbean, Washington, DC and St. Paul: IFPRI, IDB, and InSTePP, 2010.

Supplementary Tables and Figures for:
Research Futures:Projecting Agricultural R&D Potentials
for Latin America and the Caribbean
EditorsPhilip G. Pardey, Stanley Wood, and Reed Hertford
Contributing AuthorsJulian M. Alston, Nienke M. Beintema, Connie Chan-Kang,
Reed Hertford, Philip G. Pardey, César L. Revoredo-Giha, Kate Sebastian, Ulrike Wood-Sichra, Stanley Wood, and Liang You
These supplementary tables and fi gures comprise a companion volume to P.G. Pardey, S. Wood, and R. Herford, eds. Research Futures: Projecting Agricultural R&D Potentials for Latin America and the Caribbean, Washington, DC and St. Paul: IFPRI, IDB, and InSTePP, 2010.

Chapter 2
Supplementary Tables and Figures
2 SUPPLEMENTARY TABLES AND FIGURES
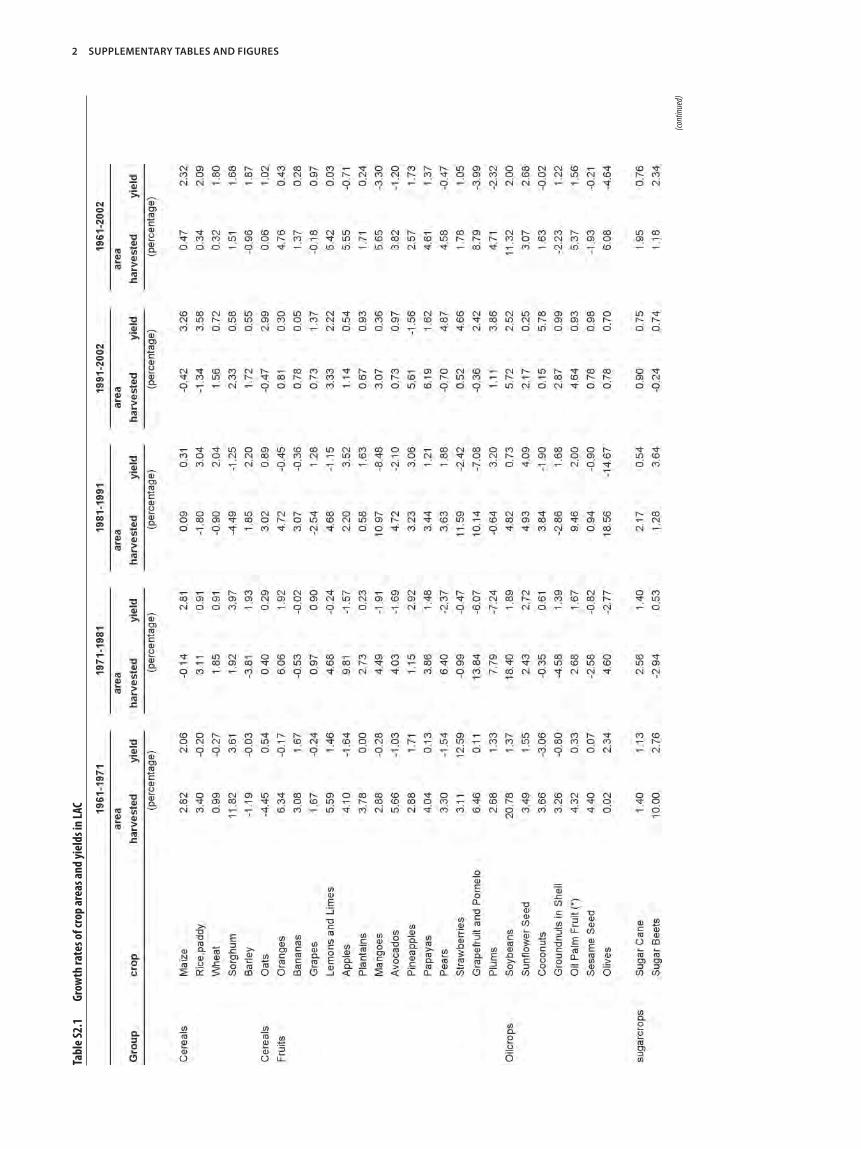
Tabl
e S2.
1 Gr
owth
rate
s of c
rop
area
s and
yiel
ds in
LAC
(con
tinue
d)

SUPPLEMENTARY TABLES AND FIGURES 3
Sour
ces:
Com
pile
d by a
utho
rs fro
m FA
OSTA
T (20
04).
a Seed
Cotto
n pr
oduc
es bo
th oi
l and
fi be
r.
Tabl
e S2.
1 (co
ntin
ued)

4 SUPPLEMENTARY TABLES AND FIGURES
Table S2.2 Land use patterns in LAC by country
Sources: Compiled by authors from FAOSTAT (2004).Notes: Data refer to year 2001.

SUPPLEMENTARY TABLES AND FIGURES 5
Table S2.3 Land-labor ratios, 1961–2001
Sources: Compiled by authors from FAOSTAT (2004).Notes: Land includes area harvested by permanent pastures. Labor refers to economically active persons engaged in agriculture.

6 SUPPLEMENTARY TABLES AND FIGURES
Table S2.4 Sources of calories consumed, 1961 and 2001
Sources: Compiled by authors from FAOSTAT (2004).

Chapter 3
Supplementary Tables and Figures
8 SUPPLEMENTARY TABLES AND FIGURES
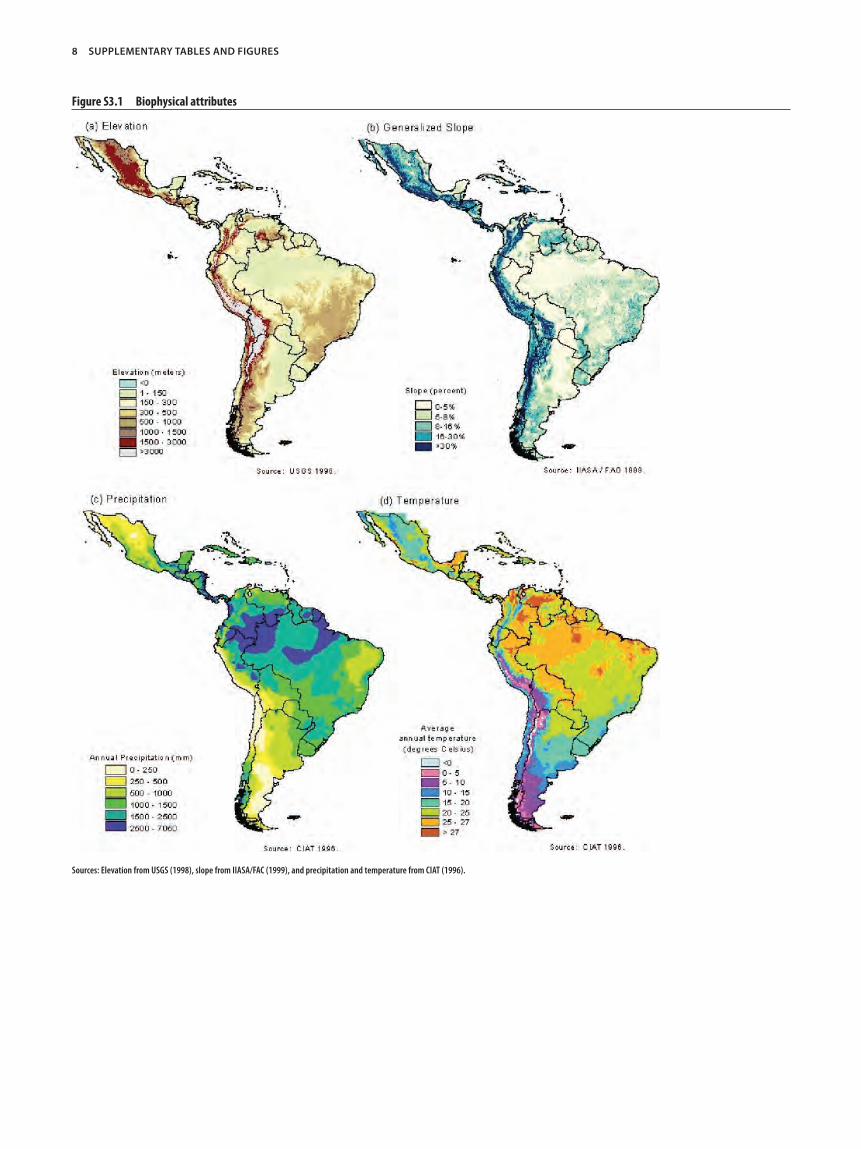
Figure S3.1 Biophysical attributes
Sources: Elevation from USGS (1998), slope from IIASA/FAC (1999), and precipitation and temperature from CIAT (1996).

SUPPLEMENTARY TABLES AND FIGURES 9
Table S3.1 Land area distribution by elevation
Sources: USGS (1998).
Table S3.2 Land area distribution by generalized slope
Sources: IIASA/FAO (1999).
Table S3.3 Land area distribution by long-term average annual temperature
Sources: CIAT (1996).
Table S3.4 Land area distribution by long-term average annual precipitation
Sources: CIAT (1996).
10 SUPPLEMENTARY TABLES AND FIGURES
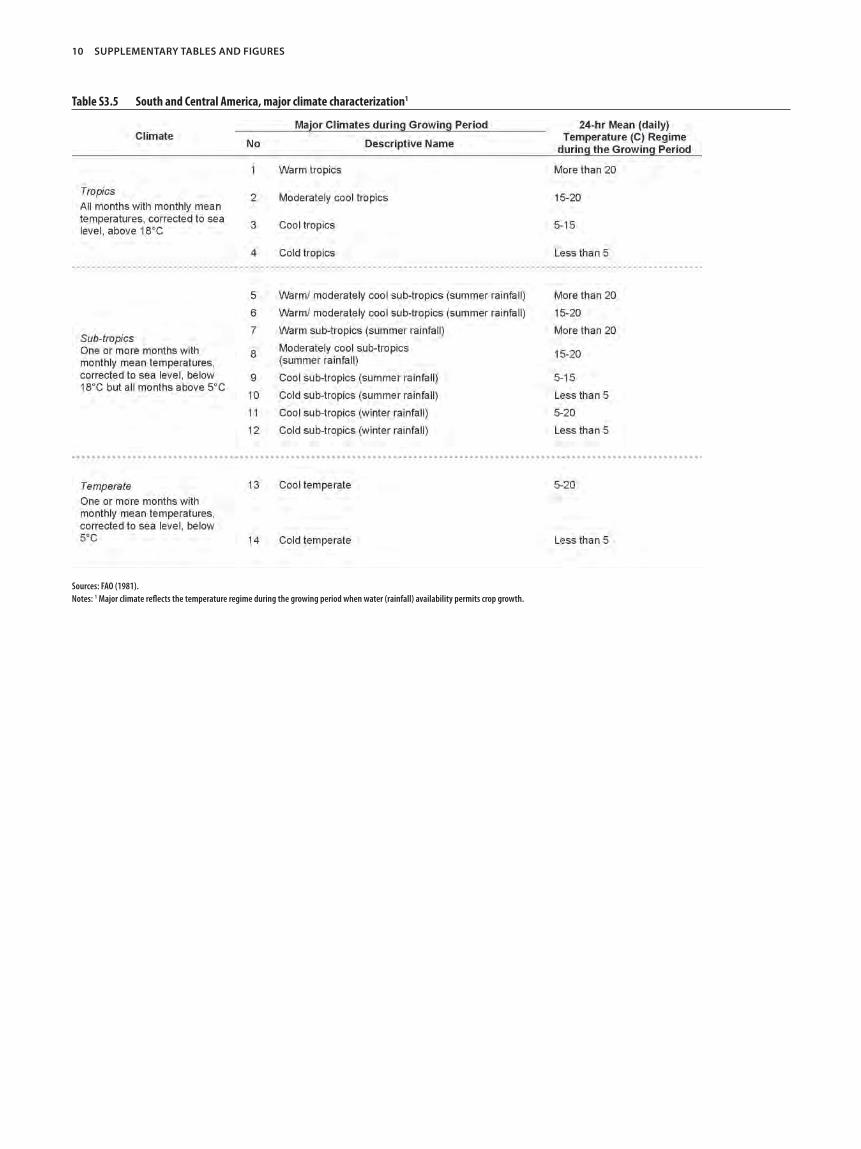
Table S3.5 South and Central America, major climate characterization1
Sources: FAO (1981).Notes: 1 Major climate refl ects the temperature regime during the growing period when water (rainfall) availability permits crop growth.
SUPPLEMENTARY TABLES AND FIGURES 11
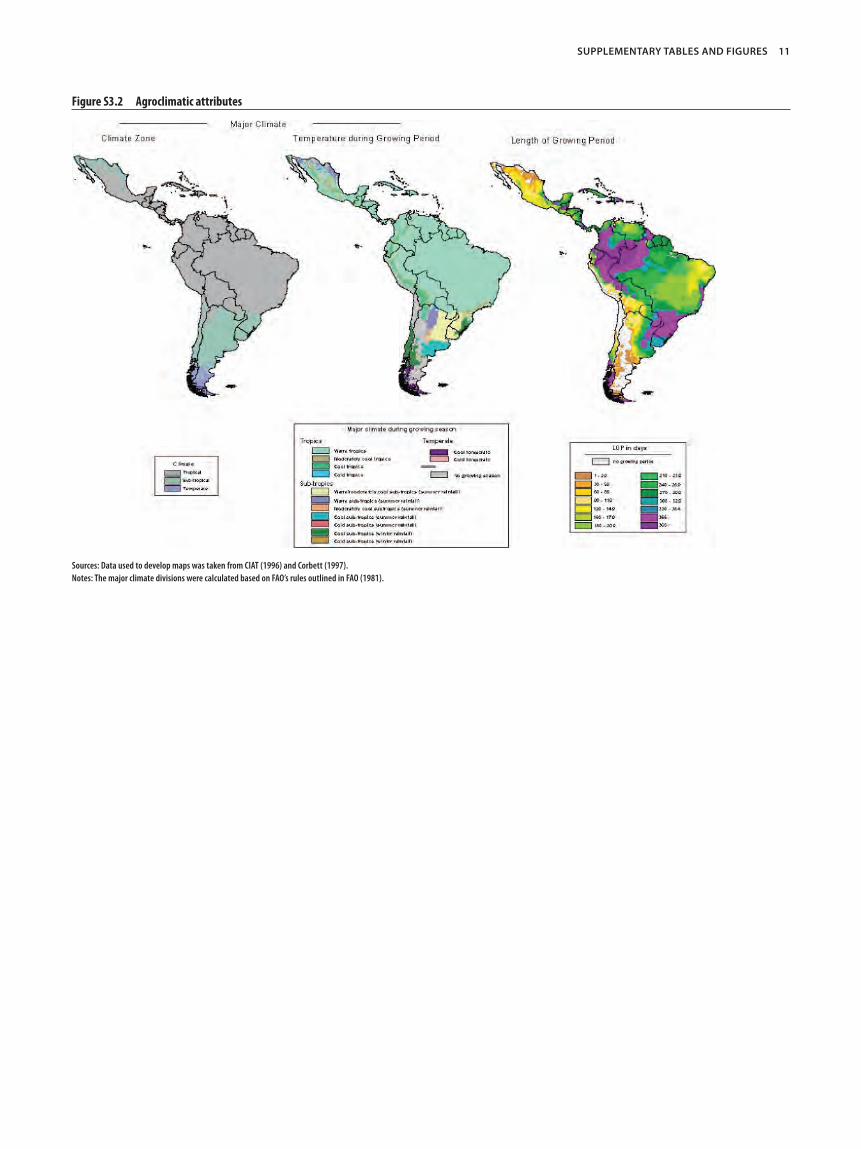
Figure S3.2 Agroclimatic attributes
Sources: Data used to develop maps was taken from CIAT (1996) and Corbett (1997).Notes: The major climate divisions were calculated based on FAO’s rules outlined in FAO (1981).
12 SUPPLEMENTARY TABLES AND FIGURES
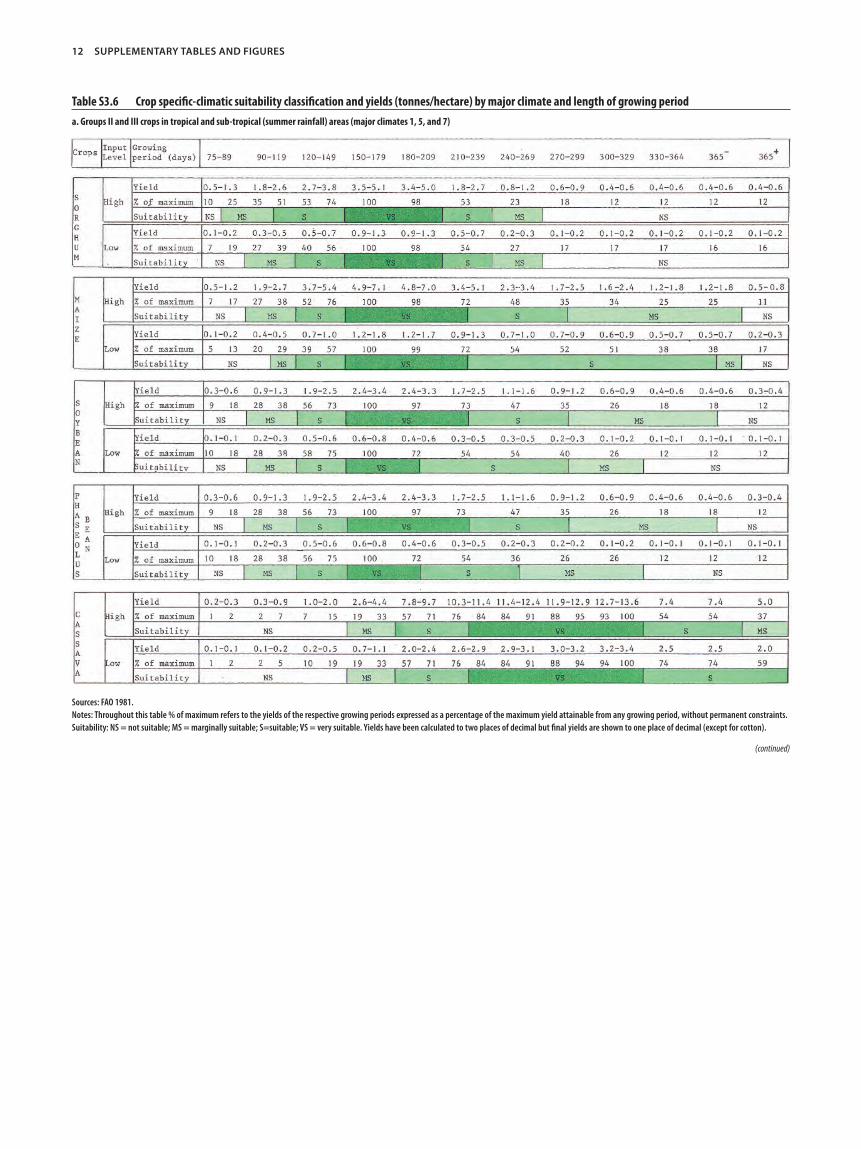
Table S3.6 Crop specifi c-climatic suitability classifi cation and yields (tonnes/hectare) by major climate and length of growing period
Sources: FAO 1981.Notes: Throughout this table % of maximum refers to the yields of the respective growing periods expressed as a percentage of the maximum yield attainable from any growing period, without permanent constraints. Suitability: NS = not suitable; MS = marginally suitable; S=suitable; VS = very suitable. Yields have been calculated to two places of decimal but fi nal yields are shown to one place of decimal (except for cotton).
a. Groups II and III crops in tropical and sub-tropical (summer rainfall) areas (major climates 1, 5, and 7)
(continued)

SUPPLEMENTARY TABLES AND FIGURES 13
Sources: FAO 1981.Notes: For areas with major climate 6, the agro-climatic suitability ratings for all crops except sorghum apply to the length appropriate to the major climate 6 alone, and not to the total length mapped. For sorghum the suitability ratings apply to the total length of the growing period mapped (i.e., major climates 5 and 6). Yields for the entire temperature range considered, i.e., mean temperature ranges 10.0-20.0°C for spring wheat, white potato and phaseolus bean; and mean temperature range 15.0-20.0°C for maize and sorghum. Throughout this table % of maximum refers to the yields of the respective growing periods expressed as a percentage of the maximum yield attainable from any growing period, without permanent constraints. For spring wheat, phaseolus bean, maize and sorghum, the values are for the mid-temperature range. For spring wheat is transitional areas of major climate 6, a period of 75-90 days should be deducted from the total length of growing period mapped before applying the agro-climatic suitability ratings. For white potato in major climate 6 (including transitional areas), the anticipated yields and suitability ratings are: High level – 150-179 days, 1.4-2.3 t/ha (NS); 180-209, 2.0-3.4 (MS); 210-299, 3.5-5.3 (S); 300-329, 2.8-5.3 (S); 300-365+, 1.8-3.6 (MS); Low Level – 150-179 days, 0.4-0.6 t/ha (NS); 180-209, 0.5-0.9 (MS); 210-299, 0.9-1.3 (S); 300-329, 0.7-1.3 (S); 330-365+, 0.5-0.9 (MS). Suitability: NS = not suitable; MS = marginally suitable; S=suitable; VS = very suitable.
b. Groups I and IV crops in tropical and sub-tropical (summer rainfall) areas (major climates 2, 3, 6, 8, and 9)
Table S3.6 (continued)
(continued)

14 SUPPLEMENTARY TABLES AND FIGURES
Sources: FAO 1981.Notes: Yields considered in the mean temperature ranges10°-20°C for spring wheat, white potato and phaseolus bean; and mean temperature range 5°-20°C for winter wheat. Throughout this table % of maximum refers to the yields of the respective growing periods expressed as a percentage of the maximum yield attainable from any growing period, without permanent constraints. Considered for production of spring crops. Suitability: NS = not suitable; MS = marginally suitable; S=suitable; VS = very suitable.
c. Group 1 crops in sub-tropical (winter rainfall) and temperate areas (major climates 11 and 13)
Table S3.6 (continued)

SUPPLEMENTARY TABLES AND FIGURES 15
Figure S3.3 Crop specifi c agro-climatic suitability classifi cation
(continued)

16 SUPPLEMENTARY TABLES AND FIGURES
Sources: Calculated by authors.Notes: The crop suitability classifi cation scheme was based on FAO (1981). See Annex Table 3.6 for more details.
Figure S3.3 (continued)

SUPPLEMENTARY TABLES AND FIGURES 17
Figure S3.4 Soil constraints
Sources: IFPRI based on FAO (1995).
18 SUPPLEMENTARY TABLES AND FIGURES
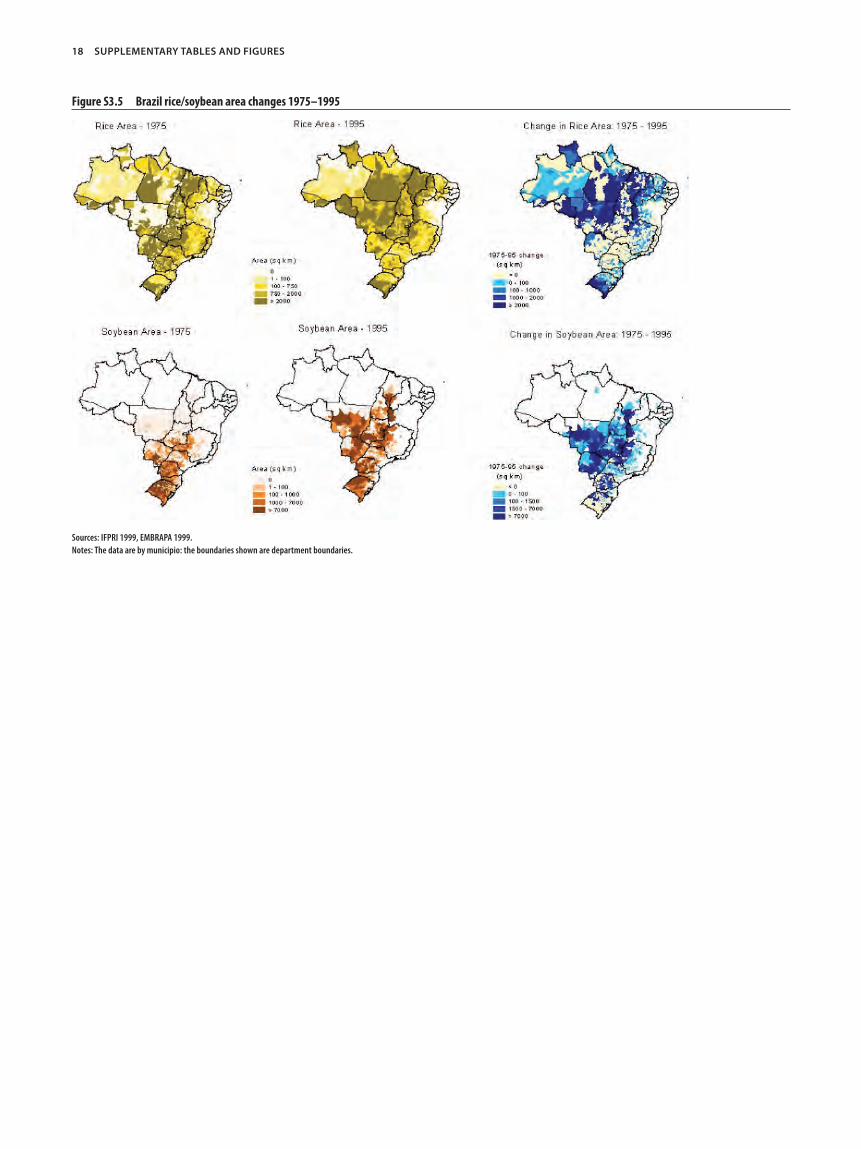
Figure S3.5 Brazil rice/soybean area changes 1975–1995
Sources: IFPRI 1999, EMBRAPA 1999.Notes: The data are by municipio: the boundaries shown are department boundaries.

SUPPLEMENTARY TABLES AND FIGURES 19
Figure S3.6 The extent of agricultural land – The Americas
Sources: IFPRI reinterpretation of USGS EROS Data Center (EDC). 1998/1999. 1 km Global Land Cover Characteristics DatasetNotes: Map represents interpretation of satellite imagery and rainfed cropland, managed pastures, orchards, vineyards and plantations.

20 SUPPLEMENTARY TABLES AND FIGURES
Tabl
e S3.
7 La
nd ar
ea d
istrib
utio
n by
agro
ecol
ogica
l zon
e (AE
Z) an
d ag
ricul
tura
l ext
ent
(con
tinue
d)

SUPPLEMENTARY TABLES AND FIGURES 21
Tabl
e S3.
7 (co
ntin
ued)

22 SUPPLEMENTARY TABLES AND FIGURES
Figure S3.7 Potato production and distribution
Sources: Calculated by authors based on IFPRI’s LAC Sub-national data collection (IFPRI 1995).
SUPPLEMENTARY TABLES AND FIGURES 23
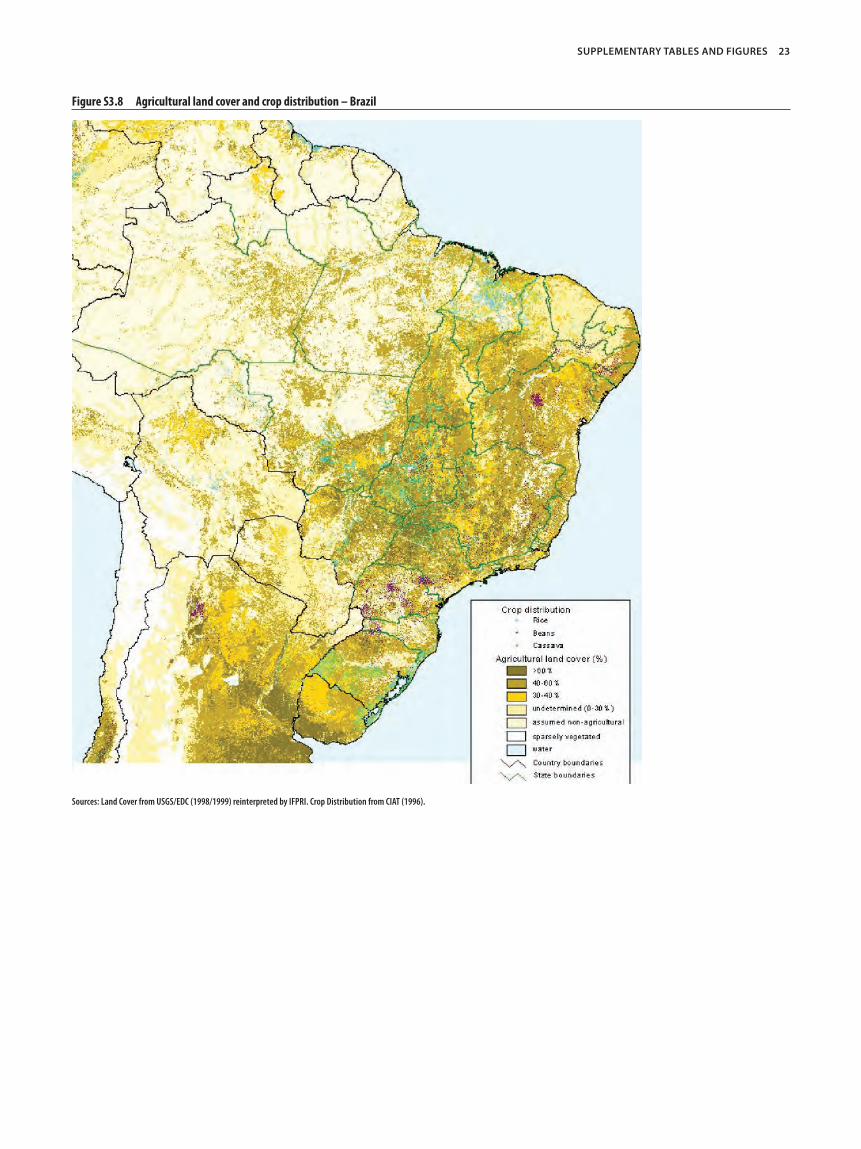
Figure S3.8 Agricultural land cover and crop distribution – Brazil
Sources: Land Cover from USGS/EDC (1998/1999) reinterpreted by IFPRI. Crop Distribution from CIAT (1996).

Chapter 4
Supplementary Tables and Figures
SUPPLEMENTARY TABLES AND FIGURES 25
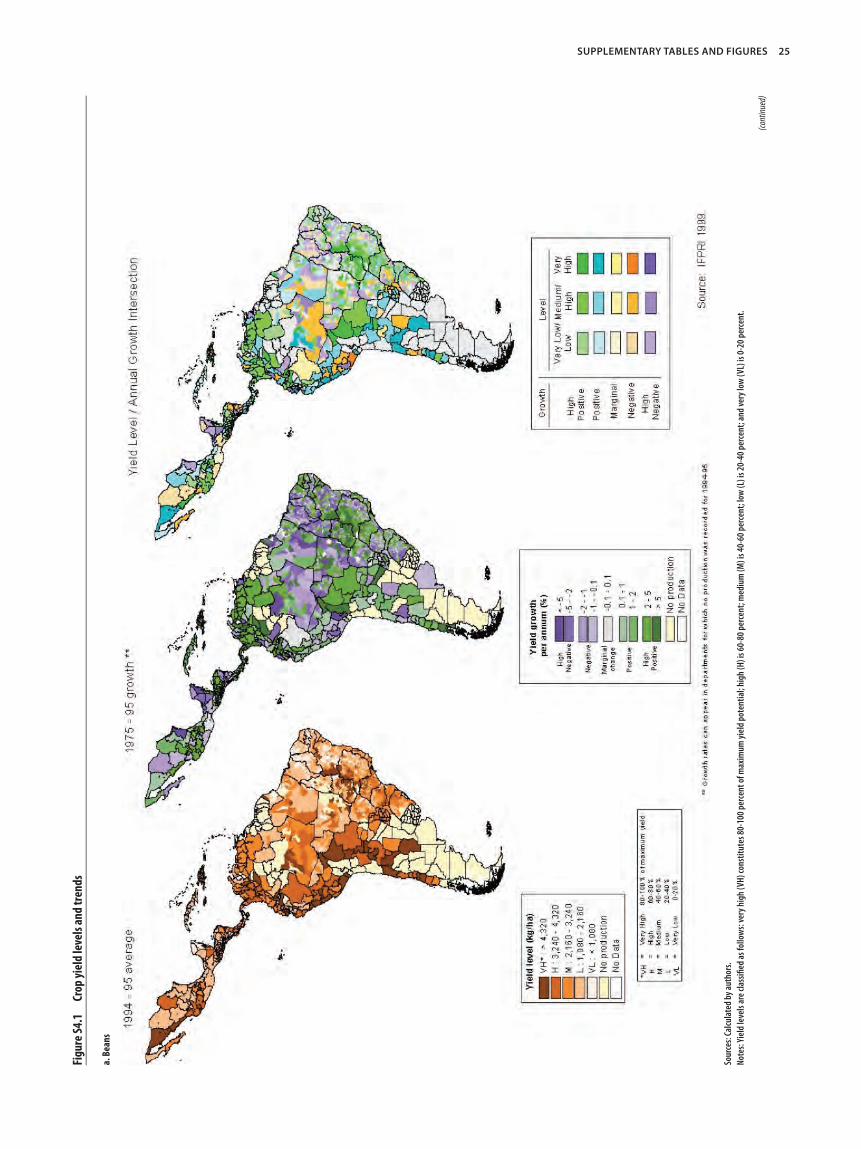
Figu
re S4
.1
Crop
yiel
d le
vels
and
tren
ds
Sour
ces:
Calcu
late
d by a
utho
rs.No
tes:
Yiel
d lev
els a
re cl
assifi
ed a
s fol
lows
: ver
y hig
h (V
H) co
nstit
utes
80-1
00 pe
rcent
of m
axim
um yi
eld p
oten
tial; h
igh
(H) i
s 60-
80 pe
rcent
; med
ium
(M) i
s 40-
60 pe
rcent
; low
(L) i
s 20-
40 pe
rcent
; and
very
low
(VL)
is 0-
20 pe
rcent
.
a. B
eans
(con
tinue
d)

26 SUPPLEMENTARY TABLES AND FIGURES
Sour
ces:
Calcu
late
d by a
utho
rs.No
tes:
Yiel
d lev
els a
re cl
assifi
ed a
s fol
lows
: ver
y hig
h (V
H) co
nstit
utes
80-1
00 pe
rcent
of m
axim
um yi
eld p
oten
tial; h
igh
(H) i
s 60-
80 pe
rcent
; med
ium
(M) i
s 40-
60 pe
rcent
; low
(L) i
s 20-
40 pe
rcent
; and
very
low
(VL)
is 0-
20 pe
cent
.
b. Ca
ssav
a
Figu
re S4
.1
(cont
inue
d)
(con
tinue
d)

SUPPLEMENTARY TABLES AND FIGURES 27
Sour
ces:
Calcu
late
d by a
utho
rs.No
tes:
Yiel
d lev
els a
re cl
assifi
ed a
s fol
lows
: ver
y hig
h (V
H) co
nstit
utes
80-1
00 pe
rcent
of m
axim
um yi
eld p
oten
tial; h
igh
(H) i
s 60-
80 pe
rcent
; med
ium
(M) i
s 40-
60 pe
rcent
; low
(L) i
s 20-
40 pe
rcent
; and
very
low
(VL)
is 0-
20 pe
rcent
.
c. M
aize
Figu
re S4
.1
(cont
inue
d)
(con
tinue
d)

28 SUPPLEMENTARY TABLES AND FIGURES
Sour
ces:
Calcu
late
d by a
utho
rs.No
tes:
Yiel
d lev
els a
re cl
assifi
ed a
s fol
lows
: ver
y hig
h (V
H) co
nstit
utes
80-1
00 pe
rcent
of m
axim
um yi
eld p
oten
tial; h
igh
(H) i
s 60-
80 pe
rcent
; med
ium
(M) i
s 40-
60 pe
rcent
; low
(L) i
s 20-
40 pe
rcent
; and
very
low
(VL)
is 0-
20 pe
rcent
.
d. Po
tato
Figu
re S4
.1
(cont
inue
d)
(con
tinue
d)

SUPPLEMENTARY TABLES AND FIGURES 29
Sour
ces:
Calcu
late
d by a
utho
rs.No
tes:
Yiel
d lev
els a
re cl
assifi
ed a
s fol
lows
: ver
y hig
h (V
H) co
nstit
utes
80-1
00 pe
rcent
of m
axim
um yi
eld p
oten
tial; h
igh
(H) i
s 60-
80 pe
rcent
; med
ium
(M) i
s 40-
60 pe
rcent
; low
(L) i
s 20-
40 pe
rcent
; and
very
low
(VL)
is 0-
20 pe
rcent
.
e. R
ice
Figu
re S4
.1
(cont
inue
d)
(con
tinue
d)

30 SUPPLEMENTARY TABLES AND FIGURES
Sour
ces:
Calcu
late
d by a
utho
rs.No
tes:
Yiel
d lev
els a
re cl
assifi
ed a
s fol
lows
: ver
y hig
h (V
H) co
nstit
utes
80-1
00 pe
rcent
of m
axim
um yi
eld p
oten
tial; h
igh
(H) i
s 60-
80 pe
rcent
; med
ium
(M) i
s 40-
60 pe
rcent
; low
(L) i
s 20-
40 pe
rcent
; and
very
low
(VL)
is 0-
20 pe
rcent
.
f. So
ybea
n
Figu
re S4
.1
(cont
inue
d)
(con
tinue
d)

SUPPLEMENTARY TABLES AND FIGURES 31
Sour
ces:
Calcu
late
d by a
utho
rs.No
tes:
Yiel
d lev
els a
re cl
assifi
ed a
s fol
lows
: ver
y hig
h (V
H) co
nstit
utes
80-1
00 pe
rcent
of m
axim
um yi
eld p
oten
tial; h
igh
(H) i
s 60-
80 pe
rcent
; med
ium
(M) i
s 40-
60 pe
rcent
; low
(L) i
s 20-
40 pe
rcent
; and
very
low
(VL)
is 0-
20 pe
rcent
.
g. So
rghu
m
Figu
re S4
.1
(cont
inue
d)
(con
tinue
d)
32 SUPPLEMENTARY TABLES AND FIGURES
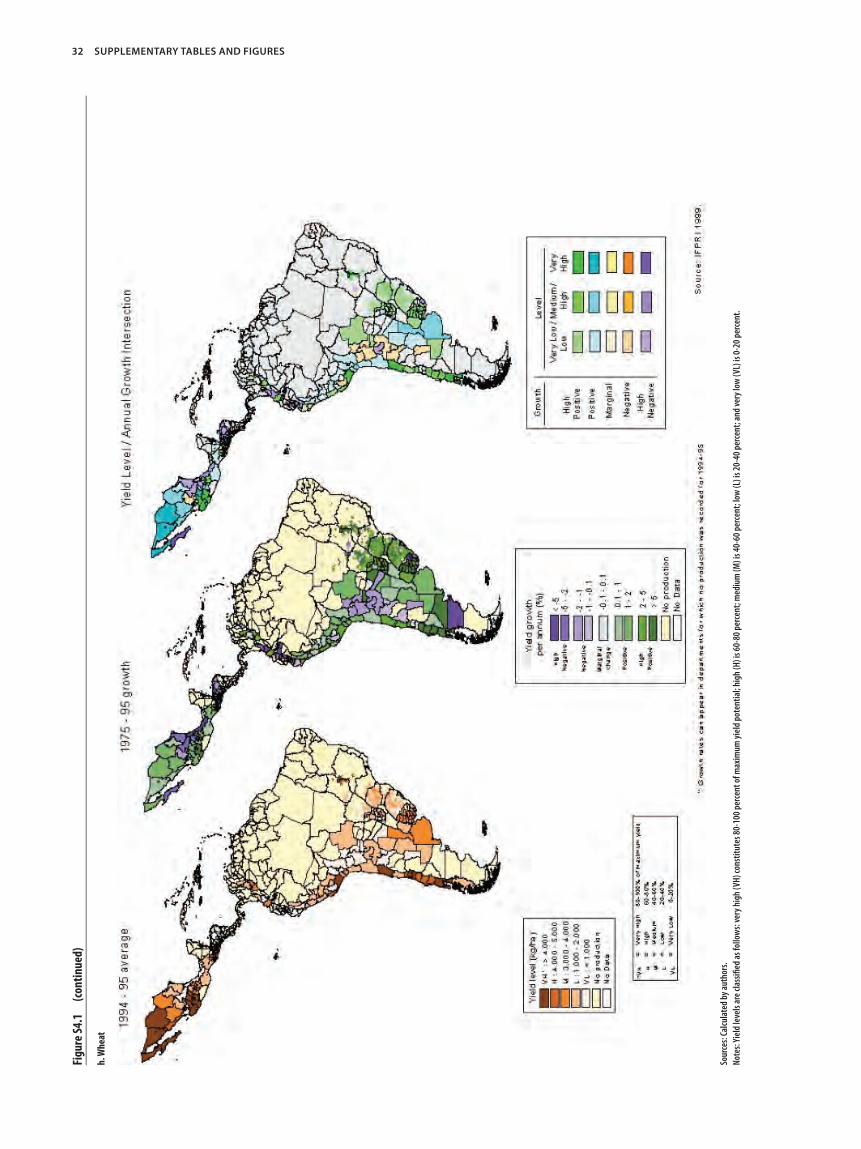
Sour
ces:
Calcu
late
d by a
utho
rs.No
tes:
Yiel
d lev
els a
re cl
assifi
ed a
s fol
lows
: ver
y hig
h (V
H) co
nstit
utes
80-1
00 pe
rcent
of m
axim
um yi
eld p
oten
tial; h
igh
(H) i
s 60-
80 pe
rcent
; med
ium
(M) i
s 40-
60 pe
rcent
; low
(L) i
s 20-
40 pe
rcent
; and
very
low
(VL)
is 0-
20 pe
rcent
.
h. W
heat
Figu
re S4
.1
(cont
inue
d)

SUPPLEMENTARY TABLES AND FIGURES 33
Figure S4.2 Crop yield distributions by harvested area
Sources: Chan-Kang, Pardey and Wood (2000).Notes: Data refer to 1993-95 averages.

34 SUPPLEMENTARY TABLES AND FIGURES
Figure S4.3 Crop yield growth distributions by production
Sources: Chan-Kang, Pardey and Wood (2000).Notes: Data refer to 1993-95 average.

SUPPLEMENTARY TABLES AND FIGURES 35
Figure S4.4 Spatial allocation of crop production
(continued)

36 SUPPLEMENTARY TABLES AND FIGURES
Figure S4.4 (continued)
(continued)

SUPPLEMENTARY TABLES AND FIGURES 37
Figure S4.4 (continued)
(continued)

38 SUPPLEMENTARY TABLES AND FIGURES
Figure S4.4 (continued)

Chapter 7
Supplementary Tables and Figures

40 SUPPLEMENTARY TABLES AND FIGURES
Tabl
e S7.
1 IM
PACT
: mod
el 20
15 p
roje
ctio
ns
(con
tinue
d)
a. La
tin A
mer
ica re
gion

SUPPLEMENTARY TABLES AND FIGURES 41
b. A
rgen
tina
Tabl
e S7.
1 (co
ntin
ued)
(con
tinue
d)

42 SUPPLEMENTARY TABLES AND FIGURES
c. Br
azil
Tabl
e S7.
1 (co
ntin
ued)
(con
tinue
d)

SUPPLEMENTARY TABLES AND FIGURES 43
Tabl
e S7.
1 (co
ntin
ued)
d. Co
lom
bia
(con
tinue
d)

44 SUPPLEMENTARY TABLES AND FIGURES
Tabl
e S7.
1 (co
ntin
ued)
e. M
exico
Sour
ces:
Unpu
blish
ed re
sults
unde
rlyin
g von
Bra
un et
al. (
2005
).No
tes:
Area
- har
veste
d are
a of c
rops
, Num
ber-
head
of an
imal
s.

SUPPLEMENTARY TABLES AND FIGURES 45
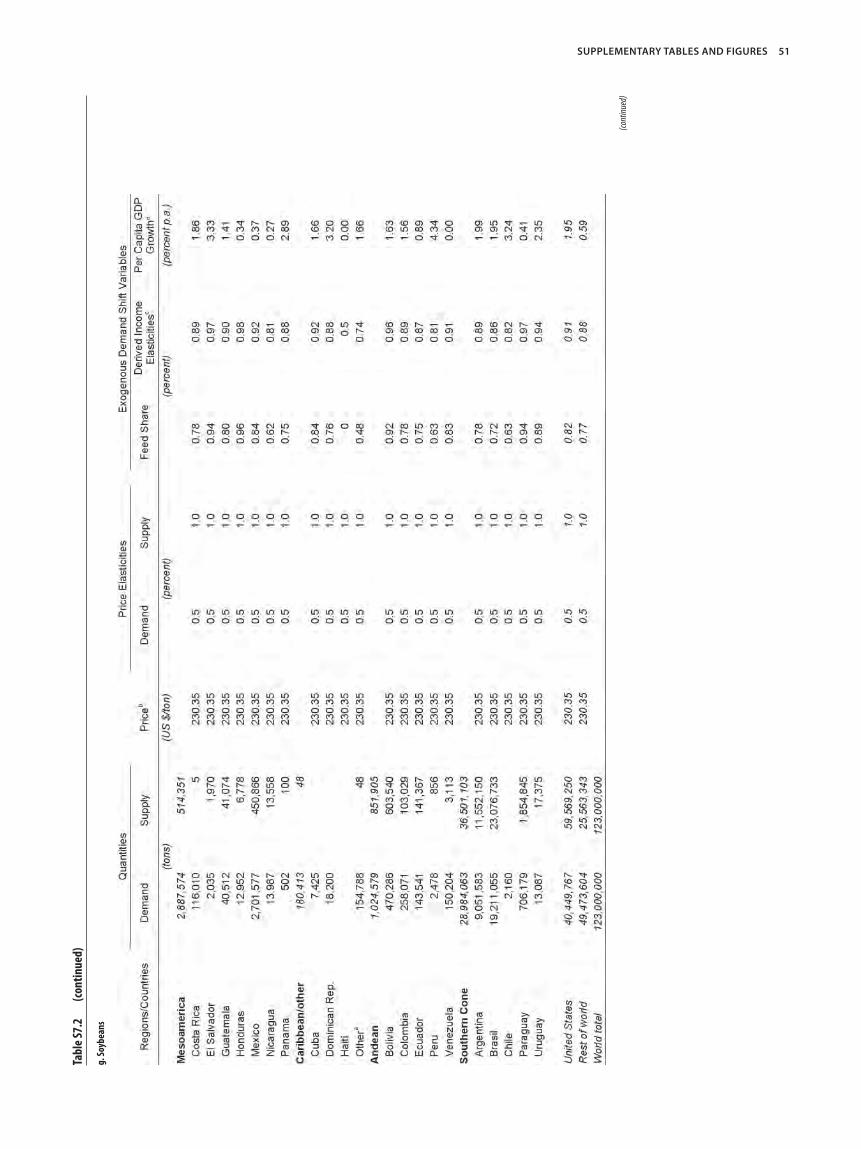
Tabl
e S7.
2 Ba
se d
ata f
or D
REAM
sim
ulat
ion
a. B
eans
(con
tinue
d)

46 SUPPLEMENTARY TABLES AND FIGURES
b. Ca
ssav
a
Tabl
e S7.
2 (co
ntin
ued)
(con
tinue
d)

SUPPLEMENTARY TABLES AND FIGURES 47
Tabl
e S7.
2 (co
ntin
ued)
c. M
aize
(con
tinue
d)

48 SUPPLEMENTARY TABLES AND FIGURES
Tabl
e S7.
2 (co
ntin
ued)
d. Po
tato
es
(con
tinue
d)

SUPPLEMENTARY TABLES AND FIGURES 49
Tabl
e S7.
2 (co
ntin
ued)
e. R
ice
(con
tinue
d)

50 SUPPLEMENTARY TABLES AND FIGURES
Tabl
e S7.
2 (co
ntin
ued)
f. So
rghu
m
(con
tinue
d)
SUPPLEMENTARY TABLES AND FIGURES 51
Tabl
e S7.
2 (co
ntin
ued)
g. So
ybea
ns
(con
tinue
d)

52 SUPPLEMENTARY TABLES AND FIGURES
Tabl
e S7.
2 (co
ntin
ued)
Note
s for
Ann
ex Ta
ble 7
.2 a−
h:a “O
ther
” inc
lude
s the
follo
wing
25 co
untri
es: A
ngui
lla, A
ntig
ua an
d Bar
buda
, the
Bah
amas
, Bar
bado
s, Be
lize,
Brit
ish Vi
rgin
Isla
nds,
Caym
an Is
land
s, Do
min
ica, F
renc
h Gu
iana
, Gre
nada
, Gua
delo
upe,
Guy
ana,
Jam
aica
, Mar
tiniq
ue, M
onts
erra
t, Ne
ther
land
s Ant
illes
, Pue
rto R
ico, S
t. Ki
tts an
d Nev
is,
St. L
ucia
, St.
Vinc
ent a
nd th
e Gre
nadi
nes,
Surin
ame,
Trin
idad
and T
obag
o, Tu
rks a
nd Ca
icos,
Falk
land
Isla
nds,
U.S.
Virg
in Is
land
s. b Pr
ices a
re ba
sed o
n 19
93-9
5 ave
rage
expo
rt un
it va
lues
(exp
ort v
alue
/exp
ort q
uant
ity) f
or th
e lar
gest
expo
rting
coun
try in
LAC.
The p
rices
are b
ased
on th
e fol
lowi
ng cr
ops a
nd co
untry
com
bina
tions
: Bea
ns–A
rgen
tina;
Cass
ava–
Cost
a Rica
; Mai
ze–A
rgen
tina;
Pota
toes
–Arg
entin
a; R
ice–U
ru-
guay
; Sor
ghum
–Arg
entin
a; So
ybea
ns–B
razil
; and
Whe
at–A
rgen
tina.
c See t
ext f
or de
tails
of de
rivat
ion.
d GDP
/cap
grow
th fo
r Arg
entin
a, Ch
ile, C
olom
bia,
Uru
guay
: impl
icit G
DP ca
p gro
wth
for y
ear 2
000,
obta
ined
by su
btra
ctin
g GDP
grow
th fr
om FM
I Wor
ld Ec
onom
ic Ou
tlook
(May
1999
) to p
opul
atio
n gr
owth
proj
ectio
n fro
m Ec
onom
ic Re
sear
ch Se
rvice
of U
SDA;
for a
ll ot
her c
ount
ries G
DP/c
ap
grow
th is
prox
ied w
ith th
e 199
0-97
grow
th ra
tes f
rom
regr
essio
n es
timat
es; C
uba’s
GDP
grow
th is
take
n to
be eq
ual t
o tha
t of “
Carib
bean
and o
ther
;” GD
P/ca
p gro
wth
is as
sum
ed to
be ze
ro fo
r the
Bah
amas
, Hai
ti, Ja
mai
ca, N
ethe
rland
s Ant
illes
, and
Vene
zuel
a bec
ause
neg
ative
grow
th w
as
foun
d ove
r the
1990
-97 p
erio
d.
h. W
heat
SUPPLEMENTARY TABLES AND FIGURES 53
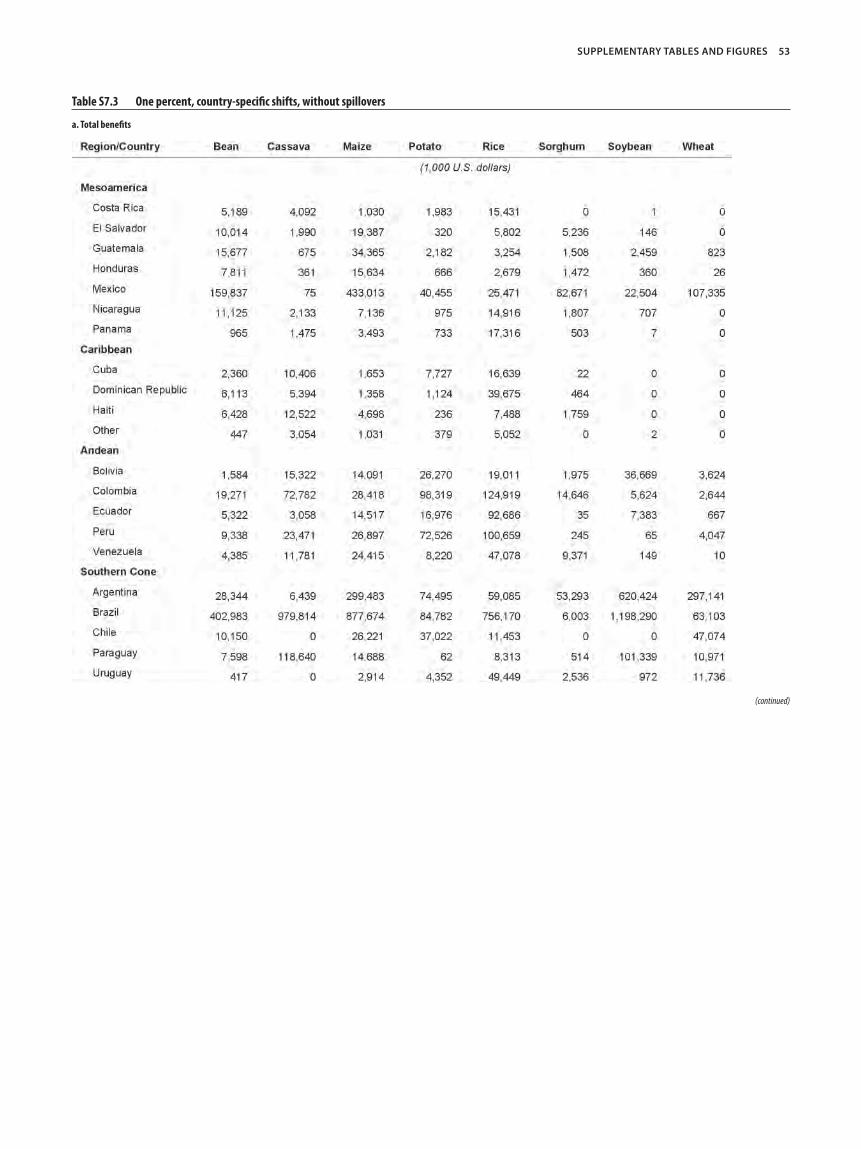
Table S7.3 One percent, country-specifi c shifts, without spillovers
a. Total benefi ts
(continued)

54 SUPPLEMENTARY TABLES AND FIGURES
b. Producer benefi ts
Table S7.3 (continued)
(continued)

SUPPLEMENTARY TABLES AND FIGURES 55
Table S7.3 (continued)
c. Consumer benefi ts

56 SUPPLEMENTARY TABLES AND FIGURES
Table S7.4 One percent, country-specifi c shifts, with spillovers
a. Total benefi ts
(continued)

SUPPLEMENTARY TABLES AND FIGURES 57
b. Producer benefi ts
Table S7.4 (continued)
(continued)

58 SUPPLEMENTARY TABLES AND FIGURES
Table S7.4 (continued)
c. Consumer benefi ts

SUPPLEMENTARY TABLES AND FIGURES 59
a. Benefi ts to the innovating country
Figure S7.1 Total, producer and consumer benefi ts—one percent, country-specifi c shifts, with spillover
(continued)

60 SUPPLEMENTARY TABLES AND FIGURES
Figure S7.1 (continued)
a. (continued)
(continued)

SUPPLEMENTARY TABLES AND FIGURES 61
b. Benefi ts to the sub-region
Figure S7.1 (continued)
(continued)

62 SUPPLEMENTARY TABLES AND FIGURES
Figure S7.1 (continued)
b. (continued)
(continued)

SUPPLEMENTARY TABLES AND FIGURES 63
c. Benefi ts to Latin America
Figure S7.1 (continued)
(continued)

64 SUPPLEMENTARY TABLES AND FIGURES
Figure S7.1 (continued)
c. (continued)