Embed Size (px)
Citation preview

Hydrosystems Research Group
University of Massachusetts, Amherst
101 North Service Road, Amherst, MA 01003-9345
hydrosystems.ecs.umass.edu
Twitter: @HydrosystemsG
Annual Report
2017
A research group of the Department of Civil and Environmental Engineering at the University
of Massachusetts, Amherst

Table of Contents
Contents
Foreword ___________________________________________________________________ 1
2017 Group Activities _________________________________________________________ 2
Project Summaries ___________________________________________________________ 6
Valley of Mexico City _________________________________________________________ 7
World Bank Water Security Diagnostic __________________________________________ 14
International Joint Commission Climate Change Study ______________________________ 17
OpenAgua _________________________________________________________________ 22
San Francisco Climate Risk Assessment _________________________________________ 25
SERDP Department of Defense ________________________________________________ 30
Tanzania - Freshwater Resilience by Design ______________________________________ 35
Personnel __________________________________________________________________ 41
Contact Information _________________________________________________________ 47

Pg. 01 Foreword
Foreword I am delighted to share with you our 2017
Annual report. Over the past year, the
Hydrosystems Research Group (HRG)
has worked on diverse projects across the
globe to improve the water security of
communities and has continued to pursue
and publish cutting-edge research in the
fields of hydrology and water
management. We’ve participated in and
presented at Stockholm Water Week,
World Bank Water Week, HydroAfrica in
Marrakesh, Morocco, the AGU Fall
Meeting and ASCE EWRI Congress. We also conducted climate risk assessment training in
Korea, Mexico and Amherst with our partners at the World Bank.
We’re thrilled to be continuing our collaboration with the Rockefeller Foundation and the World
Bank, which is bringing advanced analysis tools to design investments for resilience to the deep
uncertainty that characterizes the future. We continue to work with close collaborators in Mexico
City and Tanzania. This year we also launched a new effort with San Francisco Water and the
Water Research Foundation on a long-term vulnerability assessment.
In all of our endeavors, our overarching goal is to provide research services and insights that
benefit society. The scientific goal of our group is to understand and model complex human-
hydrologic systems to improve societal responses to water resources challenges. Most
important is the recognition that our research accomplishments are meaningful and impactful
when they are co-developed with our partners, and when addressing the practical issues of the
here and now.
We thank all of you for your support in our activities and look forward to working together in
an exciting 2018!
Dr. Casey Brown
In 2017, the
Hydrosystems
Research Group
comprised
fourteen people
from
4 states
9 countries
4 continents

Pg. 02 2017 Group Activities
2017 Group Activities In the past year, members of the Hydrosystems Research Group led and participated in a series
of events across the globe. These activities served to promote the group’s research capabilities,
disseminate research outputs, acquire skills, grow/establish networks and build capacity of
stakeholders.
December 2016
AGU Fall Meeting (San Francisco, California) Four members of the Hydrosystems Research Group participated in the 2016 Fall Meeting of
the American Geophysical Union in San Francisco. There were two oral presentations (by
Hassaan Khan and Katherine Schlef) and two poster presentations (by Dr. Sungwook Wi and
Dr. Umit Taner).
January 2017
CUAHSI-NASA Remote Sensing Workshop (Cambridge Massachusetts)
Chinedum Eluwa and Hassaan Khan attended a two-day workshop on Remote Sensing for
Hydrology. The workshop was hosted by the CUAHSI and facilitated by hydrologists at the
NASA JPL. They developed skills in querying databases of remotely sensed data and learnt
methods to analyze these data at scale.
February 2017
Resilience by Design Inception Meeting (Mexico City, Mexico) Group members (Dr. Casey Brown and Sarah Freeman) on the Freshwater Resilience Team
completed an inception meeting with partners on the Freshwater Resilience
Team from Mexico City. This meeting provided an opportunity for the
research group to learn stakeholders’ concerns and setup a partnership to
address these concerns.
March 2017
Africa Hydropower Conference (Marrakesh, Morocco)
Dr. Casey Brown and Dr. Patrick Ray conducted a training session for
about 30 water managers and decision makers at the Africa Hydropower
Conference. The session focused on the Decision Tree Framework for
Climate Risk Assessment for Water Infrastructure. Alec Bernstein
attended and participated in the training session. Casey Brown presenting The Decision Tree Framework at
the Africa Hydropower Conference in Marrackech in
March

Pg. 03 2017 Group Activities
April 2017
Decision Tree Training Workshop (Amherst, Massachusetts) The Hydrosystems Research Group in collaboration with the World Bank hosted a week-
long workshop for water managers from developing countries on the Decision Tree
Framework. The workshop sessions touched on all aspects of the framework including
model building, system stress testing and resilience components. The training was conducted
by group members Casey Brown, Katherine Schlef, Alec Bernstein and David Rheinheimer.
European Geophysical Union (EGU) General Assembly (Vienna, Austria)
Baptiste Francois convened a session during the European Geophysical Union General
Assembly on the modeling and management issues facing hydropower and other renewable
sources of energy.
May 2017
International Joint Commission (IJC) Annual Board Meeting (Washington DC, US)
Dr. Casey Brown and Alec Bernstein held a workshop during the IJC’s semi-annual board
meeting to present the Climate Change Guidance Framework and meet with watershed Board
members to discuss the implementation of the framework across basins through a Pilot Study.
The framework was developed by the Hydrosystems Research Group and completely carried out
by the group in the St. Croix Basin. Other Boards were introduced to the first step of the
framework through the Pilot Study.
June 2017
Progress Meeting (Palisades, New York) Katherine Schelf met with partners of the Hydrosystems Research Group at the
International Research Institute for Climate and Society. She presented updates
and led conversations on her ongoing research on credible flood projections.
NCAR Conference (Boulder, Colorado) Sarah Freeman presented her work at the University Council on Water
Resources 2017 Annual Conference, “Water in a Changing Environment.”
Freshwater Resilience Partners Meeting and Lerma-Chapala Workshop (Mexico City, Mexico)
The Hydrosystems Research Group met with partners from the World Bank,
SACMEX (Sistema de Aguas de la Ciudad de Mexico), CONAGUA and
UNAM as part of a workshop for collaborative management of the Lerma-
Chapala basin. Dr. Casey Brown, Sarah Freeman and Alec Bernstein presented
ongoing work and led discussions with water managers and basin stakeholders.
Casey Brown talking during the Lerma Chapala
Workshop in Mexico in June
Luis Garcia of the World Bank opening
the Decision Tree Training Workshop
in Amherst in April

Pg. 04 2017 Group Activities
August 2017
SCRiM Network Climate Risk Management Summer School (State College, Pennsylvania)
Chinedum Eluwa participated in a summer school hosted by the SCRiM Network. The summer
school covered interdisciplinary approaches in dealing with climate risk management. Topics
included communications methods, policy development, integrated assessment modelling and
robust decision-making techniques.
World Water Week (Stockholm, Sweden) Dr. Casey Brown and Sarah Freeman attended the World Water Week in Stockholm. They
presented ongoing work on Freshwater Resilience with partners from the World Bank and
Rockefeller Foundation.
September 2017
Freshwater Resilience Partners Scoping Meeting (Tanzania)
Dr. Casey Brown and Alec Bernstein travelled with
the World Bank on a scoping mission to Dar es
Salaam, Dodoma, Iringa and Morogoro, Tanzania.
They presented the Freshwater by Design
methodology to various government ministries and
basin stakeholders. The scoping mission was the
first to kick off the Freshwater Resilience by
Design work in Tanzania, and the members learned
about pressing issues facing river basins from the
local river basin board members.
November 2017
Lerma Basin Scoping Meeting (Mexico) Members of the Hydrosystems Group, met with stakeholders within the Lerma Basin from
November. The Group conducted a successful inception meeting with Lerma Basin
stakeholders and also held a technical workshop and reported on the ongoing modeling work
for the Basin. The members of the group who attended were Casey Brown, Sarah Freeman and
Sungwook Wi.
December 2017
Hydrologic Risk in Hydropower Dominated Energy Systems Workshop
Alec Bernstein travelled an International Hydropower Association (IHA), World Bank and
Nordic Development Bank funded workshop on assessing and mitigating hydrologic risk in
hydropower dominated energy systems in London, UK. The workshop’s geographic focus was
Africa and provided an opportunity to learn from private practitioners of hydropower insurance
Casey Brown discussing Freshwater Resilience by Design with the Tanzania
Ministry of Water and Irrigation in September

Pg. 05 2017 Group Activities
and risk within the African context. Alec presented the Freshwater Resilience by Design
methodology and bottom-up climate risk assessment framework for the Batoka Gorge
Hydropower Scheme study.
American Geophysical Union Fall Meeting (New Orleans) Ten HRG members attended the 2017 Fall Meeting of the AGThe Hydrosystems Research Group
had a good outing at the annual Fall meeting of the American Geophysical Union. 9 members of
the group (Sungwook Wi, David Rheinheimer, Hassaan Khan, Umit Taner, Katherin Schlef,
Baptiste Francois, Sarah Freeman, Chinedum Eluwa) made either presentations or posters and
Casey Brown played a key role in organizing the Hydrology section of the conference.
The Hydrosystems Group at AGU 2017
Hassaan Khan presenting his
work at AGU 2017
Chinedum Eluwa and his poster at
AGU 2017
Katherine Schlef presenting at AGU 2017

Pg. 06 Project Summaries
Project Summaries Over the past year, the Hydrosystems Research Group (HRG) has worked on diverse projects
across the globe to improve the water security of communities and has continued to pursue and
publish cutting-edge research in the fields of hydrology and water management.
The overall goal of our group is to understand and model complex human-hydrologic systems
to improve societal responses to water resources challenges. Human-hydrologic systems are
particularly vulnerable to climate variability and climate change and we focus on climate risk
assessment and management. Our work will provide insight for planning and adapting the
design and management of resilient water resource systems for a sustainable future.
Climate Stress Test in a nutshell
At its core, climate stress test is a bottom-up, exploratory modeling technique to understand how a system responds to changes in climate and discover future conditions that could lead to unacceptable or negative consequences in the underlying water resources system. A climate stress test involves four major steps:
The first step is to establish performance indicators and critical thresholds related to the water resources system to describe undesired consequences, for example, a water system reliability of below 95%. These performance indicators and thresholds are generally defined with the project stakeholders.
The second step to explore a wide range of future climate conditions that may occur in the future and assess the water resources system performance across these conditions using simulation models. Plausible future climate conditions can be obtained from a weather generator to produce numerous stochastic time series that preserve the variability and seasonal and spatial correlations of the historical climate record. Plausible climate change effects are then reflected on the stochastic time series by systematically varying selected statistical properties of climate variables such as average amount, frequency or duration.
The third step is to summarize the findings of the exploratory modeling analysis and depict the vulnerabilities identified such as violations of performance thresholds. This can be done through climate response maps that directly relate performance indicators to future conditions such as changes in mean temperature and precipitation.
The fourth step is to determine the plausibility of the problematic climate changes resulting vulnerabilities. This is done by making use of best-available information from various sources such as downscaled climate model projections, paleoclimate data or expert judgments. These sources of information can be combined with climate response maps to visualize the range of risks in the water resources system under climate uncertainty.

Pg. 07 Valley of Mexico City
Valley of Mexico City
Building freshwater resilience of the Valley of Mexico The Valley of Mexico is home
to Mexico City (MCMA), one
of the world’s largest urban
conglomerates with a total of
20 million inhabitants in its
metropolitan zone. The water
system that serves the city is
highly complex with diverse
and rapidly evolving demands
and an intricate institutional
network that underpins it all.
At present, 39 % of Mexico
City’s water supply is sourced
the Cutzamala and Lerma
Systems which are located west
of the city in the Valley of Mexico. This water is transferred to the MCMA at considerable cost
and with, at times, complex politics. The remaining 61% of the supply is extracted from an
already over exploited aquifer leading to continued subsidence of the city at rates that range from
4 to 24 cm annually. A trend analysis conducted by Mexico City’s water utility, SACMEX,
estimated that if current patterns continue unfettered, the percent of the population receiving
reliable water services will be decrease from 82% to 28% by 2025. The HRG, in partnership
with the World Bank, the Rockefeller Foundation and government counterparts in Mexico, are
implementing the Freshwater Resilience by
Design methodology to identify and prioritize
interventions that can help to alleviate the
current stresses on the water system in Mexico
City and the surrounding Valley of Mexico and
to build its resilience uncertainties and surprises
of the future.
Approach A modular approach of the Freshwater
Resilience by Design process is being adopted in
order to model the full water supply system of
the Valley of Mexico. The full systems may be
subdivided into three major components: the
Cutzamala System, the Lerma System, and
Mexico City (CDMX). In this instance, the first
two steps of the process (i.e. definition of
analysis scope and intervention opportunities
Mexico City Skyline

Pg. 08 Valley of Mexico City
and collaborative modelling) for each of the three component models will be undertaken
separately. At the end of the second step, the three component water systems models will be
joined in order to undertake the third and fourth steps of the process (i.e. Identify optimal
intervention portfolios and data visualization and intervention road map) for the Valley of
Mexico Water System as a whole. The Freshwater Resilience by Design process for the Valley
of Mexico as well as progress to date is depicted below.
The Freshwater Resilience by Design methodology employed in the Valley of Mexico
Due to the complex nature of the water
supply system in the Valley of Mexico,
a modular approach is being taken to
develop the Cutzamala, Lerma, and
Mexico City models. The Cutzamala
coupled systems and hydrological
model (CutzSim), which was the first
module to be undertaken, was
completed in the Summer of 2017. The
Lerma and Mexico City (LermSim and
SimCDM, respectively) are currently
under development and are expected to
be completed in the summer of 2018.
These three models will then be
integrated with a meta-model in the fall
of 2018.

Pg. 09 Valley of Mexico City
Initial Results:
Resilience in the
Cutzamala Water System The Cutzamala water system is located west of
Mexico City and represents a complex inter-basin
water transfer to the MCMA involving reservoirs
(mainly the dam reservoirs forming seven sub-
catchments, pumping stations (overcoming more than
1,100 meters of elevation difference), open channels,
tunnels, pipelines and aqueducts. The CWS was
constructed between the late 1970s and early 1990s,
and now supplies 20 to 25% of the freshwater used by
the MCMA. Figures on this page show the CWS and
a schematic of the model used.
The overarching goal for the CWS is to reliably supply
water to the nation’s capital, while respecting the
water rights of inhabitants of the catchment areas. The
evaluation conducted by the HRG is intended to
evaluate how potential investments and changes in the
operational rules of the system can help the system
achieve its operational goals into the future.
Valley of Mexico Model Schematic
The Cutzamala Water System in Mexico
Schematic of the CutzSim

Pg. 10 Valley of Mexico City
First, the performance of the current system under multiple climate futures (i.e. a climate stress
test) was evaluated in order to identify system vulnerabilities to changes in climate. The Climate
Stress Test shows the result of this climate change stress test of the current system under current
operating rules. In this figure, the contours represent maximum reliable yield of the system and
the black line represents the current delivery target (495 MCM annually). Critically, this figure
also shows us that the maximum reliable yield of current system under current climate conditions
is 469 MCM and that the majority of climate projections for 2050 will result in further reductions
in this maximum reliable yield.
Climate Stress Test of the Cutzamala System

Pg. 11 Valley of Mexico City
Next, the relative merits of
selected investments that might
improve the system’s resilience
were assessed, shown in the
Table on this page. The results of
the evaluation of investment
combinations (64 total) under
optimized operating rules which
are derived from maximizing
reliable yield and resilience of
the system are shown below. The
results indicate the proposed
development of Temascaltepec
reservoir is the best option for
increasing the maximum reliable
yield, robustness and resilience
of the system. However, it is the
most costly and controversial.
Following the initial completion
of the analysis an additional
investment (the Villa Victoria
Pressurized Canal) was
introduced and modeled. The
Cutzamala Water System Investment Options
Intervention Brief Description of Benefit Investment Cost
(MMex pesos)
Annual O&M Cost
(MMex pesos)
No intervention Business as usual 0 2,360 (1,610 + 750)
Villa Victoria 50 MCM extra storage & 8m3/s canal
(Hector Martinez)
7,000 +23
Bosque-Colorines Canal Increased capacity of canal between
Bosque and Colorines (7 m3/s)
10,000 +20
Temascaltepec Additional reservoir with capacity of 65 MCM.
18,000 +600
Platform at Bosque Decreased dead storage level at Bosque (30MMC)
2 +1
Pump Tuxpan Pumping groundwater below Tuxpan
(supplements 1.5m3/s during dry season)
1,500 +50
Tuxpan Irrigation New canal for irrigators at Tuxpan
(1.5m3/s capacity)
3,000 +15
Villa Victoria Pressurized
Tunnel New pressurized tunnel (20m3/s) to connect
pumps to Villa Victoria and Villa Victoria to
los Berros
1,600 0
Reoperation of Reservoirs Changing of operational rule curves for Villa Victoria, Bosque and Valle de Bravo Reservoirs in order to maximize the reliable yield and resilience of the system.
- -
Evaluation of Investment Option Portfolios for the Cutzamala Water System

Pg. 12 Valley of Mexico City
new consideration of Villa Victoria Pressurized Tunnel in conjunction with an expansion of the
reservoirs current capacity yields improvements in all performance metrics considered. With
additional storage capacity, this option becomes the best performing investment that does not
include Temascaltepec. This option is also less costly than the previously best performing
investment portfolio which did not included Temascaltepec. This option increases the maximum
reliable yield of the CWS to 562 MCM which represents about a 20% increase from the current
systems and falls just short of the approximate 22% increase which would be provided by an
investment in Temascaltepec. The robustness of this option is also the highest of the option
portfolios which does not include Temascaltepec. Regarding average recovery time after failure
of the CWS to deliver water to MCMA, this investment decreases the average recovery time
from about 10 days (the current system without reoperation of reservoirs) to about 1 day.
Noadditional investments
Investment PortfolioA:VillaVictoria,BosquePlatform,TuxpanPump
VillaVictoriaPressurized Tunnel
VillaVictoriaPressurized Tunnel,VVStorageExpansion
Parallel Coordinates plot showing the Performance of the new investments related to the Villa Victoria pressurized tunnel
relative to all previously evaluated investment combinations. For reference, the previously best performing portfolio without
Temascaltepec (Portfolio A) is also highlighted.
Pg. 13 Valley of Mexico City
The evaluation of this new investment in the Villa Victoria Pressurized Canal and expansion of
the Villa Victoria reservoir has been a milestone for the Freshwater Resilience by Design Process
in the Cutzamala system as it clearly demonstrates the benefit of increased connectivity in the
CWS, shown below.
Upcoming Milestones The HRG is currently expanding the models that will
be included in the final evaluation. This year will
focus heavily on stakeholder engagement to and
modeling efforts for the Lerma system as well as
Mexico City itself. In this effort, the HRG is
working closely with fellow experts at the University
of Cincinnati and National University of Mexico.
The project is ongoing and is expected to be
completed by September 2018.
Schematic of the Cutzamala Water System with and without the Villa Victoria
Pressurized Tunnel Invesment (left to right, respectively)
Mexico City Metropolitan Cathedral

Pg. 14 World Bank Water Security Diagnostic
World Bank Water Security Diagnostic The Hydrosystems Research Group is collaborating with the World Bank to develop a Water
Security Diagnostic tool. The Water Security Diagnostic is a systematic process to identify
water-related risks and opportunities, to determine factors that support or compromise water
security and to provide strategic recommendations on priority areas for investments. The
process focuses on a structured and repeatable assessment. The assessment will be conducted
as a collaborative process with a local World Bank country team in consultation with country
counterparts, local stakeholders and local and global experts.
Members of the Hydrosystems Research Group are working with Bank staff to draft the
Diagnostic and are implementing resilience thinking into the text of the document. The HRG
is involved in the structure of the Diagnostic and the implementation phases.
The phases of the diagnostic assessment and associated questions
The Diagnostic is divided into five steps, outlined here:
Phase I – Define Scope. The objective of this phase is to identify the scope of the diagnostic
assessment, including the development objective, geographic focus and resources available to
complete the assessment. The outputs of this step are a clear understanding of the scope of the
assessment, which actors and stakeholders should be involved in the preparation of the
diagnostic, and a detailed Terms of Reference for consultants who will be engaged in the
process.
Phase II – Establish Context. This phase has the objective of establishing the context and
describe the most relevant macro-trends in the study area. A complete review of the social,
economic and environmental characteristics of the study area is performed using existing data
and information. Particular attention to mega-trends in the study area and how they are

Pg. 15 World Bank Water Security Diagnostic
expected to affect water-related outcomes. In this phase, a review is completed of previous
World Bank engagements, especially those with respect to water sector investments. Past
lending and knowledge activities in the country are relevant to diagnosing issues and
identifying potential investment opportunities. The final component of this phase involves a
description of the mega-trends and their influence on water related outcomes, in general and
quantitative terms.
Phase III – Examine Outcomes This phase has two objectives: (i) determine to
what extent water related factors constitute a risk to society, the economy and the environment,
and (ii) determine if and to what extent water related factors provide opportunities for
development. This phase is split into three steps. Step 1 constitutes a review of the outcomes
of the actions of water security across three areas: society, the economy and the environment.
Step 2 benchmark’s the study area against “peers” of the same scale (country, basin, city).
This benchmarking is intended to compare or measure specific water related outcomes from
the study area to a standard based on regional or global averages. Step 3 involves developing a
narrative on the social, economic and environmental outcomes related to water supported by
data and benchmarking. This produces a detailed assessment of the status and trends of the
outcomes related to water that highlight the key areas for detailed diagnostic.
Phase IV – Diagnose actions of Water Security. The objective is to assess the
actions of water security that give rise to the outcomes in Phase III. Actions of water security
are divided into management of water resources, delivery of water services and mitigation of
water related risks. Actions in each category are diagnosed asking the following questions:
To what extent are water resources being managed sustainably, efficiently and
equitably?
To what extent are water services being delivered inclusively, reliably and
affordably?
To what extent are water related risks being recognized and mitigated to
enhance resilience in an inclusive manner?
The outputs from this phase is an understanding and description of the extent to which actions
are determining outcomes, especially those of most concern.
Phase V – Diagnose Capitals of Water Security. Assess the capitals supporting or
constraining the actions of water security. This phase combines insights from Phase III and IV
to link the actions of water security to the capitals of water security. This amounts to
describing why the actions are effective or not in determining positive water-related outcomes.
In this phase, the natural capital, infrastructure and financial capital, human capital,
information support, and political economy factors are assessed to whether each supports or
constrains water security. The output of this phase is the diagnostic assessment which
describes where aspects of the capitals of water security that constrain action or need to be
augmented. This outcome describes which capitals of water security are supporting or

Pg. 16 World Bank Water Security Diagnostic
constraining progress toward water security and informs strategic recommendations of priority
areas for investment and future program design.
The output of the Diagnostic process is a full report combining written material with geospatial
information to provide a geographically explicit representation of findings where appropriate.
The Diagnostic assessment answers two main questions: (i) what are the social, economic and
environmental water-related outcomes of greatest concern? (ii) which foundational capitals of
water security constrain or support the actions that determine these outcomes?
A framework for water security diagnostics, structured into three level and showing how outcomes are the combined
result of the capital and actions of water security.

Pg. 17 International Joint Commission Climate Change Study
International Joint Commission Climate Change Study
Pilot Study to Implement the IJC’s Climate Change Guidance Framework
Overview
The Hydrosystems Research Group conducted a Pilot Study to fully implement the
International Joint Commission’s (IJC) “Climate Change Guidance Framework” in the
St. Croix River Board and introduced the first step with all other Boards across the
continent. The IJC is a transboundary organization between Canada and the United
States to prevent and solve disputes related to water resources and pursue the
common good of both countries as an independent and objective advisor to the two
governments.
The Climate Change Guidance Framework is used to assist IJC Boards address
climate change within the bounds of their mandates. The framework guides the
Boards to analyze and act on climate change issues in a logical manner. The
Framework consists of four primary steps:
1. Organize – In the organize step, each Board formulates its climate change related
objectives and assesses what information is available and what is needed to prepare to
meet those objectives successfully. The goal of this step is for the Board to do a self-
analysis with a clear, complete understanding of the objectives that the Board is trying
to achieve.
2. Analyze – The analyze step has the Board produce quantified estimates of how a change
in climate might produce different outcomes for their activities. The Board prioritizes
the most critical, and evaluates the likelihood of the outcomes. This step involves
analysis to quantify the effects of climate change on Board activities. The analysis will
estimate how a change in climate may produce different outcomes for Boards.
3. Act – In the third step, act, the Board uses the tools and networks to quantify the problem
to evaluate different responses and based on this, the Board makes decisions that it
believes would improve their response. The step formulates a plan of alternative actions
the Board can undertake to address the concerns identified in the previous steps.
4. Update – The final step, update, is adaptive management or the establishment of a
process to improve the Board’s “act” decisions based on a formalized, ongoing effort to
systematically assess the Board’s challenges over time. A simple adaptive management
plan would be to revisit the discussion every five years, passively reviewing information
Pg. 18 International Joint Commission Climate Change Study
developed by others, and complete a short review to ask whether there is any reason to
go through the steps again.
The HRG introduced the pilot study to Boards at the IJC Semi-Annual meeting on May 4th in
Washington, DC. The steps of the Climate Change Guidance Framework were presented, and
the Boards, with the guidance of the HRG and other consultants, had a discussion on climate
change adaptation pathways. The pilot project involved two components: (i) introducing the first
step of the four step guidance framework (Horizontal Roll Out) across control, watershed, and
pilot watershed Boards and (ii) introducing the entire four step framework (Vertical Roll Out) to
the International St. Croix Watershed Board.
Horizontal Roll Out
The “Horizontal Roll Out” of the pilot involved an assessment of each Board’s missions and
objectives that could be impacted by climate change and what information the Board already
has, or needs, to prepare for and minimize risks associated with climate change. The goal of the
Horizontal Roll Out is to provide clear guidance to the Boards for addressing climate change in
IJC policy and operations using the best available institutional and organizational science and
stakeholder inputs available to the Boards. The Boards included in the “Horizontal Roll Out”
study include:
Accredited Officers for the St. Mary – Milk Rivers,
Columbia River Board of Control,
Kootenay Lake Board of Control,
Lake Ontario – St. Lawrence Board,
Lake Superior Board of Control,
Niagara Board of Control,
Osoyoos Board of Control,
Rainy-Lake of the Woods Watershed Board,
Red River Board,
Souris River Board
Vertical Roll Out
The “Vertical Roll Out” was performed in the St. Croix River basin. The St. Croix River is a
transboundary river along the Canada and United States border between New Brunswick and
Maine on the eastern end of the continent. The river is 110 miles (185 km) long and drains an
area of 1,642 square miles (4,271 km2). The river is in a unique location and comprises the
easternmost land border between the two countries. There are two principal chains of lakes in
the watershed’s headwaters. The eastern chain of lakes follows the mainstem of the St. Croix
River and includes two of the largest lakes in Maine and New Brunswick: Spednic and East
Grand Lake. The Eastern branch of the St. Croix forms the international border.

Pg. 19 International Joint Commission Climate Change Study
The “Vertical Roll Out”
analysis provides a bottom-up
assessment of climate change
vulnerabilities in the St. Croix
Watershed associated with
violating the Board’s specific
performance targets. The
method focuses on identifying
stakeholder-defined
vulnerabilities in a given
environmental resources
system to climate uncertainty,
rather than focusing on
predictions of future climate
that are subject to various
climate modeling and
downscaling approaches. This is typically done by considering a broad
range of plausible futures, and then explore vulnerabilities across those
futures using computationally inexpensive simulation models. Identified
vulnerabilities are then linked to climate information obtained from
climate models or experts for aiding the decision-making processes.
The bottom-up climate vulnerability analysis approach adopted to the St.
Croix Watershed pilot study consists of four phases:
1. Definition of objectives and critical thresholds related to the
minimum flows and lake levels at various points in the basin,
2. Developing a coupled hydrology-water system model at the
appropriate scale to analyze system performance under different
conditions,
The St. Croix River basin was first
inhabited nearly 11,000 years ago by post
ice-age populations and has been
occupied by a succession of native
populations since. The river was
historically used as a travel route to the
neighboring Penobscot and St. John River
systems. In 1604, French explorers
established the first New World colony on
St. Croix Island, located in the estuary.
The St. Croix River basin was
subsequently settled by the English and
others who have used the basin’s
resources for lumbering, ship building,
milling, and hydropower. Today, the
natural, cultural, and historic resources of
the St. Croix watershed still help support
the local economy. The majority of the
basin’s area is covered by forests, and
wood harvesting and processing is the
most important industry in the St. Croix
area. The watershed also provides
abundant natural recreational
opportunities and wildlife habitats. The St.
Croix River is known to canoeists, anglers,
and naturalists as one of the most pristine
recreational rivers in the region.

Pg. 20 International Joint Commission Climate Change Study
3. Implementation of climate stress test, to assess the violations related to the previously
defined critical thresholds across a broad range of plausible climates, and
4. Identifying climate-informed risks by linking climate stress test outcomes to the outputs
of Global Circulation Model (GCMs).
The International St. Croix
River Watershed Board’s
main objective is to
maintain appropriate
flows and levels at several
key locations within the
basin, based upon the St.
Croix River Orders of
Approval. Climate change
is predicted to influence
the climatology and
hydrology of the St. Croix
Basin. The question is,
how might that affect the ability to meet the
Board’s objectives? All of the GCM models
predict some warming to occur by 2050, from
0.2°C to over 4°C.
Droughts are expected to become more intense in the future. Drier
periods may last longer in the future, impacting the
hydrology of the basin. As temperature rises, more
precipitation will fall as rain and the declining
snowpack will affect the timing of runoff.
The HRG utilized a hydrologic-systems
model to explore the vulnerabilities
associated with violating the Board’s
specific performance targets. The stress
test is performed by first generating a wide
range of future climate conditions, and then
simulating the system response (i.e., the
physical hydrology and water system
operations to those climate conditions).
The HRG performed a climate
informed risk analysis, where the
The International St. Croix River Watershed
Board of the IJC was established in 1915 and
monitors the ecological health of the St. Croix
River boundary waters. The Board ensures
compliance with the IJC's Orders of Approval for
structures in the St. Croix River. Today, there
are approximately 25,000 people living in the
basin, around five population centers (defined
as incorporated municipalities with more than
one thousand inhabitants): St. Stephen, St.
Andrews, and McAdam in New Brunswick, and
Calais and Baileyville in Maine. All of these
municipalities except McAdam are located in the
lower part of the watershed, and over 75% of the
population lives at the lower end of the
watershed within 10 miles (16 km) of the
estuary. Most of the watershed is sparsely
populated.
Schematic of the St. Croix River watershed system
The St. Croix Board at Forest City Dam

Pg. 21 International Joint Commission Climate Change Study
results from the climate stress test
were evaluated with the GCM
projections to identify the future
conditions of the greatest
concern.
Modeling Results
The climate response surface
(see the figure below) shows the range
of minimum flow violations in the
watershed across a plausible range of climate
changes, i.e., changes in mean temperature up
to 5 °C and changes in annual mean precipitation from -20% to
30%. Results indicate that the number of violations can be as
high as 60 per year under very dry (-20% decrease in precipitation) and very warm (5°C increase
in temperature) future conditions. However, violations are less than 5 times per year in the GCM-
projected range of climate changes, which are super-imposed over the climate response surface.
Overall, the analysis shows that the total frequency of lake level violations is highly sensitive to
changes in the annual mean precipitation, and range from
zero to more than 10 violations per year. The frequency of
violations is up to 5 violations per year under a
precipitation change of -20%, and up to 12 violations per
year under a precipitation increase of 30%. However, the
total frequency of lake level violations in the GCM-
projected range is less than 5 violations per year. The total
frequency of minimum flow violations can be as high as
50 times per year under the driest (-20% change in
precipitation) and the warmest (+5 °C) future. However,
based on the current set of GCM projections, these future
changes are less likely to occur. The frequency of
violations in the GCM-projected range ranges from about
0 to 5 violations per year.
The Pilot Study was well received by the IJC
Commissioners, and the Hydrosystems Research Group
will present the results of the Pilot Study to the
Commissioners and Boards at the next Spring Semi-
Annual Meeting.
ForestCityDam
VanceboroDam
GrandFallsDam
Dennisstream
PassamaquadyBay
St.Croix
atBaring(EC)Woodland
Dam
WestGrandDam
MilltownDam
StCroixatVanceboro(USGS)
Dennisstream
nearStStephen(EC)
Forestcitystream(EC)
Grandfalls
flowage(USGS)
GrandLake
stream(USGS)
St.Croixat
Calais(USGS)
Climate response surface showing the total frequency of minimum flow
violations in Forest City Dam, Vanceboro Dam, the St. Croix River at
Baring, Maine. Superimposed circles over the response surface show
GCM projections obtained from the CMIP5 ensemble for the St. Croix
Watershed.

Pg. 22 OpenAgua
OpenAgua
OpenAgua: A Web-Based Application for Modeling Water Systems for Water Resources
Planning and Management Overview Water system models are often at the core of a systems analysis approach undertaken by the
Hydrosystems Research Group to understanding water systems under uncertainty, and are widely
used to inform water planning. However, system models have historically been developed on
desktop computers by individual specialists, who act as gatekeepers to the system model and its
data and results. While some existing applications (e.g., WEAP, RiverWare, AquaTool, etc.)
make water system modeling easier—and accessible to the non-coder—their confinement to
computer desktops limit 1)
their potential in a distributed
decision-making environment
and 2) their computational
complexity, which may be
limited by a computers
processing power.
Modern web technologies
help ameliorate these issues.
While accessible online
communication has existed
for well over two decades
now, only recently have web
application (web app)
frameworks become
sufficiently advanced to
enable development of fast,
good-looking, highly
interactive web apps, as we see in, for example, Google Docs. Furthermore, cloud computing
services enable easy access to computers far more powerful than what may be immediately
accessible to a modeler.
Objectives OpenAgua (www.openagua.org) aims to be a one-stop web application for collaborative water
systems modeling using the best of these recent innovations in web technologies. Specifically,
with OpenAgua the Hydrosystems Research Group seeks to help deliver on the promise of the
web to facilitate collaboration in all facets of water systems modeling, including development of
the model itself (building a system network, entering data, designing “stress tests”, etc.), running
a built-in or user-supplied model, developing management options and portfolios, integrating
Schematic of the Mexico City water supply system in OpenAgua

Pg. 23 OpenAgua
climate and other stressor scenarios, and exploring model
results. Importantly, we envision a direct connection
between the model & data and stakeholders, via
stakeholder-centric interfaces, to allow stakeholders to
interact with the model & data directly, not necessarily
facilitated by an intermediary modeling expert. While
OpenAgua will include a range of control and
visualization tools out-of-the-box, it will also enable
development of new interaction tools that can be
developed in collaboration with stakeholders.
In the context of on-going efforts in the Hydrosystems
Research Group, OpenAgua is being developed to
address the immediate need of an online, open source
graphical interface and model to assess and enhance
resiliency of Mexico City’s water system to multiple
stressors, and to assess the vulnerability of San
Francisco’s water system to climate change.
Summary of Recent Activities Phase I saw the development of a preliminary prototype, using somewhat older web
technologies (e.g., jQuery).
Phase II, now well underway at UMass, comprises of:
1) Replacing the older technologies by newer, more appropriate technologies. Among
other improvements, the application is being converted to use the React JavaScript
library. Compared to the predecessor library used (jQuery), React results in a faster
application (better for application users) and is easier to understand (better for
application developers).
2) Developing/refining core features of the platform. These include, among others:
A facility to share/control access to water system with other platform users and
the public for collaboration and communication (Figure 1).
A prototype simplified view of a “public” project outside the core application
(Figure 2). This could facilitate communication of modeling efforts and
sharing results with collaborators and/or the public.
The ability to run a model. Though first achieved in Phase I, this facility now
enables:
i. Running a model using a manually-added cloud computer (using the
Amazon Web Services platform)
ii. Seeing model progress, even after logging out and logging back in.
iii. Running any arbitrary model developed by the user, not necessarily
the demand-driven model packaged with OpenAgua.

Pg. 24 OpenAgua
Interconnectivity with other web-
based services. For example, OpenAgua
connects to Google Earth Engine to display
global streamlines (from the HydroSHEDS
datasets), which can facilitate drawing river
networks. (In the future, this will connect with
a build-in hydrologic modeling facility).
These core features, though not fully
developed, have been developed sufficiently
over the past year to demonstrate viability, as
shown in the figures below, and continue to be
actively developed/refined. In addition, many
other features continue to be
developed/enhanced.

Pg. 25 San Francisco Climate Risk Assessment
San Francisco Climate Risk Assessment
A Climate Risk Assessment of the San Francisco Public Utility Commission Water Supply System
Overview The Hydrosystems Research Group is partnering with
the San Francisco Public Utilities Commission (SFPUC)
to perform a climate risk assessment on its urban water
supply. The San Francisco Bay Area obtains water from
watersheds distributed across three distinct regions in
California, each with a unique topology and hydrology.
These regions are referred to as
the Upcountry (in the Sierra
Nevada), the Alameda and the
Peninsula watersheds (west of
the Central Valley), shown in
the figure below. Almost 85%
of water supplied by the
SFPUC comes from the
Upcountry watershed.
Reservoirs in the Alameda
watersheds, along with those in
the Peninsula, comprise the
local storage available to the
SFPUC, and therefore have a
high strategic importance
despite the relatively small
percentage (~20%) of total
water supplied that they
comprise.
Climate change and other
changing conditions may jeopardize the future ability of the Upcountry watershed to meet the
San Francisco Public Utilities Commission’s (SFPUC) desired level of service. Current planning
will benefit from early identification of potential vulnerabilities and evaluation of possible
adaptations to address them.
Water supply areas of the San Francisco Water Supply System

Pg. 26 San Francisco Climate Risk Assessment
The Hydrosystems Research Group is working with SFPUC to provide the insights needed to
plan for an uncertain future by conducting a comprehensive vulnerability assessment of climate
and other drivers for change and adaptation planning process. A tailored methodology will be
utilized to complete the following tasks:
1. Identify vulnerabilities through exhaustive, systematic exploration of uncertainty
ranges of future conditions
2. Assess the risks associated with these vulnerabilities through integration of the best
available climate information
3. Develop and evaluate an Adaptation Plan consisting of a portfolio of options that
together are flexible and robust to a wide range of futures
Hydrosystems Group Approach As has always been the case, future performance of water systems
depends on a number of factors that may change in the future. The
approach used here provides a comprehensive understanding of
system performance over a wide range of possible futures, and in
doing so, clearly defines the conditions that cause failure and
identifies priorities for adaptation planning. The computational
engine of this analysis is a multi-dimensional, algorithmic
sensitivity analysis – a stress test – that explores ranges of uncertain
variables, including both climate and non-climate uncertainties, and
creates a database of system response that is then mined to identify
vulnerabilities. The analysis results are not dependent on specific
climate projections and all their uncertainties, but climate
projections are interrogated to assess a “level of concern” to
associate with vulnerabilities that are identified. Likewise, non-climate vulnerabilities are further
analyzed to assess the level of risk they present. The execution of this effort depends on
functional hydrologic models of reservoir inflows and system models representing reservoir
operations, infrastructure connections, water demands, revenue generation, costs and regulatory
requirements.
Phase I – Develop Detailed Workplan In the first Phase we design and execute an exhaustive vulnerability assessment that provides a
comprehensive understanding of the expected water system performance relative to goals and
expectations. In doing so it will reveal the specific combination of factors that lead to a failure
to meet performance goals, which we define as vulnerabilities. A number of preparatory steps
are required to complete the vulnerability assessment.
The Adaptation Plan will provide
guidance for water supply decisions that address
the risk of system vulnerabilities over the next 50
years, answering three key questions:
1. Under what conditions and when will the
RWS no longer meet water supply
performance criteria?
2. Is climate change the most important
driver of vulnerability for the RWS and if
not, what is?
3. What is the capability to manage
vulnerabilities and what should the
associated level of concern be?

Pg. 27 San Francisco Climate Risk Assessment
The first task in this vulnerability assessment was the development of the analysis framework
based on clear articulation of the goals of the study, scope of the study and the available
resources, including data and modeling tools. To do so, an initial internal kick-off meeting was
held at SFPUC headquarters. This 2-day kick off meeting consisted of a workshop with the Water
Enterprise Executive Team (WET) of the SFPUC, interviews with senior SFPUC staff and site
visits. During the workshop with the WET, a group discussion was held to select long-term
sources of vulnerability to include in the study, rank these concerns in order of importance and
determine the level of uncertainty associated with each of these vulnerabilities. A source of
vulnerability is defined as an uncertain factor or condition that lies outside the control of the
Water Enterprise and can significantly disturb the operations of the Regional Water System. The
figure below represents the workshop participants’ characterization of uncertainty and
importance for each of the sources of vulnerability.
There are a few notable high level take-aways from these discussions. The first is the high
ranking of natural hazards in terms of both uncertainty and importance. Next are a tier of
uncertainties clustered in terms of their uncertainty ranking: climate change, political/legislative,
technology, environmental and drinking water regulations, and regionalization. Their assessed
importance varies yet based on the discussions and pre-workshop interviews each has the
Scatterplot showing the distribution and importance of, and uncertainty associated with, identified sources of vulnerability
Pg. 28 San Francisco Climate Risk Assessment
potential for significant effects on the Water Enterprise performance. These uncertainties have
probabilities of occurrence that are not known or easily estimated, unlike earthquakes, and thus
are best explored through the methods to be employed in the vulnerability analysis. Finally, there
is a wide disparity in the
ratings of the degree of
importance of almost all
uncertain factors, reflecting
the range of opinions within
the executive team and the
difficulty in assessing
importance a priori. Indeed, a
primary goal of the
vulnerability analysis will be
to elucidate the importance of
these factors through
quantitative assessment of
their actual effects, allowing
an informed prioritization of
concerns, and if necessary,
adaptive responses.
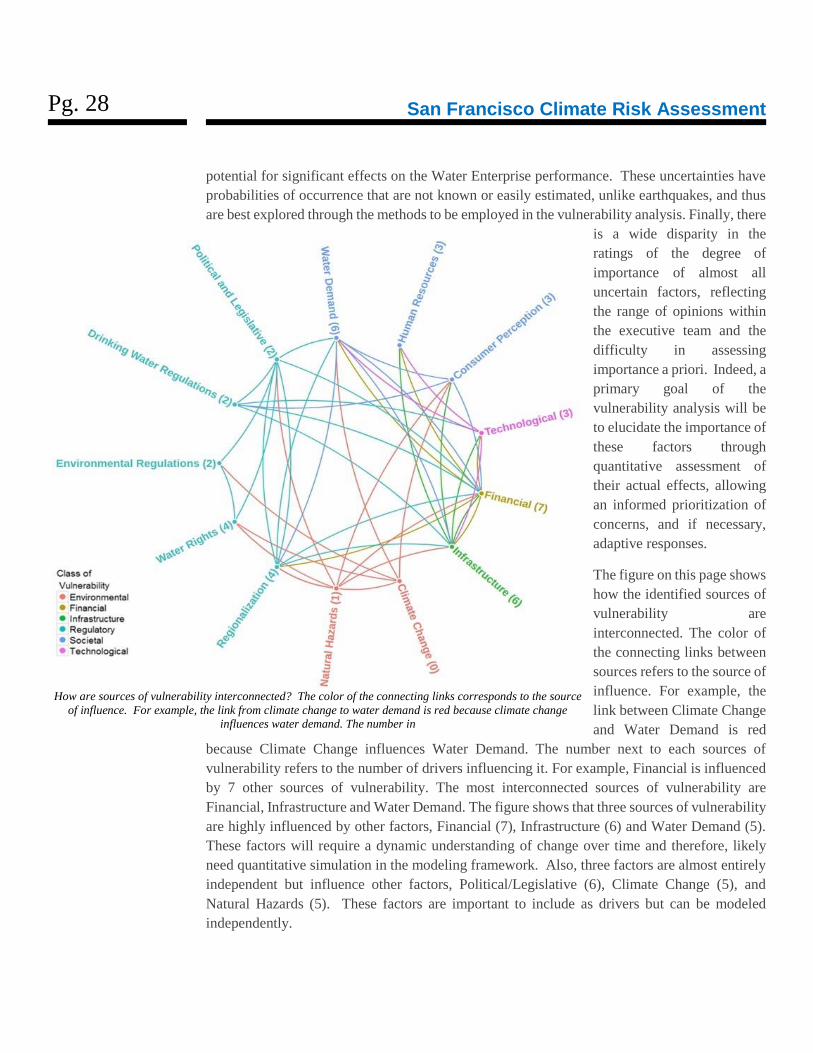
The figure on this page shows
how the identified sources of
vulnerability are
interconnected. The color of
the connecting links between
sources refers to the source of
influence. For example, the
link between Climate Change
and Water Demand is red
because Climate Change influences Water Demand. The number next to each sources of
vulnerability refers to the number of drivers influencing it. For example, Financial is influenced
by 7 other sources of vulnerability. The most interconnected sources of vulnerability are
Financial, Infrastructure and Water Demand. The figure shows that three sources of vulnerability
are highly influenced by other factors, Financial (7), Infrastructure (6) and Water Demand (5).
These factors will require a dynamic understanding of change over time and therefore, likely
need quantitative simulation in the modeling framework. Also, three factors are almost entirely
independent but influence other factors, Political/Legislative (6), Climate Change (5), and
Natural Hazards (5). These factors are important to include as drivers but can be modeled
independently.
How are sources of vulnerability interconnected? The color of the connecting links corresponds to the source
of influence. For example, the link from climate change to water demand is red because climate change
influences water demand. The number in
Pg. 29 San Francisco Climate Risk Assessment
Phase II – Conduct Vulnerability Assessment A vulnerability assessment will be designed and performed to explore the RWS performance
under a wide range of uncertainties identified and evaluated in terms of the performance metrics
and thresholds specified. The computational engine of the vulnerability assessment is a multi-
dimensional, algorithmic sensitivity analysis that links the simulation tools used to represent the
system and estimate its performance under changing conditions. This stress test exhaustively
and systematically tests the system using Latin hypercube sampling (Stein, 1987) to identify
vulnerabilities and link them to the specific factor, or combination of factors that causes them.
This combination of factors that constitute a vulnerability is called an “ex post” scenario,
meaning the key scenarios of interest are identified as a result of the analysis, rather than being
defined prior to the analysis (so-called “a priori” scenarios). The ex post scenarios serve as the
basis for risk assessment (assigning levels of concern or priority to the vulnerability) and
adaptation planning. They are identified using data mining algorithms such as the Patient Rule
Induction Method (PRIM).
The stress testing algorithm is a computational engine that links the individual modeling tools
that are used to represent and simulate the water system performance. For SFPUC, this
includes hydrologic models of the watersheds that produce reservoir inflows, water resources
models or “system” models that represent reservoir storage, operations, infrastructure linkages,
demand, and revenue generation and a climate/weather generator, which is a stochastic model
that generates time series of inputs for the hydrologic models that simulate a wide range of
climate changes. The systems model will also be extended to include other key uncertain
factors, such as social, technical, economic and other changes. The potential need to include
water quality modeling will also be considered.
The final step is to assign the relative level of concern to the vulnerabilities that are identified,
which is associated with judgment of how likely they are and can serve to assist prioritization
of actions. The estimation of level of concern typically depends on the judgment of experts
and incorporation of quantitative estimates when appropriate, such as those used to derive
probabilities from ensembles of GCM projections. These estimated risks will serve as a
starting point for risk assessment and adaptation planning conducted in the next Phase of this
project.

Pg. 30 SERDP Department of Defense
SERDP Department of Defense
Climate Informed Estimation of Hydrologic Extremes for Robust Adaptation to Non-
Stationary Climate Overview The purpose of this project is to develop and evaluate methods to produce the next generation of
intensity-duration-frequency curves for engineering design at United States Department of
Defense installations. More simply, this project aims to develop new methods based on large
scale climate patterns to project extreme rainfall and flood events, and then determine how those
projections can be used in engineering design.
This project is funded by the Strategic Environmental Research and
Development Program within the United States Department of Defense and is
being performed in collaboration with Columbia University and the National
Center for Atmospheric Research. Within the Hydrosystems group, the
primary researchers on this project are Baptiste Francois (postdoctoral researcher) and Katherine
Schlef (Ph.D. candidate), with help from Sungwook Wi (postdoctoral researcher) and Jacob
Kravits (undergraduate summer research assistant).
Within the last year, there have been four main avenues of research by the Hydrosystems group:
(1) a review of methods for engineering design of flood mitigation strategies under non-
stationarity; (2) development of various hydrological models for the catchments in the Upper
Missouri River basin; (3) development of long-term projections of flood events in the Ohio River
Basin using large-scale climate patterns; and (4) a comparison of different methods of choosing
the flood magnitude for levee design in Louisville, KY. Additionally, the Hydrosystems
Group hosted a two-day meeting with project collaborators in November 2016 at
UMass, and members of the group presented results at the 2016 Fall Meeting of the
American Geophysical Meeting in San Francisco and at the 2017 Northeast Graduate
Student Water Symposium at UMass.

Pg. 31 SERDP Department of Defense
Research Avenue 1: A review of methods for engineering design of flood mitigation strategies under non-stationarity For decades, design for hydrologic extremes has played an important role in the development of
the hydrological sciences. Today, while the scientific literature discusses the emergence of
factors leading to non-stationarity in hydrologic extremes, methods for designing real-world
infrastructure for water resources management (e.g., dams and levees) still maintain the
assumption of stationarity. The aim of this study is to discuss the different options that are
currently available for assessing the value of the design flood in a nonstationary world. We first
review the main sources of non-stationarity in time series of hydrological extremes. We then
present the different methods for estimating the design flood in the context of climate change,
one of the major sources
of non-stationarity. This
review reveals the gap
between the available
methods and real-world
design guidelines. We
then highlight that the
notion of uncertainty in
only poorly represented
and discuss the
advantages and
drawbacks of new
methods that could bridge
this gap.
Research Avenue 2: Development of various hydrological models for the catchments in the Upper Missouri River basin There has been growing interest for hydrologists and water resources managers about the
emergence of non-stationarities associated with the hydro-meteorological processes driving
floods. In particular, climate change is a key potential cause of non-stationarity, climate change.
Understanding the effects of climate change on hydrological regimes of the Missouri River is
challenging. In this region, floods are mainly triggered by snow melting, either when
temperatures get mild in spring and summer, or when rain falls over snow in early spring and
fall. The sparsely gauged and topographically complex area degrades the value of hydrological
modeling that otherwise might foreshadow the evolution of hydro-meteorological interactions
between precipitation, temperature and snow.
Annual peak flow for the Red River at Fargo, North Dakota. A significant increasing trend (i.e., non-
stationarity) is observed in the latter portion of the record.

Pg. 32 SERDP Department of Defense
In this work, we explore
the utility of deep
learning for assessing
flood magnitude change
under climate change. By
using multiple hidden
layers within artificial
neural networks (ANNs),
deep learning allows
modeling complex
interactions between
inputs (i.e. precipitation,
temperature and snow
water equivalent) and
outputs (i.e. water
discharge). The objective
is to develop a
parsimonious model of
the flood processes that
maintain the contribution
of nonstationary factors
and their potential
evolution under climate
change, while reducing
extraneous factors not central to flood generation. By comparing ANN’s performance with
outputs from two hydrological models of differing complexity (i.e. VIC, SAC-SMA), we
evaluate the modeling capability of ANNs for three snow-dominated catchments that represent
different flood regimes.
Research Avenue 3: Development of long-term projections of flood events in the Ohio River Basin using large-scale climate patterns Estimating future hydrologic flood risk under non-stationary climate is a key challenge to the
design of long-term water resources infrastructure and flood management strategies. In this
work, we demonstrate how projections of large-scale climate patterns can be credibly used to
create projections of long-term flood risk. Our study area is the northwest region of the Ohio
River Basin in the United States Midwest. In the region, three major teleconnections have been
previously demonstrated to affect synoptic patterns that influence extreme precipitation and
streamflow: the El Nino Southern Oscillation, the Pacific North American pattern, and the
Pacific Decadal Oscillation. These teleconnections are strongest during the winter season
Observed data, fitted statistical models, and projections for an example gage in the Ohio River Basin. GCM refers
to general circulation model, MMM refers to multi-model mean (that is, an average of the projections), rcp 8.5
refers to the most extreme scenario of future greenhouse gas emissions, M0 and M1 refer to stationary and
nonstationary statistical models, respectively, and CIs refer to confidence intervals.

Pg. 33 SERDP Department of Defense
(January-March), which also experiences the greatest number of peak flow events. For this
reason, flood events are defined as the maximum daily streamflow to occur in the winter season.
For each gage in the region, the location parameter of a log Pearson type 3 distribution is
conditioned on the first principal component of the three teleconnections to create a statistical
model of flood events. Future projections of flood risk are created by forcing the statistical model
with projections of the teleconnections from general circulation models selected for skill. We
compare the results of our method to the results of two other methods: the traditional model chain
(i.e., general circulation model projections to downscaling method to hydrologic model to flood
frequency analysis) and that of using the historic trend. We also discuss the potential for
developing credible projections of flood events for the continental United States.
Research Avenue 4: A comparison of different methods of choosing the flood magnitude for levee design in Louisville, KY
As flood risk in
cities increases due
to changes in climate
and land-use, flood
mitigation options
are needed to limit
future damages.
However, analysis
regarding the
optimum design
flood, i.e. the flood
magnitude that a
mitigation option
protects against,
require choices on
behalf of the analyst.
This work compares
the modeling options
of using probability-
only versus risk-
based analyses and
assuming stationary
versus nonstationary
flood probabilities.
As a case study, we
evaluate levees in
Results of the nonstationary risk-based analysis (the range of expected damages and total expected costs comes
from the range of projections of future floods – the dark line within the range is the mean value). The optimum
design flood is that which minimizes the total expected cost – assuming the mean is a good approximation, the
design flood would be 650,000 cfs.
600000 650000 700000 750000 800000 850000 900000 950000
0500
1000
1500
2000
2500
3000
Nonstationary and Risk-Based
Flow (cfs)
Tota
l E
xpecte
d C
ost
($m
il)
Expected Damages
Levee Cost
Total Expected Cost
Total Expected Cost Range
Expected Damage Range
8.56 19.2 101 200 1000
Levee Return Period (Future)

Pg. 34 SERDP Department of Defense
the historically flood-prone city of Louisville, Kentucky. For probability-only analysis, the
optimum design flood is the 100-year flood. For risk-based analysis, the optimum design flood
is selected based on minimization of total expected cost, defined as the sum of expected damages
and mitigation cost for the corresponding levee size. Damages associated with each levee were
determined via Hazard US (HAZUS). HAZUS is a GIS-based software developed by the Federal
Emergency Management Agency that calculates flood damages based on topographic data, flood
magnitude data, and damage curves. Levee cost was estimated utilizing a calibrated function of
the averaged levee height. Stationary flood probabilities were based on the historic record while
nonstationary flood projections were created based on a relationship to large-scale climate
patterns. Based on the results of the case study, we recommend a risk-based nonstationary
analysis as extreme climate projections change both total expected cost and design flood, while
a risk-based analysis guarantees a minimization of total expected cost and a justification of a
design flood. This comparison is generalizable to other flood mitigation options and enables
more informed investments that improve safety while reducing costs associated with over or
under preparation.

Pg. 35 Tanzania - Freshwater Resilience by Design
Tanzania - Freshwater Resilience by Design
Prioritizing Investments in the Rufiji, Wami-Ruvu, and Pangani Basins of Tanzania
Tanzania’s water resources are facing challenges as the country undergoes rapid
change. The East African country’s population is expected to double by
2035 and changing lifestyles and evolving water consumption patterns are
adding extra stress to this limited resource. Competing sectoral water
demands and uncoordinated future economic development plans in each
basin will intensify Tanzania’s water resources challenges.
Investments in water resources can help Tanzania realize its
growth potential if the investments are appropriate and
focused. Currently several basins in Tanzania have Integrated
Water Resources Management plans, however, these plans are a
laundry list of investments that requires prioritization to be
effectively realized. With rapidly evolving demands for water across
multiple sectors, this coordinated approach will be crucial for
Tanzania to realize its development plans. Through the
implementation of the Freshwater Resilience by Design
methodology, the Hydrosystems Research Group, World Bank
and Government of Tanzania will collaborate to produce a
prioritized plan of investments in the Rufiji, Wami-Ruvu and
Pangani basins.
Funding for this project comes from the Rockefeller Foundation

Pg. 36 Tanzania - Freshwater Resilience by Design
Summary The Hydrosystems Research Group is partnering with the World Bank and the Government of
Tanzania to implement the water resources investment prioritization methodology Freshwater
Resilience by Design. The methodology is a systematic process for evaluating and ranking
investments singularly and in combination while accounting for future climate variability and
change and other deep uncertainties that affect the performance of investments in the water
resources sector. The result is an investment road map for achieving water-related development
goals that is resilient to the uncertainties and surprises of the future.
The methodology was developed to provide technical expertise in support of the ongoing joint
Rockefeller Foundation and World Bank freshwater resilience partnership. Implementation of
this methodology is part of continued engagements by the World Bank in Tanzania to strengthen
institutions, prioritize lines of support and identify investment needs in the water resources
sector. Implementing this approach in three basins in Tanzania will build on
the existing World Bank Integrated Water Resources Management work in
Tanzania. The methodology will be implemented by the Hydrosystems
Research Group in three river basins (Rufiji, Wami-Ruvu and Pangani) in
close collaboration with the World Bank and the Government of Tanzania.
The Freshwater Resilience by Design methodology utilizes a systematic
process for evaluating and ranking investments singularly and in combination
while accounting for future climate variability and change and other deep
uncertainties that affect the performance of investments in the water resources
sector. The process adopts a bottom up approach to risk assessment that aims
to thoroughly understand the basin’s vulnerabilities to climate change in the
context of other non-climate uncertainties (for example, economic,
environmental, demographic, or political). The methodology promotes
freshwater resilience as a lens through which water resources investment
prioritization is analyzed.
A resilient river basin is one where communities within a basin have options
and use them to manage change, both sudden and gradual, while not
undermining the long term ability of the basin to thrive. The analysis helps
to identify investment combinations that perform well across a wide range of
potential future climate conditions, as opposed to seeking solutions that are
optimal in expected conditions but fragile to conditions deviating from the
expected. The result is an investment road map for achieving water-related
development goals that is resilient to the uncertainties and surprises of the
future.

Pg. 37 Tanzania - Freshwater Resilience by Design
Basin Descriptions The Rufiji basin is characterized by competing water demands
from several sectors, with agriculture, hydropower and flows for
the environment vying for the same scarce resource. Challenges
are acute during dry season and the effects on flow in dry years
are worsening as uncoordinated agriculture expansion increases
in the basin (see Box 1). National Parks and Game Reserves
occupy a large portion of the basin, and increases in irrigated
agriculture area through a government funded initiative
(SAGCOT) will place further stress on water resources.
Continued uncoordinated irrigation expansion, future
hydropower development and will lead to reduced environmental
flows, jeopardizing protected parks and reserves and the
dependent tourism economy.
Our convoy of Land Cruisers drove down the washboard dirt road as we passed villages and small children and adults carrying buckets of water balanced precariously on their heads. As we got further away from the paved road and relative comfort of the small town of Iringa, the settlements got smaller and smaller. Along the narrow one lane road, our vehicles kicked up so much of the dry soil that we followed a cloud of dust in front of us – not even a discernable outline of the Land Cruiser was visible. We passed thousands of leaf-less trees and shrubs that looked thirsty for water. After over a hundred kilometers of this journey, we arrived at the gate to Ruaha National Park, one of the ecological gems of the Rufiji Basin in southern Tanzania. This is a vital ecosystem for megafauna (elephants, giraffes, lions, antelope, hippos) and a major tourist destination. Another 20 kilometers onward, we arrived at the Great Ruaha River. Had we not passed a sign and crossed a bridge, we may have completely missed the river. There was zero flow.
The dry season in Tanzania lasts for months, and our trip to the Great Ruaha River in late September occurred during one of the driest times of the year. The dry season, however, did not always mean zero flow in the Great Ruaha. Hundreds of kilometers upstream, thousands of liters of water are abstracted from the Great Ruaha before it enters the park. Most of the water is diverted from the river to feed thirsty crops in both large scale formal and smaller informal farms. The water used for increasing agriculture upstream has diminished the flow through the National Park and increased the prevalence of zero flow days in recent decades. Hundreds of kilometers downstream of the park, two hydropower reservoirs (Mtera and Kidatu) are operating at far below their peak capacities. The ring of exposed land around the Mtera reservoir grows larger and larger as less water flows from upstream to fill the large body of water – the largest in the Rufiji basin.
As the trees, megafauna, farmers, and the empty reservoirs await the onset of the rainy season, many wonder how this limited resource can be shared, especially during the dry season. As we stood along the banks of the great floodplain and looked at a few small pools below, we could see this competition taking shape amongst the park’s fauna. A herd of elephants was drinking and playing in a pool where each animal had to squeeze to gain access to the small supply of water. Hippos were crowded into a pool with crocodiles just to try and stay submerged under the hot African sun. Zebras, gazelles, and giraffes traveled the banks looking for a suitable pool to stop for a drink. A lazy lion perched at a high point along the bank monitored the scene.
It’s hard to imagine that in the rainy season, the torrent of water passing in the space before us could over top the banks several meters above the flat floodplain. During this time, there is plenty of water to go around, but in these driest times of year, allocating water to various different demands has becoming increasingly difficult.
Box 1 - Ruaha National Park in the Rufiji basin during the dry season
Elephants gather around a small pool in the Great
Ruaha River during the dry season
Ruaha
National
Park

Pg. 38 Tanzania - Freshwater Resilience by Design
The Wami-Ruvu basin contains the urban centers of Dar es Salaam, Morogoro and Dodoma,
the capital city. These rapidly growing urban areas demand more water each year, and there are
already plans for expanded irrigation and industry in the basin. Expanded industrial activities are
planned in the basin, particularly in the corridor between Dar es Salaam and Morogoro, further
stressing the water resources in this area of the basin.
The Pangani basin is the most water stressed catchment in Tanzania. With expanding water
abstractions projected for urban and industrial centers, existing hydropower and irrigation
requirements and flows for the natural environment, coordination is needed to account and
allocate water in the basin.

Pg. 39 Tanzania - Freshwater Resilience by Design
Implementation Rolling out the Freshwater Resilience by Design methodology in Tanzania will require a strong
partnership between the HRG, World Bank and Government of Tanzania. The HRG began this
engagement in September 2017 and it is expected to continue through September 2018. The
following steps outline the process and timeline for applying the methodology to the Rufiji,
Wami-Ruvu and Pangani basins in Tanzania.
Define Resilience and Scope of Analysis – This process will begin with an initial
inception workshop that convenes stakeholders, establishes relationships, and defines
metrics for success in each basin. This meeting will set the scope of the analysis and
define the investment prioritization objective.
Collaborative Modeling – The HRG will work with the World Bank and
Government of Tanzania to develop a coupled hydrologic and systems model of each
basin. The details of the modeling will be completed collaboratively by the HRG and
a technical team within the government identified within each basin. The model will
represent the physical features of the basin and highlight key nodes where further
analysis can take place. The models will be calibrated and validated over a period of
record to be determined, based on available streamflow and precipitation data. The
models will be modifiable to test various investment scenarios for prioritization.
Data Analytics Discovers Optimal Resilience Investment Portfolios – The
collaborative team conducts the multi-criteria, multi-scenario options analysis
optimization. The team will run hydrologic and systems models through a stress test
to determine the optimal investment combination to achieve the goals defined in the
first phase. The metrics used in the analysis align with the specific interests of
stakeholders across sectors defined during the inception meeting.
During the stress test, future climate predictions for precipitation and temperature are
considered based on the range of global circulation model projections. Various
development patterns are considered, and different combinations of sectoral demands
are analyzed. These basis for these combinations are defined during the initial
inception meeting and will depend on demographic trends and demands within each
basin. All arrangements of individual investments and combinations of investments
are added and tested through these future climate and development scenarios to
uncover the optimal investments to achieve the objectives defined in Phase I.
Design a Water Security and Resilience Implementation Plan – The HRG and
partners will design a water security and resilience plan and implementation timeline
that highlights optimal investment design. The robustness and resilience of the
investment plans will be elucidated and the success of the investment combination
will be based on the specific metrics and scope of work defined in Step 1.

Pg. 40 Tanzania - Freshwater Resilience by Design
Results of the investment
prioritization analysis will be
presented to the World Bank,
Government of Tanzania and other
interested parties. The results will
be presented to ensure that the
process fits within the existing
institutional frameworks and
processes already in place at these
organizations.
The results will be summarized in a
final report on the investment
prioritization plan. The investment
prioritization analysis will
comprise an investment strategy
plan for the river basins undergoing
this analysis. This plan will include
a portfolio of prioritized investments and an implementation
timeline.
The HRG will also lead a training workshop for the
Government of Tanzania and local learning centers
including the Water Resources Management Institute and
the University of Dar es Salaam (Water Resources
Department) to train local partners and ensure they are
capable of executing the Freshwater Resilience by Design
process to add to their capacity to develop this framework in
other settings.
The project is ongoing and is expected to be completed by
September 2018.
Zero flow conditions in the Great Ruaha River in Ruaha National Park
One of two freshwater intakes to Dar es Salaam on the Ruvu River
The Great Ruaha River near the confluence with the Kilombero River

Pg. 41 Personnel
Personnel
Hydrosystems Research Group
From Left to Right: Casey Brown, Januka Gyawali, Sarah Freeman, Dong Kwan (Don)
Park, Chinedum Eluwa, David Rheinheimer, Khan Nguyen, M. Umit Taner, Hassaan Khan,
Sungwook Wi, Baptiste Francois, Katherine Schlef, Alec Bernstein, Mariam Allam

Pg. 42 Personnel
Mariam Allam Mariam Allam is a postdoctoral research associate who started working with the Hydrosystems
Group in 2017. She recently graduated with a PhD from the Civil and Environmental
Engineering department at MIT during which she studied the food-water-energy nexus in the
upper Blue Nile basin and found alternatives for win-win opportunities for the three stakeholder
countries sharing the basin’s water. Mariam did her MSc and BSc in Cairo University in water
resources engineering. When she is not thinking about resource allocation problems, Mariam is
a fitness maniac! She is a certified group exercise instructor and a BollyX instructor and she
enjoys long runs!
Alec Bernstein Alec Bernstein is the Hydrosystems Group Project Manager and began work with the Group in
2016. Alec previously worked as a water resources engineer in Seattle, WA, and also worked
briefly at a startup on water distribution system monitoring hardware. From 2013 to 2014, Alec
conducted independent research in India as a Fulbright-Nehru Scholar investigating water
treatment system sustainability in communities in rural West Bengal. Alec completed his M.S.
from the University of Massachusetts in civil engineering with a focus in water resources
engineering in 2013, and a B.S. from Lafayette College in civil engineering in 2011. He enjoys
collaborating with local stakeholders to solve complex water resources challenges, and has
worked on projects in Latin America, Asia, Africa, and North America. Alec has a passion for
the outdoors and enjoys biking, hiking, camping, cooking, brewing, playing and listening to
music, and any water-related activities from a lazy day at the beach to hiking on glaciers.
Chinedum Eluwa Chinedum Eluwa started work as a Research Assistant in the Hydrosystems Research Group in
September 2016 when he moved to Amherst, MA to begin a PhD in Water Resources Systems
Analysis. Prior to this he completed a Master’s degree in Hydrology and Climate Change (in
Newcastle, UK) and worked as a researcher to develop flood risk assessment methods for the
European Union RAMSES climate adaptation project. In his current work, he helps governments
(including inter-governmental organizations) decide which water-resources infrastructure
investment options to pursue given future uncertainties – especially hydro-climatologic
uncertainties. When not working, Chinedum enjoys listening to economic or political debates
on one of the BBC’s channels.

Pg. 43 Personnel
Sarah Freeman Sarah Freeman is a PhD student in the Hydrosystems Research Group. Ms. Freeman joined the
group in the fall of 2016 after spending the past decade working for both private sector and non-
profit organizations in the infrastructure and environmental conservation sectors. She has worked
in a variety of roles that have included project management, scientific research as well extensive
work with stakeholder processes around the world. She is particularly passionate about how
science can inform policy. Ms. Freeman is currently leading the HRG’s Resilience by Design
project in the Valley of Mexico. She was recognized as the 2009 American Council of
Engineering Companies (ACEC) Young Professional of the Year and holds a MSc in Water
Resources Engineering and her BS in Mechanical Engineering from Tufts University. She is also
the designated cocktail maker for the HRG and occasionally a soccer co-captain along with
Katherine Schlef.
Baptiste François Dr. Baptiste François is a postdoctoral researcher in the Hydrosystems Research Group at the
University of Massachusetts, Amherst. He has a PhD in hydrology and atmospheric sciences
from the University of Grenoble-Alpes (France). His research focuses on the water-climate-
energy nexus. He is especially interested in the impact of climate change on the integration of
intermittent renewable energy sources into the future electricity grid. His postdoctoral research
led him to work at the University of Padua (Italy, 1 year), at the SINTEF Energies research
institute (Trondheim, Norway, 9 months) and at the University of Grenoble-Alpes, where he got
his PhD (2 years). He is now working on assessing climate change impacts on hydrological
extremes.
Januka Gyawali Januka Gyawali is a Fulbright Scholar in a graduate program of Civil and Environmental
engineering at University of Massachusetts Amherst. She holds both of her B.E. in Civil
Engineering and M.Sc in Water Resources Engineering from Institute of Engineering, Pulchowk
Campus, Nepal. Prior to joining UMass Amherst, she worked as a civil engineer in Nepal
Electricity Authority. She likes to listen music, read novels, hike and travel during her free time.
Pg. 44 Personnel
Hassaan Khan Hassaan Khan is a doctoral candidate in the Hydrosystems Research Group and joined the group
in 2013. Like many others in the group, he has been involved in a variety of interdisciplinary
projects throughout his graduate career. For his dissertation, he is evaluating the use of coupled
natural and human systems for water resources planning in water scarce regions around the
world. Hassaan obtained his M.S in Environmental Engineering from the University of
Massachusetts in 2016, and a B.S. in Civil and Environmental Engineering from Lafayette
College. Hassaan is originally from Karachi, Pakistan, a mega city with major water challenges.
He enjoys learning about and experiencing different cultures through traveling. In his free time,
he likes to cook, watch soccer, and read about history and religion, with a special interest in the
Middle East and South Asia.
Khanh Nguyen In 2013, Khanh Nguyen obtained a Bachelor of Engineering in environmental management and
technology at Ho Chi Minh City University of Technology (HCMUT), Vietnam. After
graduation, Khanh worked as Research Assistant in the domain of Geographic Information
System and hydrological modeling at DITAGIS center, HCMUT. In 2014, she worked as
Corporate Environmental Coordinator in Holcim Vietnam Ltd., where she undertook tasks of
CO2 reporting and waste management. Six months later, Khanh began her masters program in
environmental science and engineering with the expertise of hydrology, water, soil and
ecosystems at Swiss Federal Institute of Technology (EPFL), Lausanne, Switzerland under a
RESCIF-CARE fellowship. During the masters program, she worked as an intern at
GeoplanTeam which is a Swiss enterprise in geo-informatics and geographic information
systems. In 2017, Khanh achieved her masters degree and became a graduate student in the
Hydrosystems Research Group at University of Massachusetts Amherst.
Dong Kwan (Don) Park Dong Kwan (Don) Park is a first year Ph.D. student with the Hydrosystems Research Group
from Fort Collins, Colorado. He completed his B.S. in 2013 from The Pennsylvania State
University in Civil Engineering – Water Resources and received his M.S. from Seoul National
University in 2015 in Civil Engineering with a focus in Hydrology and Water Resources. From
2014 through early 2017, Don worked at Seoul National University as a researcher developing
an integrated framework that includes social, environmental, and water resources through the
Model of Integrated Impact and Vulnerability Evaluation of climate change (MOTIVE) project
with the Ministry of Environment Korea. In his free time, Don enjoys camping, hiking, cooking,
and listening to music.

Pg. 45 Personnel
David Rheinheimer Dr. David Rheinheimer is currently a Postdoctoral researcher in the Hydrosystems Research
Group. With a PhD from the University of California, Davis, his interests are primarily in
environmental flows, which encompasses seeking a better understanding of how environmental
flows can be better represented in water systems models and how environmental flow
requirements interact with other water management objectives and changing baseline conditions.
David has recently turned to web technologies, which enable both easy access to on-demand
cloud computing and rapid development of collaboration platforms for distributed participatory
modeling and decision-making. David has a wide range of previous experience in the Federal
Government (the U.S. Department of Energy and the National Oceanic and Atmospheric
Administration) and in academia. He has been a Postdoc at the University of California (Davis
& Merced campuses), Wuhan University, China, and at the Indian Institute of Technology,
Roorkee as a Fulbright-Nehru Postdoctoral Fellow. Before coming to UMass, he was a Research
Specialist at the Tecnológico de Monterrey in Monterrey, Mexico. An avid outdoorsman, David
enjoys walking, hiking, backpacking, biking and sailing, and has climbed many a local peak
wherever his travels take him. He is also an avid amateur photographer and clarinetist.
Katherine Schlef Katherine Schlef will complete her Ph.D. in May 2018 in civil engineering with a focus on water
resources from the University of Massachusetts Amherst. She received a M.S. in civil
engineering from the same institution in 2014 and a B.S. in general engineering from Harvey
Mudd College in 2012. Katherine spent the 2014-2015 school year in Burkina Faso with the
Fulbright U.S. student program studying urban flood risk assessment and management. She was
awarded a National Science Foundation Graduate Research Fellowship in 2012. She has a
passion for understanding the complex interactions between water, humans, and the
environment.
M. Ümit Taner Dr. M. Ümit Taner, is a postdoctoral researcher at the University of Massachusetts, Amherst. He
received his PhD from the University of Massachusetts, Amherst in 2017. He has more than ten
years of experience in international water projects, ecological modeling, and wastewater
treatment. Previous to University of Massachusetts, he had worked at the Scientific and
Technological Research Council of Turkey (TUBITAK-MRC) and at the U.S. Environmental
Protection Agency (US EPA), Office of Water. During his Ph.D. work, he developed various
hydrology and water resources system models and web-based tools to aid long-term water
systems planning under climate change. He has also instructed a number of stakeholder
workshops in Africa and Asia for various World Bank funded projects. His recent work includes
various water system planning and management projects in United States, Kenya, Malawi, and
the Niger River Basin. Currently, his work focuses on integration of vulnerability-based planning

Pg. 46 Personnel
approaches and robust optimization to solve complex planning problems involving long-term
water, food, and energy security.
Sungwook Wi Dr. Sungwook Wi is a postdoctoral research associate in the Department of Civil and
Environmental Engineering at the University of Massachusetts (UMASS) Amherst and a chief
hydrologist at the UMASS Hydrosystems Research Group. His research focuses on the
intersection between hydrologic, climatic, and anthropogenic systems with an emphasis on
sustainable water resources management. He specializes in developing human-hydrologic
systems models and applying the models to assess the impact of climate change and variability
as well as human activities on water resources planning and management. His expertise in
hydrology has played a critical role in addressing water issues for various watershed systems all
over the world, including USA, Mexico, Africa, East Asia, and Himalayan regions.

Pg. 47 Contact Information
Contact Information
Contact the Group
Mailing Address
Hydrosystems Research Group
University of Massachusetts, Amherst
Department of Civil and Environmental Engineering
130 Natural Resources Road
Marston Hall
Amherst, Massachusetts 01003
Telephone +1-413-577-2337
Electronic Mail
Website
hydrosystems.ecs.umass.edu
Social Media
Twitter: @HydrosystemsG


![Textila 2 2012revistaindustriatextila.ro/images/2020/3/Industria... · polyamide knitted scrim [9]. Knit Scrim material has the task to give the dimensional stability to sandwich](https://img.dokumen.tips/doc/110x75/5fdc75ff22e4b870962c09c1/textila-2-2012rev-polyamide-knitted-scrim-9-knit-scrim-material-has-the-task.jpg)