Embed Size (px)
Citation preview

For institutional use only. Not for distribution to retail investors.
LibertasWealth Management Ideas Forum: SMSFs and ETFs
Paul Chin: Senior Investment Analyst
Julie Scurfield: Business Development Manager NSW

2For institutional use only. Not for distribution to retail investors.
Vanguard Global Funds Under Management: as at 31 Dec 2013
A business to partner with
Global strength & resources
The Vanguard Group founded in 1975
Over A$3 trillion global funds under
management
Index pioneer
> 13,500 crew
Australian footprint
Headquarters in Melbourne
Offices in Sydney, Brisbane & Perth
48 investment crew
45 traditional managed funds and ETFs
*As at 31 December 2013
67%33%
3For institutional use only. Not for distribution to retail investors.
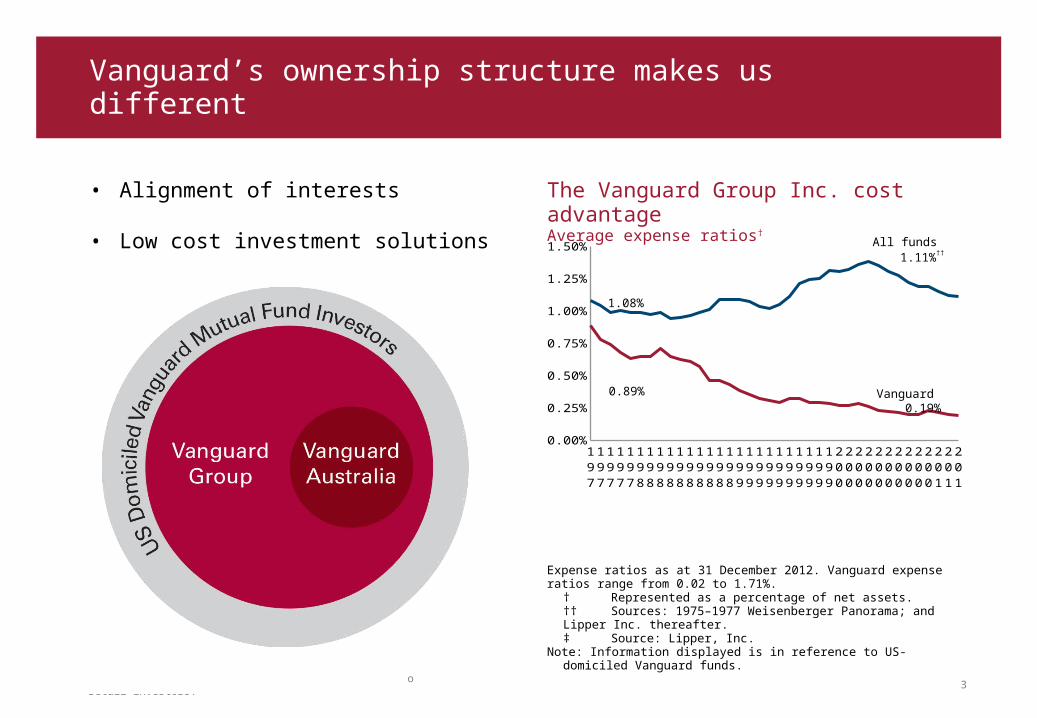
• Alignment of interests
• Low cost investment solutions
Vanguard’s ownership structure makes us different
The Vanguard Group Inc. cost advantageAverage expense ratios†
Expense ratios as at 31 December 2012. Vanguard expense ratios range from 0.02 to 1.71%.
† Represented as a percentage of net assets.†† Sources: 1975–1977 Weisenberger Panorama; and Lipper Inc. thereafter.‡ Source: Lipper, Inc.
Note: Information displayed is in reference to US-domiciled Vanguard funds.
1975
1976
1977
1978
1979
1980
1981
1982
1983
1984
1985
1986
1987
1988
1989
1990
1991
1992
1993
1994
1995
1996
1997
1998
1999
2000
2001
2002
2003
2004
2005
2006
2007
2008
2009
2010
2011
2012
0.00%
0.25%
0.50%
0.75%
1.00%
1.25%
1.50% All funds 1.11%††
Vanguard 0.19%
1.08%
0.89%

4For institutional use only. Not for distribution to retail investors.
The average expense ratio for Vanguard ETFs is 17 basis points, while the Australian industry average is 31 basis points*
Vanguard’s low-cost advantage
Vanguard ETFs Industry
0.17%
0.31%
Average ETF management cost in Australia
Source: ASX with Vanguard calculations, weighted by funds under management as at 31 December 2013.

5For institutional use only. Not for distribution to retail investors.
SMSFs: changing the world one fund at a time
• There are now 509,000+ SMSFs in existence* with $506 billion in assets and 963,000 individual trustees
• Average of 26,000 new funds a year since June 2008
• Key drivers:– Control– Cost– Tax/franking credits
Which is challenging the industry on a number of fronts…
• Industry funds− Heavy outflows in pension mode− High account balance clients deserting funds− Launching member-directed investment options to retain
members/assets
• Adviser platforms− Adds high cost layer− Accountants entering adviser licensing regime
* ATO SMSF statistical bulletin June 2013
Number of SMSFs(Source: APRA Quarterly Superannuation Performance Report)
301k307k
313k320k
339k347k
353k
374k380k
402k407k
413k421k
428k435k
443k453k
460k469k
477k488k
498k503k
386k392k396k
366k359k
300,000
350,000
400,000
450,000
500,000
550,000
6For institutional use only. Not for distribution to retail investors.
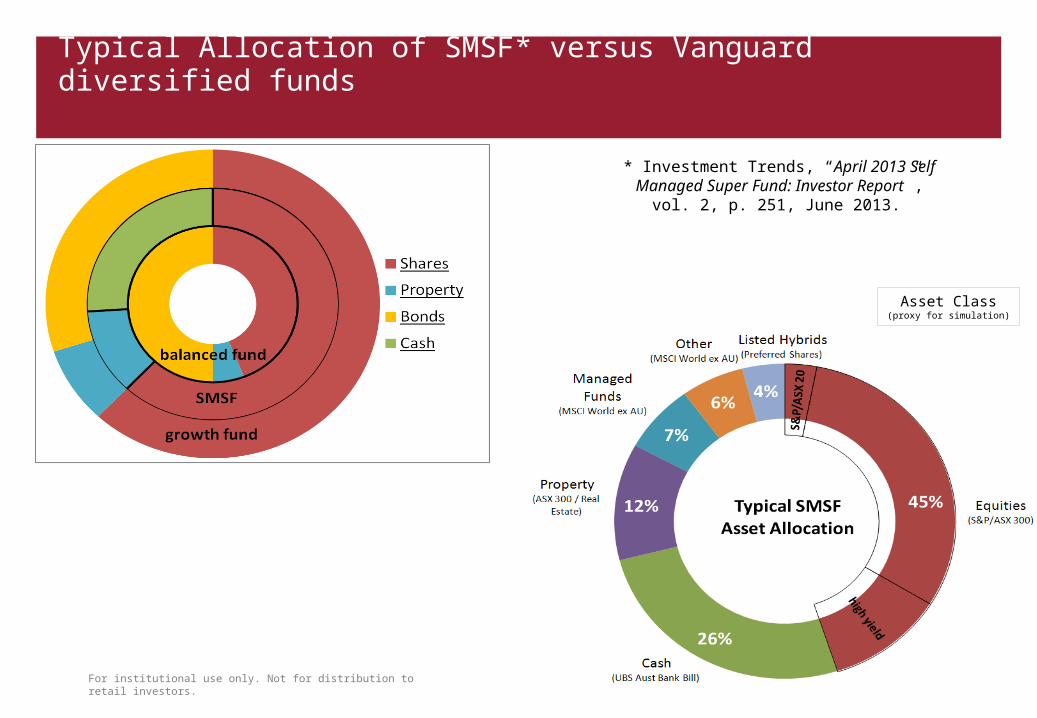
Typical Allocation of SMSF* versus Vanguard diversified funds
* Investment Trends, “April 2013 Self Managed Super Fund: Investor Report”, vol. 2, p. 251, June 2013.
Asset Class(proxy for simulation)

7For institutional use only. Not for distribution to retail investors.
The obvious risks … and the known unknowns
Trustee overconfidence• Cash allocations protected many
SMSFs through the GFC (skill vs. luck?)
Pursuit of high yield• Tax value of franking credits• High yield hybrid offers
Asset allocation • Concentration risk ( no. of shares)• Lack of diversification
− International (equities and FI)− Domestic fixed income− Residential property
The SMSF challenge: Uncovering the risk vs return profile within 509,000 portfolios…

8For institutional use only. Not for distribution to retail investors.
Vanguard ISG Methodology for SMSF Simulations… a random walk
• Constructed portfolios of randomly selected securities that matched allocation of typical self-managed super funds (SMSFs),determined from survey of 1,305 SMSF investors
• Generated 1000 simulated SMSFs using historical returns
• Investigated return paths & risk profiles of these simulated SMSF returns
• Investigated three different compositions for equity portion of simulated SMSFs:
1. All equities selected from S&P/ASX 3002. Most equities selected from large-cap stocks3. Most equities selected from high-yielding stocks
• Used conservative approach to simulations, true risks even higher
9For institutional use only. Not for distribution to retail investors.
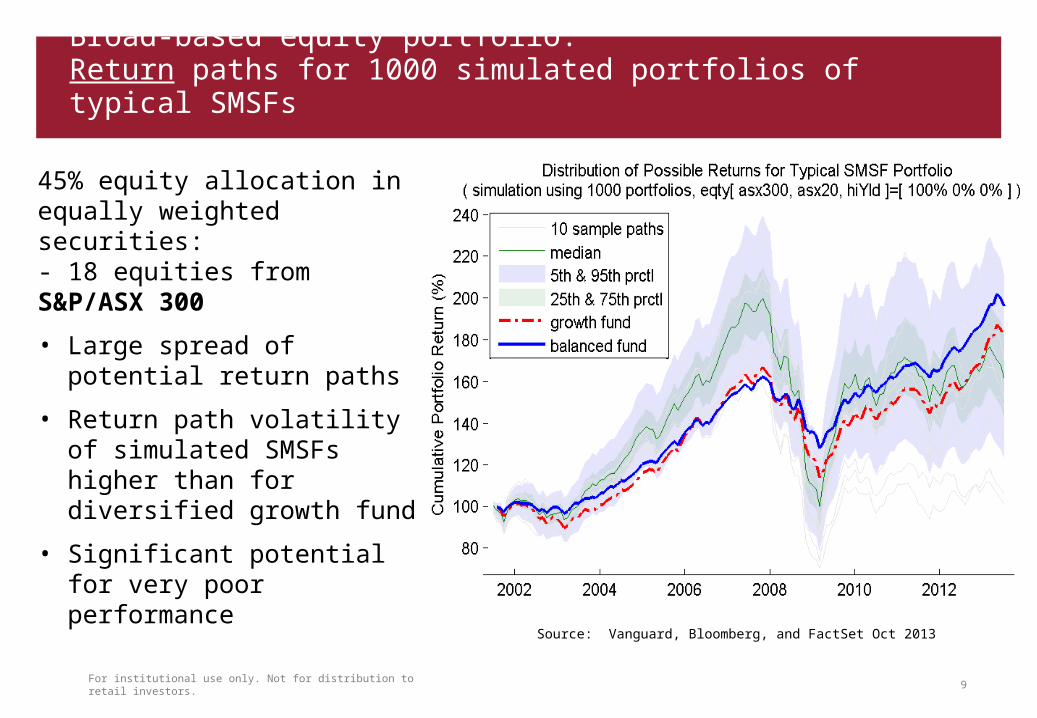
Broad-based equity portfolio: Return paths for 1000 simulated portfolios of typical SMSFs
Source: Vanguard, Bloomberg, and FactSet Oct 2013
45% equity allocation inequally weighted securities:- 18 equities from S&P/ASX 300
• Large spread of potential return paths
• Return path volatility of simulated SMSFs higher than for diversified growth fund
• Significant potential for very poor performance

10For institutional use only. Not for distribution to retail investors.
Simulated risk for typical SMSF:Broad-based equity portfolio
Source: Vanguard, Bloomberg, and FactSet Oct 2013
Risk of typical SMSFin turbulent timesalmost double risk ofdiversified growth fund

11For institutional use only. Not for distribution to retail investors.
High-yielding equity portfolio:Returns paths for 1000 simulated portfolio of typical SMSFs:
Source: Vanguard, Bloomberg, and FactSet Oct 2013
45% equity allocation inequally weighted securities: -15 equities high-yielding& 3 equities from S&P/ASX 300
• High-yield membership calculated by ranking 6-month yield calc 1-year prior &selecting top quartile equities
• Lower spread of returns thanbroad-based index simulation

12For institutional use only. Not for distribution to retail investors.
Simulated risk for typical SMSF:High-yielding equities
Source: Vanguard, Bloomberg, and FactSet Oct 2013
Risk of typical SMSFin turbulent timesalmost double risk ofdiversified growth fund

13For institutional use only. Not for distribution to retail investors.
Efficient Frontier Relative to Typical SMSF:equities selected from broad-based index
Source: Vanguard, Bloomberg, and FactSet Oct 2013
We looked at Vanguard diversified funds vs. typical SMSF relative to efficient frontier
• Vanguard diversified funds located close to theoretically optimal portfolios defined by efficient frontier
• Typical SMSF far from efficient frontier (i.e., additional risk not compensated by extra returns)
• Large risk-return spread in cloud of SMSF returns arises from selection risk

14For institutional use only. Not for distribution to retail investors.
What do the risk and returns simulations tell us?
• Typical SMSF performed well during GFC – so why the high risk profile?
• Key drivers of risk are:
• Selection risk - leads to large spread of return paths
• Equity concentration risk – no. of securities; home country bias, low levels of international exposure
• Typical SMSF inefficient from risk-adjusted return perspective(cash drag reduces return & equity concentration, home country biasincreases risk)
• Are trustees conscious of risk within typical portfolio profiles?
• Conversation starter for brokers/advisers with clients on risk (vs reward) and value of strategic asset allocation and diversification
• What is the solution?

For institutional use only. Not for distribution to retail investors. 15
Vanguard ETFs on the ASX
16For institutional use only. Not for distribution to retail investors.
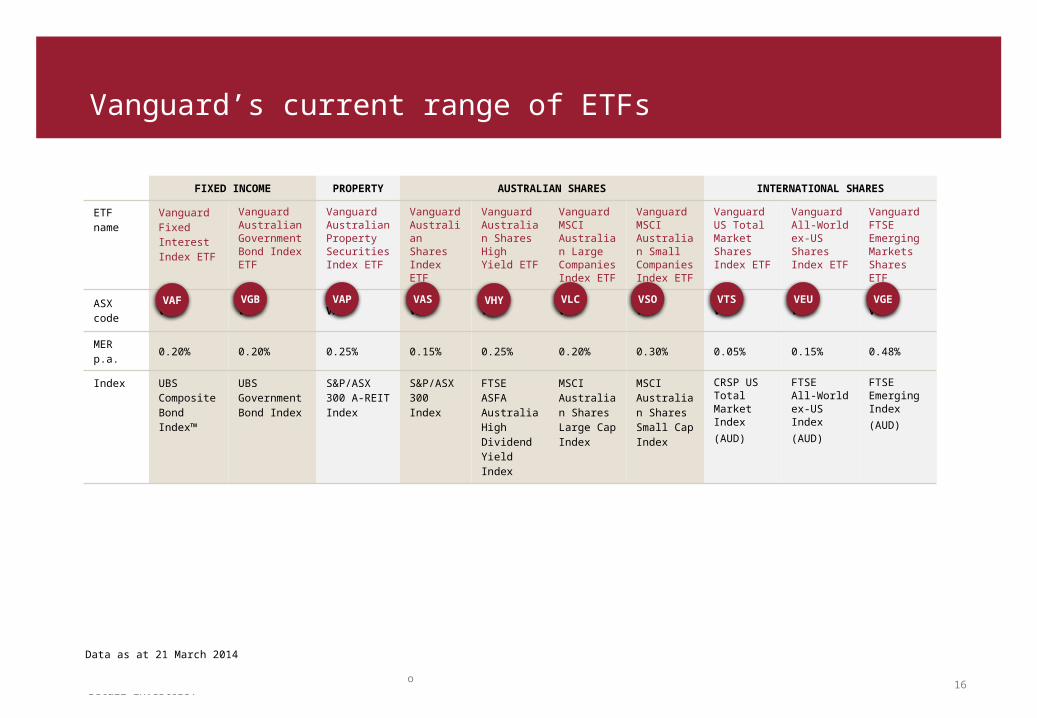
Vanguard’s current range of ETFs
FIXED INCOME PROPERTY AUSTRALIAN SHARES INTERNATIONAL SHARES
ETF name
Vanguard Fixed Interest Index ETF
Vanguard Australian Government Bond Index ETF
Vanguard Australian Property Securities Index ETF
Vanguard Australian Shares Index ETF
Vanguard Australian Shares High Yield ETF
VanguardMSCI Australian Large Companies Index ETF
Vanguard MSCI Australian Small Companies Index ETF
Vanguard US Total Market Shares Index ETF
Vanguard All-World ex-US Shares Index ETF
Vanguard FTSE Emerging Markets Shares ETF
ASX code
VAF VGB VAP VAS VHY VLC VSO VTS VEU VGE
MER p.a. 0.20% 0.20% 0.25% 0.15% 0.25% 0.20% 0.30% 0.05% 0.15% 0.48%
Index UBS Composite Bond Index™
UBS Government Bond Index
S&P/ASX 300 A-REIT Index
S&P/ASX 300 Index
FTSEASFA Australia High Dividend Yield Index
MSCIAustralian Shares Large Cap Index
MSCIAustralian Shares Small Cap Index
CRSP US Total Market Index(AUD)
FTSEAll-World ex-US Index(AUD)
FTSE Emerging Index (AUD)
VAF VGB VAP VAS VHY VLC VSO VTS VEU VGE
Data as at 21 March 2014

17For institutional use only. Not for distribution to retail investors.
Building an international equity portfolio in two ASX trades
Two trades:
• Build out a major asset class
• Over 5,800 securities
• Over 40 developed and emerging market economies
• Exxon, Apple, Microsoft, Johnson & Johnson, Nestle, HSBC, General Electric
• Weighted Management costs of 10 bps
Source: MSCI Inc. and Vanguard Australia
VTS50%
VEU50%

18For institutional use only. Not for distribution to retail investors.
7 8 9 10 11 12 1318.0
18.5
19.0
19.5
20.0
20.5
21.0
21.5
22.0
Lowering portfolio risk, increasing diversification
• 2yr standard deviation falls 27%
• Expanded value proposition
• Build out fixed income, property, small ords, high yield…
2yr standard deviation %
tota
l ret
urn
%
Lower risk
Australian large caps
Portfolio after
Source: Morningstar Direct and Vanguard Australia. As at March 31 2014.
VTS20%
Australianlarge caps
60%VEU20%

19For institutional use only. Not for distribution to retail investors.
7 8 9 10 11 12 13 149.0
9.5
10.0
10.5
11.0
Lowering portfolio risk, increasing diversification
• 3yr standard deviation falls 36%
• Expanded value proposition
• Build out property, small ords, high yield…
Australianlarge caps
60%
3yr Standard Deviation
Tota
l Ret
urn
Lower risk
Australian Large Caps
Portfolio after
Source: Morningstar Direct and Vanguard Australia
MSCI ACWI20%
Australianlarge caps
60%
UBS Comp20%

For institutional use only. Not for distribution to retail investors. 20
Vanguard ETF talking points

21For institutional use only. Not for distribution to retail investors.
Australian shares – small companies
ETF name
Vanguard MSCI Australian Small Companies Index ETF (ASX Code: VSO.AXW)
IndexMSCI Australian Shares Small Cap Index
Management costs 0.30% p.a.
Average spread 0.18%
ASX listing date 26 May 2011
AUM $40.9m
No. Securities in ETF 166
Top 5 holdingsChallenger, Bluescope Steel, Ansell, Commonwealth Property Office, Duet Group
Distribution. (DRP?) Semi-annually (DRP)
Large cap % 0.00
Mid cap % 64.06
Small cap % 35.94
1 year return 1.09%
1 year index return 1.23%
All data as at 31 March 2014.
Note: The asset allocations in this diagram are examples only and do not represent a recommendation
Australian fixed interest
Cash
International shares
Listed property
Emergingmarkets
International fixed interest
AustralianShares
VHY
VSO
AustralianShares
AustralianShares

22For institutional use only. Not for distribution to retail investors.
ETF name
Vanguard US Total MarketShares Index ETF (ASX code: VTS.AXW)
Index CRSP US Total Market Index
Management costs 0.05% p.a.
Average spread 0.19%
ASX listing date 12 May 2009
AUM (ETF/fund) A$44.7b (A$349.3b)
No. Securities in ETF 3,698
Top 5 holdingsApple Inc., Exxon Mobil Corp, Google Inc., Microsoft Corp., General Electric Co.
Distribution. (DRP?) Quarterly (No DRP)
Large cap % 72.09
Medium cap % 19.28
Small cap % 8.63
1 year return 38.00%
1 year index return 38.02%
3 year return 18.91% p.a.
International shares - US shares
All data as at 31 March 2014.
Australian fixed interest
Cash
International shares
Listed property
Emergingmarkets
International fixed interest
Note: The asset allocations in this diagram are examples only and do not represent a recommendation
VTS
AustralianShares
VSO

23For institutional use only. Not for distribution to retail investors.
VTS advantage: achieve broad diversification at lower cost
Summary performance statistics from May 2003 to December 2013. (May 2003 is when the CRSP index’s inception)
IndexCRSP US Total Market
S&P 500
Annualised return 9.32% 8.54%
Annualised risk 14.9% 14.3%
Market coverage 99.5% 81%
• Large cap• Mid cap• Small cap• Micro cap
• Large cap
VTSCRSP US Total Markets Index
(broad)
IVVS&P500
VTS IVV
MER % p.a 0.05 0.07
US broad, large, mid and small cap calendar year performance from 2000 to 2013
Summary performance statistics from May 2003 to December 2013. (May 2003 is when the CRSP index’s inception)

24For institutional use only. Not for distribution to retail investors.
Australian property securities
ETF name
Vanguard Australian PropertySecurities Index ETF (ASX code: VAP.AXW)
Index S&P/ASX 300 A-REIT Index
Management costs 0.25% p.a.
Average spread 0.13%
ASX listing date 15 October 2010
AUM (ETF/fund) $166.9m ($2,892.9m)
No. Securities in ETF 28
Top 5 holdingsWestfield, Westfield,Retail Trust, Stockland, Goodman Group, Mirvac
Distribution. (DRP?) Quarterly (DRP)
Large cap % 61.04
Mid cap % 34.50
Small cap % 4.46
1 year return 4.86%
1 year index return 4.96%
All data as at 31 March 2014.Note: The asset allocations in this diagram are examples only and do not represent a recommendation
Australian fixed interest
Cash
International shares
Listed property
Emergingmarkets
International fixed interest
AustralianSharesAustralianShares
VSO
VAP

25For institutional use only. Not for distribution to retail investors.
Australian fixed interest
ETF name
Vanguard Australian Fixed Interest Index Fund (ASX code: VAF.AXW)
Index UBS Composite Bond Index
Management costs 0.20% p.a.
Average spread 0.27%
ASX listing date 31 October 2012
AUM (ETF/fund) $31.3m ($3,686.3m)
No. Securities in ETF 422
No. Issuers in ETF 154
Distribution. (DRP?) Quarterly (DRP)
Yield to maturity 3.61%
Effective duration (yrs) 4.16
1 year return 3.18%
1 year index return 3.33%
All data as at 31 March 2014.
Australian fixed interest
Cash
International shares
Listed property
Emergingmarkets
International fixed interest
Note: The asset allocations in this diagram are examples only and do not represent a recommendation
VAF
AustralianShares
VSO
4,314 stocks and bonds in 4 trades

For institutional use only. Not for distribution to retail investors. 26
Next steps…

27For institutional use only. Not for distribution to retail investors.
Next steps…
• Vanguard has the largest financial adviser support team in Australia
• We can help you:
– have the ‘why Vanguard’ conversation with clients
– discuss the benefits of ETFs in investment portfolios
– articulate talking points on individual Vanguard ETF exposures

For institutional use only. Not for distribution to retail investors. 28
Appendix

29For institutional use only. Not for distribution to retail investors.
• Do your homework
– What is the iNAV?
– What are typical spreads?
– What are spreads for the managed fund?
• Don’t trade during market open and market close
• Use “limit” orders
• On-screen volume is an indication of price, not the additional liquidity available
Trading tips
For ETF trade execution assistance, contact our ETF Help Desk:
1300 655 888

30For institutional use only. Not for distribution to retail investors.
A starting point: The iNAV
Product iNAV Code
VAS.AXW VASINAV.ETF
VHY.AXW VHYINAV.ETF
VLC.AXW VLCINAV.ETF
VSO.AXW VSOINAV.ETF
VAP.AXW VAPINAV.ETF
VGB.AXW VGBINAV.ETF

31For institutional use only. Not for distribution to retail investors.
Disclosures – General advice warning
Vanguard Investments Australia Ltd (ABN 72 072 881 086 / AFS Licence 227263) (“Vanguard”) is the product issuer.
This presentation contains general information and is intended to assist you. We have not taken anybody's circumstances into account so the information may not be applicable to your circumstances or those of any other person. This presentation was prepared in good faith and we accept no liability for any errors or omissions.
You should consider your circumstances or those of any other relevant person, and the relevant Product Disclosure Statement (PDS), before making an investment decision or recommendation. You can access our PDS at www.vanguard.com.au or by calling 1300 655 102.
Past performance is not an indication of future performance. Unless otherwise indicated, Vanguard pays a fee for access to the data used in this presentation but did not commission the research.
"Vanguard", "Vanguard Investments", and the ship logo are the trademarks of The Vanguard Group, Inc.© 2014 Vanguard Investments Australia Ltd. All rights reserved.
32For institutional use only. Not for distribution to retail investors.
Important information
This presentation contains general information and is intended to assist you. In preparing the above information, individual circumstances, for example tax implications, have not been taken into account and it may, therefore, not be applicable to an individual’s situation. Before making an investment decision, you should consider your circumstances and whether the above information is applicable to your situation.
Past performance is not an indication of future performance. Vanguard Investments Australia Ltd (ABN 72 072 881 086 / AFS Licence 227263) (“Vanguard”) is the issuer of the Vanguard® Australian ETFs. Vanguard is the issuer of the Prospectus on behalf of the US listed ETFs described in the Prospectus. Vanguard has arranged for interests in the US ETFs to be made available to Australian investors via CHESS Depositary Interests that are quoted on the AQUA market of the Australian Securities Exchange (“ASX”).
Vanguard ETFs will only be issued to Authorised Participants, that is persons who have entered into an Authorised Participant Agreement with Vanguard. Retail investors can transact in Vanguard ETFs through a stockbroker or financial adviser on the secondary market.
Investors should consider the relevant Prospectus and/or Product Disclosure Statement (“PDS”) in deciding whether to acquire Vanguard ETFs. Retail investors can only use the Prospectus and PDS for informational purposes. You can access the PDS and/or Prospectus at vanguard.com.au
Vanguard is not offering the Vanguard FTSE Emerging Markets Shares ETF in the United States and this presentation does not constitute an offer or an invitation to apply for or acquire any interests in the International ETFs in the United States. The information contained in this presentation is not intended for US persons as defined in Regulation S under the US Securities Act.
Standard & Poor’s® and S&P® are registered trademarks of Standard & Poor's Financial Services LLC ("S&P") and ASX® is a registered trademark of the Australian Securities Exchange Limited (“ASX”). These trademarks have been licensed for use by The Vanguard Group, Inc. Vanguard's ETFs are not sponsored, endorsed, sold or promoted by S&P or ASX, and S&P and ASX make no representation, warranty or condition regarding the advisability of buying, selling or holding units/shares in the Vanguard ETFs.
The funds or securities referred to herein are not sponsored, endorsed, or promoted by MSCI, and MSCI bears no liability with respect to any such funds or securities. For any such funds or securities, the Prospectus contains a more detailed description of the limited relationship MSCI has with Vanguard and any related funds.
“FTSE®” is a trademark of the London Stock Exchange Group companies (LSEG) and is used by FTSE International Limited under license. "All-World" is a trade mark of FTSE International Limited. The FTSE All-World ex US Index and the FTSE Emerging Index are calculated by FTSE. FTSE does not sponsor, endorse or promote this product and is not in any way connected to it; and does not accept any liability in relation to its issue, operation and trading. All rights in the FTSE ASFA Australia High Dividend Yield Index (the “Index”) vest in FTSE International Limited (“FTSE”) and The Association of Superannuation Funds of Australia (“ASFA”). “ASFA™”is a trade mark of ASFA. The Vanguard Australian Shares High Yield ETF, the Vanguard All-World ex-US Shares Index ETF and the Vanguard FTSE Emerging Markets Shares ETF (the “Products") have been developed solely by Vanguard. The Indices are calculated by FTSE or its agent. Neither FTSE nor its licensors are connected to and do not sponsor, advise, recommend, endorse or promote the ETF and do not accept any liability whatsoever to any person arising out of (a) the use of, reliance on or any error in the Index or (b) investment in or operation of the ETF. Neither FTSE nor ASFA make any claim, prediction, warranty or representation either as to the results to be obtained from the ETF or the suitability of the Index for the purpose to which it is being put by Vanguard.
The marks and names "UBS Government Bond Index"and "UBS Composite Bond Index™" a are proprietary to UBS AG ("UBS"). Any use of these indices or the index names must be with the express written consent of UBS AG acting through its Australia Branch. UBS has agreed to the use of, and reference to the "UBS Government Bond Index" and "UBS Composite Bond Index™" ("Indices") by us in connection with the Vanguard funds and ETFs and the website material but no Vanguard fund or ETF is in any way sponsored, endorsed or promoted by UBS. UBS assumes no responsibility for this website material or the ETFs. Vanguard assumes sole responsibility for producing this website material, which has not been reviewed by UBS AG.
© 2014 Vanguard Investments Australia. All rights reserved.