Embed Size (px)
Citation preview

1
Supporting information
Facile synthesis of silk-cocoon cobalt polysulfide as an efficient catalyst for hydrogen evolution reaction
Chao Wang,a,b ‡ Tanyuan Wang,c ‡ Jiajie Liu,d Yue Zhou,e Daiwei Yu,f Jeng-cheng Kuei,a,g Fei Han,b Qing Li,c Jitao Chen,d* Yunhui Huanga,c*
a.Department of Nuclear Science and Engineering, Massachusetts Institute of Technology, Cambridge, Massachusetts 02139, USA.b.School of Materials Science and Engineering, Tongji University, Shanghai, 200240, China.c.School of Materials Science and Engineering, Huazhong University of Science and Technology (HUST), Wuhan, Hubei 430074, China.d.Beijing National Laboratory for Molecular Sciences, College of Chemistry and Molecular Engineering, Peking University, Beijing, 100871, P. R. China. e.Department of Aeronautics and Astronautics, Massachusetts Institute of Technology, Cambridge, Massachusetts 02139, USA.f.Department of Electrical Engineering and Computer Sciences, Massachusetts Institute of Technology, Cambridge, Massachusetts 02139, USA.g.Institute of Materials Science and Engineering, National Central University, Taoyuan, Taiwan
Figure S1 SEM image of the CoSx composite after hydrothermal for 12 hours with the using of 200 mg sulfur and 100 mg cobalt acetate.
Figure S2 Photograph of the CoSx after removing water in the PTFE hydrothermal container.
Electronic Supplementary Material (ESI) for Energy & Environmental Science.This journal is © The Royal Society of Chemistry 2018
2
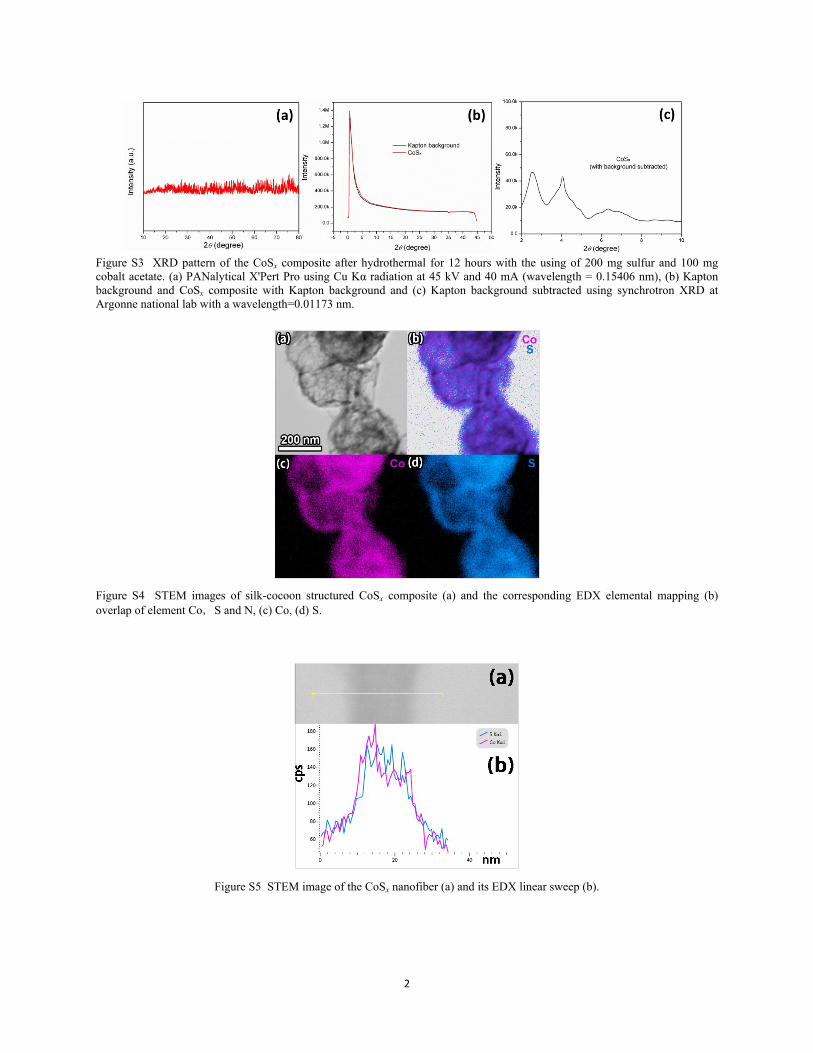
Figure S3 XRD pattern of the CoSx composite after hydrothermal for 12 hours with the using of 200 mg sulfur and 100 mg cobalt acetate. (a) PANalytical X'Pert Pro using Cu Kα radiation at 45 kV and 40 mA (wavelength = 0.15406 nm), (b) Kapton background and CoSx composite with Kapton background and (c) Kapton background subtracted using synchrotron XRD at Argonne national lab with a wavelength=0.01173 nm.
Figure S4 STEM images of silk-cocoon structured CoSx composite (a) and the corresponding EDX elemental mapping (b) overlap of element Co,S and N, (c) Co, (d) S.
Figure S5 STEM image of the CoSx nanofiber (a) and its EDX linear sweep (b).

3
Figure S6 (a) TGA curve under Ar gas of the CoSx composite after hydrothermal for 12 hours with the using of 200 mg sulfur and 100 mg cobalt acetate, (b) XRD curve of the CoSx composite after the same heat treatment process with TGA.
We reheated the sample in TGA at 100 for 2 h to remove the absorbed water on the sample surface. The weight loss before 100 oC is about 4%. After that, the temperature increased to 800 oC at a rate of 5 oC/min. Figure S6a shows the weight change curve from 100-800 oC. The weight percent remained at 800 oC is about 46.5 wt.%. The weight loss of 3.5 wt.% before 200 oC is the loss of crystal water in the sample. Base on the weight loss, we can calculate that the weight percent of the residual material in the composite is 46.5 wt.% / (1-3.5 wt.%) = 48.2 wt.% and sulfur lose is 51.8 wt.%. If the product is Co9S8, then x is 3.8. If the product is CoS, then x is 4. The product is a mixture of Co9S8 and CoS, then x is estimated to be 3.9.
Ratio calculated by mass conservation
Assuming that the cobalt in Co(ac)2 is completely transferred into CoSx, because the use of sulfur in the experiment is far more than needed to precipitate cobalt. In our hydrothermal experiment, when the usage amount of Co(ac)2 and sulfur are 200 mg and 400 mg individually. The weight percent of cobalt in Co(ac)2 is about 23.66 wt.%, so the cobalt mass is about 47.32 mg. Then sulfur is about 88.84 mg in the final product, so the weight ration of S/Co is 1.9. (This result is based on the deducting of 7.5% of water in the system according to TGA result). Based on the molecular weight of sulfur and cobalt, the mole ratio of S/Co is 3.5. We double check the weight of another sample with twice the weight of precursors and the final product weight is about 296.1mg, which is about two times of the weight of 148mg, so the S/Co ratio is nearly the same. We repeated this experiment for at least 5 times, and every time the consistency of the result is good. However, during the operation process (wash and transfer), we still may lose some weight and there have very small amount of nitrogen and carbon in the system, so the ratio is not very accurate but just a rough result.
(a) (b)

4
Figure S7 Photographs of (a) 75 mg silk-cocoon CoSx composite in 7.5 ml EDA solvent, (b) 75 mg sulfur in 7.5 ml EDA solvent, and (c) 30 times dilution of (b).
Figure S8 Photographs of the product after hydrothermal for different time.
Figure S8 shows the photographs of the solution after hydrothermal at different time (0, 1, 1.5, 2, 2.5, and 12 h). We can see that the color of the solution became more and more dark at the first 1.5 h and after that, it became more and more light with the increase of time. The 1.5 h picture shows the typical color of high concentrated polysulfides solution. After 1.5 h, the polysulfides chains became shorter and the concentration became lower as the reaction proceeded. The UV spectrum of the supernatant shows that polysulfides exist in the solution The color of the precipitation changed from dark red to black, and the volume decreased first and kept stable after 2 h.

5
Figure S9 The SEM morphology of CoSx at different hydrothermal time: (a) 1h, (b) 2h, (c2) 3h, (d) 5h, (e) 12h, and (f) 24h.
Figure S10 SEM image of precursor without hydrothermal and stirred for 12 hours.
Figure S11 TEM images of the CoSx composite at 2.5 hours hydrothermal time, scale bar 10 nm.

6
Figure S12 SEM images of CoSx at different synthesis conditions (a) using only EDA as the solvent for solvothermal, (b) using cobalt acetylacetonate as the cobalt source for the hydrothermal, using different sulfur amounts for the hydrothermal: (c) 50 mg, (d) 100 mg, (e) 150 mg, and (f) 300 mg.
Figure S13 Raman spectra of CoS2 and elemental sulfur.
Figure S14 Raman spectra of CoSx that were synthesized with a S to Co(ac)2·4H2O to S mass ratio of 3:1 and 4:1.

7
Figure S15 XPS spectra of S 2p region for CoSx compound that obtained by reacting S to Co(ac)2·4H2O in a mass ratio of 4:1 for 12 h.
Figure S16 XPS spectra of Co 2p region for CoSx compound that obtained by reacting S to Co(ac)2·4H2O in a mass ratio of 2:1 for 24 h.
Figure S17. Polarization curves of CoSx that were synthesized with a S to Co(ac)2•4H2O mass ratios of 1:2 (x=2.1) and 2:1 (x=3.9) respectively in 0.5 M H2SO4 at a scan rate of 2 mV s−1.
8
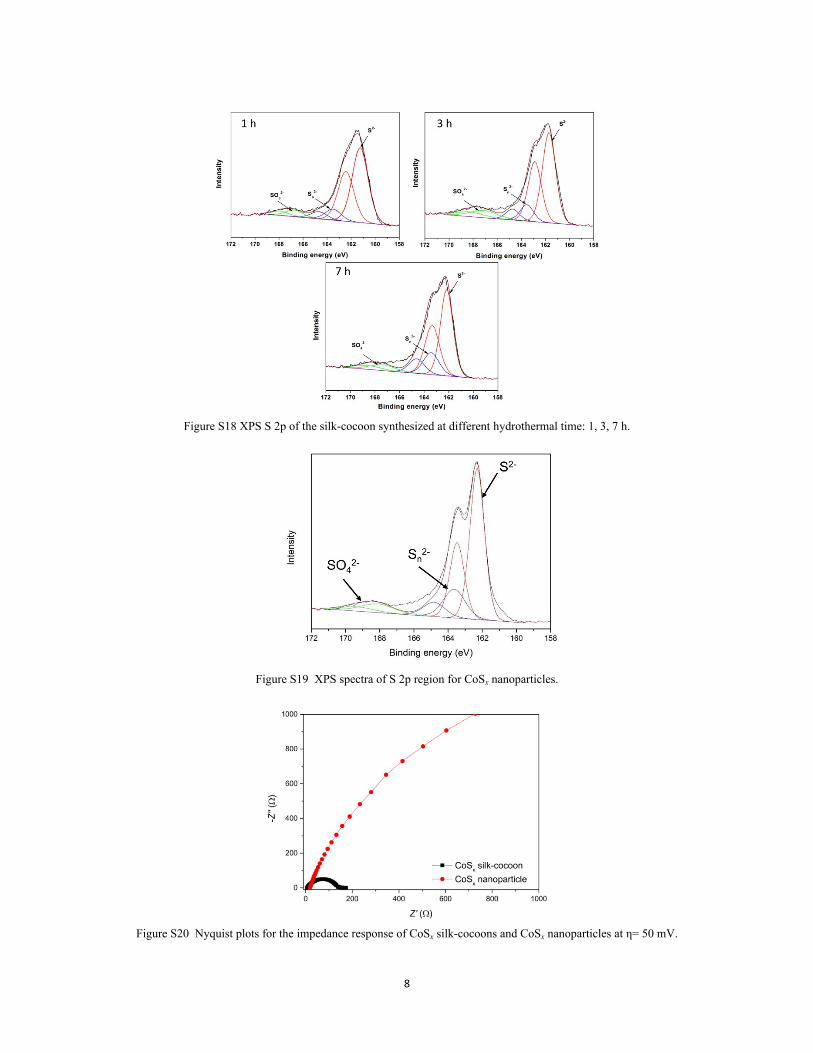
Figure S18 XPS S 2p of the silk-cocoon synthesized at different hydrothermal time: 1, 3, 7 h.
Figure S19 XPS spectra of S 2p region for CoSx nanoparticles.
Figure S20 Nyquist plots for the impedance response of CoSx silk-cocoons and CoSx nanoparticles at η= 50 mV.

9
Figure S21 Chronoamperometric response of the CoSx silk-cocoons at a constant potential of -0.045 V vs. RHE in 0.5 M H2SO4.
Figure S22 XPS S 2p of the silk-cocoon CoSx after 2000 cycles
Figure S23 SEM images of the silk-cocoon CoSx after 2000 cycles (a),(b),(c).

10
Table S1. Comparison of HER performance of the state-of-art transition metal sulfide electrocatalysts with our silk-cocoon S-
rich cobalt polysulfide at room temperature.Catalyst Substrate Electrolyte Loading
(mg cm-2) Onset potential
(mV)Overpotential at 10 mA cm-2 (mV)
Tafel slope (mV dec-1)
Reference
Amorphous CoSx FTO 0.5 M H3PO4 0.0796 N/A 83 (2 mA cm-2) 93 1
Electrodeposited Ni-Co-S FTO 1 M H3PO4 N/A -150 280 93 2
CoS2 wire graphite 0.5 M H2SO4 25±2 -75 145 51.6 3
CoPS nanoplates carbon paper 0.5 M H2SO4 N/A N/A 48 56 4
Co-doped FeS2 glassy carbon 0.5 M H2SO4 0.15 N/A 166 51 5
CoSe2 nanoparticles carbon fiber paper 0.5 M H2SO4 N/A N/A 137 48 6
Cobalt sulfide hollow nanospheres
Carbon paper 1 M KOH 1.5 N/A 193 100 7
Amorphous MoS3 glassy carbon 0.5 M H2SO4 N/A N/A 200 (15 mA cm-2) 40 8
[Mo2S12]2- Cluster FTO 0.5 M H2SO4 0.0864 N/A 161 40 9
CoS|P/CNT Carbon fiber paper 0.5 M H2SO4 0.4 0 48 55 10
Silk-cocoon cobalt polysulfide
glassy carbon 0.5 M H2SO4 0.2 0 42 41 This work
1. N. Kornienko, J. Resasco, N. Becknell, C. M. Jian, Y. S. Liu, K. Q. Nie, X. H. Sun, J. H. Guo, S. R. Leone and P. D.
Yang, J. Am. Chem. Soc., 2015, 137, 7448-7455.
2. A. Irshad and N. Munichandraiah, Acs Appl Mater Inter, 2017, 9, 19746-19755.
3. M. S. Faber, R. Dziedzic, M. A. Lukowski, N. S. Kaiser, Q. Ding and S. Jin, J. Am. Chem. Soc., 2014, 136, 10053-10061.
4. M. Caban-Acevedo, M. L. Stone, J. R. Schmidt, J. G. Thomas, Q. Ding, H. C. Chang, M. L. Tsai, J. H. He and S. Jin, Nat.
Mater., 2015, 14, 1245-1251.
5. S. Y. Huang, D. Sodano, T. Leonard, S. Luiso and P. S. Fedkiw, J. Electrochem. Soc., 2017, 164, F276-F282.
6. D. S. Kong, H. T. Wang, Z. Y. Lu and Y. Cui, J. Am. Chem. Soc., 2014, 136, 4897-4900.
7. X. Ma, W. Zhang, Y. Deng, C. Zhong, W. Hu and X. Han, Nanoscale, 2018, 10, 4816-4824.
8. D. Merki, S. Fierro, H. Vrubel and X. L. Hu, Chem. Sci., 2011, 2, 1262-1267.
9. Z. J. Huang, W. J. Luo, L. Ma, M. Z. Yu, X. D. Ren, M. F. He, S. Polen, K. Click, B. Garrett, J. Lu, K. Amine, C. Hadad,
W. L. Chen, A. Asthagiri and Y. Y. Wu, Angew. Chem. Int. Edit., 2015, 54, 15181-15185.
10. W. Liu, E. Hu, H. Jiang, Y. Xiang, Z. Weng, M. Li, Q. Fan, X. Yu, E. I. Altman and H. Wang, Nat. Commun., 2016, 7,
10771.